Colorado Pilot Statewide Training Program AWWA...
52
Colorado – Pilot Statewide Training Program AWWA M36 Water Audits & Loss Control AUDIO INSTRUCTIONS: Dial +1 (909) 259-0023 Access Code: 402-917-661 (all lines will be muted) Introductory Webcast August 19, 2015 – 1:00p MT https://global.gotowebinar.com/register/104453395 1
-
Upload
nguyenkhanh -
Category
Documents
-
view
216 -
download
0
Transcript of Colorado Pilot Statewide Training Program AWWA...

Colorado – Pilot Statewide Training Program
AWWA M36 Water Audits & Loss Control
AUDIO INSTRUCTIONS:
Dial +1 (909) 259-0023
Access Code: 402-917-661
(all lines will be muted)
Introductory Webcast
August 19, 2015 – 1:00p MT
https://global.gotowebinar.com/register/104453395
1

Other Logistics:
1. Questions
a. If you’re watching the webcast, type your questions into the Q&A menu (upper left)
b. If you’re just listening on the phone, email your questions to [email protected]
2. The presentation
a. If you’re only joining by phone, follow along using the handouts. You can use the slide number (bottom right of each page) to know where we’re at in the presentation.
2

Today’s Webcast
1. Meet the Team
2. Background for Pilot Training Program
3. An Overview of the Program – what to expect
4. Foundations
5. Next Steps
. . . If you have questions, please feel free to type them in at any time. . .We will have a Q&A at the end of the webcast. . .
3

Program Hosts
4
Colorado Water Conservation Boardcwcb.state.co.us
Colorado Water Wise coloradowaterwise.org
RMS AWWA rmsawwa.org
Water Research Foundation waterrf.org

Meet the Trainers
5

Meet the Trainers
Will Jernigan, P.E.TeacherProgram [email protected]
Rachel [email protected]
Tory Wagoner, P.E.,P.L.S.Teacher877.557.8923
Steve Cavanaugh, [email protected]
6

Background for the
Pilot Training Program
7

• 2010: HB10-1051 passed
• Covered entities selling >2,000 Acre Feet per year
• Requirement for water use and conservation reporting
• Includes reporting on water loss
• February 1, 2012: CWCB adopts Guidelines and reports to legislature regarding the Guidelines.
• June 30, 2014 : Annual covered entity reporting for the previous calendar year began.
8

AWWA M36 Manual and
CWW Guidebook of Conservation Practices
9
2009 2010

Program Overview –
What to expect?
10

What you put in to the Program
• Program is being offered (nearly) free by the host agencies
• Today’s webcast
• Homework
• Workshop participation
• Give feedback for future training & technical assistance needs
• Apply workshop learning at your utility
11

• Introductory training on AWWA water balance and audit software
• Introductory training on data validation for the water audit
• Introductory training on water loss component analysis
12
What you get out of the Program
Functional
Focus Area
Audit Data
Collection
Short-term
loss control
Long-term
loss control
Target-setting
Benchmarkin
g
Identify Best Practices/ Best in
class - the ILI is very reliable as a
real loss performance indicator
for best in class service
For validity scores of 50 or below, the shaded blocks should not be focus areas until better data validity is achieved.
Preliminary Comparisons - can
begin to rely upon the
Infrastructure Leakage Index (ILI)
for performance comparisons for
real losses (see below table)
Performance Benchmarking - ILI
is meaningful in comparing real
loss standing
Continue incremental
improvements in short-term and
long-term loss control
interventions
Establish long-term apparent and
real loss reduction goals (+10
year horizon)
Establish mid-range (5 year
horizon) apparent and real loss
reduction goals
Evaluate and refine loss control
goals on a yearly basis
Begin to assess long-term needs
requiring large expenditure:
customer meter replacement,
water main replacement program,
new customer billing system or
Automatic Meter Reading (AMR)
system.
Begin to assemble economic
business case for long-term
needs based upon improved data
becoming available through the
water audit process.
Conduct detailed planning,
budgeting and launch of
comprehensive improvements for
metering, billing or infrastructure
management
Annual water audit is a reliable
gauge of year-to-year water
efficiency standing
Research information on leak
detection programs. Begin
flowcharting analysis of customer
billing system
Conduct loss assessment
investigations on a sample
portion of the system: customer
meter testing, leak survey,
unauthorized consumption, etc.
Establish ongoing mechanisms
for customer meter accuracy
testing, active leakage control
and infrastructure monitoring
Refine, enhance or expand
ongoing programs based upon
economic justification
Stay abreast of improvements in
metering, meter reading, billing,
leakage management and
infrastructure rehabilitation
Launch auditing and loss control
team; address production
metering deficiencies
Analyze business process for
customer metering and billing
functions and water supply
operations. Identify data gaps.
Establish/revise policies and
procedures for data collection
Refine data collection practices
and establish as routine business
process
Water Audit Data Validity Level / Score
Level I (0-25) Level II (26-50) Level III (51-70) Level IV (71-90) Level V (91-100)

Added Benefits for Attending the Workshop
• Connectivity with your peers – others who are working on the same thing you are!
• Lunch will be provided!
13
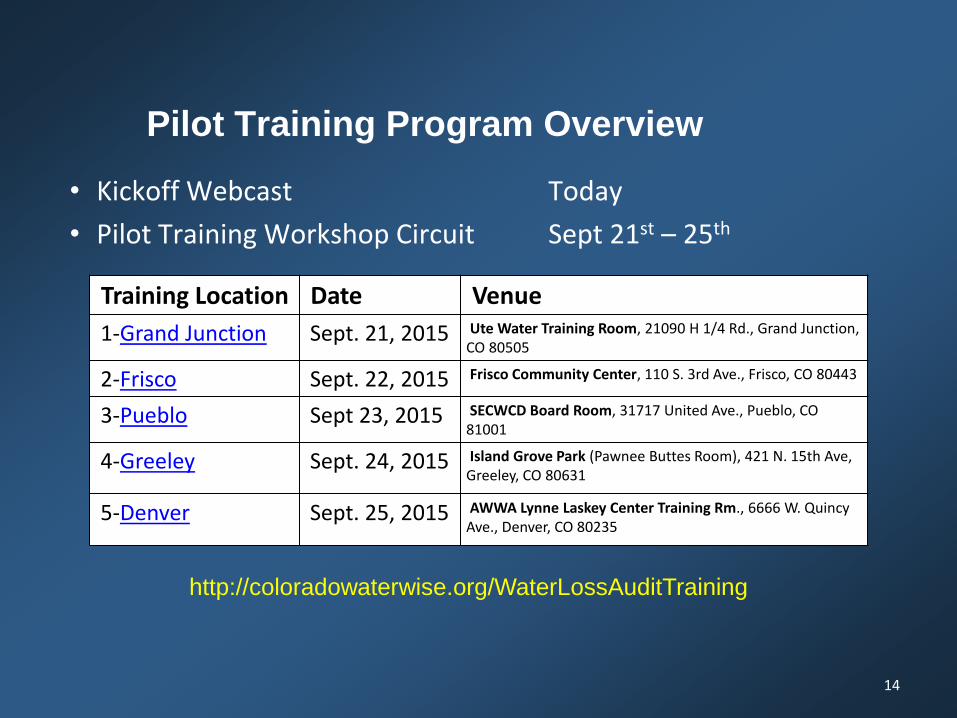
Pilot Training Program Overview
• Kickoff Webcast Today
• Pilot Training Workshop Circuit Sept 21st – 25th
14
Training Location Date Venue
1-Grand Junction Sept. 21, 2015 Ute Water Training Room, 21090 H 1/4 Rd., Grand Junction, CO 80505
2-Frisco Sept. 22, 2015 Frisco Community Center, 110 S. 3rd Ave., Frisco, CO 80443
3-Pueblo Sept 23, 2015 SECWCD Board Room, 31717 United Ave., Pueblo, CO 81001
4-Greeley Sept. 24, 2015 Island Grove Park (Pawnee Buttes Room), 421 N. 15th Ave, Greeley, CO 80631
5-Denver Sept. 25, 2015 AWWA Lynne Laskey Center Training Rm., 6666 W. Quincy Ave., Denver, CO 80235
http://coloradowaterwise.org/WaterLossAuditTraining

9/21
9/22
9/23
9/24
9/25

Who Should Attend?
Representation from these key areas:
• Operations
• Finance
• Management
• Conservation
• Consultant
• For smaller utilities – one person may cover multiple areas
16

Water Auditing
Foundations
17

Basic Concepts
1. Utilize the Water Balance.
2. Separate Total Water Loss into Real and Apparent Loss.
3. Separate Real and Apparent Loss into their subcomponents.
4. Use metrics in units of Volume, Value & Validity.18

RealLosses
ApparentLosses
UnbilledAuthorized
Consumption
BilledAuthorized
Consumption
Non-Revenue
Water
RevenueWater
Leakage & Overflows at Storage
Billed Unmetered Consumption
Billed Metered Consumption
Billed Water Exported
Leakage on Service Lines(before the meter)
Leakage on Mains
Customer Metering & Data Inaccuracies
Unauthorized Consumption
Unbilled Unmetered Consumption
Unbilled Metered Consumption
WaterImported
OwnSources
TotalSystemInput
( allowfor
knownerrors )
WaterLosses
AuthorizedConsumption
WaterExported
WaterSupplied
AWWA Standard Water Balance
19

RealLosses
ApparentLosses
UnbilledAuthorized
Consumption
BilledAuthorized
Consumption
Non-Revenue
Water
RevenueWater
Leakage & Overflows at Storage
Billed Unmetered Consumption
Billed Metered Consumption
Billed Water Exported
Leakage on Service Lines(before the meter)
Leakage on Mains
Customer Metering & Data Inaccuracies
Unauthorized Consumption
Unbilled Unmetered Consumption
Unbilled Metered Consumption
WaterImported
OwnSources
TotalSystemInput
( allowfor
knownerrors )
WaterLosses
AuthorizedConsumption
WaterExported
WaterSupplied
AWWA Standard Water Balance
20

Non-Revenue Water
1. Water put into the system that does NOT return revenue to the Utility.
2. All Water Loss plus Unbilled Consumption.
3. “Unaccounted-for water” has been abandoned as an obsolete practice (2003).
21

RealLosses
ApparentLosses
UnbilledAuthorized
Consumption
BilledAuthorized
Consumption
Non-Revenue
Water
RevenueWater
Leakage & Overflows at Storage
Billed Unmetered Consumption
Billed Metered Consumption
Billed Water Exported
Leakage on Service Lines(before the meter)
Leakage on Mains
Customer Metering & Data Inaccuracies
Unauthorized Consumption
Unbilled Unmetered Consumption
Unbilled Metered Consumption
WaterImported
OwnSources
TotalSystemInput
( allowfor
knownerrors )
WaterLosses
AuthorizedConsumption
WaterExported
WaterSupplied
AWWA Standard Water Balance
22

RealLosses
ApparentLosses
UnbilledAuthorized
Consumption
Non-Revenue
Water

RealLosses
ApparentLosses
UnbilledAuthorized
Consumption
Non-Revenue
Water
Physical loss - leakage
Cost impacts at ‘wholesale’ rate
Tools for control include leakage and
pressure management
Non-physical / revenue loss - slow meters,
billing issues and theft
Cost impacts at ‘retail’ rate.
Tools for control include data management,
quality control policies/practices, & meter
testing & repair
Fire Dept Usage
Operational Flushing
Tools for control include efficient flushing
practices and awareness campaigns

AWWA Free Water Audit Software
Water Audit Report for:
Reporting Year:
All volumes to be entered as: MILLION GALLONS (US) PER YEAR
Master Meter Error Adjustments
WATER SUPPLIED Pcnt: Value:
Volume from own sources: 5 1,000.000 MG/Yr 1 MG/Yr
Water imported: MG/Yr MG/Yr
Water exported: 1 100.000 MG/Yr 9 MG/Yr
Enter negative % or value for under-registration
WATER SUPPLIED: 825.000 MG/Yr Enter positive % or value for over-registration.
AUTHORIZED CONSUMPTION
Billed metered: 8 700.000 MG/Yr
Billed unmetered: 9 50.000 MG/Yr
Unbilled metered: MG/Yr Pcnt: Value:
Unbilled unmetered: 9 10.313 MG/Yr 1.25% MG/Yr24061
AUTHORIZED CONSUMPTION: 760.313 MG/Yr
WATER LOSSES (Water Supplied - Authorized Consumption) 64.688 MG/Yr
Apparent Losses Pcnt: Value:
Unauthorized consumption: 10 3.000 MG/Yr 0.25% MG/Yr
Customer metering inaccuracies: 5 7.071 MG/Yr 1.00% MG/Yr
Systematic data handling errors: 4 5.000 MG/Yr 0.25% MG/Yr
Apparent Losses: 15.071 MG/Yr
Real Losses (Current Annual Real Losses or CARL)
Real Losses = Water Losses - Apparent Losses: 49.617 MG/Yr
WATER LOSSES: 64.688 MG/Yr
NON-REVENUE WATER
NON-REVENUE WATER: 75.000 MG/Yr
= Water Losses + Unbilled Metered + Unbilled Unmetered
SYSTEM DATA
Length of mains: 7 100.0 miles
Number of active AND inactive service connections: 6 1,000
Service connection density: 10 conn./mile main
Yes
Average length of customer service line: ft
Average operating pressure: 6 60.0 psi
COST DATA
Total annual cost of operating water system: 5 $1,000,000 $/Year
Customer retail unit cost (applied to Apparent Losses): 7 $3.50
Variable production cost (applied to Real Losses): 7 $3,000.00 $/Million gallons
WATER AUDIT DATA VALIDITY SCORE:
PRIORITY AREAS FOR ATTENTION:
1: Volume from own sources
2: Customer metering inaccuracies
3: Total annual cost of operating water system
Based on the information provided, audit accuracy can be improved by addressing the following components:
$/1000 gallons (US)
100.000
<----------- Enter grading in column 'E' and 'J' ---------->
Unauthorized consumption volume entered is greater than the recommended default value
5.000
*** YOUR SCORE IS: 60 out of 100 ***
A weighted scale for the components of consumption and water loss is included in the calculation of the Water Audit Data Validity Score
100.000
3.000
25.000
Average length of customer service line has been set to zero and a data grading score of 10 has been applied
Are customer meters typically located at the curbstop or property line?
AWWA Free Water Audit Software:
Reporting Worksheet
Default option selected for Unbilled unmetered - a grading of 5 is applied but not displayed
1.000
2013 1/2013 - 12/2013
Northern San Leandro Combined Water Sewer Storm Utility District (0007900)
?
?
?
?
?
? Click to access definition
?
?
?
?
?
?
Please enter data in the white cells below. Where available, metered values should be used; if metered values are unavailable please estimate a value. Indicate your confidence in the accuracy of the input data by grading each component (n/a or 1-10) using the drop-down list to the left of the input cell. Hover the mouse over the cell to obtain a description of the grades
?
?
?
?
?
?
(length of service line, beyond the property boundary, that is the responsibility of the utility)
Use buttons to selectpercentage of water
suppliedOR
value
?Click here:
for help using option buttons below
?
?
?
?
+
+ Click to add a comment
WAS v5.0
+
+
+
+
+
+
American Water Works Association.Copyright © 2014, All Rights Reserved.
?
?
?
+
+
+
+
+
+
+
+
+
+
+
+
+ Use Customer Retail Unit Cost to value real losses
?
To select the correct data grading for each input, determine the highest grade where the utility meets or exceeds all criteria for that grade and all grades below it.
Defaults provided
Free
awwa.org/waterlosscontrol
Industry Standard
(M36)
~10 Volume Inputs
~7 System Data Inputs
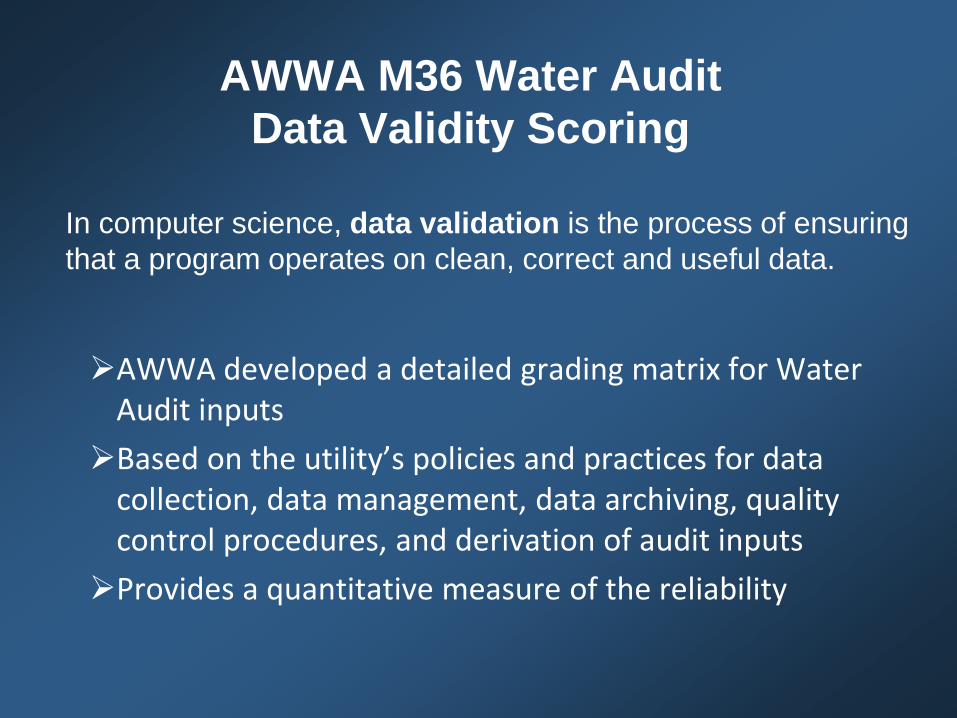
AWWA M36 Water Audit
Data Validity Scoring
AWWA developed a detailed grading matrix for Water Audit inputs
Based on the utility’s policies and practices for data collection, data management, data archiving, quality control procedures, and derivation of audit inputs
Provides a quantitative measure of the reliability
In computer science, data validation is the process of ensuring
that a program operates on clean, correct and useful data.

AWWA Free Water Audit Software© (V5.0)Data Grading for each Water Audit input (excerpt)

AWWA Free Water Audit Software© (V5.0)Guidance on Use of Water Audit Data, based on Level of
Data Validity
Functional
Focus Area
Audit Data
Collection
Short-term
loss control
Long-term
loss control
Target-setting
Benchmarkin
g
Identify Best Practices/ Best in
class - the ILI is very reliable as a
real loss performance indicator
for best in class service
For validity scores of 50 or below, the shaded blocks should not be focus areas until better data validity is achieved.
Preliminary Comparisons - can
begin to rely upon the
Infrastructure Leakage Index (ILI)
for performance comparisons for
real losses (see below table)
Performance Benchmarking - ILI
is meaningful in comparing real
loss standing
Continue incremental
improvements in short-term and
long-term loss control
interventions
Establish long-term apparent and
real loss reduction goals (+10
year horizon)
Establish mid-range (5 year
horizon) apparent and real loss
reduction goals
Evaluate and refine loss control
goals on a yearly basis
Begin to assess long-term needs
requiring large expenditure:
customer meter replacement,
water main replacement program,
new customer billing system or
Automatic Meter Reading (AMR)
system.
Begin to assemble economic
business case for long-term
needs based upon improved data
becoming available through the
water audit process.
Conduct detailed planning,
budgeting and launch of
comprehensive improvements for
metering, billing or infrastructure
management
Annual water audit is a reliable
gauge of year-to-year water
efficiency standing
Research information on leak
detection programs. Begin
flowcharting analysis of customer
billing system
Conduct loss assessment
investigations on a sample
portion of the system: customer
meter testing, leak survey,
unauthorized consumption, etc.
Establish ongoing mechanisms
for customer meter accuracy
testing, active leakage control
and infrastructure monitoring
Refine, enhance or expand
ongoing programs based upon
economic justification
Stay abreast of improvements in
metering, meter reading, billing,
leakage management and
infrastructure rehabilitation
Launch auditing and loss control
team; address production
metering deficiencies
Analyze business process for
customer metering and billing
functions and water supply
operations. Identify data gaps.
Establish/revise policies and
procedures for data collection
Refine data collection practices
and establish as routine business
process
Water Audit Data Validity Level / Score
Level I (0-25) Level II (26-50) Level III (51-70) Level IV (71-90) Level V (91-100)

18%
49%
33%
Finished Water Meter Flow Verification
Georgia Statewide Water Loss Technical Assistance –Finished Water Meter Testing
FAIL
UNTESTABLE
PASS

Georgia Statewide Water Loss Technical Assistance –Customer Meter Testing (CMT)
54%40%
6%
Customer Meter Testing
FAIL
UNTESTABLE
PASS

3-V
Validity
Value
Volume
MG per Year
Gal/connection/day
Leakage Index
$ per Year
Economic Loss Index
Water Audit Data Validity Score
95% Confidence Limits
Key Data Input Grades

Unaccounted
For Water
Unaccounted
For Water
Percentage
2003
Inconsistent use and interpretation
Unreliable indicator of
performance
Fails to segregate loss into its
components for effective
management

Water Loss or
NRW as % of
Supply

0
5
10
15
20
25
30
35
40
45
50
MG
DWater Loss as a Percentage of Supply is not an Indicator of Performance
Water Supplied (MGD)
Authorized Consumption (MGD)
Water Loss (MGD)
Development BoomGreat Recession,
Rate Increases,
Conservation
New Normal

10%
12%
14%
16%
18%
20%
22%
24%
26%
28%
0
5
10
15
20
25
30
35
40
45
50
MG
DWater Loss as a Percentage of Supply is not an Indicator of Performance
Water Supplied (MGD)
Authorized Consumption (MGD)
Water Loss (MGD)
Water Loss (Percent of Supply)


3-V
Validity
Value
Volume
MG per Year
Gal/connection/day
Leakage Index
$ per Year
Economic Loss Index
Water Audit Data Validity Score
95% Confidence Limits
Key Data Input Grades

Water Audit Data Validity Score: 74 out of 100
(Validated)
Economic Metrics Volume
95%
Confidence
Limits (+/-)
Value -
Water Only
Value -
With Sewer
95%
Confidence
Limits (+/-)
Non-Revenue Water 24,744 gal/conn/yr 14.2% 22$ 35$ $/conn/yr 16.6%
Non-Revenue Water 8,235 MG/yr 14.1% 7,166,110$ 11,568,137$ $/yr 16.6%
Target NRW Recovery (prel) 4,037 MG/yr 25.0% 4,707,445$ 7,985,285$ $/yr 25.0%
NRW Economic Index
(ratio of current vs optimum NRW cost) 2.9 3.2

Volume Value
Real Loss
Apparent Loss
Unbilled Consumption
NRW Components - By Volume (MG) - Level 2
Real Loss
Apparent Loss
Unbilled Consumption
NRW Components - By ValueLevel 2

Volume Value
Unbilled Unmetered
Unbilled Metered
Meter Inaccuracy
Theft
Data Handling
Unreported Leakage
Background Leakage
Reported Leakage
Real Loss Apparent Loss UnbilledConsumption
NRW Components - By Volume (MG)
Level 3
Unbilled Unmetered
Unbilled Metered
Meter Inaccuracy
Theft
Data Handling
Unreported Leakage
Background Leakage
Reported Leakage
Real Loss Apparent Loss UnbilledConsumption
NRW Components - By ValueLevel 3

Water Audit Report for:
Reporting Year: 2013 Show me the VOLUME of Non-Revenue Water
Data Validity Score: 60 Show me the COST of Non-Revenue Water
AWWA Free Water Audit Software:
Dashboard
1/2013 - 12/2013
Northern San Leandro Combined Water Sewer Storm Utility District (0007900)
0
10,000
20,000
30,000
40,000
50,000
60,000
70,000
80,000
90,000
Co
st $
Total Cost of NRW =$116,513
Unbilled metered (valued at Var. Prod. Cost)
Unbilled unmetered (valued at Var. Prod. Cost)
Unauth. consumption
Cust. metering inaccuracies
Syst. data handling errors
Real Losses (valued at Var. Prod. Cost)
WAS v5.0
American Water Works Association.Copyright © 2014, All Rights Reserved.
Water Exported
Authorized Consumption
Water Losses
0%
10%
20%
30%
40%
50%
60%
70%
80%
90%
100%
Water Exported
Water Imported
Volume From OwnSources
Water Exported
Billed Auth. Cons.
Unbilled Auth. Cons.
Apparent Losses
Real Losses
Water Exported
Revenue Water
Non Revenue Water
The graphic below is a visual representation of the Water Balance with bar heights propotional to the
volume of the audit components
Water Exported
Water Supplied
Water Audit Report for:
Reporting Year: 2013 Show me the VOLUME of Non-Revenue Water
Data Validity Score: 60 Show me the COST of Non-Revenue Water
AWWA Free Water Audit Software:
Dashboard
1/2013 - 12/2013
Northern San Leandro Combined Water Sewer Storm Utility District (0007900)
0
5
10
15
20
25
30
35
40
45
Volu
me
(MG
/Yr)
Total Volume of NRW = 75 MG/Yr
Unbilled metered (valued at Var. Prod. Cost)
Unbilled unmetered (valued at Var. Prod. Cost)
Unauth. consumption
Cust. metering inaccuracies
Syst. data handling errors
Real Losses (valued at Var. Prod. Cost)
WAS v5.0
American Water Works Association.Copyright © 2014, All Rights Reserved.
Water Exported
Authorized Consumption
Water Losses
0%
10%
20%
30%
40%
50%
60%
70%
80%
90%
100%
Water Exported
Water Imported
Volume From OwnSources
Water Exported
Billed Auth. Cons.
Unbilled Auth. Cons.
Apparent Losses
Real Losses
Water Exported
Revenue Water
Non Revenue Water
The graphic below is a visual representation of the Water Balance with bar heights propotional to the
volume of the audit components
Water Exported
Water Supplied

Volume Value
Current8.2 BG
Economically Optimized
3.6 BG
NRW Volume (BG/year)
Current$7.3M
Economically Optimized
$2.3M
NRW Value ($/year)
$5 M4.6 BG

Volume Value
Current8.2 BG
Economically Optimized
3.6 BG
NRW Volume (BG/year)
Current(WATER)$7.3M
Economically Optimized
(WATER)$2.3M
NRW Value ($/year)
4.6 BG
$8.5 M
(SEWER)$4.5M
(SEWER)$1.1M
$11.6
M
$3.4
M

Leakage Component Analysis

Basic Concepts
1. Utilize the Water Balance.
2. Separate Total Water Loss into Real and Apparent Loss.
3. Separate Real and Apparent Loss into their subcomponents.
4. Use metrics in units of Volume, Value & Validity.45

Homework
46

Homework
47
Register for the Workshop!
coloradowaterwise.org/WaterLossAuditTraining
*then we won’t call and bug you*
Who? Management, Finance, Operations, Conservation

Homework
48
If you have already had experience with the AWWA M36 Water Audit Methodology:
• Bring Your Questions

Homework
49
If this will be your first experience with the AWWA M36 Water Audit Methodology:
• Download the AWWA Free Water Audit Software– www.awwa.org/waterlosscontrol
• Download the WRF Free Leakage Component Analysis Model– http://www.waterrf.org/resources/pages/PublicWebTools-
detail.aspx?ItemID=27
…or google “WRF 4372”, look for web tools link at bottom of WRF page

Homework
50
What to Bring?
1. People (don’t forget to register)
2. Laptop (one per group is fine)
3. Your Questions
4. Readiness to Participate

Questions?
51

Colorado – Pilot Statewide Training Program
AWWA M36 Water Audits & Loss Control
coloradowaterwise.org/WaterLossAuditTraining
52