COLORADO HOUSING AND FINANCE AUTHORITY ANNUAL FINANCIAL REPORT · 2017-03-27 · COLORADO HOUSING...
80
COLORADO HOUSING AND FINANCE AUTHORITY ANNUAL FINANCIAL REPORT (With Independent Auditors’ Report Thereon) December 31, 2016 and 2015 Prepared by: Accounting Division
Transcript of COLORADO HOUSING AND FINANCE AUTHORITY ANNUAL FINANCIAL REPORT · 2017-03-27 · COLORADO HOUSING...

COLORADO HOUSING AND FINANCE AUTHORITY
ANNUAL FINANCIAL REPORT (With Independent Auditors’ Report Thereon)
December 31, 2016 and 2015
Prepared by:
Accounting Division

COLORADO HOUSING AND FINANCE AUTHORITY – Annual Financial Report Table of Contents
Page(s) EXECUTIVE LETTER (Unaudited) 1 – 3 INDEPENDENT AUDITORS’ REPORT 4 – 6 MANAGEMENT’S DISCUSSION AND ANALYSIS (Unaudited) 7 – 14
BASIC FINANCIAL STATEMENTS 15 – 19
Statement of Net Position 16 Statement of Revenues, Expenses and Changes in Net Position 17 Statement of Cash Flows 18 – 19
NOTES TO BASIC FINANCIAL STATEMENTS 20 – 61 REQUIRED SUPPLEMENTAL INFORMATION 62 – 63
Schedules of Selected Pension Information 63
SUPPLEMENTAL INFORMATION 64 – 73
1. Combining Schedule – Statement of Net Position 65 2. Combining Schedule – Statement of Revenues, Expenses and Changes in Net Position 66 3. Combining Schedule – Statement of Cash Flows 67 – 68 4. Schedule of Adjusted Net Worth 69 5. Schedule of Other Assets 70 6. Liquid Asset Requirement Calculation for Issuers 71 7. Capital Requirement Calculation for Issuer 72 8. Schedule of Insurance Requirement 73
HUD REPORTING 74 – 78
Independent Auditors’ Report on Compliance With Requirements That Could Have a Direct and Material Effect on Each Major HUD Program and on Internal Control Over Compliance Based on an Audit in Accordance With the HUD Consolidated Audit Guide 75 – 76 Independent Auditors’ Report on Internal Control over Financial Reporting and on Compliance and Other Matters Based on an Audit of Financial Statements Performed in Accordance with Government Auditing Standards 77 – 78

1
EXECUTIVE LETTER (UNAUDITED)

2
Message from Cris White, Executive Director and CEO March 23, 2017 CHFA’s programs to support housing stability and economic prosperity were in demand throughout Colorado in 2016. CHFA was pleased to exceed production goals in all three lines of CHFA’s business, in addition to setting a new record for the most single family mortgage production in our history - a significant indicator of the great need for affordable homeownership options in Colorado. Overall in 2016, CHFA supported:
6,114 Colorado households in obtaining home purchase loans, mortgage refinance loans, or mortgage credit certificates;
the development or preservation of 62 affordable rental housing projects, supporting a total of 5,573 rental housing units; and
414 businesses with our capital access and business lending programs, which combined supported 4,486 jobs.
CHFA made a $1.7 billion direct investment into our mission last year. The economic activity estimated to occur as a result of this investment is $2.5 billion.
Home prices grew by more than 8 percent in 2016, bringing the median sales price to $310,000. To support the growing need for affordable homeownership, CHFA invested $1.3 billion in first mortgage home loans in 2016. This surpassed our previous record for highest annual production of $745.9 million, achieved in 2015. Additionally, enrollment in statewide CHFA-sponsored homebuyer education classes reached an all-time high in 2016, with 10,719 households served.
In 2016’s third quarter, the median rent in Colorado was $1,267, which is a 48.8% increase over the last five years. As unaffordability became more widespread across Colorado last year, CHFA invested $323.2 million in multifamily loans and Low Income Housing Tax Credits to support the development or preservation of affordable rental housing properties. This investment translates to 5,573 units to be developed or preserved throughout Colorado. CHFA’s investment in economic development via our business finance programs strengthened Colorado communities in 2016. We exceeded our 2016 business finance production goal by more than 200 percent, investing $70.0 million to help businesses grow across the state. In addition, credit enhancement programs administered by CHFA, Colorado Credit Reserve and Cash Collateral Support, leveraged a combined $52.0 million in private sector lending to support Colorado businesses in 2016. CHFA’s Housing Opportunity Fund (HOF) remains an important resource to support our mission. In 2016, we doubled its balance by contributing $23.8 million, bringing the balance available to $42.2 million. HOF supported 652 new or preserved rental housing units in 2016, including 100 units serving formerly homeless families and individuals, and 196 serving seniors and disabled individuals. In addition, $11.6 million in HOF has been committed to support future projects. In the coming years, we expect HOF to continue to be a source of funding that accommodates an array of affordable housing and community development activities throughout Colorado.

3
As Colorado continues to grow and change, CHFA will continue to fulfill our mission and aspire to realize our vision that everyone in Colorado will have the opportunity for housing stability and economic prosperity. This will take strong partnerships, creative solutions, and a continued commitment to our values.
Cris A. White Executive Director and CEO

4
INDEPENDENT AUDITORS’ REPORT

Independent Auditor’s Report
The Board of Directors Colorado Housing and Finance Authority Denver, Colorado
Report on the Financial Statements We have audited the accompanying financial statements of Colorado Housing and Finance Authority (the Authority) as of and for the years ended December 31, 2016 and 2015, and the related notes to the financial statements, which collectively comprise the Authority’s basic financial statements as listed in the table of contents.
Management’s Responsibility for the Financial Statements Management is responsible for the preparation and fair presentation of these financial statements in accordance with accounting principles generally accepted in the United States of America; this includes the design, implementation and maintenance of internal control relevant to the preparation and fair presentation of financial statements that are free from material misstatement, whether due to fraud or error.
Auditor’s Responsibility Our responsibility is to express an opinion on these financial statements based on our audits. We conducted our audits in accordance with auditing standards generally accepted in the United States of America and the standards applicable to financial audits contained in Government Auditing Standards, issued by the Comptroller General of the United States. Those standards require that we plan and perform the audit to obtain reasonable assurance about whether the financial statements are free from material misstatement.
An audit involves performing procedures to obtain audit evidence about the amounts and disclosures in the financial statements. The procedures selected depend on the auditor’s judgment, including the assessment of the risks of material misstatement of the financial statements, whether due to fraud or error. In making those risk assessments, the auditor considers internal control relevant to the entity’s preparation and fair presentation of the financial statements in order to design audit procedures that are appropriate in the circumstances, but not for the purpose of expressing an opinion on the effectiveness of the entity’s internal control. Accordingly, we express no such opinion. An audit also includes evaluating the appropriateness of accounting policies used and the reasonableness of significant accounting estimates made by management, as well as evaluating the overall presentation of the financial statements.
We believe that the audit evidence we have obtained is sufficient and appropriate to provide a basis for our audit opinion.
Opinion In our opinion, the financial statements referred to above present fairly, in all material respects, the respective financial position of the Colorado Housing and Finance Authority as of December 31, 2016 and 2015, and the respective changes in financial position and, where applicable, cash flows thereof for the years then ended in accordance with accounting principles generally accepted in the United States of America.
5

Other Matters Required Supplementary Information Accounting principles generally accepted in the United States of America require that the management’s discussion and analysis and the schedule of selected pension information, as listed in the table of contents, be presented to supplement the basic financial statements. Such information, although not a part of the basic financial statements, is required by the Governmental Accounting Standards Board, who considers it to be an essential part of financial reporting for placing the basic financial statements in an appropriate operational, economic or historical context. We have applied certain limited procedures to the required supplementary information in accordance with auditing standards generally accepted in the United States of America, which consisted of inquiries of management about the methods of preparing the information and comparing the information for consistency with management’s responses to our inquiries, the basic financial statements, and other knowledge we obtained during our audit of the basic financial statements. We do not express an opinion or provide any assurance on the information because the limited procedures do not provide us with sufficient evidence to express an opinion or provide any assurance. Supplementary and Other Information Our audit was conducted for the purpose of forming opinions on the financial statements that collectively comprise the Authority’s basic financial statements. The executive letter and the supplementary information, as listed in the table of contents, are presented for purposes of additional analysis and are not a required part of the basic financial statements. The supplementary information is the responsibility of management and was derived from and relates directly to the underlying accounting and other records used to prepare the basic financial statements. Such information has been subjected to the auditing procedures applied in the audit of the basic financial statements and certain additional procedures, including comparing and reconciling such information directly to the underlying accounting and other records used to prepare the basic financial statements, or to the basic financial statements themselves, and other additional procedures in accordance with auditing standards generally accepted in the United States of America. In our opinion, the supplementary information is fairly stated, in all material respects, in relation to the basic financial statements as a whole. The executive letter has not been subjected to the auditing procedures applied in the audit of the basic financial statements, and accordingly, we do not express an opinion or provide any assurance on it. Other Reporting Required by Government Auditing Standards In accordance with Government Auditing Standards, we have also issued our report dated March 23, 2017, on our consideration of the Authority’s internal control over financial reporting and on our tests of its compliance with certain provisions of laws, regulations, contracts, and grant agreements and other matters. The purpose of that report is to describe the scope of our testing of internal control over financial reporting and compliance and the results of that testing, and not to provide an opinion on internal control over financial reporting or on compliance. That report is an integral part of an audit performed in accordance with Government Auditing Standards in considering the Authority’s internal control over financial reporting and compliance.
Denver, Colorado March 23, 2017
6

7
MANAGEMENT’S DISCUSSION AND ANALYSIS (UNAUDITED)

Management’s Discussion and Analysis
(unaudited)
8
This section of the Colorado Housing and Finance Authority’s (the Authority) annual financial report presents management’s discussion and analysis of the financial position and results of operations as of and for the years ended December 31, 2016 and 2015. This information is being presented to provide additional information regarding the activities of the Authority and to meet the disclosure requirements of Government Accounting Standards Board (GASB) Statement No. 34, Basic Financial Statements – and Management’s Discussion and Analysis – for State and Local Governments. The Authority is a public purpose financial enterprise, a body corporate and political subdivision of the State of Colorado (the State), that finances affordable housing, business and economic growth opportunities for residents and businesses of Colorado. Its dual mission is to increase the availability of affordable, decent and accessible housing for lower- and moderate-income Coloradans, and to strengthen the state’s development by providing financial assistance to businesses. Established by the Colorado General Assembly in 1973, the Authority raises funds through the public and private sale of bonds and notes, which are not obligations of the State. The proceeds are loaned to eligible borrowers, primarily through private lending institutions across the state under sound fiscal practices established by the Authority. As a self-sustaining organization, the Authority’s operating revenues come from loan and investment income, program administration fees, loan servicing and gains on sales of loans. The Authority receives no tax appropriations, and its net revenues are reinvested in its programs and used to support bond ratings. The Authority participates in the Government National Mortgage Association (Ginnie Mae) Mortgage Backed Securities (MBS) Programs. Through the MBS Programs, Ginnie Mae guarantees securities that are issued by the Authority and that are backed by pools of mortgage loans. Ginnie Mae securities, which can be held or sold, carry the full faith and credit guaranty of the United States government. Holders of the securities receive a “pass-through” of the principal and interest payments on a pool of mortgage loans, less amounts required to cover servicing costs and Ginnie Mae guaranty fees. The Ginnie Mae guaranty ensures that the holder of the security issued by the Authority receives the timely payment of scheduled monthly principal and any unscheduled recoveries of principal on the underlying mortgage loans, plus interest at the rate provided for in the securities. All loans pooled under the Ginnie Mae MBS Programs are either insured by the Federal Housing Administration or are guaranteed by the United States Department of Agriculture Rural Development or the Veterans Administration. The Authority also participates in the Federal National Mortgage Association (Fannie Mae) Mortgage Backed Securities (MBS) and Whole Loan Commitment Programs. Fannie Mae is a Government-Sponsored Enterprise with a public mission to provide stability in and to increase the liquidity of the residential mortgage market for homebuyers. The Authority is a Fannie Mae Seller/Servicer, either selling whole loans to Fannie Mae for cash or swapping pooled loans for mortgage-backed securities (MBS) issued by Fannie Mae, which securities can be held or sold. The Authority also participates in the Federal Home Loan Corporation (Freddie Mac) Whole Loan Commitment Program. Freddie Mac is a Government-Sponsored Enterprise with a public mission to provide liquidity, stability and affordability to the nation’s housing market. The Authority is a Freddie Mac Seller/Servicer, selling whole loans to Freddie Mac for cash. Overview of the Financial Statements The basic financial statements consist of the Statement of Net Position, the Statement of Revenues, Expenses and Changes in Net Position, the Statement of Cash Flows and the notes thereto. The Authority follows enterprise fund accounting. The financial statements offer information about the Authority’s activities and operations. The Statement of Net Position includes all of the Authority’s assets and liabilities, presented in order of liquidity, along with deferred outflows and deferred inflows. The resulting net position presented in these statements is displayed as invested in capital assets, restricted or unrestricted. Net position is restricted when its use is subject to external limits such as bond indentures, legal agreements or statutes.
Management’s Discussion and Analysis
(unaudited)
9
All of the Authority’s current year revenues and expenses are recorded in the Statement of Revenues, Expenses and Changes in Net Position. This statement measures the activities of the Authority’s operations over the past year and presents the resulting change in net position. The final required financial statement is the Statement of Cash Flows. The primary purpose of this statement is to provide information about the Authority’s cash receipts and cash payments during the reporting period. This statement reports cash receipts, cash payments and net changes in cash resulting from operating, noncapital financing, capital and related financing and investing activities. The statement provides information regarding the sources and uses of cash and the change in the cash balance during the reporting period. The notes to the financial statements provide additional information that is essential for a full understanding of the information provided in the financial statements. Required and other supplementary information is presented following the notes to financial statements to provide selected pension information and other supplemental information, such as combining schedules for the Authority’s programs. Debt Activity On May 5, 2016, the Authority issued $12.5 million in tax exempt, Federally Insured Multi-Family Pass-Through, Series 2016-I Bonds to fund the construction and permanent loan for Montbello VOA Senior Housing Project. On July 20, 2016, the Authority issued $18.0 million in tax exempt, Federally Insured Multi-Family Pass-Through, Series 2016-II Bonds to fund the construction and permanent loan for Crisman Apartments Project. On August 31, 2016, the Authority issued $7.5 million in tax exempt, Federally Insured Multi-Family Pass-Through, Series 2016-III Bonds to fund the construction and permanent loan for Willow Street Residences Project. On September 29, 2016, the Authority issued $12.4 million in tax exempt, Federally Insured Multi-Family Pass-Through, Series 2016-IV Bonds to fund the construction and permanent loan for Porter House Apartments Project. On October 25, 2016, the Authority issued $1.2 million in Federally Taxable 2016 Series A-1 Bonds and $10.5 million in non-AMT 2016 Series A-2 bonds to fund building improvements at the Authority’s headquarters. On December 14, 2016 the Authority issued $44.0 million in tax exempt, Federally Insured Multi-Family Pass-Through, Series 2016-V Bonds to refund a portion of bonds within the Multi-Family Project Indenture. In connection with the refunding, certain outstanding Federally Insured mortgage loans were transferred and pledged to the 2016-V Series Bonds. Programs – The financial statements present the activities of the Authority’s housing and lending programs. Information regarding these programs is provided in the supplemental schedules. Financial Highlights
Total cash and investments as of December 31, 2016 were $698.8 million, a decrease of $48.1 million, or 6.4%,
compared to the amount outstanding as of December 31, 2015. The decrease was primarily the result of payments made against interest rate swap agreements and scheduled payments of principal and interest on bonds outstanding.
Total net loans receivable as of December 31, 2016 were $1.2 billion, a decrease of $46.7 million, or 3.8%, compared to the amount outstanding as of December 31, 2015. Loan repayments occurred without a

Management’s Discussion and Analysis
(unaudited)
10
corresponding increase in new loans retained as the Authority continued in 2016 to sell all of its single family loan production through four vehicles: sales of Ginnie Mae and Fannie Mae mortgage backed securities or by direct sale to Fannie Mae or Freddie Mac. During 2016, $972.3 million in loans were sold through the issuance and sale of Ginnie Mae securities, $202.1 million in loans were pooled and swapped for Fannie Mae mortgage backed securities, which were subsequently sold, $66.9 million in loans were sold directly to Fannie Mae and $25.5 million in loans were sold directly to Freddie Mac.
Total deferred outflows as of December 31, 2016 were $108.2 million, a decrease of $22.1 million, or 17.0%, compared to the amount outstanding as of December 31, 2015, reflecting an increase in market interest rates.
As of December 31, 2016, bonds, notes payable and short-term debt were $1.3 billion, a decrease of $174.6 million, or 11.5%, compared to the balance at December 31, 2015. Payments of loans, together with available cash, have been used to reduce bond balances.
Net position as of December 31, 2016 was $364.5 million, an increase of $24.4 million, or 7.2%, compared to the balance at December 31, 2015. Net position as a percent of total assets increased from 16.9% as of December 31, 2015 to 18.9% as of December 31, 2016.
As reflected in the Statement of Revenues, Expenses and Changes in Net Position, the change in net position was $8.0 million or 48.5% more than the results at December 31, 2015. The increase in the change in net position compared to prior year was primarily composed of the following:
A $1.4 million increase in net interest income as a result of lower bond expense.
A $48.4 million increase in other operating income is a result of the following:
$36.5 million increase in gain on sale of loans
$1.1 million increase in investment derivative activity
$8.1 million increase in fair value of investments
$2.7 million increase in loan servicing and other revenues
A $41.1 million increase in operating expenses due primarily to expenses related to the down payment assistance program.
Management’s Discussion and Analysis
(unaudited)
11
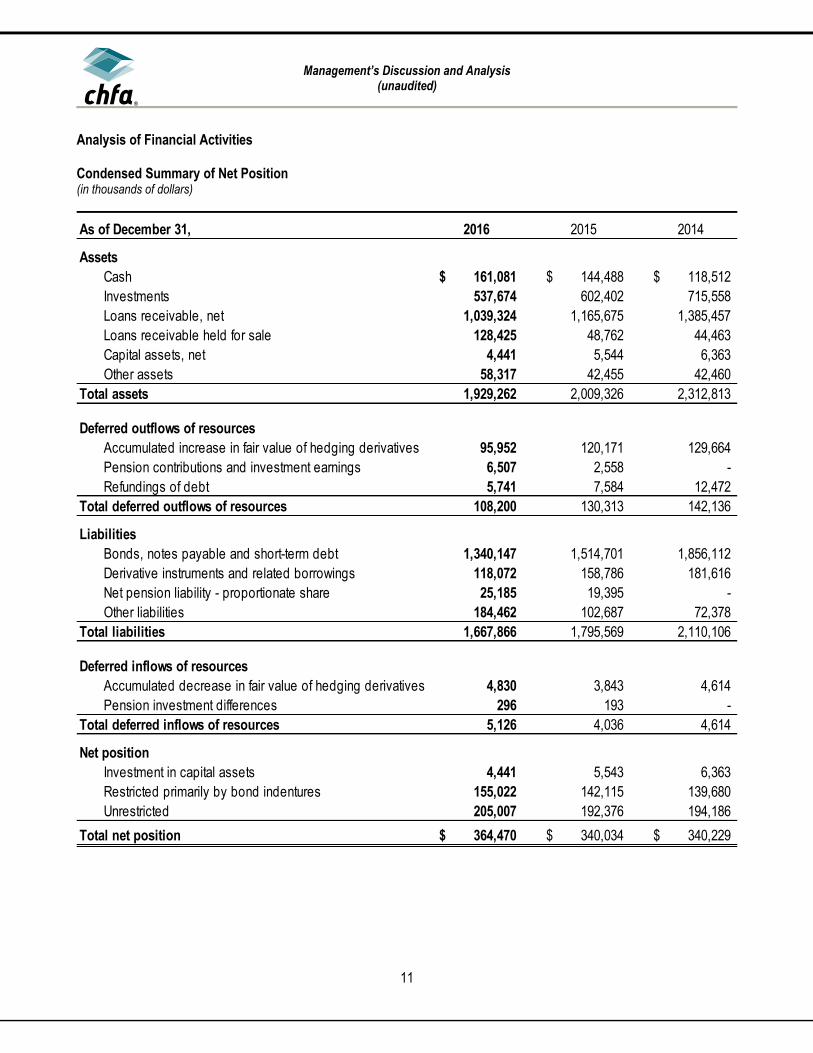
Analysis of Financial Activities Condensed Summary of Net Position (in thousands of dollars)
As of December 31, 2016 2015 2014
Assets
Cash 161,081$ 144,488$ 118,512$
Investments 537,674 602,402 715,558
Loans receivable, net 1,039,324 1,165,675 1,385,457
Loans receivable held for sale 128,425 48,762 44,463
Capital assets, net 4,441 5,544 6,363
Other assets 58,317 42,455 42,460
Total assets 1,929,262 2,009,326 2,312,813
Deferred outflows of resources
Accumulated increase in fair value of hedging derivatives 95,952 120,171 129,664
Pension contributions and investment earnings 6,507 2,558 -
Refundings of debt 5,741 7,584 12,472
Total deferred outflows of resources 108,200 130,313 142,136
Liabilities
Bonds, notes payable and short-term debt 1,340,147 1,514,701 1,856,112
Derivative instruments and related borrowings 118,072 158,786 181,616
Net pension liability - proportionate share 25,185 19,395 -
Other liabilities 184,462 102,687 72,378
Total liabilities 1,667,866 1,795,569 2,110,106
Deferred inflows of resources
Accumulated decrease in fair value of hedging derivatives 4,830 3,843 4,614
Pension investment differences 296 193 -
Total deferred inflows of resources 5,126 4,036 4,614
Net position
Investment in capital assets 4,441 5,543 6,363
Restricted primarily by bond indentures 155,022 142,115 139,680
Unrestricted 205,007 192,376 194,186
Total net position 364,470$ 340,034$ 340,229$

Management’s Discussion and Analysis
(unaudited)
12
Comparison of Years Ended December 31, 2016 and 2015 Total assets decreased $80.1 million, or 4.0%, from the prior year. Total cash and investments decreased $48.1 million, or 6.4% primarily as a result of payments made against interest rate swap agreements and scheduled payments of principal and interest on bonds outstanding. Net loans receivable decreased by $46.7 million, or 3.8%, as a result of loan repayments occurring without a corresponding increase in new loans retained as the Authority continued in 2016 to sell all of its single family loan production through four vehicles: sales of Ginnie Mae and Fannie Mae mortgage backed securities or by direct sale to Fannie Mae or Freddie Mac. Deferred outflows decreased $22.1 million, or 17.0%, from the prior year, reflecting an increase in market interest rates. Total liabilities decreased $127.7 million, or 7.1%, from the prior year. Bonds, notes payable and short-term debt decreased $174.6 million, or 11.5% from the prior year, primarily due to scheduled bond payments and additional unscheduled redemptions. Derivative instruments and related borrowings decreased $40.7 million, or 25.6%, from the prior year due to an increase in market interest rates. Comparison of Years Ended December 31, 2015 and 2014 Total assets decreased $303.5 million, or 13.1%, from the prior year. Total cash and investments decreased $87.2 million, or 10.5% primarily as a result of payments made against interest rate swap agreements and scheduled payments of principal and interest on bonds outstanding. Net loans receivable, including loans receivable held for sale, decreased by $215.5 million, or 15.1%, as a result of loan repayments occurring without a corresponding increase in new loans retained as the Authority continued in 2015 to sell all of its single family loan production through three vehicles: sales of Ginnie Mae and Fannie Mae mortgage backed securities or by direct sale to Fannie Mae. Deferred outflows decreased $11.8 million, or 8.3%, from the prior year, reflecting an increase in market interest rates. Total liabilities decreased $314.5 million, or 14.9%, from the prior year. Bonds, notes payable and short-term debt decreased $341.4 million, or 18.4% from the prior year, primarily due to scheduled bond payments and additional unscheduled redemptions. Derivative instruments and related borrowings decreased $22.8 million, or 12.6%, from the prior year due to an increase in market interest rates.

Management’s Discussion and Analysis
(unaudited)
13
Condensed Summary of Revenues, Expenses and Changes in Net Position (in thousands of dollars)
For the years ended December 31, 2016 2015 2014
Interest income and expense:
Interest on loans receivable 63,648$ 72,283$ 83,347$
Interest on investments 14,472 23,667 21,522
Interest on debt (53,367) (72,616) (80,603)
Net interest income 24,753 23,334 24,266
Other operating income (loss):
Rental income 17 17 32
Gain on sale of loans 86,527 50,065 23,846
Investment derivative activity gain (loss) 2,651 1,569 (3,194)
Net increase (decrease) in the fair value of investments (5,032) (13,123) 8,790
Other revenues 29,487 26,749 22,739
Total other operating income 113,650 65,277 52,213
Total operating income 138,403 88,611 76,479
Operating expenses:
Salaries and related benefits 22,207 18,647 16,977
General operating 90,306 51,872 24,489
Depreciation 932 1,109 1,197
Provision for loan losses (180) 525 (2,698)
Total operating expenses 113,265 72,153 39,965
Net operating income 25,138 16,458 36,514
Nonoperating expenses:
Federal grant receipts 129,405 120,224 116,944
Federal grant payments (129,405) (120,224) (116,944)
Loss on sale of capital assets (702) - (20)
Total nonoperating income and expenses, net (702) - (20)
Change in net position 24,436 16,458 36,494
Net position:
Beginning of year 340,034 340,229 303,735
Restatement due to GASB 68 - (16,653) -
End of year 364,470$ 340,034$ 340,229$

Management’s Discussion and Analysis
(unaudited)
14
Comparison of Years Ended December 31, 2016 and 2015 Total operating income increased by $49.8 million in 2016, or 56.2%, compared to 2015. The following contributed to the increase:
Interest income decreased by $17.8 million in 2016 as a result of higher loan prepayments without a corresponding increase in new loan production retained.
Interest expense related to debt decreased by $19.2 million due to lower outstanding balances and reducing interest through actions to restructure debt.
Gain on sale of loans increased $36.5 million due to increased loan activity related to the down payment assistance grant program offered in 2016.
The fair value of investments and investment derivative activity collectively increased by $9.2 million due primarily to changes in market rates during 2016.
Other revenues increased $2.7 million due to higher servicing fee income collected.
Total operating expenses increased $41.1 million in 2016, or 57.0%, compared to 2015. The increase was primarily due to expenses related to the down payment assistance program that began in 2015. The federal grant receipts/payments consisted primarily of pass-through amounts related to the Authority’s role as a contract administrator of the U.S. Department of Housing and Urban Development’s Section 8 subsidy program. Under the Section 8 subsidy program, tenants pay 30% of their income toward rent and the balance is paid by federal subsidy. Comparison of Years Ended December 31, 2015 and 2014 Total operating income increased by $12.1 million in 2015, or 15.9%, compared to 2014. The following contributed to the increase:
Interest income decreased by $8.9 million in 2015 as a result of higher loan prepayments without a corresponding increase in new loan production retained.
Interest expense related to debt decreased by $8.0 million due to lower outstanding balances and reducing interest through actions to restructure debt.
Gain on sale of loans increased $26.2 million due to increased loan activity related to the down payment assistance grant program offered in 2015.
The fair value of investments and investment derivative activity collectively decreased by $17.2 million due primarily to changes in market rates during 2015.
Other revenues increased $4.0 million due to higher servicing fee income collected.
Total operating expenses increased $32.2 million in 2015, or 80.5%, compared to 2014. The increase was primarily due to expenses related to the down payment assistance program that began in 2015. The federal grant receipts/payments consisted primarily of pass-through amounts related to the Authority’s role as a contract administrator of the U.S. Department of Housing and Urban Development’s Section 8 subsidy program. Under the Section 8 subsidy program, tenants pay 30% of their income toward rent and the balance is paid by federal subsidy.

15
BASIC FINANCIAL STATEMENTS

16
Colorado Housing and Finance Authority
Statement of Net Position
(in thousands of dollars)
2016 2015
Assets
Current assets:
Cash
Restricted 117,993$ 97,753$
Unrestricted 43,088 46,735
Investments (partially restricted, see note 2) 291,336 317,090
Loans receivable (partially restricted, see note 3) 34,644 87,617
Loans receivable held for sale 128,425 48,762
Other current assets 25,792 15,325
Total current assets 641,278 613,282
Noncurrent assets:
Investments (partially restricted, see note 2) 246,338 285,312
Loans receivable, net (partially restricted, see note 3) 1,004,680 1,078,058
Capital assets, net 4,441 5,544
Other assets 32,525 27,130
Total noncurrent assets 1,287,984 1,396,044
Total assets 1,929,262 2,009,326
Deferred outflows of resources
Accumulated increase in fair value of hedging derivatives 95,952 120,171
Pension contributions and investment earnings 6,507 2,558
Refundings of debt 5,741 7,584
Total deferred outflows of resources 108,200 130,313
Liabilities
Current liabilities:
Short-term debt 61,005 77,505
Bonds payable 46,947 84,192
Notes payable 103 102
Other current liabilities 172,899 95,498
Total current liabilities 280,954 257,297
Noncurrent liabilities:
Bonds and notes payable 1,232,092 1,352,902
Derivative instruments 91,385 121,187
Hybrid instrument borrowing 26,687 37,599
Net pension liability - proportionate share 25,185 19,395
Other liabilities 11,563 7,189
Total noncurrent liabilities 1,386,912 1,538,272
Total liabilities 1,667,866 1,795,569
Deferred inflows of resources
Accumulated decrease in fair value of hedging derivatives 4,830 3,843
Pension investment differences 296 193
Total deferred inflows of resources 5,126 4,036
Net position
Investment in capital assets 4,441 5,543
Restricted primarily by bond indentures 155,022 142,115
Unrestricted 205,007 192,376
Total net position 364,470$ 340,034$
As of December 2016 and 2015
See accompanying notes to basic financial statements.

17
Colorado Housing and Finance Authority
Statement of Revenues, Expenses and Changes in Net Position
(in thousands of dollars)
2016 2015
Interest income and expense:
Interest on loans receivable 63,648$ 72,283$
Interest on investments 14,472 23,667
Interest on debt (53,367) (72,616)
Net interest income 24,753 23,334
Other operating income (loss):
Rental income 17 17
Gain on sale of loans 86,527 50,065
Investment derivative activity gain 2,651 1,569
Net decrease in the fair value of investments (5,032) (13,123)
Other revenues 29,487 26,749
Total other operating income 113,650 65,277
Total operating income 138,403 88,611
Operating expenses:
Salaries and related benefits 22,207 18,647
General operating 90,306 51,872
Depreciation 932 1,109
Provision for loan losses (180) 525
Total operating expenses 113,265 72,153
Net operating income 25,138 16,458
Nonoperating income and expenses:
Federal grant receipts 129,405 120,224
Federal grant payments (129,405) (120,224)
Loss on sale of capital assets (702) -
Total nonoperating income and expenses (702) -
Change in net position 24,436 16,458
Net position:
Beginning of year 340,034 340,229
Restatement due to GASB 68 - (16,653)
End of year 364,470$ 340,034$
For the years ended December 2016 and 2015
See accompanying notes to basic financial statements.

18
Colorado Housing and Finance Authority
Statement of Cash Flows
(in thousands of dollars)
2016 2015
Cash flows from operating activities:
Principal payments received on loans receivable
and receipts from dispositions of other real estate owned 974,533$ 450,109$
Interest payments received on loans receivable 64,917 74,123
Payments for loans receivable (1,405,172) (807,829)
Receipts from sales of Ginnie Mae securities 614,840 623,901
Receipts from rental operations 17 17
Receipts from other revenues 29,774 26,724
Payments for salaries and related benefits (15,675) (17,177)
Payments for goods and services (91,997) (52,078)
All other, net 14,990 32,020 -
Net cash provided by operating activities 186,227 329,810
Cash flows from noncapital financing activities:
Net increase (decrease) in short-term debt (16,500) 15,700
Proceeds from issuance of bonds 106,041 125,300
Proceeds from issuance of notes payable - 266
Receipts from federal grant programs 129,941 119,282
Payments for federal grant programs (129,405) (120,224)
Principal paid on bonds (264,573) (483,652)
Interest rate swap activity, net (5,793) (5,754)
Principal paid on notes payable (103) (104)
Interest paid on short-term debt (504) (235)
Interest rate swap settlements (44,674) (60,485)
Interest paid on bonds (18,159) (17,757)
Interest paid on notes payable (10) (10) -
Net cash used in noncapital financing activities (243,739) (427,673)
Cash flows from capital and related financing activities:
Purchase of capital assets (530) (291)
Net cash used in capital and related financing activities (530) (291)
Cash flows from investing activities:
Proceeds from maturities and sales of investments 2,140,154 2,593,526
Purchase of investments (2,080,462) (2,493,489)
Income received from investments 14,943 24,093
Net cash provided by investing activities 74,635 124,130
Net increase in cash 16,593 25,976
Cash at beginning of year 144,488 118,512
Cash at end of year 161,081$ 144,488$
Restricted 117,993$ 97,753$
Unrestricted 43,088 46,735
Cash, end of year 161,081$ 144,488$
For the years ended December 2016 and 2015
Continued on the next page

19
Colorado Housing and Finance Authority
Statement of Cash Flows (continued)
For the years ended December 2016 and 2015
(in thousands of dollars)
2016 2015
Reconciliation of operating income to net cash
provided by operating activities:
Net operating income 25,138$ 16,458$
Adjustments to reconcile operating income to
net cash provided by operating activities:
Depreciation expense 932 1,109
Amortization and fair value adjustments of service release premiums 15,657 8,212
Proportionate share of net pension expense 1,943 377
Amortization of derivatives related borrowings (10,912) (7,657)
Provision for loan losses (180) 525
Interest on investments (14,472) (23,667)
Interest on debt 64,279 80,273
Unrealized gain on investment derivatives (2,651) (1,569)
Unrealized loss on investments 5,032 13,123
Gain on sale of REO (59) (278)
Gain on sale of loans receivable held for sale (86,527) (50,065)
Changes in assets and liabilities:
Loans receivable and other real estate owned 116,370 257,870
Accrued interest receivable on loans and investments 1,269 1,840
Other assets (18,620) (3,409)
Accounts payable and other liabilities 89,028 36,668
Net cash provided by operating activities 186,227$ 329,810$
See accompanying notes to basic financial statements.

20
NOTES TO BASIC FINANCIAL STATEMENTS

Notes to Basic Financial Statements
(tabular dollar amounts are in thousands)
21
1) Organization and Summary of Significant Accounting Policies (a) Authorizing Legislation and Reporting Entity Authorizing Legislation - The Colorado Housing and Finance Authority (the Authority) is a body corporate and a political subdivision of the State of Colorado (the State) established pursuant to the Colorado Housing and Finance Authority Act, Title 29, Article 4, Part 7 of the Colorado Revised Statutes (the Statutes), as amended (the Act). The Authority is not a state agency and is not subject to administrative direction by the State. The governing body of the Authority is its board of directors (the Board). Operations of the Authority commenced in 1974. The Authority is not a component unit of the State or any other entity.
The Authority was created for the purpose of making funds available to assist private enterprise and governmental entities in providing housing facilities for lower- and moderate-income families. Under the Act, the Authority is also authorized to finance projects and working capital loans to industrial and commercial enterprises (both for-profit and nonprofit) of small and moderate size.
In 1992, Colorado voters approved an amendment to the State Constitution, Article X, Section 20, which, among other things, imposes restrictions on increases in revenue and expenditures of state and local governments. In the opinion of its bond counsel, the Authority qualifies as an enterprise under the amendment and, therefore, is exempt from its provisions.
In 2001, the Colorado state legislature repealed the limitation on the amount of debt that the Authority can issue as well as removed the moral obligation of the State on future debt issues of the Authority. The bonds, notes and other obligations of the Authority do not constitute debt of the State. Lending and Housing Programs – The Authority accounts for its lending and operating activities in the following groups:
General Program – The General Program is the Authority’s primary operating program. It accounts for assets, liabilities, revenues and expenses not directly attributable to a bond program. Most of the bond resolutions of the programs permit the Authority to make cash transfers to the general accounts after establishing reserves required by the bond resolutions. The general accounts financially support the bond programs when necessary. The general accounts include proprietary loan programs developed by the Authority to meet the needs of low- and moderate-income borrowers not served by traditional lending programs. The general accounts also include administrative activities related to the federal government’s Section 8 housing assistance payments program. Single Family Program – The Single Family Program includes bonds issued and assets pledged for payment of the bonds under the related indentures. Loans acquired under this program with the proceeds of single family bond issues include Federal Housing Administration (FHA), conventional, United States Department of Agriculture (USDA) Rural Development, Rural Economic and Community Development Department (RD), and Veterans Administration (VA) loans made under various loan programs. Multi-Family/Business Program – The Multi-Family/Business Program includes bonds issued and assets pledged for payment of the bonds under the related indentures. Loans acquired under this program with the proceeds of multi-family and business (sometimes referred to as project) bond issues include loans made for the purchase, construction or rehabilitation of multi-family rental housing. In addition, business loans are made to both for-profit and nonprofit organizations primarily for the purpose of acquisition or expansion of their facilities or for the purchase of equipment.
(b) Basis of Accounting The Authority presents its financial statements in accordance with United States Generally Accepted Accounting Principles (U.S. GAAP) as established by the Governmental Accounting Standards Board (GASB). For financial purposes, the

Notes to Basic Financial Statements
(tabular dollar amounts are in thousands)
22
Authority is considered a special-purpose government engaged in business-type activities. The financial statements are prepared using the economic resources measurement focus and the accrual basis of accounting. Under the accrual basis, revenues are recognized when earned, and expenses are recorded when incurred. All significant intra-entity transactions have been eliminated.
(c) Summary of Significant Accounting Policies Estimates – The preparation of financial statements in conformity with U.S. GAAP requires management to make estimates and assumptions that affect the reported amounts of assets, liabilities, deferred outflows and deferred inflows and disclosure of contingent assets and liabilities at the date of the financial statements and the reported amounts of revenue and expenses during the reported period. Significant estimates to the Authority’s financial statements include the allowance for loan losses and fair value estimates. Actual results could differ from those estimates. Cash and Restricted Cash – The Authority’s cash and cash equivalents are represented by cash on hand and demand deposits held in banks. Restricted cash includes payments received on pledged assets and used for the payment of bonds under the related indenture agreements. Also included in restricted cash are escrow balances, payments in process and various government deposits. Restricted Assets – Amounts related to Single Family and Multi-Family/Business Programs are considered restricted and are detailed in the supplemental schedules. Restricted assets are held for the benefit of respective bondholders and accounted for by program. Certain other assets are held on behalf of various governmental housing initiatives or regulations. Investments – Noncurrent investments of the Authority, representing those investments which are held as reserves under indenture or other restrictions, are reported at fair value based on values obtained from third-party pricing services. The values are based on quoted market prices when available or on adjusted value in relation to observable prices on similar investments. Money market investments are reported at amortized cost. Investment amounts related to Single Family and Multi-Family/Business Programs are considered restricted and are detailed in the supplemental schedules. Loans Receivable – Mortgage loans receivable are reported at their unpaid principal balance net of an allowance for estimated loan losses. Loans related to Single Family and Multi-Family/Business Programs are considered restricted and are detailed in the supplemental schedules. Loans Receivable Held for Sale – Loans originated or acquired and intended for sale in the secondary market are carried at the lower of cost or fair value. Gains and losses on loan sales (sales proceeds minus carrying value) are reported as other operating income. Allowance for Loan Losses – The allowance for loan losses is a reserve against current operations based on management's estimate of expected loan losses. Management’s estimate considers such factors as the payment history of the loans, the projected cash flows of the borrowers, estimated value of the collateral, subsidies, guarantees, mortgage insurance, historical loss experience for each loan type, additional guarantees provided by the borrowers and economic conditions. Based on review of these factors, a total reserve amount is calculated and a provision is made against current operations to reflect the estimated balance. Troubled Debt Restructuring – A restructuring of a debt constitutes a troubled debt restructuring if the creditor for economic or legal reasons related to the debtor’s financial difficulties grants a concession to the debtor that it would not otherwise consider. Whatever the form of concession granted by the creditor to the debtor in a troubled debt restructuring, the creditor’s objective is to make the best of a difficult situation. That is, the creditor expects to obtain more cash or other value from the debtor, or to increase the probability of receipt, by granting the concession than by not granting it.

Notes to Basic Financial Statements
(tabular dollar amounts are in thousands)
23
Interest income is recognized using the new interest rate after restructuring, which approximates the effective interest rate. Additional information is disclosed in the loans receivable note. See note 3. Capital Assets – Capital assets are defined by the Authority as assets with an initial, individual cost of $10 thousand or greater. Capital assets are depreciated or amortized using the straight-line method over their estimated useful lives, which are 30 years for buildings and from 3 to 10 years for furniture and equipment. Other Assets – Other assets is primarily made up of mortgage servicing rights. Mortgage servicing rights are amortized over the estimated life of the related loans using the effective interest method. Unamortized costs totaling $29.2 million and $23.3 million were outstanding at December 31, 2016 and 2015, respectively. Included in these amounts are mortgage servicing rights of $24.4 million and $18.6 million as of December 31, 2016 and 2015, respectively, related to loans sold by the Authority for which the Authority retained the mortgage servicing. These mortgage servicing rights are reported at the lower of cost or fair value. The Authority recorded impairment losses of $4.1 million and $1.1 million on mortgage servicing rights as of December 31, 2016 and 2015, respectively. The impairment losses are reported in general operating expense on the Statement of Revenues, Expenses and Changes in Net Position. Bonds – Bonds payable are general and limited obligations of the Authority, and are not a debt or liability of the State or any subdivisions thereof. Each bond issue is secured, as described in the applicable trust indenture, by all revenues, moneys, investments, mortgage loans, and other assets in the accounts of the program. Virtually all of the Authority’s loans and investments are pledged as security for the bonds. The provisions of the applicable trust indentures require or allow for redemption of bonds through the use of unexpended bond proceeds and excess funds accumulated primarily through prepayment of mortgage loans and program certificates. All outstanding bonds are subject to redemption at the option of the Authority, in whole or in part at any time after certain dates, as specified in the respective series indentures. The Authority issues fixed rate and variable rate bonds. The rate on the fixed rate bonds is set at bond closing. The variable rate bonds bear interest at either a monthly or a weekly rate until maturity or earlier redemption. For bonds that pay weekly rates, the remarketing agent for each bond issue establishes the weekly rate according to each indenture’s remarketing agreement. The weekly rates are communicated to the various bond trustees for preparation of debt service payments. The weekly rate, as set by the remarketing agent, allows the bonds to trade in the secondary market at a price equal to 100% of the principal amount of the bonds outstanding, with each rate not exceeding maximum rates permitted by law. The Authority has variable rate demand bonds that have Stand-by Purchase Agreements (SBPA), which state that the issuer of the SBPA will purchase the bonds in the event the remarketing agent is unsuccessful in marketing the bonds. In this event, the interest rate paid by the Authority will be calculated using a defined rate from the SBPA. If the bonds remain unsold for a period of 90 days, they are deemed to be “bank bonds” and the Authority is required to repurchase the bonds from the SBPA issuer. The timing of this repurchase, or term out, will vary by issuer from two to five years. Bond Discounts and Premiums – Discounts and premiums on bonds payable are amortized to interest expense over the lives of the respective bond issues using the effective interest method. Debt Refundings – For current refundings and advance refundings resulting in defeasance of debt, the difference between the reacquisition price and the net carrying amount of the old debt is deferred and amortized as a component of interest expense over the remaining life of the old or new debt, whichever is shorter. The difference is amortized using the effective interest method, with the exception of the amount relating to deferred loss on terminated interest rate swap hedging relationships, which is amortized on a straight-line basis. The deferred refunding amounts are classified as a component of deferred outflows on the Statement of Net Position.

Notes to Basic Financial Statements
(tabular dollar amounts are in thousands)
24
Derivative Instruments – Derivative instruments, as defined in GASB No. 53, Accounting and Financial Reporting for Derivative Instruments, are measured on the Statement of Net Position at fair value. Changes in fair value for those derivative instruments that meet the criteria for hedging instruments under GASB No. 53 are reported as deferred inflows and outflows. Changes in fair value of investment derivative instruments, which are ineffective derivative instruments, are reported within investment derivative activity loss starting in the period of change. Derivative Instruments – Interest Rate Swap Agreements – The Authority enters into interest rate swap agreements (swap) with rated swap counterparties in order to (1) provide lower cost fixed rate financing for its loan production needs through synthetic fixed rate structures and (2) utilize synthetic fixed rate structures with refunding bonds in order to generate cash flow savings. The interest differentials to be paid or received under such swaps are recognized as an increase or decrease in interest expense of the related bond liability. The Authority enters into fixed payor swaps, where it pays a fixed interest rate in exchange for receiving a variable interest rate from the counterparty. The variable interest rate may be based on either a taxable or tax-exempt index. By entering into a swap agreement, the Authority hedges its interest rate exposure on the associated variable rate bonds. The Authority’s interest rate swaps are generally considered to be hedging derivative instruments under GASB No. 53. However, certain interest rate swaps have been deemed ineffective and are classified as investment derivative instruments. Additional information about the swap agreements is provided in note 8. Derivative Instruments – Forward Sales Contracts – Forward sales of mortgage backed securities within the To-Be-Announced market are utilized to hedge changes in fair value of mortgage loan inventory and commitments to purchase mortgage loans at fixed rates. At December 31, 2016, the Authority had executed 114 forward sales transactions with a $384.0 million notional amount with six counterparties with concentrations and ratings (Standard and Poor’s/Moody’s Investors Service) as shown in note 8. The forward sales will all settle by March 21, 2017. These contracts are considered investment derivative instruments and carry a fair value of $2.4 million as of December 31, 2016. Hybrid Instrument Borrowings – Hybrid instrument borrowings represent cash premiums received on interest rate swaps that had a fair value other than zero at the date of execution, generally because the fixed rates were different from market rates at that date. Interest expense is imputed on these borrowings, which are reported at amortized cost. Net Pension Liability – For purposes of measuring the net pension liability, deferred outflows of resources and deferred inflows of resources related to pensions, pension expense, information about the fiduciary net position of the Public Employee’s Retirement Association of Colorado (PERA) pension plan and additions to/deductions from PERA’s fiduciary net position have been determined on the same basis as they are reported by PERA. For this purpose, benefit payments (including refunds of employee contributions) are recognized when due and payable in accordance with benefit terms. Other Liabilities – The major other liabilities are as follows:
Servicing escrow: The net amount of collected escrow funds currently being held on behalf of borrowers to pay future obligations of property taxes and insurance premiums due on real properties. The Authority has a corresponding asset that is recorded in restricted cash.
Deferred Low Income Housing Tax Credit (LIHTC) Income: Compliance monitoring fees collected in advance on multi-family properties that have been awarded low-income housing tax credits to be used over a 15-year period. These fees cover the ongoing cost the Authority incurs to certify that these properties remain low-income compliant during the 15-year period and continue to be eligible to use the tax credits awarded.
Compensated Absences: Employees accrue paid time off at a rate based on length of service. Employees may accrue and carry over a maximum of 150% of their annual paid time off benefit. The liability for compensated absences is based on current salary rates and is reported in the Statement of Net Position.
Classification of Revenues and Expenses – The Authority distinguishes operating revenues and expenses from nonoperating items. Operating revenues and expenses generally result from providing services in connection with the Authority’s ongoing operations. The principal operating revenues of the Authority are interest income on loans, gain on sale

Notes to Basic Financial Statements
(tabular dollar amounts are in thousands)
25
of loans and investment income. The Authority also recognizes revenues from rental operations and other revenues, which include loan servicing fees and other administrative fees. Operating expenses include interest expense, administrative expenses, depreciation, and the provision for loan losses. All revenues and expenses not meeting this definition are reported as nonoperating revenues and expenses. The Authority’s nonoperating revenues and expenses consist primarily of pass-through amounts related to the Authority’s role as a contract administrator of the U.S. Department of Housing and Urban Development’s Section 8 subsidy program. Under the Section 8 subsidy program, tenants pay 30% of their income toward rent and the balance is paid to the Authority by federal subsidy. New Accounting Principles – As of December 31, 2016, the Authority implemented GASB Statement No. 72, Fair Value Measurement and Application. This statement addresses accounting and financial reporting issues related to fair value measurements. The definition of fair value is the price that would be received to sell an asset or paid to transfer a liability in an orderly transaction between market participants at the measurement date. This Statement provides guidance for determining a fair value measurement for financial reporting purposes. This Statement also provides guidance for applying fair value to certain investments and disclosures related to all fair value measurements. The Statement establishes a hierarchy of inputs to valuation techniques to measure fair value. That hierarchy has three levels. Level 1 inputs are quoted prices (unadjusted) in active markets for identical assets or liabilities. Level 2 inputs are inputs – other than quoted prices – included within Level 1 that are observable for the asset or liability, either directly or indirectly. Finally, Level 3 inputs are unobservable inputs, such as management’s assumptions of the default rate among underlying mortgages of a mortgage-backed security. The requirements of this Statement will enhance comparability of financial statements among governments by requiring measurement of certain assets and liabilities at fair value using a consistent and more detailed definition of fair value and accepted valuation techniques. This Statement also will enhance fair value application guidance and related disclosures in order to provide information to financial statement users about the impact of fair value measurements on a government’s financial position. The provisions of this statement were implemented as of December 31, 2016. GASB issued Statement No. 79, Certain External Investment Pools and Pool Participants. This Statement addresses accounting and financial reporting for certain external investment pools and pool participants. Specifically, it establishes criteria for an external investment pool to qualify for making the election to measure all of its investments at amortized cost for financial reporting purposes. An external investment pool qualifies for that reporting if it meets all of the applicable criteria established in this Statement. The specific criteria address (1) how the external investment pool transacts with participants; (2) requirements for portfolio maturity, quality, diversification, and liquidity; and (3) calculation and requirements of a shadow price. Significant noncompliance prevents the external investment pool from measuring all of its investments at amortized cost for financial reporting purposes. Professional judgment is required to determine if instances of noncompliance with the criteria established by this Statement during the reporting period, individually or in the aggregate, were significant. This statement was applicable to the Authority’s investments in external investment pools as of December 31, 2016. Future Accounting Principles – GASB issued Statement No. 75, Accounting and Financial Reporting for Postemployment Benefits Other Than Pensions, which is effective for financial statements for periods beginning after June 15, 2018. This Statement replaces the requirements of Statements No. 45, Accounting and Financial Reporting by Employers for Postemployment Benefits Other Than Pensions, as amended, and No. 57, OPEB Measurements by Agent Employers and Agent Multiple-Employer Plans, for OPEB. Statement No. 74, Financial Reporting for Postemployment Benefit Plans Other Than Pension Plans, establishes new accounting and financial reporting requirements for OPEB plans. The scope of this Statement addresses accounting and financial reporting for OPEB that is provided to the employees of state and local governmental employers. This Statement establishes standards for recognizing and measuring liabilities, deferred outflows of resources, deferred inflows of resources, and expense/expenditures. For defined benefit OPEB, this Statement identifies

Notes to Basic Financial Statements
(tabular dollar amounts are in thousands)
26
the methods and assumptions that are required to be used to project benefit payments, discount projected benefit payments to their actuarial present value, and attribute that present value to periods of employee service. Note disclosure and required supplementary information requirements about defined benefit OPEB also are addressed. This Statement will be applicable to the Authority in 2018; however, the financial impact of the applicability of Statement No. 75 on the Authority’s financial statements has not yet been determined. GASB issued Statement No. 80, Blending Requirements for Certain Component Units—an amendment of GASB Statement No. 14, which is effective for reporting periods beginning after June 15, 2016. The objective of this Statement is to improve financial reporting by clarifying the financial statement presentation requirements for certain component units. This Statement amends the blending requirements established in paragraph 53 of Statement No. 14, The Financial Reporting Entity, as amended. This Statement amends the blending requirements for the financial statement presentation of component units of all state and local governments. The additional criterion requires blending of a component unit incorporated as a not-for-profit corporation in which the primary government is the sole corporate member. The additional criterion does not apply to component units included in the financial reporting entity pursuant to the provisions of Statement No. 39, Determining Whether Certain Organizations Are Component Units. This Statement will be applicable to the Authority in 2017; however, the financial impact of the applicability of Statement No. 80 on the Authority’s financial statements has not yet been determined. GASB issued Statement No. 82, Pension Issues an amendment of GASB Statements No. 67, No. 68, and No.73. The objective of this Statement is to address certain issues that have been raised with respect to Statements No. 67, Financial Reporting for Pension Plans, No. 68, Accounting and Financial Reporting for Pensions, and No. 73, Accounting and Financial Reporting for Pensions and Related Assets That Are Not within the Scope of GASB Statement No. 68, and Amendments to Certain Provisions of GASB Statements No. 67 and No. 68. Specifically, this Statement addresses issues regarding (1) the presentation of payroll-related measures in required supplementary information, (2) the selection of assumptions and the treatment of deviations from the guidance in an Actuarial Standard of Practice for financial reporting purposes and (3) the classification of payments made by employers to satisfy employee (plan member) contribution requirements. This Statement clarifies that payments made by an employer to satisfy contribution requirements that are identified by the pension plan terms as plan member contributions for purposes of Statement No. 67 and as employee contributions for the purposes of Statement No. 68. It also requires that an employer’s expense and expenditures for those amounts be recognized in the period for which the contribution is assessed and classified in the same manner as the employer classifies similar compensation other than pensions (for example, as salaries and wages or as fringe benefits). The requirements of this Statement are effective for reporting periods beginning after June 15, 2016, except for the requirements of this Statement for the selection of assumptions in a circumstance in which an employer’s pension liability is measured as of a date other than the employer’s most recent fiscal year-end. In that circumstance, the requirements for the selection of assumptions are effective for that employer in the first reporting period in which the measurement date of the pension liability is on or after June 15, 2017. GASB issued Statement No. 84, Fiduciary Activities. The objective of this Statement is to improve guidance regarding the identification of fiduciary activities for accounting and financial reporting purposes and how those activities should be reported. This Statement establishes criteria for identifying fiduciary activities of all state and local governments. The focus of the criteria generally is on (1) whether a government is controlling the assets of the fiduciary activity and (2) the beneficiaries with whom a fiduciary relationship exists. Separate criteria are included to identify fiduciary component units and postemployment benefit arrangements that are fiduciary activities. An activity meeting the criteria should be reported in a fiduciary fund in the basic financial statements. Governments with activities meeting the criteria should present a statement of fiduciary net position and a statement of changes in fiduciary net position. An exception to that requirement is provided for a business-type activity that normally expects to hold custodial assets for three months or less. This Statement describes four fiduciary funds that should be reported, if applicable: (1) pension (and other employee benefit) trust funds, (2) investment trust funds, (3) private-purpose trust funds, and (4)

Notes to Basic Financial Statements
(tabular dollar amounts are in thousands)
27
custodial funds. Custodial funds generally should report fiduciary activities that are not held in a trust or equivalent arrangement that meets specific criteria. As the Authority does not currently participate in fiduciary activities subject to this Statement, no impact to Authority’s financial statements is anticipated at this time. The requirements of this Statement are effective for reporting periods beginning after December 15, 2018. Earlier application is encouraged. Reclassifications – Certain reclassifications have been made to the statement of net position as of December 31, 2015 in order to conform to the presentation used for December 31, 2016. These reclassifications had no effect on the change in net position or net position as previously reported. (2) Cash and Investments Cash and Cash Equivalents – The Authority’s cash and cash equivalents are reported as either restricted or unrestricted and are represented by cash on hand and demand deposits held in banks. Cash is classified as restricted when its use is subject to external limits such as bond indentures, legal agreements or statutes. Restricted cash includes payments received on pledged assets and used for the payment of bonds under the related indenture agreements. Also included in restricted cash are escrow balances, payments in process and various government deposits. As of December 31, 2016 and 2015, the Authority had unrestricted cash of $43.1 million and $46.7 million, respectively. Restricted cash as of December 31, 2016 and 2015 was as follows:
Summary of Restricted Cash 2016 2015
Customer escrow accounts 101,524$ 73,901$
Payments in process 12,454 20,398
Administered program deposits 4,015 3,454
Total fair value 117,993$ 97,753$
Custodial Credit Risk – Cash Deposits – In the case of cash deposits, custodial credit risk is the risk that in the event of a bank failure, the Authority’s deposits may not be returned to it. All deposit accounts were either covered by the Federal Deposit Insurance Corporation or fully collateralized in accordance with the State of Colorado’s Division of Banking’s Public Deposit Protection Act. Included in cash deposits are escrow deposits in the amount of $101.5 million and $73.9 million held in a fiduciary capacity as of December 31, 2016 and 2015, respectively. These escrow deposits are primarily held for the payment of property taxes and insurance on behalf of the mortgagors whose loans are owned or serviced by the Authority. Investments – The Authority is authorized by means of a Board-approved investment policy to invest in notes, bonds and other obligations issued or guaranteed by the U.S. government and certain governmental agencies. Additionally, the Authority is permitted to invest, with certain restrictions as to concentration of risk, collateralization levels, maximum periods to maturity, and/or underlying rating levels applied, in revenue or general obligations of states and their agencies, certificates of deposits, U.S. dollar denominated corporate or bank debt, commercial paper, repurchase agreements backed by U.S. government or agency securities, money market mutual funds and investment agreements. The Authority’s investment policy requires 1) staggered maturities to avoid undue concentrations of assets in a specific maturity sector, 2) stable income, 3) adequate liquidity to meet operations and debt service obligations and 4) diversification to avoid overweighting in any one type of security. The Authority is also subject to permissible investments as authorized by Title 24, Article 75, Part 6 of the Statues. Permissible investments pursuant to the Statutes are either identical to or less restrictive than the Authority’s investment policy. In addition, each of the trust indentures established under the Authority’s bond programs contains requirements as to permitted investments of bond fund proceeds, which may be more or less restrictive than the

Notes to Basic Financial Statements
(tabular dollar amounts are in thousands)
28
Authority’s investment policy. These investments are included in the disclosures below under State and political subdivision obligations. General Program investments of $22.5 million include investments pledged as of December 31, 2016 as follows: a $9 million overnight deposit pledged to the FHLB line of credit and Colorado Local Government Liquid Asset Trust (COLOTRUST) investments of Rural Development Loan Program (RDLP), RDLP II and RDLP V in the amounts of $856 thousand, $740 thousand and $262 thousand, respectively; each pledged as collateral for the RDLP notes payable and $98 thousand of investments pledged as collateral for private placement bonds. General Program investments of $89.1 million include investments pledged as of December 31, 2015 as follows: a $18.4 million certificate of deposit and a $57.0 million Federal Home Loan Bank (FHLB) discount note pledged to the FHLB line of credit and Colorado Local Government Liquid Asset Trust (COLOTRUST) investments of Rural Development Loan Program (RDLP), RDLP II and RDLP V in the amounts of $811 thousand, $423 thousand and $503 thousand, respectively; each pledged as collateral for the RDLP notes payable and $945 thousand of investments pledged as collateral for private placement bonds. All Single Family and Multi-Family/Business Program investments, which total $515.2 million and $513.3 million as of December 31, 2016 and 2015, respectively, are restricted under bond indentures or other debt agreements, or otherwise pledged as collateral for borrowings. These amounts are detailed in the supplemental schedules. Interest Rate Risk – Interest rate risk is the risk that changes in interest rates will adversely affect the fair value of an investment. Except for the money market mutual fund investments, substantially all of the Authority’s investments are subject to this risk. As of December 31, 2016, the Authority had the following investment maturities:
Less More
Investment Type Than 1 1-5 6-10 Than 10 Total
External investment pool $ 8,831 $ - $ - $ - $ 8,831
Investment agreements - uncollateralized 50,010 - - 22,830 72,840
Money market mutual fund 96,483 - - - 96,483
Overnight deposit 9,000 - - - 9,000
Repurchase agreement 8,539 - - 4,506 13,045
State & political subdivision obligations 393 - - - 393
U.S. government agencies 117,910 25,947 - 192,500 336,357
U.S. Treasury 170 555 - - 725
Total $ 291,336 $ 26,502 $ - $ 219,836 $ 537,674
Investment Maturities (In Years)

Notes to Basic Financial Statements
(tabular dollar amounts are in thousands)
29
As of December 31, 2015, the Authority had the following investment maturities:
Less More
Investment Type Than 1 1-5 6-10 Than 10 Total
Certificate of deposit $ 18,400 $ - $ - $ - $ 18,400
External investment pool 7,124 - - - 7,124
Investment agreements - uncollateralized 79,166 - - 27,148 106,314
Money market mutual fund 42,196 - - - 42,196
Repurchase agreement 19,652 - - 4,506 24,158
State & political subdivision obligations - - - 425 425
U.S. government agencies 77,083 31,195 - 221,464 329,742
U.S. Treasury 73,468 - 575 - 74,043
Total $ 317,089 $ 31,195 $ 575 $ 253,543 $ 602,402
Investment Maturities (In Years)
Credit Risk – The following table provides credit ratings of the Authority’s investments as determined by Standard and Poor’s and/or Moody’s Investors Service.
2016 2015
Investment Type Rating Total Rating Total
Certificate of deposit Not Rated -$ Not Rated 18,400$
External investment pool AAAm 8,831 AAAm 7,124
Investment agreements - uncollateralized AA+/A1 1,983 AA+/A1 10,794
Investment agreements - uncollateralized A/A2 13,419 A/A2 17,134
Investment agreements - uncollateralized A+/Aa2 5,500 A+/Aa2 5,500
Investment agreements - uncollateralized AA-/Aa3 3,339 AA-/Aa3 4,376
Investment agreements - uncollateralized AA/Aa2 15,487 AA/Aa2 30,683
Investment agreements - uncollateralized AA+/Aa2 33,112 AA+/Aa2 37,827
Money market mutual fund AAAm/Aaa 96,483 AAAm/Aaa 42,196
Overnight deposit Not Rated 9,000 Not Rated -
Repurchase agreements AA+/Aaa 13,045 AA+/Aaa 24,158
State and political subdivision obligations AAA/Aaa 393 AAA/Aaa 425
U.S. government agencies AA+/Aaa 336,357 AA+/Aaa 329,742
U.S. Treasury AA+/Aaa 725 AA+/Aaa 74,043
Total 537,674$ 602,402$
Of the investments in securities issued by state and political subdivisions, 100% are rated AAA as of December 31, 2016 and 2015. Investment agreements meet the requirements of the rating agency providing the rating on the related debt issue and of the Board’s investment policy. The Board’s investment policy states that the Authority is empowered to invest in any security that is a revenue or general obligation of any political subdivision. The credit rating at the time of purchase must be

Notes to Basic Financial Statements
(tabular dollar amounts are in thousands)
30
rated in one of its two highest rating categories by one or more nationally recognized organizations, which regularly rate such obligations and concentration limits may not exceed more than 20% of the investment portfolio. As of December 31, 2016 and 2015, the Authority had invested in COLOTRUST, an investment vehicle established for local governmental entities in Colorado to pool funds available for investment. COLOTRUST is reflected in the above tables as an external investment pool. The State Securities Commissioner administers and enforces all State statutes governing COLOTRUST. COLOTRUST operates similarly to a money market fund and each share’s fair value is $1.00. Concentration of Credit Risk – The Authority has various maximum investment limits both by type of investment and by issuer to prevent inappropriate concentration of credit risk. The following table provides information on issuers in which the Authority has investments representing more than 5% of its total investments as of December 31, 2016 and 2015.
Issuer 2016 2015
FHLB 19.67% 16.14%
FHLMC 15.29% 15.72%
FNMA 3.94% 5.36%
GNMA 17.56% 20.58%
Goldman Sachs 5.70% 0.00%
Invesco 7.77% 0.00%
IXIS 7.80% 11.95%
Mass Mutual 6.16% 0.00%
Trinity 0.00% 6.28%
US Treasury 0.13% 12.29%
Wells Fargo 12.25% 4.26%
Custodial Credit Risk – Investments – Custodial credit risk is the risk that, in the event of the failure of the custodian, the Authority will not be able to recover the value of its investment or collateral securities that are in the possession of the custodian. All securities owned by the Authority are either in the custody of the related bond indenture trustees or held in the name of the Authority by a party other than the issuer of the security.

Notes to Basic Financial Statements
(tabular dollar amounts are in thousands)
31
(3) Loans Receivable, Related Allowances and Troubled Debt Restructuring Loans receivable and loans receivable held for sale at December 31, 2016 and 2015 consisted of the following:
2016 2015
General Fund 236,464$ 164,902$
Single Family Fund 418,446 536,362
Multi-Family/Business Fund:
Multi-Family/Project 456,321 499,457
Multi-Family Pass Through 74,579 24,734
Total Multi-Family/Business Fund 530,900 524,191
Less intercompany loans, included in Multi-Family/Project above (11,679) (1,443)
Total loans receivable 1,174,131 1,224,012
Payments in process (762) (2,844)
Allowance for loan losses (5,620) (6,731)
Total loans receivable, net 1,167,749$ 1,214,437$
Loans in the Single Family Program and the Multi-Family/Business Program in the table above are grouped based on the related bond type (see note 6 for additional information). Amounts related to these programs are considered restricted and are detailed in the supplemental schedules. General Program loans include single family, multi-family and business finance loans acquired under various programs of the General Program, loans to be sold through the issuance of Ginnie Mae securities, loans to be sold to Fannie Mae and Freddie Mac, loans to be pooled and swapped for securities issued by Fannie Mae, loans held as investments and loans backed by bonds within the General Program. These loans are typically collateralized by mortgages on real property and improvements. Certain of these loans are also insured or guaranteed by agencies of the U.S. government. Single family bond program loans are collateralized by mortgages on applicable real property and, in the case of loans with an initial loan-to-value ratio of 80% or more, are generally either insured by the FHA or guaranteed by the VA or RD or insured by private mortgage insurance. The single family loan portfolio included in the general and single family programs as of December 31, 2016 was comprised of $376.5 million of FHA insured loans, $18.9 million of VA guaranteed loans, $18.5 million of RD guaranteed loans and $68.4 million of conventional insured loans with the balance of $112.0 million made up of uninsured conventional and second mortgage loans. The single family loan portfolio included in the general and single family programs as of December 31, 2015 was comprised of $404.3 million of FHA insured loans, $27.3 million of VA guaranteed loans, $20.8 million of RD guaranteed loans and $73.8 million of conventional insured loans with the balance of $113.4 million made up of uninsured conventional and second mortgage loans. The Authority is exposed to operational risk, which makes it subject to loss or repurchase of insured FHA loans if specific guidelines are not met. As of December 31, 2016 and 2015, the Authority recorded a reserve of $202 thousand and $205 thousand, respectively, for claim refunds to be paid to the U.S. Department of Housing and Urban Development (HUD).

Notes to Basic Financial Statements
(tabular dollar amounts are in thousands)
32
As of December 31, 2016 and 2015, single family mortgage loans with pending foreclosure actions have aggregate principal balances of approximately $6.9 million and $7.9 million, respectively. As of December 31, 2016 and 2015, the aggregate principal balance of single family mortgage loans delinquent 91 days or greater was approximately $31.9 million and $39.2 million, respectively. The Multi-Family/Business Program loans and a portion of General Program loans are commercial loans. Commercial loans are collateralized by mortgages on applicable real estate and, in some cases, are insured by an agency of the U.S. government, which reduces the credit risk exposure for that type of insured loan. As of December 31, 2016, approximately $306.7 million, or 72.2%, of the commercial loan balances are not covered by insurance. The insured loans were comprised of $203.2 million of Section 542(c) risk share loans, which are 50% insured, and $3.4 million of Section 221(d) new construction and rehabilitation loans, which are 99% insured. As of December 31, 2015, approximately $313.8 million, or 72.9%, of the commercial loan balances are not covered by insurance. The insured loans were comprised of $184.5 million of Section 542(c) risk share loans, which are 50% insured, and $7.2 million of Sections 221(d) and 223(f) new construction and rehabilitation loans, which are 99% insured. As of December 31, 2016 and 2015, there were no commercial loans with pending foreclosure actions. As of December 31, 2016 and 2015, commercial loans delinquent 91 days or greater aggregate principal balances were approximately $0 and $161 thousand, respectively. Activity in the allowance for loan loss for the years ended December 31, 2016 and 2015 was as follows:
2016 2015
Beginning balance 6,731$ 8,948$
Provision (179) 525
Net charge-offs
Single-family (714) (1,835)
Multi-family/Business (218) (907)
Ending balance 5,620$ 6,731$
The Authority services loans that it securitizes as Ginnie Mae mortgage-backed securities and sells. As of December 31, 2016 and 2015, these loans totaled $1.9 billion and $1.5 billion, respectively. The Authority services loans on the behalf of others, primarily for Fannie Mae and Freddie Mac, which are not reported on the Statement of Net Position. As of December 31, 2016 and 2015, these outstanding loan balances were $564.8 million and $411.5 million, respectively.

Notes to Basic Financial Statements
(tabular dollar amounts are in thousands)
33
The Authority has granted terms and interest rate concessions to debtors, which are considered troubled debt restructurings, as of December 31, 2016 and 2015, as summarized below:
Single Family Program Loans: 2016 2015
Aggregate recorded balance 46,768$ 46,047$
Number of loans 386 369
Gross interest revenue
if receivables had been current 2,619$ 2,223$
Interest revenue included in
changes in net position 1,801$ 1,807$
Multi-Family/Business Program Loans: 2016 2015
Aggregate recorded balance 18,971$ 17,351$
Number of loans 19 22
Gross interest revenue
if receivables had been current 1,126$ 966$
Interest revenue included in
changes in net position 961$ 991$

Notes to Basic Financial Statements
(tabular dollar amounts are in thousands)
34
(4) Capital Assets Capital asset activity for the year ended December 31, 2016 was as follows:
Beginning
Balance Additions Reductions
Ending
Balance
Nondepreciable capital assets:
Land 1,573$ -$ -$ 1,573$
Construction in progress - 475 - 475
Total nondepreciable capital assets 1,573 475 - 2,048
Depreciable capital assets:
Cost:
Computer equipment/software * 15,196 55 (8,176) 7,075
Furniture and equipment 1,116 - (862) 254
Buildings and related improvements 8,042 - (3,506) 4,536
Total depreciable capital assets 24,354 55 (12,544) 11,865
Less accumulated depreciation:
Computer equipment/software * (14,359) (510) 8,172 (6,697)
Furniture and equipment (919) (77) 862 (134)
Buildings and related improvements (5,105) (345) 2,809 (2,641)
Total accumulated depreciation (20,383) (932) 11,843 (9,472)
Total depreciable capital assets, net 3,971 (877) (701) 2,393
Total capital assets, net 5,544$ (402)$ (701)$ 4,441$
* Includes capital lease

Notes to Basic Financial Statements
(tabular dollar amounts are in thousands)
35
Capital asset activity for the year ended December 31, 2015 was as follows:
(5) Short-Term Debt The Authority has agreements with the FHLB of Topeka for collateralized borrowings in an amount not to exceed the lending limit internally established by the FHLB, which is 40% of the Authority’s total assets, or $771.7 million. As of December 31, 2016 and 2015, the Authority had $61.0 million and $77.5 million of short-term debt outstanding with the FHLB, respectively. Borrowings under these agreements are used to support the Authority’s various lending programs, to purchase loans to be sold through the issuance and sale of Ginnie Mae securities and activities related to the Authority’s private activity bond volume cap preservation program. Amounts drawn under the agreements bear interest at the same rates charged by the FHLB to its member banks and are collateralized by certain mortgage loans and investments. There are no commitment fees associated with these agreements. The Authority also has a revolving, unsecured, commercial bank line of credit agreement for borrowings of up to $50.0 million. Amounts drawn under the agreement bear interest fixed at 1.5% per annum above the one week or one-month LIBOR rate. This line of credit agreement terminates on October 3, 2017. The Authority pays an unused line fee at the rate of 0.2% per annum, payable in arrears on the first business day after each calendar quarter. The fee is based upon the average daily unused amount of the line of credit computed on the basis of a 360-day year. As of December 31, 2016 and 2015, there were no outstanding balances.
Beginning
Balance Additions Reductions
Ending
Balance
Nondepreciable capital assets:
Land 1,573$ -$ -$ 1,573$
Construction in progress 234 301 (535) -
Total nondepreciable capital assets 1,807 301 (535) 1,573
Depreciable capital assets:
Cost:
Computer equipment/software * 14,678 518 - 15,196
Furniture and equipment 1,116 - - 1,116
Buildings and related improvements 8,035 7 - 8,042
Total depreciable capital assets 23,829 525 - 24,354
Less accumulated depreciation:
Computer equipment/software * (13,701) (658) - (14,359)
Furniture and equipment (831) (88) - (919)
Buildings and related improvements (4,741) (364) - (5,105)
Total accumulated depreciation (19,273) (1,110) - (20,383)
Total depreciable capital assets, net 4,556 (585) - 3,971
Total capital assets, net 6,363$ (284)$ (535)$ 5,544$
* Includes capital lease

Notes to Basic Financial Statements
(tabular dollar amounts are in thousands)
36
Short-term debt activity for the years ended December 31, 2016 and 2015 was as follows:
2016 2015
Beginning balance 77,505$ 61,805$
Additions 4,817,491 4,160,340
Reductions (4,833,991) (4,144,640)
Ending balance 61,005$ 77,505$
(6) Bonds, Notes Payable and Other Liabilities The Authority issues bonds and notes payable to finance its lending programs. Proceeds from long-term debt of the Single Family and Multi-Family/Business bonds are used for funding of single family, multi-family and business loans. Long-term debt of the General Program (including notes payable) is used to finance single family and business loans. The aggregate principal amounts of bonds and notes payable outstanding as of December 31, 2016 and 2015 are shown in the table on the following pages. Interest is payable semiannually unless otherwise noted. Interest rates on variable rate debt reset on a weekly or monthly basis. At December 31, 2016, these rates ranged from 0.57% to 1.32%. At December 31, 2015, these rates ranged from 0.01% to 0.98%.

Notes to Basic Financial Statements
(tabular dollar amounts are in thousands)
37
Outstanding Bonds at December 31, 2016:
Descripton and due date Interest rate (%) 2016 2015
Bonds payable:
General Fund (prior to 2011, all General Fund bonds carry the Authority's general obligation pledge):
Multi-Family/Business Finance:
Guaranteed Loan Participation Purchase Bonds: (* principal and interest payable monthly)
2004 Series B* 2016 - 2016 4.88 -$ 1,074$
2011 Series A* 2017 - 2031 2.92 426 528
2012 Series A* 2017 - 2025 2.84 4,187 5,100
Total Guaranteed Loan Participation Purchase Bonds 4,613 6,702
Taxable Rental Project Revenue Bonds: (* principal and interest payable monthly)
2000 Series A 2017 - 2020 6.15 2,240 2,884
2002 Series AV* 2017 - 2022 5.55 1,138 1,250
2003 Series AV* 2017 - 2024 5.19 605 655
2004 Series A* 2017 - 2024 4.90 7,937 8,467
Total Taxable Rental Project Revenue Bonds 11,920 13,256
Total Multi-Family/Business Finance 16,533 19,958
Total General Fund 16,533 19,958
Single Family Fund:
Single Family Mortgage Bonds:
2001 Series AA 2017 - 2038 Variable 69,695 79,030
2002 Series A 2017 - 2021 Variable 8,905 11,255
2002 Series B 2017 - 2021 Variable 23,240 23,240
2002 Series C 2017 - 2022 Variable 18,990 22,175
2003 Series B 2017 - 2028 Variable 33,990 36,485
2006 Series A 2017 - 2036 Variable 32,170 38,585
2006 Series B 2017 - 2036 Variable 66,780 79,925
2006 Series C 2016 - 2016 Variable - 12,395
2007 Series A 2017 - 2037 Variable 39,300 45,895
2007 Series B 2017 - 2038 Variable 99,940 102,545
2008 Series A 2017 - 2038 Variable & 5.00 70,015 87,555
2009 Series A 2016 - 2016 3.85 - 4.35 - 7,360
2011 Series AA 2017 - 2029 3.00 - 5.00 9,615 15,275
2011 Series D 2016 - 2016 Variable - 4,055
2012 Series A 2017 - 2038 Variable 53,110 68,655
2013 Series AA 2017 - 2041 2.80 21,485 29,150
2013 Series B 2017 - 2036 Variable 28,645 34,290
2014 Series A 2017 - 2027 1.17 - 3.53 33,240 43,490
2015 Series A 2017 - 2031 1.09 - 4.00 64,675 84,220
2015 Series B 2017 - 2026 1.02 - 3.42 17,285 22,975
Total Single Family Mortgage Bonds 691,080 848,555
Total Single Family Fund 691,080 848,555
Table continued on following page.

Notes to Basic Financial Statements
(tabular dollar amounts are in thousands)
38
Descripton and due date Interest rate (%) 2016 2015
Multi-Family/Business Fund:
Multi-Family/Project Bonds: (* principal and interest payable quarterly on some of the bonds)
2000 Series A 2017 - 2030 Variable 8,225 13,500
2000 Series B* 2017 - 2020 Variable 2,710 3,260
2002 Series A 2016 - 2016 Variable - 2,490
2002 Series C 2017 - 2032 Variable 15,675 61,315
2003 Series A 2017 - 2033 Variable 31,560 31,560
2004 Series A 2017 - 2034 Variable 15,140 38,610
2005 Series A 2017 - 2036 Variable 18,605 26,750
2005 Series B 2017 - 2040 Variable 14,295 17,660
2006 Series A 2017 - 2036 Variable 36,930 36,930
2007 Series B 2017 - 2038 Variable 49,905 56,120
2008 Series A 2017 - 2043 Variable 21,440 24,165
2008 Series B 2017 - 2052 Variable 153,245 155,470
2008 Series C 2017 - 2038 Variable 14,300 14,350
2009 Series A 2017 - 2041 Variable & 4.00 - 5.40 24,945 27,105
2012 Series A 2017 - 2051 2.75 - 4.50 10,190 10,330
2012 Series B 2017 - 2054 2.55 - 4.20 17,025 17,240
2013 Series A 2017 - 2023 Variable 3,670 4,165
2013 Series I 2017 - 2044 3.20 24,262 24,776
2016 Series A 2017 - 2041 0.88 - 4.00 11,725 -
2016 Series I 2017 - 2056 1.05 - 3.45 12,500 -
2016 Series II 2017 - 2056 0.90 - 3.00 18,000 -
2016 Series III 2017 - 2052 2.15 - 3.10 7,500 -
2016 Series IV 2017 - 2056 2.20 - 3.13 12,365 -
2016 Series V 2017 - 2045 3.40 43,951 -
Total Multi-Family/Project Bonds 568,163 565,796
Total Multi-Family/Business Fund 568,163 565,796
Total bonds payable 1,275,776$ 1,434,309$
Premiums and losses classified as bonds payable
Bond premiums (unamortized) 2,297 1,715
Bonds payable 1,278,073$ 1,436,024$
Notes payable 1,069 1,172
Bonds and notes payable 1,279,142$ 1,437,196$
Current:
Bonds payable 46,947$ 84,192$
Notes payable 103 102
Noncurrent:
Bonds and notes payable 1,232,092 1,352,902
Total 1,279,142$ 1,437,196$

Notes to Basic Financial Statements
(tabular dollar amounts are in thousands)
39
A breakdown of bonds payable as of December 31, 2016 and 2015, by fixed and variable interest rates, follows in the table below. Certain of the Authority’s variable rate debt has been hedged by entering into pay fixed/receive variable rate interest rate swap agreements as further described in note 8. Such debt is referred to in the table as synthetic fixed rate debt.
Description 2016 2015
Fixed rate debt 326,652$ 286,679$
Synthetic fixed rate debt 784,889 948,625
Unhedged variable rate debt 164,235 199,005
Total 1,275,776$ 1,434,309$
Also included in the table of bonds and notes payable outstanding are certain Single Family and Multi-Family/Project bonds, which carry the Authority’s general obligation pledge. These general obligation bonds are presented in the following table as of December 31, 2016 and 2015:
Description 2016 2015
General Fund Program Bonds 11,920$ 14,330$
Single Family Mortgage Bonds, Class III 4,585 8,655
Multi-Family/Project Bonds, Class I 164,220 195,165
Multi-Family/Project Bonds, Class II 17,210 17,210
Total 197,935$ 235,360$

Notes to Basic Financial Statements
(tabular dollar amounts are in thousands)
40
Standby Purchase Agreements provide liquidity support on variable rate bonds that are remarketed weekly. The liquidity/commitment fees vary by agreement and are based on a percentage of the outstanding bond balance, payable monthly or quarterly. During 2016 and 2015, the Authority renewed or replaced expiring liquidity facilities of $399.8 million and $482.6 million, respectively. Liquidity fees for the years ended December 31, 2016 and 2015 were $4.0 million and $4.9 million, respectively. A schedule of providers and maturities is presented below, as of December 31, 2016:
Liquidity
Expiration
Bank of
America (1) FHLB (2)
Royal Bank of
Canada (3)
Sumitomo
MBC (4) Grand Total
2018 42,230$ 359,625$ -$ 6,275$ 408,130$
2019 - 94,800 102,970 - 197,770
2020 - 98,950 - - 98,950
2021 - - - 40,920 40,920
Total 42,230$ 553,375$ 102,970$ 47,195$ 745,770$
The following provides the terms of the debt service requirements that would result if the SBPA commitments were to be exercised (bank bond rate, accelerated payment schedule, and lien): (1) (a) Bank Rate: for the first 90 days following the purchase date, the "Base Rate", for any day, a per annum rate to the highest of (a) the Federal Fund
Rate plus 2.00%, (b) the prime rate plus 1.00%, (c) the LIBOR Rate plus 2.00%, and (d) seven and one-half percent (7.50%), then from and after the ninety-first (91st) day, the Base Rate plus 1.00% per annum.
(b) Term out provisions: three hundred sixty-six (366) days following the earlier of (x) the Purchase Date, or (y) the last day of the Purchase Period. Semiannual Principal payment due the date that is the earlier of (x) the five year anniversary of the related Purchase Date, or (y) the five year
anniversary of the last day of the Purchase Period. (2) (a) Bank Rate: One-Month LIBOR plus 2.00%.
(b) Term out provisions: repayments due 366 days following the purchase date in equal semiannual installments until fifth anniversary of the purchase date.
(3) (a) Bank Rate: for the first 90 days following the purchase date, the "Base Rate", which equals the highest of (i) the prime rate plus 2.50%, (ii) the Fed funds rate plus 3.00% and (iii) 8.00%; then for the period 91-180 days following the purchase date, the Base Rate plus 1.00%; then
for the period 181 days and higher following the purchase date, the Base Rate plus 2.00%. (b) Term out provisions: repayments due on the first business day of February, May, August or November on or following 90 days following purchase
date and thereafter quarterly on each such dates in equal installments to the third anniversary of such purchase date. Class I lien. (4) (a) Bank Rate: for the first 60 days following the purchase date, the "Base Rate”, for any day, a per annum rate to the highest of (i) prime rate plus
2.00%, (ii) the Federal Fund Rate plus 3.00%, (iii) the One Month LIBOR Rate plus 3.00%, (iv) the SIFMA Rate plus 3.00%, and (v) six and one-half percent (6.50%), then from and after the ninety-first (91st) day, the Base Rate plus 1.00% per annum.
(b) Term out provisions: repayments due 366 days following the Purchase date in quarterly installments to the fifth anniversary of purchase date.

Notes to Basic Financial Statements
(tabular dollar amounts are in thousands)
41
The following table presents the detail of bonds, notes payable and certain other liabilities that include current and noncurrent activity for the year ended December 31, 2016:
The following table presents the detail of bonds, notes payable and certain other liabilities that include current and noncurrent activity for the year ended December 31, 2015:
Beginning Ending
Description Balance Additions Reductions Balance Current Noncurrent
Bonds payable 1,434,309$ 106,041$ (264,574)$ 1,275,776$ 46,863$ 1,228,913$
Bond premiums - unamortized 1,715 776 (194) 2,297 84 2,213
Total bonds payable 1,436,024 106,817 (264,768) 1,278,073 46,947 1,231,126
Notes payable 1,172 - (103) 1,069 103 966
Arbitrage rebate payable 499 5 (504) - - -
Unearned revenue 2,902 791 (426) 3,267 218 3,049
Other liabilities 4,066 5,076 (509) 8,633 119 8,514
Total other liabilities 7,467 5,872 (1,439) 11,900 337 11,563
Total 1,444,663$ 112,689$ (266,310)$ 1,291,042$ 47,387$ 1,243,655$
Beginning Ending
Description Balance Additions Reductions Balance Current Noncurrent
Bonds payable 1,792,660$ 125,300$ (483,651)$ 1,434,309$ 84,092$ 1,350,217$
Bond premiums - unamortized 638 1,324 (247) 1,715 100 1,615
Total bonds payable 1,793,298 126,624 (483,898) 1,436,024 84,192 1,351,832
Notes payable 1,009 266 (103) 1,172 102 1,070
Arbitrage rebate payable 488 11 - 499 - 499
Unearned revenue 2,557 737 (392) 2,902 193 2,709
Other liabilities 1,858 2,614 (406) 4,066 85 3,981
Total other liabilities 4,903 3,362 (798) 7,467 278 7,189
Total 1,799,210$ 130,252$ (484,799)$ 1,444,663$ 84,572$ 1,360,091$

Notes to Basic Financial Statements
(tabular dollar amounts are in thousands)
42
Bonds and notes payable sinking fund installments and contractual maturities subsequent to December 31, 2016, using rates in effect as of December 31, 2016, are as follows:
Years Ending
December 31, Principal Interest Principal Interest Principal Interest Principal Interest
2017 648$ 742$ 38,500$ 8,935$ 7,715$ 8,090$ 103$ 11$
2018 661 703 39,455 8,463 17,080 8,016 104 10
2019 598 662 41,000 8,005 12,790 7,734 105 9
2020 333 625 42,010 7,503 3,595 7,660 90 8
2021 - 615 43,180 6,951 3,100 7,612 57 7
2022 - 2026 13,867 1,460 154,715 27,039 16,115 37,386 260 25
2027 - 2031 426 62 128,815 15,368 48,185 35,529 130 15
2032 - 2036 - - 157,605 8,404 119,535 32,277 137 8
2037 - 2041 - - 45,800 3,070 80,200 26,332 83 1
2042 - 2046 - - - - 73,954 19,877 - -
2047 - 2051 - - - - 5,960 11,186 - -
2052 - 2056 - - - - 179,934 4,082 - -
Total 16,533$ 4,869$ 691,080$ 93,738$ 568,163$ 205,781$ 1,069$ 94$
General Fund Single Family Multi-Family / Business Notes Payable
(7) Conduit Debt Obligation The Authority has issued certain conduit bonds, the proceeds of which were made available to various developers and corporations for rental housing and commercial purposes. Other conduit proceeds were made available to the State of Colorado for the Colorado Unemployment Insurance Trust Fund. The bonds are payable solely from amounts received by the trustees. The faith and credit of the Authority is not pledged for the payment of the principal or interest on the bonds. Accordingly, these obligations are excluded from the Authority's financial statements. As of December 31, 2016 and 2015, the aggregate principal amount of conduit debt outstanding totaled $942.6 million and $954.1 million, respectively.
(8) Derivative Instruments The Authority reports derivative instruments at fair value. The fair value of all derivatives is reported on the Statement of Net Position as a derivative instrument at the end of the year. If an interest rate hedge is considered ineffective, it is referred to as an investment derivative and the change in fair value is reported on the Statement of Revenues, Expenses and Changes in Net Position as investment derivative activity loss. The annual changes in the fair value of effective hedging derivative instruments are reported as deferred inflows and outflows, as appropriate, on the Statement of Net Position. Swaps Transactions – The Authority has entered into pay fixed, receive variable interest rate swaps in order to (1) provide lower cost fixed rate financing for its production needs through synthetic fixed rate structures and (2) utilize synthetic fixed rate structures with refunding bonds in order to generate cash flow savings. The objective of the swaps is to hedge interest rate risk. The fair values take into consideration the prevailing interest rate environment and the specific terms and conditions of each swap. All fair values were estimated using the zero-coupon discounting method. This method calculates the future payments required by the swap, assuming that the current forward rates implied by the yield curve are the market’s best

Notes to Basic Financial Statements
(tabular dollar amounts are in thousands)
43
estimate of future spot interest rates. These payments are then discounted using the spot rates implied by the current yield curve for hypothetical zero coupon rate bonds due on the date of each future net settlement payment on the swaps. The Authority’s interest rate swaps, which were used to hedge interest rate risk, are generally considered to be hedging derivative instruments under GASB No. 53. However, certain interest rate swaps have been deemed ineffective and are classified as investment derivative instruments. On February 8, April 4, August 19, October 1, and December 12, 2016, the Authority partially redeemed from loan prepayments certain multi-family bonds subject to existing interest rate swap agreements that were considered effective interest rate hedges. As a result of the redemptions, $34.7 million of the existing swaps were reclassified from effective hedges to investment derivative instruments during 2016. On April 1, 2016, the Authority partially or fully redeemed certain multi-family bonds subject to existing interest rate swap agreements that were considered effective interest rate hedges. As a result of the redemptions, $6.0 million of the existing swaps were reclassified from effective hedges to investment derivative instruments during 2016. On May 1 and November 1, 2016, the Authority partially redeemed from loan repayments and prepayments certain single family bonds subject to existing interest rate swap agreements that were considered effective interest rate hedges. As a result of the redemptions, $24.7 million of the existing swaps were reclassified from effective hedges to investment derivative instruments during 2016. On December 14, 2016, the Authority partially or fully redeemed from refunding bond proceeds certain multi-family bonds subject to existing interest rate swap agreements that were considered effective interest rate hedges. As a result of the redemptions, $12.4 million of the existing swaps were reclassified from effective hedges to investment derivative instruments during 2016. On February 5, 2015, the Authority fully redeemed and refunded with fixed rate bonds certain single family bonds subject to existing interest rate swap agreements that were considered effective interest rate hedges. As a result of the redemption and refunding, $113.9 million of the existing swaps were reclassified from effective hedges to investment derivative instruments during 2015. On May 1 and November 1, 2015, the Authority partially redeemed from loan repayments and prepayments certain single family bonds subject to existing interest rate swap agreements that were considered effective interest rate hedges. As a result of the redemptions, $20.2 million of the existing swaps were reclassified from effective hedges to investment derivative instruments during 2015. On February 12, April 6, and September 1, 2015, the Authority partially redeemed from loan prepayments certain multi-family bonds subject to existing interest rate swap agreements that were considered effective interest rate hedges. As a result of the redemptions, $30.9 million of the existing swaps were reclassified from effective hedges to investment derivative instruments during 2015. On January 9, February 20, April 1, and October 1, 2015, the Authority partially or fully redeemed from surplus funds certain multi-family bonds subject to existing interest rate swap agreements that were considered effective interest rate hedges. As a result of the redemptions, $20.0 million of the existing swaps were reclassified from effective hedges to investment derivative instruments during 2015.

Notes to Basic Financial Statements
(tabular dollar amounts are in thousands)
44
A summary of interest rate swaps for the years ended December 31, 2016 and 2015 was as follows:
2016 2015
Summary of Interest Rate Swaps Fair Value Fair Value
Par optional termination right with trigger 15,230$ 24,490$
Par optional termination right 9,518 17,947
T rigger 7,287 9,878
Plain 61,728 68,678
Total fair value 93,763$ 120,993$
Trigger: The variable rate received on these swaps is 68% of the one-month LIBOR, if LIBOR is equal to or greater than 3.5%. The variable rate received on these swaps is SIFMA plus a spread if the one-month LIBOR is less than 3.5%. See further discussion in the basis risk section below. Par Optional Termination Right: Certain swaps contain a cancellation clause that provides the Authority the option to cancel a certain amount of the swaps on certain dates. The Authority may cancel the optional termination amount for no payment (callable at par). The optional termination dates coincide with the debt service dates on the associated hedged bonds payable. These dates and amounts are provided in the table below. Detail of Outstanding Interest Rate Swaps – The key terms, including the fair values and counterparty credit ratings of the outstanding swaps as of December 31, 2016, are shown in the table below. Except as discussed under amortization risk below, the Authority’s swap agreements contain scheduled reductions to outstanding notional amounts that are expected to approximately follow scheduled or anticipated reductions in the associated bonds payable. Based on the standard swap agreement, payments are settled on a net basis. The Authority enters into master netting arrangements with each of its swap counterparties. All of the agreements provide for the netting of the value of assets and liability positions of all transactions with the respective counterparty. There are no other significant transactions with these counterparties outside of these swap agreements, such that the aggregate amount of liabilities included in the master netting arrangements is equal to the net fair value of the swaps.

Notes to Basic Financial Statements
(tabular dollar amounts are in thousands)
45
Outstanding Swaps at December 31, 2016:
Current
Notional Effective Termination
Fixed
Rate Variable Rate Embedded
Optional
Termination
Optional
Termination
Counterparty
Rating 2016 Change in 2015
Swap Series Amount Date Date Paid Received * Options Date, at Par Amount S&P/Moody's Fair Value ** Fair Value Fair Value **
Single Family:
Investment derivatives (includes overhedged portion of interest rate swaps):
2001AA-1 **** 22,500$ 12/1/2009 11/1/2038 4.4850% Trigger, SIFMA + .15% or 68% LIBOR ***
1) 11/1/2017
2) 11/1/2019
Up to:
1) 7,500
2) all remaining A- / A1 (485)$ (617)$ 132$
2002C-3 **** 8,315 12/4/2008 5/1/2022 4.4220% Trigger, SIFMA + .15% or 68% LIBOR A- / A1 425 48 377
2006A-3 10,065 1/18/2006 11/1/2036 4.3129% Trigger, SIFMA + .15% or 68% LIBOR *** 5/1/2019 9,514 A+ / A1 688 183 505
2006B-2 6,770 7/26/2006 11/1/2034 4.1951% Trigger, SIFMA + .05% or 68% LIBOR *** 5/1/2019 4,134 A+ / A1 42 (111) 153
2006B-3 16,745 7/26/2006 11/1/2036 4.5445% Trigger, SIFMA + .15% or 68% LIBOR *** 5/1/2019 15,746 A+ / A1 624 21 603
2006C-2 (C) 5,305 12/20/2006 11/1/2017 4.2884% Trigger, SIFMA + .05% or 68% LIBOR *** A+ / A1 152 152 -
2006C-2 (D) 340 12/20/2006 11/1/2034 4.2884% Trigger, SIFMA + .05% or 68% LIBOR *** 11/1/2019 249 A+ / A1 28 28 -
2007A-2 28,785 5/9/2007 11/1/2037 4.1530% Trigger, SIFMA + .15% or 68% LIBOR *** 5/1/2019 26,597 A+ / A1 1,827 (371) 2,198
2012A-2 (SPV) 825 6/4/2008 5/1/2038 4.4140% 65% LIBOR + .10% *** 5/1/2018 all remaining AA- / Aa2 39 (52) 91
Total 99,650 3,340 (719) 4,059
Hedging derivatives:
2001AA-2 **** 40,920 12/4/2008 5/1/2031 4.6000% Trigger, SIFMA + .05% or 68% LIBOR A- / A1 4,117 (936) 5,053
2001AA-3 6,275 12/2/2008 5/1/2018 5.5260% Trigger, SIFMA + .05% or 68% LIBOR A- / A1 139 (326) 465
2002A-3 **** 8,905 12/4/2008 11/1/2021 4.7490% Trigger, SIFMA + .05% or 68% LIBOR A- / A1 339 (207) 546
2002B-3 **** 23,240 12/4/2008 11/1/2021 4.5060% Trigger, SIFMA + .05% or 68% LIBOR A- / A1 977 (511) 1,488
2002C-3 **** 21,225 12/4/2008 5/1/2022 4.4220% Trigger, SIFMA + .15% or 68% LIBOR A- / A1 1,286 (385) 1,671
2003B-2 9,355 10/29/2008 5/1/2028 4.9380% LIBOR + .05% *** 11/1/2018 8,050 AA- / Aa3 550 (348) 898
2006A-3 29,935 1/18/2006 11/1/2036 4.3129% Trigger, SIFMA + .15% or 68% LIBOR *** 5/1/2019 28,296 A+ / A1 1,849 (1,411) 3,260
2006B-2 20,580 7/26/2006 11/1/2034 4.1951% Trigger, SIFMA + .05% or 68% LIBOR *** 5/1/2019 12,566 A+ / A1 1,208 (1,065) 2,273
2006B-3 46,200 7/26/2006 11/1/2036 4.5445% Trigger, SIFMA + .15% or 68% LIBOR *** 5/1/2019 43,444 A+ / A1 3,728 (2,108) 5,836
2006C-2 (A) - 12/20/2006 5/1/2016 4.2884% Trigger, SIFMA + .05% or 68% LIBOR *** A+ / A1 - (89) 89
2006C-2 (B) - 12/20/2006 11/1/2016 4.2884% Trigger, SIFMA + .05% or 68% LIBOR *** A+ / A1 - 1 (1)
2006C-2 (C) - 12/20/2006 11/1/2017 4.2884% Trigger, SIFMA + .05% or 68% LIBOR *** A+ / A1 - (328) 328
2006C-2 (D) 28,645 12/20/2006 11/1/2034 4.2884% Trigger, SIFMA + .05% or 68% LIBOR *** 11/1/2019 20,961 A+ / A1 (1,460) (713) (747)
2007A-2 39,300 5/9/2007 11/1/2037 4.1530% Trigger, SIFMA + .15% or 68% LIBOR *** 5/1/2019 36,313 A+ / A1 2,126 (1,673) 3,799
2007B-1 25,615 11/1/2007 11/1/2026 5.5800% LIBOR + .05% *** 11/1/2017 23,585 A+ / Aa3 951 (1,165) 2,116
2007B-2 49,325 10/18/2007 5/1/2038 4.5075% Trigger, SIFMA + .15% or 68% LIBOR *** 5/1/2019 46,545 A+ / A1 3,316 (1,626) 4,942
2007B-3 **** 25,000 12/2/2008 5/1/2038 4.4050% Trigger, SIFMA + .15% or 68% LIBOR *** 11/1/2017 all remaining A- / A1 638 (800) 1,438
2008A-1 12,800 6/4/2008 5/1/2038 5.4450% LIBOR + .05% *** 11/1/2018 all remaining A+ / Aa3 879 (1,033) 1,912
2008A-2 37,070 6/4/2008 11/1/2027 4.5960% LIBOR + .05% *** 5/1/2018 33,105 AA- / Aa2 1,527 (1,239) 2,766
2012A-1 **** 13,935 12/2/2008 11/1/2021 4.1600% Trigger, SIFMA + .05% or 68% LIBOR A- / A1 (148) (10) (138)
2012A-2 (SPV) 39,175 6/4/2008 5/1/2038 4.4140% 65% LIBOR + .10% *** 5/1/2018 all remaining AA- / Aa2 197 (33) 230
Total 477,500 22,219 (16,005) 38,224
Total Single Family 577,150 25,559 (16,724) 42,283
Table continued on following page.

Notes to Basic Financial Statements
(tabular dollar amounts are in thousands)
46
Current
Notional Effective Termination
Fixed
Rate Variable Rate Embedded
Optional
Termination
Optional
Termination
Counterparty
Rating 2016 Change in 2015
Swap Series Amount Date Date Paid Received * Options Date, at Par Amount S&P/Moody's Fair Value ** Fair Value Fair Value **
Multi-Family:
Investment derivatives (includes overhedged portion of interest rate swaps):
2002A-1 **** 6,055 11/21/2008 10/1/2022 5.1000% SIFMA + .15% A- / A1 660 (323) 983
2002C-2 **** 45,885 11/21/2008 10/1/2032 5.1240% Trigger, SIFMA + .15% or 68% LIBOR *** 4/1/2018 42,940 A- / A1 2,240 177 2,063
2002C-4 **** 28,635 11/21/2008 10/1/2032 5.0440% Trigger, SIFMA + .05% or 68% LIBOR *** 4/1/2018 26,785 A- / A1 475 (261) 736
2005B-2 (B) 2,700 9/1/2006 10/1/2038 4.5270% SIFMA + .15% *** 10/1/2021 2,311 A+ / A1 337 (126) 463
2007B-2 (A) **** 1,220 12/3/2008 10/1/2036 4.2870% SIFMA + .15% *** 10/1/2017 1,152 A- / A1 30 (49) 79
2007B-2 (C) **** 2,865 12/3/2008 4/1/2038 4.4695% SIFMA + .15% *** 10/1/2017 2,820 A- / A1 75 (12) 87
2007B-2 (D) **** 4,400 12/3/2008 4/1/2028 4.6510% SIFMA + .15% *** 4/1/2023 3,835 A- / A1 699 (219) 918
2007B-3 (A) **** 2,150 12/3/2008 10/1/2037 4.2970% SIFMA + .05% *** 10/1/2017 2,065 A- / A1 12 12 -
2007B-3 (C) **** 2,220 12/3/2008 4/1/2038 4.8805% SIFMA + .05% *** 10/1/2017 2,205 A- / A1 64 64 -
2008A-2 **** 2,530 12/3/2008 4/1/2043 4.4540% SIFMA + .15% *** 4/1/2019 2,373 A- / A1 174 174 -
2008C-3 **** 3,450 12/3/2008 10/1/2038 4.3400% SIFMA + .05% *** 4/1/2019 3,222 A- / A1 228 (150) 378
2009A-1 **** 3,930 6/24/2009 10/1/2041 4.7900% SIFMA + .05% *** 4/1/2024 3,216 A- / A1 736 600 136
2013A **** 2,125 11/21/2008 10/1/2023 6.0350% SIFMA + .05% A- / A1 345 (117) 462
Total 108,165 6,075 (230) 6,305
Hedging derivatives:
2000A-1 **** 8,225 11/21/2008 10/1/2020 5.2350% SIFMA + .05% A- / A1 459 (424) 883
2000B-1 (SPV) - 10/19/2000 7/1/2020 7.3900% Citigroup 3 month + .25% A+ / A3 - (462) 462
2002C-2 **** 17,525 11/21/2008 10/1/2032 5.1240% Trigger, SIFMA + .15% or 68% LIBOR *** 4/1/2018 16,400 A- / A1 (1,614) 429 (2,043)
2002C-4 **** - 11/21/2008 10/1/2032 5.0440% Trigger, SIFMA + .05% or 68% LIBOR *** 4/1/2018 A- / A1 - 658 (658)
2003A **** 11,210 11/21/2008 10/1/2023 6.0350% SIFMA + .05% A- / A1 103 (228) 331
2005B-2 (B) 2,580 9/1/2006 10/1/2038 4.5270% SIFMA + .15% *** 10/1/2021 2,209 A+ / A1 226 (121) 347
2006A-1 **** 13,245 12/3/2008 4/1/2027 5.7100% LIBOR + .05% *** A- / A1 (371) (704) 333
2006A-1 (F) 9,800 12/1/2006 10/1/2036 5.3420% LIBOR + .05% *** 4/1/2021 8,040 A+ / A1 1,243 (404) 1,647
2007B-1 **** 24,505 12/3/2008 4/1/2038 5.6400% LIBOR + .05% ***
1) 10/1/2017
2) 4/1/2022
Up to:
1) 14,220
2) all remaining A- / A1 21 (771) 792
2007B-1 (G) 7,040 10/1/2007 4/1/2028 5.2200% LIBOR + .05% *** 10/1/2022 6,190 A+ / A1 1,003 (282) 1,285
2007B-2 (A) **** 940 12/3/2008 10/1/2036 4.2870% SIFMA + .15% *** 10/1/2017 888 A- / A1 (39) (32) (7)
2007B-2 (B) **** 1,830 12/3/2008 4/1/2038 4.5350% SIFMA + .15% *** 10/2/2017 1,780 A- / A1 (7) (73) 66
2007B-2 (C) **** 1,600 12/3/2008 4/1/2038 4.4695% SIFMA + .15% *** 10/1/2017 1,575 A- / A1 7 (171) 178
2007B-2 (D) **** - 12/3/2008 4/1/2028 4.6510% SIFMA + .15% *** A- / A1 - 110 (110)
2007B-3 (A) **** - 12/3/2008 10/1/2037 4.2970% SIFMA + .05% *** 10/1/2017 A- / A1 - (78) 78
2007B-3 (C) **** - 12/3/2008 4/1/2038 4.8805% SIFMA + .05% *** 10/1/2017 A- / A1 - (141) 141
2008A-1 **** 12,085 12/3/2008 4/1/2029 5.1300% LIBOR + .05% ***
1) 4/1/2018
2) 4/1/2019
Up to:
1) 3,070
2) 7,350 A- / A1 (49) (345) 296
2008A-2 **** 4,230 12/3/2008 4/1/2043 4.4540% SIFMA + .15% *** 4/1/2019 3,967 A- / A1 158 (465) 623
2008B (a) **** 108,495 12/3/2008 10/1/2044 5.1722% LIBOR AA- / Aa3 40,837 (3,893) 44,730
2008B (b) **** 44,750 12/3/2008 3/1/2047 5.2071% LIBOR AA- / Aa3 19,481 (1,485) 20,966
2008C-3 **** 3,510 12/3/2008 10/1/2038 4.3400% SIFMA + .05% *** 4/1/2019 3,278 A- / A1 167 (149) 316
2009A-1 **** 9,650 6/24/2009 10/1/2041 4.7900% SIFMA + .05% *** 4/1/2024 7,899 A- / A1 661 (1,227) 1,888
2013A **** 3,670 11/21/2008 10/1/2023 6.0350% SIFMA + .05% A- / A1 (157) (18) (139)
Total 284,890 62,129 (10,276) 72,405
Total Multi-Family 393,055 68,204 (10,506) 78,710
Total 970,205$ 93,763$ (27,230)$ 120,993$
(*) SIFMA is the Securities Industry Financial Markets Association Municipal Swap Index. LIBOR is the London Interbank Offered Rate. (**) All fair values include the effect of any related embedded option. (***) Par optional termination right. (****) Swaps for which cash premiums were received in the amount of $73.4 million in 2008. The outstanding unamortized balance of the premium is reported on the Statement of Net Position as hybrid instrument borrowings. (SPV) Counterparty operates as a special-purpose vehicle.
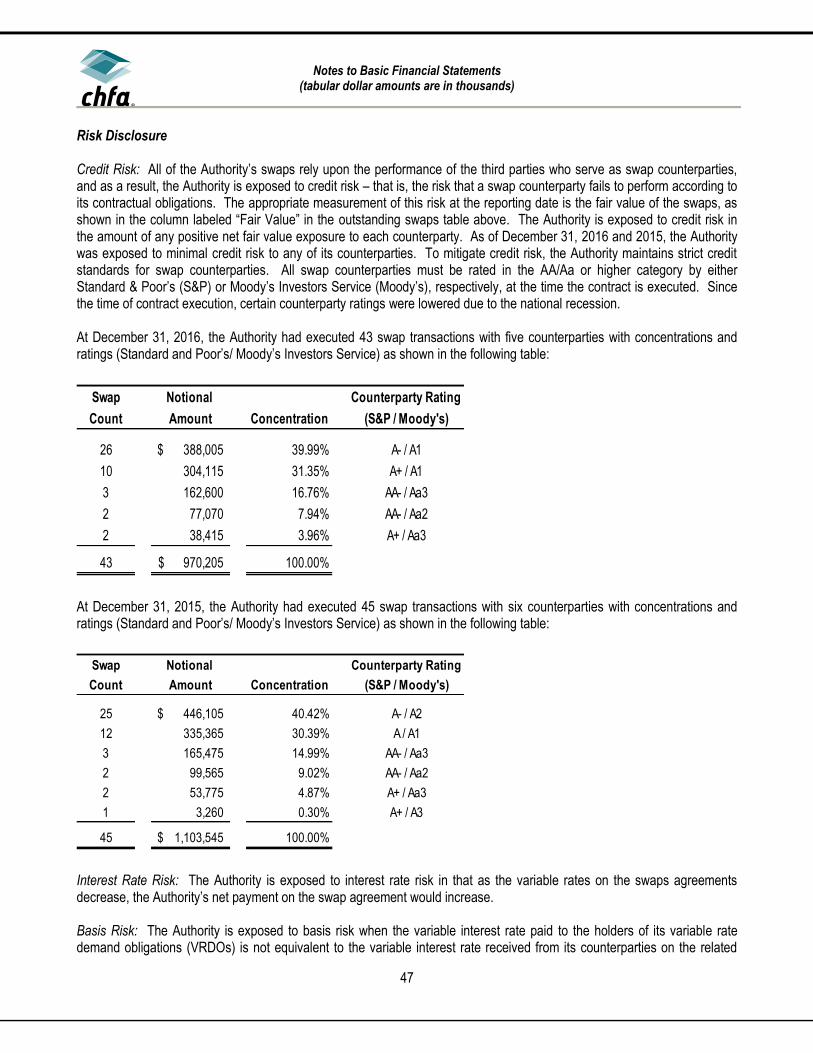
Notes to Basic Financial Statements
(tabular dollar amounts are in thousands)
47
Risk Disclosure Credit Risk: All of the Authority’s swaps rely upon the performance of the third parties who serve as swap counterparties, and as a result, the Authority is exposed to credit risk – that is, the risk that a swap counterparty fails to perform according to its contractual obligations. The appropriate measurement of this risk at the reporting date is the fair value of the swaps, as shown in the column labeled “Fair Value” in the outstanding swaps table above. The Authority is exposed to credit risk in the amount of any positive net fair value exposure to each counterparty. As of December 31, 2016 and 2015, the Authority was exposed to minimal credit risk to any of its counterparties. To mitigate credit risk, the Authority maintains strict credit standards for swap counterparties. All swap counterparties must be rated in the AA/Aa or higher category by either Standard & Poor’s (S&P) or Moody’s Investors Service (Moody’s), respectively, at the time the contract is executed. Since the time of contract execution, certain counterparty ratings were lowered due to the national recession. At December 31, 2016, the Authority had executed 43 swap transactions with five counterparties with concentrations and ratings (Standard and Poor’s/ Moody’s Investors Service) as shown in the following table:
Swap Notional Counterparty Rating
Count Amount Concentration (S&P / Moody's)
26 388,005$ 39.99% A- / A1
10 304,115 31.35% A+ / A1
3 162,600 16.76% AA- / Aa3
2 77,070 7.94% AA- / Aa2
2 38,415 3.96% A+ / Aa3
43 970,205$ 100.00%
At December 31, 2015, the Authority had executed 45 swap transactions with six counterparties with concentrations and ratings (Standard and Poor’s/ Moody’s Investors Service) as shown in the following table:
Interest Rate Risk: The Authority is exposed to interest rate risk in that as the variable rates on the swaps agreements decrease, the Authority’s net payment on the swap agreement would increase. Basis Risk: The Authority is exposed to basis risk when the variable interest rate paid to the holders of its variable rate demand obligations (VRDOs) is not equivalent to the variable interest rate received from its counterparties on the related
Swap Notional Counterparty Rating
Count Amount Concentration (S&P / Moody's)
25 446,105$ 40.42% A- / A2
12 335,365 30.39% A / A1
3 165,475 14.99% AA- / Aa3
2 99,565 9.02% AA- / Aa2
2 53,775 4.87% A+ / Aa3
1 3,260 0.30% A+ / A3
45 1,103,545$ 100.00%

Notes to Basic Financial Statements
(tabular dollar amounts are in thousands)
48
swap agreements. When exposed to basis risk, the net interest expense incurred on the combination of the swap agreement and the associated variable rate debt may be higher or lower than anticipated. The Authority’s tax-exempt variable rate bond interest payments are substantially equivalent to the SIFMA rate (plus a trading spread). Certain tax-exempt swaps, as indicated in the table above, contain a trigger feature in which the Authority receives a rate indexed on SIFMA should LIBOR be less than a predetermined level (the trigger level, 3.5%), or a rate pegged at a percentage of LIBOR should LIBOR be equal to or greater than the predetermined trigger level. For these swaps, the Authority would be negatively exposed to basis risk during the time period it is receiving the rate based on a percentage of LIBOR should the relationship between LIBOR and SIFMA converge. The Authority’s taxable variable rate bond interest payments are substantially equivalent to LIBOR (plus a trading spread) and are reset on a weekly basis. The Authority is receiving one-month LIBOR (plus a trading spread) or LIBOR flat for all of its taxable swaps and therefore is only exposed to basis risk to the extent that the Authority’s bonds diverge from their historic trading relationship with LIBOR. Termination Risk: The Authority’s swap agreements do not contain any out-of-the-ordinary termination events that would expose it to significant termination risk. In keeping with market standards, the Authority or the counterparty may terminate each swap if the other party fails to perform under the terms of the contract. In addition, the swap documents allow either party to terminate in the event of a significant loss of creditworthiness. If at the time of the termination a swap has a negative value, the Authority would be liable to the counterparty for a payment equal to the fair value of such swap. There are certain termination provisions relevant to the Authority’s counterparties operating as special-purpose vehicles (SPV) with a terminating structure. In the case of certain events, including the credit downgrade of the SPV or the failure of the parent company to maintain certain collateral levels, the SPV would be required to wind up its business and terminate all of its outstanding transactions with all clients, including the Authority. All such terminations would be at mid-market pricing. In the event of such termination, the Authority would be exposed to the risk of market re-entry and the cost differential between the mid-market termination and the offered price upon re-entry. Rollover Risk: The Authority is exposed to rollover risk only on swaps that mature or may be terminated at the counterparty’s option prior to the maturity of the associated debt. As of December 31, 2016 and 2015, the Authority was not exposed to rollover risk. Amortization Risk: The Authority is exposed to amortization risk in the event that the swap amortization schedules fail to match the actual amortization of the underlying bonds as a result of loan prepayments, which significantly deviate from expectations. If prepayments are significantly higher than anticipated, the Authority would have the option of reinvesting or recycling the prepayments, or calling unhedged bonds. Alternatively, if the Authority chose to call bonds associated with the swap, the Authority could elect an early termination of the related portions of the swap at a potential cost to the Authority. If prepayments are significantly lower than anticipated and the associated bonds remained outstanding longer than the relevant portion of the swap, the Authority could experience an increase in its exposure to unhedged variable rate bonds. Alternatively, the Authority could choose to enter into a new swap or an extension of the existing swap. If interest rates are higher at the time of entering into a new swap or swap extension, such action would result in an increased cost to the Authority. Collateral Requirements: As of December 31, 2016 and 2015, swaps with a fair value of $81.4 million and $100.7 million, respectively, require the Authority to post collateral in the event that the underlying Class I bond rating drops below Aa3 as issued by Moody’s Investor Service or AA- as issued by Standard & Poor’s. Collateral requirements range up to 100% of the fair value of the swap depending on the bond rating. Over collateralization is required for investments posted in lieu of cash. At December 31, 2016 and 2015, the ratings of bonds subject to collateral requirements exceed the levels specified in the swap agreements.

Notes to Basic Financial Statements
(tabular dollar amounts are in thousands)
49
Swap Payments – Using interest rates as of December 31, 2016, debt service requirements of the Authority’s outstanding variable rate debt and net swap payments were as follows. As rates vary, variable rate interest rate payments on the bonds and net swap payments will change.
Years Ending
December 31, Principal Interest Swaps, Net Total
2017 75,065$ 6,376$ 37,805$ 119,246$
2018 45,465 5,973 34,993 86,431
2019 46,880 5,665 33,163 85,708
2020 48,455 5,354 31,270 85,079
2021 50,325 5,018 29,336 84,679
2022-2026 189,605 20,875 121,711 332,191
2027-2031 206,405 14,079 81,179 301,663
2032-2036 199,200 7,773 42,444 249,417
2037-2041 67,940 2,726 15,097 85,763
2042-2046 32,665 872 4,845 38,382
2047 8,200 27 152 8,379
Total 970,205$ 74,738$ 431,995$ 1,476,938$
Hybrid Instrument Borrowings – Certain interest rate swaps, as identified on the detailed swap table above, include fixed rates that were off-market at the execution of the interest rate swaps. For financial reporting purposes, these interest rate swaps are considered hybrid instruments and are bifurcated between borrowings, with an aggregate original amount of $98.0 million reflecting the fair value of the instrument at its execution, and an interest rate swap with a fixed rate that was considered at-the-market at execution. Activity for the hybrid instrument borrowings for the years ended December 31, 2016 and 2015 was as follows:
2016 2015
Beginning balance 37,599$ 49,399$
Reductions (10,912) (11,800)
Ending balance 26,687$ 37,599$

Notes to Basic Financial Statements
(tabular dollar amounts are in thousands)
50
The following table sets forth as of December 31, 2016, payments of principal and interest on the hybrid instrument borrowings for the next five years and thereafter. The total payments generally reflect the difference between the stated fixed rate of the hybrid instrument and the at-the-market fixed rate at the execution of the instrument.
Years Ending Principal
December 31, and Interest
2017 5,120$
2018 3,750
2019 2,914
2020 2,476
2021 2,016
2022-2026 6,360
2027-2031 3,063
2032-2036 845
2037-2041 129
2042-2046 14
Total 26,687$
Forward Sales Contracts – The Authority has entered into forward sales of mortgage backed securities with the To-Be-Announced market in order to lock in the sales price of certain single family loans to be securitized and later sold. The contracts offset potential changes in interest rates between the time of the loan reservation and the securitization and sale of such loans into Ginnie Mae and Fannie Mae securities. These contracts are considered investment derivative instruments, such that their change in fair value is reported as investment derivative activity gains or losses on the Statement of Revenues, Expenses and Changes in Net Position. The outstanding forward contracts, summarized by counterparty as of December 31, 2016, were as follows:
Count Par Exposure
Original Sales
Price
12/31/16
Premium Fair Value
Counterparty Rating
(S&P / Moody's)
31 72,000$ 18.80% 76,453$ 75,598$ (855)$ A+ / A1
18 46,000 12.00% 48,646 48,130 (516) A- / A1
7 13,000 3.40% 13,612 13,531 (81) AA- / Aa2
10 68,000 17.70% 72,041 71,864 (177) A- / Baa1
18 68,000 17.70% 72,342 72,086 (256) A+ / A3
30 117,000 30.40% 124,316 123,823 (493) AA- / Aa2
114 384,000$ 100.00% 407,410$ 405,032$ (2,378)$

Notes to Basic Financial Statements
(tabular dollar amounts are in thousands)
51
The outstanding forward contracts, summarized by counterparty as of December 31, 2015, were as follows:
Summary A summary of derivative instruments activity for the years ended December 31, 2016 and 2015 is as follows:
2016 2015
Hedging Investments Hedging Investments
Swaps Swaps Forwards Total Swaps Swaps Forwards Total
Fair value, beginning 110,629$ 10,364$ 194$ 121,187$ 121,908$ 9,864$ 445$ 132,217$
Settlements (25,679) (8,084) (194) (33,957) (44,675) (8,152) (445) (53,272)
Change in fair value (1,585) 8,118 (2,378) 4,155 33,396 8,652 194 42,242
Fair value, ending 83,365$ 10,398$ (2,378)$ 91,385$ 110,629$ 10,364$ 194$ 121,187$
(9) Debt Refundings On December 14, 2016, the Authority issued Federally Taxable, Federally Insured Multi-Family Pass-Through, Series 2016-V Bonds in the aggregate principal amount of $44.0 million. The entire proceeds of the bonds were used to defease (refund) portions of the Multi-Family/Project Bonds 2002 Series C-2, 2002 Series C-4, 2004 Series A-1, 2005 Series A-1, 2005 Series A-3 and 2005 Series B-1. The refund resulted in an overall reduction of locked in interest rate spread on variable rate debt. On February 5, 2015, the Authority issued Single Family Mortgage Bonds 2015 Series A in the aggregate principal amount of $99.8 million. The entire proceeds of the bonds were used to refund the Single Family Mortgage Bonds 2003 Series C-1 and C-2, 2004 Series B-2, 2005 Series B1-A and B1-B, Series 2005 B-2, and 2011 Series D-2. The refunding resulted in a decrease in the aggregate future debt service requirement of approximately $10.1 million and an approximate economic gain to the Authority of $8.7 million. In accordance with GASB No. 23, Accounting and Financial Reporting for Refundings of Debt Reported by Proprietary Activities, a gain of $1.2 million was deferred and is being amortized over the contractual life of the new debt as an adjustment to interest expense. On April 29, 2015, the Authority issued Single Family Mortgage Bonds 2015 Series B in the aggregate principal amount of $25.5 million. The entire proceeds of the bonds were used to refund the Single Family Mortgage Bonds 2003 Series B-3. The refunding resulted in a decrease in the aggregate future debt service requirement of approximately $2.5 million and an approximate economic gain to the Authority of $2.4 million. In accordance with GASB No. 23, Accounting and Financial
Count Par Exposure
Original Sales
Price
12/31/14
Premium Fair Value
Counterparty Rating
(S&P / Moody's)
5 28,500$ 17.90% 30,711$ 30,645$ (66)$ A / A1
11 15,000 9.40% 15,848 15,868 20 A- / A2
9 21,500 13.50% 22,910 22,948 38 AA- / Aa2
10 19,500 12.20% 20,603 20,668 65 A+ / A3
31 75,000 47.00% 80,235 80,372 137 AA- / Aa2
66 159,500$ 100.00% 170,307$ 170,501$ 194$

Notes to Basic Financial Statements
(tabular dollar amounts are in thousands)
52
Reporting for Refundings of Debt Reported by Proprietary Activities, a gain of $1.5 million was deferred and is being amortized over the contractual life of the new debt as an adjustment to interest expense. Economic gain or loss is calculated as the difference between the present value of the old debt service requirements, including related fees, and the present value of the new debt service requirements less related upfront costs of issuance, bond call premiums and bond insurance premiums, discounted at the effective interest rate. (10) Fair Value Measurement The Authority categorizes its fair value measurements within the fair value hierarchy established by generally accepted accounting principles. The hierarchy is based on the valuation inputs used to measure the fair value of the assets and liabilities and gives the highest priority to Level 1 measurements and the lowest priority to Level 3 measurements. These measurements are described as follows: Level 1 – Unadjusted quoted prices for identical instruments in active markets. Level 2 – Quoted prices for similar instruments in active markets; quoted prices for identical or similar instruments in markets that are not active; and model-derived valuations in which all significant inputs are observable. Level 3 – Valuations derived from valuation techniques in which significant inputs are unobservable. The Authority has the following recurring fair value measurements as of December 31, 2016:
Quoted
Prices in
Active Significant
Markets for Other Significant
Identical Observable Unobservable
Assets Inputs Inputs
12/31/2016 (Level 1) (Level 2) (Level 3)
Investments by fair value level
Money market mutual funds 96,483$ 96,483$ -$ -$
State & policital subdivision obligations 393 - 393 -
U.S. government agencies 336,358 78,923 257,435 -
U.S. Treasuries 724 555 170 -
Total investments by fair value level 175,960$ 257,998$ -$
Other investments not subject to the leveling hierarchy
Investment agreements - uncollaterlized 72,840
Repurchase agreements 13,045
Overnight deposit 9,000
External investment pools 8,831
Total investments 537,674$
Derivative instuments
Forward sale agreements (2,378)$ -$ (2,378)$ -$
Hedging and investment derivatives 93,763 - 93,763 -
Total derivative instruments 91,385$ -$ 91,385$ -$
Fair Value Measurements Using

Notes to Basic Financial Statements
(tabular dollar amounts are in thousands)
53
Investments and derivative instruments classified as Level 2 are valued using either bid evaluation or a matrix-based pricing technique. Bid evaluations are typically based on market quotations, yields, maturities, call features and ratings. Matrix pricing is used to value securities based on a securities’ relationship to benchmark quoted prices. As of December 31, 2016 the Authority held investments totaling $94.9 million that were not subject to the leveling hierarchy. These investments consisted of private, guaranteed investment contracts categorized as either investment agreements, repurchase agreements or overnight deposits. Additionally, the Authority held investments in an external governmental investment pool totaling $8.8 million which were not subject to the leveling hierarchy. (11) Restricted and Unrestricted Net Position The amounts restricted for the Single Family bond programs and the Multi-Family/Business bond programs are for the payment of principal, redemption premium, if any, and interest, including net swap payments, on all outstanding single family and multi-family/business bond issues, in the event that no other funds are legally available for such payments. Such assets are segregated within the Single Family and Multi-Family/Business bond programs and are held in cash, loans receivable and investments. The Board may authorize the withdrawal of all or part of this restricted balance if (1) updated cash flow projections indicate that adequate resources will exist after any withdrawal to service the outstanding debt, subject to approval by the bond trustee and the rating agency review; (2) the Authority determines that such funds are needed for the implementation or maintenance of any duly adopted program of the Authority; and (3) no default exists in the payment of the principal, redemption premium, if any, or interest on such bonds. The Board has designated certain amounts of the unrestricted net position of the General Programs as of December 31, 2016 and 2015, for various purposes, as indicated in the following table. These designations of net position are not binding, and can be changed by the Board.
Unrestricted Net Position for the years ended December 31, 2016 and 2015:
2016 2015
Designations:
Housing lending program 127,367$ 108,142$
Commerical lending program 7,482 16,584
General operating and working capital reserves 23,624 23,227
Debt reserves 46,534 44,423
Total general programs unrestricted net position 205,007$ 192,376$
(12) Retirement Plans (a) Summary of Significant Accounting Policies Pensions – The Authority participates in the Local Government Division Trust Fund (LGDTF), a cost-sharing multiple-employer defined benefit pension fund administered by the Public Employees’ Retirement Association of Colorado (PERA). The net pension liability, deferred outflows of resources and deferred inflows of resources related to pensions, pension expense, information about the fiduciary net position and additions to/deductions from the fiduciary net position of the LGDTF have been determined using the economic resources measurement focus and the accrual basis of accounting. For

Notes to Basic Financial Statements
(tabular dollar amounts are in thousands)
54
this purpose, benefit payments (including refunds of employee contributions) are recognized when due and payable in accordance with the benefit terms. Investments are reported at fair value. (b) General Information about the Pension Plan Plan description – Eligible employees of the Authority are provided with pensions through the LGDTF. Plan benefits are specified in Title 24, Article 51 of the Colorado Revised Statutes (C.R.S.), administrative rules set forth at 8 C.C.R. 1502-1, and applicable provisions of the federal Internal Revenue Code. Colorado State law provisions may be amended from time to time by the Colorado General Assembly. PERA issues a publicly available comprehensive annual financial report that can be obtained at www.copera.org/investments/pera-financial-reports. Benefits provided – PERA provides retirement, disability and survivor benefits. Retirement benefits are determined by the amount of service credit earned and/or purchased, highest average salary, the benefit structure(s) under which the member retires, the benefit option selected at retirement, and age at retirement. Retirement eligibility is specified in tables set forth at C.R.S. § 24-51-602, 604, 1713, and 1714. The lifetime retirement benefit for all eligible retiring employees under the PERA Benefit Structure is the greater of the:
Highest average salary multiplied by 2.5% and then multiplied by years of service credit
The value of the retiring employee’s member contribution account plus a 100% match on eligible amounts as of the retirement date. This amount is then annuitized into a monthly benefit based on life expectancy and other actuarial factors.
In all cases the service retirement benefit is limited to 100% of highest average salary and also cannot exceed the maximum benefit allowed by federal Internal Revenue Code. Members may elect to withdraw their member contribution accounts upon termination of employment with all PERA employers; waiving rights to any lifetime retirement benefits earned. If eligible, the member may receive a match of either 50% or 100% on eligible amounts depending on when contributions were remitted to PERA, the date employment was terminated, whether five years of service credit has been obtained and the benefit structure under which contributions were made. Benefit recipients who elect to receive a lifetime retirement benefit are generally eligible to receive post-retirement cost-of-living adjustments (COLAs), referred to as annual increases in the C.R.S. Benefit recipients under the PERA benefit structure who began eligible employment before January 1, 2007 receive an annual increase of 2%, unless PERA has a negative investment year, in which case the annual increase for the next three years is the lesser of 2% or the average of the Consumer Price Index for Urban Wage Earners and Clerical Workers (CPI-W) for the prior calendar year. Benefit recipients under the PERA benefit structure who began eligible employment after January 1, 2007 receive an annual increase of the lesser of 2% or the average CPI-W for the prior calendar year, not to exceed 10% of PERA’s Annual Increase Reserve for the LGDTF. Disability benefits are available for eligible employees once they reach five years of earned service credit and are determined to meet the definition of disability. The disability benefit amount is based on the retirement benefit formula shown above considering a minimum of 20 years of service credit, if deemed disabled. Survivor benefits are determined by several factors, which include the amount of earned service credit, highest average salary of the deceased, the benefit structure(s) under which service credit was obtained, and the qualified survivor(s) who will receive the benefits. Contributions – Eligible employees and the Authority are required to contribute to the LGDTF at a rate set by Colorado statute. The contribution requirements are established under C.R.S. § 24-51-401, et seq. Eligible employees are required

Notes to Basic Financial Statements
(tabular dollar amounts are in thousands)
55
to contribute 8% of their PERA-includable salary. The employer contribution requirements are summarized in the table below:
Rate
Employer Contribution Rate 1 10.00%
Amount of Employer Contribution apportioned to the Health Care Trust
Fund as specified in C.R.S. § 24-51-208(1)(f) 1 -1.02%
Amount Apportioned to the LGDTF 1 8.98%
Amortization Equalization Disbursement (AED) as specified in C.R.S. § 24-
51-411 1 2.20%
Supplemental Amortization Equalization Disbursement (SAED) as
specified in C.R.S. § 24-51-411 1 1.50%
Total Employer Contribution Rate to the LGDTF1 12.68%
1Rates are expressed as a percentage of salary as defined in C.R.S. § 24-51-101(42). Employer contributions are recognized by the LGDTF in the period in which the compensation becomes payable to the member and the Authority is statutorily committed to pay the contributions to the LGDTF. Employer contributions recognized by the LGDTF from the Authority were $1.6 million and $1.5 million for the years ended December 31, 2016 and 2015, respectively. (c) Pension Liabilities, Pension Expense, and Deferred Outflows of Resources and Deferred Inflows of Resources Related to Pensions At December 31 2016, the Authority reported a liability of $25.2 million for its proportionate share of the net pension liability. The net pension liability was measured as of December 31, 2015, and the total pension liability used to calculate the net pension liability was determined by an actuarial valuation as of December 31, 2014. Standard update procedures were used to roll forward the total pension liability to December 31, 2015. The Authority’s proportion of the net pension liability was based on the Authority’s contributions to the LGDTF for the calendar year 2015 relative to the total contributions of participating employers to the LGDTF. At December 31, 2015, the Authority’s proportion was 2.3%, which was a decrease of 0.1% from its proportion measured as of December 31, 2014.

Notes to Basic Financial Statements
(tabular dollar amounts are in thousands)
56
For the year ended December 31, 2016, the Authority recognized pension expense of $1.9 million. At December 31, 2016, the Authority reported deferred outflows of resources and deferred inflows of resources related to pensions from the following sources:
Deferred Outflow
of Resources
Deferred Inflow
of Resources
Difference between expected and actual experience 105$ -$
Change of assumptions or other inputs 255
Net difference between projected and actual earnings on
pension plan investments 3,843 -
Changes in proportion and differences between contributions
recognized and proportionate share of contributions 629 41
Contributions subsequent to the measurement date 1,930 n/a
Total 6,507$ 296$
The $1.9 million reported as deferred outflows of resources related to pensions, resulting from contributions subsequent to the measurement date, will be recognized as a reduction of the net pension liability in the year ended December 31, 2017. Other amounts reported as deferred outflows of resources and deferred inflows of resources related to pensions will be recognized in pension expense as follows:
Years Ending
December 31, Pension Expense
2017 1,359$
2018 1,106
2019 1,013
2020 803
2021 -
Thereafter -

Notes to Basic Financial Statements
(tabular dollar amounts are in thousands)
57
Actuarial assumptions – The total pension liability in the December 31, 2014 actuarial valuation was determined using the following actuarial assumptions and other inputs:
Price inflation 2.80%
Real wage growth 1.10%
Wage inflation 3.90%
Salary increases, including wage inflation 3.90% - 10.85%
Long-term investment Rate of Return, net of pension plan
investment expenses, including price inflation 7.50%
Future post-retirement benefit increases: PERA Benefit Structure
hired prior to 1/1/07; and DPS Benefit Structure (automatic) 2.00%
PERA Benefit Structure hired after 12/31/06
(ad hoc, substantively automatic) Financed by the Annual Increase Reserve Mortality rates were based on the RP-2000 Combined Mortality Table for Males or Females, as appropriate, with adjustments for mortality improvements based on a projection of Scale AA to 2020 with Males set back 1 year, and Females set back 2 years. The actuarial assumptions used in the December 31, 2014 valuation were based on the results of an actuarial experience study for the period January 1, 2008 through December 31, 2011, adopted by PERA’s Board on November 13, 2012, and an economic assumption study, adopted by PERA’s Board on November 15, 2013 and January 17, 2014. Changes to assumptions or other inputs since the December 31, 2013 actuarial valuation are as follows:
The following programming changes were made:
Valuation of the full survivor benefit without any reduction for possible remarriage.
Reflection of the employer match on separation benefits for all eligible years.
Reflection of one year of service eligibility for survivor annuity benefit.
Refinement of the 18 month annual increase timing.
Refinements to directly value certain and life, modified cash refund and pop-up benefit forms.
The following methodology changes were made:
Recognition of merit salary increases in the first projection year.
Elimination of the assumption that 35% of future disabled members elect to receive a refund.
Removal of the negative value adjustment for liabilities associated with refunds of future terminating members.
Adjustments to the timing of the normal cost and unfunded actuarial accrued liability payment calculations to reflect contributions throughout the year.
The LGDTF’s long-term expected rate of return on pension plan investments was determined using a log-normal distribution analysis in which best estimate ranges of expected future real rates of return (expected return, net of investment expense and inflation) were developed for each major asset class. These ranges were combined to produce the long-term expected rate of return by weighting the expected future real rates of return by the target asset allocation percentage and then adding expected inflation.
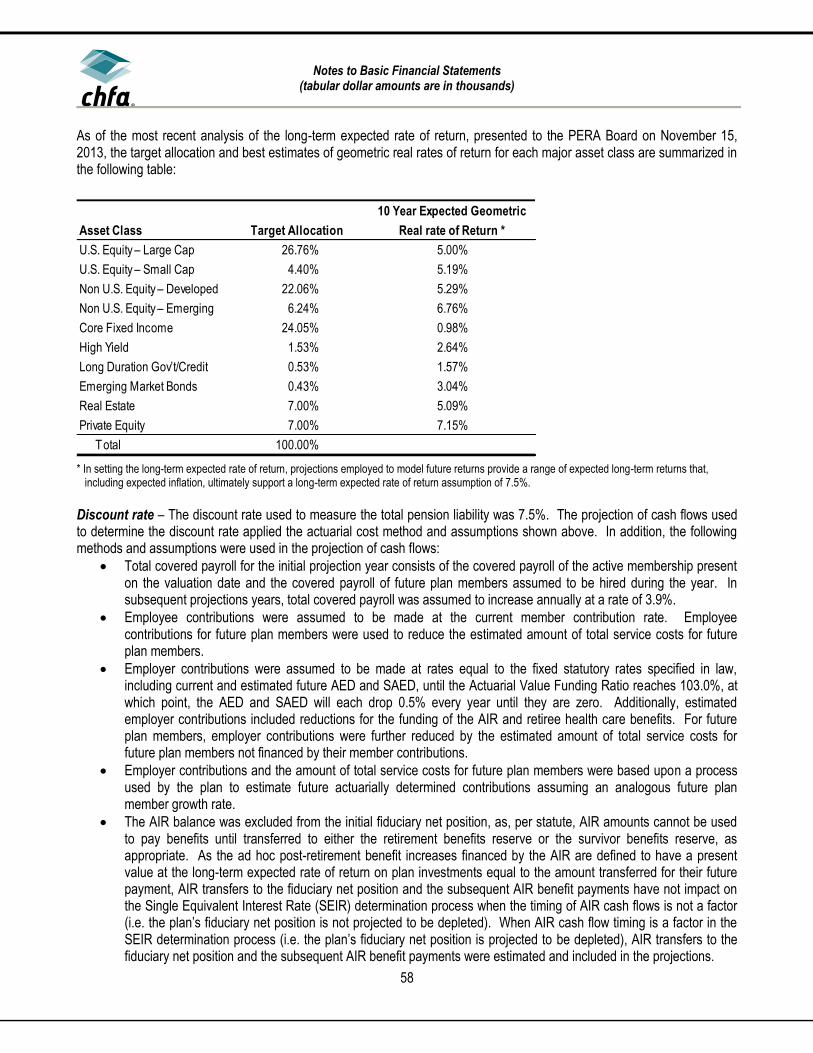
Notes to Basic Financial Statements
(tabular dollar amounts are in thousands)
58
As of the most recent analysis of the long-term expected rate of return, presented to the PERA Board on November 15, 2013, the target allocation and best estimates of geometric real rates of return for each major asset class are summarized in the following table:
10 Year Expected Geometric
Asset Class Target Allocation Real rate of Return *
U.S. Equity – Large Cap 26.76% 5.00%
U.S. Equity – Small Cap 4.40% 5.19%
Non U.S. Equity – Developed 22.06% 5.29%
Non U.S. Equity – Emerging 6.24% 6.76%
Core Fixed Income 24.05% 0.98%
High Yield 1.53% 2.64%
Long Duration Gov’t/Credit 0.53% 1.57%
Emerging Market Bonds 0.43% 3.04%
Real Estate 7.00% 5.09%
Private Equity 7.00% 7.15%
Total 100.00%
* In setting the long-term expected rate of return, projections employed to model future returns provide a range of expected long-term returns that, including expected inflation, ultimately support a long-term expected rate of return assumption of 7.5%.
Discount rate – The discount rate used to measure the total pension liability was 7.5%. The projection of cash flows used to determine the discount rate applied the actuarial cost method and assumptions shown above. In addition, the following methods and assumptions were used in the projection of cash flows:
Total covered payroll for the initial projection year consists of the covered payroll of the active membership present on the valuation date and the covered payroll of future plan members assumed to be hired during the year. In subsequent projections years, total covered payroll was assumed to increase annually at a rate of 3.9%.
Employee contributions were assumed to be made at the current member contribution rate. Employee contributions for future plan members were used to reduce the estimated amount of total service costs for future plan members.
Employer contributions were assumed to be made at rates equal to the fixed statutory rates specified in law, including current and estimated future AED and SAED, until the Actuarial Value Funding Ratio reaches 103.0%, at which point, the AED and SAED will each drop 0.5% every year until they are zero. Additionally, estimated employer contributions included reductions for the funding of the AIR and retiree health care benefits. For future plan members, employer contributions were further reduced by the estimated amount of total service costs for future plan members not financed by their member contributions.
Employer contributions and the amount of total service costs for future plan members were based upon a process used by the plan to estimate future actuarially determined contributions assuming an analogous future plan member growth rate.
The AIR balance was excluded from the initial fiduciary net position, as, per statute, AIR amounts cannot be used to pay benefits until transferred to either the retirement benefits reserve or the survivor benefits reserve, as appropriate. As the ad hoc post-retirement benefit increases financed by the AIR are defined to have a present value at the long-term expected rate of return on plan investments equal to the amount transferred for their future payment, AIR transfers to the fiduciary net position and the subsequent AIR benefit payments have not impact on the Single Equivalent Interest Rate (SEIR) determination process when the timing of AIR cash flows is not a factor (i.e. the plan’s fiduciary net position is not projected to be depleted). When AIR cash flow timing is a factor in the SEIR determination process (i.e. the plan’s fiduciary net position is projected to be depleted), AIR transfers to the fiduciary net position and the subsequent AIR benefit payments were estimated and included in the projections.

Notes to Basic Financial Statements
(tabular dollar amounts are in thousands)
59
Benefit payments and contributions were assumed to be made at the end of the month.
Based on the above actuarial cost method and assumptions, the LGDTF’s fiduciary net position was projected to be available to make all projected future benefit payments of current members. Therefore, the long-term expected rate of return on pension plan investments was applied to all periods of projected benefit payments to determine the total pension liability. The discount rate determination does not use the Municipal Bond Index Rate. There was no change in the discount rate from the prior measurement date. Sensitivity of the Authority’s proportionate share of the net pension liability to changes in the discount rate – The following presents the proportionate share of the net pension liability calculated using the discount rate of 7.5%, as well as what the proportionate share of the net pension liability would be if it were calculated using a discount rate that is 1-percentage-point lower (6.5%) or 1-percentage-point higher (8.5%) than the current rate:
1.0% Decrease Current Discount Rate 1.0% Increase
(6.5%) (7.5%) (8.5%)
Proportionate share of the net pension liability 38,612$ 25,185$ 14,049$ Pension plan fiduciary net position – Detailed information about the LGDTF’s fiduciary net position is available in PERA’s comprehensive annual financial report which can be obtained at www.copera.org/investments/pera-financial-reports. (d) Defined Contribution Retirement Plans PERAPlus 401(k) Plan Plan Description - Employees of the Authority that are also members of the LGDTF may voluntarily contribute to the PERAPlus 401(k) plan, an Internal Revenue Code Section 401(k) defined contribution plan administered by PERA. Title 24, Article 51, Part 14 of the C.R.S., as amended, assigns the authority to establish the Plan provisions to the PERA Board of Trustees. PERA issues a publicly available comprehensive annual financial report for the Program. That report can be obtained at www.copera.org/investments/pera-financial-reports. Funding Policy - The PERAPlus 401(k) plan is funded by voluntary member contributions up to the maximum limits set by the Internal Revenue Service, as established under Title 24, Article 51, Section 1402 of the C.R.S., as amended. In addition, the Authority has agreed to match employee contributions up to 3.5% of covered salary as determined by the Internal Revenue Service. Employees are immediately vested in their own contributions, employer contributions and investment earnings. For the years ended December 31, 2016 and 2015, program members contributed $1.2 million and $1.1 million, respectively, and the Authority recognized expense of $430 thousand and $401 thousand, respectively, related to the PERAPlus 401(k) plan. PERAPlus 457 Plan Plan Description - Employees of the Authority that are also members of the LGDTF may voluntarily contribute to the PERAPlus 457 plan, an Internal Revenue Code Section 457 defined contribution plan administered by PERA. Title 24, Article 51, Part 14 of the C.R.S., as amended, assigns the authority to establish the Plan provisions to the PERA Board of Trustees. PERA issues a publicly available comprehensive annual financial report for the Program. That report can be obtained at www.copera.org/investments/pera-financial-reports. Funding Policy - The PERAPlus 457 plan is funded by voluntary member contributions up to the maximum limits set by the Internal Revenue Service, as established under Title 24, Article 51, Section 1402 of the C.R.S., as amended. The Authority does not match employee contributions. Employees are immediately vested in their own contributions and investment

Notes to Basic Financial Statements
(tabular dollar amounts are in thousands)
60
earnings. For the years ended December 31, 2016 and 2015, program members contributed $76 thousand and $55 thousand, respectively. (e) Other Post-Employment Benefits Health Care Trust Fund Plan Description – The Authority contributes to the Health Care Trust Fund (HCTF), a cost sharing multiple employer healthcare trust administered by PERA. The HCTF benefit provides a health care premium subsidy and health care programs (known as PERACare) to PERA participating benefit recipients and their eligible beneficiaries. Title 24, Article 51, Part 12 of the C.R.S., as amended, establishes the HCTF and sets forth a framework that grants authority to the PERA Board to contract, self-insure and authorize disbursements necessary in order to carry out the purposes of the PERACare program, including the administration of health care subsidies. PERA issues a publicly available comprehensive annual financial report that includes financial statements and required supplementary information for the HCTF. That report can be obtained at www.copera.org/investments/pera-financial-reports. Funding Policy – The Authority is required to contribute at a rate of 1.02% of PERA-includable salary for all PERA members as set by statute. No member contributions are required. The contribution requirements for the Authority are established under Title 24, Article 51, Part 4 of the C.R.S., as amended. The apportionment of the contributions to the HCTF is established under Title 24, Article 51, Section 208(1)(f) of the C.R.S., as amended. For the years ending December 31, 2016 and 2015, the Authority’s contributions to the HCTF were $144 thousand and $132 thousand, respectively, equal to their required contributions for each year. (13) Risk Management The Authority’s Legal and Risk Management function consists of Legal Operations, Internal Audit, Regulatory Compliance and Information Security and Privacy. The Authority embraces the Three Lines of Defense Model to enterprise risk management, in which senior management and the board of directors can look to (a) operating management, (b) the risk and compliance functions and (c) internal audit testing to appropriately manage risk. The Enterprise Risk Management (ERM) program oversight is through the ERM Committee. The Committee consists of General Counsel, Executive Director, Chief Financial Officer, Chief Operating Officer, Director of IT, and the Director of Enterprise Risk. The risk management techniques utilized include annual risk assessments with periodic updates, established policies and procedures, which are tested based on risk, and purchased insurance. Commercial general liability, property losses, automobile liability, worker’s compensation, crime, Executive Risk package with Directors’ and Officer and Employed Lawyers Professional Liability, cyber coverage and public officials liability are all shared risk managed through purchased insurance. Settled claims did not exceed insurance coverage in the past three years. (14) Related-Party Transactions As of the year ended December 31, 2016, the Authority allocated Federal and State Low Income Housing Tax Credits in the amount of $4.6 million to housing projects in which the Fort Collins Housing Authority (FCHA) is the general partner. Federal tax credits are provided annually for each of ten years and State tax credits are provided annually for each of six years. In addition, the Authority has an outstanding loan with the FCHA. As of December 31, 2016 and 2015, the unpaid principal balance on the loan was $4.3 million and $1.0 million, respectively. The Executive Director of the FCHA is a member of the Authority’s Board. As of the year ended December 31, 2016, the Authority allocated Federal Low Income Housing Tax Credits in the amount of $2.3 million to housing projects in which the Grand Junction Housing Authority (GJHA) is the general partner. The allocated tax credits will be provided annually for each of ten years. In addition, the Authority has three outstanding loans with the

Notes to Basic Financial Statements
(tabular dollar amounts are in thousands)
61
GJHA. As of December 31, 2016 and 2015, the unpaid principal balance on the loans totaled $5.1 million and $3.6 million, respectively. The Executive Director of the GJHA is a member of the Authority’s Board. As of the year ended December 31, 2016, the Authority allocated Federal and State Low Income Housing Tax Credits in the amount of $5.1 million to housing projects in which the Housing Authority of the City of Loveland, Colorado (HACL) is the developer or a limited partner. Federal tax credits are provided annually for each of ten years and State tax credits are provided annually for each of six years. In addition, the Authority has four outstanding loans with the HACL. As of December 31, 2016 and 2015, the unpaid principal balance on the loans totaled $5.8 million and $2.5 million, respectively. The Executive Director of the HACL was a member of the Authority’s Board. (15) Commitments and Contingencies The Authority had outstanding commitments to make or acquire single family and multi-family/business loans of $55.3 million and $28.5 million, respectively, as of December 31, 2016. The Authority had outstanding commitments to make or acquire single family and multi-family/business loans of $57.2 million and $71.4 million, respectively, as of December 31, 2015. As of December 31, 2016 and 2015 the Authority also had outstanding commitments to various vendors related to building improvements at the Authority’s headquarters totaling $10.8 million and $0, respectively. There are a limited number of claims or suits pending against the Authority arising in the Authority’s ordinary course of business. In the opinion of the Authority’s management and counsel, any losses that might result from these claims and suits are either covered by insurance or, to the extent not covered by insurance, would not have a material adverse effect on the Authority’s financial position. The Authority participates in the Ginnie Mae Mortgage Backed Securities (MBS) Programs. Through the MBS Programs, Ginnie Mae guarantees securities that are issued by the Authority and backed by pools of mortgage loans. If a borrower fails to make a timely payment on a mortgage loan, the Authority must advance its own funds to ensure that the security holders receive timely payment. All loans pooled under the Ginnie Mae MBS Program are either insured by the FHA or are guaranteed by the VA or RD. The Authority assesses the overall risk of loss on loans that it may be required to repurchase and advances funds to repurchase the loans as necessary. Advances are recovered as claims are processed or loans are modified. The Authority repurchased $35.4 million and $34.6 million of these loans in 2016 and 2015, respectively. Claims, recoveries and proceeds from re-pooled, modified loans substantially reimburse the Authority over time. The Authority also participates in the Whole Loan Sales and Mortgage-Backed Securities (MBS) programs with Fannie Mae. Through the consideration of Whole Loan Sales to Fannie Mae, the Authority receives cash for mortgages. Through the MBS program, the Authority swaps loans for securities issued by Fannie Mae. Whole Loans Sales are serviced by the Authority in an Actual/Actual remittance method and the MBS loans are serviced by the Authority in a Schedule/Schedule remittance method. Under the Schedule/Schedule method if a borrower fails to make a timely payment on a MBS mortgage loan, the Authority must advance its own funds to ensure that the security holders receive timely payment. The Authority assesses the overall risk of loss on loans that it may be required to repurchase and repurchases the loans as necessary. The Authority repurchased $201 thousand and $1.0 million of these loans in 2016 and 2015, respectively. The Authority did not have any repurchase obligations as of December 31, 2016. Beginning 2016, the Authority also participates in the Whole Loan Sales program with Freddie Mac. Through the consideration of Whole Loan Sales to Freddie Mac, the Authority receives cash for mortgages. Whole Loans Sales are serviced by the Authority in a Schedule/Actual remittance method. Under the Schedule/Actual method if a borrower fails to make a timely payment on a mortgage loan, the Authority must advance its own funds to ensure that the interest is current. The Authority assesses the overall risk of loss on loans that it may be required to repurchase and repurchases the loans as necessary. The Authority repurchased $0 of these loans in 2016. The Authority did not have any repurchase obligations as of December 31, 2016.

62
REQUIRED SUPPLEMENTAL INFORMATION

63
Colorado Housing and Finance Authority
Schedule of the Authority's Share of Net Pension Liability
Last 10 Fiscal Years*
(in thousands of dollars)
2014 2015
Proportion of the net pension
liability 2.16% 2.29%
Proportionate share of
net pension liability 19,360$ 25,185$
Covered-employee payroll 11,857$ 12,984$
Proportionate share of the net pension
liability as a percentage of its
covered-employee payroll 163.28% 193.97%
Plan fiduciary net position as a
percentage of the total pension
plan liability 80.72% 76.87%
* This schedule is intended to show information for 10 years. Additional years will be displayed
as they become available.
Colorado Housing and Finance Authority
Schedule of Authority Contributions
Local Government Division Trust Fund
Last 10 Fiscal Years*
(in thousands of dollars)
2014 2015
Contractually required contribution 1,504$ 1,646$
Contributions in relation to the
contractually required contribution 1,504 1,646
Contribution deficiency -$ -$
Covered-employee payroll 11,857$ 12,984$
Contributions as a percentage of
covered-employee payroll 12.68% 12.68%
* This schedule is intended to show information for 10 years. Additional years will be displayed
as they become available.

64
SUPPLEMENTAL INFORMATION

65
Colorado Housing and Finance Authority
Combining Schedule - Statement of Net Position
(with summarized financial information for December 31, 2015)
(in thousands of dollars)
General Single Multi-Family/ Summarized
Programs Family Business Eliminations 2016 2015
Assets
Current assets:
Cash (Note 2)
Restricted 117,993$ -$ -$ -$ 117,993$ 97,753$
Unrestricted 43,088 - - - 43,088 46,735
Investments (Note 2) 17,924 146,519 126,893 - 291,336 317,090
Loans receivable (Note 3) 3,535 13,883 17,615 (389) 34,644 87,617
Loans receivable held for sale (Note 3) 128,425 - - - 128,425 48,762
Accrued interest receivable 3,013 3,584 1,762 (38) 8,321 10,346
Other assets 17,415 30 26 - 17,471 4,979
Due (to) from other programs (31,884) 15,734 16,150 - - -
Total current assets 299,509 179,750 162,446 (427) 641,278 613,282
Noncurrent assets:
Investments (Note 2) 4,583 186,198 55,557 - 246,338 285,312
Loans receivable, net (Note 3) 102,529 402,598 510,843 (11,290) 1,004,680 1,078,058
Capital assets - nondepreciable (Note 4) 2,048 - - - 2,048 1,573
Capital assets - depreciable, net (Note 4) 2,393 - - - 2,393 3,971
Other real estate owned, net 246 653 571 - 1,470 1,988
Other assets 31,055 - - - 31,055 25,142
Total noncurrent assets 142,854 589,449 566,971 (11,290) 1,287,984 1,396,044
Total assets 442,363 769,199 729,417 (11,717) 1,929,262 2,009,326
Deferred outflows of resources
Accumulated increase in fair value of hedging derivatives - 31,139 64,813 - 95,952 120,171
Pension contributions and investment earnings 6,507 - - - 6,507 2,558
Refundings of debt - 3,942 1,799 - 5,741 7,584
Total deferred outflows of resources 6,507 35,081 66,612 - 108,200 130,313
Liabilities
Current liabilities:
Short-term debt (Note 5) 61,005 - - - 61,005 77,505
Bonds payable (Note 6) 648 38,556 7,743 - 46,947 84,192
Notes payable (Note 6) 103 - - - 103 102
Accrued interest payable 87 4,932 5,766 (38) 10,747 12,176
Federally assisted program advances 1,111 - - - 1,111 896
Accounts payable and other liabilities 107,243 301 53,497 - 161,041 82,426
Total current liabilities 170,197 43,789 67,006 (38) 280,954 257,297
Noncurrent liabilities:
Bonds payable (Note 6) 15,885 654,050 561,191 - 1,231,126 1,351,831
Derivative instruments (2,378) 25,559 68,204 - 91,385 121,187
Derivatives related borrowing - 14,705 11,982 - 26,687 37,599
Net pension liability - proportionate share 25,185 - - - 25,185 19,395
Notes payable (Note 6) 12,645 - - (11,679) 966 1,071
Other liabilities (Note 6) 11,563 - - - 11,563 7,189
Total noncurrent liabilities 62,900 694,314 641,377 (11,679) 1,386,912 1,538,272
Total liabilities 233,097 738,103 708,383 (11,717) 1,667,866 1,795,569
Deferred inflows of resources
Accumulated decrease in fair value of hedging derivatives - 1,608 3,222 - 4,830 3,843
Pension investment differences 296 - - - 296 193
Total deferred inflows of resources 296 1,608 3,222 - 5,126 4,036
Net position
Investment in capital assets, net of related debt 4,441 - - - 4,441 5,543
Restricted primarily by bond indentures 6,029 64,569 84,424 - 155,022 142,115
Unrestricted (Note 11) 205,007 - - - 205,007 192,376
Total net position 215,477$ 64,569$ 84,424$ -$ 364,470$ 340,034$
As of December 31, 2016

66
Colorado Housing and Finance Authority
Combining Schedule - Statement of Revenues, Expenses and Changes in Net Position
For the year ended December 31, 2016
(with summarized financial information for the year ended December 31, 2015)
(in thousands of dollars)
General Single Multi-Family/ Summarized
Program Family Business Eliminations 2016 2015
Interest income and expense:
Interest on loans receivable 8,145$ 24,357$ 31,291$ (145)$ 63,648$ 72,283$
Interest on investments 570 10,534 3,368 - 14,472 23,667
Interest on debt (1,395) (31,097) (21,020) 145 (53,367) (72,616)
Net interest income 7,320 3,794 13,639 - 24,753 23,334
Other operating income (loss):
Rental income 17 - - - 17 17
Loan servicing income 19,502 - (29) - 19,473 17,854
Section 8 administration fees - - - - - -
Gain on sale of loans 86,527 - - - 86,527 50,065
Investment derivative activity gain (loss) 2,572 835 (756) - 2,651 1,569
Net decrease in the fair value
of investments (106) (3,901) (1,025) - (5,032) (13,123)
Other revenues 9,927 36 51 - 10,014 8,895
Total other operating income (loss) 118,439 (3,030) (1,759) - 113,650 65,277
Total operating income 125,759 764 11,880 - 138,403 88,611
Operating expenses:
Salaries and related benefits 22,207 - - - 22,207 18,647
General operating 87,095 639 2,572 - 90,306 51,872
Depreciation 932 - - - 932 1,109
Provision for losses 662 (257) (585) - (180) 525
Total operating expenses 110,896 382 1,987 - 113,265 72,153
Net operating income (loss) 14,863 382 9,893 - 25,138 16,458
Nonoperating income and expenses:
Federal grant receipts 129,405 - - - 129,405 120,224
Federal grant payments (129,405) - - - (129,405) (120,224)
Loss on sale of capital assets (702) - - - (702) -
Total nonoperating income and expenses, net (702) - - - (702) -
Income (loss) before transfers 14,161 382 9,893 - 24,436 16,458
Transfers from (to) other programs (2,414) (537) 2,951 - - -
Change in net position 11,747 (155) 12,844 - 24,436 16,458
Net position:
Beginning of year 203,730 64,724 71,580 - 340,034 340,229
Restatement due to GASB 68 - - - - - (16,653)
End of year 215,477$ 64,569$ 84,424$ -$ 364,470$ 340,034$

67
Colorado Housing and Finance Authority
Combining Schedule - Statement of Cash Flows
For the year ended December 31, 2016
(with summarized financial information for the year ended December 31, 2015)
(in thousands of dollars)
General Single Multi-Family/ Summarized
Program Family Business Eliminations 2016 2015
Cash flows from operating activities:
Principal payments received on loans receivable
& receipts from dispositions of other real estate owned $ 782,780 $ 118,011 $ 63,507 $ 10,235 $ 974,533 $ 450,109
Interest payments received on loans receivable 8,087 25,066 31,900 (136) 64,917 74,123
Payments for loans receivable (1,385,114) (313) (19,745) - (1,405,172) (807,829)
Receipts from sales of Ginnie Mae securities 614,840 - - - 614,840 623,901
Receipts from rental operations 17 - - - 17 17
Receipts from other revenues 29,714 38 22 - 29,774 26,724
Payments for salaries and related benefits (15,675) - - - (15,675) (17,177)
Payments for goods and services (91,466) (531) - - (91,997) (52,078)
All other, net 14,990 - - - 14,990 32,020 - - - - -
Net cash provided by (used in) operating activities (41,827) 142,271 75,684 10,099 186,227 329,810
Cash flows from noncapital financing activities:
Net increase (decrease) in short-term debt (16,500) - - - (16,500) 15,700
Proceeds from issuance of bonds - - 106,041 - 106,041 125,300
Proceeds from issuance of notes payable - - - - - 266
Receipts from federal grant programs 129,941 - - - 129,941 119,282
Payments for federal grant programs (129,405) - - - (129,405) (120,224)
Principal paid on bonds (3,425) (157,475) (103,673) - (264,573) (483,652)
Interest rate swap activity, net (3,847) (1,819) (127) - (5,793) (5,754)
Principal paid on notes payable (103) - - - (103) (104)
Interest paid on short-term debt (504) - - - (504) (235)
Interest rate swap settlements - (25,053) (19,621) - (44,674) (60,485)
Interest paid on bonds (830) (10,135) (7,194) - (18,159) (17,757)
Interest paid on notes payable (10) - - - (10) (10)
Transfers to (from) other programs 6,450 1,904 (8,354) - - - - - - - -
Net cash used in noncapital financing activities (18,233) (192,578) (32,928) - (243,739) (427,673)
Cash flows from capital and related financing activities:
Purchase of capital assets (530) - - - (530) (291)
Proceeds from issuance of capital-related debt 11,725 - - (11,725) - -
Principal paid on capital-related debt (1,490) - - 1,490 - -
Interest paid on capital-related debt (136) - - 136 - -
Net cash provided by (used in) capital and related financing activities 9,569 - - (10,099) (530) (291)
Cash flows from investing activities:
Proceeds from maturities and sales of investments 1,115,086 662,532 362,536 - 2,140,154 2,593,526
Purchase of investments (1,048,587) (622,953) (408,922) - (2,080,462) (2,493,489)
Income received from investments 585 10,728 3,630 - 14,943 24,093
Net cash provided by (used in) investing activities 67,084 50,307 (42,756) - 74,635 124,130
Net increase in cash 16,593 - - - 16,593 25,976
Cash at beginning of year 144,488 - - - 144,488 118,512
Cash at end of year $ 161,081 $ - $ - $ - $ 161,081 $ 144,488
Restricted $ 117,993 $ - $ - $ - $ 117,993 $ 97,753
Unrestricted 43,088 - - - 43,088 46,735
Cash, end of year $ 161,081 - $ - $ - $ 161,081 $ 144,488
Continued on the next page.

68
Colorado Housing and Finance Authority
Combining Schedule - Statement of Cash Flows (continued)
For the year ended December 31, 2016
(with summarized financial information for the year ended December 31, 2015)
(in thousands of dollars)
General Single Multi-Family/ Summarized
Program Family Business Eliminations 2016 2015
Reconciliation of operating income to net cash
provided by (used in) operating activities:
Net operating income $ 14,863 $ 382 $ 9,893 $ - $ 25,138 $ 16,458
Adjustments to reconcile operating income (loss) to
net cash provided by (used in) operating activities:
Depreciation expense 932 - - - 932 1,109
Amortization and fair value adjustments of service release premiums 15,657 - - - 15,657 8,212
Proportionate share of net pension expense 1,943 - - - 1,943 377
Amortization of imputed debt associated with swaps - (4,449) (6,463) - (10,912) (7,657)
Provision for losses 662 (257) (585) - (180) 525
Interest on investments (570) (10,534) (3,368) - (14,472) (23,667)
Interest on debt 1,395 35,546 27,483 (145) 64,279 80,273
Unrealized (gain) loss on investment derivatives (2,572) (835) 756 - (2,651) (1,569)
Unrealized loss on investments 106 3,901 1,025 - 5,032 13,123
(Gain) loss on sale of REO 28 (36) (51) - (59) (278)
Gain on sale of loans (86,527) - - - (86,527) (50,065)
Changes in assets and liabilities:
Loans receivable and other real estate owned (5,122) 117,734 (6,477) 10,235 116,370 257,870
Accrued interest receivable on loans and investments (58) 709 609 9 1,269 1,840
Other assets (18,762) 109 33 - (18,620) (3,409)
Accounts payable and other liabilities 36,198 1 52,829 - 89,028 36,668
Net cash provided by (used in) operating activities $ (41,827) $ 142,271 $ 75,684 $ 10,099 $ 186,227 $ 329,810

69
A. Adjusted net worth calculation:
Net position per statement of
net position at end of
reporting period 364,470$
Less:
Itemized unacceptable assets
1. Other assets 48,526$
2.
3.
Total unacceptable assets 48,526
Adjusted net worth 315,944$
B. Required net worth calculation:
Unpaid principal balance of
securities outstanding 1,918,340$
(Note: number of pools: 425)
Plus:
Outstanding balance of
commitment authority issued
and requested 494,099
Total outstanding portfolio
and authority 2,412,439$
Required net worth 10,944$
C. Excess net worth 305,000$
(Adjusted net worth - required net worth)
Capital ratio (Meets requirements? Yes / No) 16.38%
(in thousands of dollars)
Colorado Housing and Finance Authority
Schedule of Adjusted Net Worth
At December 31, 2016

70
Colorado Housing and Finance Authority
Schedule of Other Assets
At December 31, 2016
A. Accrued interest income 8,321$
B. Deferred debt cost of issuance -
C. Other real estate owned 1,470
Total other asset included in adjusted net worth 9,791$
D. Other assets excluded from adjusted net worth 48,526
Total current and noncurrent other assets 58,317$
(in thousands of dollars)

71
Colorado Housing and Finance Authority
Liquid Asset Requirement Calculation for Issuers
At December 31, 2016
(in thousands of dollars)
A. Liquid asset calculation:
Required net worth (Schedule of Adjusted Net Worth, section B) 10,944$
Acceptable liquid assets
1. Unrestricted cash 43,088$
2.
3.
4.
5.
6.
Total liquid assets 43,088$
B. Required liquid asset:
Meets requirements?
Excess liquid 394% Yes / No
(Total liquid assets/required net worth)
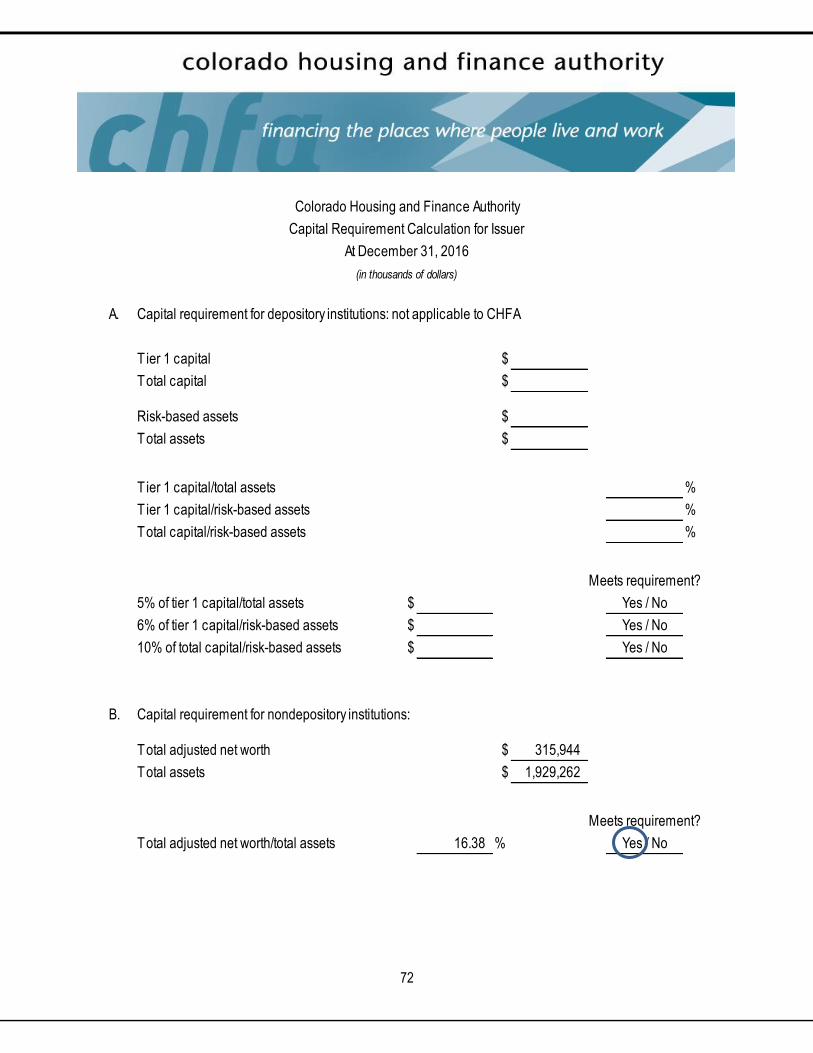
72
Colorado Housing and Finance Authority
Capital Requirement Calculation for Issuer
At December 31, 2016
(in thousands of dollars)
A. Capital requirement for depository institutions: not applicable to CHFA
Tier 1 capital $
Total capital $
Risk-based assets $
Total assets $
T ier 1 capital/total assets %
Tier 1 capital/risk-based assets %
Total capital/risk-based assets %
Meets requirement?
5% of tier 1 capital/total assets $ Yes / No
6% of tier 1 capital/risk-based assets $ Yes / No
10% of total capital/risk-based assets $ Yes / No
B. Capital requirement for nondepository institutions:
Total adjusted net worth $ 315,944
Total assets $ 1,929,262
Meets requirement?
Total adjusted net worth/total assets 16.38 % Yes / No

73
Colorado Housing and Finance Authority
Schedule of Insurance Requirement
At December 31, 2016
A. Identification of affiliated Ginnie Mae Issuers
Affiliated Ginnie Mae issuers: None
B. Required insurance calculation:
Servicing portfolio:
Ginnie Mae 1,918,340$
Fannie Mae 539,041
Freddie Mac 25,732
Conventional (other) 1,167,810
Total servicing portfolio 3,650,923$
Required fidelity bond coverage 4,176$
Required mortgage servicing errors and omissions coverage 4,176$
C. Verification of insurance coverage:
Fidelity bond coverage at end of reporting period 10,000$
Mortgage servicing errors and omissions
coverage at end of reporting period 10,000$
D. Excess insurance coverage:
Fidelity bond coverage 5,824$
Required mortgage servicing errors
and omissions coverage 5,824$
E. Ginnie Mae loss payable endorsement
Fidelity bond coverage Yes / No
Mortgage servicing errors and omissions coverage Yes / No
(in thousands of dollars)
The Authority certifies that it is in good standing with FHA, Fannie Mae and Freddie Mac, and has not been the subject of any adverse actions.

74
HUD REPORTING

Independent Auditor’s Report on Compliance With Requirements That Could Have a Direct and Material Effect on the Major HUD Program
and on Internal Control Over Compliance Based on an Audit in Accordance With the Consolidated Audit Guide for Audits of HUD Programs
To the Board of Directors Colorado Housing and Finance Authority Denver, Colorado
Report on Compliance for the Major HUD Program We have audited Colorado Housing and Finance Authority (the Authority)’s compliance with the compliance requirements described in the Consolidated Audit Guide for Audits of HUD Programs (the Audit Guide) that could have a direct and material effect on the Authority’s major U.S. Department of Housing and Urban Development (HUD) program for the year ended December 31, 2016. The Authority’s major HUD program and the related direct and material compliance requirements are as follows:
Name of Major HUD Program Direct and Material
Compliance Requirements
Government National Mortgage Association issuers of mortgage-back securities
Federal financial reports
Eligibility to issue mortgage-backed securities
Review of custodial documents
Review of monthly accounting reports andquarterly submissions
Securities marketing and trading practices
Adjusted net worth
Capital, liquid asset and insurance requirement
Management’s Responsibility Management is responsible for compliance with the requirements of laws, regulations, contracts and grants applicable to its HUD programs.
Auditor’s Responsibility Our responsibility is to express an opinion on compliance for the Authority’s major HUD program based on our audit of the compliance requirements referred to above. We conducted our audit of compliance in accordance with auditing standards generally accepted in the United States of America; the standards applicable to financial audits contained in Government Auditing Standards, issued by the Comptroller General of the United States; and the Audit Guide. Those standards and the Audit Guide require that we plan and perform the audit to obtain reasonable assurance about whether noncompliance with the compliance requirements referred to above that could have a direct and material effect on a major HUD program occurred. An audit includes examining, on a test basis, evidence about the Authority’s compliance with those requirements and performing such other procedures as we considered necessary in the circumstances.
We believe that our audit provides a reasonable basis for our opinion on compliance for the major HUD program. However, our audit does not provide a legal determination of the Authority’s compliance.
75

Opinion on the Major HUD Program In our opinion, based on our audit, the Authority complied, in all material respects, with the compliance requirements referred to above that could have a direct and material effect on the major HUD program for the year ended December 31, 2016. Report on Internal Control Over Compliance Management of the Authority is responsible for establishing and maintaining effective internal control over compliance with the compliance requirements referred to above. In planning and performing our audit of compliance, we considered the Authority’s internal control over compliance with the requirements that could have a direct and material effect on the major HUD program to determine the auditing procedures that are appropriate in the circumstances for the purpose of expressing an opinion on compliance for the major HUD program and to test and report on internal control over compliance in accordance with the Audit Guide, but not for the purpose of expressing an opinion on the effectiveness of internal control over compliance. Accordingly, we do not express an opinion on the effectiveness of the Authority's internal control over compliance. A deficiency in internal control over compliance exists when the design or operation of a control over compliance does not allow management or employees, in the normal course of performing their assigned functions, to prevent, or detect and correct, noncompliance with a compliance requirement of a HUD program on a timely basis. A material weakness in internal control over compliance is a deficiency, or combination of deficiencies, in internal control over compliance, such that there is a reasonable possibility that material noncompliance with a compliance requirement of a HUD program will not be prevented, or detected and corrected, on a timely basis. A significant deficiency in internal control over compliance is a deficiency, or a combination of deficiencies, in internal control over compliance with a compliance requirement of a HUD program that is less severe than a material weakness in internal control over compliance, yet important enough to merit attention by those charged with governance. Our consideration of internal control over compliance was for the limited purpose described in the first paragraph of this section and was not designed to identify all deficiencies in internal control over compliance that might be material weaknesses or significant deficiencies. We did not identify any deficiencies in internal control over compliance that we consider to be material weaknesses. However, material weaknesses may exist that have not been identified. The purpose of this report on internal control over compliance is solely to describe the scope of our testing of internal control over compliance and the results of that testing based on the requirements of the Audit Guide. Accordingly, this report is not suitable for any other purpose.
Denver, Colorado March 23, 2017
76

Report on Internal Control Over Financial Reporting and on Compliance and Other Matters Based on an Audit of Financial
Statements Performed in Accordance With Government Auditing Standards
Independent Auditor’s Report
The Board of Directors Colorado Housing and Finance Authority Denver, Colorado
We have audited, in accordance with the auditing standards generally accepted in the United States of America and the standards applicable to financial audits contained in Government Auditing Standards, issued by the Comptroller General of the United States, the financial statements of the Colorado Housing and Finance Authority (the Authority) as of and for the year ended December 31, 2016, and the related notes to the financial statements, which collectively comprise the Authority’s basic financial statements, and have issued our report thereon dated March 23, 2017.
Internal Control Over Financial Reporting In planning and performing our audit of the financial statements, we considered the Authority’s internal control over financial reporting (internal control) to determine the audit procedures that are appropriate in the circumstances for the purpose of expressing our opinion on the financial statements, but not for the purpose of expressing an opinion on the effectiveness of the Authority’s internal control. Accordingly, we do not express an opinion on the effectiveness of the Authority’s internal control.
A deficiency in internal control exists when the design or operation of a control does not allow management or employees, in the normal course of performing their assigned functions, to prevent, or detect and correct, misstatements on a timely basis. A material weakness is a deficiency, or a combination of deficiencies, in internal control, such that there is a reasonable possibility that a material misstatement of the entity’s financial statements will not be prevented, or detected and corrected, on a timely basis. A significant deficiency is a deficiency, or a combination of deficiencies, in internal control that is less severe than a material weakness, yet important enough to merit attention by those charged with governance.
Our consideration of internal control was for the limited purpose described in the first paragraph of this section and was not designed to identify all deficiencies in internal control that might be material weaknesses or significant deficiencies. Given these limitations, during our audit we did not identify any deficiencies in internal control that we consider to be material weaknesses. However, material weaknesses may exist that have not been identified.
77

Compliance and Other Matters As part of obtaining reasonable assurance about whether the Authority’s financial statements are free from material misstatement, we performed tests of its compliance with certain provisions of laws, regulations, contracts and grant agreements, noncompliance with which could have a direct and material effect on the determination of financial statement amounts. However, providing an opinion on compliance with those provisions was not an objective of our audit, and accordingly, we do not express such an opinion. The results of our tests disclosed no instances of noncompliance or other matters that are required to be reported under Government Auditing Standards. Purpose of This Report The purpose of this report is solely to describe the scope of our testing of internal control and compliance and the results of that testing, and not to provide an opinion on the effectiveness of the entity’s internal control or on compliance. This report is an integral part of an audit performed in accordance with Government Auditing Standards in considering the Authority’s internal control and compliance. Accordingly, this communication is not suitable for any other purpose.
Denver, Colorado March 23, 2017
78


![[XLS] · Web viewMississippi Regional Housing Authority No. IV MS030 Mississippi Regional Housing Authority No. V MS040 Mississippi Regional Housing Authority No. VIII MS047 The Housing](https://static.fdocuments.us/doc/165x107/5ab7689f7f8b9ad3038b901d/xls-viewmississippi-regional-housing-authority-no-iv-ms030-mississippi-regional.jpg)