Color Image Segmentation Using CIELab Color Space Using ... · Color Image Segmentation Using...
6
Color Image Segmentation Using CIELab Color Space Using Ant Colony Optimization Seema Bansal #1 , Deepak Aggarwal *2 # CSE Dept. (SUSWEC, Tangori, Punjab ) * CSE Dept. (BBSBEC, Fatehgarh Sahib, Punjab) Abstract— This paper proposes an approach for the segmentation of color images using CIELab color space and Ant based clustering. Image segmentation is the process of assigning a label to every pixel in an image such that pixels with the same label share certain visual characteristics. The objective of segmentation is to change the image into meaningful form that is easier to analyze. This paper elaborates the ant based clustering for image segmentation. CMC distance is used to calculate the distance between pixels as this color metric gives good results with CIELab color space. Results show the segmentation using ant based clustering and also verifies that number of clusters for the image with the CMC distance also varies. Clustering quality is evaluated using MSE measure. Keywords— Ant Clust, CMC distance, CIELab color space, segmentation. 1. INTRODUCTION Image Segmentation is the process of partitioning an image into non-intersecting regions such that each region is homogeneous and the union of two adjacent regions is heterogeneous. The objective of segmentation [9] is to simplify and/or change the representation of an image into something that is more meaningful and easier to analyze. Image segmentation is typically used to locate objects and boundaries in images. More precisely, image segmentation is the process of assigning a label to every pixel in an image such that pixels with the same label share certain visual characteristics. The result of image segmentation is a set of segments that collectively cover the entire image, or a set of contour extracted from the image Each of the pixels in a segment are similar with respect to some characteristic or computed property, such as intensity, color or texture. Image Segmentation based on Clustering can be supervised clustering which demands human interaction to decide the clustering criteria and the unsupervised clustering which decides the clustering criteria by itself. For intensity images, four popular segmentation approaches are: threshold techniques, edge based methods, region-based techniques, and connectivity-preserving relaxation methods. 1.1 Various color Models Color models provide a standard way to specify a particular color, by defining a 3D coordinate system, and a subspace that contains all constructible colors within a particular model[4]. Any color that can be specified using a model will correspond to a single point within the subspace it defines. When this model is associated with a precise description of how the components are to be interpreted, the resulting set of colors is called color space. There are several models used to describe the color scheme: RGB, CMY, YIQ, and HSI. Each model was derived for specific purposes and has certain advantages over the others. Converting between the different models is generally done by a relatively simple mapping. Lab color Model A Lab color space is a color opponent space with dimension L for lightness and a and b for the color-opponent dimensions. Lab color is designed to approximate human vision. It aspires to perceptual uniformity, and its L component closely matches human perception of lightness. It can thus be used to make accurate color balance corrections by modifying output curves in the a and b components, or to adjust the lightness contrast using the L component. The three coordinates of CIELAB represent the lightness of the color (L* = 0 yields black and L* = 100 indicates diffuse white), its position between red/magenta and green (a*, negative values indicate green while positive values indicate magenta) and its position between yellow and blue (b*, negative values indicate blue and positive values indicate yellow). The asterisk (*) after L, a and b are part of the full name. 1.2 Ant Based Clustering: Ant-based clustering algorithms are based upon the brood sorting behavior of ants. The general idea of ant based clustering was introduced by Deneubourg et al., and applied for tasks in robotics. To extend the task to numerical data analysis, this basic work has been modified by Lumer and Faita [12]. In this algorithm, the data is randomly dispersed onto a two dimensional grid. Each ant moves randomly around this grid picking and dropping the data items [12]. The decision to pick up or drop an item is not specific but is influenced by the data items in the ant’s immediate neighborhood. Picking and dropping of the data items causes similar items to be more likely placed together on the grid. The probability of dropping an object increases with high densities of similar objects in the neighborhood. In contrast, the probability of picking an object increases with low- density neighborhoods and decreases with high similarity among objects in the surrounding area. The probability of picking and dropping are given by: Picking up probability: =൬ ଵ ଵ + ൰ ଶ Dropping Probability ௗ =൬ ଶ + ൰ ଶ Seema Bansal et al IJCSET |August 2011 | Vol 1, Issue 7, 415-420 415
Transcript of Color Image Segmentation Using CIELab Color Space Using ... · Color Image Segmentation Using...

Color Image Segmentation Using CIELab Color Space Using Ant Colony Optimization
Seema Bansal#1, Deepak Aggarwal*2
#CSE Dept. (SUSWEC, Tangori, Punjab ) *CSE Dept. (BBSBEC, Fatehgarh Sahib, Punjab)
Abstract— This paper proposes an approach for the segmentation of color images using CIELab color space and Ant based clustering. Image segmentation is the process of assigning a label to every pixel in an image such that pixels with the same label share certain visual characteristics. The objective of segmentation is to change the image into meaningful form that is easier to analyze. This paper elaborates the ant based clustering for image segmentation. CMC distance is used to calculate the distance between pixels as this color metric gives good results with CIELab color space. Results show the segmentation using ant based clustering and also verifies that number of clusters for the image with the CMC distance also varies. Clustering quality is evaluated using MSE measure.
Keywords— Ant Clust, CMC distance, CIELab color space, segmentation.
1. INTRODUCTION
Image Segmentation is the process of partitioning an image into non-intersecting regions such that each region is homogeneous and the union of two adjacent regions is heterogeneous. The objective of segmentation [9] is to simplify and/or change the representation of an image into something that is more meaningful and easier to analyze. Image segmentation is typically used to locate objects and boundaries in images. More precisely, image segmentation is the process of assigning a label to every pixel in an image such that pixels with the same label share certain visual characteristics. The result of image segmentation is a set of segments that collectively cover the entire image, or a set of contour extracted from the image Each of the pixels in a segment are similar with respect to some characteristic or computed property, such as intensity, color or texture. Image Segmentation based on Clustering can be supervised clustering which demands human interaction to decide the clustering criteria and the unsupervised clustering which decides the clustering criteria by itself. For intensity images, four popular segmentation approaches are: threshold techniques, edge based methods, region-based techniques, and connectivity-preserving relaxation methods. 1.1 Various color Models Color models provide a standard way to specify a particular color, by defining a 3D coordinate system, and a subspace that contains all constructible colors within a particular model[4]. Any color that can be specified using a model will correspond to a single point within the subspace it defines. When this model is associated with a precise description of how the components are to be interpreted, the resulting set of colors is called color space. There are several models used to describe the color scheme: RGB, CMY, YIQ, and HSI. Each
model was derived for specific purposes and has certain advantages over the others. Converting between the different models is generally done by a relatively simple mapping. Lab color Model A Lab color space is a color opponent space with dimension L for lightness and a and b for the color-opponent dimensions. Lab color is designed to approximate human vision. It aspires to perceptual uniformity, and its L component closely matches human perception of lightness. It can thus be used to make accurate color balance corrections by modifying output curves in the a and b components, or to adjust the lightness contrast using the L component. The three coordinates of CIELAB represent the lightness of the color (L* = 0 yields black and L* = 100 indicates diffuse white), its position between red/magenta and green (a*, negative values indicate green while positive values indicate magenta) and its position between yellow and blue (b*, negative values indicate blue and positive values indicate yellow). The asterisk (*) after L, a and b are part of the full name. 1.2 Ant Based Clustering: Ant-based clustering algorithms are based upon the brood sorting behavior of ants. The general idea of ant based clustering was introduced by Deneubourg et al., and applied for tasks in robotics. To extend the task to numerical data analysis, this basic work has been modified by Lumer and Faita [12]. In this algorithm, the data is randomly dispersed onto a two dimensional grid. Each ant moves randomly around this grid picking and dropping the data items [12]. The decision to pick up or drop an item is not specific but is influenced by the data items in the ant’s immediate neighborhood. Picking and dropping of the data items causes similar items to be more likely placed together on the grid. The probability of dropping an object increases with high densities of similar objects in the neighborhood. In contrast, the probability of picking an object increases with low-density neighborhoods and decreases with high similarity among objects in the surrounding area. The probability of picking and dropping are given by: Picking up probability: = +
Dropping Probability = +
Seema Bansal et al IJCSET |August 2011 | Vol 1, Issue 7, 415-420
415

f = f (oi) is a similarity or relevance measure of the item oi in its neighborhood, while k1 and k2 are threshold constants (picking-up threshold and dropping threshold, respectively). Short-term memory notion is introduced with each agent by Lumer and Faieta. Each ant remembers a small number of locations where it has successfully dropped an item. And so, when picking a new item this memory is consulted in order to bias the direction in which the ant will move. Thus, the ant tends to move towards the location it last dropped a similar item. Some of the distinctive features of the Ant based clustering are: Solutions of the ant based algorithms constructed within a stochastic iterative process, by adding solution components to partial solutions. Ant based algorithms can adopt continuously even if the graph dynamically changes and this is a very useful case for the network routing. ACO also clearly differs from BBO, because ACO generates a new set of solutions with each iteration and on the other side, BBO maintains its set of solutions from one iteration to the next, relying on migration to probabilistically adapt those solutions. BBO has the most in common with strategy such as PSO.
2. LITERATURE SURVEY Various techniques available in literature for image segmentation[9] are: gray level thresholding, MRF based approaches, Neural network based approaches, surface based segmentation, Segmentation of color images, segmentation based on edge detection, Methods based on fuzzy set theory. Image pre-processing using image mask is proposed that shortened processing time more than three times[11]. Contrast information [6] of a color image is used to detect edges instead of commonly used derivative info. And this new algorithm provides reasonable and reliable results for color image segmentation. Space contraction transformations are introduces into standard Ant Colony System algorithm [7] to increase the speed and to improve the search ability of algorithm. Performance of techniques[4]: Taylor expansion, Iterative procedures and look up table are investigated in terms of speed and accuracy for approximating the nonlinear function in transformation from RGB to CIELab color space. Paper concludes that for real time inspection of color, look up table approach is best. Image segmentation is performed on the basis of color features [1] with K-means clustering unsupervised algorithm. No training data is used. The results shows that proposed scheme reduces the computational cost and gives a high discriminative power of regions present in the image. [5] Reviews a segmentation method based on CIELAB color space model and also compares various edge detection methods. The results show that algorithm based on CIELab is appropriate for the color images with various types of noises and from various edge detection methods canny method is most powerful. Clustering with swarm-based algorithms has recently been shown to produce good results in a wide variety of real-world applications [10]. ACO algorithm for the segmentation of brain MR images can effectively segments the fine details [8]. By taking advantage
of the improvements introduced in ant colony system, edge detection techniques on the basis of ACO was able to successfully extract edges from a digital image[2]. Standard ant based clustering technique is modified in [12]. The algorithm does not require any knowledge of the number of clusters and initial partition during clustering and was able to extract the number of clusters with good quality From the literature survey, we concluded to work on ant clustering technique using CIELab color space as CIELab color space closely matches with the human perception and gives best results.
3. PROPOSED ALGORITHM Image segmentation is an important part of a digital image processing. Since now, many image segmentation techniques have been used like clustering techniques where cluster correspond to a image region with the similar characteristics. Here we use ant based clustering technique with CIELab color model for image segmentation. ACO is a meta-heuristic where primary goal of the ants is the survival of whole colony. Only the bigger community can cooperate effectively. In antclust algorithms, ants move on the 2D board. The size of the grid should be selected in dependence of the data which will consume large amount of computational time. Size of the board is not determined automatically. So, we replace the rectangular grid by an array of N cells, N is the number of pixels in the image to be clustered. All cells of the array are connected to each other to let the ants travel. During the algorithm, clusters of pixels are created or destroyed. A cluster is a group of 2 or more pixels with the similar characteristics. Initially, pixels to be clustered are placed on the array such that each array cell can only be occupied by one pixel. This domain is considered as the cluster space for ant based clustering. With this cluster space, a single agent is placed on a random data item. Then it searches for the neighbor which is uncovered. After finding the uncovered data item, algorithm checks for the similarity. If data item is found with the similar characteristics, then algorithm marks that data item as covered .Once a run is over for an agent, the cluster space is checked for uncovered data items. If we could find any uncover data item then the next ant is introduced ant finds its cluster as similar procedure. This entire procedure is repeated till there is no uncovered data item. Similarity between the pixels is determined using CMC distance. For two colors of respective CIELab components (L1, a1, b1) and (L2, a2, b2), CMC metrics define three components for the distance measure as follows: Chroma difference: ∆C = a1 + b1 − a2 + b2 Lighting difference: ΔL = L1 − L2 Hue perceptual difference: ΔH = √∆a + ∆b − ∆C With the global distance given by: ΔE = ∆HSh + ∆Ll. Sl − ∆Cc. Sc l and c are application dependent coefficients.
Seema Bansal et al IJCSET |August 2011 | Vol 1, Issue 7, 415-420
416

The overall procedure of the proposed algorithm can be described as follows:
1. Take an image and convert it to a Lab image. 2. For each pixel do
Place the pixel in a cell of the array End for
3. Initialize the cluster for the entire data item with 0 and availability with 1.
4. Initialize the cluster index with 1. Do Introduce an ant Initialize the ant by choosing a data item randomly and place the ant. Check for the availability of data item Assign the current cluster index for each data item do If the data item is not covered, calculate similarity measure M Select threshold measure of similarity R If M<R
Add the data item with the current cluster and assign the current cluster index
Move to the next neighbor. End if End if
End-for 5. If any items in the cluster-space is available ( not
covered) Increase the cluster index by 1.
Repeat with the next ant Else
break End if Repeat: step 4.
4. EXPERIMENTAL RESULTS
Experiments are conducted to evaluate the performance of the proposed approach using three test images with different format, onion, lena and lion which are shown in Figure1.
(a) (b) (c)
Fig 1. Test images used in this paper (a) Onion.png (128 × 128); (b) Lena.tiff (128×128); (c) Lion.jpg(128×128) The proposed algorithm automatically calculates the number of clusters on the basis of similarity measure i.e. CMC distance. CMC distance and calculated number of clusters depends on the number of colors present in the image. As the number of colors present in the image increases, CMC distance varies inversely with number of clusters. With the decrease in the CMC distance, number of clusters increases
and with the increase in the CMC distance, number of clusters decreases automatically. The proposed algorithm offers flexibility in calculating the number of clusters with the CMC distance over number of runs because each time it runs, ants are initialized with the different positions, which affect the number of clusters calculation. In order to evaluate the clustering. MSE is taken as a measure and Euclidean distance measure is used to calculate distance between pixels in the cluster.
Fig 2. Original Onion image with CMC distance 16.7 and 10 no. of
clusters
Fig 3. Original Onion image with CMC distance 17 and 9 no. of
clusters
Fig 4. Original Onion image with CMC distance 18.5 and 8 no. of
clusters
Seema Bansal et al IJCSET |August 2011 | Vol 1, Issue 7, 415-420
417
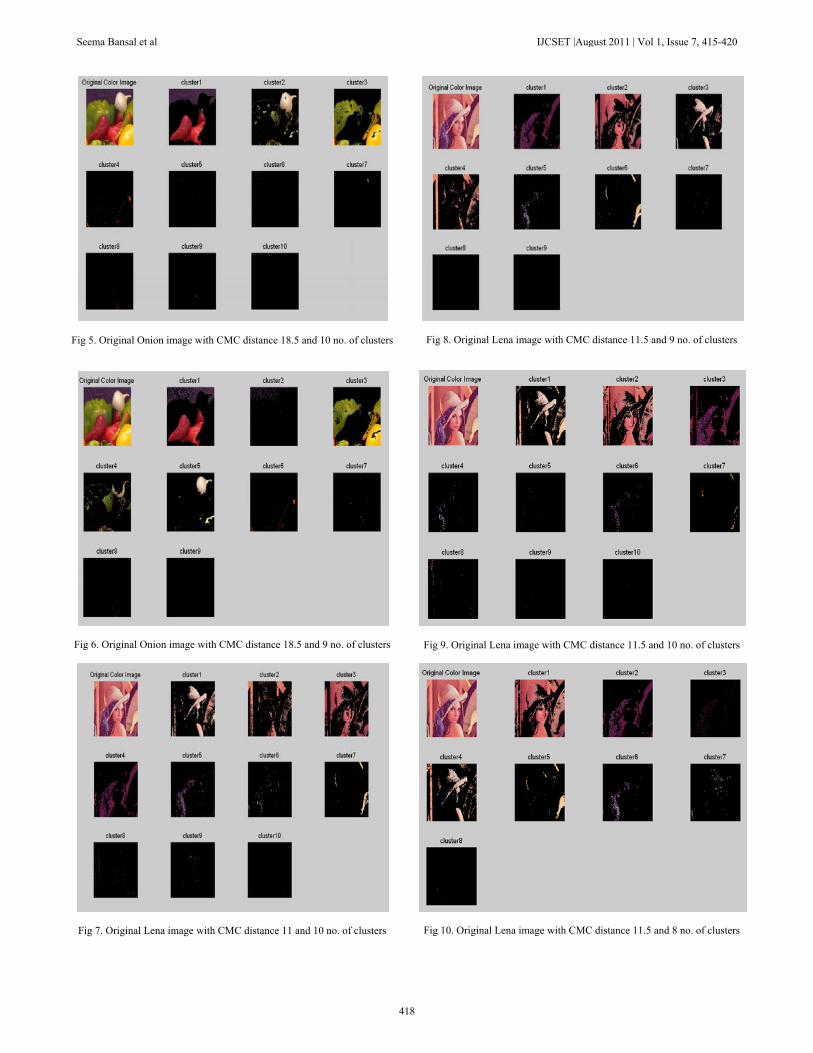
Fig 5. Original Onion image with CMC distance 18.5 and 10 no. of clusters
Fig 6. Original Onion image with CMC distance 18.5 and 9 no. of clusters
Fig 7. Original Lena image with CMC distance 11 and 10 no. of clusters
Fig 8. Original Lena image with CMC distance 11.5 and 9 no. of clusters
Fig 9. Original Lena image with CMC distance 11.5 and 10 no. of clusters
Fig 10. Original Lena image with CMC distance 11.5 and 8 no. of clusters
Seema Bansal et al IJCSET |August 2011 | Vol 1, Issue 7, 415-420
418

Fig 11. Original Lena image with CMC distance 11.7 and 8 no. of clusters
Fig 12. Original Lion image with CMC distance 9 and 10 no. of clusters
Fig 13. Original Lion image with CMC distance 9.3 and 9 no. of clusters
Fig 14. Original Lion image with CMC distance 9.4 and 8 no. of clusters
Fig 15. Original Lion image with CMC distance 9.4 and 7 no. of clusters
Fig 16. Original Lion image with CMC distance 9.4 and 10 no. of clusters
Seema Bansal et al IJCSET |August 2011 | Vol 1, Issue 7, 415-420
419

TABLE 4. 1. COMPUTATIONAL RESULTS
TABLE 4.2. RESULTS SHOWS THE VARIATION OF NUMBER OF CLUSTERS WITH PARTICULAR CMC DISTANCE
From the Table 4.1, it can be observed that number of clusters of the image depends on CMC distance selected. The selected CMC distance in turn depends on the number of colors of the image. Numbers of ants for the purpose are chosen by the algorithm automatically. Number of clusters for the particular CMC value also varies because the ants are initialized randomly, first time any pixel can be selected which in turn will affect the number of clusters for the image as shown in Table 4.2. From the observation in Table4.1, we come to know that for the onion image where CMC distance is near 16.7, Euclidean distance for the pixels in the cluster are near 2.7. It shows how accurate CMC measure is for the Lab color model.
5. CONCLUSIONS In this paper, an ant based clustering technique using CIELab color space has been successfully developed and tested. Experimental results show the feasibility of the approach in segmentation. With suitable values, the proposed algorithm was able to successfully segment the test images. It should be noted the appropriate parameter values depends on the image i.e. number of color in the image. The proposed algorithm also proves the flexibility of the ant clustering approach as the proposed algorithm automatically calculates the number of ants required for the clustering. In order to verify results MSE is taken as a measure.
REFERENCES [1] Anil Z Chitade et. al., “COLOUR BASED IMAGE SEGMENTATION
USING K-MEANS CLUSTERING”, International Journal of Engineering Science and Technology Vol. 2(10), 2010, 5319-5325.
[2] Anna Veronica Baterina et al., “Image Edge Detection Using Ant Colony Optimization”, INTERNATIONAL JOURNAL OF CIRCUITS, SYSTEMS AND SIGNAL PROCESSING, Issue 2, Volume 4, 2010.
[3] C. Immaculate Mary et al., “A Modified Ant-based Clustering for Medical Data”, (IJCSE) International Journal on Computer Science and Engineering Vol. 02, No. 07, 2010, 2253-2257.
[4] Christine Connolly et al, “A Study of Efficiency and Accuracy in the Transformation from RGB to CIELAB Color Space”, IEEE TRANSACTIONS ON IMAGE PROCESSING, VOL. 6, NO. 7, JULY 1997.
[5] Ganesan P et al., “Segmentation and Edge Detection of Color Images Using CIELAB Color Space and Edge Detectors”, 978-1-4244-9005-9/10/$26.00 ©2010 IEEE.
[6] Hsin-Chia Chen et al.,” Contrast-Based Color Image Segmentation”, IEEE SIGNAL PROCESSING LETTERS, VOL. 11, NO. 7, JULY 2004.
[7] Liqiang Liu and Haijiao Ren et al.,” Ant Colony Optimization Algorithm Based on Space Contraction”, Proceedings of the 2010 IEEE, International Conference on Information and Automation, June 20 - 23, Harbin, China.
[8] Myung-Eun Lee1 et al., “Segmentation of Brain MR Images using an Ant Colony Optimization Algorithm”, 978-0-7695-3656-9/09 $25.00 © 2009 IEEE.
[9] N.R. Pal et al., “A review on image segmentation techniques”, Pattern Recognition 9(26): 1277–1294, 1993.
[10] O.A. Mohamed Jafar, “Ant-based Clustering Algorithms: A Brief Survey “, International Journal of Computer Theory and Engineering, Vol. 2, No. 5, October, 2010, 1793-8201.
[11] R. Laptik et al., “Application of Ant Colony Optimization for Image Segmentation”, ISSN 1392 – 1215, 2007. No. 8 (80).
[12] Salima Ouadfel et al., “An Efficient Ant Algorithm for Swarm-Based Image Clustering”, Journal of Computer Science 3 (3): 162-167, 2007 ISSN 1549-3636 © 2007 Science Publications.
Image Name No. of colors
CMC distance
No. of clusters MSE
Onion.png 13849 16.7 10 2.7067
Onion.png 13849 17 9 3.1332
Onion.png 13849 18.5 8 3.0315
Lena.tiff 15456 11 10 2.5614
Lena.tiff 15456 11.5 9 2.7112
Lena.tiff 15456 11.7 8 2.6239
Lion.jpg 6359 9 10 2.6181
Lion.jpg 6359 9.3 9 2.7669
Lion.jpg 6359 9.4 8 2.8345
Image Name
No. of colors
CMC distance
No. of clusters
(1st run)
No. of clusters
(2nd run)
No. of clusters
(3rd run)
Onion.png 13849 18.5 8 9 10
Lena.tiff 15456 11.5 9 10 8
Lion.jpg 6359 9..4 8 7 10
Seema Bansal et al IJCSET |August 2011 | Vol 1, Issue 7, 415-420
420