Colombia Humanitarian Situationreliefweb.int/.../130308_infograma_II_2012.pdf · Natural Disasters...
10
Colombia Humanitarian Situation Synopsis July – December 2012
Transcript of Colombia Humanitarian Situationreliefweb.int/.../130308_infograma_II_2012.pdf · Natural Disasters...

Colombia
Humanitarian
Situation
Synopsis
July – December 2012

Internal Displacement
Explosive Devices
Natural Disasters
Homicides
HSRI

Explosive Devices2009-2012
OCHA | UN | Colombia
Source: Programa Presidencial para la Acción
Integral contra Minas Antipersonal – PPAICMA
Number of Victims Explosive Devices by year
Victims (2012)
AP
M-E
RW
Source: For Colombia. figure is from PPAICMA (2012). Cutoff date: December 31 2012. Report date: January 31.,2013.
76(0.23 rate)
132(0.07 rate)
479(1.13rate)
33(0.23 rate)
317(0.66 rate)
736(2.27 rate)
437(0.25 rate)
178(1.24 rate)
64(0.13rate)
0
100
200
300
400
500
600
700
800
900
Afganistan(2011) Pakistan(2011) Colombia(2012) Myanmar(2011) Cambodia (2011)
APM Other Divices Source: For Colombia. figure is from PPAICMA (2012). Cutoff date: December 31 2012. Report date: January 31.,2013.For others countries. figures are from Landmine Monitor Report 2012 (2011).*Other devices: Explosive Remnants of War (ERW). Antivehicle Mines. Activated Improvised Explosives Device and Unknown Device.PPAICMA didn´t report any other devices for 2012.
Source: Programa Presidencial para la Acción Integral Contra Minas Antipersonal (PPAICMA).Cutoff date: December 31, 2012. Report date: January 31, 2013.
Civilian and Military Victims by Semester
186
300 294246
306
159
0
50
100
150
200
250
300
350
II-2009 I-2010 II-2010 I-2011 II-2011 I-2012 II-2012
Civilian Injured Civilian Deaths Military Injured Military Deaths
262
Synopsis 2012
Number of victims Explosive Devices 479Number of accidents Explosive Devices 300Number of departments affected 16 (48,4%) Number of municipalities affected 86 (7.6%) National Annual Rate (per 100.000) 1,02

Explosive Devices2009-2012
OCHA | UN | Colombia
Source: Programa Presidencial para la Acción
Integral contra Minas Antipersonal – PPAICMA
AP
M-E
RW
Victims by department (2012)
Victims by Gender and Age
186
300 294
246
306
159
262
0
50
100
150
200
250
300
350
II-2009 I-2010 II-2010 I-2011 II-2011 I-2012 II-2012
Department Victims Rate per
100,000 inh
Putumayo 64 30,47
Arauca 18 17,50
Exce
edin
gN
atio
nal
Ave
rage
Rat
e
Caquetá 34 11,84
Guaviare 6 10,45
Meta 29 5,68
Nariño 54 4,75
Vichada 1 3,89
Huila 28 3,87
Norte de Santander 36 3,77
Cauca 32 3,36
Tolima 35 2,81
Chocó 10 2,77
Antioquia 87 2,11
Córdoba 22 2,08
National Data 479 1,03
Valle del Cauca 21 0,69
Nat
ion
alA
vera
ge
Source: Programa Presidencial para la Acción Integral Contra Minas Antipersonal (PPAICMA).Cutoff date: December 31. 2012. Report date: January 31. 2013.
Source: Programa Presidencial para la Acción Integral Contra Minas Antipersonal (PPAICMA).Cutoff date: December 31, 2012. Report date: January 31, 2013. Rate per 100.000 inhabitants yearly1 Most affected municipalities organized by highest rate per 100.000 inhabitants2 National Rate per 100.000 inhabitants
National rate
1.03 2
Most Affected Municipalities (Arranged by rate per 100.000 inhabitants by semester)1
Male under 18 years old Male over 18 years old Female under 18 years old Female over 18 years old
Valle del Cauca 21 0,69
Bel
ow
Nat
ion
alA
vera
ge
Rat
e
La Guajira 2 0,55
120.
67(2
0 vi
ctim
s)
94.7
6(9
vic
tims)
88.5
8(1
3 vi
ctim
s)
79.9
3(1
2 vi
ctim
s)
77.5
3(3
vic
rim
s)
77.4
9(3
vic
tims)
69.5
2(3
vic
tims)
66.4
3(
8 vi
ctim
s)
65.8
7(6
vic
tims)
57.8
3(9
vic
tims)
0,000
20,000
40,000
60,000
80,000
100,000
120,000
140,000
160,000
Jambaló (Cauca) Baraya (Huila) El Carmen (Norte de Santander)
Uribe (Meta) Sipí (Chocó) Puerto Rondón (Arauca)
El Bagre (Antioquia) Colombia (Huila) Cáceres (Antioquia) Puerto Leguízamo
2009 2011 2010 2012

Natural Disasters 2009-2012
OCHA | UN | Colombia
Source: Unidad Nacional para La Gestión del
Riesgo de Desastres (UNGRD)
Persons Affected by Natural Disasters 2009 – 2012 by Semester
Persons Affected (2012)
Na
tura
l Dis
ast
ers
550.733(2392.2 rate)
123,277(548,2 rate)
635,223(2,791.7 rate)
2,714,794(11,931.0 rate)
1,051,287(4,566.5 rate)
1.275,044(5,538.4 rate)
406,952(1,767.6 rate)
500.000
1.000.000
1.500.000
2.000.000
2.500.000
3.000.000
Source: Unidad Nacional para la Gestión del Riesgo de Desastres (UNGRD). Cutoff date: December 31, 2012. Report date: February 4, 2013Rate per 100.000 inhabitants
Source: Unidad Nacional para la Gestión del Riesgo de Desastres (UNGRD).Cutoff date: December 31. 2012. Report date: February 4. 2013Rate per 100.000 inhabitants annualized by semester
0
II-2009 I-2010 II-2010 I-2011 II-2011 I-2012 II-2012
Affected by Floods Affected by Landslides Affected by other Emergencies
Synopsis 2012
Deaths 248Injuried 608Affected Persons 971,105Destroyed Homes 2,907Damaged Homes 121,291National Annual Rate 2.109,05

Natural Disasters 2009-2012
OCHA | UN | Colombia
Source: Unidad Nacional para La Gestión del
Riesgo de Desastres (UNGRD)
Most Affected Departments (Arranged by Affected rate per 100.000 inhabitants) 1
National rate
2.08423
Persons Affected (2012)
21.6
21.2
(104
.980
per
son
s)
40.5
95.1
(135
.282
per
son
s)
7.26
6,3
(97.
561
per
son
s)
21.3
70,7
(15.
750
per
son
s)
8.87
0,3
(73.
338
per
son
s)
10.8
61,2
(726
8 p
erso
ns)
10.3
84(3
5.08
6 p
erso
ns)
5.23
6,5
(85.
493
per
son
s)
3.80
4,4
(17.
482
per
son
s)
3.66
7,1
(61.
637
per
son
s)
0,0
10.000,0
20.000,0
30.000,0
40.000,0
50.000,0
60.000,0
70.000,0
80.000,0
Most Affected Municipalities (Arranged by Affected rate per 100.000 inhabitants) ²
Source: Unidad Nacional para la Gestión del Riesgo de Desastres (UNGRD) Cutoff date: December 31, 2012. Report date: February 4, 2013. See http://www.sigpad.gov.co/1 Most affected departments organized by highest rate per 100.000 inhabitants2 Most affected municipalities organized by highest rate per 100.000 inhabitants³ National Rate per 100.000 inhabitants
2.0842 0,0
PUTUMAYO CHOCÓ AMAZONAS VICHADA CASANARE SUCRE CAUCA CÓRDOBA CAQUETÁ NARIÑO
2009 2010 2011 2012
167.
323,
06(1
4.44
5 p
erso
ns)
123.
772,
61( 2
6.34
5 p
erso
ns)
119.
405,
43(1
8.19
5 p
erso
sns)
118.
468,
24(9
250
per
son
s)
117.
405,
34(4
000
per
son
s)
111.
223,
75(1
536
per
sosn
s)
101.
605,
4(5
.000
per
son
s)
80.7
83(1
9.95
6 p
erso
ns)
78.3
53,3
(113
15 p
erso
ns)
76.9
93,6
6(3
524
per
son
s)
0,0
50.000,0
100.000,0
150.000,0
200.000,0
250.000,0
Río Quito (Chocó) Timbiquí (Cauca) Medio San Juan (Chocó)
Puerto Nariño (Amazonas)
Juradó (Chocó) La Salina (Casanare) Puerto Asís (Putumayo) Nechí (Antioquia) Puerto Caicedo (Putumayo)
San Miguel de Sema (Boyacá)
2009 2010 2011 2012

Homicides
2012OCHA | UN | Colombia
Source:Dirección de Policía Judicial (DIJIN)Processed by: Observatorio de DDHH y DIH, Vicepresidencia de la República
Homicide rate per 100,000 inhabitants
Homicide Rate per 100,000 (I Sem 2012) INML
Ho
mic
ide
s
74.85(21,692)
2012
32.07(34,7663)
2010
30.85(15,609)
2011-2012
29.20(13,602)
2012
4.47(13,913)
201110,00
20,00
30,00
40,00
50,00
60,00
70,00
80,00
90,00
100,00
Oficial data: Colombia (INML), United States (FBI), South Africa (South African Police Service), Venezuela (Observatorio Venezolano de Violencia), Mexico (Instituto Ciudadano de Estudios sobre la Inseguridad).Report date: Colombia (2012), US (2011), Venezuela (2012), South Africa (April. 2011/ March. 2012), Mexico (2010).
Synopsis 2012
Source : *DRIP INMLCF: División de Referencia de Información Pericial (DRIP) Instituto Nacional de Medicina Legal (INML). Cutoff date: December 31, 2012; report date February 11, 2013.Rate per 100,000 inhabitants. CICRI DIJIN: Dirección de Investigación Criminal e INTERPOL (DIJIN). Curtoff date: December 31, 2012; report date Fabruary 11, 2013.
(1)Include Mayors, Municipal Council members, Journalist, Indigenous people and Union Members .Processed by: Observatorio del Programa de Derechos Humanos y Derecho Internacional Humanitario, Vicepresidencia de la República. Cutoff date December 31, 2012, report date February 11, 2013 .
2011
0,00
10,00
Venezuela Mexico South Africa Colombia Unites States
Number of homicides according to Medicina Legal 13.602
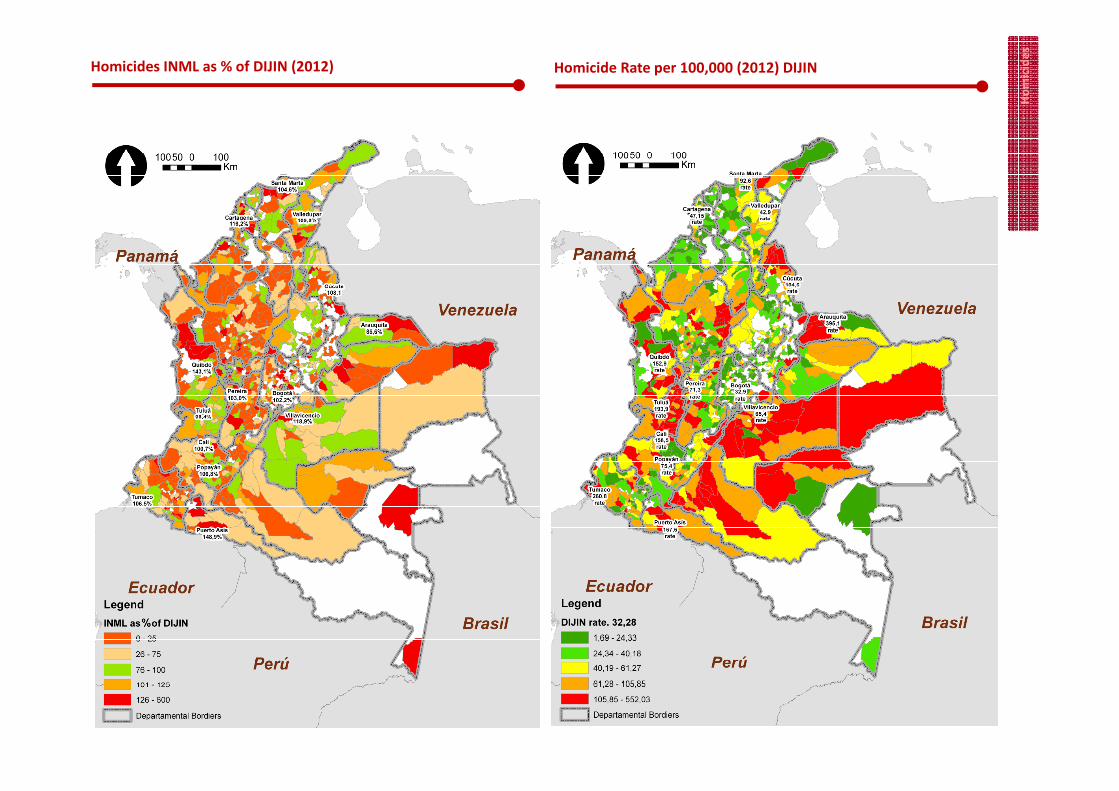
Number of homicides according to DIJIN 15.038
National Homicide Rate, DRIP INML per 100,000 inhabitants 29,20
National Homicide Rate, CRIC DIJIN per 100,000 inhabitants 32,28
Number of homicides among protected persons (1) 103
Ho
mic
ide
s
Homicide Rate per 100,000 (2012) DIJINHomicides INML as % of DIJIN (2012)

Homicides
I Sem 2012OCHA | UN | Colombia
Source:Dirección de Policía Judicial (DIJIN)Processed by: Observatorio de DDHH y DIH, Vicepresidencia de la República
Ho
mic
ide
s
Homicides by semester
Most affected Departments according to DIJIN
(arranged by number and rate per 100,000 inh)
Most affected Municipalities according to DIJIN
(arranged by number and rate per 100,000 inh)
Source: CIC DIJIN. Cutoff date December 31, 2012, report date DIJIN February 11, 2013; DRIP INML. Cutoff date December 31, 2012, report date February 11, 2013
8.12
9
7.47
9
7.98
0
7.33
7
7.37
5
7.14
3
7.89
59.38
2
7.71
6 9.74
3
7.12
0
7.45
3
6.33
6
7.26
6
0
2.000
4.000
6.000
8.000
10.000
12.000
II-2009 I-2010 II-2010 I-2011 II-2011 I-2012 II-2012
CRIC DIJIN DRIP INML
+15.
41%
-11.
29%
-7.
96%
+ 3.
16%
+22.
09%
-2.
95%
+1.0
5%
39,85 (535h.)
40,45 (2,517h.)
43,04 (209 h.)
45,01 (150 h.)
46,79 (618h.)
48,88 (52h.)
49,74(451 h.)
58,54(269 h.)
77,75 (3,479 h.)
81,24 (206 h.)
0,0 20,0 40,0 60,0 80,0 100,0 120,0
Cauca
Antioquia
Chocó
Putumayo
Norte de Santander
Guaviare
Meta
Caquetá
Valle del Cauca
Arauca
2009 2010 2011 2012
Source: CICRI DIJIN. cutoff date December 31, 2012, report date February 11, 2013Rate per 100,000 inhabitants.
362,24 (18 h.)
375,67 (29 h.)
395,15 (79 h.)
406,43 (37 h.)
408,16 (10 h.)
408,68(79 h.)
409,54 (20 h.)
454,95(20 h.)
513,37 (62h.)
552,03 (75 h.)
0,0 250,0 500,0 750,0
Ansermanuevo (Valle del Cauca)
Riofrío (Valle del Cauca)
Arauquita (Arauca)
Puerto Gaitán (Meta)
San José del Palmar (Chocó)
Segovia (Antioquia)
Puerto Santander (Norte de Santander)
El Dovio (Cauca)
Vistahermosa (Meta)
Remedios (Antioquia)
2009 2010 2011 2012

Homicides
2012OCHA | UN | Colombia
Source:Dirección de Policía Judicial (DIJIN)Processed by: Observatorio de DDHH y DIH, Vicepresidencia de la República
Homicide Definition DIJIN
Homicide in general, is defined as killinga human being; the action is to kill; thematerial result is death. It is aninstantaneous crime that is consumedwhen the victim is dead. Under PenalCode, homicide is: when one person killsanother, article 103 of Law 599 of 2000.According to the police, common
Ho
mic
ide
s
2007 2008 2009 2010 2011 2012
Journalists 2 1 1 1 1 0
Mayors 1 3 4 4 8 2
Municipal Council Members 14 13 10 9 9 5
Union Members 26 38 28 37 29 20
Indigenous People 23 30 58 25 62 76
Total DIJIN 17198 16140 15817 15459 14712 15038
Total INML
0
2000
4000
6000
8000
10000
12000
14000
16000
18000
20000
0
10
20
30
40
50
60
70
80
To
tal H
om
icid
es
Pro
tect
ed
Pe
rso
ns
(1)(
2)
Homicides among protected persons
According to the police, commonhomicide is all death that is caused byany weapon except those that arecommitted in traffic accidents.
Homicide Definition INML
“Suppression by conduct of the agent(aggressor), of a human life(criminality), without legal justification(illegality), intentionally ormaliciously, or with guilt orpremeditation (guilty)”.
Forensis 2008
Distribution of the rate of homicides per 100,000 inhabitants by age group and gender 2012
Source: INML cutoff date: December 31, 2013, DANE: Población por sexo y grupo de edad. Report date: February 11, 2013.
(1) Include Mayors, ex Mayors, Municipal Council Members, Journalists and Union Members. Source: Observatorio del Programa de Derechos Humanos y Derecho Internacional Humanitario, Vicepresidencia de la República. Cutoff date December 31, 2012, report date February 11, 2013.(2) Indigenous People. Source: Organización Nacional Indígena de Colombia – ONIC, report date September 2012
(00 a 04) (05 a 09) (10 a 14) (15 a 17) (18 a 19) (20 a 24) (25 a 29) (30 a 34) (35 a 39) (40 a 44) (45 a 49) (50 a 54) (55 a 59) (60 a 64) (65 a 69) (70 a 74) (75 a 79)
Men 1,46 1,05 4,18 59,37 99,74 117,97 118,93 107,18 85,23 67,21 53,28 39,13 35,21 21,76 20,59 20,98 9,99
Women 1,24 0,77 2,34 5,94 8,56 9,77 9,41 8,38 7,16 4,50 5,00 3,02 2,41 3,47 1,82 1,95 1,94
Total 1,35 0,91 3,28 33,29 55,30 65,09 63,95 56,56 44,96 34,55 28,07 20,20 17,97 12,13 10,62 10,61 5,46
0,00
20,00
40,00
60,00
80,00
100,00
120,00
140,00
Total INML 16283 15250 17692 17459 14573 13602