Colombia Field Survey Report
35
Colombia Field Survey Report Prepared by Conservation International Teresa Castillejos, Elizabeth Baer and Bambi Semroc
Transcript of Colombia Field Survey Report

Colombia Field Survey ReportPrepared by Conservation International
Teresa Castillejos, Elizabeth Baerand Bambi Semroc
Table of Contents
Executive Summary ...........................................................................................................................3
Introduction & Objectives ...................................................................................................................4
Methodology ......................................................................................................................................5
Description of the Study Area .............................................................................................................9
Results .............................................................................................................................................15
Advantages and Disadvantages of Participation: .......................................................................15
Changes in Farm Management .................................................................................................17
Quality of Life and Access to Opportunity: .................................................................................19
Environmental Health and Quality ..............................................................................................25
Conclusions and Recommendations ................................................................................................29
References .......................................................................................................................................32
Appendices ......................................................................................................................................34
Appendix 1: Field survey ...........................................................................................................34
Appendix 2: Expert survey .........................................................................................................34
Acknowledgments ...........................................................................................................................35
COVER PHOTOS: © ROBIN MOORE/iLCP

SEPTEMBER 2011 | COLOMBIA FIELD SURVEY REPORT | 3
Executive SummaryAs part of an ongoing process to evaluate the impacts of the Starbucks Coffee and Farmer Equity (C.A.F.E.) Practices program since its inception in 2004, Conservation International (CI) designed and implemented a field survey among coffee farmers in the state of Nariño, Colombia, in March and April of 2011. This survey built upon a previous field survey, conducted in Guatemala in 2009. The site selected for survey represents an important and unique coffee producing region, is of longstanding importance as a supplier to Starbucks, and performs an important role in the conservation of species and natural resources.
The objectives of the survey were to explore the perceived value of participation in C.A.F.E. Practices; to:
• Identify differences and changes in socio-economic and conservation performance of coffee producers and the role of C.A.F.E. Practices in these differences and changes;
• Identify opportunities for improvements to the C.A.F.E. Practices program; and
• Continue to refine a methodology for results assessment that can be replicated.
A team at CI worked with Starbucks and partner organizations in Colombia to advance the assessment model developed for the Guatemala survey, implement the survey in the field and analyze results.
CI, working with local partners, trained a team of surveyors to implement surveys consisting of questions related to household information, income, assets, farm management practices, farm and household infrastructure, labor and others. C.A.F.E. Practices participants were asked additional questions related to their experience with the program. Surveyors interviewed 501 farmers, of which 203 were participants in C.A.F.E. Practices and 298 were not (e.g. the control group). As is common in the region, nearly all respondents were smallholders with fewer than 12 hectares of land. CI also interviewed experts from a variety of related fields to supplement and triangulate responses gathered in the survey process. CI worked with the International Center for Tropical Agriculture (CIAT) to analyze survey responses and test for statistical significance across the C.A.F.E. participant and the control group.
Overall, the findings of this survey reveal that the program is having a positive impact on communities and the environment, and participants view participation as valuable. The most common way in which participants perceived C.A.F.E. Practices as influencing them was through trainings, technical support and capacity building. The survey findings also reinforce conclusions from the previous field survey that generating social and environmental results is a long-term investment that requires a longer timescale and repeated surveying before greater impacts become apparent. A selection of key findings supporting these conclusions includes the following:
• More participants were participating in other certification programs to increase their access to premium markets than non-participants; most began participating in C.A.F.E. Practices first.
• Most participants did not have difficulty meeting the program’s requirements.
• Most participants’ expectations of the program had been fulfilled and most found the program to be beneficial.
• More participants took part in training and changed management techniques as a result of training.
• Participants had higher productivity per hectare, larger farms and resulting higher sales and overall income.
• Participants reported greater overall earnings status, compared to the national poverty line, compared to non-participants.
• Participants had more years of formal education and more sent their children to secondary school.
• Household assets did not vary across the two groups, although participants owned motorbikes and automobiles in greater numbers.
• Participants had more sophisticated processing infrastructure and methods than non-participants.
• Soil quality was more stable on participant farms and participants had made more progress addressing erosion issues.
• There was greater diversity in the shade canopies of participant farms.
• There was no significant difference in the current use of agrochemicals, the frequency of applications, or in the change in use over time.
• More participants maintained uncultivated areas on farms, and the extent of natural habitat around participant farms was more stable with fewer losses and more increases.
• Participants made greater gains in improving waste management practices.

SEPTEMBER 2011 | COLOMBIA FIELD SURVEY REPORT | 4
Introduction & ObjectivesIn 2004, Starbucks launched the Coffee and Farmer Equity (C.A.F.E.) Practices program, a coffee sourcing program designed to ensure the sustainable supply of high quality coffee and achieve economic accountability, promote social responsibility and protect the environment within coffee supply chains.
C.A.F.E. Practices is a comprehensive set of social, economic, environmental and quality guidelines for the production and processing of coffee, and was developed by Starbucks in partnership with Conservation International (CI) and Scientific Certification System (SCS). The guidelines include prerequisites related to coffee quality and economic transparency and introduce additional expectations related to hiring practices; working and living conditions for workers; conservation of water, soil, and wildlife; and environmental management. Independent, third-party verifiers assess performance against the guidelines.
Starbucks’ underlying hypothesis is that implementation of the C.A.F.E. Practices program will drive the long-term sustainability of coffee supply through improvements in environmental conditions and the socio-economic livelihood of farmers and workers. In 2008, CI and Starbucks began a process to evaluate the results of the C.A.F.E. Practices program by analyzing global data Starbucks collects from suppliers through the C.A.F.E. Practices verification process, as well as by conducting targeted field surveys to further explore global-scale trends and findings within the context of a specific region. The first global-scale assessment1 examined data from Starbucks fiscal year 2008 verification reports and the first field survey2 was conducted by CI and local partners in Guatemala in 2010.
Colombia was selected as the location for the second farmer field survey as it has historically represented an important source of coffee for Starbucks and was one of the first countries to apply to the C.A.F.E. Practices program in 2004. CI worked with local partners to conduct a field survey of coffee farmers in 16 municipalities in the state of Nariño as well as six interviews with experts and stakeholders during March and April of 2011. This field survey contributes to the ongoing efforts to evaluate the results of the C.A.F.E. Practices program and to understand the producers’ perceptions of the program and challenges they face. It is informed by global-scale results from the FY08 assessment and builds on the methods developed through implementation of the Guatemala field survey.
The objectives of the Colombia survey were to:
• Understand the role of C.A.F.E. Practices in driving changes in socio-economic and/or conservation performance of coffee producers;
• Identify the perceived value of C.A.F.E. Practices among participants in the Nariño area;
• Identify potential incentives that retain participants in the program for the Nariño coffee area;
• Develop recommendations for improvements to the C.AF.E. Practices program; and
• Continue to refine a methodology for results assessment that can be replicated in other key supply countries.
1 Semroc, B., 2011. 2 Castillejos, T., 2010.
SEPTEMBER 2011 | COLOMBIA FIELD SURVEY REPORT | 5
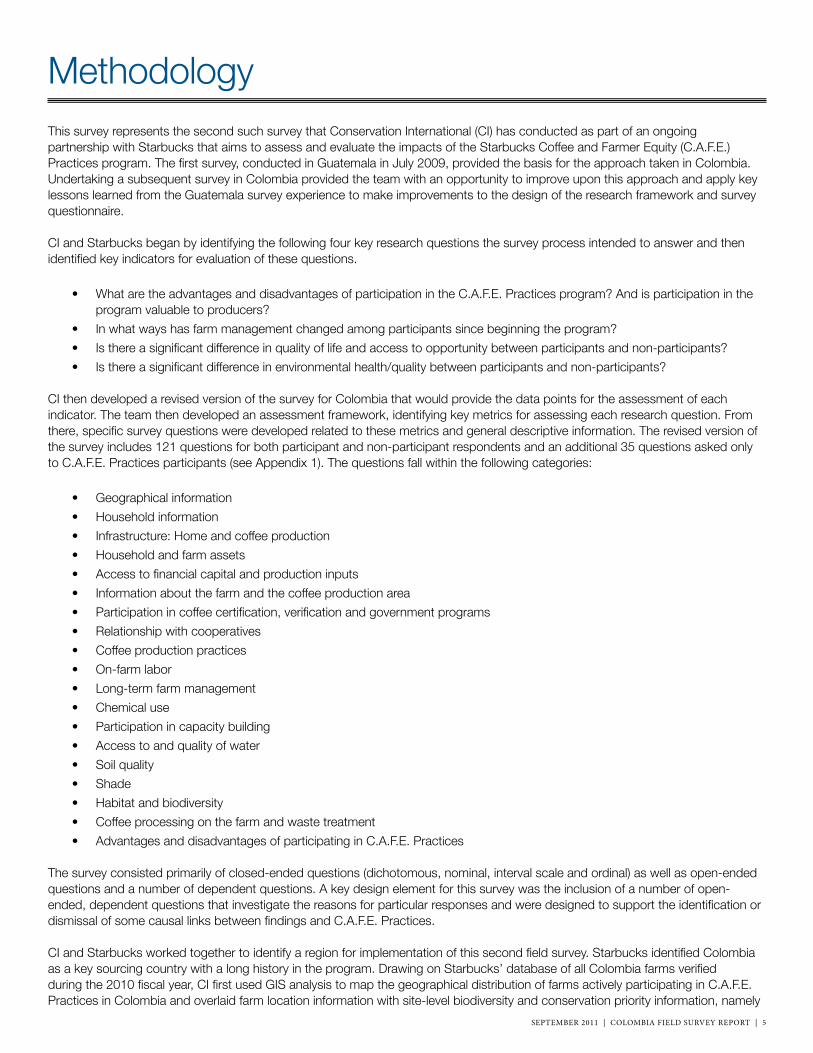
MethodologyThis survey represents the second such survey that Conservation International (CI) has conducted as part of an ongoing partnership with Starbucks that aims to assess and evaluate the impacts of the Starbucks Coffee and Farmer Equity (C.A.F.E.) Practices program. The first survey, conducted in Guatemala in July 2009, provided the basis for the approach taken in Colombia. Undertaking a subsequent survey in Colombia provided the team with an opportunity to improve upon this approach and apply key lessons learned from the Guatemala survey experience to make improvements to the design of the research framework and survey questionnaire.
CI and Starbucks began by identifying the following four key research questions the survey process intended to answer and then identified key indicators for evaluation of these questions.
• What are the advantages and disadvantages of participation in the C.A.F.E. Practices program? And is participation in the program valuable to producers?
• In what ways has farm management changed among participants since beginning the program?
• Is there a significant difference in quality of life and access to opportunity between participants and non-participants?
• Is there a significant difference in environmental health/quality between participants and non-participants?
CI then developed a revised version of the survey for Colombia that would provide the data points for the assessment of each indicator. The team then developed an assessment framework, identifying key metrics for assessing each research question. From there, specific survey questions were developed related to these metrics and general descriptive information. The revised version of the survey includes 121 questions for both participant and non-participant respondents and an additional 35 questions asked only to C.A.F.E. Practices participants (see Appendix 1). The questions fall within the following categories:
• Geographical information
• Household information
• Infrastructure: Home and coffee production
• Household and farm assets
• Access to financial capital and production inputs
• Information about the farm and the coffee production area
• Participation in coffee certification, verification and government programs
• Relationship with cooperatives
• Coffee production practices
• On-farm labor
• Long-term farm management
• Chemical use
• Participation in capacity building
• Access to and quality of water
• Soil quality
• Shade
• Habitat and biodiversity
• Coffee processing on the farm and waste treatment
• Advantages and disadvantages of participating in C.A.F.E. Practices
The survey consisted primarily of closed-ended questions (dichotomous, nominal, interval scale and ordinal) as well as open-ended questions and a number of dependent questions. A key design element for this survey was the inclusion of a number of open-ended, dependent questions that investigate the reasons for particular responses and were designed to support the identification or dismissal of some causal links between findings and C.A.F.E. Practices.
CI and Starbucks worked together to identify a region for implementation of this second field survey. Starbucks identified Colombia as a key sourcing country with a long history in the program. Drawing on Starbucks’ database of all Colombia farms verified during the 2010 fiscal year, CI first used GIS analysis to map the geographical distribution of farms actively participating in C.A.F.E. Practices in Colombia and overlaid farm location information with site-level biodiversity and conservation priority information, namely
SEPTEMBER 2011 | COLOMBIA FIELD SURVEY REPORT | 6
Key Biodiversity Areas (KBAs),3 including Alliance for Zero Extinction (AZE)4 sites and protected areas as delineated by the World Database on Protected Areas5. AZE sites are designated using geographical point data, so for each of the AZE sites located in Colombia, CI applied a 10km buffer surrounding each point to demarcate an area of direct impact. Three clusters of farms emerged and CI and Starbucks selected the cluster in the Nariño state as the area of focus. Starbucks’ long history of sourcing coffee from this region; their long-standing and strong relationship with Empresas de Nariño, the local export company; and safety concerns in other sites were each factored in to the selection of the site. Empresas de Nariño played a critical role in advising and supporting implementation of the survey: their extension agents and buyers have longstanding relationships with farmers, know the area well, and provided advice to CI in selecting municipalities that would be feasible for implementing the survey and where surveyors could expect to find a mix of participating and non-participating farms. CI recognizes that working with Empresas de Nariño, a supplier to Starbucks, may introduce some selection bias in the results of the survey, but determined that it was necessary to design the implementation approach in partnership with them in order to ensure a high level of participation. CI randomized selection of farms for survey, but has not otherwise attempted to control for these possible biases.
Using a list of 22,000 farms identified as active participants in the previous year, fiscal year 2010, CI worked with Empresas de Nariño to begin identifying farms to include in the survey. Because the overwhelming majority of coffee farmers in this region of Colombia are smallholders, no effort was made to stratify the sample by farm size. CI extracted a random sample of 175 farms that had verification reports6 from the database of 22,000, and mapped the location of these farms using GIS analysis. Four farms had faulty GPS data and were excluded from the sample. These remaining 171 farms were grouped by municipality to inform the logistical planning of the survey process. Three municipalities were removed from consideration due to ongoing social conflict in the area, which made it unsafe for surveyors to travel and work in the area. Nine municipalities in the northern region of Nariño and seven municipalities in the western region remained, for a total of 16 municipalities selected for the survey (Figure 1). It was later determined by the implementing team that the western region also presented some security concerns and should only be visited if necessary. Surveyors conducted many C.A.F.E. Practices participant surveys in the northern region, but did not identify a sufficient number of non-participants there, so they collected the balance of non-participant surveys and additional C.A.F.E. Practices participants from the western region.
CI selected a local organization, ECONEXOS, to be the survey implementing partner largely due to its strong team in the field, comprised largely of local people who are recent graduates from University of Nariño with degrees in agronomy, biology, and forestry. In addition, CI partnered with the International Center for Tropical Agriculture (CIAT) in Cali, Colombia, to conduct data analysis and to provide general support. CI and ECONEXOS trained six recent agronomy graduates to conduct the surveys in the field. Surveyors worked in pairs and undertook survey implementation during April and May 2011, with an aim to survey a total of 500 farmers with a targeted split of approximately 50 percent C.A.F.E. Practices participants and 50 percent non-participants. See Table 1 for a breakdown of surveys by region and Figure 1 for a map of surveyed farms.
3 Key biodiversity areas are places of international importance for the conservation of biodiversity through protected areas and other governance mechanisms. They are identified nationally using simple, standard criteria, based on their importance in maintaining species populations. See: http://www.iucn.org/about/union/secretariat/offices/iucnmed/iucn_med_programme/species/key_biodiversity_areas/
4 AZE uses the following criteria to identify priority sites: 1. Endangerment, 2. Irreplaceability, 3. Discreteness. See: http://www.zeroextinction.org/ 5 The World Database on Protected Areas contains reference to all legally-established protected areas. See: http://www.wdpa.org/ 6 C.A.F.E. Practices participants are verified by a third party upon joining the program and on a recurring basis, according to a sampling method and the third-party issues a
verification report to Starbucks. Because most of the 22,000 farms in this set are smallholders, they are verified under C.A.F.E. Practices according to a group method whereby a sample of the whole set of farms is verified, rather than each individual farm. For more information about the sampling method, see the C.A.F.E. Practices Verifier and Inspector Operations Manual: http://www.scscertified.com/retail/starbucks_documents.php

SEPTEMBER 2011 | COLOMBIA FIELD SURVEY REPORT | 7
Figure 1 | Geographic regions, conservation priorities and surveyed farm locations in Nariño, Colombia.
CIAT developed a database for managing the survey results using Omniform software and trained ECONEXOS administrators in entering information from the paper surveys into the database. ECONEXOS transmitted the database to CIAT and CIAT undertook data cleaning and analysis using the STATA statistical software package. As a first step, CIAT cleaned raw data, checking for inconsistencies and categorizing open-ended responses for analysis. Inconsistencies were checked with ECONEXOS and revised where appropriate. Using the agreed research framework as a guide, CIAT used the STATA statistical package to perform simple analytical procedures as well as some calculated analyses for results such as mean yield, income, etc. to evaluate the research questions. In addition, CIAT preformed tests for statistical significance. For most procedures, using the chi squared or Fisher’s exact test in most cases, and Bartlett’s test for equal variances in others. In all cases, a threshold of 0.05 was used to determine significance.
In conducting surveys and follow-up conversations, it became clear that some confusion may exist among farmers as to whether or not they participate in the C.A.F.E. Practices program. Some farmers simply associate Empresas de Nariño with C.A.F.E. Practices, and others may not have realized they were participants. Although not all misclassifications were identifiable, CIAT attempted to identify such potential misclassifications and followed up to resolve these where possible by referring to other information contained in the surveys and by following up directly with surveyors. Some misclassification may still exist between the two groups, but we have relied on tests of statistical significance to identify findings with high confidence levels that allay concerns regarding any sampling error.
In addition to the farmer surveys, CI conducted seven interviews with experts in the region in order to learn more about distinctive features of coffee production in Nariño in general and to triangulate results of data analysis. CI selected experts who could provide information and perspective on agriculture in general — and coffee production in particular — in the broader Pasto region and in the state of Nariño. Other important factors in the selection of experts to interview included their knowledge of coffee producers in Nariño and coffee buyers in the region. Specifically, CI spoke with experts at Empresas de Nariño as well as another export company (EXPOCAFE) and the Coffee Federation; a representative of the Nariño Specialty Coffee Alliance; and representatives from

SEPTEMBER 2011 | COLOMBIA FIELD SURVEY REPORT | 8
the Departments of Agriculture for Pasto and Nariño. CI developed a separate survey for such experts (see Appendix 3), and one of the survey leads at CI conducted these surveys in person and over the phone in April 2011.
TABLE 1 | Surveys implemented by region, municipality and vereda.
NORTHERN REGION WESTERN REGION
Municipality Vereda Surveys Total Municipality Vereda Surveys Total
ARBOLEDALa Cocha 12
22ANCUYÁ
Yanancha 6
17El Pedregal 10 La Loma 6
BUESACO
La Loma 10
30
Cocha Blanca 5
Cabecera 5EL TAMBO
El Cidral 1427
Higuerones 15 Potrerillo 13
EL TABLÓN
Los Alpes 616
CONSACÁ
El Tejar 10
38Victoría 10 Paltapamba 10
Cabecera 6 6 Cariaco 9
LA UNIÓN
El Sauce 817
Campamento 9
El Chilcal 9 Bombona 16 16
La Castilla 1326
LINARES
El Motilón 8
23La Pradera 13 Bella Vista 8
ALBÁN
Fátima 8
24
San José 7
El Carmelo 8
LA FLORIDA
El Rodeo 18
51Buena Vista 8 Rosa Pamba 9
COLÓN GÉNOVA
Villanueva 16
32
Tunja 15
La Plata 8 Quebrada Honda 9
El Llano 8
SANDONÁ
Santa Rosa 9 9
SAN PABLO
Vega Quito 6
22
Bohorquez 12
44La Cañada 8 El Ingenio 14
Los Llanos 8 El Plan 8
SAN LORENZO
El Carmen 10
39
San José 10
Madroñero 17
SOTOMAYOR
El Placer 8
22San Vicente 12 El Arenal 8
CARTAGOEl Salado 10
19El Huilque 6
Buenos Aires 9 7 25 241 247
9 26 253 253
SEPTEMBER 2011 | COLOMBIA FIELD SURVEY REPORT | 9
Description of the Study Area
IntroductionColombia is well recognized as the largest producer of mild coffee in the world.7 Historians debate exactly when coffee began to thrive in Colombia, but there are two different dates where coffee appears in written testimonies. The first was a description of the region by a Jesuit priest in 1730, and the second occurred in 1787, by Archbishop Viceroy Sir y Góngora, who registered coffee cultivation for the Spanish authorities in the Santander and Boyaca regions.8
With an area of 1,139,000 square kilometers and a population of 42.8 million, Colombia has been recognized for its strong economy in comparison with other South American economies, a result largely due to trade based on the export of petroleum and coffee, as well as investment in education that has resulted in a current literacy rate of 93 percent9 and a Gross National Income of $4,990 USD per capita.10 The importance of coffee in the Colombian economy is clear: it represented about 6 percent of total export value in 2006, and about 10 percent of the total agricultural output.11 The coffee economy contributes directly and indirectly to the economy of the country and it is estimated that 566,000 families — 2.3 million Colombians — depend entirely on coffee.12 These families contributed 8,498,000 bags of coffee to the coffee exports in the 2010 production year,13 placing Colombia as the third largest worldwide exporter of coffee, after Brazil and Vietnam, in 2010.14
Since its creation in 1927,15 the National Federation of Coffee Growers of Colombia (known simply as the Federation) has been a strong force in the development of the coffee export industry in Colombia. A national, government-supported entity owned by over 500,000 farmers who cultivate coffee on small farms16, the Federation supported the consolidation and organization of coffee cooperatives and small holders and began to develop physical and commercial infrastructure to support increased exports of coffee. By 1930, Colombia had become the second largest coffee producer in the world.
Coffee in ColombiaCoffee cultivation in Colombia is mainly located in the Andes Mountains and the Sierra Nevada of Santa Marta (see Figure 1). The land dedicated to the cultivation of coffee represents between 850,000 and 900,00017 hectares and is located at altitudes ranging from 1,200 to 1,800 meters above sea level. These areas have climates conducive to coffee production with temperatures ranging between 17 to 23°C, with an average annual precipitation of 2,000 millimeters.
Colombian coffee has a special place in the international market as the world’s largest producer of washed Arabica with high production volume and a longer harvesting season, which can supply fresh coffee throughout the year to the international market. The prolonged harvest season is due to Colombia’s location, which brings high solar irradiation, beneficial climatic conditions and exceptional rainfall patterns that allow producers to harvest in different parts of the country during all the months of the year.
The harvest period varies across states and regions due to differences in local climate conditions (see Figure 2). Some states (Caldas, Quindio and Cundimarca) have two harvest seasons, while others (Nariño, Cauca, Valle, Huila and Cundinamarca) have only one. The timing of the harvest also varies significantly, with some states harvesting their main crop in the period from September through December, and others harvesting beginning in March and continuing into June. The different timing of the coffee crop in Colombia shows the range of activities taking place across rural areas as well the consistency of labor that the coffee area needs throughout the year.
7 “National Federation of Coffee Growers of Colombia” website.8 Ibid.9 “World Bank Data Catalog: Colombia” website.10 Ibid.11 Hudson, ed., 2010.12 Ibid.13 “Producción y Exportaciones de café de Colombia,” “National Federation of Coffee Growers of Colombia” website. 14 Hudson, ed., 2010.15 “National Federation of Coffee Growers of Colombia” website.16 Hudson, ed., 2010.17 “National Federation of Coffee Growers of Colombia” website.

SEPTEMBER 2011 | COLOMBIA FIELD SURVEY REPORT | 10
FIGURE 2 | Principle and secondary coffee harvest cycles in Colombia.
Biodiversity in ColombiaColombia is rich in natural resources, with five distinct natural regions: the Andean, Pacific, Orinoquia, Amazonas and Caribbean. These regions, and the biodiversity they contain, result in the categorization of Colombia as one of the 12 megadiverse countries in the world, ranking second overall in total biodiversity18. Colombia has the highest level of bird and orchid diversity in the world, with 1,885 and 4010 species, respectively19. The country ranks second in plant diversity with between 30,000 and 41,000 species estimated, and third in reptiles (524 species)20. Colombia is also home to 479 species of mammals, ranking it fourth in the world21. In addition, Colombia contains numerous endemic species: 28 mammals, 115 reptiles, 330 amphibians, 66 birds and 1,500 plants22. Moreover, Colombia contains the second-highest number of Alliance for Zero Extinction23 (AZE) sites, with 48 AZEs registered.24
Biodiversity and coffee production in NariñoThe state of Nariño is located in the southeast of Colombia, on the border with the Republic of Ecuador (see Chart 2). The Andes Mountains enter into Colombia in Nariño and run from south to north forming the “Pastos knot” (el nudo de los Pasto) in the south, where two ranges are born: the Western and the Central-Eastern. The Western range has the Chiles (4,718 m), Cumbal (4.764 m) and Azufral (4.070 m) volcanoes, and a large depression called “Hoz de Minamá;” whereas the Central-Eastern range has the
18 Biodiversity is defined as the sum of all life, in terms of genes, species, and ecosystems, in a given region or in the world as a whole.19 “Biodiversidad en cifras,” SiB.20 Ibid.21 Ibid.22 Ibid.23 The Alliance for Zero Extinction is a global initiative of biodiversity conservation organizations aims to prevent extinctions by identifying and safeguarding key sites where species
are in imminent danger of disappearing.24 Alliance for Zero Extinction, 2005.

SEPTEMBER 2011 | COLOMBIA FIELD SURVEY REPORT | 11
Galeras (4.276 m) and Doña Juana (4.250 m) volcanoes, the Túquerres - Ipiales plateau, as well as the “Atriz Valley.” The conditions in the Nariño region are beneficial for coffee production: the region’s proximity to the equator brings a high number of average hours of daylight (and average solar irradiation25 of 36.1 MJ/m2 per day); the volcanic soil is high in nutrients; the region receives an average rainfall of 1,866 milliliters per year; the average temperature is 19.9°C; and there are high-quality water sources widely available.26 The coffee area is also characterized by the presence of shade canopy, a distinctive characteristic in comparison with other coffee areas in Colombia. These conditions combine with the presence of rivers and canyons to produce a beneficial effect — the warm air that is produced in the bottom of the canyons during the day rises at night, tempering otherwise cool nighttime temperatures, and enabling the high-altitude coffee plantations to survive. They also provide the ability to produce coffee at the highest altitude in the world — 2,300 meters above sea level. These natural conditions, combined with the variety of coffee produced (coffea Arabica), also enable maturation of the coffee in Nariño in 37 weeks, compared to the 32-week maturation period in other areas,27 which leads to higher sugar content and determines the sweetness and acidity.
FIGURE 3 | Conservation priorities in Nariño, Colombia.
Nariño has been one of the key sourcing regions for Starbucks, and Starbucks has had a commercial relationship with producers in the region since 1993. While this area is very well known for their high quality coffee, it was also known for the presence of illicit crops and ongoing social conflict taking place in the region during that time. In 1993, Starbucks established its first coffee contracts with Empresas de Nariño (Nariño Enterprises), a coffee trading company established as a family business in 1950, to source coffee from 38 municipalities in the state of Nariño. Throughout the second half of the 20th century, social unrest in Colombia increased — particularly in the Nariño region — at a time when the Federation did not have a strong presence in the region. In 2004, Colombia became one of the first supplier countries to participate in the C.A.F.E. Practices program.
25 “Solar irradiation” is a measure of the amount of solar energy expressed in terms of watts per square meter. 26 “National Federation of Coffee Growers of Colombia” web page.27 Expert interview.

SEPTEMBER 2011 | COLOMBIA FIELD SURVEY REPORT | 12
Coffee production is the second largest agriculture economic activity in Nariño, after potato cultivation, with 36,45628 producers participating in the coffee trade.29 These producers are distributed across 33,50030 hectares and currently account for about 3 percent31 of the total production of coffee in Colombia. The industry has experienced growth over the past 10 years with increasing numbers of coffee producers and hectares cultivated. Total coffee production; however, is not growing at the same rate because of two key factors that have impacted a large proportion of producers: the roya (Hemileia vastatrix) coffee fungus; and early-onset climate change, which has impacted traditional weather patterns.
The majority of producers in Nariño are smallholders who cultivate and produce their coffee with little technical assistance and still conduct wet processing using artisanal processes and then dry process the coffee on a cement patio. Coffee production is prevalent in two main areas: the Western region and Northern region. The largest municipalities in the Northern region include: San Pablo, La Unión, Colón Génova, La Cruz, Arboleda, Belén, Albán, San Bernardo, El Tablón, Buesaco, Chachagui and San Lorenzo; and in the Western region: Sandoná, Consacá, La Florida, Ancuyá, Linares, El Tambo, Pasto, Nariño and Yacuanquer.
Producers in this area have been recognized for their distinctive cultivation and production practices—they maintain more shade canopy than other coffee areas in the country, and maintain the artisanal knowledge of the wet milling process. Coffee producers in the Nariño region typically use the “wet process” method for processing coffee cherries. This method includes a water-based phase whereby the coffee fruit (pulp) is removed from the bean, and a second phase whereby the de-pulped coffee beans are partially dried. Producers may complete all wet process phases on their farms, they may do some phases on-farm, or they may not do any processing on-farm, opting instead to sell coffee cherries to a stand-alone milling operation. After the wet process, producers typically sell dried coffee to larger dry mills to dry the coffee beans more completely and complete the processing phase, which includes hulling, polishing, cleaning, sorting and grading of coffee beans.
Coffee farms are not only fundamental for the region’s economy, but also for the conservation and sustainability of the environment, as the effort of coffee producers contributes strongly to the conservation in the region. As an example, the approximately 33 tree species used in the shade coffee canopy play a very important role in the optimization of coffee production32 as well as in conservation of natural resources. The main species among them include: Arrayan (Myrcia popayanensis Hier.), the Yarumo (Cecropia sp.), the Mullo Pava (Oreopanax incisus (Will ex Schull.) Decne.), the Cucharo (Clusia multiflora H.B.K) and citrus.33
FIGURE 4: Yarumo (Cecropia sp.) Photo by Fundación Jardín Botánico Nacional de Viña del Mar
28 Ibid.29 Delgado, A., 2008, pg 197.30 Expert interview.31 Ibid.32 Perfecto, I., 1996. 33 “National Federation of Coffee Growers of Colombia” website.
SEPTEMBER 2011 | COLOMBIA FIELD SURVEY REPORT | 13
Understanding the biodiversity of coffee production areas helps us to understand and highlight the challenges and advantages that production practices may provide for conservation. Shade coffee and forest remnants on farms connected to others within the landscape are just some of the strategies for optimizing biodiversity within the coffee landscape. Coffee producers in Nariño are applying these and other strategies to preserve the remaining biodiversity in the region, especially in light of the additional challenges associated with climate change, in an effort to maintain and enhance the quality of the coffee, level of production and well-being of coffee producers.
Most of the mountains are situated in the Rio Patia valley, in the north of the state near the border with Cauca, where a high concentration of the coffee producers are located; and the high plateaus are located in Nariño altiplano volcano complex. The presence of numerous sources of water, including lagoons and paramos, allows for a vast wealth of flora and fauna in the Colombian Massif in the Santuario de Flora y Fauna Galeras, the Páramo de Paja Blanca and in the Chiles, Cumbal and Azufral volcano complex.34
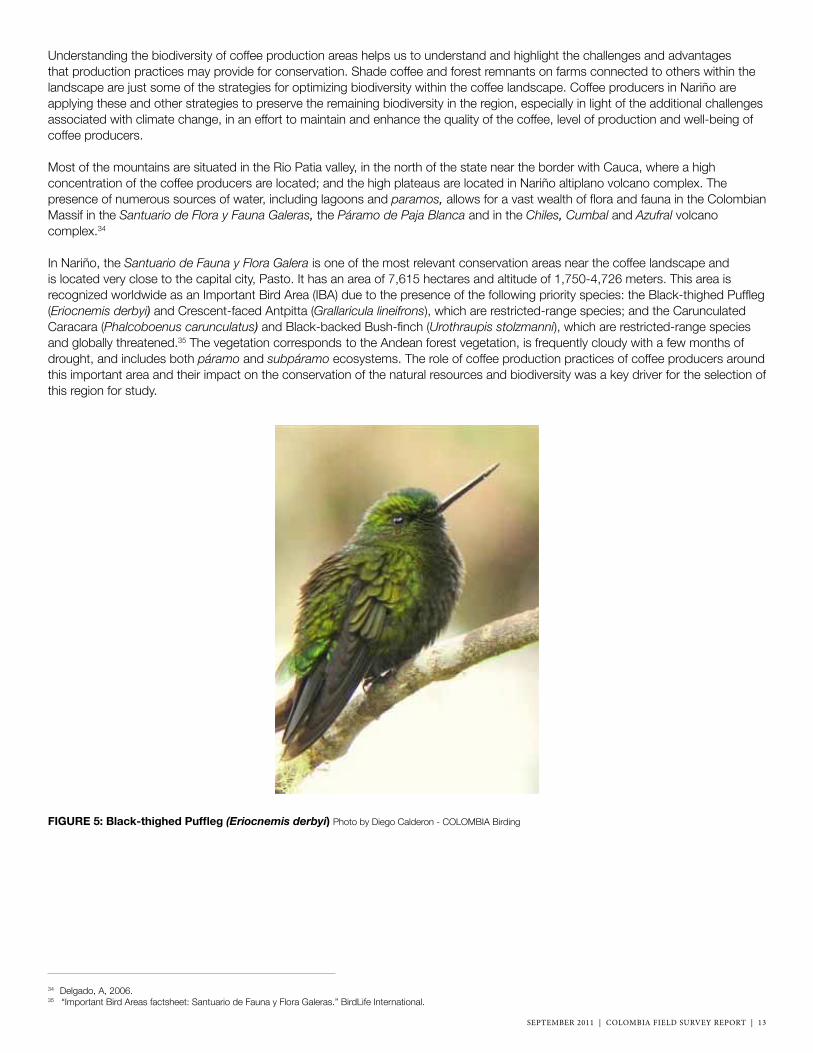
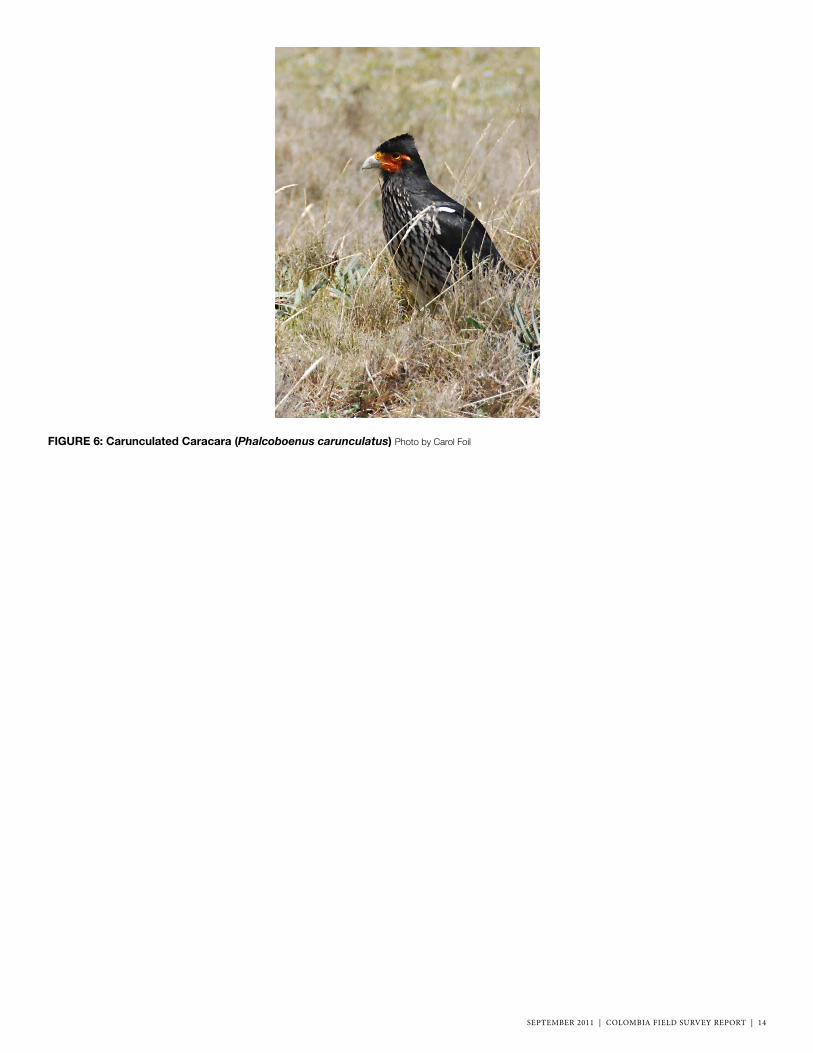
In Nariño, the Santuario de Fauna y Flora Galera is one of the most relevant conservation areas near the coffee landscape and is located very close to the capital city, Pasto. It has an area of 7,615 hectares and altitude of 1,750-4,726 meters. This area is recognized worldwide as an Important Bird Area (IBA) due to the presence of the following priority species: the Black-thighed Puffleg (Eriocnemis derbyi) and Crescent-faced Antpitta (Grallaricula lineifrons), which are restricted-range species; and the Carunculated Caracara (Phalcoboenus carunculatus) and Black-backed Bush-finch (Urothraupis stolzmanni), which are restricted-range species and globally threatened.35 The vegetation corresponds to the Andean forest vegetation, is frequently cloudy with a few months of drought, and includes both páramo and subpáramo ecosystems. The role of coffee production practices of coffee producers around this important area and their impact on the conservation of the natural resources and biodiversity was a key driver for the selection of this region for study.
FIGURE 5: Black-thighed Puffleg (Eriocnemis derbyi) Photo by Diego Calderon - COLOMBIA Birding
34 Delgado, A, 2006. 35 “Important Bird Areas factsheet: Santuario de Fauna y Flora Galeras.” BirdLife International.
SEPTEMBER 2011 | COLOMBIA FIELD SURVEY REPORT | 14
FIGURE 6: Carunculated Caracara (Phalcoboenus carunculatus) Photo by Carol Foil
SEPTEMBER 2011 | COLOMBIA FIELD SURVEY REPORT | 15
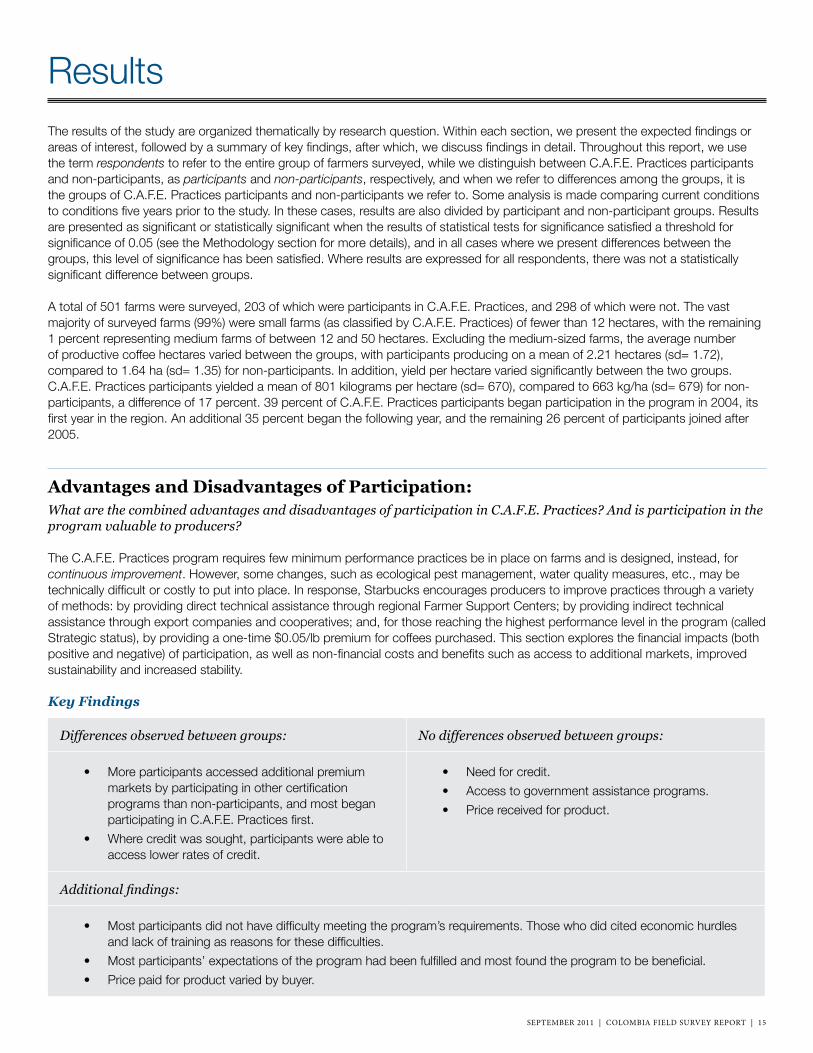
ResultsThe results of the study are organized thematically by research question. Within each section, we present the expected findings or areas of interest, followed by a summary of key findings, after which, we discuss findings in detail. Throughout this report, we use the term respondents to refer to the entire group of farmers surveyed, while we distinguish between C.A.F.E. Practices participants and non-participants, as participants and non-participants, respectively, and when we refer to differences among the groups, it is the groups of C.A.F.E. Practices participants and non-participants we refer to. Some analysis is made comparing current conditions to conditions five years prior to the study. In these cases, results are also divided by participant and non-participant groups. Results are presented as significant or statistically significant when the results of statistical tests for significance satisfied a threshold for significance of 0.05 (see the Methodology section for more details), and in all cases where we present differences between the groups, this level of significance has been satisfied. Where results are expressed for all respondents, there was not a statistically significant difference between groups.
A total of 501 farms were surveyed, 203 of which were participants in C.A.F.E. Practices, and 298 of which were not. The vast majority of surveyed farms (99%) were small farms (as classified by C.A.F.E. Practices) of fewer than 12 hectares, with the remaining 1 percent representing medium farms of between 12 and 50 hectares. Excluding the medium-sized farms, the average number of productive coffee hectares varied between the groups, with participants producing on a mean of 2.21 hectares (sd= 1.72), compared to 1.64 ha (sd= 1.35) for non-participants. In addition, yield per hectare varied significantly between the two groups. C.A.F.E. Practices participants yielded a mean of 801 kilograms per hectare (sd= 670), compared to 663 kg/ha (sd= 679) for non-participants, a difference of 17 percent. 39 percent of C.A.F.E. Practices participants began participation in the program in 2004, its first year in the region. An additional 35 percent began the following year, and the remaining 26 percent of participants joined after 2005.
Advantages and Disadvantages of Participation:What are the combined advantages and disadvantages of participation in C.A.F.E. Practices? And is participation in the program valuable to producers?
The C.A.F.E. Practices program requires few minimum performance practices be in place on farms and is designed, instead, for continuous improvement. However, some changes, such as ecological pest management, water quality measures, etc., may be technically difficult or costly to put into place. In response, Starbucks encourages producers to improve practices through a variety of methods: by providing direct technical assistance through regional Farmer Support Centers; by providing indirect technical assistance through export companies and cooperatives; and, for those reaching the highest performance level in the program (called Strategic status), by providing a one-time $0.05/lb premium for coffees purchased. This section explores the financial impacts (both positive and negative) of participation, as well as non-financial costs and benefits such as access to additional markets, improved sustainability and increased stability.
Key Findings
Differences observed between groups: No differences observed between groups:
• More participants accessed additional premium markets by participating in other certification programs than non-participants, and most began participating in C.A.F.E. Practices first.
• Where credit was sought, participants were able to access lower rates of credit.
• Need for credit.
• Access to government assistance programs.
• Price received for product.
Additional findings:
• Most participants did not have difficulty meeting the program’s requirements. Those who did cited economic hurdles and lack of training as reasons for these difficulties.
• Most participants’ expectations of the program had been fulfilled and most found the program to be beneficial.
• Price paid for product varied by buyer.

SEPTEMBER 2011 | COLOMBIA FIELD SURVEY REPORT | 16
Detailed Findings
More participants participated in additional certification programs, though non-participants also participated in these programs.A significantly greater proportion of C.A.F.E. Practices participants also participated in another certification/verification program (49%) than the control group who only had 33 percent of farmers certified by another program. Respondents reported participating in Rainforest Alliance (RA) (9.1% of participants and 2.6% of non-participants) and Nespresso AAA program (42% of participants and 31% of non-participants). See Table 2. No respondents reported participating in Fair Trade (FLO) or organic certification programs. Most respondents reported beginning participation in Rainforest Alliance in 2010 or 2008 and Nespresso in 2008, 2007 or 2009. Nearly all C.A.F.E. Practices participants began participating in C.A.F.E. Practices before participating in other programs.
TABLE 2 | Participation in other certification/verification programs, by group.
Group yes no
Participants 49% 51%
Non-participants 33% 67%
Group RA Nespresso AAA FLO Organic
Participants 9.1% 42% - -
Non-participants 2.6% 31% - -
One expert corroborated these findings, asserting that C.A.F.E. Practices and Nespresso AAA program were the most popular certification/verification programs in Nariño. Another expert expressed a belief that these initiatives are paving the way for other certification/verification programs, such as Rainforest Alliance, that are becoming more popular in the area.
Few respondents received direct government benefits or participated in government programs.A minority of respondents (26%) accessed government benefits or programs. The most common benefit respondents accessed was education, while some also reported participating in an environmental program.
One expert’s perspective was that the Nariño area had been abandoned by the federal government in past years due to social unrest in the region. However, it was asserted that in recent years, with the recognition of Nariño coffee quality, the federal government had begun to return to the region and regional governments had begun to provide assistance to support the consolidation of coffee enterprises and the improvement of coffee production and quality, as well to promote the Nariño origin in the international market. In addition, local organizations and governments had partnered to create the “Nariño Coffee Alliance” to support coffee producers and all levels of the value chain, and to develop public policies supporting coffee as the main enterprise for Nariño.36
Many participants reported that they did not have difficulty meeting the best practices outlined in the program. Those who did have difficulty cited either a lack of training or economic challenges as the cause.Most participants (85%) reported that they do not have any difficulty applying the social best practices outlined in the program. Among the 15 percent who do face challenges, the most commonly cited causes were: lack of training (21%, n= 6), economic difficulties (21%, n= 6), lack of support and technical advice (14%, n= 4), and lack of knowledge about the program (14%, n= 4). Only 15 percent of participants reported having difficulty meeting the environmental best practices outlined in the program. Among these, the most commonly cited causes were: lack of technical assistance and support (38%, n= 12) and economic difficulties (16%, n= 5). 23 percent of the participants reported that they have difficulty meeting the quality requirements outlined in the program. Among these, the most commonly cited reasons were: lack of support and technical advice (20%, n= 9); drying requirements (18%, n= 8); the increased cost of production (11%, n= 5); and general economic factors (11%, n= 5).
Most participants found the program to be beneficial and fulfilling their expectations.The majority of participants considered the C.A.F.E. Practices “beneficial” (45%) or “somewhat beneficial” (29%). 15 percent considered the program “very beneficial,” and 8.4 percent did not consider it to be beneficial. Among those who specified benefits (n= 198), the greatest number (37%) reported receiving farm and production infrastructure grants, while 20% reported receiving technical assistance and training. 22 percent said they received minor benefits. The majority or participants (53%) did not identify any disadvantages of the program, but 31 percent said there was a lack of follow-up related to training, and 7.1 percent said they did not receive any aid — technical or financial.
The most common motivations for joining the program were: grants for infrastructure improvements (30%), better market conditions (20%), and better price and aid for infrastructure (18%). Other motivations included access to training and consulting and a general
36 Expert interview.

SEPTEMBER 2011 | COLOMBIA FIELD SURVEY REPORT | 17
benefit of being associated with a verification program. The majority of participants said their expectations for the program had been “well fulfilled” (43%) or “somewhat fulfilled” (40%). 17 percent reported that their expectations had not been fulfilled.
Expert interviews explained and reinforced these findings. In 2004, Starbucks and the Dutch Government partnered with Empresas de Nariño to provide grants and equipment for processing infrastructure improvements. Although this program was not related to participation in C.A.F.E. Practices, many respondents did not distinguish well between C.A.F.E. Practices, Empresas de Nariño and Starbucks, and so — for some — the perception may have been that these grants were part of the C.A.F.E. Practices program. The experts’ perspective was that the benefits that the coffee producers gain by participating in a program like C.A.F.E. Practices are evident and can be observed over the years in changes in the way producers are motivated to improve, as well as in the reasons they were able to achieve different goals related to yield, soil quality and their improvement in their living conditions. They reported that this is even more evident with a producer who is a first-time participant in a program, because s/he is able to learn more from the first program, which the expert asserted is the case for the Nariño producers with C.A.F.E. Practices.37
There was no significant difference in price received for product among participant and non-participant farmers.Although there was some difference in the average price paid by different buyers in the region, the price received by participants and non-participants was not significantly different. Empresas de Nariño paid an average of 1.6 percent more per kilogram than the cooperatives, and an average of 11 percent more than other purchasers in the area, but this is regardless of whether or not the coffee comes from farms implementing C.A.F.E. Practices or not.38
Changes in Farm ManagementHow has farm management changed among participants since beginning participation in the program?
C.A.F.E. Practices encourages efficient use of resources and inputs, and compliance with these C.A.F.E. Practices indicators requires skilled farm management. Through evaluation against these indicators, work with Starbucks’ agronomists and work with cooperatives, farm management may improve through participation in the program.
Key Findings
Differences observed between groups: No differences observed between groups:
• More participants took part in training and changed management techniques as a result of training.
• Participants increased overall investment in the farm.
• More participants provided training for workers.
• Participants may have derived more value from cooperative membership, such as access to credit and farm supplies.
• Prioritization of financial investment.
• Membership in cooperatives.
Detailed Findings
More C.A.F.E. Practices participants participated in training and changed management techniques as a result of training.About twice as many participants attended farm management training in the past year (70% of participants, compared to 35% of non-participants). A greater proportion of C.A.F.E. Practices participants reported that they changed the way in which they manage their farms as a result of training (78% of participants, compared to 48% of non-participants).
More participants increased investment in more aspects of coffee production than non-participants.Most respondents increased their investment in coffee productivity over the past five years, though a greater number of participants reported investing more than previously (62% of participants increased investment, compared to 55% of non-participants). A higher number of participants also reported investing more in increasing coffee quality (68%, compared to 57% of non-participants). Significantly more non-participants reported no investment in erosion control (23%, compared to 11% of participants). Excluding those who did not invest in erosion control, most respondents invested the same in erosion control with some respondents from both groups investing more and some less. Significantly more non-participants reported making no investment in improving water
37 Expert interview.38 Because pricing terms are proprietary, we have removed these specific figures from this report.

SEPTEMBER 2011 | COLOMBIA FIELD SURVEY REPORT | 18
quality (22% of non-participants, compared to 10% of participants). More C.A.F.E. Practices participants reported investing more in improving water quality (15%, compared to 11% of non-participants), but some also reported investing less. Significantly more non-participants also reported no investment in conservation of plants and animals (26%, compared to 10% of participants), while more participants reported investing more (16%) than non-participants (11%). See Table 4.
TABLE 4 | Changes in on-farm investment over 5 years, by group.
Group No investmentChange in investment, over 5 years
Investing less No change Investing more
Productivity
Participants 0.0% 13% 25% 62%
Non-participants 2.7% 15% 30% 55%
Coffee quality
Participants 0.5% 6.4% 25% 68%
Non-participants 2.4% 2.8% 39% 59%
Erosion control
Participants 11% 8.9% 77% 14%
Non-participants 23% 8.5% 78% 13%
Water quality
Participants 10% 7.7% 75% 17%
Non-participants 22% 7.0% 79% 14%
Conservation
Participants 10% 7.2% 75% 18%
Non-participants 26% 7.7% 78% 14%
Most respondents said the reason they increased investment in these areas was increased income (34% across both groups). 21 percent of participants increased investment because of requirements for better quality and opportunities to sell their coffee into a certified market. Most participants (61%) said C.A.F.E. Practices had no role in these changes, but 20 percent said that training contributed to their changes in investment.
More participants conducted trainings for employees in the past year, many of whom did not conduct trainings five years ago.Significantly more participants conducted training for workers sometime in the past year than non-participants (35% of participants, compared to 26% of non-participants). 21 percent of participants said they did not conduct trainings previously, which represents an increase of 14 percent since the program’s inception. Most respondents conducted training related to general crop management (54%). An additional 35 percent trained workers on techniques related to sowing, weeding, harvesting and gathering; and 10 percent of respondents had trainings related to environmental protection.
Similar numbers of respondents belonged to cooperatives, but participants may have derived some additional value out of membership than non-participants.There was no significant difference between groups in membership in cooperatives, with about 25 percent of all respondents belonging to a cooperative. In addition, the most common cooperative to belong to was common among both groups, with 90 percent of both groups belonging to Cooperativa de Caficultura. Length of membership was similar among both groups, with an average tenure of 13.4 years. Few farmers accessed training or capacity building (8.3%); education (4.1%); extension services and technical advice (9.6%); access to machinery or tools (6.3%) or medical services (1.2%) through their cooperatives. However, some farmers accessed financial services (savings and loans), with 16 percent of participants accessing this service, compared to 10 percent of non-participants. In addition, 15 percent of participants reported accessing farm supplies (such as fertilizer) through their cooperative, compared to 9 percent of non-participants. This represents a significant difference in both cases and, given that most respondents belong to the same cooperatives, indicates that participants appear to be accessing more services from the same cooperative.

SEPTEMBER 2011 | COLOMBIA FIELD SURVEY REPORT | 19
Quality of Life and Access to Opportunity:Is there a significant difference in quality of life and access to opportunity between participants and non-participants?
C.A.F.E. Practices aims to improve — directly and indirectly — the quality of life of the suppliers participating in the program.
Key Findings:
Differences observed between groups: No differences observed between groups:
• Participants had higher productivity per hectare, resulting in higher sales and gross income.
• Participants reported greater overall earnings status, relative to the poverty level.
• Participants spent more on food, but this represented a smaller percentage of their overall income.
• Participants consumed beef with more frequency.
• Participants were better educated.
• More participants sent their children to secondary school.
• Participants owned motorbikes and automobiles in greater numbers than non-participants.
• Participants had more sophisticated processing infrastructure and methods.
• Participants had larger farms.
• Primary source of income.
• Degree of diversification of income sources.
• Children attending primary school.
• Daily health.
• Housing and sanitation quality.
• Household assets, aside from motorbikes and automobiles.
• General methods of coffee processing.
• Ownership of and entitlement to land.
Additional findings:
• Methods for financing home improvements varied between groups.
• There were general improvements in working conditions and education over time, but mixed results with medical care over time.
Detailed Findings
Participants had larger farms than non-participants, but there was no difference in ownership.Participating farms were, on average, larger than non-participant farms. The average size of participating farms was 2.7 hectares (sd= 2.4), compared to 2.1 ha (sd= 1.9) for non-participants, a difference of 22 percent. There was no significant difference in the proportion of property that was owned with title (81%), owned without title (18%) or rented (0.8%) among the two groups.
Participants had larger farms, on average, and produced more coffee per hectare, on average, than non-participants.Excluding the medium-sized farms, the average number of productive coffee hectares varied between the groups, with participants producing on a mean of 2.21 hectares (sd= 1.72), compared to 1.64 ha (sd= 1.35) for non-participants, a difference of 26 percent. In addition, yield per hectare varied significantly between the two groups. C.A.F.E. Practices participants yielded a mean of 801 kilograms per hectare (sd= 670), compared to 663 kg/ha (sd= 679) for non-participants, a difference of 17 percent.
Only one third of coffee farmers had diversified sources of income.There was no significant difference between the two groups in diversification of income sources. About 33 percent of both groups had an additional source of income beyond coffee production. This lack of diversification represents a vulnerability among coffee growers in the region, as is evidenced by the current challenges with roya coffee fungus and climatic changes impacting current coffee production. The expert interviews reinforced the coffee producer in Nariño’s commitment to coffee. Experts suggested (and suggested farmers would agree) that farmers know everything about how to cultivate quality coffee. However, climate change (which is bringing different

SEPTEMBER 2011 | COLOMBIA FIELD SURVEY REPORT | 20
rain patterns and too much rain), the lack of fertilization, and resulting increases in cost and decreases in production are creating an economic problem, since coffee is their only income source.39
C.A.F.E. Practices producers reported higher household production, resulting in higher sales and gross income.C.A.F.E. Practices participants reported producing significantly more dry parchment coffee per household than non-participants. Participants produced an average of 1,621 kilograms (sd= 1,688) parchment, compared to 1,060 kg (sd= 1,511) parchment for non-participants — an average difference of 35 percent. This difference in production is likely due to the difference in farm size as well as differences in yield per hectare between the two groups (see above). Both groups reported consuming about 2 percent of this total in their household and selling the remainder.
C.A.F.E. Practices participants reported annual gross household income from coffee sales of nearly 11 million Colombian pesos (about $6,200 US dollars), compared to an average of nearly 7.1 million pesos (about $4,000 US dollars) among non-participants, a difference of 35 percent. In a context with relatively little diversity of income sources, apart from coffee sales, this difference is quite significant.
Participant households earned greater gross household income and perceived themselves to be in better financial standing.When including all sources of household net income, C.A.F.E. Practices participants earned an average of 535,000 pesos (sd= 520,000) per month ($304 US dollars), compared to 423,000 pesos (sd= 306,000) per month ($241 US dollars) for non-participants, a difference of 21 percent. On a per capita basis that distributes household income among all family members, income did not vary significantly, with both groups earning an average of 137,000 pesos (sd= 142,000) per person per month. The national monthly minimum wage for Colombia was 515,600 pesos40 ($293 US dollars) per month in 2010 and these earnings put participant and non-participant households right on the minimum wage line, though on a per capita basis, income is well below the minimum wage line. Compared to the Colombian poverty line in rural areas, which can be estimated at about 204,448 pesos per month ($116 US dollars) in 200941, both participant and non-participant households were living above the national rural poverty level while, again, per capita income was below the rural poverty line.
When asked to estimate their monthly income in comparison to the national legal minimum, the majority of both participants and non-participants estimated that they earn less than the minimum wage in earnings. However, there was a significant difference in distribution of estimated earnings among the two groups, with 59 percent of participants estimating they earn less than the minimum wage, 34 percent estimating they earn between 1-2 times the minimum wage, and 6 percent estimating they earn between 2-4 times the minimum wage. 75 percent of non-participants estimated they earn less than the minimum wage, and 24 percent estimated they earn between 1-2 times the minimum wage. See Table 2.
TABLE 2 | Perceived monthly earnings of participants and non-participants, compared to national minimum wage (SMLV).
Group Less than SMLVBetween 1-2 times
SMLVBetween 2-4 times
SMLFMore than 4 times
SMLVn
Participants 58.62% 34.48% 6.40% 0.49% 203
Non-participants 75.50% 24.16% 0.34% 0.00% 298
Total 344 142 14 1 501
Where credit was sought, participants sometimes had a greater ability to access credit, and were charged lower interest rates than non-participants.Most respondents did not need credit to pay for their activities. In the cases where credit was needed, it was most often for farm supplies, where 39 percent of participants sought credit, compared to 30 percent of non-participants. Participants were more successful in securing credit to meet this need, with 85 percent of participants receiving credit, compared to 73 percent of non-participants. Participants also paid a lower interest rate of 0.92 percent on average, compared to an average rate of 1.3 percent for non-participants. After farm supplies, credit was most frequently sought for home improvement (7.0% of both groups) and farm equipment (5.6% of both groups). Again, for farm equipment loans, participants pay a lower average interest rate of 1.15 percent, compared to 1.9 percent for non-participants. There were no significant differences in the ability of the groups to access credit for these other needs. See Table 3.
39 Expert interview.40 “Aspectos Laborales de Colombia.”41 DANE, 2010.

SEPTEMBER 2011 | COLOMBIA FIELD SURVEY REPORT | 21
TABLE 3 | Credit sought, received, and interest rates, by group.
Group
Farm supplies Farm equipment Home Improvement
Credit needed?
Received? RateCredit
needed?Received? Rate
Credit needed?
Received? Rate
Participants 39% 85% 0.92% 8.9%100%
1.2%7.0% 100% 2.9%
Non-participants 30% 73% 1.3% 3.4% 1.9%
Participants spent more money on food, but a smaller percentage of overall income than non-participants.C.A.F.E. Practices participants reported spending about 13 percent more money on food each month than non-participants, about 270,000 pesos ($151 US dollars) compared to about 235,000 pesos ($132 US dollars). While they spent more overall, this amount represented a smaller relative proportion of overall income: participants spent about 50 percent of their annual income from coffee on food while non-participants spent an average of 55 percent of their annual income on food. Greater spending on food among participants may suggest the purchase of higher quality foods, more food and/or more nutritious foods, or family size may simply be larger; however, detailed questions about food spending were not included in this survey.
Participants consumed beef with more frequency than non-participants.The consumption of beef varied between participants and non-participants. Although a similar proportion of both groups did not eat beef (2.6%) or only ate beef once a week (34.2%) or twice a week (34.8%), there was greater consumption of beef by participants at the more frequent end of the scale, which may represent some of the spending differences explored above. 33.7 percent of participants ate beef three or more times per week, compared to 24.8 percent of non-participants. The majority of respondents (83%) had not changed their beef consumption over the past five years, while 12 percent had decreased their consumption and just 4 percent had increased consumption of beef.
Education level did not differ greatly, but participants had some additional higher-level education.The majority (97%) of heads of household on both participating and non-participating farms had completed basic, primary-level education. 82 percent had completed just primary school, 11 percent had completed secondary school studies and another 4 percent had some graduate-level study. More participants had completed secondary (13% of participants, compared to 10% of non-participants) or graduate studies (5% of participants, compared to 3% of non-participants), a trend that may contribute to their choice to participate in the program.
Participation in primary-level education was nearly universal, but participants sent a greater number of older children and teens to secondary school.Among children and teens living in the household, nearly 95 percent of all young children attended primary school, with no significant difference between participants and non-participants. Primary school is provided by the federal government at no cost. Among older children and teens living in the household, there was a significant difference in participation in education between participants and non-participants: 79 percent of older children and teens on participating farms attended secondary school, while only 69 percent of older children and teens on non-participating farms attended. Secondary school, vocational school and graduate school in Colombia typically require tuition.
From one expert’s perspective, one of the biggest changes over the past 10 years was the level of education in the rural areas. There was now greater access to education in rural areas and programs like C.A.F.E. Practices played a role in reinforcing legal requirements that children attend school, which had a larger transformational effect42. Another expert asserted that these improvements in education in the rural areas had been an integrated effort of the local government, the National Federation of Coffee Growers of Colombia, and the certification and verification programs, stating that each entity played an important role: the government and the Federation built the infrastructure and programs and certification efforts enforced attendance.43
There was no significant difference in daily health between groups. There was no significant difference between the average number of days participants and non-participants were unable to work due to illness. The average across groups was 24 days. There was also no significant difference between the most commonly cited ailments or impediments. The most commonly cited reason for being unable to work among both groups was general illness (42%) as a result of colds, flu and other illnesses.
Housing and sanitation quality did not differ greatly.There was little difference in housing construction or quality. The majority of participants and non-participants had tile or cement floors. There was some variation in use of adobe, brick or natural brick in the construction of walls, but these represent the top three most common materials used. 60 percent of non-participants used brick, compared to 52 percent of participants. There was
42 Expert interview.43 Expert interview.

SEPTEMBER 2011 | COLOMBIA FIELD SURVEY REPORT | 22
some variation in the construction of roofs as well. Asbestos tile, metal roofs and clay tile were the most common materials among both groups.
Sanitation and living conditions were quite similar between the two groups and little had changed over the past five years. More than 97 percent of households had access to water, 97 percent had energy services, and 94 percent of respondents had cellular coverage. 27 percent of households had sewer services and 64 percent had a septic tank. However, nearly 10 percent of respondents did not report access to any type of sewage system.
Respondents financed home improvements differently.About 40 percent of all respondents made some improvements to their homes over the past five years, but the way in which they financed improvements differed between the groups. Among non-participants, the most common financing methods were savings from farming sales (52%), a bank loan (18%) and government aid (11%). Among participants, the most common means of financing improvements were savings from farming income (35%), support from Empresas de Nariño (31%) and support from C.A.F.E. Practices (15.47%). Although respondents were not asked to explain these responses, the support for Empresas de Nariño and C.A.F.E. Practices may here refer again to the Starbucks and Dutch Government assistance program even though this program only supported farm improvements.
Most household assets were common among participants and non-participants, though participants were more likely to own a motorbike or automobile.Household assets were common among both groups as well. 24 percent of households owned a bicycle, fewer than 5 percent of households owned a computer, 41 percent of households owned a refrigerator, while just 3 percent owned a microwave and 7 percent owned a washing machine. Radios, TVs and cellular phones were the most common assets to own, with 89 percent of households owning one or more radio, 94 percent of households owning a TV and 88 percent owning a cellular phone. Just 10 percent owned a sewing machine. There was some difference in ownership of a motorbike or automobile. 44 percent of participants owned a motorbike, compared to 30 percent of non-participants, while 11 percent of participants owned an automobile, compared to just 6 percent of non-participants.
Processing styles did not differ greatly between groups, but more participants used parabolic patios and fewer dried coffee directly on the ground.44
There was little difference in the type of on-farm processing that occurs in the region. Most respondents reported wet processing coffee on their farms (85%) and that they also did so five years ago. In addition, most respondents reported drying coffee on their farm (94%). The most common method was sun drying (94%), though a few respondents also used mechanical drying methods, and this had not changed compared to five years ago. The most common method for drying coffee among both groups was to dry on cement patios (70% for both groups). Beyond patio-drying, there was some difference in the method of sun-drying the coffee between participants and non-participants: 11 percent of participants used parabolic patios45, compared to 5.8 percent of non-participants. The practice of drying directly on the ground was also prevalent, with 18 percent of participants and 24 percent of non-participants using this method. Among those who shifted the way they dry coffee over the past year, participants reported adopting more sophisticated methods in greater numbers than non-participants. Among those participants who used to dry coffee on the ground, 48 percent shifted to cement patios and 5.3 percent shifted to parabolic dryers. An additional 7.8 percent of those who used to dry on cement patios shifted to parabolic dryers. Among non-participants who used to dry coffee on the ground, 35 percent shifted to drying on cement patios, and 4.3 percent shifted to parabolic dryers. An additional 3.7 percent of those who dried on cement patios shifted to parabolic. See Table 5. Participants cited aid and assistance in construction (n= 22) and training on coffee processing (n= 18) as the roles C.A.F.E. Practices has played in these changes.
44 See page 17 for a description of coffee processing techniques typically used in Nariño.45 Parabolic patios are covered with plastic to concentrate the sun’s rays and retain heat from the sun, similar to a greenhouse.

SEPTEMBER 2011 | COLOMBIA FIELD SURVEY REPORT | 23
TABLE 5: Uptake of improved drying methods, by group, over 5 years.
Dried on the ground 5 years ago
Group Shifted to patio drying Shifted to parabolic drying
Participants 48% 5.3%
Non-participants 35% 4.3%
Dried on patios 5 years ago
Group N/A Shifted to parabolic drying
Participants - 7.8%
Non-participants - 3.7%
Participants reported owning more sophisticated processing equipment and infrastructure than non-participants and had acquired more sophisticated equipment and infrastructure in greater numbers than non-participants over the past five years.46
See Table 6 for tabular results. Although there was no significant difference among groups in owning a wet milling facility five years ago (23% of all respondents had one), currently there were significantly more participants that reported owning a wet milling facility than non-participants (51%, compared to 29%). 36 percent of participants who did not have a facility five years ago now had one, while just 10 percent of non-participants who did not have one five years ago had one currently. Traditional wet milling facilities were the most common (34% of respondents had such facilities). Although few respondents currently owned an ecological wet milling machine, the proportion of those who did was higher among participants (9%) than non-participants (3%) and more participants had acquired one over the past five years with 7.5 percent of participants who did not have one previously acquiring one over the past five years compared to 1.7 percent of non-participants. Very few respondents owned a demucilager (1.8%). More participants currently owned a coffee cherry hopper (37%) than non-participants (19%), and more participants who did not have one five years ago had acquired one over the past five years (21% compared to 10%). Ownership of a pulper machine was common among both groups (86%) and was common five years ago (76%). Significantly more participants owned a pulper motor (60%) than non-participants (39%), and more of those participants who did not own one five years ago had acquired one (34%) compared to non-participants (15%) who did not own a motor five years ago.
Although ownership of plastic fermentation tanks was fairly uncommon among both groups, more participants (35%) owned them than non-participants (18%), and more participants who did not own them five years ago had acquired them (28%) than non-participants (15%). Traditional tanks remained more common among both groups, with 46 percent of all respondents owning them currently, and 41 percent owning them five years ago.
Ownership of a greenhouse or parabolic unit to dry coffee after fruit removal was more common among participants (24%) than non-participants (8.1%), and more participants who did not own one five years ago had acquired one than non-participants (18%, compared to 5.2%). Five years ago, a concrete patio for drying coffee was the most common infrastructure (45% had one) and uptake has increased, so it remained the most common drying infrastructure. However, more participants who did not have one five years ago had built one (51%) than non-participants (32%), and it was currently more common among participants (68%) than non-participants (58%).
On-farm mechanical coffee drying equipment was uncommon among both groups and was also uncommon five years ago, though more participants had acquired this equipment than non-participants. 4.6 percent of participants who did not own a dryer five years ago had acquired one, for a total of 6.9 percent of participants owning a mechanical dryer with silos. Just 1 percent of non-participants who did not have a dryer five years ago acquired one, for a total of 3 percent of non-participants owning mechanical dryers with silos. Adding drying capacity may have a positive impact on coffee quality and, although the uptake of such equipment is slow, the rate of uptake was faster among participants.
Residual water treatment facilities were also uncommon among both groups (1.6%) five years ago, and remained uncommon. However, there has been greater uptake of water treatment facilities on participating farms, with 6.1 percent of participants who did not have water treatment plants five years ago building them, compared to less than 1 percent of non-participants.
46 See page 17 for a description of coffee processing techniques typically used in Nariño.

SEPTEMBER 2011 | COLOMBIA FIELD SURVEY REPORT | 24
TABLE 6: Ownership of on-farm processing infrastructure, by group, and uptake of infrastructure over past 5 years.
Group Currently own% uptake among those who did not have one 5
years ago
Fruit removal equipment
Wet milling facility
Participants 51% 36%
Non-participants 29% 9.9%
Ecological wet milling facility
Participants 9% 7.5%
Non-participants 3% 1.7%
Cherry hopper
Participants 37% 21%
Non-participants 19% 10%
Pulper motor
Participants 60% 34%
Non-participants 39% 15%
Plastic fermentation tanks
Participants 35% 28%
Non-participants 18% 15%
Residual water treatment
Participants 7.9% 6.1%
Non-participants 1.3% 1.0%
Drying equipment
Greenhouse/parabolic dryer
Participants 24% 18%
Non-participants 8.1% 5.2%
Concrete drying patio
Participants 68% 51%
Non-participants 58% 32%
Mechanical dryer
Participants 6.9% 4.6%
Non-participants 3.0% 1.0%
Expert interviews revealed that as part of Empresas de Nariño’s work with C.A.F.E. Practices, there have been efforts to improve the infrastructure and implement new technologies. Participants have had access to support for adapting or implementing a parabolic dryer to bring a difference in the quality of their coffee.47 However, as is evidenced by findings above, ownership of infrastructure may not mean it is used: although 24 percent of participants and 8.1 percent reported that they own a parabolic drying unit, just 11 percent of participants and 5.8 percent of non-participants reported using parabolic units to dry coffee.
Agrochemical storage was uncommon, but more participants had constructed storage facilities for agrochemicals.Storage for agrochemicals was uncommon among both groups five years ago (just 7.8% had storage) and it remained uncommon, but there had been greater construction of storage facilities on participant farms than non-participant farms, with 12 percent of participants who did not have storage facilities five years ago adding them, compared to just 3.2 percent of non-participants. Still, the total use of storage facilities remained low, with just 20 percent of participating farms storing chemicals and just 8.7 percent of non-participants.
47 Expert interview.

SEPTEMBER 2011 | COLOMBIA FIELD SURVEY REPORT | 25
There were more improvements in general working conditions and education than declines. Medical care seemed to be problematic, with an equal number seeing improved care as declining care.There were some changes in conditions on the farm, and perception of these changes was common among participants and non-participants. 30 percent of respondents reported that working conditions for the farmer and the family had improved, while 7.9 percent reported these conditions declined. 17 percent reported that the education of farmers and workers had improved, while 8.9 percent said it had declined. 13 percent reported improvements in medical care for workers and their families, while 13 percent also said care had declined.
Environmental Health and QualityIs there a significant difference in environmental health/quality between participant and non-participant farms?C.A.F.E. Practices operates in some regions where comprehensive environmental regulations are not in place. In response, C.A.F.E. Practices includes a number of indicators that establish expectations and better practices for environmental management, protection, restoration and long-term sustainability of natural resources.
Key Findings:
Differences observed between groups: No differences observed between groups:
• Soil quality was more stable over time on participant farms.
• More participants took up use of protective equipment in application of agrochemicals, but overall use was low.
• Participants made more progress addressing erosion issues.
• More participants reported having planted shade trees in the last year.
• There was greater diversity in the shade canopies of participant farms.
• More participants maintained uncultivated areas on farms.
• The extent of natural habitat around participant farms was more stable, with fewer losses and more increases.
• Participants made greater gains in improving organic and inorganic waste management practices as well as wastewater treatment.
• Size of uncultivated areas.
• Change in density of shade cover.
• Use of agrochemicals, frequency of applications, or in the change in use over time.
• Water consumption for processing
Additional findings:
• Most respondents in both groups reported declining soil quality.
• There was some awareness of water quality issues, but little had been done to address these issues and little had changed over time.
• Overall decline in frequency of sighting of some species.
Detailed Findings:
There was a greater awareness of water quality issues among participants, but little was done by either group to address root causes.More participants perceived issues with water quality (46%) than non-participants (23%) and also perceived that these issues existed five years ago. The issues cited as causing issues five years ago were pollution and lack of treatment (68% of participants and 62% of non-participants). In addition, participants cited damage to water systems and lack of service (17%), and non-participants cited difficulty of access and misuse of water resources. Today, most participants (57%) cited a lack of treatment (57%) as the cause of water quality issues, while non-participants cited contamination (33%) as the leading cause. The majority of respondents (59%) across both groups were not taking any steps to remedy water quality issues, however, some treated their

SEPTEMBER 2011 | COLOMBIA FIELD SURVEY REPORT | 26
water (24%), and some were taking up the issue at the community level (11%). They did not perceive C.A.F.E. Practices as having any role in changes to this issue.
Although many respondents from both groups reported declining soil quality, fewer participants observed this trend, compared to non-participants, and more participants observed improving soil quality. In addition, many participants credited C.A.F.E. Practices training in contributing to improvements.When asked about changes in soil quality over the past five years, the most common response among both groups was that soil quality had declined. However, significantly fewer participants observed this trend (36%) compared to non-participants (44%), and significantly more participants reported an increase in soil quality (29%) compared to non-participants (19%). A small number even reported significant improvements in soil quality (2.0% of participants, compared to 0.3% of non-participants). When asked what had led to the changes, those who saw declines cited inappropriate practices on soil and crops (61% of participants [n= 46] and 46% of non-participants [n= 60]) and excessive use of agrochemicals, which was more commonly cited by non-participants (34%, n= 44), compared to participants (18%, n= 14). Among those who saw improvements in soil quality, 85 percent of both groups (n= 105) cited better land and soil use practices. 19 percent of participants (n= 26) credited C.A.F.E. Practices with contributing to positive change in soil quality through trainings on soil conservation and management. See Table 7.
TABLE 7 | Change in soil quality compared to five years ago, by group.
Group Decline No change ImprovementSignificant
improvement
Participants 36% 33% 29% 2.0%
Non-participants 44% 37% 19% 0.34%
Participants had made greater progress in addressing issues related to erosion than non-participants. Nearly a third of participants credited C.A.F.E. Practices-related training in playing a role.Currently, there was little difference in perception of erosion problems, with 29 percent of both groups saying they have a problem with erosion. However, there was a significant difference in perceived problems with erosion five years ago, with 33 percent of participants saying they had problems with erosion five years ago and 24 percent of non-participants saying they had problems with erosion five years ago. More participants (10%) had decreased erosion problems, compared to non-participants (6.0%). In addition, fewer participants (6.4%) had developed problems with erosion over the past five years compared to non-participants (11%). See Table 8. Participants cited a combination of man-made and environmental causes: the most commonly cited cause of erosion was extreme climatic conditions (27%, n= 39); followed by lack of vegetation and other soil problems (22%, n= 31); inadequate management of weeding and cleaning (15%, n= 22) and excessive rains (15%, n= 22). There was a significant difference in what steps respondents had taken to mitigate the problem. 39 percent of participants (n= 23) had constructed live barriers and reforested, compared to 27 percent of non-participants (n= 27); 24 percent of participants (n= 14) had improved weeding and cleaning practices, compared to 18 percent of non-participants (n= 15). However, 38 percent of non-participants (n= 32) had taken no steps to mitigate the issue, compared with 24 percent of participants (n= 14). 28 percent of participants (n= 13) said that C.A.F.E. Practices played a role in the shift in erosion issues through training and recommendations on soil management.
TABLE 8 | Changes in erosion issues, by group.
Group Worsened No change Improved
Participants 6.4% 84% 10%
Non-participants 11% 83% 6.0%
There was not a significant difference in the density of shade or changes (positive or negative) in shade density between the groups. However, more respondents reported planting shade over the past year.On average, respondents estimated having an average of 73 shade trees per hectare (sd= 103), with no significant difference between participants and non-participants. Most respondents (48%) said there had been no change in the density of shade over the past five years, while 25 percent said shade density had declined and 25 percent said it had increased. Significantly more participants (43%) reported that they planted shade trees in the past year compared to non-participants (31%). 35 percent (n= 61) of those who planted trees said they did so to improve coffee growing conditions; 28 percent (n= 50) said they planted trees to protect and conserve water sources; and 20 percent (n= 36) said they planted shade trees for food production and sale. 36 percent (n= 31) of participants who planted shade trees credited C.A.F.E. Practices training in technical management of shade influencing their decision to plant.

SEPTEMBER 2011 | COLOMBIA FIELD SURVEY REPORT | 27
Participants had a greater level of diversity in their shade canopies than non-participants. Most respondents selected species that provide consumable fruit, while some prioritized the species’ ability to promote soil health. Participants maintained significantly more varieties of shade (an average of 5.9 species, sd= 2.0) on their farms than non-participants (5.4 species, sd= 2.2). See Table 9. The most common species were plantain (91%), orange (77%) and avocado (71%), all fruit-bearing species that provide food and/or income for farmers. In addition, 92 percent of participants reported having guamo (Inga), a coffee shade tree and common pioneer species, compared to 85 percent of non-participants. In choosing which species to plant or retain, 51 percent of respondents (n= 255) looked for species that provide fruit for consumption. Another 33 percent (n= 164) prioritized those species that help to conserve soil resources. Most respondents (59%) said they did not increase or decrease the variety of species planted on the farm over the past five years, while 22 percent said the number of varieties increased and 17 percent said it decreased.
TABLE 9 | Frequency of unique tree species per household (estimated), by group.
Group 0-4 5-9 10 or more
Participants 22% 74% 4.4%
Non-participants 36% 58% 6.0%
Use of agrochemicals was common and did not vary significantly between groups or over time.There was no significant difference in the rate of use of agrochemicals between participants and non-participants. 41 percent of respondents used herbicides, and most respondents used them one to two times per year. 67 percent of respondents reported no change in the frequency of use, though 16 percent reported an increase in use compared to five years ago. 42 percent of respondents used insecticides, and most used them one to two times per year. 62 percent reported no change in the frequency of use of the past five years, while 20 percent reported an increase. 67 percent of respondents used fungicides, usually one to two times per year. Most respondents reported no change (49%) in use over the past five years, but many (37%) reported an increase. Use of fertilizer was widespread, with 99% of all respondents reporting that they used fertilizers. Most respondents used fertilizers one to two times per year and reported no change (69%) in use over the past five years.
Although use of protective equipment for application of agrochemicals was not a widespread practice, uptake of the practice had increased more among participants.Just 53 percent of respondents used protective equipment when using agrochemicals, with no significant difference between the groups. Use of protective equipment had increased over the past five years, but it had increased more among participants, with 27 percent of participants taking up use of protective equipment compared to 20 percent of non-participants.
More participants maintained uncultivated areas on farms for plant and animal conservation, though the size of these areas did not vary between groups.Significantly more participants (31%) reported that they had some kind of uncultivated areas on their farm that provide natural habitat for plants and animals, compared to non-participants (19%). Among those who had uncultivated areas, the size was consistent between both groups with a mean of 0.61 hectares (se= 0.76). Most respondents (85%) reported no change in the size of uncultivated areas, while 11 percent reported a decline. 48 percent of respondents (n= 38) reported agricultural expansion as the primary reason for declines, while environmental conservation was cited as the primary reason for increases.
Natural habitat was more stable around participant farms, with fewer losses and greater increases than surrounding non-participant farms.Significantly more participants (23%) reported increases in the amount of natural habitat surrounding their farm compared to five years ago, as compared to non-participants (14%). More also reported significant increases (1.5% of participants compared to 0.7% of non-participants). In addition, fewer participants reported declines (15%) in natural habitat, compared to non-participants (26%). The most frequently cited reasons for negative changes were expansion of productive area (15%) and timber felling (16%). 19 percent reported a greater general awareness of conservation issues as a reason for positive changes.
There was overall decline in the frequency of sighting some animal species, compared to five years ago.Respondents reported some changes in the frequency of sighting some species. 78 percent of respondents reported seeing fewer armadillos (Dasypodidae) compared to five years ago, 68 percent reported seeing fewer guan (Penelopinae) (a common bird) and 77 percent reported seeing fewer pacarana (Dinomys branickii) (a common rodent). However, for some species, there was a great deal of inconsistency in changes in the frequency of sightings of animals among farmers, with some reporting more sightings than five years ago, some less, some the same. Because of the variability in responses, this measure may not be a reliable means for monitoring environmental change for some species, including squirrels (Sciuridae), pigeons (Columbidae), parrots (Psittacidae) and sparrows (Passeridae).
SEPTEMBER 2011 | COLOMBIA FIELD SURVEY REPORT | 28
Participants made greater gains in improving management of organic and inorganic waste.There was a significant difference in the way respondents managed different types of waste, especially in the uptake of better management practices. 70 percent of participants composted organic solid waste and 7.9 percent used vermiculture. This represents increases of 30 percent and 3.9 percent, respectively. This compared to 56 percent of non-participants who composted and 5.4 percent who used vermiculture. These amounts represented increases of 15 percent and 3 percent, respectively, for non-participants over the five years. There was not a significant difference in the treatment of inorganic waste — 61 percent recycled it and 21 percent burned it. However, over the five years, the recycling rate was up 31 percent among participants, compared to 17 percent among non-participants; the rate of burning was down 19 percent among participants, compared to just 4 percent for non-participants.
It was not common for respondents to treat used household or processing wastewater, though treatment of wastewater was more common among participants and had increased over time for both groups.There was a significant difference in management of used household water and water used for coffee processing. 11 percent of participants used a water treatment system for household waste, compared to 5.2 percent of non-participants. There was also more significant shift toward use of treatment among participants: less than 3 percent of participants and non-participants had used water treatment systems in the past — an 8 percent increase for participants compared to a 2 percent increase among non-participants.
14 percent of participants used water filtration ponds (14%) or water treatment systems (13%) for the treatment of processing wastewater, compared to 6.9 percent and 8.6 percent, respectively, of respondents. Again, the uptake of water treatment methods was more prevalent among participants than non-participants, especially in the use of water treatment systems and filtration ponds, where 18 percent of participants had taken up these practices compared to 7 percent of non-participants.
Respondents reported that these improvements in waste management were the result of training and technical assistance (24%), environmental conservation efforts (20%) and better waste management systems (12%). 53 percent of participants credited C.A.F.E. Practices training related to waste management as playing a role in these changes.
Water consumed for processing and changes in consumption were common among both groups and was stable or declining.Most respondents reported no change in the volume of water used for processing over the past five years (68%) or a decrease in water use (21%).

SEPTEMBER 2011 | COLOMBIA FIELD SURVEY REPORT | 29
Conclusions and RecommendationsThe results of this field survey of coffee farmers help to draw links between changes in conditions within coffee communities and participation in the C.A.F.E. Practices program. They also help to identify ways in which producers derive value from participation in the program. Overall, the findings of this survey revealed that the program has had a positive impact on communities and the environment, and participants viewed participation as valuable. The most common way in which participants perceived C.A.F.E. Practices as influencing them was through trainings, technical support and capacity building. Assessment of the research questions in light of statistically significant findings leads us to conclude:
Research Question 1:
What are the combined advantages and disadvantages of participation in C.A.F.E. Practices? And is participation in the program valuable to producers?
Assessment against a standard or program can be a complex and confusing process for farmers. Verification within the C.A.F.E. Practices program may have helped to demystify the process, and as a result, opened up opportunities for participants to enter other certification/verification programs and access premium markets. The results showed that C.A.F.E. Practices participants participated in these other programs in greater numbers than non-participants. In addition, there were cases where participants reported that trainings and general capacity building influenced changes in management practices. Participants in C.A.F.E. Practices are generally satisfied with their experience in the program. Most expectations, though modest, had been met and producers did not face undue difficulty in meeting program requirements.
Research Question 2:
How has farm management changed among participants since beginning participation in the program?
Participants were participating in trainings and used what they learned, either directly through trainings or indirectly, to improve some farm management practices, and were doing so in greater numbers than non-participants who received trainings. Participants also trained their own workers and improved the overall capacity of their supply networks in greater numbers than non-participants.
Research Question 3:
Is there a significant difference in quality of life and access to opportunity between participants and non-participants?
There was not a significant difference in the quality of life, as measured by housing and sanitation quality and ownership of assets, between participants and non-participants. However, there were some differences in the sophistication of coffee processing infrastructure and techniques that may contribute to higher yields and greater overall income for participants. This difference in income may be the foundation of greater financial resiliency, though whether this difference was a direct result of participation in the program or other reasons was not explored in this survey. In most cases, participants outstripped non-participants in the rate of uptake of new processing infrastructure and methods. In addition, participants sent teenaged children to secondary school in greater numbers, which may contribute to quality of life improvements over the long term.
Research Question 4:
Is there a significant difference in environmental health/quality between participant and non-participant farms?
There was some difference in environmental practices between participants and non-participants, particularly in the areas of:
• Waste and wastewater management, where participants had made greater improvements;
• Shade canopy diversity, where participants had integrated more diversity into shade canopies; and
• Commitment to conservation, where participants took more steps to support conservation on their farms.
In addition, participants reported greater stability of soil quality, the cornerstone of sustainable agriculture.
Recommendations:
These results also help to highlight areas where the C.A.F.E. Practices program could have greater impact and where resources may be directed to achieve greater results. They also reinforce conclusions in the previous field survey in Guatemala that such results are long-term and it may take a longer timescale and repeated surveying in order for greater impacts to become apparent: in many cases, statistically significant differences appear between groups even where modest changes are reported, but as these gains are extended over a longer timescale, the impacts may become even more evident. In addition, the experience of implementing the survey in Colombia built on that of the first survey in Guatemala and the results highlight challenges to this method of assessment and areas for further development of the survey approach.

SEPTEMBER 2011 | COLOMBIA FIELD SURVEY REPORT | 30
Survey approach:• It is difficult to rely on survey respondents to accurately recall the way conditions existed five years ago and compare
these conditions objectively with current conditions. To accurately compare historical and current conditions, a baseline is needed. This initial set of surveys can serve as a baseline for future surveys and will allow more objective and quantitative assessments of how farms change over time as they continue to participate in C.A.F.E. practices.
• Although we incorporated causality questions into many areas of the survey, these responses varied widely and revealed that the respondents did not always understand these questions as was intended. Although some causal relationships may be derived from this survey, future surveys should continue to focus on methods to establish causal links.
• In a very integrated network of value chains, there are bound to be spillover effects of the program where non-participants access benefits aimed at participants. Although these spillover impacts are considered desirable by Starbucks, they dilute the measurement of results the program has achieved when measured in a controlled sample survey. It may be worthwhile, in future surveys, to consider selecting sample groups that are not proximal to each other in order to decrease the effect of spillover effects on the study, although such efforts may have cost implications.
Increasing impacts:• 78 percent of C.A.F.E. Practices participants who participated in trainings reported that they changed farm management
practices as a result. While this is a large majority — and significantly more than the 40 percent figure for non-participants — the goal would be 100 percent and a gap remains that could be addressed. Further investigation may reveal why the remaining 22 percent did not change practices. Further studies may also explore which types of training were more effective than others.
• 95 percent of respondents send their primary school-aged children to school. However, the law requires 100 percent attendance, so this 5 percent gap represents an area for further investigation and effort to reach the 100 percent requirement.
• Nearly 10 percent of respondents did not report having a sewage system of any kind. This represents an opportunity to significantly improve the livelihood of these farmers, especially in an area where the municipality provides such services.
• Treatment of wastewater is a low priority for respondents. However, uptake of treatment methods was higher among participants than non-participants. Further efforts may be directed at training and infrastructure development for water treatment.
• Drying coffee directly on the ground is a fairly prevalent practice among both groups. Although many participants and non-participants had taken up improved drying methods, this represents an opportunity area for effort that may lead to improved coffee quality.
• Although use of agrochemicals was widespread, proper storage of agricultural chemicals was relatively uncommon on both participant and non-participant farms and just 53 percent of respondents reported using protective equipment when applying agrochemicals. The handling of agrochemicals represents a key opportunity area for improving health and safety on farms.
• Although many respondents (46% of participants and 23% of non-participants) reported that they had water quality issues, just 61 percent of these respondents were taking any steps to remedy these issues. Further efforts could be directed at addressing water quality issues.
• Many respondents reported that soil quality was declining. However, a greater proportion of C.A.F.E. Practices participants saw improvements or significant improvements in soil quality compared to non-participants, indicating a greater uptake of improved soil management techniques on participant farms. Similar results emerged related to erosion trends and management. Further efforts could continue to focus on this management area and might be aimed at sharing such practices more broadly.
Areas for Further Study:
The results of this survey also prompt additional questions that were outside the scope of this study and represent areas for possible future study.
• 8.4 percent of participants did not find participation in the C.A.F.E. Practices program to be beneficial and 17 percent reported that their expectations had not been fulfilled. While these are small constituencies of all participants, further investigation may reveal more detail about what aspects of the program were not working for these individuals.
• Findings related to value and benefits gained from membership to a cooperative may warrant further study. Although the participation rate and tenure of participation were common among both participants and non-participants and most respondents belonged to the same cooperative, there was some difference in the benefits derived from membership, particularly in the areas of loans and access to farm supplies. Neither group reported receiving much support from the
SEPTEMBER 2011 | COLOMBIA FIELD SURVEY REPORT | 31
cooperative, but in the areas where they did receive benefits, C.A.F.E. Practices participants were able to gain better value. Further investigation could explore opportunities for cooperatives to provide more valuable support to members and could also explore what characteristics enabled C.A.F.E. Practices participants to access such benefits in greater numbers.
• Just 33 percent of respondents had another source of income beyond coffee farming and expert interviews reiterated that the region is heavily dependent on coffee production. At the same time, climate change and other factors have made coffee productivity more variable in recent years and this variability may increase as the effects of climate change are further realized. The heavy reliance on coffee production in this region warrants further investigation to determine why farmers are so heavily dependent on the crop and what options and alternatives may exist for producers in the future.
• Participants had more land and higher productivity per hectare. These conditions led to greater overall production and greater income. However, the underlying reasons for larger farms and for higher levels of productivity per hectare were not explored in this study. Further study could investigate these factors in more detail.
• Although credit was not frequently sought by either group, where credit was sought, participants were more successful in being granted credit and received better terms (lower interest rates) than non-participants. Further investigation could explore what makes participants more creditworthy.
• Participants are somewhat better educated than non-participants, though, because of the timeline of C.A.F.E. Practices in the region, the program has not contributed to this result. Further studies could investigate the links between education level of participants and the way they participate in the program — for example, might better-educated participants be more receptive to changing practices?
• Many respondents (31% of participants and 19% of non-participants) reported maintaining some kind of uncultivated area on their farms. However, 11 percent of all respondents reported that some clearance of these areas had occurred over time and 48 percent reported that clearance was for the expansion of agricultural production. In addition, timber felling and agricultural expansion were cited as the most common reasons for clearance around farms. This indicates that clearance for coffee and other agricultural activity remains a risk factor for remaining natural habitat on and around farms. Additional studies may explore these risk factors in more detail.
SEPTEMBER 2011 | COLOMBIA FIELD SURVEY REPORT | 32
References
CitationsAlliance for Zero Extinction, 2005. Alliance for Zero Extinction Report. www.zeroextinction.org
Castillejos, T., Baer, E., & Semroc, B., “Guatemala Field Survey Report,” Conservation International, December 21, 2010. Available online: http://www.conservation.org/campaigns/starbucks/Pages/CAFE_Practices_Results.aspx
Delgado A., Ruiz S., Arévalo L., Castillo G., Viles N. (Eds). 2008. Plan de Acción en Biodiversidad del departamento de Nariño 2006 - 2030- Propuesta Técnica. Corponariño, Gobernación de Nariño - Secretaría de Agricultura, Instituto de Investigación de Recursos Biológicos Alexander von Humboldt, Unidad Administrativa Especial del Sistema de Parques Nacionales Naturales - UAESPNN - Territorial Surandina, Universidad de Nariño, Universidad Mariana y Asociación para el Desarrollo Campesino. Pasto. Available online: http://corponarino.gov.co/expedientes/intervencion/biodiversidad/pabn_1.pdf
El Departamento Administrativo Nacional de Estadística (DANE). “RESULTADOS CIFRAS DE POBREZA, INDIGENCIA Y DESIGUALDAD 2009.” Bogota, Colombia. April, 2010. Available online: http://www.dnp.gov.co/PortalWeb/LinkClick.aspx?fileticket=Crk3ZivixSk%3D&tabid=337
Hudson, Rex A., ed., Colombia: a country study, 5th edition. Federal Research Division, Library of Congress, 2010.
Perfecto, I., Rice, RA, Greenberg, R. and Van der Voort, ME: 1996,’Shade coffee: a disappearing refuge for biodiversity’, BioScience 46(8), 598–608.
Semroc, B., Baer, E., “Assessment of the Coffee and Farmer Equity (C.A.F.E.) Practices Program for FY08,” Conservation International, March, 2011. Available online: http://www.conservation.org/campaigns/starbucks/Pages/CAFE_Practices_Results.aspx
WebsitesAlliance for Zero Extinction (AZE). “Criteria to Identify Priority.” Retrieved January 17, 2011 from http://www.zeroextinction.org/
Alliance for Zero Extinction. “Pinpointing and Preventing Imminent Extinction.” Retrieved May 10, 2011 from: http://www.zeroextinction.org/AZE_report.pdf
BirdLife International. “Important Bird Areas factsheet: Santuario de Fauna y Flora Galeras,” 2011. Retrieved March 04, 2011 from: http://www.birdlife.org
BusinessCol.com. “Aspectos Laborales de Colombia.” Retrieved September 12, 2011. http://www.businesscol.com/empresarial/tributarios/salario_minimo.htm
Instituto de Investigación de Recursos Biológicos Alexander von Humboldt Colombia . “Colombia en el Mundo.” Retrieved February 24, 2011, from: http://www.humboldt.org.co/iavh/component/k2/item/129-colombia-en-el-mundo
International Coffee Organization. “Monthly Coffee Market Report April 2011,” Retrieved May 10, 2011 from: http://www.ico.org/show_news.asp?id=241
International Union for Conservation of Nature (IUCN). “Key Biodiversity Areas,” Last modified January 11, 2010. Retrieved January 13, 2011, from: http://www.iucn.org/about/union/secretariat/offices/iucnmed/iucn_med_programme/species/key_biodiversity_areas
International Union for Conservation of Nature (IUCN). “Red List of Threatened Species.” Last modified 2009. Retrieved February 17, 2011. http://www.iucnredlist.org/
International Union for Conservation of Nature and UN Environmental Programme (UNEP-WCMC). “World Database on Protected Areas.” 2009. Retrieved January 17, 2011 from http://www.wdpa.org/

SEPTEMBER 2011 | COLOMBIA FIELD SURVEY REPORT | 33
National Federation of Coffee Growers of Colombia. “Coffee in the Colombian Economy, Manuel Santos,” Final Inform Coffee Commission, September 2002. Retrieved January 13, 2011, from: http://www.federaciondecafeteros.org/static/files/3.comisionajusteinstcafet.pdf
National Federation of Coffee Growers of Colombia. “National Federation of Coffee Growers of Colombia,” 2011. Retrieved January 5, 2011 from: http://www.federaciondecafeteros.org
National Federation of Coffee Growers of Colombia. “Producción y Exportaciones de café de Colombia,” (Table: Coffee Exportation April 2010-March 2011). Retrieved March 1, 2011 from: http://www.federaciondecafeteros.org/particulares/es/quienes_somos/119_estadisticas_historicas/
Sistema de información sobre biodiversidad en Colombia (SiB). “Biodiversidad en cifras.” Retrieved September 12, 2011. http://www.siac.net.co:8088/web/sib/cifras
The World Bank. “World Bank Data Catalog: Colombia.” Retrieved July 18, 2011, from: http://data.worldbank.org/country/colombia
Interviews Albornoz, Álvaro. Agriculture Director, Nariño Agriculture Department, April 11, 2011.
Calderón, Rodrigo. Strategic Market, National Federation of Coffee Growers of Colombia, April 8, 2011.
Gavilanes, Luis. Commercial Coordinator, Empresas de Nariño, April 7, 2011.
Rebolledo, Jairo. General Manager, Nariño Specialty Coffee Alliance, April 6, 2011.
Restrepo, Marino. Specialty Coffee Markets, EXPOCAFE, April 8, 2011.
Pantoja, Maria Alejandra. Environmental Management, Pasto Municipality, April 14, 2011.
Vásquez, Jorge Enrique. General Manager (trading), Empresas de Nariño, April 8, 2011.

SEPTEMBER 2011 | COLOMBIA FIELD SURVEY REPORT | 34
Appendices
Appendix 1: Field surveyThe full survey is available for download at:http://www.conservation.org/sites/celb/Documents/2011.09.26_Colombia_%20Survey.PDF
Appendix 2: Expert surveyThe full survey is available for download at:http://www.conservation.org/sites/celb/Documents/2011.09.26_Colombia_Experts_Survey.PDF

SEPTEMBER 2011 | COLOMBIA FIELD SURVEY REPORT | 35
Acknowledgments
Survey TeamCIAT
Mark LundyCarolina GonzalezDiana Carolina LoperaSalomón PerezMarta del RioRobert Santiago Andrade
ECONEXOSCarlos EscobarLiliana Mendez
Universidad de NariñoJorge Fernando Navia Estrada
Conservation InternationalFabio ArjonaDorelly EstepaJulián CardonaCelia Harvey
Expert InterviewsEmpresas de Nariño
Jorge Enrique Vásquez, General Manager Luis Fernando Gavilanes, Commercial Coordinator
EXPOCAFEMarino Restrepo, Specialty Coffee Markets
Nariño Specialty Coffee AllianceJairo Rebolledo, General Manager
National Federation of Coffee Growers of ColombiaRodrigo Calderón, Strategic Markets
Agriculture, Pasto Municipality Maria Alejandra Pantoja, Environmental Management
Nariño Department of AgricultureÁlvaro Albornoz, Director of Agriculture