
College Choice in the Philippines - Digital Library/67531/metadc9916/m2/1/high_res_d · College...
240
COLLEGE CHOICE IN THE PHILIPPINES Christine Joy Tan, B.A., B.B.A., TH.M. Dissertation Prepared for the Degree of DOCTOR OF PHILOSOPHY UNIVERSITY OF NORTH TEXAS May 2009 APPROVED: Ron W. Newsom, Major Professor Michael S. Lawson, Minor Professor Patsy Fulton-Calkins, Committee Member Kathleen Whitson, Program Coordinator for Higher Education Jan Holden, Chair of the Department of Counseling and Higher Education Jerry Thomas, Dean of the College of Education Michael Monticino, Interim Dean of the Robert B. Toulouse School of Graduate Studies
Transcript of College Choice in the Philippines - Digital Library/67531/metadc9916/m2/1/high_res_d · College...
COLLEGE CHOICE IN THE PHILIPPINES
Christine Joy Tan, B.A., B.B.A., TH.M.
Dissertation Prepared for the Degree of
DOCTOR OF PHILOSOPHY
UNIVERSITY OF NORTH TEXAS
May 2009
APPROVED:
Ron W. Newsom, Major ProfessorMichael S. Lawson, Minor ProfessorPatsy Fulton-Calkins, Committee MemberKathleen Whitson, Program Coordinator for
Higher EducationJan Holden, Chair of the Department of
Counseling and Higher EducationJerry Thomas, Dean of the College of
EducationMichael Monticino, Interim Dean of the Robert
B. Toulouse School of Graduate Studies
Tan, Christine Joy. College Choice in the Philippines
This descriptive and correlational study examined the applicability of major U.S.
college choice factors to Philippine high school seniors. A sample of 226 students from
a private school in Manila completed the College Choice Survey for High School
Seniors. Cronbach's alpha for the survey composite index was 0.933. The purposes of
this nonexperimental, quantitative study were (1) to describe the relative importance of
major college choice factors (as identified in U.S. research) to Philippine high school
seniors, and (2) to determine whether there were statistically significant differences in
the importance ascribed to these factors, according to students’ demographic attributes.
. Doctor of Philosophy
(Higher Education), May 2009, 226 pp., 33 tables, 4 figures, references, 109 titles.
For all statistical analyses, SPSS 16.0 software was used. To address the first
purpose, the mean and standard deviation were calculated for each college choice
factor addressed in the survey. To address the second purpose, ANOVAs, Mann-
Whitney U tests, and Kruskal-Wallis tests were run, in order to study the relationship
between each of the major college choice factors and students’ demographic attributes.
This study found that all of the major U.S. college choice factors were important,
to some degree, in the Philippine context. Other factors were added based on pilot
studies. This study also found that some of the U.S.-literature-generated demographic
choice attributes functioned similarly in the Philippine setting (e.g. academic ability,
gender), while others did not (e.g. educational level of fathers and of mothers).
Moreover, students’ academic ability was the primary demographic attribute, accounting
for statistically significant differences in assessment of the importance of college choice
factors for most (12 out of 13) of the factors.
The major U.S. college choice factors appear to be important to Philippine private
high school students. Two choice attributes (academic ability, gender) appear to apply
to private high school students in the Philippines, while the attributes of father's and
mother's education levels do not appear to apply. Among Philippine private high school
students, academic ability may account for differences in assessment of the importance
of college choice factors. Using a survey method alone to study college choice is
limiting. Future studies should utilize a variety of methods to collect data and should
involve several schools.

ii
Copyright 2009
by
Christine Joy Tan
iii
ACKNOWLEDGEMENTS
To my Lord and Savior Jesus Christ, I give all glory, honor, and praise!
“Looking unto Jesus the author and finisher of our faith…” (Hebrews 12:2)
I would like to express sincere appreciation to Dr. Ron Newsom, my major
professor, for his wise guidance, graciousness, and patience throughout this
dissertation process. Many thanks to Dr. Michael Lawson and Dr. Patsy Fulton-Calkins
for sharing their excellent insights.
My beloved parents (Dr. and Mrs. Paul Lee Tan) and family have been a
constant source of unconditional love, encouragements, and support.
Special thanks to Dr. and Mrs. James L. Tan, with respective administrators, for
permission and aid in administering the surveys.
My church family and friends have been my “cheerleaders” during this doctoral
marathon. Thanks so much.
iv
TABLE OF CONTENTS
Page
ACKNOWLEDGEMENTS……………………………………………………………………...iii
LIST OF TABLES………………………………………………………………………………..x
LIST OF FIGURES…………………………………………………………………………….xii
Chapter
1. INTRODUCTION……..………………………………………….……………...1
Statement of the Problem……………………………….……………..2
Purposes of the Study…………………………………………………..2
Research Questions…………………………………………………….3
Significance of the Study……………………………………………….5
Definition of Terms………………………………………………………6
Definition of Terms (Relating to Philippine Higher Education)……10
Limitations………………………………………………………………11
Delimitations……………………………………………………………12
Assumptions……………………………………………………………12
2. LITERATURE REVIEW……………………………………………………….13
Introduction……………………………………..………………………13
Proposed Models of College Choice…………...……………………13
Econometric Models of College Choice..……………………14
Status-Attainment Models of College Choice……..………..15
Information-Processing Models of College Choice…...……16
Combined Models of College Choice……………………..…17
Jackson’s Three–Phase Model (1982)………………17
Litten’s Five–Phase Model (1982)…………………...18
Hossler & Gallagher’s Three-Phase Model (1987)...19
Predisposition……………..……………………20
Search…………………….…………………….22
Choice…………………………………………..23
v
Hossler and Gallager (1987) Model asResearch Organizing Framework……………………………24
Factors Influencing College Choice………………………….………24
Student Characteristics……………………………………….26
Academic Ability……………………………………….26
Socioeconomic Status………………………………...29
Race/Ethnicity……..…………………………………...33
High School Environment……………………………..42
Educational Aspirations/Expectations..……………...46
Gender………………………………………………….47
Institutional Characteristics……………………………...……51
Academic Quality………….…………………………..51
Programs of Study……………………………………..54
Cost and Financial Aid………………………………...56
Location…………………………………………………63
Social Atmosphere…………………………………….67
Future Job Opportunities...……………………………69
Religious Emphasis……………………………….…..70
Significant Others…………………………………….…..…....73
Parents…………………………………………….……73
Guidance Counselors…………………………………83
Friends………………………………………….………86
College/University Search Activities: College Marketing.....87
Connection of Factors with Survey………….……………….92
Philippine Higher Education and College Choice Research…...…96
Background…………………………………………...…..……96
The Philippines……………………………………...…96
The Educational System…………..……………….…97
Elementary and Secondary Education…...…97
Post-Secondary Technical andVocational Education……………………….....98
vi
Higher Education in the Philippines: A General Overview...98
Historical Milestones………………………..…………98
Spanish Colonization (1521-1898)…....….… 98
American Period (1898-1946)…..……..….… 99
Post-World War II…………………..…...…...100
1969—Beginning of Regulation……...……..100
1992—Deregulation……………………….....100
The Results of a Laissez-Faire Policy…..…101
The Commission on Higher Education (CHED)…..101
Some Current Aspectsof Philippine Higher Education…………………...…102
Distribution of Institutional Types…….…..…102
Enrollment in Higher Education………….…104
Predominance ofUndergraduate Enrollment…………………..106
Entry Level………………………………….…107
Socioeconomic Statusand College Choice………………………..…108
Scholarships and Other Student AssistancePrograms…………………………...…………109
Commuter Institutions………………………..111
Student Services………………………..……112
Accreditation of Higher Education………….112
Professional Board Examinations….….……113
Lack of Research…………………….………113
Attitudes Towards Higher Education……….………114
Review of College Choice Research in the Philippines.…115
Application of U.S. College Choice Research to the Philippines..117
The Western Impact on Higher Educationin the Philippines…………………………………………..…117
Logic for Applying United States Researchto the Philippine Situation……………………………………120
vii
Findings Relate to Search and Choice Phases…………...………120
Summary………………………………………………………………122
3. RESEARCH METHODOLOGY..………………………………………….. 124
Theoretical Framework………………………………………………124
Research Design……………………………………………….…….125
Procedure for Data Collection………………………………………126
Study Setting………………………………………………………….127
Study Population………………………………………………..……128
Institutional Review Board…………………………………………..129
Survey Instrument……………………………………………………129
Validity and Reliability of the Survey Instrument………………….134
Survey Validity…………………………………..……………134
Survey Reliability………………………………..……………135
Cronbach’s Alpha for Pilot Survey……..…………..136
Cronbach’s Alpha for Final Survey……...………….136
Data Analysis…………………………………………………………137
4. FINDINGS……………………………………………….……………………139
Introduction……………………………………………………………139
Demographic Profile of Students……………………..….…………139
Missing Values in the Data Set……………………………….…….140
Research Questions Addressed……………………………………141
Research Question 1……………………………………...…141
Research Question 2………………………..……….………142
Meeting the Assumptions of ANOVA………………144
Random and Independent Samples…..……144
Normal Distribution ofDependent Variables……………………..….144
Homogeneity of Variance……………………146
Balanced Design…………………..…………147
Effect Sizes Used………………………….…………148
viii
Research Question 2.1………………………………149
Research Question 2.2………………………………161
Research Question 2.3……………………..……….165
Research Question 2.4………………………………165
Research Question 2.5………………………………167
Research Question 2.6……………………….……..168
Research Question 2.7……………………….……..169
Research Question 2.8………………………..…….169
Research Question 2.9…………………………..….171
Research Question 2.10………………………….…171
Additional Findings…………………………………...172
5. SUMMARY OF FINDINGS, DISCUSSION, CONCLUSIONS ANDRECOMMENDATIONS………………………………………………...……173
Summary and Discussion of Findings………………………..……173
Introduction……………………………………………………173
Research Question 1……………………………………...…174
Research Question 2………………………………………...176
Research Question 2.1………………………………176
Research Question 2.2………………………………178
Research Question 2.3………………………………178
Research Question 2.4………………………………180
Research Question 2.5………………………………181
Research Question 2.6………………………………181
Research Question 2.7………………………………182
Research Question 2.8………………………………183
Research Question 2.9………………………………184
Research Question 2.10…………………………….185
Additional Finding………………………………….…185
Conclusions…………………………………………………………...186
Implications……………………………………………………………186
ix
Recommendations…………………………………………………...188
Personal Reflections on Conducting International Research……189
Appendices
A. INSTITUTIONAL REVIEW BOARD APPROVAL LETTER………..…….190
B. INFORMED CONSENT AND STUDENT ASSENT FORMS…….……...192
C. PILOT SURVEY EVALUATION FORM…………………………………....195
D. SURVEY INSTRUMENT…………………………………………………….197
E. INFORMATION TABLES………………...................................................201
F. STUDENT CHARACTERISTICS AND INSTITUTIONAL PRACTICE….207
REFERENCES……………………………………………………………………………….218
x
LIST OF TABLES
Page
1. College Choice Factors and Survey Questions…………………………………….92
2. Distribution of Higher Education Institutions by Sector and Institutional Type,AY 2004-2005………………………………………………………………………...104
3. Enrollment by Sector, Institutional Type and Sex, AY 2004-2005………………106
4. Enrollment by Sector, Institutional Type and Program Level, AY 2004-2005…107
5. Beneficiaries of CHED’s Student Financial Assistance Programs,AY 2004-2005………………………………………………………………………...111
6. College Choice Factors and Survey Questions…………………………………..130
7. College Choice Factors: Mean and Standard Deviation…………………………142
8. Selected College Choice Factors (Dependent Variables):Skewness and Kurtosis……………………………………………………………...145
9. Skewness and Kurtosis: Before and After Data Transformation………………..146
10. Cohen's (1988) benchmarks for effect size magnitudes…………………………149
11. Analysis of Variance for Academic Ability (Honors vs. Non-Honors) andAcademic Quality…………………………………………………………………….150
12. Analysis of Variance for Academic Ability (Honors vs. Non-Honors) andPrograms of Study……………………………………………………………………151
13. Analysis of Variance for Academic Ability (Honors vs. Non-Honors) andCost and Financial Aid……………………………………………………………….152
14. Analysis of Variance for Academic Ability (Honors vs. Non-Honors) andLocation……………………………………………………………………………….153
15. Analysis of Variance for Academic Ability (Honors vs. Non-Honors) andSocial Atmosphere…………………………………………………………………...154
16. Analysis of Variance for Academic Ability (Honors vs. Non-Honors) andParents………………………………………………………………………………...156
17. Analysis of Variance for Academic Ability (Honors vs. Non-Honors) andGuidance Counselors………………………………………………………………..157
xi
18. Analysis of Variance for Academic Ability (Honors vs. Non-Honors) andFriends………………………………………………………………………………...158
19. Analysis of Variance for Academic Ability (Honors vs. Non-Honors) andPastor/Religious Adviser………..…………………………………………………...159
20. Analysis of Variance for Academic Ability (Honors vs. Non-Honors) andCollege Marketing……………………………………………………………………160
21. Analysis of Variance for Academic Ability (Overall High School Average) andSocial Atmosphere…………………………………………………………………...162
22. Analysis of Variance for Academic Ability (Overall High School Average) andReligious Emphasis…………………………………………………………….........163
23. Analysis of Variance for Academic Ability (Overall High School Average) andFriends………………………………………………………………………………...164
24. Analysis of Variance for Academic Ability (Overall High School Average) andPastor/Religious Adviser………………………………………………………….....165
25. Analysis of Variance for Gender and College Marketing………………………...166
26. Analysis of Variance for Educational Aspirations/Expectations andPrograms of Study……………………………………………………………………168
27. Analysis of Variance for Race/Ethnicity and Cost and Financial Aid ………….169
28. Analysis of Variance for Mother's Educational Level and Social Atmosphere...170
29. Responses to Survey Question 42…………………………………………………172
30. Responses to Survey Question 45…………………………………………………172
E.1 Demographic Characteristics of Student Respondents………………………….202
E.2 College Choice Factors (Dependent Variables) and Survey Questions……….204
E.3 Demographic Factors (Independent Variables) and Survey Questions………..206
xii
LIST OF FIGURES
Page
1. Hossler & Gallager’s Three-Phase Model of College Choice (1987)…………….19
2. Predisposition (Phase 1)……………………………………………………………...21
3. Search (Phase 2)………………………………………………………………………22
4. Choice (Phase 3)………………………………………………………………………23
1
CHAPTER 1
INTRODUCTION
The crucial significance of the college choice decision to a person’s life and
future cannot be overstated (Canterbury, 1999, p. 26). According to Boyer (1987), “in
choosing a college, one of life’s major decisions is being made. A lot of time, money,
and effort will be involved. The shape and quality of the student’s life may rest on the
outcome” (p. 287).
Research on college choice has provided additional insights in this area. Yet, as
Liu (2005) and others have observed, “Most of the studies in college choice were
conducted in the United States and other Western countries like Australia . . . and some
European countries” (p. 18). The reality is that research on the college choice of
students in the Philippines is limited. College choice research also has implications for
the recruiting strategies of colleges/universities. Paulsen (1990) writes,
The most important contribution of the micro-level studies of individual student
enrollment behavior is their ability to estimate the effects of student
characteristics, institutional characteristics, and their interactions on the
probability that a student will choose a particular college or noncollege option. . . .
Understanding the probable enrollment effects of institutional characteristics can
help faculty and administrators develop the most appropriate marketing mix of
attractive programs, delivered in appropriate places, at acceptable prices. (pp.
73-74)
2
Statement of the Problem
A major high school in the Philippines had recently launched into the higher
education arena, by starting its own college. The aim was to recruit half of its college
students from its high school base. As competition from area colleges/universities was
stiff, administrators of the fledgling college needed an understanding of what their high
school seniors were looking for in terms of higher education institutions. Unfortunately,
research focused on the college choice of students in the Philippines was limited. A
better understanding of how high school seniors evaluated the relative importance of
major college choice factors would aid this college in recruiting students from its high
school base.
Purposes of the Study
The first purpose of this study was to describe the relative importance of major
college choice factors (as identified in United States research) to high school seniors in
the Philippines, who were in the search and choice phases of their college selection
process. The second purpose was to determine whether there were statistically
significant differences in the relative importance ascribed to these major college choice
factors (i.e. academic quality, college marketing, cost and financial aid, friends,
guidance counselors, future job opportunities, location, parents, pastor/religious adviser,
programs of study, religious emphasis, security, and social atmosphere), according to
demographic attributes of the students (i.e. academic ability, socioeconomic status,
gender, educational aspirations/expectations, race/ethnicity, father’s educational level,
mother’s educational level, religion, and friends/peer influence).
3
Research Questions
The study sought answers to these research questions:
RQ1: How do high school seniors in the Philippines, in the search and choice
phases of their college selection process, evaluate the relative importance of major
college choice factors (as identified in United States research)?
RQ2: Do the relative importance ascribed to these major college choice factors
(i.e. academic quality, college marketing, cost and financial aid, friends, guidance
counselors, future job opportunities, location, parents, pastor/religious adviser,
programs of study, religious emphasis, security, and social atmosphere) vary when the
survey population was disaggregated by students’ demographic attributes (i.e.
academic ability, socioeconomic status, gender, educational aspirations/expectations,
race/ethnicity, father’s educational level, mother’s educational level, religion, and
friends/peer influence)?
RQ2.1: Is there a statistically significant difference in the relative importance
ascribed to these major college choice factors, when the survey population was
disaggregated by students’ academic ability (as distinguished by being in honors versus
non-honors class section)?
RQ2.2: Is there a statistically significant difference in the relative importance
ascribed to these major college choice factors, when the survey population was
disaggregated by students’ academic ability (as seen in overall high school average)?
RQ2.3: Is there a statistically significant difference in the relative importance
ascribed to these major college choice factors, when the survey population was
disaggregated by students’ socioeconomic status?
4
RQ2.4: Is there a statistically significant difference in the relative importance
ascribed to these major college choice factors, when the survey population was
disaggregated by students’ gender?
RQ2.5: Is there a statistically significant difference in the relative importance
ascribed to these major college choice factors, when the survey population was
disaggregated by students’ educational aspirations/expectations?
RQ2.6: Is there a statistically significant difference in the relative importance
ascribed to these major college choice factors, when the survey population was
disaggregated by students’ race/ethnicity?
RQ2.7: Is there a statistically significant difference in the relative importance
ascribed to these major college choice factors, when the survey population was
disaggregated by students’ father’s educational level?
RQ2.8: Is there a statistically significant difference in the relative importance
ascribed to these major college choice factors, when the survey population was
disaggregated by students’ mother’s educational level?
RQ2.9: Is there a statistically significant difference in the relative importance
ascribed to the college choice factor of religious emphasis, when the survey population
was disaggregated by students’ religion?
RQ2.10: Is there a statistically significant difference in the relative importance
ascribed to these major college choice factors, when the survey population was
disaggregated by students’ friends/peer influence?
5
Significance of the Study
This study had significance for several areas. First, the results of this study were
beneficial to students, their parents, and high school counselors and administrators in
providing insights into the college selection process (Rowe, 2002, p. 14). Moreover, the
findings “may provide a useful tool for self-discovery by providing a framework for
assessing appropriate college choices” (Rowe, 2002, p. 14). Second, with the opening
of its own college, AAA High School had launched into higher education. The natural
clientele for the college were graduates of AAA High School. The institution (here
referred to simply as AAA High School) was not identified by name, in order to facilitate
objective critique of the findings. The results of this study should aid the college in
recruiting students, as Paulsen (1990) explains,
The most important contribution of the micro-level studies of individual
student enrollment behavior is their ability to estimate the effects of student
characteristics, institutional characteristics, and their interactions on the
probability that a student will choose a particular college or non-college option.
The enrollment effects of student attributes serve as guidelines for dividing
students into groups possessing characteristics similar to those who most often
enroll at a particular college. This enables institutions to identify the student
markets with the greatest potential enrollment yield for a particular college or
university.
Understanding the probable enrollment effects of institutional
characteristics can help faculty and administrators develop the most appropriate
marketing mix of attractive programs, delivered in appropriate places, at
6
acceptable prices. The probable enrollment effects of interactions between
student and institutional characteristics provide guidelines to help administrators
effectively tailor and target their college’s marketing mix of institutional attributes
according to student characteristics in high enrollment yield markets. (pp. 73-74)
Third, this study contributed to scholarship on college choice in the Philippines,
an area in which little research had been done. Finally, this investigation provided some
insight into the extent to which United States college choice research related to the
Philippine context.
Definition of Terms
Academic ability: In operationalizing this concept, this study considered two
student factors: overall high school grade average and class section (honors vs. non-
honors).
Academic quality: In operationalizing this concept, this study considered the
student’s value judgment of the institution based on his/her perception of the school’s
quality of professors, good academic reputation, quality of major(s) and courses he/she
is interested in, quality of learning resources and facilities (library, computers,
laboratories, etc.), interaction between students and professors, and focus on
undergraduate education.
Choice: The third phase of the Hossler and Gallagher (1987) model, this is the
stage when students decide which university or college they will attend, after evaluating
the institutions in their choice set (p. 209).
Choice set: This is the short list of schools to which students will actually apply
(Hossler & Gallagher, 1987, p. 209).
7
College choice: This is “a complex, multistage process during which an
individual develops aspirations to continue formal education beyond high school,
followed later by a decision to attend a specific college, university or institution of
advanced vocational training” (Hossler, Braxton, & Coopersmith, 1989, p. 234)
College marketing: In operationalizing this concept, this study considered the
student’s rating of the importance of the following information sources in his/her
selection of a college: visits by college admissions officers to the high school, college
literature (catalogs, flyers, brochures, etc.), college website, college DVDs/CD-
ROMs/videos, campus visit, contact with college professors, contact with college
alumni, and contact with college students.
Combined models of college choice: These models incorporate facets of the
economic and sociological models, and may provide more explanatory power than any
single perspective (Hossler, Schmit, & Vesper, 1999, p. 144).
Cost and financial aid: In operationalizing this concept, this study considered the
student’s rating of the importance of the following in his/her selection of a college: costs,
room and board expenses, availability of scholarships/financial aid, availability of
internship/co-op opportunities, and availability of loans.
Econometric models of college choice: The fundamental notion underlying these
models is that students maximize a utility (e.g., high quality, low cost), often using cost-
benefit analysis (Hossler et al., 1999, p. 142).
Educational aspirations/expectations: In operationalizing this concept, this study
considered the highest academic degree the student plans to attain in his/her lifetime.
8
Father’s educational level: In operationalizing this concept, this study considered
the highest level of education achieved by the student’s father/male guardian.
Friends/peer influence: In operationalizing this concept, this study considered
the student’s perception of the importance of his/her friends’ opinions in his/her college
selection. This study also looked into how many of the student’s close friends were
planning to attend college.
Information-processing models of college choice: Another perspective from
which to examine the college selection process (especially the search stage), these
models see through a lens that “makes gathering and processing information in a social
setting an essential part of decision making rather than a prerequisite to it” (Hossler et
al., 1999, pp. 150-151).
Location: In operationalizing this concept, this study considered the student’s
rating of the importance of the following in his/her selection of a college: convenient
driving distance from home and quality of campus residence halls.
Mother’s educational level: In operationalizing this concept, this study
considered the highest level of education achieved by the student’s mother/female
guardian.
Parent: This is a “father or mother or an individual serving as a mentor or guide
for a dependent child” (Thomas, 2003, p. 16). This study explored “the influence that
parents (or guardians) have on their child’s decision to attend one institution rather than
another” (Rowe, 2002, p. 10).
9
Predisposition: The first phase of the Hossler and Gallagher (1987) model, this
is “a developmental phase in which students determine whether or not they would like to
continue their education beyond high school” (p. 209).
Programs of study: In operationalizing this concept, this study considered the
student’s rating of the importance of the following in his/her selection of a college:
variety of majors and courses, and whether the institution offers the major(s) and
courses that he/she wanted.
Religious emphasis: In operationalizing this concept, this study considered the
student’s rating of the importance of a Christian environment in his/her selection of a
college.
Search: The second phase of the Hossler and Gallagher (1987) model, this is
the stage when students who want to continue their education, gather information about
colleges or universities; the outcome is the student’s “choice set” (p. 209).
Social atmosphere: In operationalizing this concept, this study considered the
student’s rating of the importance of the following in his/her selection of a college:
variety of extracurricular activities (clubs, music, theater, etc.), quality of social
life/activities, opportunity to be with his/her friends, and opportunity to interact with
students from different backgrounds.
Socioeconomic status: In operationalizing this concept, this study considered the
approximate annual income of the student’s parents/guardians.
Status-attainment (or sociological) models of college choice: These models
emphasize “how socialization processes, family conditions, interactions with peers, and
10
school environments help shape students’ college choices” (Hossler et al., 1999, p.
144).
Definition of Terms (Relating to Philippine Higher Education)
Baccalaureate: These “generally require four to five years of study. The
Bachelor of Arts (AB) and Bachelor of Science (BS) are the most common
baccalaureates, and both include general education courses, a major and electives”;
these programs usually require at least 180 credits (Higher Education Statistical
Bulletin: Definition of Terms, 2006).
CHED supervised institution: This refers to a “non-chartered public post-
secondary education institution established by law, administered, supervised and
financially supported by the government” (Higher Education Statistical Bulletin:
Definition of Terms, 2006).
Local university and college: This refers to a “public higher education institution
established by the local government through an appropriate resolution/ordinance and
financially supported by the local government concerned” (Higher Education Statistical
Bulletin: Definition of Terms, 2006).
Other government school: This refers to “any public secondary or post-
secondary education institution that offers higher education programs” (Higher
Education Statistical Bulletin: Definition of Terms, 2006).
Pre-baccalaureate: This refers to “college or university parallel programs that are
similar to the first two years of a 4-year college curriculum often referred to as a
Transfer Degree. These programs generally require a minimum of 90 credits” (Higher
Education Statistical Bulletin: Definition of Terms, 2006).
11
Private non-sectarian: This refers to “any private higher education institution duly
incorporated, owned and operated by private entities, which are not affiliated to any
religious organization” (Higher Education Statistical Bulletin: Definition of Terms, 2006).
Private sectarian: This refers to “any private higher education institution, usually
non-stock, non-profit, duly incorporated, owned and operated by a religious
organization” (Higher Education Statistical Bulletin: Definition of Terms, 2006).
Sector: This “refers to Public or Private sector” (Higher Education Statistical
Bulletin: Definition of Terms, 2006).
State university/college: This is “a chartered public higher education institution
established by law, administered, and financially subsidized by the government” (Higher
Education Statistical Bulletin: Definition of Terms, 2006).
Limitations
First, as the demographics of AAA High School’s students did not mirror that of
the nation (e.g. race/ethnicity, socioeconomic status, attendance at a school that is both
Evangelical and strong in math and science), the generalizability of this study’s results
to the entire population of high school seniors in the Philippines was severely limited.
Second, by its very nature, a survey or questionnaire “cannot probe deeply into
respondents’ beliefs, attitudes, and inner experience” (Gall, Gall, & Borg, 2003, p. 222).
The researcher could not follow up on a response to get more information. Third, a
potentially major threat to the internal validity of this study was the influence of
experimenter bias, defined as “researchers’ expectations about the outcomes of their
experiments that are unintentionally transmitted to participants so that their subsequent
behavior is affected” (Gall et al., 2003, pp. 379-380). The survey was administered by
12
various school representatives, including teachers, counselors, and administrators.
Fourth, the credibility of self-reported data was threatened by the presence of social
desirability bias, that is, “the desire to edit a response before communicating it to a
researcher, in order to make the responder look good” (Gonyea, 2005, p. 82). However,
in paper survey administration, the size of this effect is usually small (Gonyea, 2005, p.
82). Moreover, the assurance of confidentiality and anonymity should have helped to
mitigate the effect of this bias. Finally, since the respondents of the initial pilot study
were seniors from one class of AAA High School, there was a possibility that they may
have influenced their schoolmates from other classes, who took the survey later.
Delimitations
First, although the three phases of the Hossler and Gallagher (1987) model—
predisposition, search, choice—provided the organizing framework for the research
results referred to in Chapter 2, testing the entire Hossler and Gallagher model was not
within the purview of this dissertation. Second, this study did not investigate the initial
stage of college choice (predisposition), but focused on the latter phases—search and
choice. Third, students who were absent from school on the day the survey was
administered, or who were not able to submit the consent/assent forms on time, were
not able to take the survey.
Assumptions
An underlying assumption was that students responded honestly and accurately
when completing the survey. Another assumption related to the applicability of the
college choice factors (as surfaced in United States research) to the Philippine situation.
13
CHAPTER 2
LITERATURE REVIEW
Introduction
In this chapter, literature pertaining to the college choice of students is reviewed.
Proposed models of college choice, as well as influential factors, are addressed. As Liu
(2005) and others have observed, “Most of the studies in college choice were
conducted in the United States and other Western countries like Australia . . . and some
European countries” (p. 18). Although some college choice research has been done in
countries such as the United Kingdom (e.g., Anderson, 1999; Brooks, 2005; Dawes &
Brown, 2002; Dawes & Brown, 2004; Hemsley-Brown, 1999; Maringe, 2006; Pugsley,
2004; Smith, 2007), with regards to community colleges (e.g., Absher & Crawford, 1996;
Bers & Galowich, 2002), and with a focus on adult students (e.g., Broekemier, 2002;
Roszkowski & Reilly, 2005), the studies reviewed in this chapter were conducted in the
United States, relate mainly to four-year colleges, and focus on traditional-age students.
Research on the college choice of students in the Philippines is limited. This chapter is
divided into five major sections: (1) proposed models of college choice, (2) factors
influencing college choice, (3) Philippine higher education and college choice research,
(4) logic for applying United States college choice research to the Philippine situation,
and (5) a summary.
Proposed Models of College Choice
College choice is defined as “a complex, multistage process during which an
individual develops aspirations to continue formal education beyond high school,
followed later by a decision to attend a specific college, university or institution of
14
advanced vocational training” (Hossler, Braxton, & Coopersmith, 1989, p. 234). Since
the 1970s, the subject of student college choice has been generating more attention.
On the college and university level, there was increased competition for a decreasing
number of traditional-age students, and research in student college choice was viewed
as a means of creating better marketing strategies (Hossler & Gallagher, 1987, p. 207).
On the state and federal level, interest in college choice was fueled by public policy
issues related to student financial aid and student access (Hossler & Gallagher, 1987,
p. 207).
Proposed models of college choice can be classified into four categories:
(1) econometric models, (2) status-attainment models, (3) information-processing
models, and (4) combined models (Hossler, Schmit, & Vesper, 1999, pp. 141-142). The
combined models of Jackson (1982), Litten (1982), and Hossler and Gallagher (1987)
have been widely used (Hossler et al., 1999, pp. 141-142). These will be briefly
reviewed. Since little study has been done on student college choice in the Philippines,
it is helpful for educational administrators to glean from the scholarly research of the
United States, where investigation into this subject has spanned almost four decades.
Econometric Models of College Choice
The fundamental notion underlying econometric models of college choice is that
students maximize a utility (e.g., high quality, low cost), often using cost-benefit analysis
(Hossler et al., 1999, p. 142). These models make the assumption that, “as students
consider colleges, they can detail the advantages and disadvantages of each, associate
a utility or a value with the attributes of each, make reasonable assumptions about the
15
outcomes of one decision over another, and then choose more or less rationally in order
to maximize benefits and reduce costs” (Hossler et al., 1999, p. 142).
Two main branches of econometric models of college choice exist. The first gives
“equations explaining institutional, statewide, or national enrollments as a function of
characteristics of the population of potential enrollees and of the set of existing schools”
(Fuller, Manski, & Wise, 1983, p. 105). The second explains “the enrollment decision of
an individual student as his revealed preference among the available schooling and
work alternatives” (Fuller et al., 1983, p. 105).
The second branch, which puts the focus on the individual student rather than on
institutions, may be further subdivided into two types of econometric models. One type
centers on the student’s choice between college and non-school alternatives, such as
military service or the workforce (e.g., Manski & Wise, 1983; Fuller et al., 1983). Another
type concentrates on the student’s selection of a particular college from among several
higher education alternatives (Liu, 2005, p. 22).
A major weakness of econometric models relates to the assumption that students
possess perfect (or near-perfect) information and make rational decisions in order to
maximize utilities; however, this is not always the reality (Hossler et al., 1999, p. 144).
Moreover, econometric models fail to address how the college choice process is
influenced by institutions (Espinoza, 2001, p. 23).
Status-Attainment Models of College Choice
Status-attainment (or sociological) models emphasize “how socialization
processes, family conditions, interactions with peers, and school environments help
shape students’ college choices” (Hossler et al., 1999, p. 144). For example, Sewell &
16
Shah (1968) examined the relationships of socioeconomic status, intelligence, and
parental encouragement to the higher education aspirations of students. Sewell, Haller,
& Portes (1969) stressed the social psychological and social structural antecedents of
educational and occupational attainment.
While econometric models assume that students make rational decisions, status-
attainment models have more interaction between variables that measure the traits of
individual students and variables that assess broad social constructs (Hossler et al.,
1999, p. 144). Combined models have the distinct advantage in that “the researcher can
choose variables from either domain and concentrate on the sociological aspect of
college choice as a process while maintaining the decision-making perspective of
economics” (Hossler et al., 1999, pp. 144-145).
Information-Processing Models of College Choice
Information-processing has been suggested as another perspective from which
to examine the college selection process, especially the search stage (Hossler et al.,
1999, p. 150). It is a lens that
makes gathering and processing information in a social setting an essential part
of decision making rather than a prerequisite to it. Taking this perspective means
we must consider aspects of decision-making theory and sociology, especially
social capital and socialization. Information processing, social capital, and
cultural capital together allow us to introduce into the college-choice process
dynamic roles for parents, peers, and schools. (Hossler et al., 1999, pp. 150-151)
17
Combined Models of College Choice
Combined models, which incorporate facets of the economic and sociological
models, may provide more explanatory power than any single perspective (Hossler et
al., 1999, p. 144).
Jackson’s Three–Phase Model (1982)
Jackson’s (1982) model involves three phases: preference, exclusion, and
evaluation. During the preference phase, Jackson (1982) suggests that students’
aspirations develop in line with sociological findings, with the three strongest correlates
of high school students’ aspirations being (in decreasing order of strength): academic
achievement, context, and family background (pp. 239-240).
In the exclusion phase, Jackson utilizes economic theory to maintain that college
decision-making is basically a process of excluding institutions (Hossler et al., 1999, p.
146). He asserts that “students’ choice sets depend on their exclusion criteria, which in
turn depend on their anticipated financial resources and their academic experience”
(Jackson, 1982, p. 240). However, he diverges from econometric models in
acknowledging that students neither possess perfect information nor make rational
decisions. “[T]he limited evidence available suggests that accurate information about
colleges is difficult to come by . . . and that students typically exclude from their choice
set colleges they ought to evaluate” (Jackson, 1982, p. 240).
During the evaluation phase, students assess the remaining options in their
choice set, perhaps implicitly “translat[ing] his or her preferences into a rating scheme,
rat[ing] each option in the choice set, and select[ing] according to these ratings”
(Jackson, 1982, p. 241). In this final phase, Jackson (1982) notes that
18
college costs, job benefits, and (where there is variation within the choice set)
location have the strongest effects, followed closely by the interactions of family
background and academic experience with these variables. College attributes
other than cost have relatively weak effects, as distinct from some of the same
variables’ stronger effects in the exclusion phase. (p. 241)
Rating the relative importance of the various factors in the general model of
student college choice, Jackson (1982) concludes that family background, academic
experience, location, and college costs have strong effects on student choice;
information, college attributes, and job attributes have moderate effects; and social
context has a weak effect (p. 241). Some have pointed out that the models of Jackson
(1982) and Chapman (1984) place undue emphasis on the factors which influence
outcome, while failing to address the actual process of college selection (Merranko,
2005, p. 19). Although Jackson’s model might aid college administrators in putting
together a general enrollment plan, this model does not deal with other variables found
in other models (Merranko, 2005, p. 19).
Litten’s Five-Phase Model (1982)
Litten (1982) suggested a five-phase process: college aspirations, decision to
start process, information gathering, applications, and enrollment (p. 388). His model
recognized a diversity of variables influencing the college selection process of students.
These factors include background (race, income, socioeconomic status, parents’
education, family culture, parents’ personalities, religion, gender), personal attributes
(academic ability, self-image, personal values, benefits sought, personality/lifestyle),
high school attributes (social composition, quality), student’s performance (class rank,
19
curriculum), environment (occupational structure, economic and cultural conditions),
influences/media used (parents, counselors, peers, publications, college officials, other
media), college characteristics (price, size, programs, ambience, control), college
actions, and public policy in the form of financial aid (Litten, 1982, p. 388).
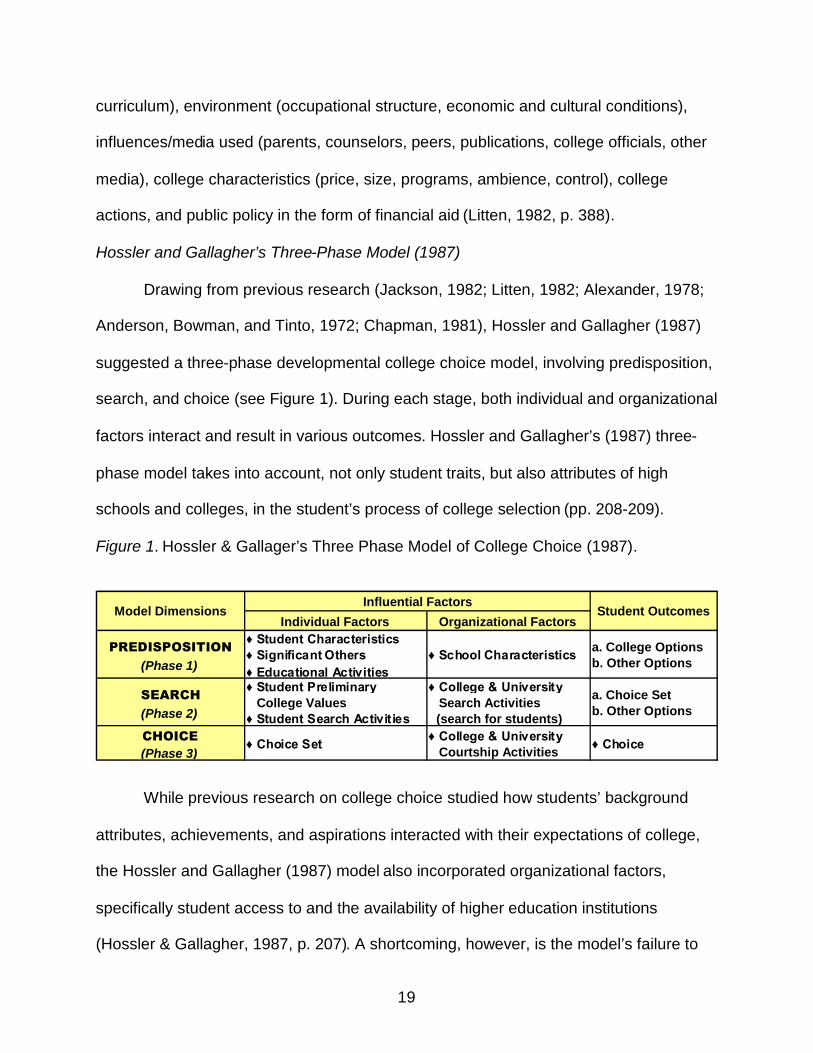
Hossler and Gallagher’s Three-Phase Model (1987)
Drawing from previous research (Jackson, 1982; Litten, 1982; Alexander, 1978;
Anderson, Bowman, and Tinto, 1972; Chapman, 1981), Hossler and Gallagher (1987)
suggested a three-phase developmental college choice model, involving predisposition,
search, and choice (see Figure 1). During each stage, both individual and organizational
factors interact and result in various outcomes. Hossler and Gallagher’s (1987) three-
phase model takes into account, not only student traits, but also attributes of high
schools and colleges, in the student’s process of college selection (pp. 208-209).
Figure 1. Hossler & Gallager’s Three Phase Model of College Choice (1987).
Individual Factors Organizational Factors
PREDISPOSITION(Phase 1)
♦ Student Characteristics♦ Significant Others♦ Educational Activities
♦ School Characteristicsa. College Optionsb. Other Options
SEARCH(Phase 2)
♦ Student PreliminaryCollege Values
♦ Student Search Activities
♦ College & UniversitySearch Activities(search for students)
a. Choice Setb. Other Options
CHOICE(Phase 3)
♦ Choice Set♦ College & University
Courtship Activities♦ Choice
Influential FactorsStudent OutcomesModel Dimensions
While previous research on college choice studied how students’ background
attributes, achievements, and aspirations interacted with their expectations of college,
the Hossler and Gallagher (1987) model also incorporated organizational factors,
specifically student access to and the availability of higher education institutions
(Hossler & Gallagher, 1987, p. 207). A shortcoming, however, is the model’s failure to
20
address how the organizational and individual student factors affect diverse student
populations (Merranko, 2005, p. 25).
Southerland (2006) highlighted another weakness of the Hossler and Gallagher
(1987) model, namely, that “almost all of the research upon which they build their model
is based upon studies of traditional college-bound high school students” (p. 8). Indeed,
today’s student is “increasingly older, returning to school because of work-related
issues, and attending on a part-time basis” (Broekemier, 2002, p. 32). As Hossler,
Schmit, and Vesper (1999) observed,
The model is primarily sociological. Background characteristics are correlated
with the predisposition stage, the point at which students choose to go to college.
These background characteristics are cumulative in terms of their effect upon the
college-choice process, varying only in their level of influence during the several
stages of the process they always operate. (p. 150)
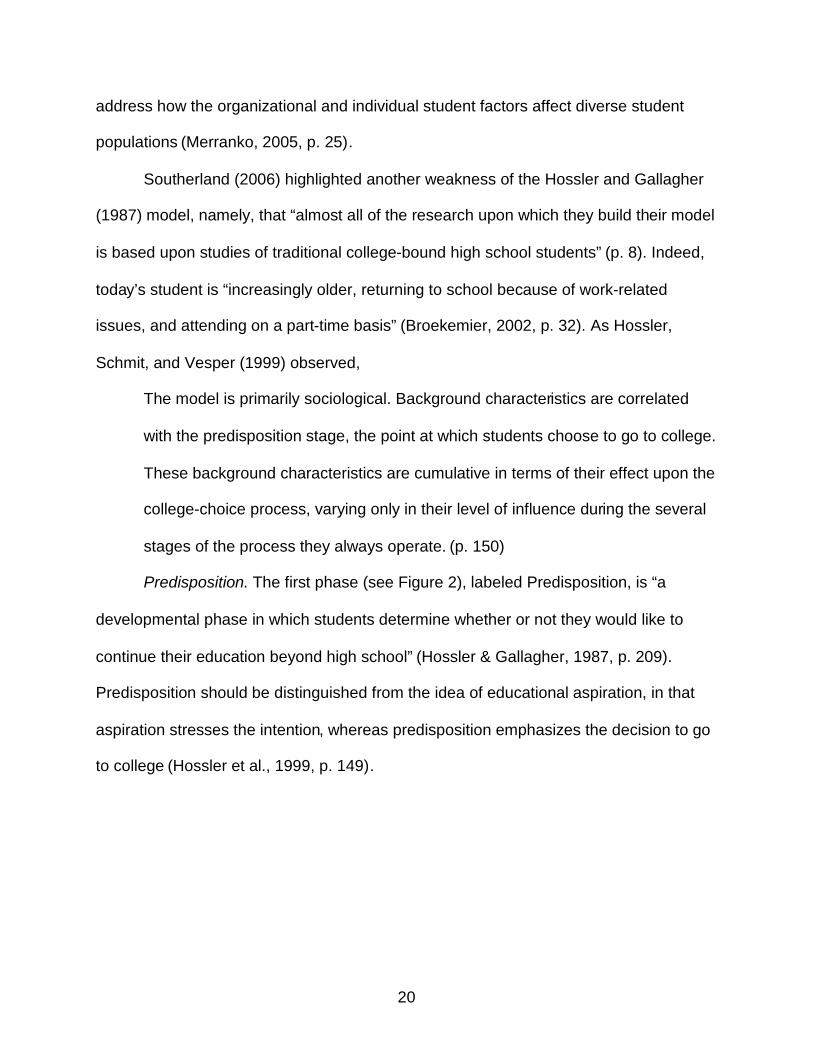
Predisposition. The first phase (see Figure 2), labeled Predisposition, is “a
developmental phase in which students determine whether or not they would like to
continue their education beyond high school” (Hossler & Gallagher, 1987, p. 209).
Predisposition should be distinguished from the idea of educational aspiration, in that
aspiration stresses the intention, whereas predisposition emphasizes the decision to go
to college (Hossler et al., 1999, p. 149).
21
Figure 2. Predisposition (Phase 1) (Adapted from Hossler & Gallager, 1987).
Among the three stages, the Predisposition phase has historically been the least
researched (Hossler & Gallagher, 1987, p. 210). Nevertheless, Hossler and Gallagher
(1987) identified some background attributes that seem to be positively correlated with
attendance in college, and are cumulative in their effects on the college choice of
students (p. 210). These include socioeconomic status, student ability, and the attitudes
of parents and peers (Hossler & Gallagher, 1987, pp. 210-211).
Moreover, they described some organizational factors which interact with student
factors to affect college choice. These include range of pre-college school experiences,
and high school and college attributes (e.g., quality high school curricula, student
proximity to campus, urban/suburban versus rural background of students) (Hossler &
Gallagher, 1987, pp. 211-212). However, these organizational factors are not as
strongly correlated to college attendance as are the background attributes previously
mentioned (Hossler & Gallagher, 1987, p. 211).
Although the experiences molding predisposition are not well understood, it can
be said that prospective college matriculants enter the search phase by some time in
the early years of high school (Hossler & Gallagher, 1987, p. 212). According to
Campaigne and Hossler (1998), “research also suggests that students have typically
formulated their educational aspirations by the 9th or 10th grade” (p. 91).
22
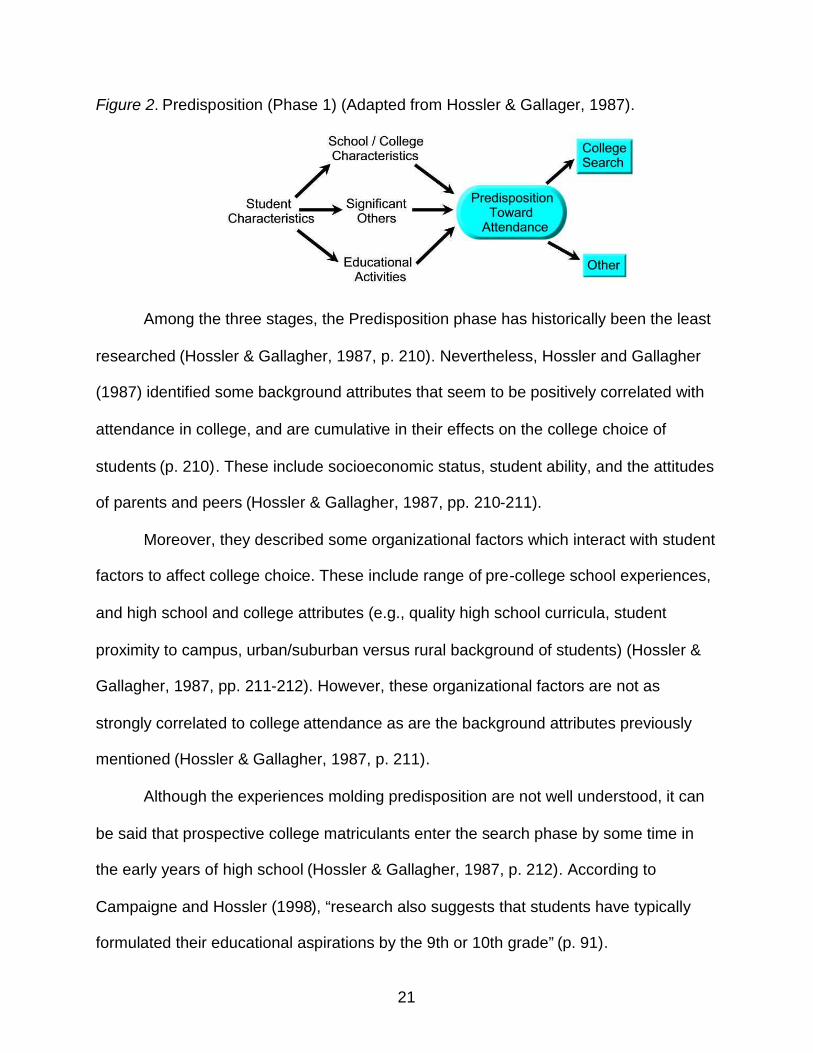
Search. The second phase (see Figure 3), called Search, is the stage when
students who want to continue their education, gather information about colleges or
universities (Hossler & Gallagher, 1987, p. 209). The outcome is the student’s “choice
set,” that is, the short list of schools to which they will actually apply (Hossler &
Gallagher, 1987, p. 209). During the Search stage, there is increased interaction
between students and higher education institutions; in other words, students are
researching institutions at the same time that colleges and universities are looking for
students (Hossler & Gallagher, 1987, p. 213). Moreover, students’ social aspects (such
as ability, socioeconomic status, and parental education) influence the quality of the
searches conducted (Hossler & Gallagher, 1987, pp. 214-215).
Figure 3. Search (Phase 2) (Adapted from Hossler & Gallager, 1987).
Contrary to econometric models, Hossler and Gallagher (1987) make no
assumptions that students have perfect information or even that they make rational
decisions. Rather, they acknowledge that students don’t seem to use information in a
completely rational manner, and posit that lack of accurate information regarding the
true cost of attendance and financial aid may further this problem (Hossler & Gallagher,
23
1987, pp. 214-215). According to Cabrera and La Nasa (2000), “[t]his stage usually
begins during tenth grade and ends by the middle of twelfth grade” (p. 9).
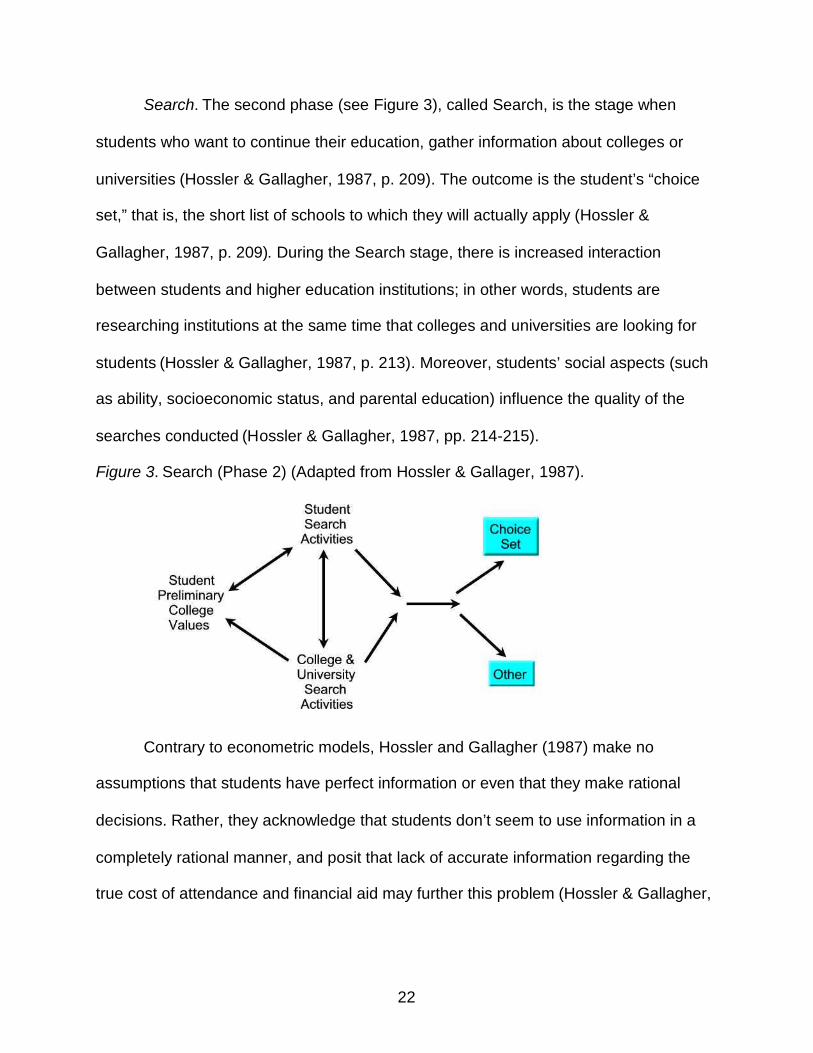
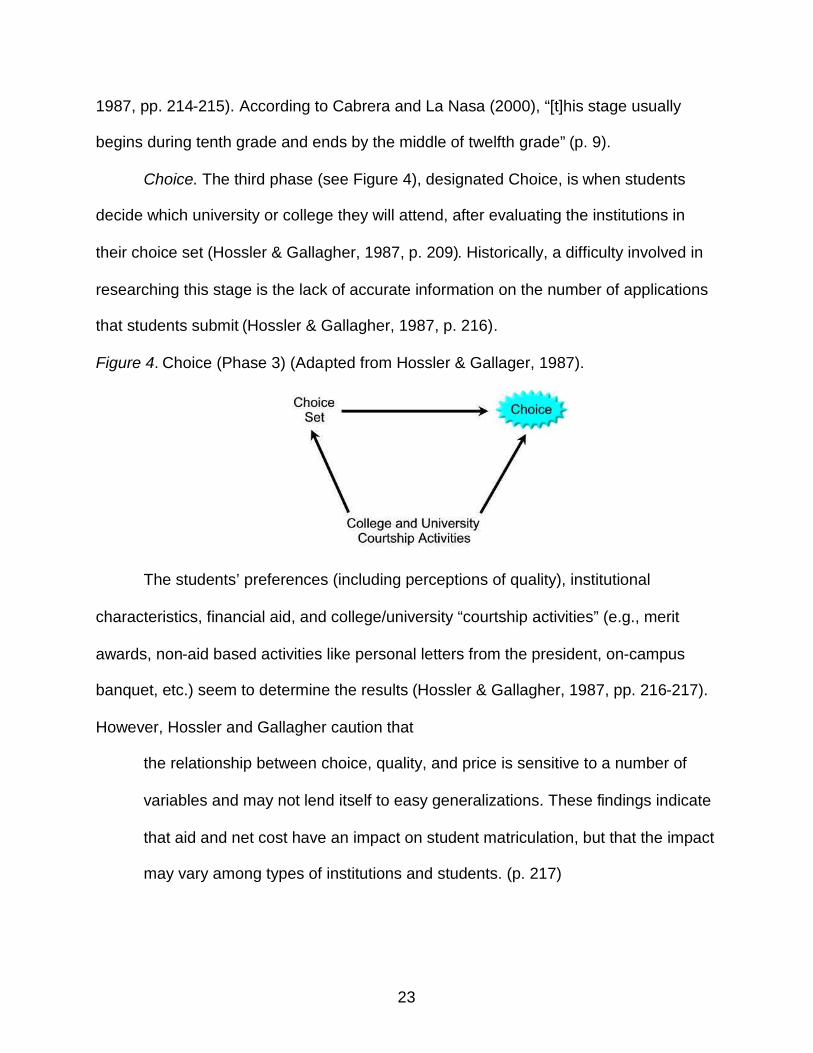
Choice. The third phase (see Figure 4), designated Choice, is when students
decide which university or college they will attend, after evaluating the institutions in
their choice set (Hossler & Gallagher, 1987, p. 209). Historically, a difficulty involved in
researching this stage is the lack of accurate information on the number of applications
that students submit (Hossler & Gallagher, 1987, p. 216).
Figure 4. Choice (Phase 3) (Adapted from Hossler & Gallager, 1987).
The students’ preferences (including perceptions of quality), institutional
characteristics, financial aid, and college/university “courtship activities” (e.g., merit
awards, non-aid based activities like personal letters from the president, on-campus
banquet, etc.) seem to determine the results (Hossler & Gallagher, 1987, pp. 216-217).
However, Hossler and Gallagher caution that
the relationship between choice, quality, and price is sensitive to a number of
variables and may not lend itself to easy generalizations. These findings indicate
that aid and net cost have an impact on student matriculation, but that the impact
may vary among types of institutions and students. (p. 217)
24
Hossler and Gallager (1987) Model as Research Organizing Framework
Each model has strengths and weaknesses in understanding the complex
process of choosing a college. However, the Hossler and Gallagher (1987) model is
considered by many to be the “prevailing model” (Teranishi, Ceja, Antonio, Allen, &
McDonough, 2004, p. 531). As Teranishi, Ceja, Antonio, Allen, and McDonough (2004)
note, “This model is particularly useful in considering the sequencing of factors that
impact the decision-making process for students and parents and the role of school
agents and external resources” (p. 531).
The Hossler and Gallagher (1987) model, with its three phases (predisposition,
search, choice), provided the organizing framework for the research results referred to
in this chapter (Braxton, 1990, p. 58). Research relating to various factors which
influence the college selection process was examined to determine the approximate
college choice phase—predisposition, search, or choice—in which the findings applied
(Espinoza, 2001, pp. 25-26). However, testing the entire Hossler and Gallagher (1987)
model was not within the purview of this dissertation.
Factors Influencing College Choice
A review of existing research yields several factors which influence the college
choice process of high school seniors. Research findings relating to these factors are
discussed subsequently in this chapter. The three phases of the Hossler and Gallagher
(1987) model—predisposition, search, choice—provide the organizing framework for the
research findings. Although this list is not exhaustive, the author contends that it
includes the most outstanding and relevant college choice factors, as surfaced by
previous studies. These factors, divided into four categories, are (1) Student
25
Characteristics: academic ability, socioeconomic status, race/ethnicity, high school
environment, educational aspirations/expectations, gender; (2) Institutional
Characteristics: academic quality, programs of study, cost and financial aid, location,
social atmosphere, future job opportunities, religious emphasis; (3) Significant Others:
parents, guidance counselors, friends; and (4) College/University Search Activities:
college marketing.
The amount of attention given to various college choice factors has been uneven.
For instance, much research has been devoted to the financial aid factor, while
relatively little attention has been given to the factor of religious emphasis. Moreover,
although this literature review includes the findings of research which span several
decades, there seems to be a continuity in the factors considered during the college
selection process. As Kinzie, Palmer, Hayek, Hossler, Jacob, and Cummings (2004)
observed,
The factors influencing students’ college choice in the 1990s remained much the
same as those identified in the 1960s by Holly and Richards (1965). They found
that four main factors influenced students’ college choice: intellectual emphasis,
practicality, advice of others and social emphasis. Practicality included items
such as “closeness to home” and “low cost,” while items related to social climate
and cocurricular life fit the social emphasis factor. Hossler, Schmit and Vesper
(1999) found similar influences for students, but they asserted that either parents,
other family members, or, to a lesser extent, peers, had the greatest influence on
students’ decisions. These findings are consistent with research dating back to
the 1930s and 1940s. (p. 36)
26
Student Characteristics
Academic Ability
Student ability is a factor that influences the predisposition, search, and choice
stages of the college choice process (Cabrera & Nasa, 2000, p. 6).
Predisposition. Paulsen (1990), after reviewing previous research (Conklin and
Dailey, 1981; Tuttle, 1981; Carpenter and Fleishman, 1987; Davies and Kandel, 1981),
concluded that a person is more likely to desire to attend college “when student
academic aptitude is greater” and “when student academic achievement is greater” (pp.
37-38). Hossler and Gallagher’s (1987) research concurred along the same lines (p.
210). The degree of parental encouragement seems to be moderated by students’
academic ability, as occupational attainment research suggests that parents give the
most encouragement to their child with the highest academic ability (Cabrera & Nasa,
2000, p. 9).
Search. Paulsen’s (1990) literature review yielded these five general
relationships related to students’ academic ability: When student academic aptitude and
achievement are greater, he/she is more likely to apply to, or attend, (1) a more highly
selective institution, (2) a high-cost institution, (3) an institution located a greater
distance from home, (4) a private institution rather than a public institution, and (5) a
four-year institution (pp. 55-58). However, according to McDonough (1997), “African
Americans, women, and low-SES students are especially likely to attend less-selective
institutions, even if their ability and achievements are high” (pp. 4-5).
Using the National Education Longitudinal Study (NELS:88/92) and the
Beginning Postsecondary Student Longitudinal Study (BPS:90/92), Hurtado, Inkelas,
27
Briggs, and Rhee (1997) found that, “as we might expect, measures of ability play a
significant role in determining the number of college applications a student submits.
Students with higher SAT scores are likely to submit more applications across most
racial/ethnic groups” (p. 57).
Some research indicate that “[s]tudents with higher aptitude begin thinking about
college earlier, apply earlier, and consider a larger number of schools” (Paulsen, 1990,
pp. 46-47). Studies also indicate that high ability students differ in their rankings of
various college choice factors. According to Paulsen (1990),
The higher the academic ability of a student, the greater the concern about
academic standards, program offerings, and awareness of “net cost” rather than
just “price,” and the lesser the concern about career outcomes, campus
appearance, and financial matters . . . There is also some evidence that high
ability students tend to have much broader geographic limits regarding the
search and application process. (p. 50)
Choice. Harvard economists Christopher Avery and Caroline M. Hoxby’s (2004)
article, entitled “Do and Should Financial Aid Packages Affect Students’ College
Choices?”, has been called “the most precise examination yet on the impact of merit aid
and aid package strategies on the enrollment patterns of students of high ability” (Mills,
2004, p. 28). Using data from the College Admissions Project, wherein researchers
gathered data on 3,240 students from 396 United States high school and utilizing the
conditional logit technique, Avery and Hoxby focused on how the college choice
behaviors of high-ability students are affected by their financial aid packages (Cheng,
2006, p. 115). Avery and Hoxby (2004) concluded that
28
high-aptitude students are nearly indifferent to a college’s distance from their
home, to whether it is in-state, and to whether it is public. However, they are
sensitive to tuition, room, and board in the expected direction (lower is better).
They also prefer to attend the most selective colleges in the set to which they are
admitted. They are attracted by grants, loans, and work-study commitments.
Although we find that students from different backgrounds do exhibit somewhat
different college choice behavior, the differences are not dramatic and much
college choice behavior is shared by the entire array of high-aptitude students.
The main exceptions to this rule are students whose parents have high incomes
or who themselves graduated from very selective colleges. Such students exhibit
less sensitivity to variables that affect college costs. (p. 288)
Paulsen (1990) noticed that when tuition expenses, room and board costs, and
distance from home increased, the college option became less attractive to students.
However, “these effects are significantly greater for students at lower income levels and
for those with lower aptitude. At higher levels of student income and aptitude, these
effects become less important” (Paulsen, 1990, p. 27). Hossler (2000), reviewing
several meta-analyses on the effects of financial aid on enrollment choices (Heller,
1997; Jackson, 1978; Leslie and Brinkman, 1987; St. John, 1990), observed that these
reached similar conclusions,
it typically requires larger scholarships to influence the enrollment decisions of
high-ability students. These students are heavily recruited by many colleges and
universities and are often offered many large scholarships. These students are
29
also more likely to be interested in institutions with higher levels of prestige and
greater selectivity. (pp. 81-82)
Braxton (1990), reviewing previous studies (Chapman and Jackson, 1987; Litten
and others, 1983; Keller and McKewon, 1984), concluded that although “[f]or
academically able students, perceived quality is the most influential institutional
characteristic in the choice stage,” the awarded amount of financial aid “plays a
significant role in the decisions of such students when their second- and third-choice
institutions offer more aid than does their first choice” (pp. 61-62).
Socioeconomic Status
Socioeconomic status is a factor that influences the predisposition, search, and
choice stages of the college choice process (Cabrera & Nasa, 2000, p. 6). According to
the National Center for Education Statistics’ Descriptive Summary of 2003-04 Beginning
Postsecondary Students: Three Years Later, which describes a nationally
representative sample of students who began their postsecondary education for the first
time during the 2003-04 academic year,
Thirty percent of dependent beginning postsecondary students at 4-year
institutions came from families with annual incomes of $92,000 or more,
compared with 17 percent of those at 2-year institutions and 4 percent of those at
less-than-2-year institutions.
About two-thirds (65 percent) of students who began at less-than-2-year
institutions came from families in the lowest income group (less than $32,000).
(Berkner, Choy, & Hunt-White, 2008, p. 34)
30
Predisposition. Paulsen (1990), referring to earlier studies (Stage and Hossler,
1989; Tutle, 1981), concluded that a person is more likely to want to attend college
“when family income is higher” (p. 37). McDonough (1997) pinpoints some differences
between low socioeconomic status, first-generation, college-bound students and high
socioeconomic status students whose parents had finished college:
Students who are first-generation college-bound begin to think about going to
college much later than do students whose parents have gone to college, and
those thoughts tend to be triggered by school personnel, specifically teachers
and counselors . . . . Students who parents have attended college often get a
head start on college preparations in elementary school by taking the right
courses and maintaining good grades, and their families convey information to
them about the different types of colleges and universities. Meanwhile, first-
generation college-bound students do not get this information, oftentimes are not
taking the right courses, and are struggling with the cultural conflicts between
their new college-oriented world and the world of their friends, families, and
communities. (p. 6)
Search and Choice. Paulsen (1990), after reviewing previous research,
concluded that “[b]ased on characteristics of student background and ability alone,
individuals are more likely to attend college” when “family income is higher” (p. 26).
Furthermore, he found that when a student’s family income is greater, he/she is more
likely to apply to, or attend, a more highly selective institution, a high-cost institution, an
institution located a greater distance from home, a private (rather than a public)
institution, and a four-year institution (Paulsen, 1990, pp. 55-58). In a similar vein,
31
McDonough (1997) writes, “Independent of academic factors, upper-income youth are
especially likely to enter America’s elite colleges . . . African Americans, women, and
low-SES students are especially likely to attend less-selective institutions, even if their
ability and achievements are high” (pp. 4-5).
Using the National Education Longitudinal Study (NELS:88/92) and the
Beginning Postsecondary Student Longitudinal Study (BPS:90/92), Hurtado, Inkelas,
Briggs, and Rhee (1997) found that
[a]nalyses by income groups also reveal that the majority of students in the
lowest income category are either not likely to apply to college in the 12th grade
(52%) or are likely to apply to very few schools. Although approximately 25% of
students in the highest income category had not applied to college by the end of
12th grade, over half of these students apply to two or more schools and are
more likely than students in other income categories to apply to five or more
schools. In contrast, over half of the students in the lowest income category had
not applied to college by the end of 12th grade. (pp. 54, 56)
Hurtado et al. (1997) concluded, “While results show that ability measures
remain strong determinants of strategically planning students’ college options,
socioeconomic characteristics continue to influence the choices or opportunities
available to students in higher education in terms of the development of their college
choice sets” (pp. 65-66).
Paulsen (1990) summarized his findings regarding the relation of costs and
financial aid to socioeconomic status:
32
College becomes less attractive to students when tuition expenses, room and
board expenses, and distance from home increase. However, these effects are
significantly greater for students at lower income levels and for those with lower
aptitude. At higher levels of student income and aptitude, these effects become
less important . . . .
College becomes more attractive as the availability of financial aid increases,
particularly scholarship aid. However, this effect is reduced for students at higher
income levels because they have less chance of receiving financial aid. (pp. 27-
28)
Using information from the College Admissions Project (which includes data on
3,240 students from 396 United States high schools), Avery and Hoxby (2004) focused
on how the college choice behaviors of high-ability students are affected by their
financial aid packages (Cheng, 2006, p. 115). Avery and Hoxby (2004) concluded that
“[o]verall, we find that students from high-income families, whose parents attended
more-selective colleges and who themselves attended private high schools, are less
deterred by college costs and less attracted by aid” (p. 272).
Regarding loans, Campaigne and Hossler (1998), reviewing previous research
(Hossler, Braxton, and Coopersmith, 1989; Newman, 1985; Paulsen, 1990), concluded
that “low- and moderate-income students are very price sensitive and averse to tak[ing]
out loans. Middle-income students, and their parents, on the other hand, are not
hesitant to take out loans, indeed they often view loans as a good investment” (p. 94).
Some research indicates that student’s preferred information sources may differ
according to income; “[s]tudents at higher income levels . . . tend to depend more on
33
their parents for information, while lower-income students more often consult with high
school counselors” (Paulsen, 1990, pp. 53-54). Cabrera and La Nasa (2000), citing
earlier research (Flint, 1992, 1993; Hamrick and Hossler, 1996; Horn and Chen, 1998;
Hossler, Schmit, and Vesper, 1999; Hossler, Schmit, and Bouse, 1991; Hossler and
Vesper, 1993; Leslie, Johnson, and Carlson, 1997; McDonough, 1997; McDonough,
Antonio, Walpole, and Perez, 1998; Miller, 1997; Olivas, 1985; Tierney, 1980), found
that
[i]n general, more affluent students, compared with their less-well-off peers, tend
to rely on several sources of information (including private counselors to guide
the process), are more knowledgeable of college costs, are more likely to
broaden the search to include a wider geographical range, tend to consider
higher-quality institutions, and have parents who planned and saved for college
expenses. (p. 9)
Race/Ethnicity
According to the National Center for Education Statistics’ Descriptive Summary
of 2003-04 Beginning Postsecondary Students: Three Years Later, which describes a
nationally representative sample of students who began their postsecondary education
for the first time during the 2003-04 academic year,
Overall, 62 percent of beginning postsecondary students in 2003–04 were White,
15 percent were Hispanic, 13 percent were Black, and 5 percent were Asian. The
remaining students were American Indian (1 percent) and multiple or other races
(4 percent) . . . .
34
The racial/ethnic distribution of beginning postsecondary students varied
by type of institution. At both public and private not-for-profit 4-year institutions,
70 percent were White, and at 2-year institutions, 60 percent were White. In
contrast, at less-than-2-year institutions, 38 percent were White.
Less-than-2-year institutions had proportionately more Black (22 percent)
and Hispanic (33 percent) students than other institution levels. At 4-year
institutions, 11 percent of beginning postsecondary students were Black, and 10
percent were Hispanic; at 2-year institutions, the corresponding proportions were
15 and 16 percent. (Berkner et al., 2008, pp. 33-34)
Perna (2007) points out that “[n]umerous sources demonstrate the lower
educational attainment for African Americans and Hispanics” than whites (p. 52). Citing
data from the National Educational Longitudinal Study of 1988 eighth graders
(NELS:88), he observed that, by 2000, “eight years after most 1988 eighth graders
graduated from high school—35 percent of whites had completed at least a bachelor’s
degree compared with only 17 percent of blacks and 15 percent of Hispanics” (Perna,
2007, p. 52). Citing data from the U.S. Department of Education’s Common Core of
Data and Integrated Postsecondary Education Data System, Perna (2007) observed
that “the representation of blacks and Hispanics declines as the level of educational
attainment increases” (p. 53).
Predisposition. Based on previous research, Paulsen (1990) concluded that a
person is more likely to want to attend college “when the student is white” (p. 37).
Moreover, he observed that
35
there appears to be an interesting interaction between race and the causal
pattern by which college aspirations are formed. Variables which appear early in
the causal sequence are useful for explaining the formation of college aspirations
among whites, while blacks seem to rely more exclusively on variables which
appear later in the causal sequence of aspiration formation.
. . . For example, Portes and Wilson (1976) found that while
socioeconomic status factors and academic aptitude are related directly to the
education aspirations of whites, they are unrelated to the educational aspirations
of blacks.
College aspirations among blacks were related directly to academic
achievement in school, the influence of significant others (parents, teachers, and
friends), and self-esteem. Achievement and significant others’ encouragement,
but not self-esteem, were important in determining educational aspiration for
whites. (Paulsen, 1990, pp. 43-44)
Since expectations to attend college are partially dependent on students’ aptitude
and preparation, Hurtado, Inkelas, Briggs, and Rhee (1997) used the National
Education Longitudinal Study (NELS:88/92) and the Beginning Postsecondary Student
Longitudinal Study (BPS:90/92) to investigate the “patterns of preparation for college
and application behaviors for students who scored in the highest quartile of a four-
subject cognitive test administered in the 8th grade” (p. 52). Their research revealed
that
[t]he majority of 12th-grade Asian American students (85%), compared with other
high-achieving students, have already taken required tests (particularly the SAT)

36
or plan to take them soon. Similarly, the majority of African American (58%),
Latino (68%), and white students (58%) who scored in the highest quartiles
during 8th grade are likely to state they have already taken the SAT for college
by the end of 12th grade. (Hurtado et al., 1997, p. 52)
On the flip side, they noticed considerable talent loss.
A fair proportion of the 12th grade, high-ability African Americans (20%) have
either no plans to take the SAT or plan to take it later (20%). Unfortunately, this
means that almost 40% of African Americans may be delaying their college
entrance or foregoing college opportunities. It is also true that almost 40% of
white and 32% of Latino students face similar situations. (Hurtado et al., 1997, p.
52)
Search. Paulsen (1990), after reviewing previous research (Jackson, 1988;
Manski and Wise, 1983), concluded that “[b]ased on characteristics of student
background and ability alone, individuals are more likely to attend college” when “they
are white rather than nonwhite” (p. 26). According to McDonough (1997), “African
Americans, women, and low-SES students are especially likely to attend less-selective
institutions, even if their ability and achievements are high” (pp. 4-5). Some research
indicates differences in the nature of the search phase by student’s race; “[b]lacks
request more information, consult more information sources, consider more institutions
and more institutional characteristics than whites” (Paulsen, 1990, pp. 46-47).
Using the National Education Longitudinal Study (NELS:88/92) and the
Beginning Postsecondary Student Longitudinal Study (BPS:90/92), Hurtado, Inkelas,
Briggs, and Rhee (1997) found that a large percentage of “African American (45%) and
37
Latino students (47%) do not even apply to college during the 12th grade, nor do
approximately one-fifth to over one-quarter among these groups (respectively) who
were identified as high achievers on 8th-grade cognitive tests” (p. 63). Perna (2000)
observed that, according to previous research, “variables that predict college enrollment
vary by race and ethnicity, suggesting that the college enrollment decision-making
process is different for African Americans, Hispanics, and whites” (p. 72).
Choice. Using the National Education Longitudinal Study (NELS:88/92) and the
Beginning Postsecondary Student Longitudinal Study (BPS:90/92), Hurtado, Inkelas,
Briggs, and Rhee (1997) concluded,
In many ways our analysis confirms prior research that shows Asian Americans
are best prepared for college . . . and are likely to enter higher education
immediately after high school. They are likely to have high expectations for
degree attainment, take required standardized tests on time, and apply to the
highest number of colleges. Despite Asian Americans’ high application rates,
however, they are not significantly more likely than white students to be attending
their first choice institution. If students are aware of this fact, it only serves to
reinforce the practice of applying to a wide range of schools. Among Asian
American college applicants, student ability is the main predictor of being
strategic about submitting college applications. This is in contrast to other groups
where socioeconomic characteristics (parental income and education) continue
to play a direct role in the development of a choice set. We suggest that such
socioeconomic characteristics are more strongly tied with achievement among
Asian Americans and therefore play an indirect role in the college choice
38
process. Rather than differentiating among college applicants, it may be that
such socioeconomic characteristics play a direct role in determining which Asian
American students do not attend college immediately after high school. (p. 64)
Status of Educational Research on Asian Pacific Americans. From the 2000
Census data, the U.S. Census Bureau reports, of the entire population of the United
States, “11.9 million people, or 4.2 percent, reported they were Asian. This number
included 10.2 million people, or 3.6 percent, who reported only Asian and 1.7 million
people, or 0.6 percent, who reported Asian and at least one other race” (Reeves &
Bennett, 2004, p. 1). Despite the fact that, “[i]n recent decades, the APA [Asian Pacific
American] population has become the fastest-growing, college-going racial group in the
nation,” educational research on this group has not kept up (Teranishi et al., 2004, p.
529). Teranishi, Ceja, Antonio, Allen, and McDonough (2004) describe the current
status of educational research on Asian Pacific Americans:
Research on access and equity in higher education for different racial and ethnic
populations frequently excludes Asian Pacific Americans (APAs) . . . from the
discourse or misrepresents them. In general, research, policy, and political
debates about college access have primarily focused on the educational
attainment of African American and Latino students compared to White students
without the consideration of APAs . . . When APAs are included in the debate
over access and equity in higher education, there is a common assumption that
APAs are a successful minority group, even ‘outwhiting the Whites.’ (pp. 527-
528)
39
Asian Americans are “often presented as overrepresented in U.S. higher
education, concentrated only in selective four-year universities, or a ‘successful’
minority group with no academic challenges” (Teranishi, 2007, p. 40). However, this
perception does not accurately represent reality. According to the National Center for
Education Statistics’ Descriptive Summary of 2003-04 Beginning Postsecondary
Students: Three Years Later, “62 percent of beginning postsecondary students in 2003–
04 were White, 15 percent were Hispanic, 13 percent were Black, and 5 percent were
Asian. The remaining students were American Indian (1 percent) and multiple or other
races (4 percent)” (Berkner et al., 2008, p. 33).
Moreover, as Teranishi (2007) points out, when researchers disaggregate total
enrollment by institutional type, the large concentration of Asian Americans in
community colleges is seen. “In 2000, there was a larger proportion of Asian American
students attending public two-year institutions (44.4 percent) in the United States than
four-year public institutions (43.2 percent)” (Teranishi, 2007, p. 41). Furthermore, as
Teranishi et al. (2004) note, citing earlier research (Nakanishi, 1995; Ong, 2000; Sue
and Okazaki, 1990; Takagi, 1992; Hune and Chan, 1997; Teranishi, 2002a),
While there exists a limited amount of research on the educational experiences
of Asian Americans as a whole, even less is known about the educational
experiences of ethnic subgroups within the population . . . . Rather, the Asian
American population has been misrepresented through being categorized and
treated as a single, homogeneous racial group. (p. 528)
The contrasting reality is that “the Asian American population is quite diverse,
with ethnic, social class, and immigrant subgroups that encounter differing social and
40
institutional experiences” (Teranishi, 2007, p. 42). This is indicated by the fact that 48
different Asian American and Pacific Islander categories made up the AAPI racial
population of the U.S. Census Bureau in 2000 (Teranishi, 2007, p. 42).
Indeed, the idea that Asian Americans exceed other racial groups in educational
attainment “masks wide differences . . . found within ethnic groups. For example, a large
proportion of Hmongs (59.6 percent), Cambodians (53.3 percent), Laotians (49.6
percent), and Vietnamese (38.1 percent) adults over the age of twenty-five do not have
a high school diploma” (Teranishi, 2007, pp. 43-44). As Endo (1990) explains, “Ideally,
assessment data should be collected and reported for individual Asian groups.
Unfortunately, most institutions and researchers collect or report only aggregated data”
(p. 39).
Seminal Research of Teranishi, Ceja, Antonio, Allen, and McDonough (2004).
Using a nationally representative sample of Asian American first-year, first-time
freshmen drawn from the 1997 Freshman Survey (sponsored by the Cooperative
Institutional Research Program at the University of California, Los Angeles), Teranishi,
Ceja, Antonio, Allen, and McDonough (2004) investigated the “postsecondary decisions,
opportunities, and destinations of APA students from different ethnic and socioeconomic
class backgrounds” (pp. 528, 532).
First, they investigated the distribution of Asian Pacific American subgroups
across different types of institutions. They found that “Chinese and Korean Americans
had greater representation in selective institutions, private institutions, and four-year
universities than Filipinos and Southeast Asians. Filipinos, Japanese, and Southeast
41
Asians had their highest representation at public institutions with less stringent
admission requirements” (Teranishi et al., 2004, p. 545).
Second, they studied how socioeconomic status affects the distribution of Asian
Pacific American subgroups across different types of institutions. They found that
[a]mong different ethnic groups, socioeconomic class impacted the destination of
APA [Asian Pacific American] students at differential rates. For example,
although Chinese Americans had the highest rates of attending private
institutions, this finding holds only for high-SES Chinese students because low-
SES [socioeconomic status] Chinese Americans had the lowest rates of
enrollment in private institutions among all low-income students from other ethnic
backgrounds. Inversely, the gap between socioeconomic class groups within
some ethnic groups was very small in terms of their college destination. For
example, Southeast Asians and Koreans showed almost equal rates of attending
public universities for students from high- and low-SES backgrounds. (Teranishi
et al., 2004, p. 545)
Third, they examined college-choice factors for different Asian Pacific American
subgroups. They wrote,
We determined that the college decision-making processes varied by the ethnic
and socioeconomic class backgrounds of students. This general finding was true
among such specific factors as the influence of social networks, the impact of
cost and financial aid availability, numbers of college applications submitted, and
perceptions of the prestige and reputation of different colleges. In the regression
analyses, we found that these college-choice factors, after controlling for
42
background characteristics and academic achievement, had differential effects
on the selectivity of the college a student attended. Our findings suggest that
APA students from different ethnic backgrounds were not always similar in their
college-choice process nor were APA ethnic subpopulations similar in the factors
that impacted their eventual college destinations. (Teranishi et al., 2004, p. 546)
High School Environment
High school academic resources is a factor that influences the predisposition and
search stages of the college choice process (Cabrera & Nasa, 2000, p. 6). Research
indicates that the high school environment “has an impact on the college choice process
of all students, with the greatest impact on minority and low SES students” (Rowe,
2002, pp. 42-43). Attributes of the high school attended “is found to be positively related
to college attendance, although it does not have as strong predicative strength of
factors as SES, ability, or parental influence” (Liu, 2005, p. 40). Indeed, as Espinoza
(2001) points out,
Several studies have reported that rigorous high school curricula and college
attendance are positively correlated . . . A small positive relationship has also
been found . . . between college attendance and graduation from a high school
with a rigorous curriculum in math, science, and other college preparatory
subjects, even while holding student background characteristics constant. (pp.
39-40)
Predisposition. Paulsen (1990) concluded that a person is more likely to want to
attend college “when a college preparatory curriculum is taken in high school” (p. 37).
Using data from the National Educational Longitudinal Study of 1988 (NELS), which
43
started with surveying a nationally representative sample of 1988 eighth graders, with
follow-up surveys in 1990, 1992, and 1994, research by Choy, Horn, Nuñez and Chen
(2000) found that “[p]articipating in a rigorous mathematics curriculum significantly
increases the likelihood of attending college” (pp. 46, 56). They reported that
[t]aking algebra in eighth grade was strongly associated with taking advanced
mathematics in high school, which, in turn, was strongly associated with a high
likelihood of attending college. Taking advanced mathematics means taking at
least one course beyond Algebra 2, such as Algebra 3, Trigonometry,
Precalculus, Calculus, Probability, or Statistics. Overall, 22 percent of the 1992
high school graduates took algebra in eighth grade, and 39 percent took
advanced mathematics in high school; however, 78 percent of those who took
algebra in eighth grade later took advanced mathematics in high school . . . .
Among those who took advanced mathematics in high school, about three-
quarters (76 percent) enrolled in college by 1994 . . . . The enrollment rate
dropped to 44 percent for those who took middle-level mathematics (Algebra 2),
to 16 percent for those who took only algebra and geometry, and to 6 percent for
those whose completion level was lower than algebra and geometry. These
findings indicate that taking advanced mathematics courses in high school is an
important intermediate step to college enrollment and that taking algebra in
eighth grade is a critical first step. (Choy et al., 2000, pp. 56-57)
However, “[d]espite the strong association between mathematics course-taking
and college attendance, parents’ education still mattered” (Choy et al., 2000, p. 57).
They found that
44
[h]igh school graduates whose parents had no college experience were less
likely than their peers whose parents had graduated from college to participate in
a mathematics curriculum leading to college enrollment. They were also less
likely to have access to and be encouraged to follow such a curriculum and less
likely to work with their parents in planning for college. This was true even for
students who were the best prepared academically, where one would expect
parents’ education to make the least difference. (Choy et al., 2000, p. 56)
Search and Choice. Paulsen (1990), after reviewing previous research (Borus
and Carpenter, 1984; Conklin and Dailey, 1981), concluded that “[b]ased on
characteristics of student background and ability alone, individuals are more likely to
attend college” when “a college preparatory curriculum is followed in high school” (p.
26). Furthermore, he found that when “the student followed a college preparatory
curriculum in high school,” he/she is more likely to apply to, or attend a more highly
selective institution, and a high-cost institution (Paulsen, 1990, pp. 55-56).
Using information from the College Admissions Project (which includes data on
3,240 students from 396 United States high schools), Avery and Hoxby (2004) focused
on how the college choice behaviors of high-ability students are affected by their
financial aid packages (Cheng, 2006, p. 115). Avery and Hoxby (2004) concluded that
“[o]verall, we find that students from high-income families, whose parents attended
more-selective colleges and who themselves attended private high schools, are less
deterred by college costs and less attracted by aid” (p. 272). However, they “failed to
find significant differences in choice behavior along several other dimensions,” including
size of the high school (Avery & Hoxby, 2004, p. 272).
45
McDonough (1997) found that “[s]eniors enrolled in private high schools are
significantly more likely than public school seniors to enter college and enroll in four-
year institutions, even when track, ability levels, aspirations, and SES are controlled” (p.
7). He attributed this to the difference between private and public high schools,
explaining that
[o]n average, private schools are smaller, have different rules and expectations,
and have larger percentages of students in the academic track than do public
schools. Private schools also help students develop their college aspirations
better than do public schools through a greater proportion of counselors per
students, who encourage and influence a large proportion of their students in
their college planning. (McDonough, 1997, p. 7)
Hossler and Gallagher (1987) observed,
Several studies have noted that there is a positive relationship between the
quality high school curricula and college matriculation (Hearn, 1984; Kolstad,
1979; Peters, 1977). Even though the relationship is weak, there is a positive
correlation between college attendance and graduating from a high school which
has a curriculum that includes more math, science, and other college prep
courses. This relationship remains even when background characteristics are
held constant (Kolstad, 1979). Alexander et al. (1978) have also found that
students who graduate from high-status high schools are more likely to pursue
higher education even when ability and SES are controlled. (p. 212)
46
Educational Aspirations/Expectations
Educational aspiration is an outcome of the initial predisposition stage, and a
factor in the subsequent search and choice stages of the college choice process
(Cabrera & Nasa, 2000, p. 6).
Predisposition. McDonough (1997) found that “[s]tudents’ educational
expectations play a major role in college placement . . . and oftentimes are the single
strongest predictor of four-year college attendance” (p. 5). Moreover, “intending to go to
college increases the likelihood of going by 21 percent when that intention develops
prior to tenth grade, compared to plans formulated during the senior year” (McDonough,
1997, p. 5). Cabrera and La Nasa (2000) explain that “[d]evelopment and maintenance
of postsecondary educational aspirations among high school students is proportionally
related to the frequency and consistency with which parents provide encouragement”
(p. 8).
Search and Choice. Paulsen (1990), after reviewing previous research,
concludes that “[b]ased on characteristics of student background and ability alone,
individuals are more likely to attend college” when “their own educational or
occupational aspiration is higher” (p. 26). Furthermore, he found that when student
educational aspirations are higher, he/she is more likely to apply to, or attend, a more
highly selective institution, a high-cost institution, an institution located a greater
distance from home, a private (rather than a public) institution, and a four-year
institution (Paulsen, 1990, pp. 55-58).
Using the National Education Longitudinal Study (NELS:88/92) and the
Beginning Postsecondary Student Longitudinal Study (BPS:90/92), Hurtado, Inkelas,
47
Briggs, and Rhee (1997) found that although “the majority of students seek some type
of postsecondary training,” evidence points to “significant racial/ethnic differences in
early predispositions for college” (p. 50). Hurtado et al. (1997) reported their results,
At 10th grade, Asian Americans have the highest expectations for degree
attainment (almost 42% expect to attend graduate school) and Latinos tend to
have the lowest expectations for degree attainment among the four racial/ethnic
groups. Approximately 11% of Latinos expect to only finish high school (or less)
and 27% expect to attend graduate school. While approximately 10% of African
Americans expect to finish high school or less (compared with 8% among white
students), for the most part, their expectations for degree attainment are roughly
similar with only a slightly higher percentage of white students expecting to
complete a college or pursue graduate school. . . . By 12th grade, when all
students have increased their aspirations, we find that these differences between
black and white students have diminished somewhat (p = ≤.05). Asian
Americans continue to report the highest expectations for a graduate education
(47%) at 12th grade, with the next highest group being African Americans (35%),
white students (32%), and Latinos remaining least likely to aspire to this level of
attainment (31%). (p. 50)
Gender
According to the National Center for Education Statistics’ Descriptive Summary
of 2003-04 Beginning Postsecondary Students: Three Years Later, which describes a
nationally representative sample of students who began their postsecondary education
for the first time during the 2003-04 academic year,
48
Women constituted a majority of beginning postsecondary students overall (57
percent), but the distribution of males and females varied by type of institution . . .
. Women made up 56 percent of the beginning student population at both 2- and
4-year institutions, but they accounted for 73 percent at less-than-2-year
institutions. (Berkner et al., 2008, p. 32)
Moreover, the report found that “[a] greater percentage of Black and Hispanic
beginning postsecondary students (62 and 61 percent, respectively) were female than
were White or Asian students (56 and 52 percent)” (Berkner et al., 2008, p. 33).
Search and Choice. Paulsen (1990), after reviewing previous research, found
that when the student is male, he is more likely to apply to, or attend, a more highly
selective institution, and an institution located a greater distance from home; when the
student is female, she is more likely to apply to, or attend, a high-cost institution, and a
private (rather than a public) institution (pp. 55-58). Conversely, Avery and Hoxby
(2004) found that “[w]hile students’ choice behavior is affected by variables like parents’
income, parents’ college selectivity, and private high school attendance, . . . [w]e tried
and failed to find significant differences in choice behavior along several other
dimensions: gender,” etc. (p. 272).
According to Paulsen (1990), some research indicates that gender may play a
role in the timing and nature of search and application, the importance rating of
institutional characteristics, and the preferred information sources. First, “[w]omen start
and finish the search and application process earlier, and make more applications than
men” (Paulsen, 1990, pp. 46-47). Second, “while women tend to cite the most important
characteristics . . . with relatively equal frequency, men are more likely to emphasize
49
programs or costs. Women also are more likely than men to rate residential life as
important” (Paulsen, 1990, p. 48). Third, “[w]hile men and women utilize college
catalogs and campus visits with similar frequency, women tend to seek the advice of
college students more than men do, while men rely more on high school counselors
than women do” (Paulsen, 1990, p. 53).
Mansfield and Warwick (2005) surveyed seniors from eight private, religiously
affiliated schools from five states, evaluating the gender differences between students
(as well as between parents) as to how they rate the level of importance of 19 college
selection criteria, grouped into five categories: financial, social, psychological, physical,
and functional. In the “financial” category, there was no significant difference between
the importance level placed on “tuition costs” or on “scholarships” by male students and
that placed by female students. However, female students placed a higher level of
importance on the criterion of “financial aid” than did males (Mansfield & Warwick, 2005,
p. 63). In the “physical” category, there was no significant difference between the
importance level placed on “size of the school,” on “location,” or on “weather” by male
students and that placed by female students. However, female students placed a higher
level of importance on the criterion of “safety-security” than did males (Mansfield &
Warwick, 2005, p. 65). In the “functional” category, there was no significant difference
between the importance level placed on “quality of professors,” or on “degrees offered
by the school” by male students and that placed by female students. However, female
students placed a higher level of importance on the criterion of “academics” than did
males (Mansfield & Warwick, 2005, p. 67). In the “social” category, there was no
significant difference between the importance level placed on “degree of cultural
50
diversity on campus,” on “social activities,” on “athletic programs,” on “whether or not
friends will attend,” or on “prospects for marriage” by male students and that placed by
female students. However, female students placed a higher level of importance on the
criteria of “friendly atmosphere” and of “religious atmosphere” than did males (Mansfield
& Warwick, 2005, pp. 67-68). In the “psychological” category, there was no significant
difference between the importance level placed on “reputation of the school” or on
“reputation of the degree obtained” by male students and that placed by female
students (Mansfield & Warwick, 2005, p. 69). With regards to how both genders ranked
the importance of each category, Mansfield and Warwick (2005) reported that “[b]oth
male students and female students rate the characteristic groups in the same order,
beginning with financial, then functional, psychological, physical, and social while overall
means for each characteristic group are higher for the females than for the males” (p.
69). Moreover, for female students and parents, the most important criterion was
academics; for male students, it was tuition (Mansfield & Warwick, 2005, p. 47).
Goss, Jubenville, and Orejan (2006) surveyed 229 freshman student-athletes
from six institution in an effort to identify institutional selection factors most influential to
them. They found that
[w]hen examined separately, male and female small-college student-athletes
showed similarity in their rankings of college choice factors, with the female
subjects placing slightly more focus on academic rather than athletic factors.
These results proved similar to those of Gabert et al. (1999), who noted that male
and female student-athletes were influenced in their college selection factors in
similar ways. (Goss, Jubenville, & Orejan, 2006, p. 123)
51
Institutional Characteristics
Academic Quality
Search. The academic quality of a college or university is an important factor
considered by students during the search phase of the college choice process, as
research has shown. Although different terms were used (e.g. academic reputation,
faculty teaching reputation, academic standards, quality), Paulsen (1990), reviewing
previous research (Litten and Brodigan, 1982; Murphy, 1981; Ihlandfeldt, 1980; Leslie,
Johnson, and Carlson, 1977; Lewis and Morrison, 1975), found that academic quality is
consistently highly ranked in terms of importance during the search phase of the college
choice process (pp. 47-48). Similarly, Cabrera and La Nasa (2000), after examining
other studies (Choy and Ottinger, 1998; Hossler, Schmit, and Vesper, 1999;
McDonough, 1997; Tinto, 1993), concluded that the quality of an institution is a primary
consideration shaping actual matriculation (pp. 9-10). Canale and Dunlap (1996) found
that “teacher attributes, areas of study offered, costs and academic reputation were
ranked the highest in terms of importance among the list of college characteristics
investigated,” after surveying 543 high school seniors and juniors in order to determine
the relative importance of certain college traits in their choice of a prospective institution.
In Litten and Brodigan’s (1982) six-market study, three indicators of academic quality
(academic reputation, teaching quality, academic standards) are included among the
eight college attributes which both students and parents rated as most important
(Paulsen, 1990, p. 50).
Using a nationally representative sample of Asian American first-year, first-time
freshmen drawn from the 1997 Freshman Survey (sponsored by the Cooperative
52
Institutional Research Program at the University of California, Los Angeles), Teranishi,
Ceja, Antonio, Allen, and McDonough (2004) investigated the “postsecondary decisions,
opportunities, and destinations of APA students from different ethnic and socioeconomic
class backgrounds” (pp. 528, 532). They found that among all Asian American
subgroups, “more than half of all students indicated that the academic reputation of a
campus was important in determining their choices. Chinese, Filipinos, and Koreans
had slightly higher rates of indicating that rankings were important in their decisions”
(Teranishi et al., 2004, p. 538).
Paulsen (1990) explained that “[h]ow selective an institution is in its admissions
policy is a measure of quality for many students,” and that “[o]n average, therefore, the
attractiveness of college increases with this measure of quality” (p. 28). Some evidence
indicate that academic quality is weighted differently among diverse groups of students.
After reviewing previous research (Hearn, 1984; Rosenfeld and Hearn, 1982; Tierney,
1984; Zemsky, Shaman, and Berberich, 1980; Jackson, 1978; Zemsky and Oedel,
1983), Paulsen (1990) concluded that a person is “more likely to apply to, or attend, a
more highly selective institution” when “the student is male,” “the student is white,”
“students’ parents have greater educational attainment,” “student family income is
greater,” “student academic aptitude is greater,” “student academic achievement is
greater,” “the student followed a college preparatory curriculum in high school,” and
“student educational aspirations are higher” (p. 55).
Hossler (2000), after reviewing several meta-analyses (Heller, 1997; Jackson,
1978; Leslie and Brinkman, 1987; St. John, 1990) concurred with Paulsen’s
observation, concluding that high-ability students are “more likely to be interested in
53
institutions with higher levels of prestige and greater selectivity” (Hossler, 2000, pp. 81-
82). Similarly, Cabrera and La Nasa (2000), reviewing earlier studies (Flint, 1992, 1993;
Hamrick and Hossler, 1996; Horn and Chen, 1998; Hossler, Schmit, and Vesper, 1999;
Hossler, Schmit, and Bouse, 1991; Hossler and Vesper, 1993; Leslie, Johnson, and
Carlson, 1997; McDonough, 1997; McDonough, Antonio, Walpole, and Perez, 1998;
Miller, 1997; Olivas, 1985; Tierney, 1980), found that “[i]n general, more affluent
students, compared with their less-well-off peers, . . . tend to consider higher-quality
institutions” (p. 9). According to McDonough (1997), “African Americans, women, and
low-SES students are especially likely to attend less-selective institutions, even if their
ability and achievements are high” (pp. 4-5).
Choice. Research has consistently shown that the academic quality of an
institution is an important consideration as students choose the institution of higher
education to which they will matriculate. Paulsen (1990) listed “quality” among the top
10 “attributes which were found most often to determine where students decided to
enroll,” as he summarized representative research related to college traits which
distinguished between matriculation and nonmatriculation at specific institutions during
the final choice phase of the college choice process (p. 60). Likewise, Braxton (1990)
included “general academic reputation or quality” among the characteristics students
rated as important in their decision to apply to or attend a specific college or university
(p. 60). McDonough’s (1997) review of previous studies (Hossler, Braxton, and
Coopersmith, 1989; Manski and Wise, 1983; Zemsky and Oedel, 1983) identified
reputation, prestige, and selectivity among the factors “consistently influential” in the
search and choice phases of students’ college choice process (p. 4).
54
Avery and Hoxby (2004), using data from the College Admissions Project (which
includes information on 3,240 students from 396 United States high schools), found
that, in general, “high-aptitude students . . . prefer to attend the most selective colleges
in the set to which they are admitted” (p. 288). However, as Braxton (1990) noted,
although “[f]or academically able students, perceived quality is the most influential
institutional characteristic in the choice stage,” the awarded amount of financial aid
“plays a significant role in the decisions of such students when their second- and third-
choice institutions offer more aid than does their first choice” (pp. 61-62).
Braxton’s (1990) literature review found that students from high socioeconomic
backgrounds (rather than from low or middle income levels), high-ability students, and
students who receive much parental encouragement to attend college are more likely to
attend selective colleges and universities (pp. 59-60).
Programs of Study
Search. The programs (or fields) of study available at a college or university is an
important factor considered by students during the search phase of the college choice
process, as research has shown. Although different terms were used (e.g. special
academic programs, programs, educational programs, fields of study), Paulsen (1990),
reviewing previous research (Litten and Brodigan, 1982; Ihlandfeldt, 1980; Leslie,
Johnson, and Carlson, 1977; Lewis and Morrison, 1975), found that programs of study
is consistently highly ranked in terms of importance during the search phase of the
college choice process (pp. 47-48). Similarly, Cabrera and La Nasa (2000), after
examining some research (Choy and Ottinger, 1998; Hossler, Schmit, and Vesper,
1999; McDonough, 1997; Tinto, 1993), concluded that availability of majors is a primary
55
consideration shaping actual matriculation (pp. 9-10). Likewise, Broekemier (2002)
found that programs of study is “consistently rated [among the] important choice criteria
for traditional-aged students” (p. 34).
In Litten and Brodigan’s (1982) six-market study, fields of study is included
among the eight college attributes which both students and parents rated as most
important (Paulsen, 1990, p. 50). Surveying 543 high school seniors and juniors in order
to determine the relative importance of certain college traits in their choice of a
prospective institution, Canale and Dunlap (1996) found that “teacher attributes, areas
of study offered, costs and academic reputation were ranked the highest in terms of
importance among the list of college characteristics investigated.”
Choice. Research has shown that the programs of study of a college or university
is an important consideration as students choose the institution of higher education to
which they will matriculate. Paulsen (1990) listed “programs” among the top 10
“attributes which were found most often to determine where students decided to enroll,”
as he summarized representative research related to college traits which distinguished
between matriculation and nonmatriculation at specific institutions during the final
choice phase of the college choice process (p. 60). Likewise, Braxton (1990) included
“special academic programs” among the characteristics students rated as important in
their decision to apply to or attend a specific college or university (p. 60). McDonough’s
(1997) review of previous studies (Hossler, Braxton, and Coopersmith, 1989; Manski
and Wise, 1983; Zemsky and Oedel, 1983) identified academic programs among the
factors “consistently influential” in the search and choice phases of students’ college
choice process (p. 4).
56
Cost and Financial Aid
Financial aid is one of the most researched issues in college choice. Much of the
studies in this area “has examined issues of equity and adequacy in the computation of
financial aid” (Liu, 2005, p. 41). This study concurs with Rowe (2002) in using the term
“financial aid” to indicate “not only direct federal and state assistance such as the PELL
grant, federally subsidized loans, [state tuition assistance] . . . but also scholarship
awards and institutional grants based on student need” (pp. 51-52). According to the
National Center for Education Statistics’ Descriptive Summary of 2003-04 Beginning
Postsecondary Students: Three Years Later, which describes a nationally
representative sample of students who began their postsecondary education for the first
time during the 2003-04 academic year,
• Among all beginning students, 71 percent received some type of financial aid in
2003–04; the average amount of aid received was $7,500 . . . .
• Sixty-two percent of the beginning students received an average of $4,600 in
grants and 37 percent took out an average student loan of $4,300 in 2003-04. . . .
• The average tuition and fees charged full-time/full-year beginning students in
2003–04 ranged from $2,000 at public 2-year institutions to $18,900 at private
not-for-profit 4-year institutions . . . .
• The average price of attendance (which includes room and board, books, and
other expenses as well as tuition and fees) for full-time/full-year beginning
students in 2003–04 ranged from $9,700 at public 2-year institutions to $28,600
at private not-for-profit 4-year institutions. (Berkner et al., 2008, pp. 145-146)
57
Predisposition. Referring to earlier studies (Miller, 1997; McDonough, 1997;
Olson and Rosenfeld, 1984), Cabrera and La Nasa (2000) note that some evidence
indicate that “knowledge of college costs and preparation to finance college education
are more prevalent among upper-income parents” (pp. 8-9).
Search. During the search phase, potential matriculants develop parameters.
Citing previous research (Gilmour and others, 1978; Tierney, 1983; Astin and others,
1980), Braxton (1990) writes, “Most students establish limits on geographical location
and costs . . . . Once such limits are established, prospective students seek out
institutions that offer programs they desire” (p. 59).
The cost of a college/university and the availability of financial aid are important
factors considered by students during the search phase of the college choice process,
as research has shown. Paulsen (1990), reviewing previous research (Litten and
Brodigan, 1982; Murphy, 1981; Ihlandfeldt, 1980; Leslie, Johnson, and Carlson, 1977;
Lewis and Morrison, 1975), found that cost (or financial) considerations is consistently
highly ranked in terms of importance during the search phase of the college choice
process (pp. 47-48). Similarly, Broekemier (2002), examining previous studies
(Broekemier and Seshadri, 1998; Canale et al., 1996; Coccari and Javalgi, 1995), found
that cost and financial aid/scholarships are “consistently rated [among the] important
choice criteria for traditional-aged students” (p. 34). Likewise, Cabrera and La Nasa
(2000), after reviewing other research (Choy and Ottinger, 1998; Hossler, Schmit, and
Vesper, 1999; McDonough, 1997; Tinto, 1993), concluded that one’s ability to finance
enrollment is a primary consideration shaping actual matriculation (pp. 9-10). In Litten
and Brodigan’s (1982) six-market study, financial considerations is included among the
58
eight college attributes which both students and parents rated as most important
(Paulsen, 1990, p. 50).
Canale and Dunlap (1996) found that “teacher attributes, areas of study offered,
costs and academic reputation were ranked the highest in terms of importance among
the list of college characteristics investigated,” after surveying 543 high school seniors
and juniors in order to determine the relative importance of certain college traits in their
choice of a prospective institution. Paulsen (1990) summarized his findings thus:
College becomes less attractive to students when tuition expenses, room and
board expenses, and distance from home increase. However, these effects are
significantly greater for students at lower income levels and for those with lower
aptitude. At higher levels of student income and aptitude, these effects become
less important . . . .
College becomes more attractive as the availability of financial aid increases,
particularly scholarship aid. However, this effect is reduced for students at higher
income levels because they have less chance of receiving financial aid. (pp. 27-
28)
Some evidence indicate that financial considerations are weighted differently
among diverse groups of students. Paulsen (1990), after reviewing previous research
(Tierney, 1984; Hearn, 1984; Zemsky and Oedel, 1983; Jackson, 1978), concluded that
a person is “more likely to apply to, or attend, a high-cost institution” when the “student
is female,” the “students’ parents have greater educational attainment,” the “student’s
family income is greater,” the “student’s academic aptitude is greater,” the “student
59
academic achievement is greater,” the “student followed a college preparatory
curriculum in high school,” and “student educational aspirations are higher” (pp. 55-56).
Braxton (1990), reviewing previous studies, concluded that although “[f]or
academically able students, perceived quality is the most influential institutional
characteristic in the choice stage,” the awarded amount of financial aid “plays a
significant role in the decisions of such students when their second- and third-choice
institutions offer more aid than does their first choice” (pp. 61-62). Moreover, “costs are
more important than quality for academically talented students who are considering
attending an in-state institution” (Braxton, 1990, p. 61).
Using a nationally representative sample of Asian American first-year, first-time
freshmen drawn from the 1997 Freshman Survey (sponsored by the Cooperative
Institutional Research Program at the University of California, Los Angeles), Teranishi,
Ceja, Antonio, Allen, and McDonough (2004) investigated the “postsecondary decisions,
opportunities, and destinations of APA [Asian Pacific American] students from different
ethnic and socioeconomic class backgrounds” (pp. 528, 532). They found that
Southeast Asians and Filipinos, especially from the lowest income bracket, were
more likely to indicate that they had major financial concerns about college than
Chinese, Japanese, and Korean Americans. Filipinos (33.3%) and Southeast
Asians (29.5%) were also most likely to choose a college because of low tuition,
a trend that was true across all income levels for these ethnic groups. Filipino,
Southeast Asians, and Koreans were most likely to select colleges based on the
amount of financial aid that was offered to them. . . .
60
Filipino Americans and Southeast Asian Americans from low SES
backgrounds were most likely to indicate that they had major concerns about
cost. However, students in the same groups but in the highest income brackets
were also most likely to be concerned about cost. The groups with the largest
gap between the high and low SES students were Chinese Americans and
Korean Americans. Among low SES Filipino and Korean American students, low
tuition was more important in their college destination than it was for low SES
Chinese Americans and Southeast Asian Americans. Among the same groups,
students from high SES backgrounds also had the highest rates of indicating that
low tuition was important. For Chinese Americans and Southeast Asians, the
cost of tuition presented the largest gaps between the high and low SES
students, indicating a larger impact of socioeconomic class where the cost of
tuition is concerned. (Teranishi et al., 2004, pp. 538, 540)
Regarding student and parental knowledge of financing a college education,
Cabrera and La Nasa (2000) observed that “[i]n general, more affluent students,
compared with their less-well-off peers, . . . are more knowledgeable of college costs, . .
. and have parents who planned and saved for college expenses (p. 9).
Regarding loans, Campaigne and Hossler (1998), reviewing previous research
(Hossler, Braxton and Coopersmith, 1989; Newman, 1985; Paulsen, 1990), concluded
that “low- and moderate-income students are very price sensitive and averse to take out
loans. Middle-income students, and their parents, on the other hand, are not hesitant to
take out loans, indeed they often view loans as a good investment” (p. 94).
61
Investigating the effects of Federal Family Education Loans on the
postsecondary education decisions of traditional-age, full-time students, Campaigne
and Hossler (1998) found that these loans “seem to offer an added measure of flexibility
in college destination choices for middle- and upper-income students, but this benefit
appears to go hand in hand with a deleterious effect on the college choices of many
lower-income and minority students” (p. 97).
Choice. Research has consistently shown that the cost and financial aid
availability of a college/university is an important consideration as students choose the
institution of higher education to which they will matriculate. Paulsen (1990) listed “cost”
and “financial aid” among the top 10 “attributes which were found most often to
determine where students decided to enroll,” as he summarized representative research
related to college traits which distinguished between matriculation and nonmatriculation
at specific institutions during the final choice phase of the college choice process (p.
60). Likewise, Braxton (1990) included “tuition costs” and “availability of financial aid”
among the characteristics students rated as important in their decision to apply to or
attend a specific college or university (p. 60).
McDonough’s (1997) review of previous studies (Hossler, Braxton, and
Coopersmith, 1989; Manski and Wise, 1983; Zemsky and Oedel, 1983) identified
availability of financial aid among the factors “consistently influential” in the search and
choice phases of students’ college choice process (p. 4). Moreover, he found that
“student aid has been found to result in (1) increased consumption of higher education
and (2) redistribution of students to private, four-year, and smaller institutions”
(McDonough, 1997, p. 4).
62
Cabrera and La Nasa (2000), in their extensive review of previous research,
found that “[r]esearch consistently shows a significant and negative relationship
between tuition increases and enrollment, an empirical relationship that conforms to
public perceptions,” that “[l]ow-income students’ decisions to attend college appear to
be highly sensitive to tuition and financial aid levels,” and that “[a]lthough low-income
students can be adversely affected by tuition increases, financial aid can positively
predispose them to attend college” (pp. 12-13).
Hossler (2000), reviewing several meta-analyses on the effects of financial aid on
enrollment choices (Heller, 1997; Jackson, 1978; Leslie and Brinkman, 1987; St. John,
1990), observed that these reached similar conclusions,
[I]t typically requires larger scholarships to influence the enrollment decisions of
high-ability students. These students are heavily recruited by many colleges and
universities and are often offered many large scholarships. These students are
also more likely to be interested in institutions with higher levels of prestige and
greater selectivity. (pp. 81-82)
Harvard economists Christopher Avery and Caroline M. Hoxby’s article, entitled
“Do and Should Financial Aid Packages Affect Students’ College Choices?”, has been
called “the most precise examination yet on the impact of merit aid and aid package
strategies on the enrollment patterns of students of high ability” (Mills, 2004, p. 28).
Using data from the College Admissions Project, wherein researchers gathered data on
3,240 students from 396 United States high schools and utilizing the conditional logit
technique, Avery and Hoxby focused on how the college choice behaviors of high-ability
63
students are affected by their financial aid packages (Cheng, 2006, p. 115). Avery and
Hoxby (2004) concluded that
high-aptitude students . . . are sensitive to tuition, room, and board in the
expected direction (lower is better). . . . They are attracted by grants, loans, and
work-study commitments. . . . [However,] students whose parents have high
incomes or who themselves graduated from very selective colleges . . . exhibit
less sensitivity to variables that affect college costs.
This being said, the students in our sample exhibit some hard-to-justify
responses to aid that they are offered. They are excessively attracted by loans
and work study, given the value of these types of aid compared to grants. They
are attracted by superficial aspects of a grant, like its being called a scholarship
(with a name) and its being front-loaded. They are far more sensitive to a grant’s
share of the college’s comprehensive costs than they are to the amount of the
grant. . . . We should note that these peculiar behaviors are generally not shared
by the students whose parents have high incomes or who themselves attended
very selective colleges. (pp. 288-289)
Location
Predisposition. Hossler and Gallager (1987) observed that “[s]tudents who live
close to a campus are more likely to enroll in a college or university (and not necessarily
the one they live close to). Along with proximity, high school students who live in urban
and suburban areas are also more likely to go to college than are students from rural
settings” (p. 212).
64
Search. The location of a college or university is an important factor considered
by students during the search phase of the college choice process, as research has
shown. Although different terms were used (e.g., location, distance, distance from
home), Paulsen (1990), reviewing previous research (Litten and Brodigan, 1982;
Murphy, 1981; Ihlandfeldt, 1980; Gilmour et al., 1978; Leslie, Johnson, and Carlson,
1977; Lewis and Morrison, 1975), found that location is consistently highly ranked in
terms of importance during the search phase of the college choice process (pp. 47-48).
In Litten and Brodigan’s (1982) six-market study, location is included among the eight
college attributes which both students and parents rated as most important (Paulsen,
1990, p. 50).
Citing previous research (Gilmour and others, 1978; Tierney, 1983; Astin and
others, 1980), Braxton (1990) writes, “Most students establish limits on geographical
location and costs . . . . Once such limits are established, prospective students seek out
institutions that offer programs they desire” (p. 59). Paulsen (1990) found that “[i]n terms
of institutional characteristics, the attractiveness of college in general, and the
attractiveness of a particular college tend to increase” when “the distance from home to
college is less” (p. 27). However, “[a]t higher levels of student income and aptitude,
these effects become less important” (Paulsen, 1990, p. 27). Kinzie, Palmer, Hayek,
Hossler, Jacob, and Cummings (2000) provide some insights into the benefits of
choosing an institution close to home,
[It] is a way for many students to alleviate some of the burden of higher
education’s cost . . . . By attending a college close to home, students have the
option of living at home in order to avoid paying rent . . . . Additionally, attending
65
a local community or four-year college might ensure that a student can avoid
other costs and changes, such as finding a new place of employment, moving, or
making friends. (p. 38)
Some evidence indicate that location is weighted differently among diverse
groups of students. Paulsen, after reviewing previous research (Rosenfeld and Hearn,
1982; Tierney, 1984; Gilmour et al., 1978; Ihlanfeldt, 1980; Zemsky, Shaman, and
Berberich, 1980; Zemsky and Oedel, 1983), concluded that a person is “more likely to
apply to and attend an institution located a greater distance from home” when the
“student is male,” the “student’s parents have greater educational attainment,” the
“student family income is higher,” the “student academic aptitude is higher,” the “student
academic achievement is higher,” and the “student educational aspirations are higher”
(p. 57).
Along similar lines, Cabrera and La Nasa (2000), citing earlier studies (Flint,
1992, 1993; Hamrick and Hossler, 1996; Horn and Chen, 1998; Hossler, Schmit, and
Vesper, 1999; Hossler, Schmit, and Bouse, 1991; Hossler and Vesper, 1993; Leslie,
Johnson, and Carlson, 1997; McDonough, 1997; McDonough, Antonio, Walpole, and
Perez, 1998; Miller, 1997; Olivas, 1985; Tierney, 1980), found that “[i]n general, more
affluent students, compared with their less-well-off peers, . . . are more likely to broaden
the search to include a wider geographical range” (Cabrera & Nasa, 2000, p. 9).
Previously, Hossler and Gallagher (1987) had noted that “high-ability students
tend to conduct more sophisticated searches”; citing Zemsky and Oedel (1983), they
observed that “as the SAT scores and income level of potential matriculants fall, they
narrow the geographical range and the quality of the institutions they consider” (Hossler
66
& Gallagher, 1987, p. 214). Using a nationally representative sample of Asian American
first-year, first-time freshmen drawn from the 1997 Freshman Survey (sponsored by the
Cooperative Institutional Research Program at the University of California, Los
Angeles), Teranishi, Ceja, Antonio, Allen, and McDonough (2004) investigated the
“postsecondary decisions, opportunities, and destinations of APA students from
different ethnic and socioeconomic class backgrounds” (pp. 528, 532). They identified
socioeconomic class differences for the different ethnic subpopulations in the
type of institutions they attended. . . . Southeast Asians and Filipinos from lower-
income families were the most likely to choose a school near home. Interestingly,
Southeast Asians and Filipinos in the highest income bracket were also most
likely to indicate that living near home was very important. In addition, the gap
between the high- and low-income Southeast Asians and Filipinos was fairly
small compared to that of other ethnic groups. Thus, socioeconomic class was
less a factor in living near home than ethnicity. (Teranishi et al., 2004, p. 540)
Choice. Research has shown that the location of an institution is an important
consideration as students choose the institution of higher education to which they will
matriculate. Paulsen listed “location” among the top 10 “attributes which were found
most often to determine where students decided to enroll,” as he summarized
representative research related to college traits which distinguished between
matriculation and nonmatriculation at specific institutions during the final choice phase
of the college choice process (p. 60). Likewise, Braxton (1990) included “location or
distance from home” among the characteristics students rated as important in their
decision to apply to or attend a specific college or university (p. 60). Similarly,
67
McDonough’s (1997) review of previous studies (Hossler, Braxton, and Coopersmith,
1989; Manski and Wise, 1983; Zemsky and Oedel, 1983) identified location among the
factors “consistently influential” in the search and choice phases of students’ college
choice process (p. 4).
Rowe (2002), referring to other studies (Tierney, 1983; Tierney, Houang and
Henson, 1979; Litten and Brodigan, 1982), made a case for location as “critically
important not only in the search phase but also in the final selection phase,” and that
location is an important factor “for all seniors, at all levels of ability, first generation, or
having college educated parents, expecting to commut[e], or be a residential student”
(p. 59). However, as Espinoza noted, “Although most studies list this as an important
factor, rarely do students rate this as the most important factor driving their choice of a
college campus” (pp. 66-67). Avery and Hoxby (2004), using data from the College
Admissions Project (which includes data on 3,240 students from 396 United States high
schools), found that, in general, “high-aptitude students are nearly indifferent to a
college’s distance from their home, to whether it is in-state, and to whether it is public”
(p. 288).
Social Atmosphere
Search. The social atmosphere of a college or university is an important factor
considered by students during the search phase of the college choice process, as
research has shown. In Litten and Brodigan’s (1982) six-market study, social
atmosphere is included among the eight college attributes which both students and
parents rated as most important during the search and application process (Paulsen,
1990, p. 50). Similarly, Cabrera and La Nasa (2000), after examining previous studies
68
(Choy and Ottinger, 1998; Hossler, Schmit, and Vesper, 1999; McDonough, 1997;
Tinto, 1993), concluded that campus life is a primary consideration shaping actual
matriculation (pp. 9-10).
Capraro, Patrick, and Wilson (2004) found, in surveying high school juniors, that
“attractiveness of social life, defined in terms of characteristics of the people and
experiences to be found at a school, is at least as important as quality of education in
determining the likelihood of a candidate undertaking decision approach actions” toward
an institution of higher education (p. 93). They reported that
[t]he results suggest that after controlling for perceptions of quality of education,
there is a positive relationship between attractiveness of social life at a school
and likelihood to undertake decision approach actions (i.e., request information . .
. visit . . . apply) toward that school. (Capraro et al., 2004, pp. 99-100)
Using the National Education Longitudinal Study (NELS:88/92) and the
Beginning Postsecondary Student Longitudinal Study (BPS:90/92), Hurtado, Inkelas,
Briggs, and Rhee (1997) found that “the importance of the social atmosphere is
positively associated with large choice sets among white students but is actually
associated with smaller choice sets among African American students.” They postulate
that this “may be that few schools meet the social preference criteria among African
Americans, presumably because of the varying racial climates on college campuses”
(Hurtado et al., 1997, pp. 57, 60). Rowe (2002), after a limited literature review (Brown,
1991; Kealy and Rockel, 1987; Maguire and Lay, 1981; Carter, 1999), concluded, “All
students appear to consider student body characteristics and social environment in the
69
choice process, but according to their own characteristics they may be looking for
different institutional environments in the search for a comfortable fit” (p. 58).
Choice. Paulsen (1990) listed “social atmosphere” among the top 10 “attributes
which were found most often to determine where students decided to enroll,” as he
summarized representative research related to college traits which distinguished
between matriculation and nonmatriculation at specific institutions during the final
choice phase of the college choice process (p. 60). Likewise, Braxton (1990) included
“social atmosphere” among the characteristics students rated as important in their
decision to apply to or attend a specific college or university (p. 60).
Future Job Opportunities
Predisposition. Based on previous research, Paulsen (1990) concluded that a
person is more likely to want to attend college “when perceived economic benefits of
college are high” (p. 37).
Search. The job placement rate of a college or university is a factor considered
by students during the search phase of the college choice process, as research has
shown.
In Litten and Brodigan’s (1982) six-market study, careers available is included
among the eight college attributes which both students and parents rated as most
important during the search and application process (Paulsen, 1990, p. 50). Broekemier
(2002) found that job placement after graduation is “rated [among the] important choice
criteria for traditional-aged students” (p. 34). Likewise, citing earlier studies (Moore and
Elmer, 1992; Sanders, 1990; Swensen, 1998; Winston, 1999), Espinoza (2001) found
70
that “[s]tudents . . . report an interest in the job placement rate of program graduates” (p.
53).
Using a nationally representative sample of Asian American first-year, first-time
freshmen drawn from the 1997 Freshman Survey (sponsored by the Cooperative
Institutional Research Program at the University of California, Los Angeles), Teranishi,
Ceja, Antonio, Allen, and McDonough (2004) investigated the “postsecondary decisions,
opportunities, and destinations of APA students from different ethnic and socioeconomic
class backgrounds” (pp. 528, 532). They found that among all Asian American
subgroups, “students felt that being able to get a good job or going to a good graduate
program were also important to consider when selecting a college” (Teranishi et al.,
2004, p. 538).
Choice. Paulsen (1990) listed “jobs available” among the top 10 “attributes which
were found most often to determine where students decided to enroll,” as he
summarized representative research related to college traits which distinguished
between matriculation and nonmatriculation at specific institutions during the final
choice phase of the college choice process (p. 60).
Religious Emphasis
Choice. Referring to previous studies (Kuntz, 1987; Maguire and Lay, 1981),
Paulsen (1990) listed “religious emphasis” among the top 10 “attributes which were
found most often to determine where students decided to enroll,” as he summarized
representative research related to college traits which distinguished between
matriculation and nonmatriculation at specific institutions during the final choice phase
of the college choice process (p. 60).
71
However, a review of the literature by this researcher has not found religious
emphasis to be a major college choice factor studied. Nevertheless, there are some
research along these lines. Preferences regarding the religious emphasis of
colleges/universities may be more relevant for students from families with strong
religious beliefs, as well as for students who are in denominationally-affiliated school
settings. (Since the survey respondents for this study are from AAA High School, which
is a religious institution, this factor will be included in the survey.)
Surveying freshmen and transfer students at a denominationally-affiliated
college, Kellaris and Kellaris (1988) found that “religious orientation” was among the 11
enrollment decision factors mentioned by students (pp. 188, 190-191). Moss and
Cockriel (1990) studied reasons for college selection, using the American College
Testing Corporation’s ACT Alumni Survey data, which was gathered from 172
universities and colleges in 42 states, with over 77,000 alumni respondents (p. 4). They
concluded,
Our data clearly show that individuals do not choose to attend religious and
public colleges for the same reasons. Alumni from religious colleges revealed
that their parents, as well as the college’s social atmosphere, were more
influential in their choice of a college than did alumni of other types of schools.
Our data also show that these differences cannot be attributed to variation
between public and private schools alone nor to differences in schools size.
(Moss & Cockriel, 1990, p. 10)
72
Referring to earlier studies (Kellaris and Kellaris, 1988; MacDermott, Conn, and
Owen, 1985; Riesman, 1980; Tierney, 1988), Moss and Cockriel (1990) noted that this
conclusion was consistent with previous research,
As other researchers have found, compared to students who attend nonreligious
institutions, students who attend church-related colleges do so more because of
influences from parents and relatives . . . Christian parents influence their
children either because they attended a particular Christian college or have ties
to the sponsoring denomination . . . Many students are looking for a safe, moral
atmosphere . . . or want to avoid secular, cosmopolitan institutions. (p. 8)
Saggio (2001) investigated the influence of family on institutional choice, as well
as post-freshman persistence, of American Indian/Alaska Native students at American
Indian College (Phoenix, AR), by conducting interviews of 29 students. He reports his
findings,
Family was found to have both a positive and negative influence on choosing a
college . . . Positive influence of family towards choosing a college included
encouragement to attend, encouragement by example, and encouragement to
succeed. The negative influence of family towards choosing a college consisted
of bias against Bible colleges. (Saggio, 2001, p. 4)
Ihlanfeldt (1980) explains how preference in the area of religion may affect
college choice:
Each year many students select colleges with strong denominational ties. The
fact that a college has such an affiliation may be the main reason for choosing
the college. More often, however, a combination of factors influences the
73
decision. Denominational affiliation alone, without a history of academic
credibility, is not likely to attract many students. Yet, a college that has
maintained a reasonably distinguished academic reputation with strong
denominational ties should be in a strong market position. For many families, the
religious experience is as important as the academic experience, and for those
families the two should not be separated. (p. 25)
Significant Others
Parents
Parental encouragement and support is a factor that influences the
predisposition, search, and choice stages of the college choice process, while parental
collegiate experiences and parental saving for college affect the predisposition stage
(Cabrera & Nasa, 2000, p. 6). Referring to previous research (Cabrera and La Nasa,
2000a; Cabrera and La Nasa, 2000b; Choy, Horn, Nuñez, and Chen, 2000; Cabrera
and La Nasa, 2001; Conklin and Dailey, 1981; Flint, 1992; Keller and McKewon, 1984;
Hossler, 1999; Stage and Hossler, 1989), Bers and Galowich (2002) found that
[r]esearch shows that parents of four-year college students often play important
roles throughout the college choice process, both in terms of setting expectations
for their children and taking the more proactive approach of discussing college
plans and saving for college expenses. (p. 68)
However, as they also point out, some research (Hossler, 1999; Hossler,
Braxton, and Coopersmith, 1989) indicate that “the parental role in college choice is
greater during the earlier years of high school than later (i.e. when the disposition to
attend college is formed)” (Bers & Galowich, 2002). Similarly, Hossler and Foley (1995)
74
noted that some evidence indicate that high school students depend heavily on “internal
sources of information (parents and other family members) when they begin their
college choice process (freshman and sophomore years), but then they turn
increasingly to outside sources of information in their junior and senior years (peers,
teachers, and counselors)” (p. 25).
Some evidence suggest that “millennials,” referring to students born from 1982 to
the present, “are used to having their parents around, and many do not mind the
consultation and involvement of Mom and Dad” (Vander Schee, 2006, p. 7). The label
“helicopter parent” derives from “the behavior of parents who hover around their
children while on campus, are in constant communication, and are very engaged in the
lives of their kids” (Vander Schee, 2006, p. 7). Interestingly, “[t]he Avery and Hoxby
study [2004] treats parents as co-partners in the college selection process, which
echoes the finding of Howe and Strauss in Millennials Go to College, the 2003 follow-up
to the landmark Millennials Rising: The Next American Generation [2000]” (Mills, 2004,
p. 28).
According to the National Center for Education Statistics’ Descriptive Summary
of 2003-04 Beginning Postsecondary Students: Three Years Later, which describes a
nationally representative sample of students who began their postsecondary education
for the first time during the 2003-04 academic year,
Among all beginning postsecondary students, 36 percent had parents who had
not gone beyond high school, 25 percent had at least one parent with some
postsecondary education, and 39 percent had at least one parent with a
bachelor’s degree . . . .
75
The level of institution at which students first enrolled and parents’
education were related. For example, 65 percent of those enrolling at less-than-
2-year institutions had parents who had not gone beyond high school, compared
with 43 percent of those starting at 2-year institutions and 23 percent of those
starting at 4-year institutions. Conversely, 55 percent of students starting at the
4-year level had a parent with a bachelor’s degree, compared with 28 percent of
those at 2-year institutions and 15 percent of those at less-than-2-year
institutions. (Berkner et al., 2008, p. 34)
Predisposition. Paulsen (1990), after reviewing previous research (Stage and
Hossler, 1989; Davies and Kandel, 1981; Conklin and Dailey, 1981; Sewell and Shah,
1978; Spenner and Featherman, 1978), concluded that parental encouragement has
consistently emerged as the most influential factor on the formation of students’ college
aspiration (pp. 40-42). Furthermore, citing earlier studies (Stage and Hossler, 1989;
Tuttle, 1981; Conklin and Dailey, 1981; Carpenter and Fleishman, 1987; Davies and
Kandel, 1981), Paulsen (1990) concluded that a person is more likely to want to attend
college “when the parents’ educational attainment is greater,” “when the father’s
occupational status is higher,” and “when parental encouragement is greater” (p. 37).
MacDermott, Conn, and Owen (1987), investigating the influence of parental
educational level on college choice, found that students with college-educated parents
“said that they naturally assumed they would attend college, while the first generation
students indicated that it was discussed and seriously considered before a decision was
made” (p. 7). Referring to previous studies (Flint, 1992, 1993; Henderson and Berla,
1994; Hossler and Vesper, 1993; Hossler, Schmit and Vesper, 1999; Miller, 1997;
76
Perna, 2000; Stage and Hossler, 1989), Cabrera and La Nasa (2000) distinguish
between the two dimensions of parental encouragement. They write, “The first is
motivation: parents maintain high educational expectations for their children. The
second is proactive: parents become involved in school matters, discuss college plans
with their children, and save for college” (p. 8). McDonough (1997) pinpoints some
differences between low socioeconomic status, first-generation, college-bound students
and high socioeconomic status students whose parents had finished college:
Students who are first-generation college-bound begin to think about going to
college much later than do students whose parents have gone to college, and
those thoughts tend to be triggered by school personnel, specifically teachers
and counselors . . . Students who parents have attended college often get a head
start on college preparations in elementary school by taking the right courses and
maintaining good grades, and their families convey information to them about the
different types of colleges and universities. Meanwhile, first-generation college-
bound students do not get this information, oftentimes are not taking the right
courses, and are struggling with the cultural conflicts between their new college-
oriented world and the world of their friends, families, and communities. (p. 6)
Furthermore, as Lange and Stone (2001) note,
college-educated parents are more likely to start a college savings account for
their children and engage in more frequent discussions about college with their
children . . . By contrast, first-generation students report less family support for
their college aspirations and often have less factual information about college.
(pp. 22-23)
77
The degree of parental encouragement seems to be moderated by students’
academic ability, as occupational attainment research suggests that parents give the
most encouragement to their child with the highest academic ability (Cabrera & Nasa,
2000, p. 9).
Using data from the National Educational Longitudinal Study of 1988 (NELS),
which started with surveying a nationally representative sample of 1988 eighth graders,
with follow-up surveys in 1990, 1992, and 1994, research by Choy, Horn, Nuñez and
Chen (2000) suggest that “parents, peers, and school personnel can all contribute to
increasing the college enrollment rates of students at risk of dropping out of high school
and of students whose parents had no college experience” (pp. 46, 51). With regards to
graduates who had been at moderate to high risk of dropping out of high school, Choy
et al. (2000) found that
[p]arental involvement was . . . important in predicting enrollment. The odds of
enrolling in college were almost twice as great for students whose parents
frequently discussed school-related matters with them as for those whose
parents had little or no discussion with them. (pp. 53, 56)
With regards to graduates whose parents had no college experience, Choy et al.
(2000) found that
[a]long with being less likely to participate in a rigorous mathematics curriculum,
students whose parents did not attend college were also less likely than their
peers with more educated parents to participate in planning activities that lead to
college enrollment, even when the students were college qualified, as defined
earlier. (p. 59)
78
Search. Mansfield and Warwick (2005), after reviewing previous studies (The
Carnegie Foundation, 1986; Dixon and Martin, 1991; Flint, 1992), noted that these “all
report[ed] high school seniors identify[ing] parents as primary influencers in college
choice decisions and the most influential people in helping them select a college” (pp.
50-51). Likewise, Paulsen (1990) concluded, “The studies seem to suggest that, in
general, the most preferred sources of information about college attributes in the search
and application phase include admissions officers, college publications, high school
counselors, alumni, college students, commercial guides, campus visits, and parents”
(p. 53).
Paulsen (1990), after reviewing previous research (Zemsky, Shaman, and
Berberich, 1980; Hearn, 1984; Tierney, 1984; Zemsky and Oedel, 1983; Conklin and
Dailey, 1981), found that when students’ parents have greater educational attainment,
he/she is more likely to apply to, or attend, a more highly selective institution, a high-
cost institution, an institution located a greater distance from home, a private (rather
than a public) institution, and a four-year institution; moreover, when student’s parental
encouragement is stronger, a person is more likely to apply to and attend a four-year
institution (pp. 55-58). Similarly, the study done by MacDermott, Conn, and Owen
(1987) found that first-generation students “were more likely to select schools of less
stature or reputation,” were “more likely to choose a community college,” and chose an
in-state school (p. 8).
Some research found that students with parents of higher educational attainment
“are more likely to emphasize the importance of programs and high academic
standards, and less likely to show concern about costs” (Paulsen, 1990, pp. 48-49).
79
Moreover, these students “tend to rely more on their parents for information and less on
high school counselors” and “are more inclined to use commercial guidebooks, campus
visits, admissions officers, and alumni,” while students with parents of lower educational
attainment “depend more on the advice of high school counselors and unrequested
publications” (Paulsen, 1990, p. 54). Furthermore, parents “generally defined the cost,
geographic, and quality boundaries within which [their sons/daughters] were to remain
in making their college selection. . . . [and] this boundary setting had a subtle but
pervasive effect throughout . . . the college selection process” (Paulsen, 1990, p. 49).
MacDermott, Conn, and Owen (1987), investigating the influence of parental
educational level on college choice, found that
[w]hen evaluating the factors important in selecting a college, first generation
students were more concerned about financial aid, scholarships and tuition cost
than were second generation students. Second generation students indicated
more often that extracurricular activities were an important factor in choosing a
school. . . .
When describing a school of strong reputation, the first generation
attenders were more likely to feel that solid financial backing, graduate degrees,
and recognition for academic research were important characteristics. On one
question, the second generation students exhibited attitudes different from those
of their parents, agreeing that large lecture classes provide good instruction.
They supported their parents’ view that student involvement with faculty is an
important part of a school of academic quality. (pp. 7-8)
80
MacDermott et al. (1987) also found that “[f]irst generation students considered a
smaller number of institutions and traveled fewer miles to visit a school” than students
with college-educated parents (p. 8). In Litten and Brodigan’s (1982) six-market study,
the eight college attributes which both students and parents rated as most important
during the search and application process included financial, fields of study, academic
reputation, teaching quality, academic standards, location, social atmosphere, and
careers available (Paulsen, 1990, p. 50). Moreover, in the same study, students and
parents identified the same six most preferred sources of information: admissions
officers, college publications, high school counselors, commercial guides, alumni, and
college students, with the lone exception being that “parents would add college faculty
to the preferred list and students would not” (Paulsen, 1990, p. 50).
Mansfield and Warwick (2005) surveyed seniors from eight private, religiously
affiliated schools from five states, evaluating the gender differences between students
and between parents as to how they rate the level of importance of 19 college selection
criteria, grouped into five categories: financial, social, psychological, physical, and
functional.
The financial category includes the criteria of tuition, scholarships, and financial
aid. The physical category has the criteria of security/safety, size, location, and weather.
The functional category lists the criteria of academics, degrees, and professors. The
social category contains the criteria of cultural diversity, friendly atmosphere, friends,
prospects for marriage, social activities, athletics, and religious atmosphere. The
psychological category has the criteria of reputation of the school and reputation of the
degree (Mansfield & Warwick, 2005).
81
With regards to the parents surveyed, Mansfield and Warwick (2005) found that
these categories were ranked differently by male and female parents, “with the males
ranking the groups in order of financial, psychological, functional, social, and physical.
Female parents felt the functional group was the most important, with financial following
second, then physical, psychological, and social” (Mansfield & Warwick, 2005, pp. 69,
71). For parents, the most important criterion was academics (Mansfield & Warwick,
2005, p. 47).
For the “financial” category, the study found that “all three financial risk criteria
were found in the top ten by level of importance” for the parent groups (Mansfield &
Warwick, 2005, p. 71). For the “physical” category, the study found that the majority of
the physical criteria “are not of major importance in the scheme of overall evaluation”; of
interest is the finding that “safety/security is of more importance to parents than to their
children with both mothers and fathers placing it in the top five criteria” (Mansfield &
Warwick, 2005, p. 73). For the “functional” category, the study found that “all three of
the functional risk criteria are attributes that are of importance to incoming students and
parents, both male and female. However, academics are clearly of greater importance”
(Mansfield & Warwick, 2005, p. 73). For the “social” category, the study found that “both
male and female parents ranked religious atmosphere as the number one criterion of
importance when choosing a college for their children”; however, the authors
acknowledged that “[t]his finding is most likely due to the sample used in this study and
cannot necessarily be generalized to other institutions” (Mansfield & Warwick, 2005, p.
74). All of the other social criteria were ranked below the top ten in importance
(Mansfield & Warwick, 2005, p. 74). For the “psychological” category, the study found
82
that the “reputation of the school was found to be ranked third in level of importance for
the male parents, and eighth for females” (Mansfield & Warwick, 2005, p. 74).
Using the National Education Longitudinal Study (NELS:88/92) and the
Beginning Postsecondary Student Longitudinal Study (BPS:90/92), Hurtado, Inkelas,
Briggs, and Rhee (1997) discuss their findings which relate to the number of
applications students submit across racial/ethnic lines,
For white students, father’s education is a significant predictor of the number of
applications individuals will submit. While mother’s education is significantly
correlated with the number of applications a student submits, this drops to
nonsignificance when other controls are employed. However, this relationship
between parental education and the number of applications submitted is not
significant across the other racial/ethnic groups. This may indicate that while
African American and Latino parents may have high aspirations for their children,
family income differences play a more significant role than parents’ education in
determining different strategies for selecting a range of colleges. Since measures
of ability are the main predictors of the number of college applications submitted
among Asian Americans, it may be that the advice that these families provide is
strongly linked with the students’ achievement since neither family income nor
parental education are significantly associated with strategies for selecting a
range of institutions for college applications. (p. 57)
Choice. McDonough’s (1997) review of previous studies (Hossler, Braxton, and
Coopersmith, 1989; Manski and Wise, 1983; Zemsky and Oedel, 1983) identified
parents among the factors “consistently influential” in the search and choice phases of
83
students’ college choice process (p. 4). Using data from the College Admissions Project
(which includes data on 3,240 students from 396 United States high schools), Avery
and Hoxby (2004) found that, overall, “students whose parents have high incomes or
who themselves graduated from very selective colleges . . . exhibit[ed] less sensitivity to
variables that affect college costs” (p. 288). In their study, MacDermott, Conn, and
Owen (1987) found a
disparity in responses between students and parents when indicating whether or
not they reached agreement on the student’s college choice. Invariably the
students felt that the parents had agreed with their selection. The parents,
however, admitted that the agreement was more often only partial. This seems to
indicate that the parents have allowed for a freer range of choice as the selection
process advances. They act primarily as a veto, permitting the stuent to make a
choice, which may not be their own first choice, but is acceptable nevertheless.
(p. 9)
Guidance Counselors
Rowe (2002) observed that “[r]esearch on the influence of school counselors on
the college choice process is not extensive and its conclusions are not unanimous on
the strength of this influence” (p. 48). Moreover, there is some evidence that points to
the “declining influence of the high school counselor in the college choice process of
seniors” (Rowe, 2002, pp. 50-51). Hossler and Foley (1995) noted that some evidence
indicates that high school students depend heavily on “internal sources of information
(parents and other family members) when they begin their college choice process
84
(freshman and sophomore years), but then they turn increasingly to outside sources of
information in their junior and senior years (peers, teachers, and counselors)” (p. 25).
Predisposition. Based on previous research, Paulsen (1990) concluded that a
person is more likely to want to attend college “when school counselors encourage
college attendance” (p. 37).
Search. The guidance counselor(s) of a high school are important sources of
information consulted by students during the search phase of the college choice
process, as research has shown. In Litten and Brodigan’s (1982) six-market study, high
school counselors is included among the six most preferred sources of information by
students and parents during the search and application process (Paulsen, 1990, p. 50).
Braxton’s (1990) limited literature review included guidance counselors among the most
frequently used sources of information by students during the search stage (p. 59).
Paulsen (1990), after reviewing previous research (Leslie, Johnson, and Carlson, 1977;
Lewis and Morrison, 1975; Gilmour et al., 1978), concluded, “The studies seem to
suggest that, in general, the most preferred sources of information about college
attributes in the search and application phase include admissions officers, college
publications, high school counselors, alumni, college students, commercial guides,
campus visits, and parents” (p. 53).
Some research indicate that preferred information sources may differ by student
gender, parental education, and socioeconomic status (Paulsen, 1990, pp. 53-54).
Referring to previous studies (Lewis and Morrison, 1975; Gilmour et al., 1978; Litten,
1982; Leslie, Johnson and Carlson, 1977), Paulsen (1990) found that men, students
with lower parental education, and students at lower income levels rely more on high
85
school counselors (pp. 53-54). Cabrera and La Nasa (2000), reviewing previous studies
(Berkner and Chavez, 1997; Tierney, 1980; Leslie, Johnson, and Carlson, 1977), found
“low-SES students relying on high school counselors as the single most likely source of
information about college [while, in contrast] upper-income students report a variety of
sources” (pp. 10-11). As Espinoza insightfully observed, “Although the opinions of these
educational professionals may not be influential to all prospective students, they are
uniquely positioned in high schools to shape the early perceptions of students about
their higher educational options, particularly in-state ones” (pp. 47-48).
Choice. McDonough’s (1997) review of previous studies (Hossler, Braxton, and
Coopersmith, 1989; Manski and Wise, 1983; Zemsky and Oedel, 1983) identified
guidance counselor among the factors “consistently influential” in the search and choice
phases of students’ college choice process (p. 4). Regarding the role of counselors in
the final phase of students’ college choice process, Espinoza (2001) concluded,
Although several studies report that most students consider their high school
counselor as a source of information, there is not much evidence that high school
counselors influence the final college choice decision . . . Most high school
counselors, in fact, report that they do not influence the college choice decision
and view their role as one of only providing students with information about
possible college choice options . . . Thus, although these educational
professionals are well-positioned to influence the college search process, they do
not play a large role in the final college choice. (p. 65)
86
Friends
Predisposition. Paulsen (1990), based on previous research (Carpenter and
Fleishman, 1987; Manski and Wise, 1983; Davis and Kandel, 1981; Nolfi et al., 1978),
concluded that a person is more likely to want to attend college “when student peers
plan to go to college” (p. 37).
Search and Choice. Friends are important sources of information consulted by
students during the search and choice phases of the college choice process, as
research has shown. McDonough’s (1997) review of previous studies (Hossler, Braxton,
and Coopersmith, 1989; Manski and Wise, 1983; Zemsky and Oedel, 1983) identified
peers and friends among the factors “consistently influential” in the search and choice
phases of students’ college choice process (p. 4). Lewis and Morrison (1975) included
“friends” among the information sources on which students frequently rely (Paulsen,
1990, p. 53). Rowe (2002), in her limited review of literature (Mathay, 1989; Carnegie
Foundation for the Advancement of Teaching, 1986), found friends and peers to be
influential in the college choice process (pp. 46-48).
Using data from the National Educational Longitudinal Study of 1988 (NELS),
which started with surveying a nationally representative sample of 1988 eighth graders,
with follow-up surveys in 1990, 1992, and 1994, research by Choy, Horn, Nuñez and
Chen (2000) suggest that “parents, peers, and school personnel can all contribute to
increasing the college enrollment rates of students at risk of dropping out of high school
and of students whose parents had no college experience” (pp. 46, 51). Their study
found that
87
[p]eer group effects were especially strong. In fact, having friends with college
plans was the strongest predictor of college enrollment. If most or all of their
friends had college plans, the odds of moderate- to high-risk students enrolling in
college were four times higher than if none of their friends planned to go to
college. (Choy et al., 2000, p. 53)
However, Braxton’s (1990) research found that “encouragement from peers has
little relationship to the type of institution selected” (i.e. selective, private versus public,
etc.) (p. 60).
College/University Search Activities: College Marketing
“The higher education marketplace has become increasingly noisy; students and
their families are inundated with direct mailings, telemarketers, . . . television, radio, and
billboard advertisements,” and now e-mail and internet advertisements (Hossler &
Foley, 1995, pp. 21-22). College marketing techniques now involve the juxtaposition of
traditional venues and newer methods, which harness the power of cutting-edge
technologies. As Kinzie, Palmer, Hayek, Hossler, Jacob, and Cummings (2004) note,
Although institutional recruiting still included the staples of direct mail, visits to
high schools, college fairs and campus visits, colleges and universities adopted
more sophisticated marketing and recruiting strategies. New marketing media
and techniques such as CD-ROMs, electronic mail distributions, permission
marketing and the World Wide Web altered the way colleges and universities
communicated with prospective students. . . .
Today, the amount of information about postsecondary education
available to students can be overwhelming. Many potential applicants receive
88
campus viewbooks and direct mail, listen to the anecdotal testimony of friends
and families, and learn about potential colleges and universities through Web
sites, college ranking guidebooks, videocassettes, DVDs and CD-ROMs. (pp. 33,
35)
Indeed, as Hossler (1999) observed, “The Web has the greatest potential for an
immediate impact by rapidly expanding the levels of personalized service for
prospective and currently enrolled students” (p. 25).
Search
Hossler and Foley (1995) noted that “[r]esearch suggests that students do not
rely on written material (college catalogues, viewbooks, and other written material)
extensively until they are well into the college decision-making process” (p. 24). After
reviewing previous research (Leslie, Johnson, and Carlson, 1977; Lewis and Morrison,
1975; Gilmour et al., 1978), Paulsen (1990) concluded, “The studies seem to suggest
that, in general, the most preferred sources of information about college attributes in the
search and application phase include admissions officers, college publications, high
school counselors, alumni, college students, commercial guides, campus visits, and
parents” (p. 53). Braxton’s (1990) limited literature review yielded a variety of
information sources used by high school students during the search stage, including
college guidebooks, friends, campus visits, college publications (e.g. catalogues),
guidance counselors, current college students, and admissions officers (p. 59). In Litten
and Brodigan’s (1982) six-market study, both students and parents identified the same
six most preferred sources of information during the search and application process:
admissions officers, college publications, high school counselors, commercial guides,
89
alumni, and college students, with the lone exception being that “parents would add
college faculty to the preferred list and students would not” (Paulsen, 1990, p. 50).
However, as Hossler and Foley (1995) note, the impact of written materials from
colleges on students’ choices is not clear.
Chapman (1981), for example, found that most students used college catalogues
to confirm decisions they had already made about institutions rather than to help
them decide which campuses to more seriously consider and which institutions to
drop from further consideration. In their review of existing research on college
choice, Hossler, Braxton, and Coopersmith (1989) noted that admissions
representatives and college-marketing efforts (except for financial aid offers)
have only a minor effect on student enrollment decisions. (Hossler & Foley, 1995,
p. 26)
Paulsen (1990) finds that “the preferred information sources may vary according
to some student characteristics including sex, race, parental education, income, and
academic ability” (p. 53). He observes,
While men and women utilize college catalogs and campus visits with similar
frequency, women tend to seek the advice of college students more than men
do, while men rely more on high school counselors than women do . . . Blacks
appear to consult a greater variety of information sources than whites do. . . .
Students with higher levels of parental education tend to rely more on their
parents for information and less on high school counselors. Such students also
are more inclined to use commercial guidebooks, campus visits, admissions
officers, and alumni. Students with lower parental education depend more on the
90
advice of high school counselors and unrequested publications . . . Students at
higher income levels also tend to depend more on their parents for information,
while lower-income students more often consult with high school counselors.
(Paulsen, 1990, pp. 53-54)
Similarly, Cabrera and La Nasa (2000), reviewing previous studies (Tierney,
1980; Leslie, Johnson, and Carlson, 1977), found “low-SES students relying on high
school counselors as the single most likely source of information about college [while, in
contrast,] upper-income students report a variety of sources including parents, students,
catalogues, college representatives, and private guidance counselors” (pp. 10-11).
Extrapolating from “more broadly based studies on the college choice processes
of traditional age high school students,” Hossler and Foley (1995) conclude that “[t]he
limited research available and the observations and experiences of admissions officers
suggest that guidebooks and ratings have a small to negligible impact on most students
considering colleges and universities” (pp. 21-23). They suggest that
[f]or many students and their families, these guidebooks [e.g. U.S. News & World
Report’s “America’s Best Colleges” and Money Guide: Your Best College Buys
Now] may have little impact or serve only as confirmatory devices, helping them
to feel comfortable with decisions they have already made. However, for middle-
and upper-middle-class students and parents, especially those considering
regional private and public institutions, ratings and rankings may be important
sources of information that help to eliminate some colleges and universities from
further consideration, while elevating others for further evaluation. (Hossler &
Foley, 1995, p. 29)
91
Drawing data from the Cooperative Institutional Research Program’s (CIRP)
1995 Freshman Survey, McDonough, Antonio, Walpole, and Pérez (1998) investigated
the importance of national college rankings to the college choice decisions of students.
They found that “[o]verall, 59.9% of students find rankings to be not at all important,
29.6% cite rankings as somewhat important, and 10.5% rate them as very important in
their college choices” (McDonough, Antonio, Walpole, & Pérez, 1998, p. 520).
Moreover,
students who find newsmagazine rankings to be very important in the process of
choosing their college are distinct from other students in a number of important
ways. First, these students are more likely to be Asian-American, from high-
income families, and from families with college-educated parents. They are also
more likely to ask their high school teachers for advice, receive A grade in high
school, and have intentions of getting doctoral, medical, or law degrees. At
higher rates than other students, they live away from home during college,
expect to be satisfied with college, and have more favorable assessments of their
academic ability and motivation. Finally, students who place a high importance
on national rankings of colleges are more likely to file higher numbers of
applications and attend private universities. (McDonough et al., 1998, p. 523)
Using a nationally representative sample of Asian American first-year, first-time
freshmen drawn from the 1997 Freshman Survey (sponsored by the Cooperative
Institutional Research Program at the University of California, Los Angeles), Teranishi,
Ceja, Antonio, Allen, and McDonough (2004) investigated the “postsecondary decisions,
opportunities, and destinations of APA students from different ethnic and socioeconomic
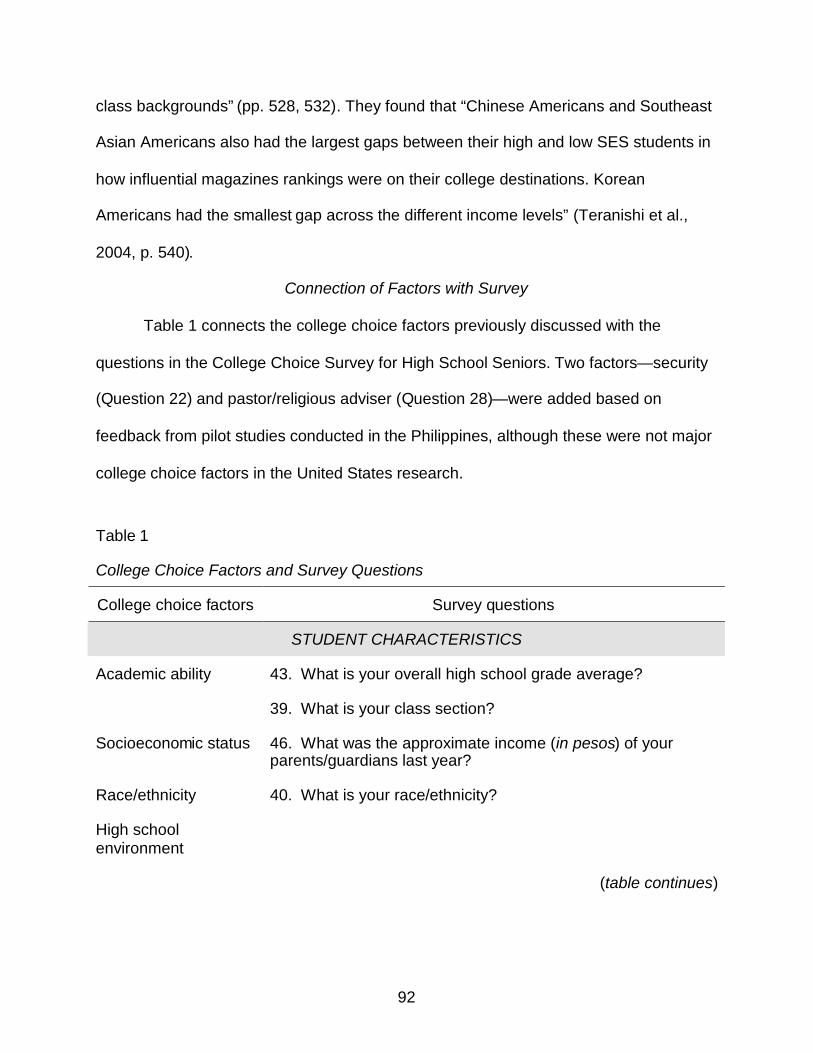
92
class backgrounds” (pp. 528, 532). They found that “Chinese Americans and Southeast
Asian Americans also had the largest gaps between their high and low SES students in
how influential magazines rankings were on their college destinations. Korean
Americans had the smallest gap across the different income levels” (Teranishi et al.,
2004, p. 540).
Connection of Factors with Survey
Table 1 connects the college choice factors previously discussed with the
questions in the College Choice Survey for High School Seniors. Two factors—security
(Question 22) and pastor/religious adviser (Question 28)—were added based on
feedback from pilot studies conducted in the Philippines, although these were not major
college choice factors in the United States research.
Table 1
College Choice Factors and Survey Questions
College choice factors Survey questions
STUDENT CHARACTERISTICS
43. What is your overall high school grade average?Academic ability
39. What is your class section?
Socioeconomic status 46. What was the approximate income (in pesos) of yourparents/guardians last year?
Race/ethnicity 40. What is your race/ethnicity?
High schoolenvironment
(table continues)
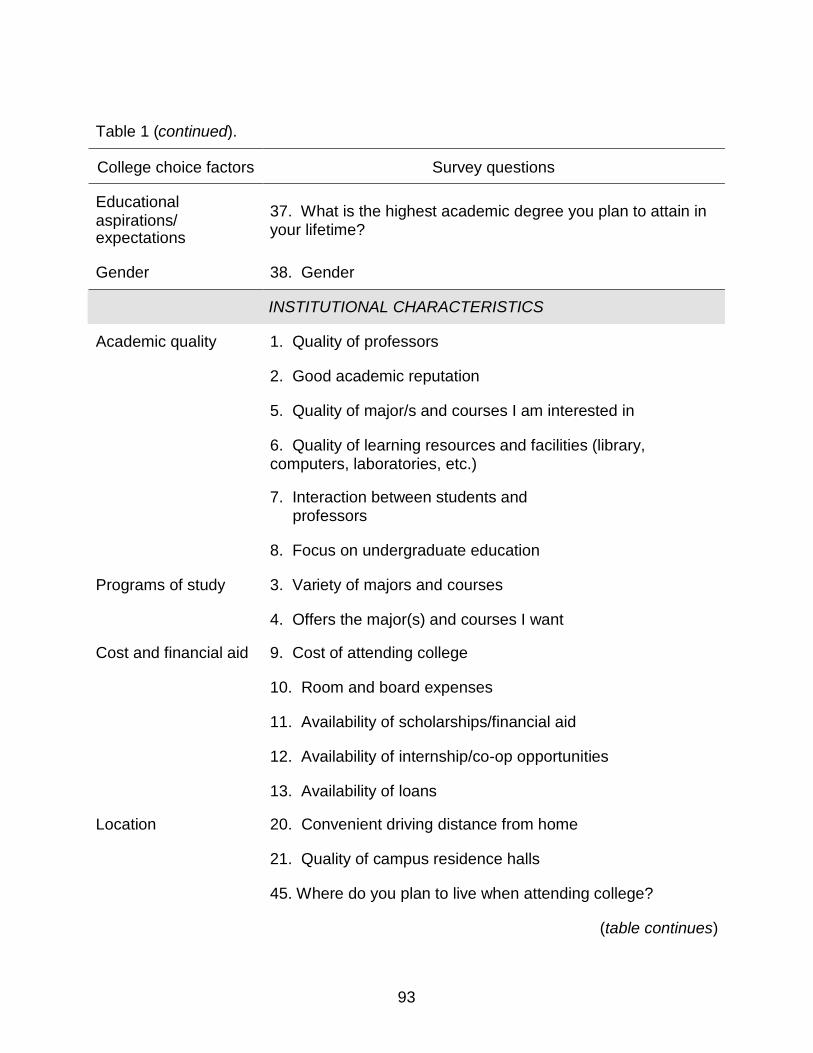
93
Table 1 (continued).
College choice factors Survey questions
Educationalaspirations/expectations
37. What is the highest academic degree you plan to attain inyour lifetime?
Gender 38. Gender
INSTITUTIONAL CHARACTERISTICS
1. Quality of professors
2. Good academic reputation
5. Quality of major/s and courses I am interested in
6. Quality of learning resources and facilities (library,computers, laboratories, etc.)
7. Interaction between students andprofessors
Academic quality
8. Focus on undergraduate education
3. Variety of majors and coursesPrograms of study
4. Offers the major(s) and courses I want
9. Cost of attending college
10. Room and board expenses
11. Availability of scholarships/financial aid
12. Availability of internship/co-op opportunities
Cost and financial aid
13. Availability of loans
20. Convenient driving distance from home
21. Quality of campus residence halls
Location
45. Where do you plan to live when attending college?
(table continues)
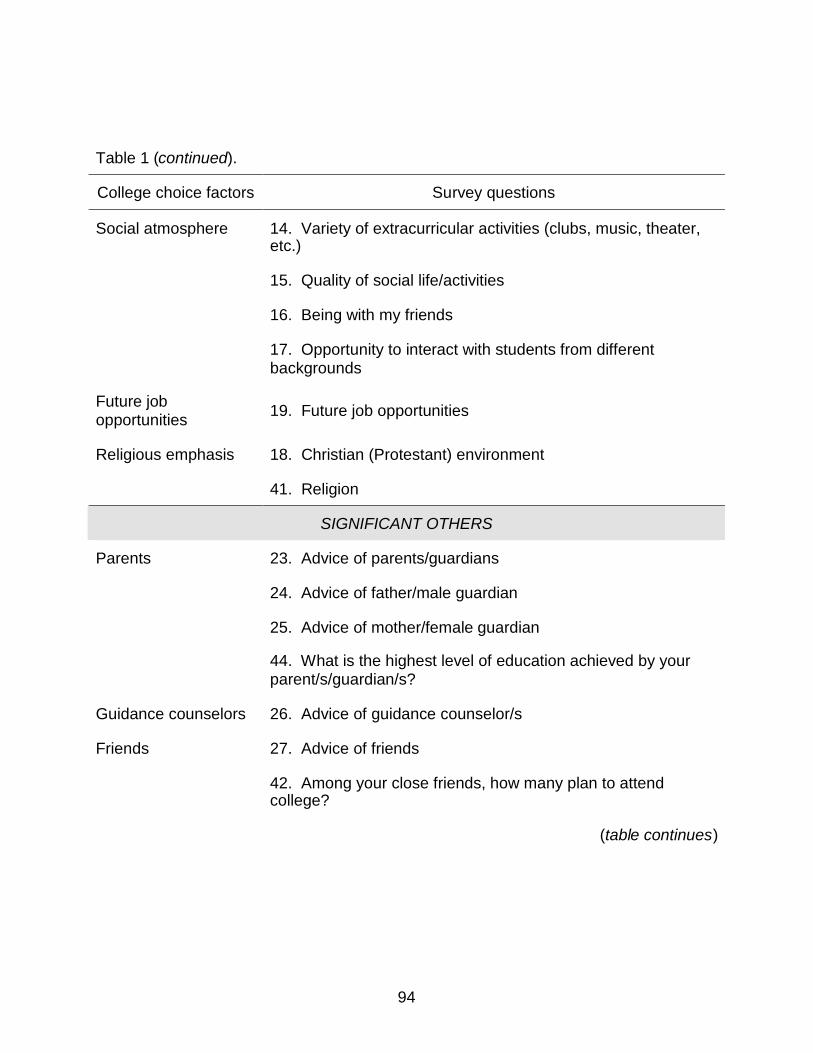
94
Table 1 (continued).
College choice factors Survey questions
14. Variety of extracurricular activities (clubs, music, theater,etc.)
15. Quality of social life/activities
16. Being with my friends
Social atmosphere
17. Opportunity to interact with students from differentbackgrounds
Future jobopportunities 19. Future job opportunities
18. Christian (Protestant) environmentReligious emphasis
41. Religion
SIGNIFICANT OTHERS
23. Advice of parents/guardians
24. Advice of father/male guardian
25. Advice of mother/female guardian
Parents
44. What is the highest level of education achieved by yourparent/s/guardian/s?
Guidance counselors 26. Advice of guidance counselor/s
27. Advice of friendsFriends
42. Among your close friends, how many plan to attendcollege?
(table continues)
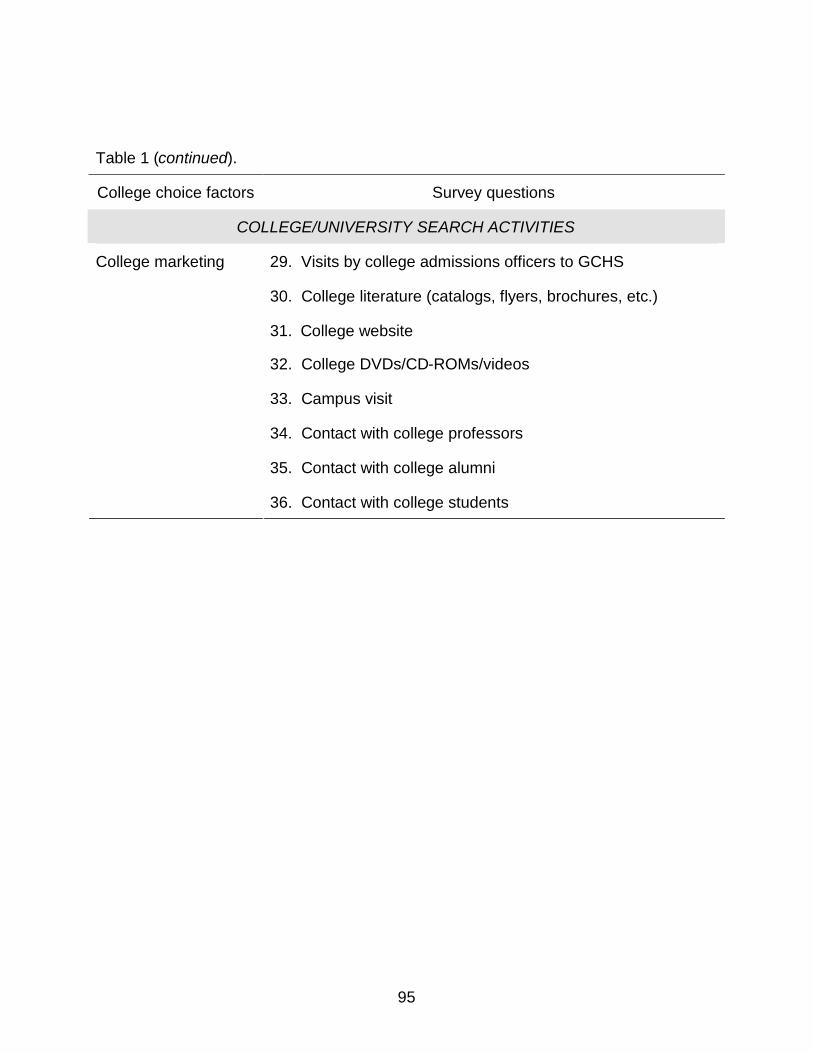
95
Table 1 (continued).
College choice factors Survey questions
COLLEGE/UNIVERSITY SEARCH ACTIVITIES
29. Visits by college admissions officers to GCHS
30. College literature (catalogs, flyers, brochures, etc.)
31. College website
32. College DVDs/CD-ROMs/videos
33. Campus visit
34. Contact with college professors
35. Contact with college alumni
College marketing
36. Contact with college students
96
Philippine Higher Education and College Choice Research
This section will provide some background of the Philippines and its educational
system, briefly elaborate on aspects of Philippine higher education, and review college
choice research in that country.
Background
The Philippines
The Philippines is a Southeast Asian archipelago with 7,107 islands, spanning
some 1,200 miles (north to south) (Swinerton, 1991, p. 11). As of May 2000, the
nation’s population numbered some 76.5 million (The Official Website of the Republic of
the Philippines: General Information, 2008). This tropical country is composed of three
island groups—Luzon (north), Visayas (central), and Mindanao (south). The nation has
“17 regions, 81 provinces, 136 cities, 1,494 municipalities, and 41,995 barangays”; a
barangay is the “smallest political unit into which cities and municipalities in the
Philippines are divided. . . . consist[ing] of less than 1,000 inhabitants residing within the
territorial limit of a city or municipality” (The Official Website of the Republic of the
Philippines: General Information, 2008).
According to the country’s official website, “Filipinos are probably one of the few,
if not the only, English-proficient Oriental people today. Filipino is the official national
language, with English considered as the country's unofficial one” (The Official Website
of the Republic of the Philippines: General Information, 2008). Moreover, English is “the
medium of instruction in higher education” (The Official Website of the Republic of the
Philippines: General Information, 2008). By one estimate, this country has around “76 to
78 major language groups, with more than 500 dialects” (The Official Website of the
97
Republic of the Philippines: General Information, 2008). In the area of religion, “[s]ome
80 percent of the population is Catholic, Spain's lasting legacy. About 15 percent is
Moslem and these people can be found basically in Mindanao. The rest of the
population is made up mostly of smaller Christian denominations and Buddhist” (The
Official Website of the Republic of the Philippines: General Information, 2008).
Zwaenepoel (1975), who wrote the 768-page Tertiary Education in the
Philippines, 1611-1972: A Systems Analysis, observed that “[t]he Filipino has . . . a
foothold in many cultural spheres: the Malayan, the Anglo-Saxon, the Hispanic, the
Hindu-Islamic, and even the Chinese” (p. 473). The Filipino culture is a blend of the
Hispanic, Islamic, American and Chinese cultures, reflecting diverse ethnic and
historical influences (Philippine Higher Education: A Brief Guide, n.d., p. 2). Close family
ties are said to be inherited from the Chinese, the piety of the people from the
Spaniards, and gracious hospitality is a common Filipino trait (Philippine Higher
Education: A Brief Guide, n.d., p. 2).
The Educational System
The Philippine formal educational system is a sequential progression of
academics at three levels—elementary, secondary, and tertiary (Philippine Higher
Education: A Brief Guide, n.d., p. 3). Classes begin in June and end in March; Philippine
universities and colleges “follow the semestral calendar from June-October and
November-March” (The Official Website of the Republic of the Philippines: General
Information, 2008).
Elementary and Secondary Education. Elementary education is the first stage of
formal schooling, with six years of instruction for children around 7 to 12 years old.
98
Secondary education is the next stage, entailing four years of schooling for young
people around 13 to 16 years old (Philippine Higher Education: A Brief Guide, n.d., p.
3). The Department of Education (formerly known as the Department of Education,
Culture and Sports) supervises the nation’s 48,446 elementary and secondary schools,
divided as follows: 40,763 elementary schools (36,234 public and 4,529 private), 7,683
secondary schools (4,422 public and 3,261 private) (Republic of the Philippines
Department of Education: Historical Perspective of the Philippine Educational System,
2008). After graduating from high school, students may opt to continue their formal
schooling by taking technical-vocational courses, or enrolling in a college or university.
Post-Secondary Technical and Vocational Education. Post-secondary technical-
vocational education provides skills orientation training and development for a particular
occupation or group of middle-level occupations. It is structured, leading to one- or two-
year certificates for middle-level occupations (Philippine Higher Education: A Brief
Guide, n.d., p. 4). The Technical Education and Skills Development Authority (TESDA)
is the national agency that plans, sets standards, coordinates, monitors and allocates
resources in this area (Philippine Higher Education: A Brief Guide, n.d., p. 4).
Higher Education in the Philippines: A General Overview
This section will address historical milestones, the creation of the Commission on
Higher Education (CHED), some current aspects of Philippine higher education, and
attitudes towards higher education.
Historical Milestones
Spanish Colonization (1521-1898). The University of Santo Tomas, which was
able to grant doctoral degrees by the end of the Spanish period, is an enduring legacy
99
of Hispanic rule (Gonzalez, 1997, p. 272). Some other contributions in education
included parish schools which taught basic literacy and religion in over one thousand
areas, seminaries which also admitted nonclerical students, secondary-level convents
for girls, and some nationally known secondary schools (e.g., the Ateneo Municipal and
the Colegio de San Juan de Letran for boys) (Gonzalez, 1997, p. 272).
American Period (1898-1946). In the American period, several tertiary-level
institutions were founded. These included the University of the Philippines, the
Philippine Colleges of Arts and Trade, the Philippine Normal School, and the Philippine
College of Commerce. Arts and trades schools, as well as agricultural schools, were
established throughout the nation (Gonzalez, 1997, p. 272). During this time, private
colleges and universities served only 11 percent of the college population, while
government institutions served 89 percent of the students (Gonzalez, 1997, p. 272).
This period saw the setup of a system of public elementary schools, which has been
responsible for the growth of literacy and the present educational level of Filipinos
(Gonzalez, 1997, p. 272).
According to Gonzalez (1989), in the area of higher education, “the one failure of
the American Colonial Government . . . was the failure to establish an indigenous
tradition of research except at the University of the Philippines, because of the long
period of gestation that a research tradition demands” (p. 119). He observed that “[t]he
private institutions were, for the most part, teaching institutions” (Gonzalez, 1989, p.
121). Rather,
[t]he focus of Philippine higher education then was professional training, a
carrera (literally, Spanish “career” but here meaning professional preparation for
100
a career), embedded in the Philippine psyche by the Spanish tradition: law,
medicine, the priesthood, and, as a result of American influence, other carreras
such as engineering, nursing, business (commerce) and economics, agriculture,
medical technology and computer science. (Gonzalez, 1989, p. 122)
Post-World War II. The postwar independence government adopted a laissez-
faire policy in education. Private schools were permitted to be established without tuition
regulations, without efforts to direct students towards specific fields, but with state
supervision regarding compliance to minimum standards. These schools were
supported by tuition fees alone, without state aid (Gonzalez, 1997, pp. 265, 272-273). At
one point, almost 85 percent of students were attending private universities (Gonzalez,
1997, pp. 265, 272-273).
1969—Beginning of Regulation. In 1969, the Philippine government conducted a
survey and evaluation, in an effort to avoid mismatch between graduates and available
jobs. Around the same time, student protests against high tuition fees culminated in a
legislative act, which allowed the Department of Education to begin regulating tuition
and fees (Gonzalez, 1997, p. 265). Thereafter, for more than a decade, the tuition and
fees of private higher education institutions were regulated, and concentrated efforts
were made to follow a central plan (Gonzalez, 1997, p. 265).
1992—Deregulation. At the beginning of the Ramos administration (in 1992), the
secretary of education deregulated tuition fees, programs, and curricula, and
encouraged the opening of new institutions. A laissez-faire policy was restored to the
system (Gonzalez, 1997, p. 265). The beginning of the end of regulation had already
101
been evident in the twilight years of the Marcos regime (1965-86), and during the
Aquino administration (1986-92) (Gonzalez, 1997, p. 265).
The Results of a Laissez-Faire Policy. Gonzalez (1997) observed that while
laissez-faire educational permissiveness has solved the social problem of providing
educational opportunities for the college-age population, there has not been a
corresponding structure to monitor the market in such a way that it will produce the
needed types of manpower for national development (p. 265).
The Commission on Higher Education (CHED)
The 1993 EDCOM (Congressional Commission on Education) report pointed out
that Philippine higher education was characterized by large enrollment, unbalanced
distribution, under-investment and poor quality, mismatch between programs and
graduates, and between employment and societal needs, and limited and
underdeveloped graduate education (Dizon, in press). A major recommendation was to
restructure the educational bureaucracy with the intent that focused attention could be
given to each subsector (Dizon, in press). Thus, in 1994, RA 7722 created the
Commission on Higher Education (CHED) to govern the higher educational system, and
RA 7796 created the Technical Education and Skills Development Authority (TESDA) to
govern post-secondary technical and vocational education (Dizon, in press). Created
independent of and coequal with DECS [Department of Education, Culture and Sports,
now known as the Department of Education], the Commission on Higher Education
(CHED) was to focus on system governance and policy guidance over all public and
private institutions of higher education, as well as degree-granting programs in all post-
secondary educational institutions (Dizon, in press). Thus, “[t]he trifocal education

102
system refocused DECS’ mandate to basic education which covers elementary,
secondary and nonformal education, including culture and sports. TESDA now
administers the post-secondary, middle-level manpower training and development while
CHED is responsible for higher education” (Republic of the Philippines Department of
Education: Historical Perspective of the Philippine Educational System, 2008).
Some Current Aspects of Philippine Higher Education
This section will highlight some current aspects of Philippine higher education,
including distribution of institutional types, enrollment, predominance of undergraduate
enrollment, entry level, socioeconomic status and college choice, scholarships and
other student assistance programs, commuter institutions, student services,
accreditation, professional board examinations, and lack of research.
Distribution of Institutional Types. In 2004-2005, the Philippines had 1,619
institutions of higher education (excluding the 271 satellite campuses) (Higher
Education Statistical Bulletin: Academic Year 2004-2005, 2006, p. 1). Public institutions
numbered 176. This figure included 111 State Universities and Colleges (SUCs), 50
Local Universities and Colleges (LUCs), 1 CHED Supervised Institution (CSI), 9 other
government schools (OGSs), and 5 special schools (SSs) (Higher Education Statistical
Bulletin: Academic Year 2004-2005, 2006, p. 1). According to the Commission on
Higher Education (2008),
The State Universities and Colleges (SUCs) are chartered public higher
education institutions established by law, administered and financially subsidized
by the government. The Local Universities and Colleges (LUCs) are those
established by the local government through resolutions or ordinances. LUCs are
103
financially supported by the local government concerned. The CHED Supervised
Institution (CSI) is non-chartered public post-secondary education institution
established by law, administered, supervised and financially supported by the
government. Other Government Schools (OGS) are public secondary and post-
secondary education institutions usually a technical-vocational education
institution that offer higher education programs. Special HEIs are directly under
the government agency stipulated in the law that created them. They provide
specialized training in areas such as military science and national defense.
(Commission on Higher Education: Higher Education System, 2008)
Private institutions totaled 1,443—340 sectarian and 1,103 non-sectarian (Higher
Education Statistical Bulletin: Academic Year 2004-2005, 2006, p. 1). Dizon (in press)
points out that “[h]istorically, the private sector has dominated higher education in terms
of number of institutions and enrollment.” As the Commission on Higher Education
(2008) notes,
Private higher education institutions are established under the Corporation Code
and are governed by special laws and general provisions of this Code. Those
under non-sectarian are duly incorporated, owned and operated by private
entities that are not affiliated to any religious organization while those under
sectarian are usually non-stock, non profit, duly incorporated, owned and
operated by a religious organization. (Commission on Higher Education: Higher
Education System, 2008)
Commenting on the diverse educational quality provided, Johanson (1999)
writes,
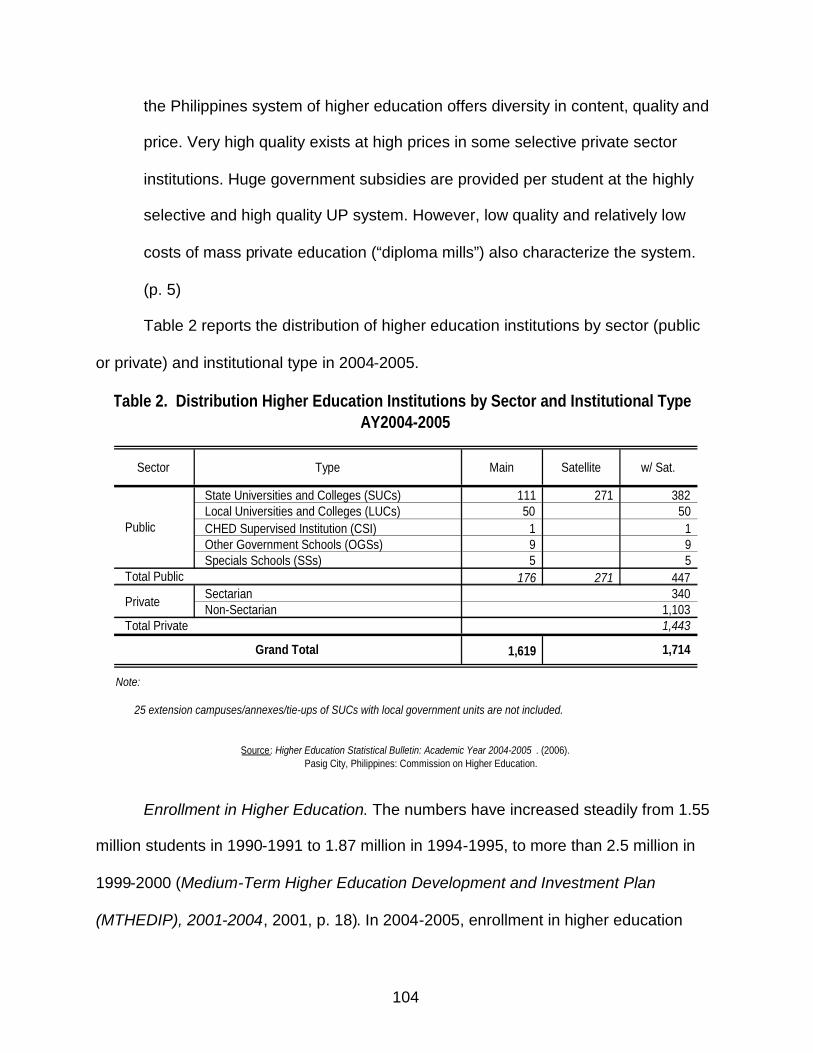
104
the Philippines system of higher education offers diversity in content, quality and
price. Very high quality exists at high prices in some selective private sector
institutions. Huge government subsidies are provided per student at the highly
selective and high quality UP system. However, low quality and relatively low
costs of mass private education (“diploma mills”) also characterize the system.
(p. 5)
Table 2 reports the distribution of higher education institutions by sector (public
or private) and institutional type in 2004-2005.
Sector Type Main Satellite w/ Sat.
State Universities and Colleges (SUCs) 111 271 382Local Universities and Colleges (LUCs) 50 50CHED Supervised Institution (CSI) 1 1Other Government Schools (OGSs) 9 9Specials Schools (SSs) 5 5
176 271 447SectarianNon-Sectarian
1,619
Source: Higher Education Statistical Bulletin: Academic Year 2004-2005 . (2006).Pasig City, Philippines: Commission on Higher Education.
25 extension campuses/annexes/tie-ups of SUCs with local government units are not included.
Note:
Private
Grand Total 1,714
Table 2. Distribution Higher Education Institutions by Sector and Institutional Type
Public
Total Private
Total Public
AY2004-2005
3401,1031,443
Enrollment in Higher Education. The numbers have increased steadily from 1.55
million students in 1990-1991 to 1.87 million in 1994-1995, to more than 2.5 million in
1999-2000 (Medium-Term Higher Education Development and Investment Plan
(MTHEDIP), 2001-2004, 2001, p. 18). In 2004-2005, enrollment in higher education
105
numbered some 2.4 million (Higher Education Statistical Bulletin: Academic Year 2004-
2005, 2006, p. 3). A distinctive feature of Philippine higher education is the high
proportion of students enrolled in private institutions (Johanson, 1999, p. 1). In 2004-
2005, some two-thirds of students were enrolled in private higher education institutions
(Higher Education Statistical Bulletin: Academic Year 2004-2005, 2006, p. 3). However,
the trend “shows a decline in the share of private education in total enrollments, as
public higher education has grown” (Johanson, 1999, p. 2). The public sector has
gradually increased its intake of students relative to the private sector—accounting for
34 percent of the total enrollment in 2004-2005, from 26 percent in 1999-2000, 21
percent in 1994-1995, and 19 percent in 1990-1991 (Medium-Term Higher Education
Development and Investment Plan (MTHEDIP), 2001-2004, 2001, p. 18; Higher
Education Statistical Bulletin: Academic Year 2004-2005, 2006, p. 3). In 2004-2005,
some 54% of total enrollment in higher education was female (Higher Education
Statistical Bulletin: Academic Year 2004-2005, 2006, p. 3). According to Johanson
(1999), “[t]he ‘transition rate’ between secondary and higher education is exceptionally
high . . . The transition rate reportedly has increased from 83 percent of high school
graduates in 1995 to about 90 percent in 1999” (p. 1). Table 3 reports the higher
education enrollment by sector (public or private), institutional type, and gender in 2004-
2005.
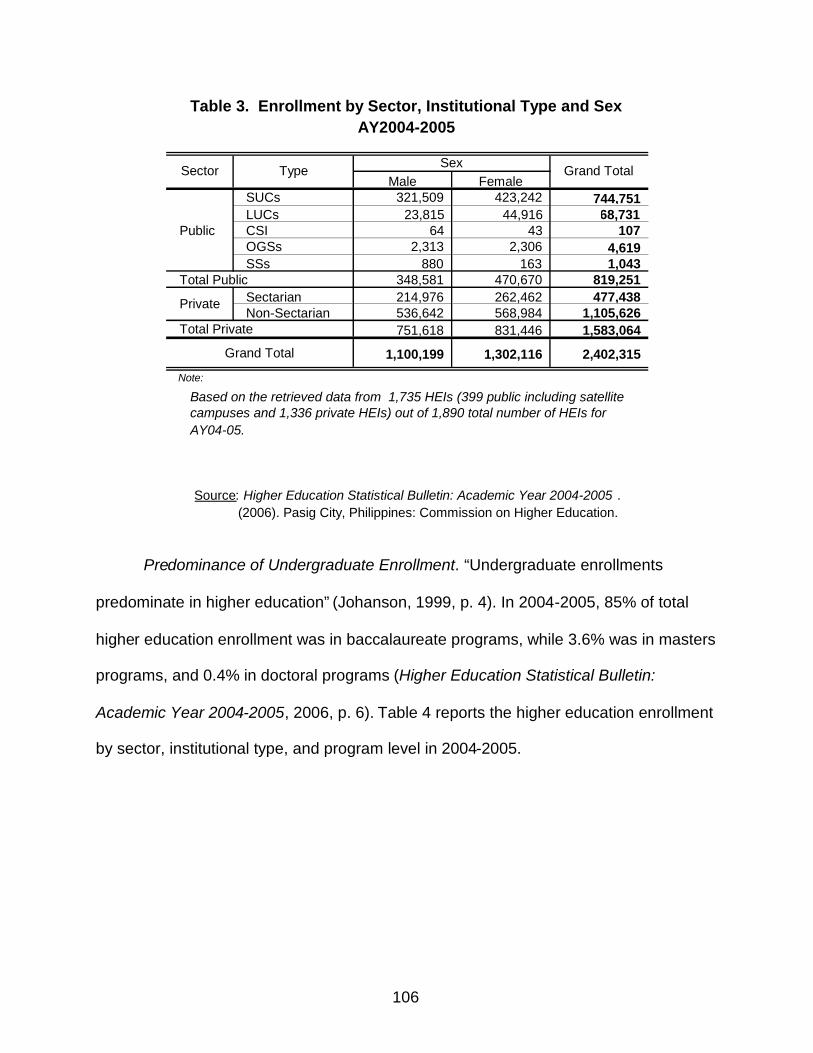
106
Male FemaleSUCs 321,509 423,242 744,751LUCs 23,815 44,916 68,731CSI 64 43 107OGSs 2,313 2,306 4,619SSs 880 163 1,043
348,581 470,670 819,251Sectarian 214,976 262,462 477,438Non-Sectarian 536,642 568,984 1,105,626
751,618 831,446 1,583,064
1,100,199 1,302,116 2,402,315
Note:
Source: Higher Education Statistical Bulletin: Academic Year 2004-2005 .(2006). Pasig City, Philippines: Commission on Higher Education.
Based on the retrieved data from 1,735 HEIs (399 public including satellitecampuses and 1,336 private HEIs) out of 1,890 total number of HEIs forAY04-05.
Grand Total
Table 3. Enrollment by Sector, Institutional Type and Sex
Public
Total Private
Total Public
AY2004-2005
Private
Sex Grand TotalSector Type
Predominance of Undergraduate Enrollment. “Undergraduate enrollments
predominate in higher education” (Johanson, 1999, p. 4). In 2004-2005, 85% of total
higher education enrollment was in baccalaureate programs, while 3.6% was in masters
programs, and 0.4% in doctoral programs (Higher Education Statistical Bulletin:
Academic Year 2004-2005, 2006, p. 6). Table 4 reports the higher education enrollment
by sector, institutional type, and program level in 2004-2005.
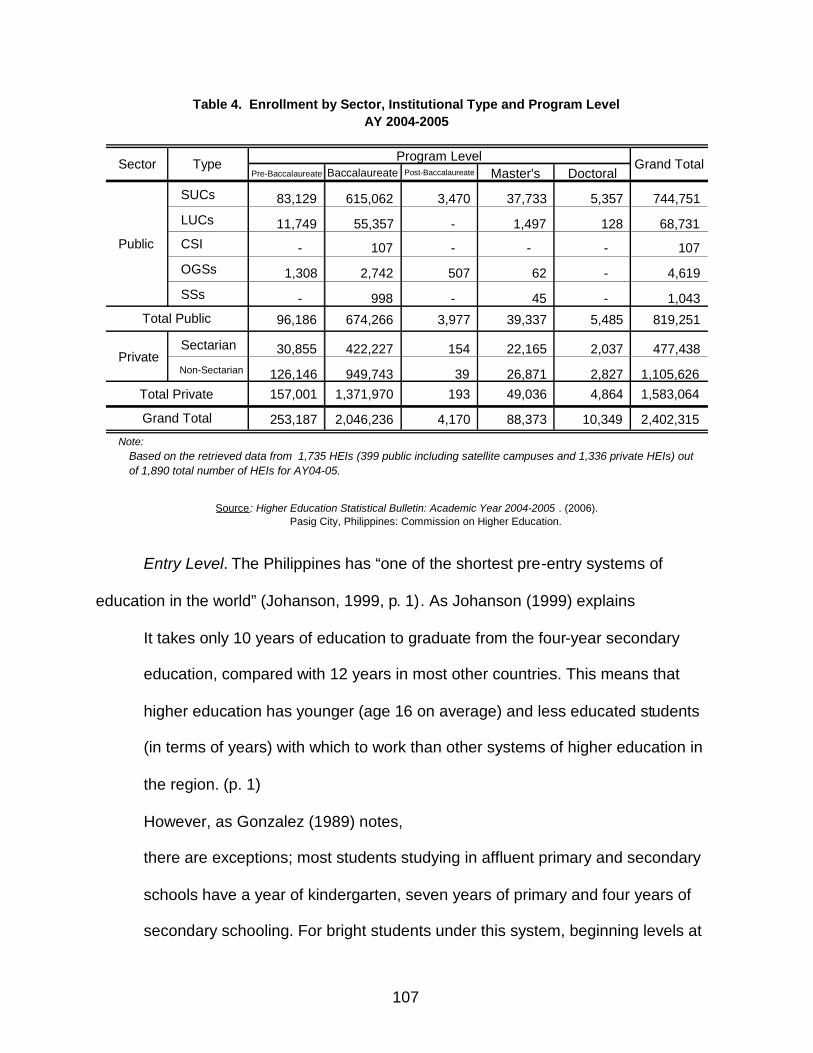
107
Pre-Baccalaureate Baccalaureate Post-Baccalaureate Master's Doctoral
SUCs 83,129 615,062 3,470 37,733 5,357 744,751
LUCs 11,749 55,357 - 1,497 128 68,731CSI - 107 - - - 107
OGSs 1,308 2,742 507 62 - 4,619
SSs - 998 - 45 - 1,043
96,186 674,266 3,977 39,337 5,485 819,251
Sectarian 30,855 422,227 154 22,165 2,037 477,438Non-Sectarian 126,146 949,743 39 26,871 2,827 1,105,626
157,001 1,371,970 193 49,036 4,864 1,583,064
253,187 2,046,236 4,170 88,373 10,349 2,402,315
Note:
Grand Total
Total Public
Private
Total Private
Source : Higher Education Statistical Bulletin: Academic Year 2004-2005 . (2006).Pasig City, Philippines: Commission on Higher Education.
Table 4. Enrollment by Sector, Institutional Type and Program Level
Program Level Grand Total
AY 2004-2005
Public
Sector Type
Based on the retrieved data from 1,735 HEIs (399 public including satellite campuses and 1,336 private HEIs) outof 1,890 total number of HEIs for AY04-05.
Entry Level. The Philippines has “one of the shortest pre-entry systems of
education in the world” (Johanson, 1999, p. 1). As Johanson (1999) explains
It takes only 10 years of education to graduate from the four-year secondary
education, compared with 12 years in most other countries. This means that
higher education has younger (age 16 on average) and less educated students
(in terms of years) with which to work than other systems of higher education in
the region. (p. 1)
However, as Gonzalez (1989) notes,
there are exceptions; most students studying in affluent primary and secondary
schools have a year of kindergarten, seven years of primary and four years of
secondary schooling. For bright students under this system, beginning levels at
108
the freshman year would be comparable to those of an American freshman. (p.
129)
Socioeconomic Status and College Choice.
Johanson (1999) describes how socioeconomic status affects college choice:
Higher education enrollments are generally biased towards the upper class.
Specifically, selectivity in public HEIs [higher education institutions] discriminates
against poorer students. Because of low tuition most SUCs [state colleges and
universities] have to ration admissions. The UP [University of the Philippines]
rejects more than 95 percent of the applicants . . . and the USEP in Davao
rejects 90 percent. The selection processes are based on entrance examinations
developed by each institution. Equity criteria are typically not part of the
admissions process. Quite naturally, students who have gone to the best
secondary schools or who have additional years of preparation at the secondary
level . . . are favored on the entrance examinations. Students from high income
families are those who most often attend the best secondary schools.
Consequently, students from public high schools, particularly Baranguay high
schools, are at a disadvantage in gaining entry into public higher education.
Although the justification for public subsidies to the SUCs is ostensibly that they
cater to poorer families, in fact this is often not the case. It is widely accepted, for
example, that students at the UP – the best public institution in the country –
come disproportionately from the upper classes. . . . UP does offer “socialized
tuition,” in which students pay according to ability. But this does not compensate
[for] the fact that poor students are not likely to be able to enter in the first place.
109
Ironically, students of rich families attend public institutions at subsidized tuition
while the poorest students have to pay much higher rates of tuition in private
institutions. (p. 23)
In their 1995 report, the Commission on Higher Education’s Task Force on
Higher Education highlights how the imperfect capital market is biased against poorer
students,
Students have to rely on their family’s support for their schooling. Considering the
poverty situation in the country, where 50 percent of families are considered poor
and those not considered poor still have low incomes, relatively few students can
freely choose the best HE [higher education] options. The large majority of
students are constrained therefore to choose from among low-cost HE categories
even if they know they can do better by going to the better quality programs, or to
programs with higher earning prospects. . . . [t]his financial problem leads to the
concentration of enrollment in the less expensive schools and in the less
expensive degree programs (i.e., those not requiring expensive laboratory fees
and those of poorer quality). (Philippine Higher Education in the 21st Century:
Strategies for Excellence and Equity, 1995, p. 109)
Scholarships and other student assistance programs. Underprivileged Filipinos
have more access to higher education through government scholarship grants and
student assistance programs. These CHED programs focus on key priority areas of the
government, the poorest regions of the country, emerging needs of the country in
response to calamities, and identification and nurturing of the most promising Filipino
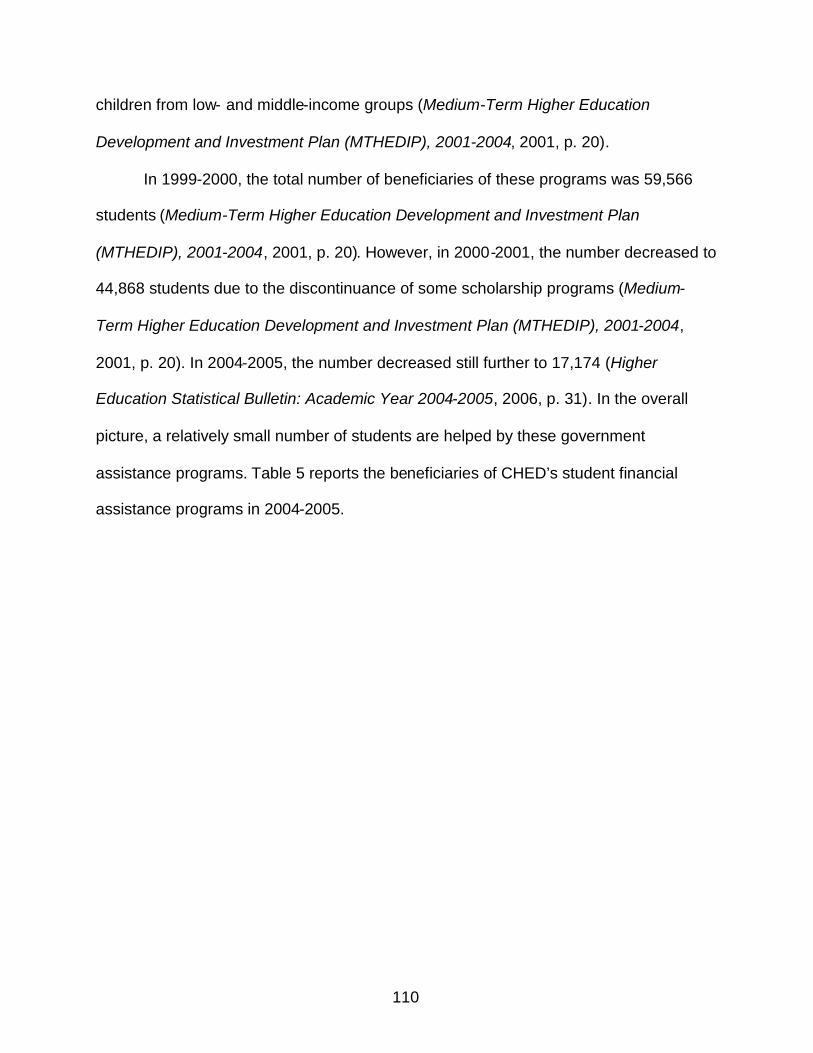
110
children from low- and middle-income groups (Medium-Term Higher Education
Development and Investment Plan (MTHEDIP), 2001-2004, 2001, p. 20).
In 1999-2000, the total number of beneficiaries of these programs was 59,566
students (Medium-Term Higher Education Development and Investment Plan
(MTHEDIP), 2001-2004, 2001, p. 20). However, in 2000-2001, the number decreased to
44,868 students due to the discontinuance of some scholarship programs (Medium-
Term Higher Education Development and Investment Plan (MTHEDIP), 2001-2004,
2001, p. 20). In 2004-2005, the number decreased still further to 17,174 (Higher
Education Statistical Bulletin: Academic Year 2004-2005, 2006, p. 31). In the overall
picture, a relatively small number of students are helped by these government
assistance programs. Table 5 reports the beneficiaries of CHED’s student financial
assistance programs in 2004-2005.
111
REGION No. of Scholar
CHED Scholarship Program for Bright Mindanaoan Muslims (CSPBMM) 31CHED Special Study Grant Program for Congressional Districts (CSGPCD) -CHED-Senate Study Grand Program (CSSGP) -College Faculty Development Fund (CFDF) 165Island Off- LuzonNational Integration Study Grant Program (NISGP) 1,095OPAPP-CHED Study Grant Program for Rebel Returnees (OPAPP-CHED-SGPRR) 817Private Educationn Student Financial Assistance Program (PESFA) 11,939Selected Ethnic Group Educational Assistance Program (SEGEAP) 1,062State Scholarship Program (SSP) 1,108State Scholarship Program-BSED-SSUC (SSP-BSED-SSUC) 104Student Financial Assistance Programs (STFUP) -Student Loan Fund For Region V (SLF-R5) -Student Loan Program for Centers of Excellence (SLP for COE) -Study-Now-Pay-Later Plan (SNPLP) 853Iskolar ng Mahirap na Pamilya (IPM) -
Total 17,174
Source: Office of the Student Services (OSS)
Table 5. Beneficiaries of CHED's Student Financial Assistance ProgramsAY 2004-2005
Source: Higher Education Statistical Bulletin: Academic Year 2004-2005 . (2006).Pasig City, Philippines: Commission on Higher Education.
Commuter Institutions. The ideal of the residential liberal arts college or a huge
university campus in the countryside has not been fully realized in the Philippines
(Gonzalez, 1989, pp. 123-124). As Gonzalez (1989) observes,
Except for Silliman University in Dumaguete, the college complex at Los Baños,
and the town which has grown up around Mindanao State University in Marawi
City, there is no real university town in the Philippines. Neither the University of
Santo Tomas nor the original University of the Philippines in Manila ever had
university-sponsored dormitory facilities, although later on, when the University of
the Philippines transferred to Diliman, dormitory buildings were erected.
Presently, only a minority of faculty and students actually reside on the Diliman
112
campus. The original intention of Ateneo University in transferring to Quezon City
was to establish a residential academic community; this has not been fully
realized, however, since only a minority of out-of-towners live in dormitories at
Ateneo University. (p. 123)
The reality is that “[p]ractically all institutions are commuter institutions with
students living in private homes, thus making out-of-town students a minority”
(Gonzalez, 1989, p. 124).
Student Services. Gonzalez (1989) comments briefly on how the campus setup
affects student services:
This situation adversely affects the quality and quantity of student services.
However, all Philippine universities feel that they need varsity sports programs
especially in basketball, a large gymnasium, but little else for sports facilities. As
the population has increased, strain has been placed on physical facilities, with
use of classroom and laboratory facilities reaching a high of as many as 16 hours
a day six days a week (with laboratories open even on Sundays), thus making
the system one of the most efficient in terms of utilization of its physical space
during the ten-month school year. (p. 124)
Accreditation of Higher Education. In the Philippines, “[a]ccreditation is voluntary
and is done for programs rather than institutions” (Johanson, 1999, p. 4). According to
the Commission on Higher Education (2008),
The Federation of Accrediting Agencies of the Philippines (FAAP) as the
umbrella organization of accrediting agencies has accredited a total of 597 higher
education programs in 1998-1999 and 743 in 2000-2001, hence, an increase of
113
24 percent . . . Of the 743 programs, 643 are baccalaureate, 65 are Master’s and
5 are Doctoral. In terms of accreditation level, 152 are Level I, 445 are Level II
and 146 are Level III. The number of HEIs [higher education institutions] with
accredited programs in 1998-1999 is 152 and 160 in 2000-2001, hence, an
increase of 5.3 percent. (Commission on Higher Education: Statistics:
Accreditation of Higher Education Programs, 2008)
Professional Board Examinations. The professional licensing examinations, given
by the Professional Regulations Commission, tests in a variety of fields, “provid[ing] a
de facto national ‘exit’ test of system effectiveness” (Johanson, 1999, p. 5).
Performance is a “proxy measure of the quality of instruction against national standards
in the various disciplines. [However,] [n]ot all graduates take the examination,
particularly those who are likely to fail” (Johanson, 1999, p. 5).
Lack of Research. In general, research has been neglected in Philippine higher
education institutions. Very few universities conduct extensive research. This situation is
due to the inadequacy of institutional research facilities, as well as the lack of qualified
faculty to conduct research (Medium-Term Higher Education Development and
Investment Plan (MTHEDIP), 2001-2004, 2001, p. 17). Moreover, the budget allocated
for research has been minimal (Medium-Term Higher Education Development and
Investment Plan (MTHEDIP), 2001-2004, 2001, p. 17). In response, CHED has
developed and disseminated the National Higher Education Research Agenda, which
has provisions for grants to institutions and independent faculty members in the form of
block grants, grants-in-aid, and grants for commissioned research (Medium-Term
Higher Education Development and Investment Plan (MTHEDIP), 2001-2004, 2001, p.
114
18). However, the processing of research proposals and awarding of research grants
have been slow (Medium-Term Higher Education Development and Investment Plan
(MTHEDIP), 2001-2004, 2001, p. 18).
Attitudes Towards Higher Education
The common man seems to have a strong attraction to tertiary education. So
engrained is this in the Filipino psyche that a father is willing to sell his last piece of
land, his work animal, just to be able to see his son through college (Rosas, 1988, p.
44). The attainment of a diploma is valued, whether or not one gets a job with it. It has
been observed that, for the Filipino, education is viewed as a consumer item, rather
than an investment (Gonzalez, 1987, p. 41). Practicing a profession seems to be
secondary to finishing college and proving one’s worth of having accomplished
something. On the other hand, there is a stigma associated if one did not complete his
college course (Gonzalez, 1987, pp. 41-42).
Moreover, according to Swinerton (1991), a Fulbright scholar researching
Philippine higher education, “many students see access to credentials as providing
social mobility to elite circles. . . . Many see higher education as a social value to
improve their social status as well as an opportunity to expand career choices” (p. 31).
According to the 1995 study conducted by the Commission on Higher Education’s Task
Force on Higher Education,
Despite the job problem, many of our youth still find college education attractive.
It qualifies them for white collar employment, which usually offers a number of
advantages—more comfortable and safe workplaces, more regular and stable
terms of employment, and social security protection. Besides, college education
115
improves their lifestyle and decision making if not their social standing.
(Philippine Higher Education in the 21st Century: Strategies for Excellence and
Equity, 1995, p. 6)
Referring to Nilo L. Rosas, previously director of the Bureau of Higher Education
in the Department of Education, Culture and Sports, Swinerton (1991) writes,
Rosas, correctly, underlines the problem of going to college to get a degree for
social acceptance rather than to use that knowledge for career development and
contribution to national development. If the degree is for social acceptance,
students lack interest in academic preparation and worry less about the quality of
the programs. (p. 31)
Moreover, as Swinerton points out,
Jesus M. Jhocson, vice president of National University in the Philippines, writes
in an article entitled “Technical Education in Philippine Private Schools” (1982)
that a major problem is that students prefer baccalaureate courses rather than
vocational courses. He writes: ‘High school graduates enter college and enroll in
courses dictated by their parents or close kin, without regard to their particular
aptitudes and ability. This is indicative of the lack of proper vocational guidance
and counseling’ (1982:22). Throughout the Philippines, counseling and guidance
are rarely available to help students to select tertiary schools, choose specific
programs of study. (p. 31)
Review of College Choice Research in the Philippines
Research focused on the college choice of students in the Philippines is limited.
The National Library of the Philippines is the official library of the country. An electronic
116
database search, conducted on January 8, 2008, using the keywords “college choice”
yielded 34 titles. Most of these related to students’ decisions pertaining to their
vocations/careers or to their college courses. Only three (reviewed below), which are
institution-specific, related to students’ college choice.
The National Library permitted only the abstracts of theses/dissertations to be
photocopied by a library attendant. In the cases where the abstract was absent (e.g.
Recalde 1977; Concepcion 1973), the concluding chapter could be photocopied.
However, this restriction, as well as the poor quality of some copied pages, severely
limited this researcher’s ability to glean from these works.
Datuharon-Yahya (1989) investigated how demographic, intellectual, institutional,
and reference group factors influenced the MSU Muslim high school graduates’
selection of the Mindanao State University, or of other higher education institutions. He
utilized a questionnaire instrument, as well as interviews, on a random sample of 490
students from Muslim graduates of the MSU high schools in the Ranao area during the
1988-1989 school year. The data were analyzed using stepwise multiple discriminant
analysis or canonical discriminal function and the ranking of mean scores. Datuharon-
Yahya (1989) summarized his findings thus,
1. Of the 22 independent variables, only 10 were found to be significantly
influential in the choice of Muslim high school graduates.
2. Of the 10 significant variables, 3, i.e., high school grades, scholarship
privileges, and school facilities, equipment and books, were found to be
influential in the choice to enroll at MSU Campus; 7, i.e., mothers’ educational
attainment in western education, mothers’ occupation, mothers’ sources of
117
income, parents’ income, perceived difficulty of the college admission test, school
site and climate, and teachers and other school officials, were influential in the
choice of other schools.
3. The 12 insignificant variables are sex, NCEE rating, prestige, variety of
courses offered, low tuition fees, quality of faculty, enrollment and medical
examination procedures, time spent in completing the course, peace and order
condition, parents and relatives, peers and friends, and local and other
community leaders. (p. xiv)
Recalde (1977) explored what factors influenced Adventist college-age young
people to enroll in non-Seventh Day Adventist schools in Metro Manila, and what factors
hindered them from attending an Adventist college (Recalde, 1977, p. 78). Concepcion
(1973) studied the factors which influenced students to enroll in the Baguio Colleges
Foundation, and compared group responses along the variables of sex, mental ability,
residences, and economic status (Concepcion, 1973, p. 118).
Application of U.S. College Choice Research to the Philippines
The Western Impact on Higher Education in the Philippines
Dr. Andrew B. Gonzalez, former president of De La Salle University and author of
several works on Philippine higher education, contends that “the Philippine college and
university system exhibits all the trappings of the West, but over the years has
manifested an acculturation and an indigenization which is uniquely Filipino” (Gonzalez,
1989, p. 117). Gonzalez (1989) explains that
one has in the Philippines a higher education system, the interesting post-
colonial development of having the form of American higher education, a token
118
homage paid to research, and service functions which are quite extensive in
some institutions, but without the substance of American higher education; that is
to say, the level of achievement sufficient to do tertiary-level academic studies in
the American context, suitably qualified faculty with research experience
themselves, a priority placed on research, proper support facilities by way of
libraries and laboratories, a tradition not only of disseminating knowledge but
also of creating new knowledge as an input to teaching and as a social
intellectual service to the community, a genuine academic life style of the faculty,
and an academic culture for the institution. (p. 129)
This assessment is balanced by noting some positive results of the Philippines
higher education system. As Gonzalez (1989) points out,
Whatever defects there are in the process, some of the products are excellent,
indicating that at least at the level of teaching, the system has had its successes.
Philippine nurses are in demand abroad and, until recently, so were doctors.
Filipino engineers and technicians have met with considerable success in Nigeria
and the Middle East. In services, Philippine domestics, hotel and restaurant
workers, airline stewardesses are also in demand. Philippine managers and
accountants are everywhere, especially in Asia and of course the United States.
Teachers have found employment in Nigeria, Ethiopia at one time, and Zambia,
as well as Papua New Guinea, although now most primary teachers working
abroad find domestic employment in Hong Kong, Singapore, United Kingdom,
France, Spain, and Italy. Moreover, the Philippines has sent a continuous though
diminishing stream of graduate students to North America who can more than
119
hold their own with their North American peers in master’s and doctoral graduate
study. . . . In Asia, the language skills of Filipinos for office work in multinational
companies continue to be real assets for work in the service industries. (pp. 129-
130)
Summarizing the overall impact of the American higher education model on the
current academic condition in the Philippines, Gonzalez (1989) writes,
In the contemporary academic situation, the structure, if not the substance, of the
U.S. model of education continues to dominate. The language of instruction
continues to be English, the fruits of American research and writing are the main
sources of learning, and possible graduate training (mostly non-degree) is still an
aspiration. Moreover, some American post-graduate experience is still possible
for some faculty. American jurisprudence on higher education laws is still a point
of reference in adjudicating cases arising in an academic community, albeit with
recognition of Philippine precedents as an intervening consideration. Other
aspects of American influence include the presence of specialists to assist in
graduate teaching programs; the presence of United States foundations, both
public and private, which continue to serve as a source of needed supplementary
funding or loans for the system; and the use of voluntary accreditation as an
instrument of quality control. Finally, the United States is still considered to be the
land of opportunity for better graduates and therefore the target of immigration for
many. The umbilical cord to the former colonial power has not been completely
severed. The dependency continues to a large extent, albeit with clear
manifestations and developments of independence in the use of Filipino as a
120
language of scholarly instruction, the indigenization of teaching materials in the
humanities and the social sciences, the doctrinal character of Philippine labor
decisions superseding American jurisprudential traditions, local fund-raising to
supplement tuition and government grants, the breakthrough in State aid to
private education, and the slow development of local doctoral programs through
cooperative inter-university arrangements (consortia) in all fields. All of these
developments have led to the beginning of the establishment of a tradition of
local research, promotion of research-oriented faculty, and the upgrading of
faculty qualifications. (pp. 139-140)
Logic for Applying United States Research to the Philippine Situation
Therefore, since Philippine research on college choice was limited, and the
influence of the U.S. model of education continued to dominate the nation’s present
academic situation (Gonzalez, 1989), this dissertation assumed the applicability of the
college choice factors (as surfaced in United States research) to the Philippine situation.
This study was potentially exploratory.
Findings Relate to Search and Choice Phases
For the purposes of this study, the search and choice phases of the Hossler and
Gallagher (1987) model were combined and treated as a “single undifferentiated
process” (Rowe, 2002, p. 6), as has been done in other studies (e.g. Campaigne &
Hossler, 1998, p. 94; Rowe, 2002, p. 6). As Rowe (2002) explains,
This three-phase process of college choice [predisposition, search, choice] is not
a linear progression. Generally, the search and selection [i.e. choice] phases
overlap significantly, recurring and reversing order as the student works through
121
the process of choosing a college. While Hossler and Gallagher (1987) make a
conceptual distinction between the second and third phases, in practice these
are on going, and continuous in the student's process of choosing a college. (p.
6)
Philippine colleges and universities had their own institution-specific entrance
exams, which were given at different times. For example, for the 2009-2010 school
year, the University of the Philippines’ College Admission Test was administered in
early August (University of the Philippines Diliman: Academic Calendar: Academic Year
2008-2009, 2008). Ateneo de Manila University’s College Entrance Test was given in
mid-September (Ateneo de Manila University: Undergraduate Program Admission:
Latest Updates, 2008). De La Salle University-Manila’s College Entrance Test was
administered several times in October (De La Salle University Manila:
Applications/Entrance Exams Timetable, 2008). Likewise, the University of Santo
Tomas’ entrance exam was given several times from mid-August to the end of October.
For the 2009-2010 school year, Ateneo de Manila University, De La Salle
University, and the University of Santo Tomas all gave out their student
acceptance/rejection letters in January 2009. The University of the Philippines sent out
its acceptance/rejection letters sometime during the last week of January to the first
week of February 2009. Thus, during the timeframe of the administration of the College
Choice Survey for High School Seniors (i.e. November 2008) most students had
submitted application forms to the colleges/universities. Some were taking their college
entrance exams, while others had completed that hurdle. Almost all were waiting to hear
from the colleges/universities.
122
Therefore, based on deadlines at Philippine colleges/universities, students of
AAA High School were in the Search and Choice phases of their college selection
process, at the time they took the College Choice Survey for High School Seniors. The
results of this study, then, related to the Hossler and Gallagher (1987) model’s Search
and Choice phases which, for the purposes of this study, were treated as a single,
continuous process.
Summary
Since research focused on the college choice of students in the Philippines was
limited, it was helpful for educational administrators to glean from the scholarly research
of the United States, where investigation into this subject had spanned almost four
decades. A review of United States research yielded several factors which were found
to influence the college choice process of high school seniors. Although this list is not
exhaustive, the author contends that it includes the most outstanding and relevant
college choice factors, as surfaced by previous studies. These factors, divided into four
categories, were (1) Student characteristics: academic ability, socioeconomic status,
race/ethnicity, high school environment, educational aspirations/expectations, gender;
(2) Institutional characteristics: academic quality, programs of study, cost and financial
aid, location, social atmosphere, future job opportunities, religious emphasis; (3)
Significant others: parents, guidance counselors, friends; (4) College/University search
activities: college marketing. Appendix F summarizes research findings regarding
student college choice characteristics and their implications for institutional practice.
123
The organizing framework for the research results referred to in this chapter was
the Hossler and Gallagher (1987) model—with its three phases of predisposition,
search, and choice (Teranishi et al., 2004, p. 531; Braxton, 1990, p. 58). This is
considered by many to be the “prevailing [college choice] model” (Teranishi et al.,
2004).
Thus, since Philippine research on college choice was limited, and the influence
of the U.S. model of education continued to dominate the nation’s present academic
situation (Gonzalez, 1989), this dissertation assumed the applicability of the college
choice factors (as surfaced in United States research) to the Philippine situation. This
study was potentially exploratory.
Based on deadlines at Philippine colleges/universities, students of AAA High
School were in the Search and Choice phases of their college selection process, at the
time they took the College Choice Survey for High School Seniors (i.e. November
2008). The results of this study, then, related to the Hossler and Gallagher (1987)
model’s Search and Choice phases which, for the purposes of this study, were treated
as a single, continuous process.
124
CHAPTER 3
RESEARCH METHODOLOGY
Theoretical Framework
The organizing framework for the research results referred to in this study was
the Hossler and Gallagher (1987) model—with its three phases of predisposition,
search, and choice (Teranishi, Ceja, Antonio, Allen, & McDonough, 2004, p. 531;
Braxton, 1990, p. 58). This is considered by many to be the “prevailing [college choice]
model” (Teranishi et al., 2004).
A review of United States research yielded several factors which were found to
influence the college choice process of high school seniors. Although this list was not
exhaustive, the author contended that it included the most outstanding and relevant
college choice factors, as surfaced by previous studies. These factors, divided into four
categories, were (1) Student characteristics: academic ability, socioeconomic status,
race/ethnicity, high school environment, educational aspirations/expectations, gender;
(2) Institutional characteristics: academic quality, programs of study, cost and financial
aid, location, social atmosphere, future job opportunities, religious emphasis; (3)
Significant others: parents, guidance counselors, friends; (4) College/University search
activities: college marketing.
Investigation into student college choice had spanned almost four decades in the
United States. Since Philippine research on college choice was limited, and the
influence of the U.S. model of education continued to dominate the nation’s present
academic situation (Gonzalez, 1989), this dissertation assumed the applicability of the
125
college choice factors (as surfaced in United States research) to the Philippine situation.
This study was potentially exploratory.
Based on deadlines at Philippine colleges/universities, students of AAA High
School were in the Search and Choice phases of their college selection process, at the
time they took the College Choice Survey for High School Seniors (i.e. November
2008). The results of this study, then, related to the Hossler and Gallagher (1987)
model’s Search and Choice phases which, for the purposes of this study, were treated
as a single, continuous process.
Research Design
This study employed a nonexperimental, quantitative research design.
Specifically, both the descriptive and correlational research designs were used.
Following were the two research questions of this study:
RQ1: How do high school seniors in the Philippines, in the search and choice
phases of their college selection process, evaluate the relative importance of major
college choice factors (as identified in United States research)?
RQ2: Do the relative importance ascribed to these major college choice factors
(i.e. academic quality, college marketing, cost and financial aid, friends, guidance
counselors, future job opportunities, location, parents, pastor/religious adviser,
programs of study, religious emphasis, security, and social atmosphere) vary when the
survey population was disaggregated by students’ demographic attributes (i.e.
academic ability, socioeconomic status, gender, educational aspirations/expectations,
race/ethnicity, father’s educational level, mother’s educational level, religion, and
friends/peer influence)?
126
The first research question was answered by using a descriptive research
design, since the intent was to make careful descriptions of educational phenomena as
they exist at one point in time (Gall, Gall, & Borg, 2003, pp. 289-290). The second
research question was addressed by a correlational research design.
A survey instrument was utilized to gather data. The College Choice Survey for
High School Seniors, developed by the researcher for this study, was administered to
high school seniors at AAA High School. This survey instrument was designed to obtain
the subjects’ assessment of the relative importance of major college choice factors (as
identified in United States research), as well as certain demographic data.
Procedure for Data Collection
Permission was granted by the Principal for AAA High School to participate in
this study. Digital files of the survey instrument, as well as the informed consent and
student assent forms, were e-mailed to Philippines, where these were printed. The
Principal designated a school administrator to oversee data collection.
The informed consent and student assent forms were distributed to high school
seniors. The students were given several days to have the forms completed by their
parents/guardians. Then the College Choice Survey for High School Seniors was
administered to high school seniors. Although the entire population of seniors had been
given the opportunity to take the survey, due to IRB regulations, only seniors who had
submitted the completed informed consent and student assent forms were actually
given the survey. Moreover, the class section which had participated in the initial pilot
study was not given the survey. In order to mitigate the effects of experimenter bias, the
researcher followed the precautions suggested by Gall, Gall and Borg (2003), namely,
127
(a) provided instructions for the proctors of the survey, (b) not personally administer the
survey, and (c) not inform the proctors that the response of the honors classes would be
the experimental group in the study (p. 380).
The proctors in each classroom distributed the survey to the students. The
seniors were given approximately 20 minutes to take the survey. After each student had
submitted the completed surveys to the proctors, he/she was given the incentive item.
According to Porter and Whitcomb (2004), “[n]umerous studies of various populations
have examined the impact of prepaid incentives [when survey recipient gets the
incentive with the survey] on survey response and the results indicate that their use
invariably increases response rates” (p. 52). However, “promises of payment upon
survey completion do not appear to affect respondent behavior” (Porter & Whitcomb,
2004, p. 53). The completed surveys, as well as the completed consent/assent forms,
were sent to the researcher in Texas. Two hundred twenty-six surveys were returned,
with a response rate of 76%.
Study Setting
AAA High School was a private college preparatory institution located in Metro
Manila, Philippines. Established as an evangelical mission school to the Filipino-
Chinese community, the institution had survived and flourished for some six decades.
AAA High School provided three years of preschool instruction (Nursery, Kinder 1,
Kinder 2), six years of elementary education, and 4 years of high school. Recently, AAA
High School had launched into the higher education arena, by starting its own college.
Clientele of AAA High School were from upper-middle class families. Around 12-
15% of the student population were under scholarship. Approximately 70-80% of
128
students were of Chinese ethnicity, 5% of Filipino ancestry, and 20% of mixed ethnicity.
Students of AAA High School placed regularly in interscholastic competitions in the
fields of math, science, English, social studies, sports, music and robotics. Almost every
year, their students represented the country in international competitions in the areas of
math and robotics.
Around 95% to 98% of AAA High School’s graduates continued their education at
a college or university. Most chose a higher education institution in the Philippines,
while a few opted for colleges/universities abroad (e.g. Purdue University). The top
schools attended by graduates of AAA High School included the University of the
Philippines, Ateneo de Manila University, De La Salle University, and the University of
Santo Tomas.
AAA High School’s recent venture into the arena of higher education had
stimulated interest in the college selection process of high school seniors, for purposes
of enhancing the recruitment of students. The institution (here referred to simply as AAA
High School) was not identified by name, in order to facilitate objective critique of the
findings.
Study Population
AAA High School had 296 high school seniors projected to graduate in 2009.
This research study’s target population was seniors with an anticipated graduation date
of March 2009. The entire population was surveyed, rather than a sample, since the
population was available and easy to access. Thus, all of the seniors at AAA High
School were given the opportunity to take the survey. The senior class was divided into
seven class sections. The honors section (known as IV-6) had 36 students.
129
Institutional Review Board
Because the participants of this study were of minor age, parent/guardian
consent with minor assent was required by the Institutional Review Board of the
University of North Texas. Thus, informed consent forms and student assent forms were
provided (see Appendix B). In order to participate in the survey, each student had to
have both forms completed and submitted to survey administrators.
Survey Instrument
This study used a survey as the instrument of research for several reasons. First,
according to McDonough (1997), research in college choice “has nearly exclusively
been the domain of quantitative analysts” (p. 4). More recently, however, some
researchers have opted for a mixed methodology, utilizing both quantitative and
qualitative methods (Hossler, Schmit, & Vesper, 1999; Liu, 2005). Second, this method
allowed the researcher to study a large sample in a relatively small amount of time (Gall
et al., 2003, p. 222; Babbie, 1995, p. 273). Indeed, survey research “has yielded much
valuable knowledge about opinions, attitudes, and practices” (Gall et al., 2003, p. 290).
The research instrument College Choice Survey for High School Seniors (see
Appendix D) was developed by the researcher for this study, based on information from
the literature review and her knowledge of the Philippines and of AAA High School.
General categories were inferred from a literature review of college choice research.
Three surveys (the College Board’s sample “Admitted Student Questionnaire”; Rowe,
2002; Liu, 2005), which most closely approximated the intent of this study, were
critically examined for factors that influence student college choice, as well as for survey
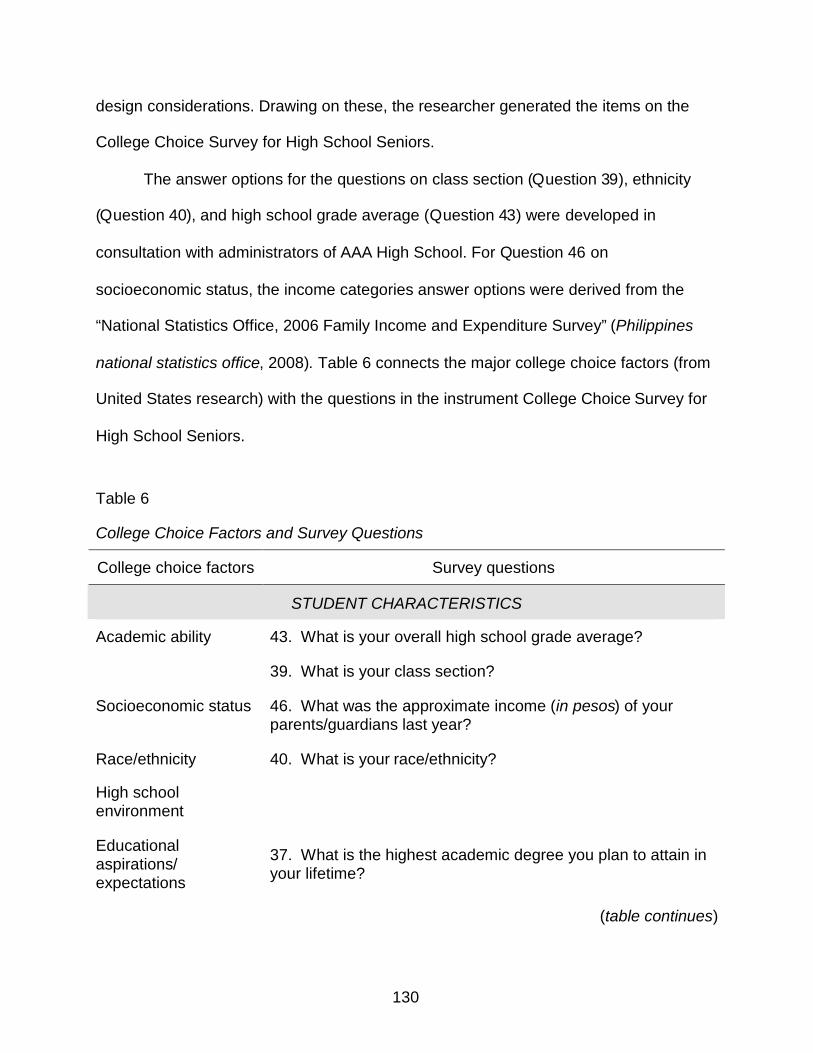
130
design considerations. Drawing on these, the researcher generated the items on the
College Choice Survey for High School Seniors.
The answer options for the questions on class section (Question 39), ethnicity
(Question 40), and high school grade average (Question 43) were developed in
consultation with administrators of AAA High School. For Question 46 on
socioeconomic status, the income categories answer options were derived from the
“National Statistics Office, 2006 Family Income and Expenditure Survey” (Philippines
national statistics office, 2008). Table 6 connects the major college choice factors (from
United States research) with the questions in the instrument College Choice Survey for
High School Seniors.
Table 6
College Choice Factors and Survey Questions
College choice factors Survey questions
STUDENT CHARACTERISTICS
43. What is your overall high school grade average?Academic ability
39. What is your class section?
Socioeconomic status 46. What was the approximate income (in pesos) of yourparents/guardians last year?
Race/ethnicity 40. What is your race/ethnicity?
High schoolenvironment
Educationalaspirations/expectations
37. What is the highest academic degree you plan to attain inyour lifetime?
(table continues)
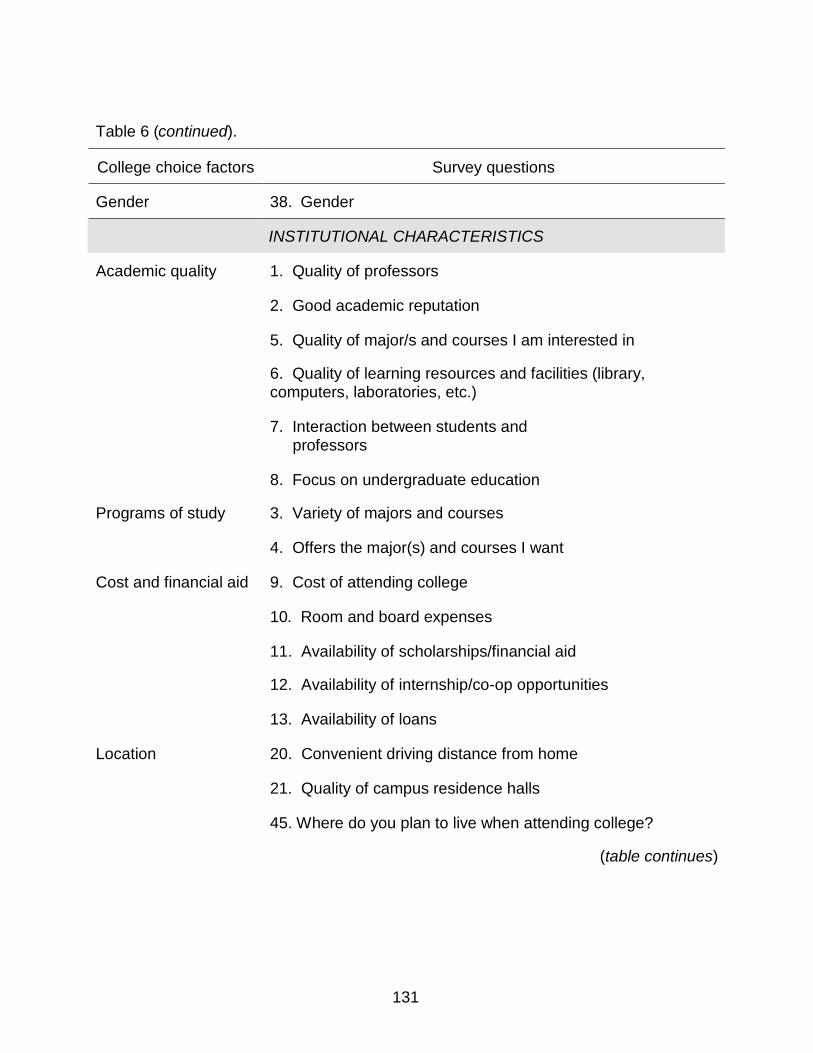
131
Table 6 (continued).
College choice factors Survey questions
Gender 38. Gender
INSTITUTIONAL CHARACTERISTICS
1. Quality of professors
2. Good academic reputation
5. Quality of major/s and courses I am interested in
6. Quality of learning resources and facilities (library,computers, laboratories, etc.)
7. Interaction between students andprofessors
Academic quality
8. Focus on undergraduate education
3. Variety of majors and coursesPrograms of study
4. Offers the major(s) and courses I want
9. Cost of attending college
10. Room and board expenses
11. Availability of scholarships/financial aid
12. Availability of internship/co-op opportunities
Cost and financial aid
13. Availability of loans
20. Convenient driving distance from home
21. Quality of campus residence halls
Location
45. Where do you plan to live when attending college?
(table continues)
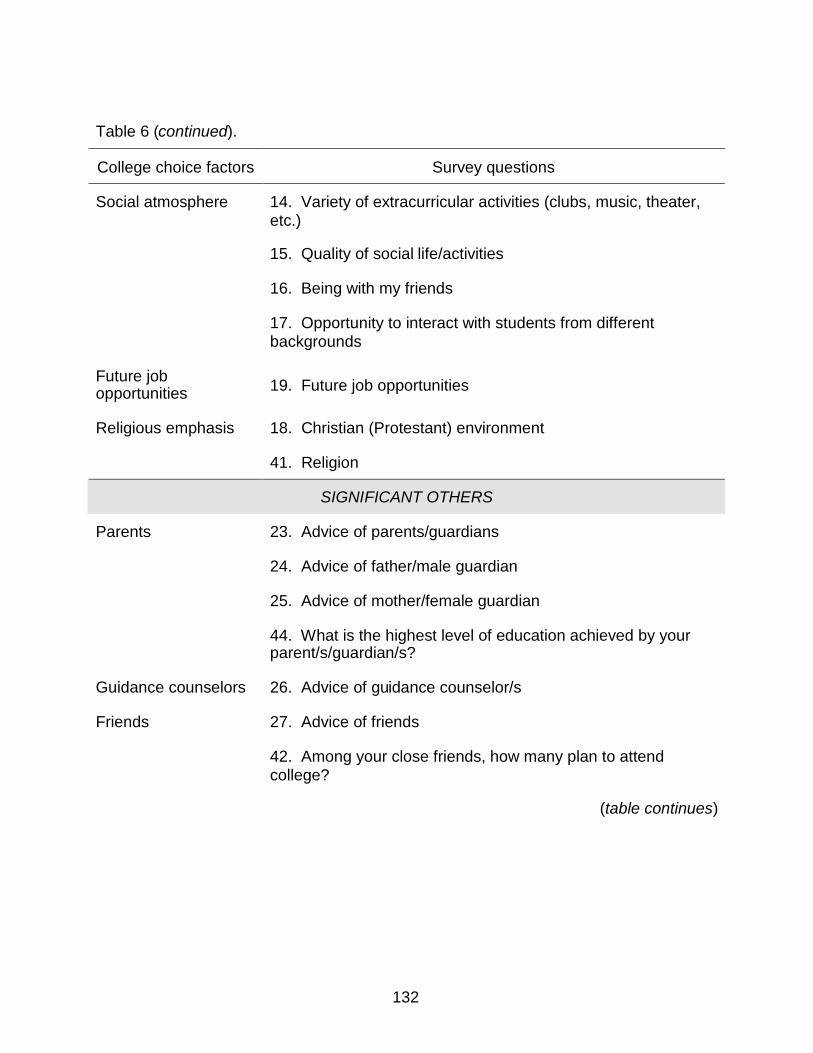
132
Table 6 (continued).
College choice factors Survey questions
14. Variety of extracurricular activities (clubs, music, theater,etc.)
15. Quality of social life/activities
16. Being with my friends
Social atmosphere
17. Opportunity to interact with students from differentbackgrounds
Future jobopportunities 19. Future job opportunities
18. Christian (Protestant) environmentReligious emphasis
41. Religion
SIGNIFICANT OTHERS
23. Advice of parents/guardians
24. Advice of father/male guardian
25. Advice of mother/female guardian
Parents
44. What is the highest level of education achieved by yourparent/s/guardian/s?
Guidance counselors 26. Advice of guidance counselor/s
27. Advice of friendsFriends
42. Among your close friends, how many plan to attendcollege?
(table continues)
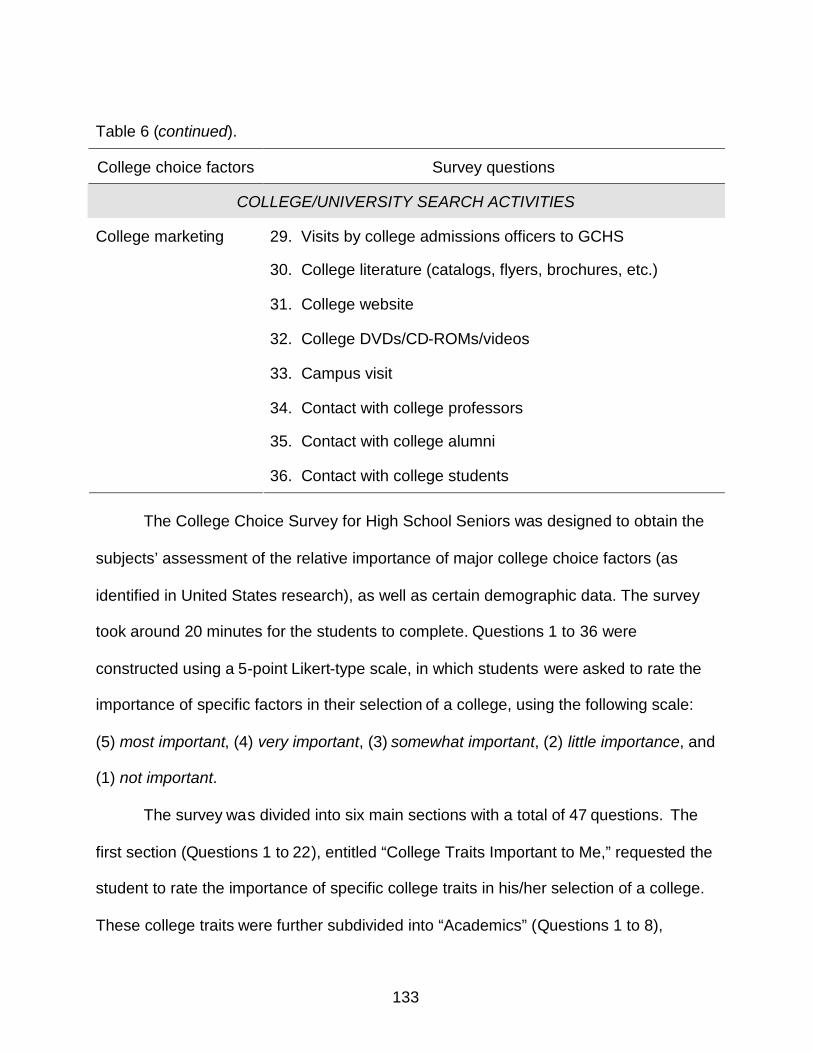
133
Table 6 (continued).
College choice factors Survey questions
COLLEGE/UNIVERSITY SEARCH ACTIVITIES
29. Visits by college admissions officers to GCHS
30. College literature (catalogs, flyers, brochures, etc.)
31. College website
32. College DVDs/CD-ROMs/videos
33. Campus visit
34. Contact with college professors
35. Contact with college alumni
College marketing
36. Contact with college students
The College Choice Survey for High School Seniors was designed to obtain the
subjects’ assessment of the relative importance of major college choice factors (as
identified in United States research), as well as certain demographic data. The survey
took around 20 minutes for the students to complete. Questions 1 to 36 were
constructed using a 5-point Likert-type scale, in which students were asked to rate the
importance of specific factors in their selection of a college, using the following scale:
(5) most important, (4) very important, (3) somewhat important, (2) little importance, and
(1) not important.
The survey was divided into six main sections with a total of 47 questions. The
first section (Questions 1 to 22), entitled “College Traits Important to Me,” requested the
student to rate the importance of specific college traits in his/her selection of a college.
These college traits were further subdivided into “Academics” (Questions 1 to 8),
134
“Financial Considerations” (Questions 9 to 13), “Extracurricular/Social Aspects”
(Questions 14 to 17), and “Miscellaneous” (Questions 18 to 22). The second section
(Questions 23 to 28), entitled “Opinions Important to Me,” invited the student to rate the
importance of the opinions of certain persons in his/her selection of a college. The third
section (Questions 29 to 36), entitled “Information Sources Important to Me,” elicited the
student’s assessment of the importance of certain information sources in his/her
selection of a college. The fourth section included Question 37, which inquired
concerning the student’s level of academic aspirations. The fifth section (Questions 38
to 46), entitled “Demographics,” asked the student to divulge certain demographic traits
of themselves, including gender, race/ethnicity, religion, friends/peer influence,
academic ability, parent’s educational level, and socioeconomic status. The final section
included Question 47, which was qualitative. This question was open-ended, as it
invited the student to describe additional factors important to his/her college selection
process that were not already addressed. The survey instrument was put into scantron
format, in order to facilitate data analysis.
Validity and Reliability of the Survey Instrument
Survey Validity
In order to ensure the validity and clarity of the instrument, the researcher’s
dissertation committee, as well as a select group in the Philippines, were asked to
evaluate the College Choice Survey for High School Seniors. This group was composed
of two guidance counselors, two administrators, and two teachers – all associated with
AAA High School. The pilot survey evaluation form (see Appendix C) was adapted from
Bell’s (2005) suggestions (pp. 147-148).
135
Several modifications to the survey instrument were made upon their
recommendation. (1) The factor "Advice of pastor and/or religious adviser" (Question
28) was added as an option, although this was not a major factor in the United States
college choice literature. Similarly, the factor "Secure/safe campus and environment"
(Question 22) was added, based on feedback from the pilot student group's responses
to the open-ended question. (2) To improve the instrument's clarity, survey Question 19
was reworded to "Future job opportunities" (from "Job placement after graduation"), and
Question 40 to “What is your race/ethnicity?” (from "What is your ethnicity?"). (3) For the
survey question "What is the highest academic degree you plan to attain in your
lifetime?" (Question 37), the options for master's and doctoral degrees were included for
clarity. Thus, the expert panel agreed on the face validity of this instrument.
Survey Reliability
Subsequently, in a pilot study, the survey was administered to 27 seniors of AAA
High School. These were from one class section of the senior class population. (Note:
The senior class section which participated in the pilot study was not given the actual
survey later.) The pilot study procedures were the same as the procedures for the
administration of the actual survey (i.e., completed informed consent and student assent
forms required before the seniors could do the pilot study, proctor’s reading of
instructions, incentives given upon completion of survey). Cronbach’s alpha coefficient
was calculated to assess the reliability of the scores produced by the survey instrument.
Huck (2000) writes,
A third method for assessing internal consistency is referred to as coefficient
alpha, as Cronbach’s alpha, or simply as alpha. . . . [A]lpha is more versatile
136
because it can be used with instruments made up of items that can be scored
with three or more possible values. Examples of such a situation include . . . a
Likert-type questionnaire where the five response options for each statement
extend from “strongly agree” to “strongly disagree” and are scored with the
integers 5 through 1. (pp. 91-92)
For studies in the early stages of research, Nunnally and Bernstein (1994)
contend that a reliability level of .70 is acceptable (pp. 264-265).
Cronbach’s Alpha for Pilot Survey
Institutional Characteristics was assessed using 21 items, each with a 5-point
scale (1 = not important to 5 = most important). Cronbach's alpha for the Institutional
Characteristics composite index was 0.817. Significant Others was assessed using 6
items, each with a 5-point scale (1 = not important to 5 = most important). Cronbach's
alpha for the Significant Others composite index was 0.785. College/University Search
Activities was assessed using 8 items, each with a 5-point scale (1 = not important to 5
= most important). Cronbach's alpha for the College/University Search Activities
composite index was 0.893. The entire pilot survey was assessed using 35 items, each
with a 5-point scale (1 = not important to 5 = most important). Cronbach's alpha for the
entire pilot survey composite index was 0.881. Thus, the reliability of the pilot survey
instrument scores was established.
Cronbach’s Alpha for Final Survey
Institutional Characteristics was assessed using 22 items, each with a 5-point
scale (1 = not important to 5 = most important). Cronbach's alpha for the Institutional
Characteristics composite index was 0.883. Significant Others was assessed using 6
137
items, each with a 5-point scale (1 = not important to 5 = most important). Cronbach's
alpha for the Significant Others composite index was 0.907. College/University Search
Activities was assessed using 8 items, each with a 5-point scale (1 = not important to 5
= most important). Cronbach's alpha for the College/University Search Activities
composite index was 0.916. The entire final survey was assessed using 36 items, each
with a 5-point scale (1 = not important to 5 = most important). Cronbach's alpha for the
entire final survey composite index was 0.933. Thus, the reliability of the final survey
instrument scores was established.
Data Analysis
This study used both the descriptive and the correlational research designs in
order to answer the research questions below.
RQ1: How do high school seniors in the Philippines, in the search and choice
phases of their college selection process, evaluate the relative importance of major
college choice factors (as identified in United States research)?
RQ2: Do the relative importance ascribed to these major college choice factors
(i.e. academic quality, college marketing, cost and financial aid, friends, guidance
counselors, future job opportunities, location, parents, pastor/religious adviser,
programs of study, religious emphasis, security, and social atmosphere) vary when the
survey population was disaggregated by students’ demographic attributes (i.e.
academic ability, socioeconomic status, gender, educational aspirations/expectations,
race/ethnicity, father’s educational level, mother’s educational level, religion, and
friends/peer influence)?
138
The first research question was answered using a descriptive research design.
Thus, descriptive statistics were calculated for each college choice factor addressed in
the survey using SPSS software. These statistics included the mean (a measure of
central tendency) and the standard deviation (a measure of variability). The second
research question was addressed by a correlational research design. Using SPSS
software, ANOVAs (analyses of variance), Mann-Whitney U tests, and Kruskal-Wallis
tests were run, in order to study the relationship between each of the major college
choice factors and the students’ demographic attributes.
The major college choice factors (i.e. dependent variables) were academic
quality, college marketing, cost and financial aid, friends, guidance counselors, future
job opportunities, location, parents, pastor/religious adviser, programs of study, religious
emphasis, security, and social atmosphere. The pertinent demographic attributes of
students (i.e. independent variables) were academic ability, socioeconomic status,
gender, educational aspirations/expectations, race/ethnicity, father’s educational level,
mother’s educational level, religion, and friends/peer influence.
While the initial 44 survey questions were quantitative, the 45th question was
qualitative. The final open-ended question invited the student to describe additional
factors important to his/her college selection process that were not already addressed.
Answers to the 45th question were analyzed manually, as these were classified by
common concepts.
139
CHAPTER 4
FINDINGS
Introduction
This chapter presents the demographic profile of student respondents and
various aspects of data analysis (including missing values, the assumptions of ANOVA,
and effect sizes). Then the two major research questions are addressed. For all
statistical analyses, SPSS 16.0 software was used, and alpha set at 0.05.
The first purpose of this study was to describe the relative importance of major
college choice factors (as identified in United States research) to high school seniors in
the Philippines, who were in the search and choice phases of their college selection
process. The second purpose was to determine whether there were statistically
significant differences in the relative importance ascribed to these major college choice
factors, according to demographic attributes of the students.
The major college choice factors (i.e. dependent variables) were academic
quality, college marketing, cost and financial aid, friends, guidance counselors, future
job opportunities, location, parents, pastor/religious adviser, programs of study, religious
emphasis, security, and social atmosphere. The pertinent demographic attributes of
students (i.e. independent variables) were academic ability, socioeconomic status,
gender, educational aspirations/expectations, race/ethnicity, father’s educational level,
mother’s educational level, religion, and friends/peer influence.
Demographic Profile of Students
Table E.1 (see Appendix E) displays the demographic characteristics of the high
school students who participated in this study. The majority were Chinese (39.8%) or
140
Chinese & Filipino (47.8%), in non-honors class sections (86.7%), were B average
students (64.6%), had aspirations to attend college (91.2%), had college-educated
mothers (60.2%), were Protestant Christian (74.8%), and had all of their friends
planning to attend college (94.7%). With respect to gender and father's educational level
(whether or not they were college-educated), student response was around the same
(44.2% males, 55.7% females; 41.2% had a non-college-educated father, 53.5% had a
college-educated father). Regarding socioeconomic status, some 35% of respondents
chose not to answer this question.
Missing Values in the Data Set
Missing values are a common problem in statistics. According to He (2008),
The seriousness depends on the pattern of missing information, how much is
missing, and why it is missing (Graham, Cumsille, & Elek-Fisk, 2003). If less than
5% of data are missing in a random pattern from a large data set, the problems
are less serious, and almost any procedure for handling missing values yields
similar results. (p. 43)
In November 2008, 226 students from AAA High School took the College Choice
Survey for High School Seniors. Of these, 203 surveys were entirely complete, while 23
surveys had 1-2 values missing at random. Thus, for this study, the missing values
problem was less acute.
Mean substitution is a valid approach for dealing with missing values (Thompson,
2006, p. 50). Graham, Cumsille, and Elek-Fisk (2003) explain, “With this procedure,
whenever a value is missing for one case on a particular variable, the mean for that
variable, based on all non-missing cases, is used in place of the missing value” (p. 90).
141
In this study, the missing values for dependent variables were substituted with its mean.
Four survey questions (corresponding to independent variables) had “I don’t know/Not
applicable” as an answer option. (These were Questions 42, 44a, 44b, and 46.) Such
responses were treated like missing values.
Research Questions Addressed
This study’s two research questions were addressed by descriptive and
correlational research designs.
Research Question 1
How do high school seniors in the Philippines, in the search and choice phases
of their college selection process, evaluate the relative importance of major college
choice factors (as identified in United States research)?
The first research question was answered using a descriptive research design.
For each college choice factor addressed in the survey, the mean (a measure of central
tendency) and the standard deviation (a measure of variability) were calculated (N=226)
using SPSS 16.0 software. Table 10 presents the mean and standard deviation of the
college choice factors, by descending order of the mean. Thus, in their selection of a
college, students placed more importance on the factors listed at the top of the table
(e.g. future job opportunities, security, and programs of study), and less importance on
the factors listed at the bottom (e.g. friends, guidance counselors). Moreover, college
choice factors with larger standard deviations indicated more variability in student
responses, when compared to college choice factors with smaller standard deviations.
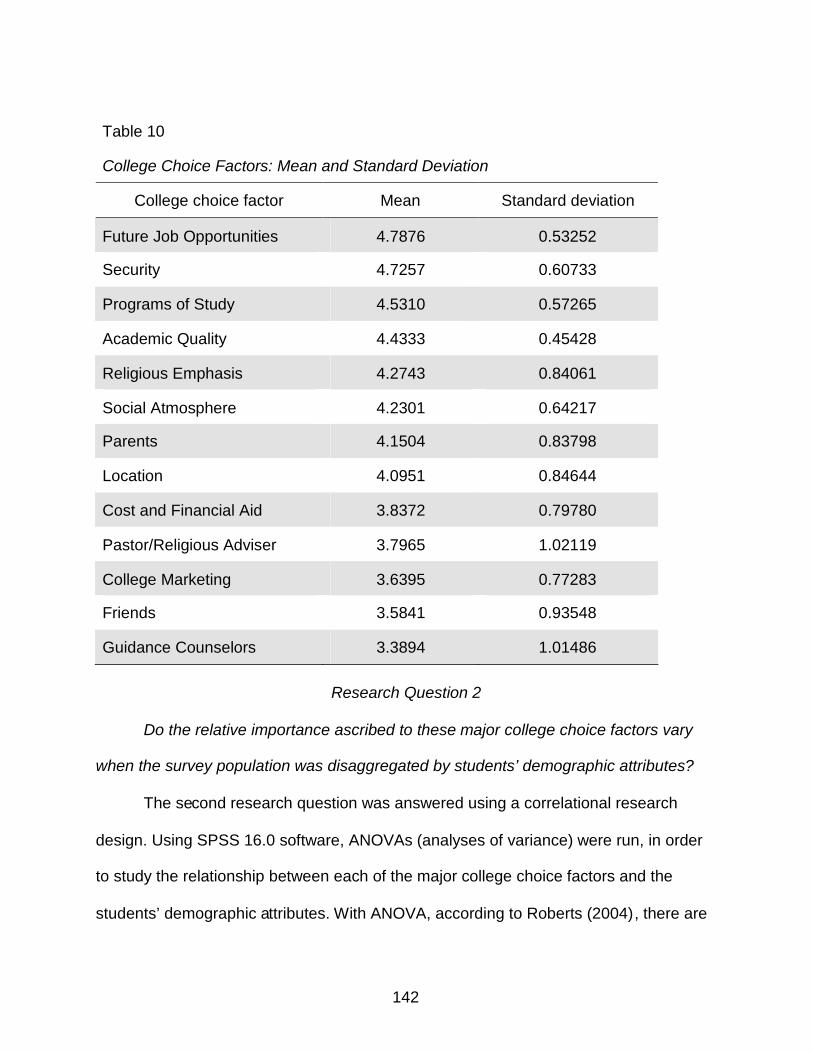
142
Table 10
College Choice Factors: Mean and Standard Deviation
College choice factor Mean Standard deviation
Future Job Opportunities 4.7876 0.53252
Security 4.7257 0.60733
Programs of Study 4.5310 0.57265
Academic Quality 4.4333 0.45428
Religious Emphasis 4.2743 0.84061
Social Atmosphere 4.2301 0.64217
Parents 4.1504 0.83798
Location 4.0951 0.84644
Cost and Financial Aid 3.8372 0.79780
Pastor/Religious Adviser 3.7965 1.02119
College Marketing 3.6395 0.77283
Friends 3.5841 0.93548
Guidance Counselors 3.3894 1.01486
Research Question 2
Do the relative importance ascribed to these major college choice factors vary
when the survey population was disaggregated by students’ demographic attributes?
The second research question was answered using a correlational research
design. Using SPSS 16.0 software, ANOVAs (analyses of variance) were run, in order
to study the relationship between each of the major college choice factors and the
students’ demographic attributes. With ANOVA, according to Roberts (2004), there are
143
“[t]wo or more different groups measured on the same construct, typically on the same
occasion” (e.g. School 1 vs. School 2 vs. School 3 vs. School 4). As Hinkle, Wiersma,
and Jurs (2003) noted, “One-way ANOVA involves the analysis of one independent
variable with two or more levels” (p. 333).
In this study, one-way ANOVAs were conducted for tests of statistical
significance involving independent variables with two or more groups. If the ANOVA
indicated statistical significance, a Tukey post-hoc test was run to investigate more
specifically where the differences lie. Only the results of statistically significant ANOVAs
(or Mann-Whitney U tests or Kruskal-Wallis tests, where appropriate) were reported.
The major college choice factors (i.e. dependent variables) were academic
quality, college marketing, cost and financial aid, friends, guidance counselors, future
job opportunities, location, parents, pastor/religious adviser, programs of study, religious
emphasis, security, and social atmosphere. Table E.2 (see Appendix E) connects the
college choice factors (dependent variables) with the questions in the instrument
College Choice Survey for High School Seniors.
The pertinent demographic attributes of students (i.e. independent variables)
were academic ability, socioeconomic status, gender, educational
aspirations/expectations, race/ethnicity, father’s educational level, mother’s educational
level, religion, and friends/peer influence. Table E.3 (see Appendix E) connects the
demographic factors (independent variables) with the questions in the instrument
College Choice Survey for High School Seniors.
144
Meeting the Assumptions of ANOVA
The three primary assumptions underlying the one-way ANOVA include (1)
random and independent samples, (2) normal distribution of dependent variables, and
(3) homogeneity of variance (i.e. equal variances of the population distributions) (Hinkle,
Wiersma, & Jurs, 2003, pp. 344-345). Balanced design is a desirable condition when
conducting an ANOVA.
Random and Independent Samples. Although each of AAA High School's 296
high school seniors had opportunity to participate in this study, 226 students actually
took the survey – a 76% response rate. Seniors at AAA High School in the Philippines
took the College Choice Survey for High School Seniors instrument independently and
only one time. Hence, the assumption of independent sampling was met.
Normal Distribution of Dependent Variables. Kurtosis and skewness values of
dependent variables were checked to determine if a distribution of scores was normal
(Field, 2000, p. 39). According to Huck (2004), “skewness is not considered to be too
extreme if the coefficient of skewness assumes a value anywhere between -1.0 and
+1.0” (pp. 29-30). Moreover, skewness and kurtosis values in the range of -2.0 to +2.0
can also be acceptable (Brown, Measures of Shape: Skewness and Kurtosis, 2008).
Leech and Onwuegbuzie (2002) noted that skewness and kurtosis coefficients outside
the -2 to +2 range, but still within the -3 to +3 boundaries indicate a slight departure
from normality (p. 9). Table 7 lists the selected college choice factors (dependent
variables), whose skewness and kurtosis values were beyond the -1.0 to +1.0 range.
Two factors (parents and religious emphasis) had values acceptable at the -2.0 to +2.0
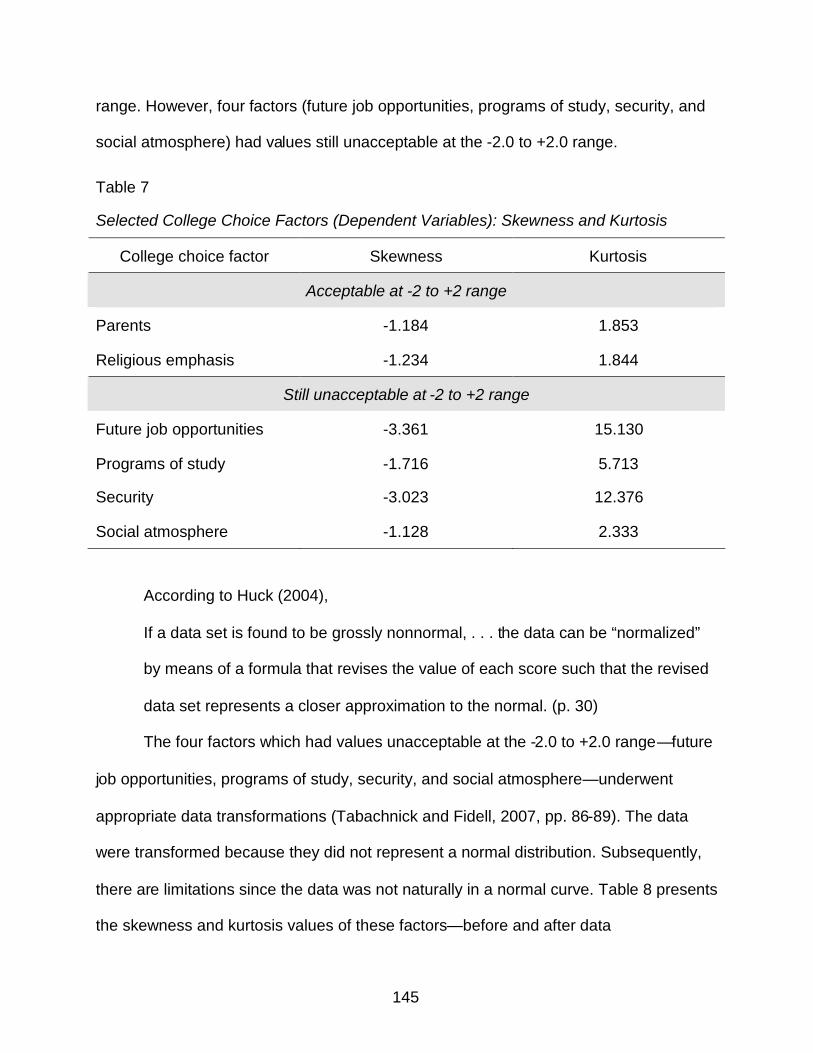
145
range. However, four factors (future job opportunities, programs of study, security, and
social atmosphere) had values still unacceptable at the -2.0 to +2.0 range.
Table 7
Selected College Choice Factors (Dependent Variables): Skewness and Kurtosis
College choice factor Skewness Kurtosis
Acceptable at -2 to +2 range
Parents -1.184 1.853
Religious emphasis -1.234 1.844
Still unacceptable at -2 to +2 range
Future job opportunities -3.361 15.130
Programs of study -1.716 5.713
Security -3.023 12.376
Social atmosphere -1.128 2.333
According to Huck (2004),
If a data set is found to be grossly nonnormal, . . . the data can be “normalized”
by means of a formula that revises the value of each score such that the revised
data set represents a closer approximation to the normal. (p. 30)
The four factors which had values unacceptable at the -2.0 to +2.0 range—future
job opportunities, programs of study, security, and social atmosphere—underwent
appropriate data transformations (Tabachnick and Fidell, 2007, pp. 86-89). The data
were transformed because they did not represent a normal distribution. Subsequently,
there are limitations since the data was not naturally in a normal curve. Table 8 presents
the skewness and kurtosis values of these factors—before and after data
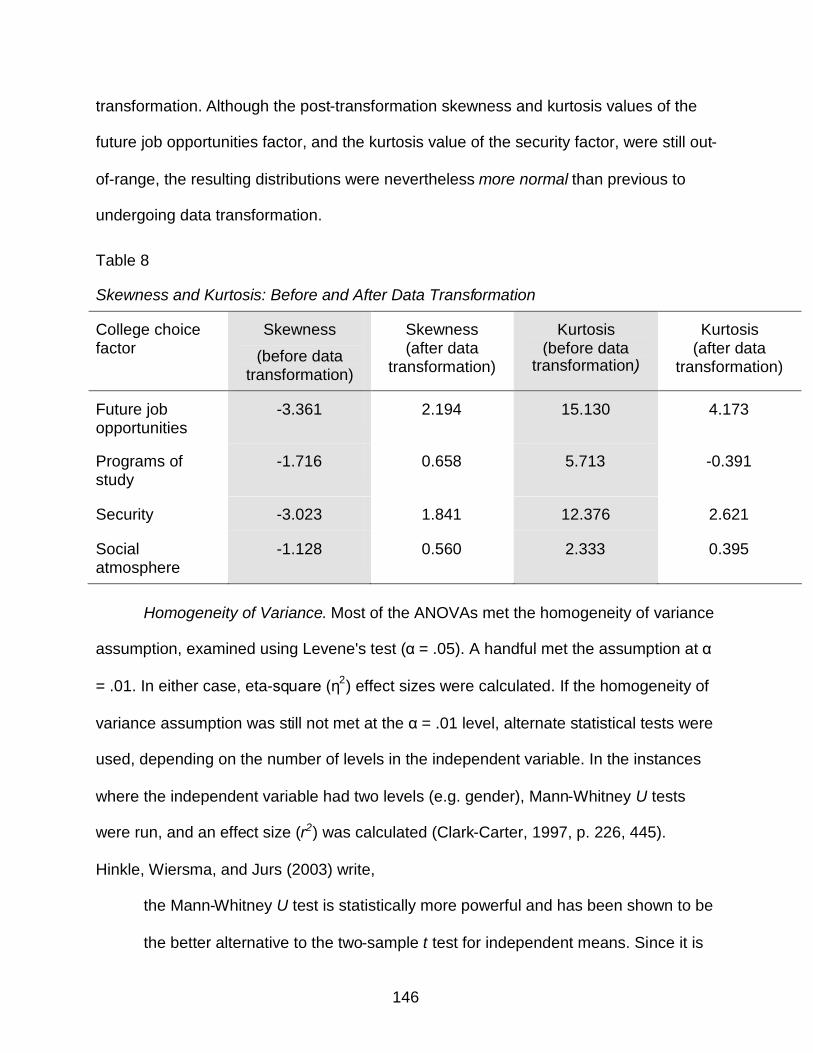
146
transformation. Although the post-transformation skewness and kurtosis values of the
future job opportunities factor, and the kurtosis value of the security factor, were still out-
of-range, the resulting distributions were nevertheless more normal than previous to
undergoing data transformation.
Table 8
Skewness and Kurtosis: Before and After Data Transformation
College choicefactor
Skewness
(before datatransformation)
Skewness(after data
transformation)
Kurtosis(before data
transformation)
Kurtosis(after data
transformation)
Future jobopportunities
-3.361 2.194 15.130 4.173
Programs ofstudy
-1.716 0.658 5.713 -0.391
Security -3.023 1.841 12.376 2.621
Socialatmosphere
-1.128 0.560 2.333 0.395
Homogeneity of Variance. Most of the ANOVAs met the homogeneity of variance
assumption, examined using Levene's test (α= .05). A handful met the assumption at α
= .01. In either case, eta-square (η2) effect sizes were calculated. If the homogeneity of
variance assumption was still not met at the α= .01 level, alternate statistical tests were
used, depending on the number of levels in the independent variable. In the instances
where the independent variable had two levels (e.g. gender), Mann-Whitney U tests
were run, and an effect size (r2) was calculated (Clark-Carter, 1997, p. 226, 445).
Hinkle, Wiersma, and Jurs (2003) write,
the Mann-Whitney U test is statistically more powerful and has been shown to be
the better alternative to the two-sample t test for independent means. Since it is
147
more sensitive and thus more likely to lead to the rejection of the null hypothesis
when it is false, the authors recommend the use of the Mann-Whitney U test
when the assumptions underlying the t test (normality and homogeneity of
variance) cannot be adequately met. (p. 576)
In the instances where the independent variable had more than two levels (e.g.
overall high school average), then the Kruskal-Wallis test was run (Hinkle, Wiersma, &
Jurs, 2003, p. 577-579). All of the one-way ANOVAs met the homogeneity assumption,
except three ANOVAs, namely religious emphasis by academic ability (honors vs. non-
honors), security by academic ability (honors vs. non-honors), and future job
opportunities by gender.
Balanced Design. Balanced design is a desirable condition when conducting an
ANOVA (Cobb, 1998, p. 151). According to Roberts (2004), this essentially requires that
an equal number of subjects be present in each level of the independent variable used
in the analysis. Balanced design allows for a more robust analysis with regard to the
assumptions of ANOVA (Hinkle, Wiersma, & Jurs, 2003, p. 346). When balanced design
was violated in this study, the following steps were taken:
Recategorization. In several instances, recategorizing the levels of the
independent variable yielded more meaningful results, in the context of this study. Such
was the case for survey Question 37 (relating to the student's educational
aspirations/expectations) when the answers were recategorized as college-bound and
non-college-bound. Similarly, the answers for Questions 44a and 44b (relating to
father's and mother's educational level) were recategorized as college-educated and
non-college-educated. Finally, since class section IV-6 was the honors class (and IV-1
148
to IV-5 were non-honors), it was logical to recategorize the answers to survey Question
39 as honors and non-honors.
Focus on Specific Levels. In two instances, this study narrowed the statistical
significance test to focus on two levels, due to lack of number of participants for the
other levels. This study focused on the difference between "Protestant Christian" and
"Catholic Christian" (for the "religion" variable), and on the difference between "Chinese"
and "Chinese & Filipino" (for the "race/ethnicity" variable).
Random Sampling. In several instances, a random sample of the larger level was
taken, which resulted in a more balanced design (Hinkle, Wiersma, & Jurs, 2003, p.
346; Cobb, 1998, p. 151). This was done for survey Questions 37 (relating to student's
educational aspirations/expectations), 41 (religion), 39 (academic ability as measured
by being in honors versus non-honors class section), and 43 (academic ability as
measured by overall high school average).
Effect Sizes Used
Two types of effect-size measures were calculated: eta-square η2 (for ANOVAs)
and r2 (for Mann-Whitney U tests). While Cohen (1988) presented benchmarks for
effect-size magnitudes, he did not expect these to be rigidly applied, but instead taken
into account in the research-specific context. Nevertheless, when context-specific effect
size standards are not present in the literature, Cohen's (1988) benchmarks are
considered a reference point. Table 9 gives Cohen's (1988) benchmarks for effect size
magnitudes (Cohen, 1988, pp. 24-26, 79; Henson, 2006, p. 617), which scale this study
will follow.
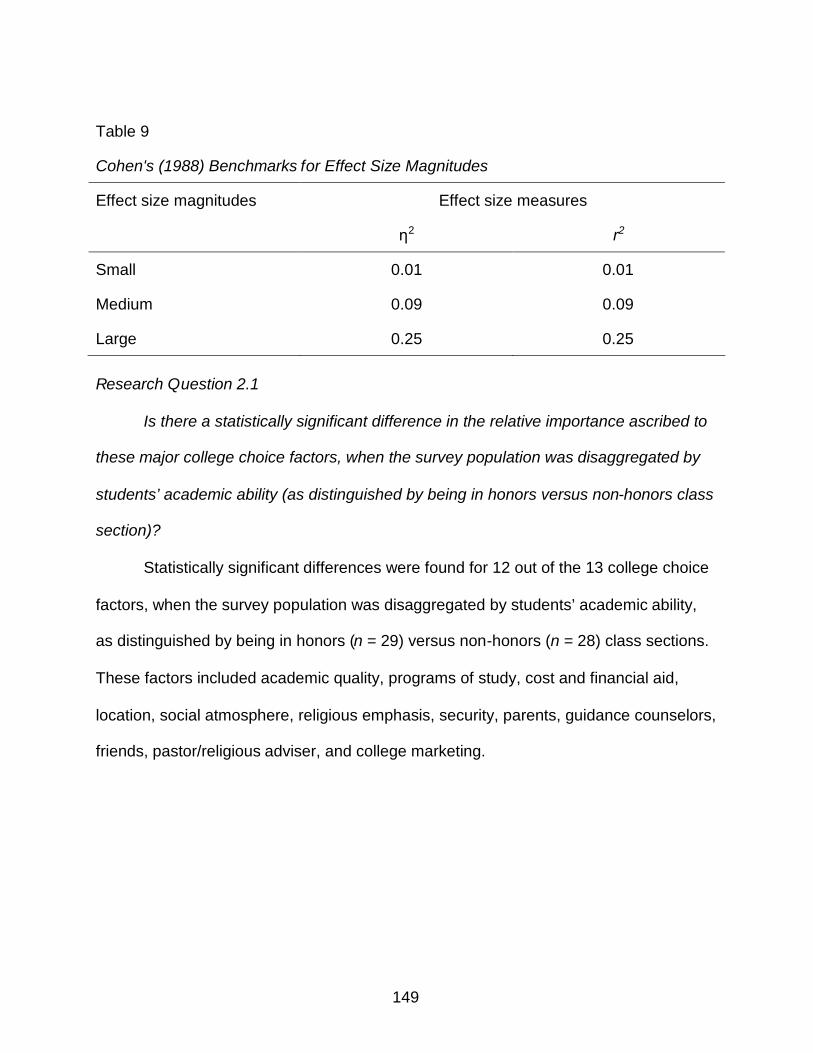
149
Table 9
Cohen's (1988) Benchmarks for Effect Size Magnitudes
Effect size magnitudes Effect size measures
η2 r2
Small 0.01 0.01
Medium 0.09 0.09
Large 0.25 0.25
Research Question 2.1
Is there a statistically significant difference in the relative importance ascribed to
these major college choice factors, when the survey population was disaggregated by
students’ academic ability (as distinguished by being in honors versus non-honors class
section)?
Statistically significant differences were found for 12 out of the 13 college choice
factors, when the survey population was disaggregated by students’ academic ability,
as distinguished by being in honors (n = 29) versus non-honors (n = 28) class sections.
These factors included academic quality, programs of study, cost and financial aid,
location, social atmosphere, religious emphasis, security, parents, guidance counselors,
friends, pastor/religious adviser, and college marketing.

150
Research Question 2.1.1
Is there a statistically significant difference in the relative importance ascribed to
academic quality, when the survey population was disaggregated by students’
academic ability (as distinguished by being in honors versus non-honors class section)?
Table 11 presents the results of the one-way ANOVA for academic ability
(honors vs. non-honors) and academic quality, with n honors = 29 and n non-honors =28.
These findings indicate that there was a statistically significant difference (p = .022)
between the honors class section (M = 4.4023) and the non-honors class section (M =
4.6102) in relation to the perceived importance of academic quality at the .05
significance level. The effect size (η2) of .091, is considered medium (Cohen, 1988).
Table 11
Analysis of Variance for Academic Ability (Honors vs. Non-Honors)
and Academic Quality
Source SS df MS F p η2
Between 0.616 1 .616 5.516* .022 .091
Within 6.139 55 .112
Total 6.755 56
Note. *p < .05. **p < .001.

151
Research Question 2.1.2
Is there a statistically significant difference in the relative importance ascribed to
programs of study, when the survey population was disaggregated by students’
academic ability (as distinguished by being in honors versus non-honors class section)?
Table 12 presents the results of the one-way ANOVA for academic ability
(honors vs. non-honors) and programs of study, with n honors = 29 and n non-honors =28.
These findings indicate that there was a statistically significant difference (p = .004)
between the honors class section (M = 4.3966) and the non-honors class section (M =
4.7679) in relation to the perceived importance of programs of study at the .05
significance level. The effect size (η2) of .138, is considered medium-to-large (Cohen,
1988).
Table 12
Analysis of Variance for Academic Ability (Honors vs. Non-Honors)
and Programs of Study
Source SS df MS F p η2
Between .164 1 .164 8.805* .004 .138
Within 1.026 55 .019
Total 1.190 56
Note. *p < .05. **p < .001.
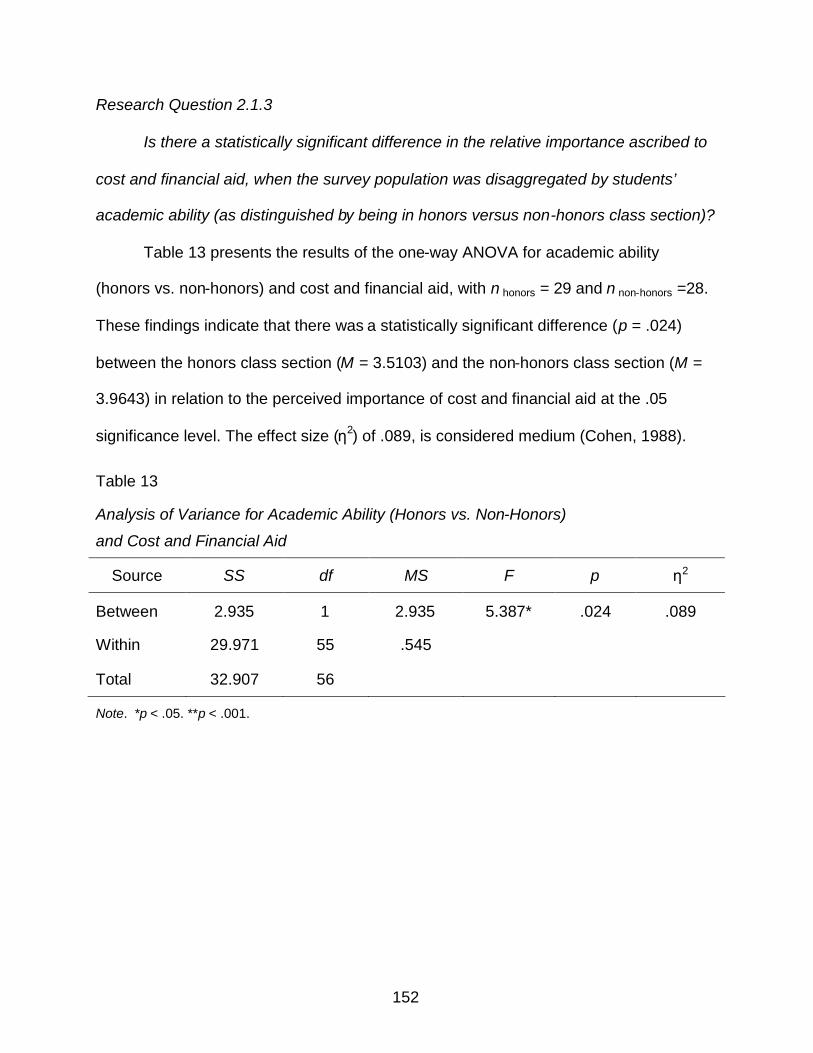
152
Research Question 2.1.3
Is there a statistically significant difference in the relative importance ascribed to
cost and financial aid, when the survey population was disaggregated by students’
academic ability (as distinguished by being in honors versus non-honors class section)?
Table 13 presents the results of the one-way ANOVA for academic ability
(honors vs. non-honors) and cost and financial aid, with n honors = 29 and n non-honors =28.
These findings indicate that there was a statistically significant difference (p = .024)
between the honors class section (M = 3.5103) and the non-honors class section (M =
3.9643) in relation to the perceived importance of cost and financial aid at the .05
significance level. The effect size (η2) of .089, is considered medium (Cohen, 1988).
Table 13
Analysis of Variance for Academic Ability (Honors vs. Non-Honors)
and Cost and Financial Aid
Source SS df MS F p η2
Between 2.935 1 2.935 5.387* .024 .089
Within 29.971 55 .545
Total 32.907 56
Note. *p < .05. **p < .001.

153
Research Question 2.1.4
Is there a statistically significant difference in the relative importance ascribed to
location, when the survey population was disaggregated by students’ academic ability
(as distinguished by being in honors versus non-honors class section)?
Table 14 presents the results of the one-way ANOVA for academic ability
(honors vs. non-honors) and location, with n honors = 29 and n non-honors =28. These
findings indicate that there was a statistically significant difference (p = .011) between
the honors class section (M = 3.6034) and the non-honors class section (M = 4.2143) in
relation to the perceived importance of location at the .05 significance level. The effect
size (η2) of .113, is considered medium-to-large (Cohen, 1988).
Table 14
Analysis of Variance for Academic Ability (Honors vs. Non-Honors) and Location
Source SS df MS F p η2
Between 5.315 1 5.315 6.977* .011 .113
Within 41.904 55 .762
Total 47.219 56
Note. *p < .05. **p < .001.
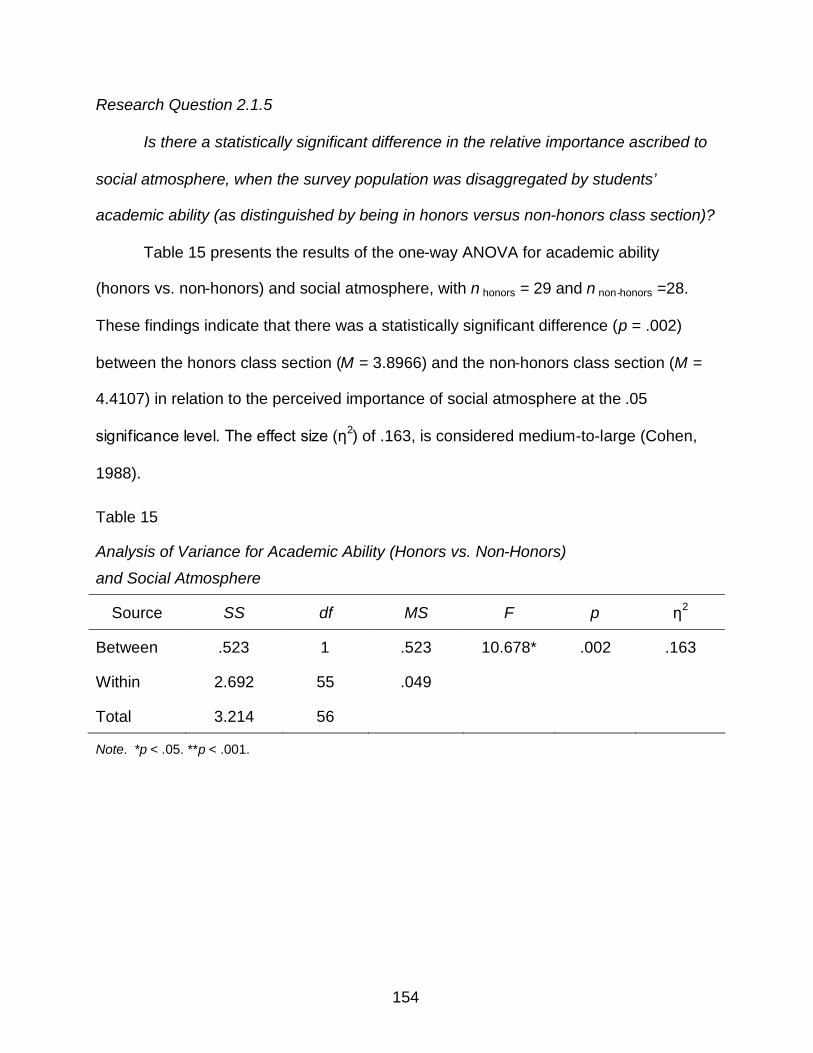
154
Research Question 2.1.5
Is there a statistically significant difference in the relative importance ascribed to
social atmosphere, when the survey population was disaggregated by students’
academic ability (as distinguished by being in honors versus non-honors class section)?
Table 15 presents the results of the one-way ANOVA for academic ability
(honors vs. non-honors) and social atmosphere, with n honors = 29 and n non-honors =28.
These findings indicate that there was a statistically significant difference (p = .002)
between the honors class section (M = 3.8966) and the non-honors class section (M =
4.4107) in relation to the perceived importance of social atmosphere at the .05
significance level. The effect size (η2) of .163, is considered medium-to-large (Cohen,
1988).
Table 15
Analysis of Variance for Academic Ability (Honors vs. Non-Honors)
and Social Atmosphere
Source SS df MS F p η2
Between .523 1 .523 10.678* .002 .163
Within 2.692 55 .049
Total 3.214 56
Note. *p < .05. **p < .001.
155
Research Question 2.1.6
Is there a statistically significant difference in the relative importance ascribed to
religious emphasis, when the survey population was disaggregated by students’
academic ability (as distinguished by being in honors versus non-honors class section)?
The results of the Mann-Whitney U test for academic ability (as distinguished by
being in honors versus non-honors class section) and religious emphasis, with n honors =
29 and n non-honors =28, indicate that there was a statistically significant difference (z = -
2.441, p = .015) between non-honors students (mean rank = 33.95) and honors
students (mean rank = 24.22) in relation to the perceived importance of religious
emphasis at the .05 significance level. The effect size (r2) of .104, is considered
medium-to-large (Cohen, 1988).
Research Question 2.1.7
Is there a statistically significant difference in the relative importance ascribed to
security, when the survey population was disaggregated by students’ academic ability
(as distinguished by being in honors versus non-honors class section)?
The results of the Mann-Whitney U test for academic ability (as distinguished by
being in honors versus non-honors class section) and security, with n honors = 29 and n
non-honors =28, indicate that there was a statistically significant difference (z = -2.524, p =
.012) between non-honors students (mean rank = 33.34) and honors students (mean
rank = 24.81) in relation to the perceived importance of security at the .05 significance
level. The effect size (r2) of .112, is considered medium-to-large (Cohen, 1988).
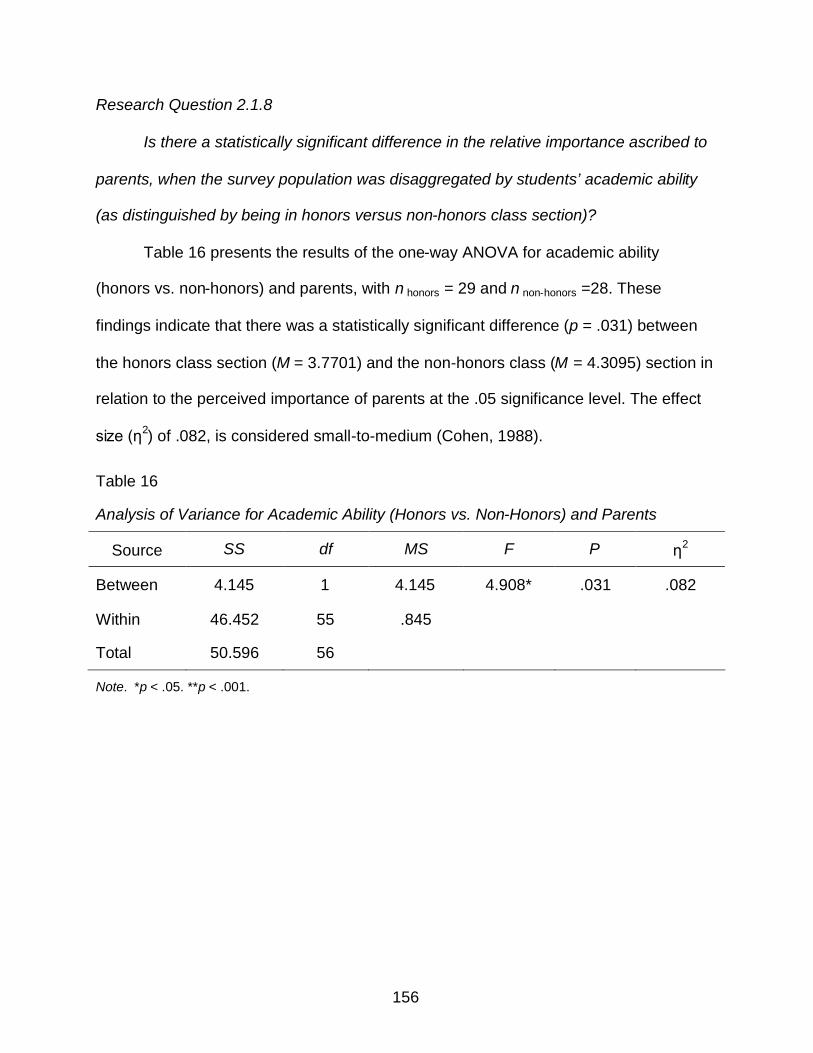
156
Research Question 2.1.8
Is there a statistically significant difference in the relative importance ascribed to
parents, when the survey population was disaggregated by students’ academic ability
(as distinguished by being in honors versus non-honors class section)?
Table 16 presents the results of the one-way ANOVA for academic ability
(honors vs. non-honors) and parents, with n honors = 29 and n non-honors =28. These
findings indicate that there was a statistically significant difference (p = .031) between
the honors class section (M = 3.7701) and the non-honors class (M = 4.3095) section in
relation to the perceived importance of parents at the .05 significance level. The effect
size (η2) of .082, is considered small-to-medium (Cohen, 1988).
Table 16
Analysis of Variance for Academic Ability (Honors vs. Non-Honors) and Parents
Source SS df MS F P η2
Between 4.145 1 4.145 4.908* .031 .082
Within 46.452 55 .845
Total 50.596 56
Note. *p < .05. **p < .001.
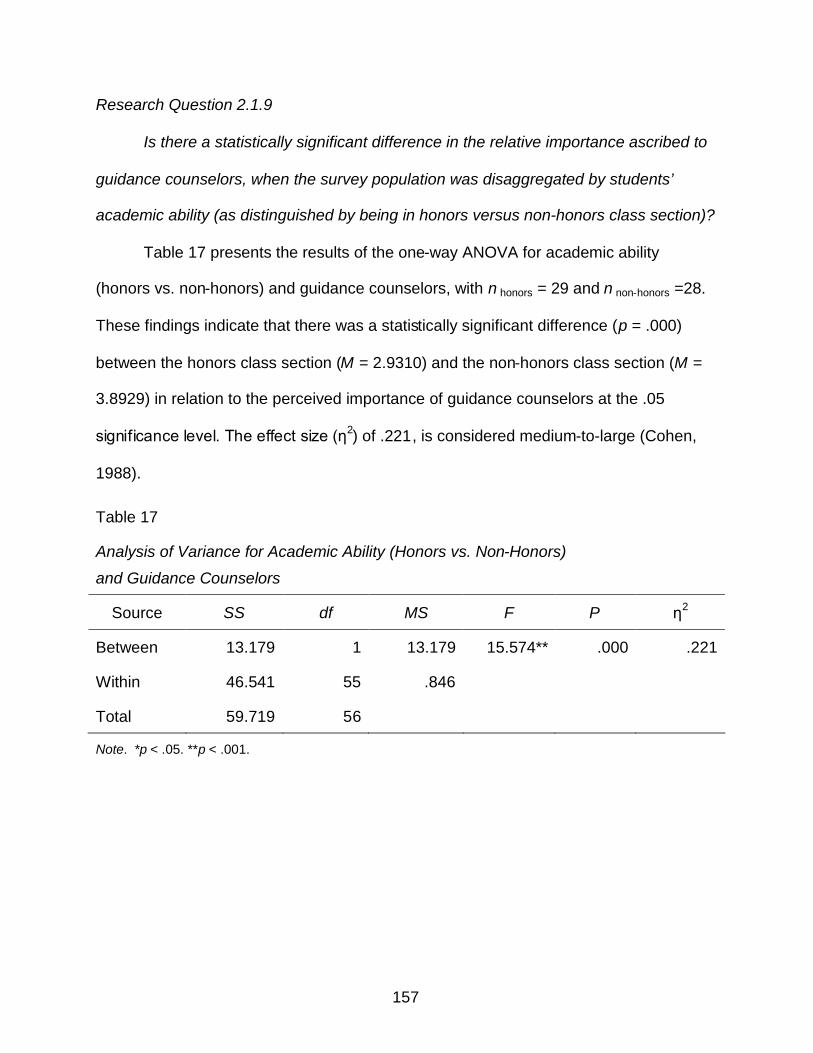
157
Research Question 2.1.9
Is there a statistically significant difference in the relative importance ascribed to
guidance counselors, when the survey population was disaggregated by students’
academic ability (as distinguished by being in honors versus non-honors class section)?
Table 17 presents the results of the one-way ANOVA for academic ability
(honors vs. non-honors) and guidance counselors, with n honors = 29 and n non-honors =28.
These findings indicate that there was a statistically significant difference (p = .000)
between the honors class section (M = 2.9310) and the non-honors class section (M =
3.8929) in relation to the perceived importance of guidance counselors at the .05
significance level. The effect size (η2) of .221, is considered medium-to-large (Cohen,
1988).
Table 17
Analysis of Variance for Academic Ability (Honors vs. Non-Honors)
and Guidance Counselors
Source SS df MS F P η2
Between 13.179 1 13.179 15.574** .000 .221
Within 46.541 55 .846
Total 59.719 56
Note. *p < .05. **p < .001.
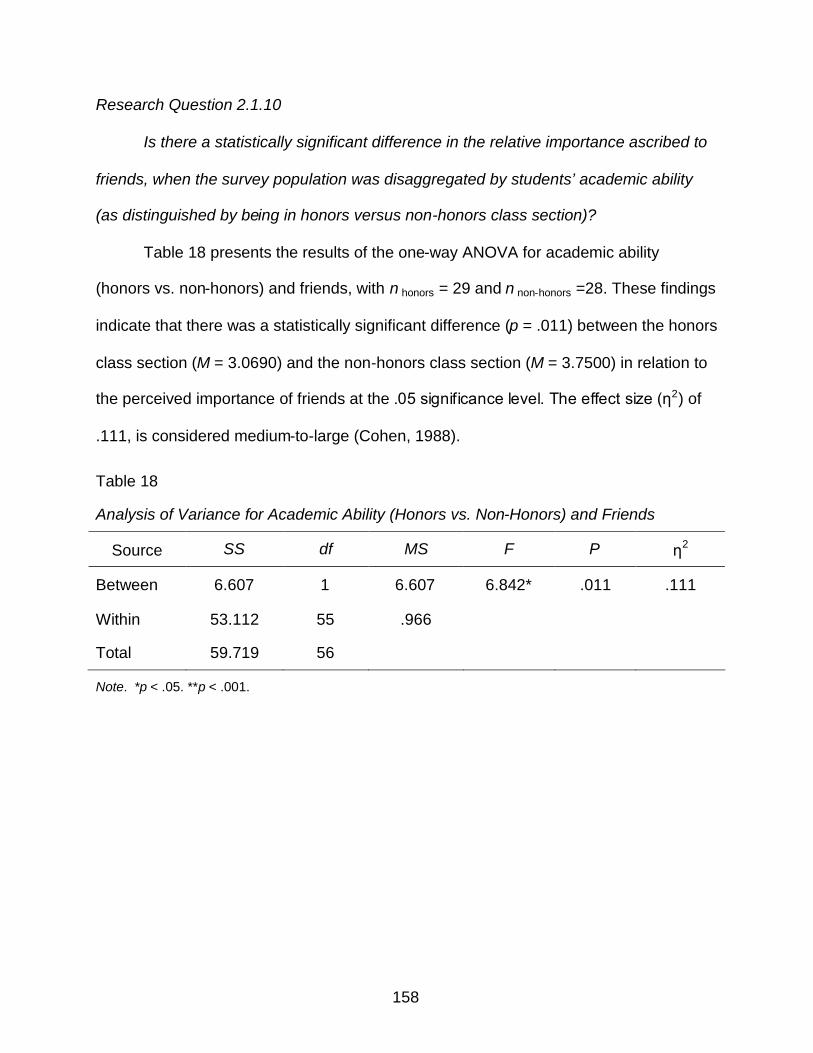
158
Research Question 2.1.10
Is there a statistically significant difference in the relative importance ascribed to
friends, when the survey population was disaggregated by students’ academic ability
(as distinguished by being in honors versus non-honors class section)?
Table 18 presents the results of the one-way ANOVA for academic ability
(honors vs. non-honors) and friends, with n honors = 29 and n non-honors =28. These findings
indicate that there was a statistically significant difference (p = .011) between the honors
class section (M = 3.0690) and the non-honors class section (M = 3.7500) in relation to
the perceived importance of friends at the .05 significance level. The effect size (η2) of
.111, is considered medium-to-large (Cohen, 1988).
Table 18
Analysis of Variance for Academic Ability (Honors vs. Non-Honors) and Friends
Source SS df MS F P η2
Between 6.607 1 6.607 6.842* .011 .111
Within 53.112 55 .966
Total 59.719 56
Note. *p < .05. **p < .001.
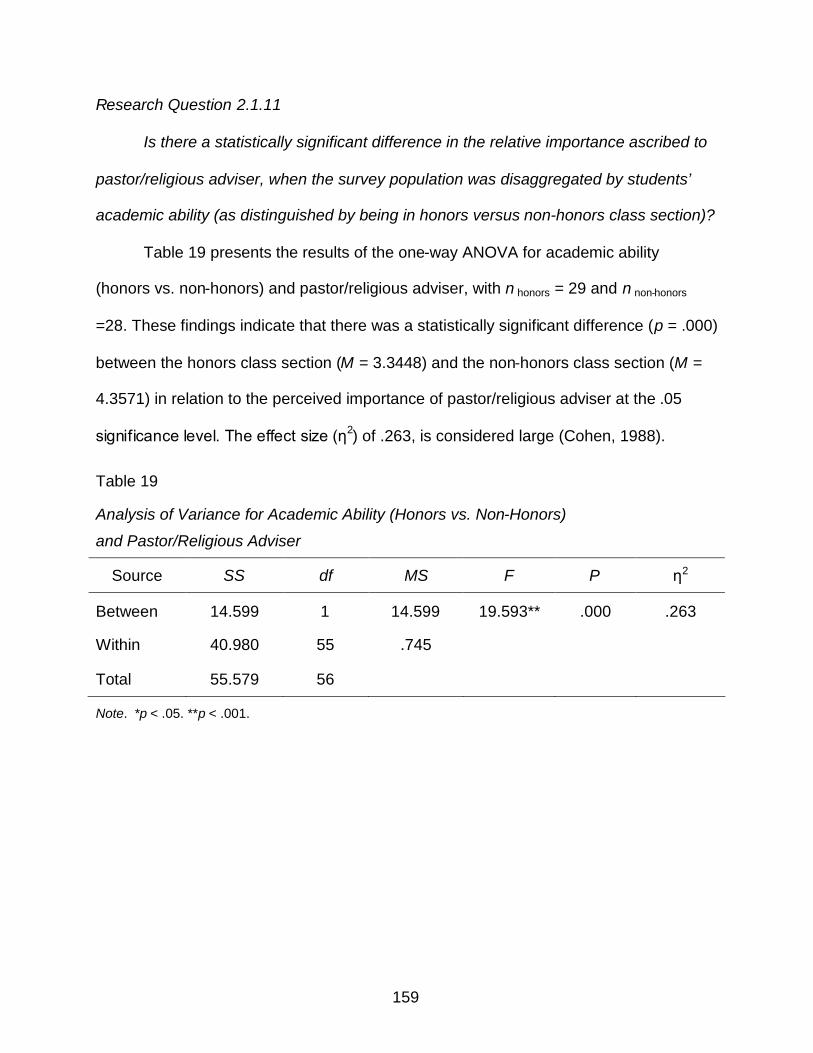
159
Research Question 2.1.11
Is there a statistically significant difference in the relative importance ascribed to
pastor/religious adviser, when the survey population was disaggregated by students’
academic ability (as distinguished by being in honors versus non-honors class section)?
Table 19 presents the results of the one-way ANOVA for academic ability
(honors vs. non-honors) and pastor/religious adviser, with n honors = 29 and n non-honors
=28. These findings indicate that there was a statistically significant difference (p = .000)
between the honors class section (M = 3.3448) and the non-honors class section (M =
4.3571) in relation to the perceived importance of pastor/religious adviser at the .05
significance level. The effect size (η2) of .263, is considered large (Cohen, 1988).
Table 19
Analysis of Variance for Academic Ability (Honors vs. Non-Honors)
and Pastor/Religious Adviser
Source SS df MS F P η2
Between 14.599 1 14.599 19.593** .000 .263
Within 40.980 55 .745
Total 55.579 56
Note. *p < .05. **p < .001.
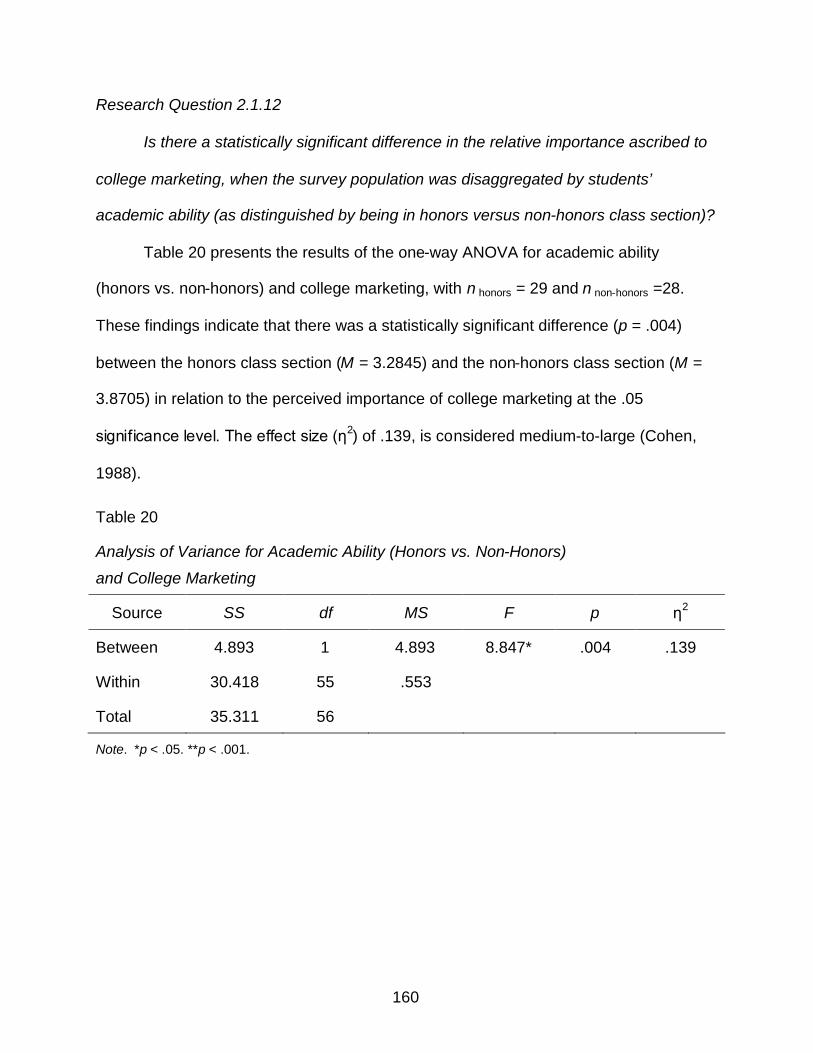
160
Research Question 2.1.12
Is there a statistically significant difference in the relative importance ascribed to
college marketing, when the survey population was disaggregated by students’
academic ability (as distinguished by being in honors versus non-honors class section)?
Table 20 presents the results of the one-way ANOVA for academic ability
(honors vs. non-honors) and college marketing, with n honors = 29 and n non-honors =28.
These findings indicate that there was a statistically significant difference (p = .004)
between the honors class section (M = 3.2845) and the non-honors class section (M =
3.8705) in relation to the perceived importance of college marketing at the .05
significance level. The effect size (η2) of .139, is considered medium-to-large (Cohen,
1988).
Table 20
Analysis of Variance for Academic Ability (Honors vs. Non-Honors)
and College Marketing
Source SS df MS F p η2
Between 4.893 1 4.893 8.847* .004 .139
Within 30.418 55 .553
Total 35.311 56
Note. *p < .05. **p < .001.
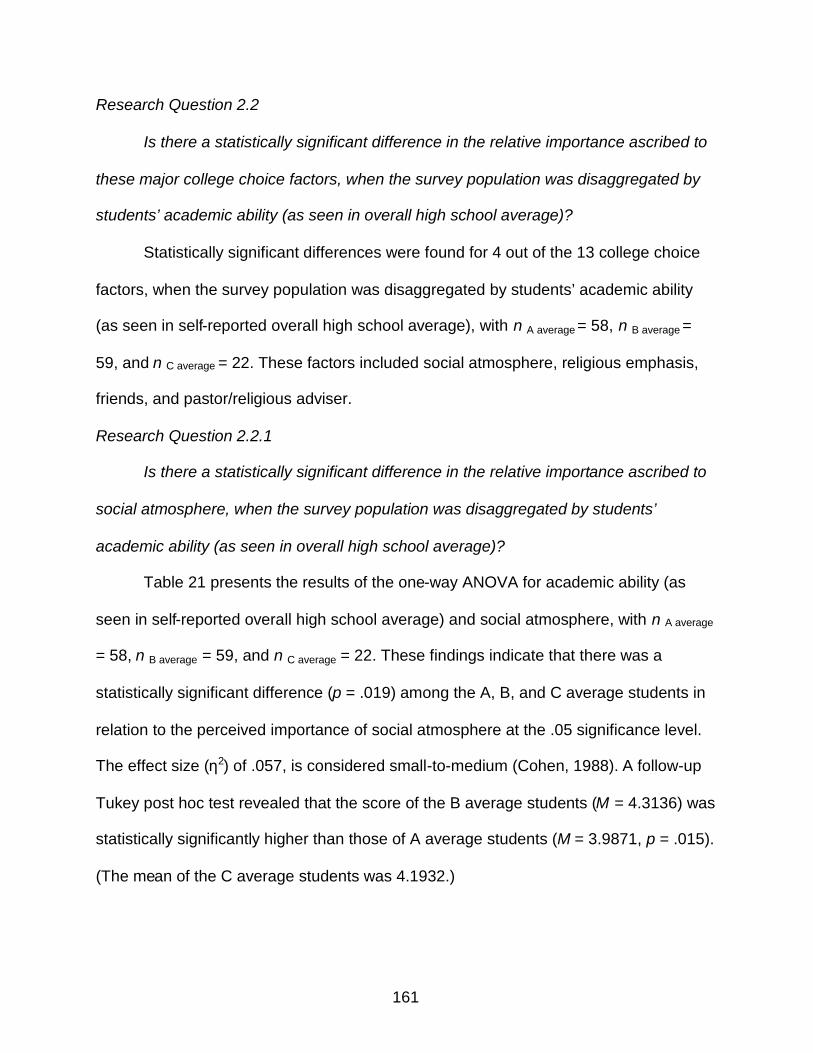
161
Research Question 2.2
Is there a statistically significant difference in the relative importance ascribed to
these major college choice factors, when the survey population was disaggregated by
students’ academic ability (as seen in overall high school average)?
Statistically significant differences were found for 4 out of the 13 college choice
factors, when the survey population was disaggregated by students’ academic ability
(as seen in self-reported overall high school average), with n A average = 58, n B average =
59, and n C average = 22. These factors included social atmosphere, religious emphasis,
friends, and pastor/religious adviser.
Research Question 2.2.1
Is there a statistically significant difference in the relative importance ascribed to
social atmosphere, when the survey population was disaggregated by students’
academic ability (as seen in overall high school average)?
Table 21 presents the results of the one-way ANOVA for academic ability (as
seen in self-reported overall high school average) and social atmosphere, with n A average
= 58, n B average = 59, and n C average = 22. These findings indicate that there was a
statistically significant difference (p = .019) among the A, B, and C average students in
relation to the perceived importance of social atmosphere at the .05 significance level.
The effect size (η2) of .057, is considered small-to-medium (Cohen, 1988). A follow-up
Tukey post hoc test revealed that the score of the B average students (M = 4.3136) was
statistically significantly higher than those of A average students (M = 3.9871, p = .015).
(The mean of the C average students was 4.1932.)
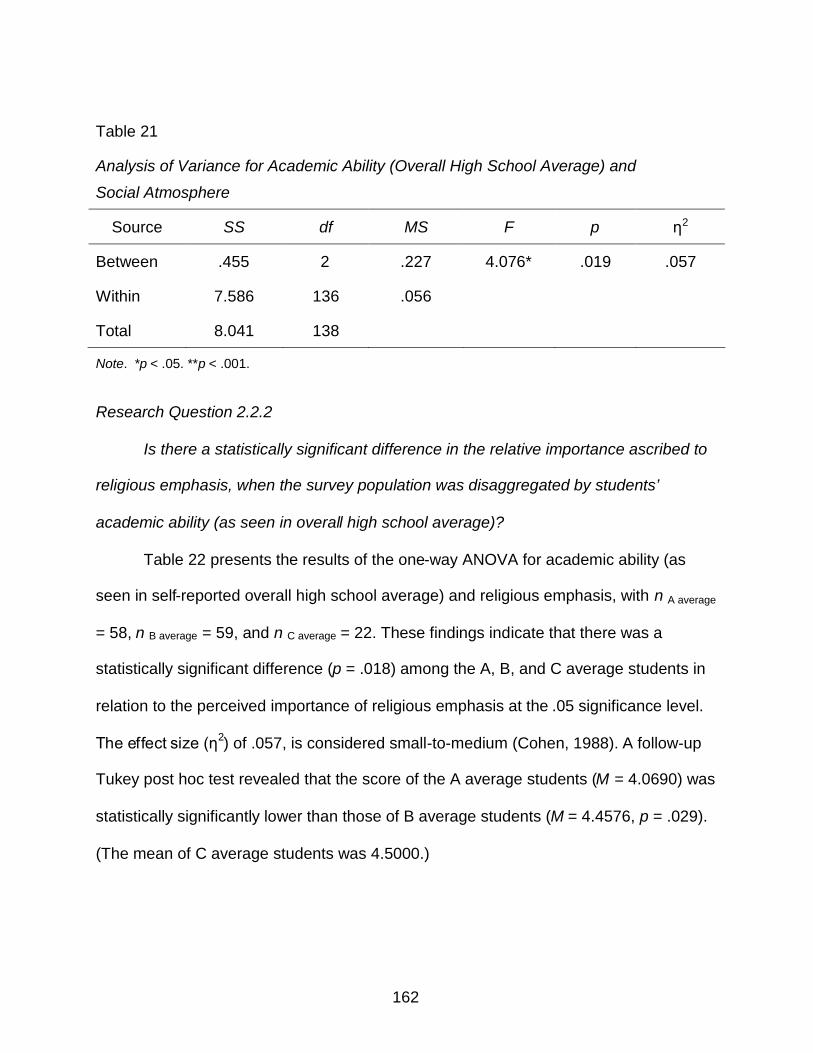
162
Table 21
Analysis of Variance for Academic Ability (Overall High School Average) and
Social Atmosphere
Source SS df MS F p η2
Between .455 2 .227 4.076* .019 .057
Within 7.586 136 .056
Total 8.041 138
Note. *p < .05. **p < .001.
Research Question 2.2.2
Is there a statistically significant difference in the relative importance ascribed to
religious emphasis, when the survey population was disaggregated by students’
academic ability (as seen in overall high school average)?
Table 22 presents the results of the one-way ANOVA for academic ability (as
seen in self-reported overall high school average) and religious emphasis, with n A average
= 58, n B average = 59, and n C average = 22. These findings indicate that there was a
statistically significant difference (p = .018) among the A, B, and C average students in
relation to the perceived importance of religious emphasis at the .05 significance level.
The effect size (η2) of .057, is considered small-to-medium (Cohen, 1988). A follow-up
Tukey post hoc test revealed that the score of the A average students (M = 4.0690) was
statistically significantly lower than those of B average students (M = 4.4576, p = .029).
(The mean of C average students was 4.5000.)
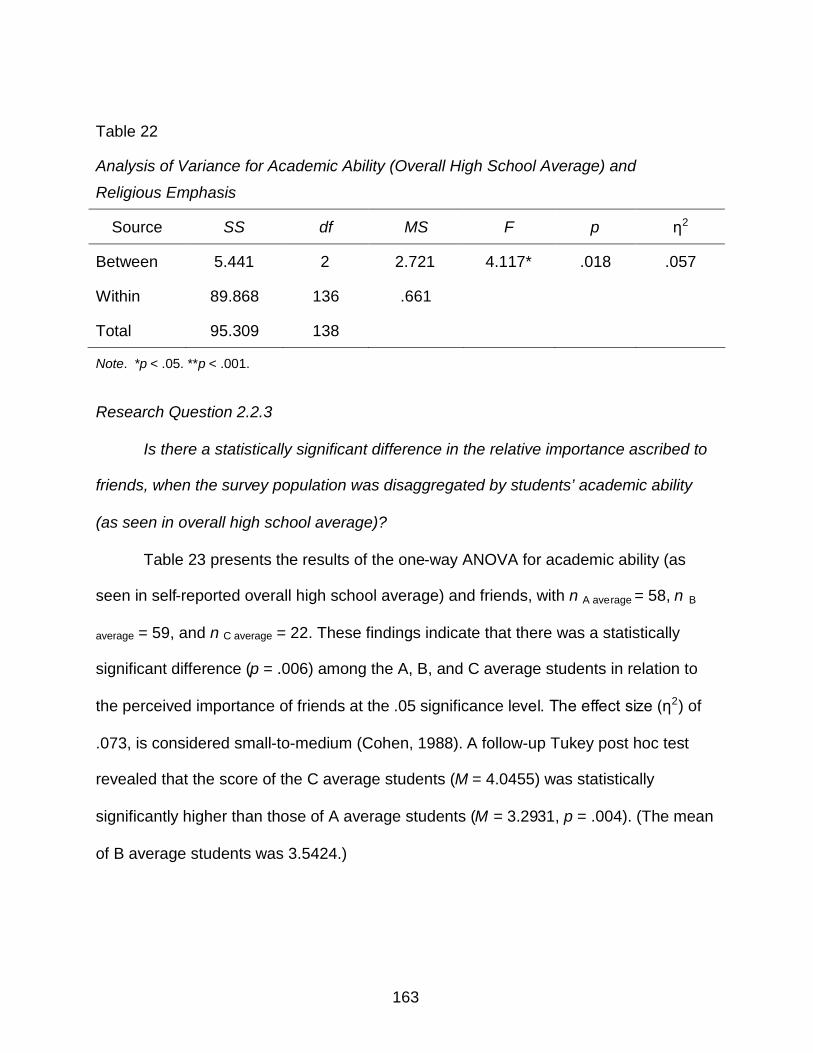
163
Table 22
Analysis of Variance for Academic Ability (Overall High School Average) and
Religious Emphasis
Source SS df MS F p η2
Between 5.441 2 2.721 4.117* .018 .057
Within 89.868 136 .661
Total 95.309 138
Note. *p < .05. **p < .001.
Research Question 2.2.3
Is there a statistically significant difference in the relative importance ascribed to
friends, when the survey population was disaggregated by students’ academic ability
(as seen in overall high school average)?
Table 23 presents the results of the one-way ANOVA for academic ability (as
seen in self-reported overall high school average) and friends, with n A average = 58, n B
average = 59, and n C average = 22. These findings indicate that there was a statistically
significant difference (p = .006) among the A, B, and C average students in relation to
the perceived importance of friends at the .05 significance level. The effect size (η2) of
.073, is considered small-to-medium (Cohen, 1988). A follow-up Tukey post hoc test
revealed that the score of the C average students (M = 4.0455) was statistically
significantly higher than those of A average students (M = 3.2931, p = .004). (The mean
of B average students was 3.5424.)
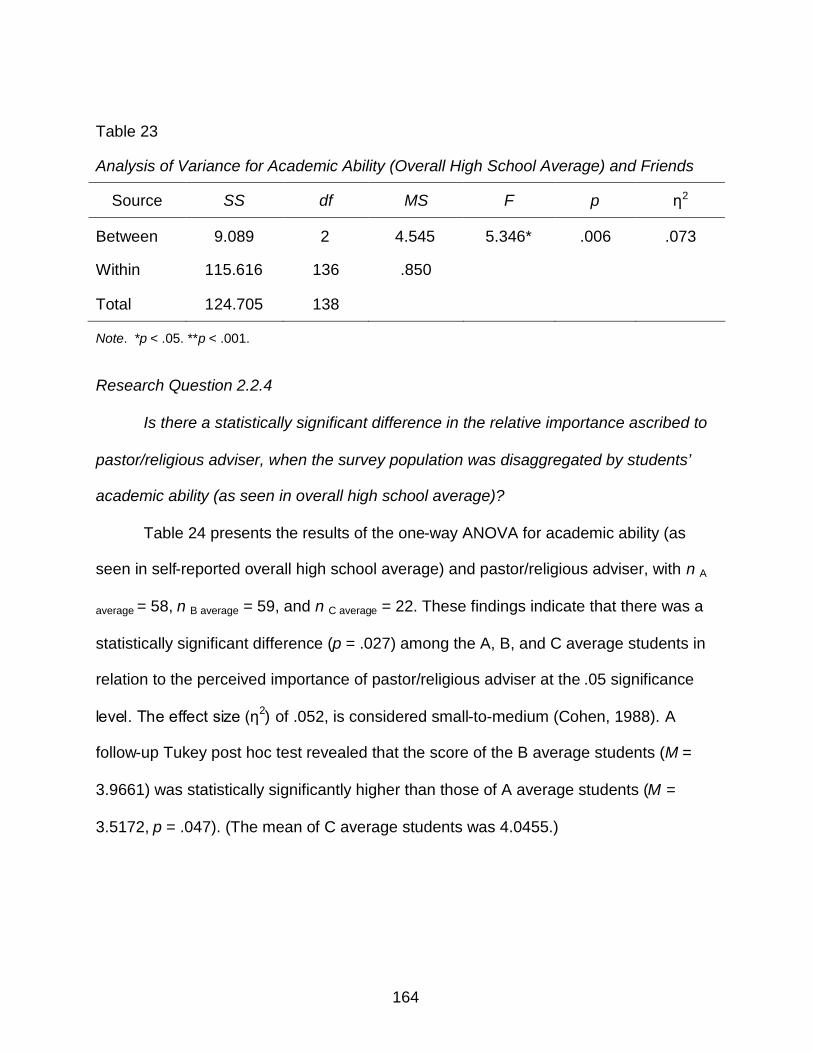
164
Table 23
Analysis of Variance for Academic Ability (Overall High School Average) and Friends
Source SS df MS F p η2
Between 9.089 2 4.545 5.346* .006 .073
Within 115.616 136 .850
Total 124.705 138
Note. *p < .05. **p < .001.
Research Question 2.2.4
Is there a statistically significant difference in the relative importance ascribed to
pastor/religious adviser, when the survey population was disaggregated by students’
academic ability (as seen in overall high school average)?
Table 24 presents the results of the one-way ANOVA for academic ability (as
seen in self-reported overall high school average) and pastor/religious adviser, with n A
average = 58, n B average = 59, and n C average = 22. These findings indicate that there was a
statistically significant difference (p = .027) among the A, B, and C average students in
relation to the perceived importance of pastor/religious adviser at the .05 significance
level. The effect size (η2) of .052, is considered small-to-medium (Cohen, 1988). A
follow-up Tukey post hoc test revealed that the score of the B average students (M =
3.9661) was statistically significantly higher than those of A average students (M =
3.5172, p = .047). (The mean of C average students was 4.0455.)
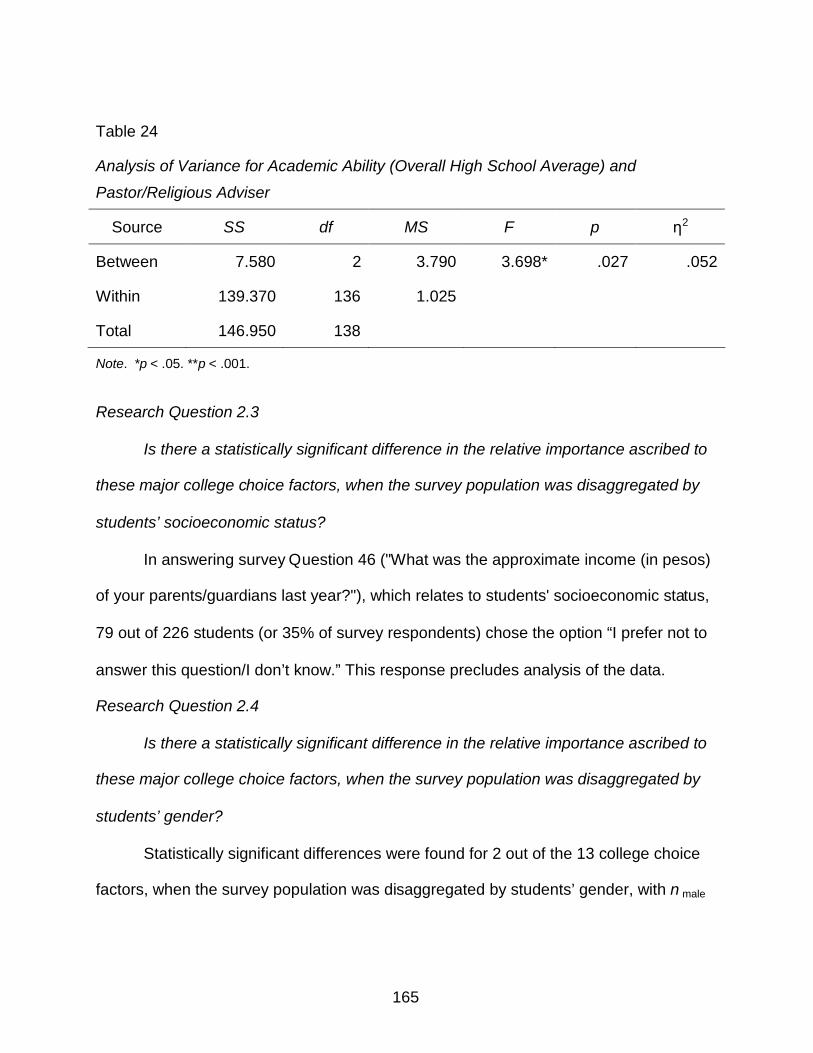
165
Table 24
Analysis of Variance for Academic Ability (Overall High School Average) and
Pastor/Religious Adviser
Source SS df MS F p η2
Between 7.580 2 3.790 3.698* .027 .052
Within 139.370 136 1.025
Total 146.950 138
Note. *p < .05. **p < .001.
Research Question 2.3
Is there a statistically significant difference in the relative importance ascribed to
these major college choice factors, when the survey population was disaggregated by
students’ socioeconomic status?
In answering survey Question 46 ("What was the approximate income (in pesos)
of your parents/guardians last year?"), which relates to students' socioeconomic status,
79 out of 226 students (or 35% of survey respondents) chose the option “I prefer not to
answer this question/I don’t know.” This response precludes analysis of the data.
Research Question 2.4
Is there a statistically significant difference in the relative importance ascribed to
these major college choice factors, when the survey population was disaggregated by
students’ gender?
Statistically significant differences were found for 2 out of the 13 college choice
factors, when the survey population was disaggregated by students’ gender, with n male
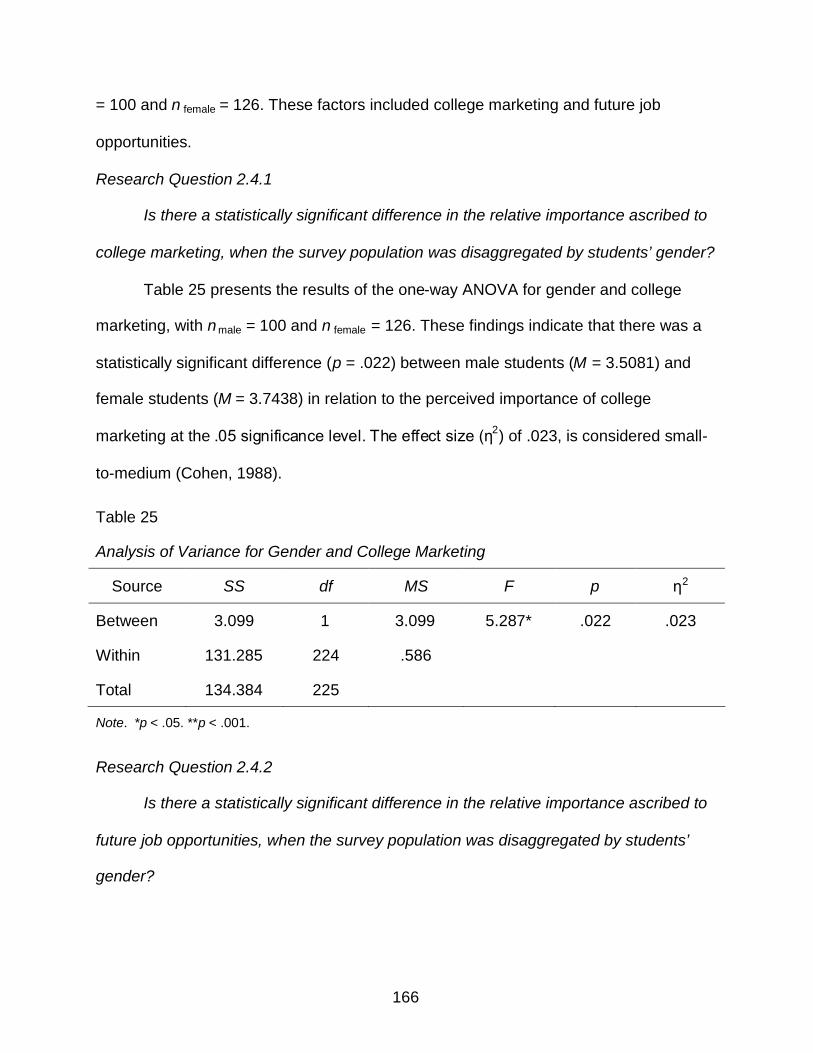
166
= 100 and n female = 126. These factors included college marketing and future job
opportunities.
Research Question 2.4.1
Is there a statistically significant difference in the relative importance ascribed to
college marketing, when the survey population was disaggregated by students’ gender?
Table 25 presents the results of the one-way ANOVA for gender and college
marketing, with nmale = 100 and n female = 126. These findings indicate that there was a
statistically significant difference (p = .022) between male students (M = 3.5081) and
female students (M = 3.7438) in relation to the perceived importance of college
marketing at the .05 significance level. The effect size (η2) of .023, is considered small-
to-medium (Cohen, 1988).
Table 25
Analysis of Variance for Gender and College Marketing
Source SS df MS F p η2
Between 3.099 1 3.099 5.287* .022 .023
Within 131.285 224 .586
Total 134.384 225
Note. *p < .05. **p < .001.
Research Question 2.4.2
Is there a statistically significant difference in the relative importance ascribed to
future job opportunities, when the survey population was disaggregated by students’
gender?
167
The results of the Mann-Whitney U test for gender and future job opportunities,
with n male = 100 and n female = 126, indicate that there was a statistically significant
difference (z = -2.061, p = .039) between male students (mean rank = 106.90) and
female students (mean rank = 118.74) in relation to the perceived importance of future
job opportunities at the .05 significance level. The effect size (r2) of .019, is considered
small (Cohen, 1988).
Research Question 2.5
Is there a statistically significant difference in the relative importance ascribed to
these major college choice factors, when the survey population was disaggregated by
students’ educational aspirations/expectations?
A statistically significant difference was found for 1 out of the 13 college choice
factors, when the survey population was disaggregated by students’ educational
aspirations/expectations, with n non-college-bound = 20 and n college-bound = 21. This factor was
programs of study.
Research Question 2.5.1
Is there a statistically significant difference in the relative importance ascribed to
programs of study, when the survey population was disaggregated by students’
educational aspirations/expectations?
Table 26 presents the results of the one-way ANOVA for educational
aspirations/expectations and programs of study, with n non-college-bound = 20 and n college-
bound = 21. These findings indicate that there was a statistically significant difference (p =
.032) between college-bound students (M = 4.6429) and non-college-bound students (M
= 4.25) in relation to the perceived importance of programs of study at the .05

168
significance level. The effect size (η2) of .113, is considered medium-to-large (Cohen,
1988).
Table 26
Analysis of Variance for Educational Aspirations/Expectations and Programs of Study
Source SS df MS F p η2
Between .109 1 .109 4.966* .032 .113
Within .854 39 .022
Total .963 40
Note. *p < .05. **p < .001.
Research Question 2.6
Is there a statistically significant difference in the relative importance ascribed to
these major college choice factors, when the survey population was disaggregated by
students’ race/ethnicity?
A statistically significant difference was found for 1 out of the 13 college choice
factors, when the survey population was disaggregated by students’ race/ethnicity, with
n Chinese = 90, n Chinese & Filipino = 108. This factor was cost and financial aid.
Research Question 2.6.1
Is there a statistically significant difference in the relative importance ascribed to
cost and financial aid, when the survey population was disaggregated by students’
race/ethnicity?
Table 27 presents the results of the one-way ANOVA for race/ethnicity and cost
and financial aid, with n Chinese = 90, n Chinese & Filipino = 108. These findings indicate that
there was a statistically significant difference (p = .011) between Chinese (M = 3.6689)
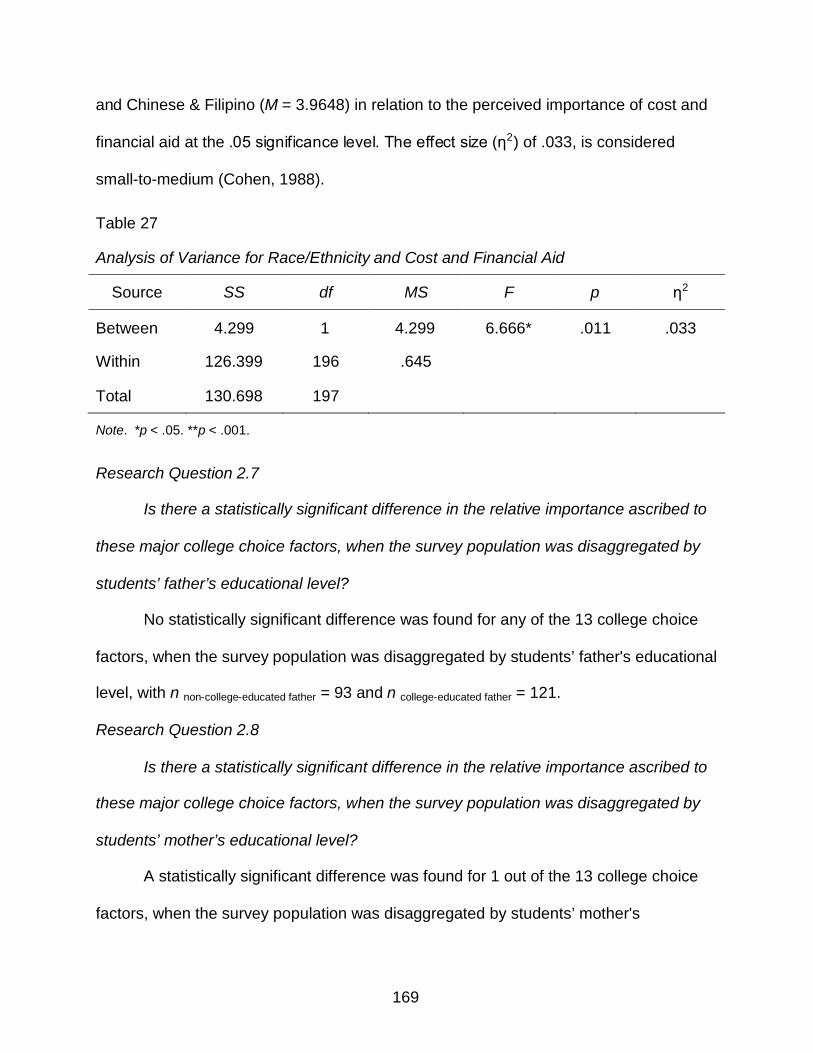
169
and Chinese & Filipino (M = 3.9648) in relation to the perceived importance of cost and
financial aid at the .05 significance level. The effect size (η2) of .033, is considered
small-to-medium (Cohen, 1988).
Table 27
Analysis of Variance for Race/Ethnicity and Cost and Financial Aid
Source SS df MS F p η2
Between 4.299 1 4.299 6.666* .011 .033
Within 126.399 196 .645
Total 130.698 197
Note. *p < .05. **p < .001.
Research Question 2.7
Is there a statistically significant difference in the relative importance ascribed to
these major college choice factors, when the survey population was disaggregated by
students’ father’s educational level?
No statistically significant difference was found for any of the 13 college choice
factors, when the survey population was disaggregated by students’ father's educational
level, with n non-college-educated father = 93 and n college-educated father = 121.
Research Question 2.8
Is there a statistically significant difference in the relative importance ascribed to
these major college choice factors, when the survey population was disaggregated by
students’ mother’s educational level?
A statistically significant difference was found for 1 out of the 13 college choice
factors, when the survey population was disaggregated by students’ mother's
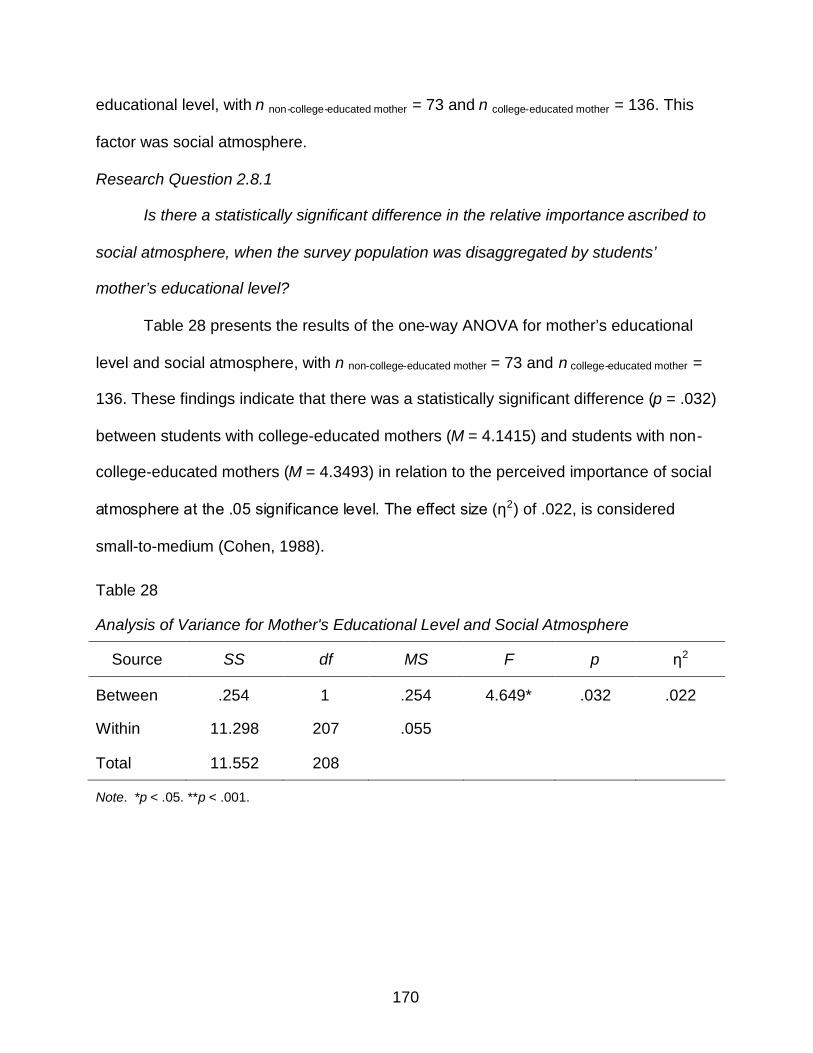
170
educational level, with n non-college-educated mother = 73 and n college-educated mother = 136. This
factor was social atmosphere.
Research Question 2.8.1
Is there a statistically significant difference in the relative importance ascribed to
social atmosphere, when the survey population was disaggregated by students’
mother’s educational level?
Table 28 presents the results of the one-way ANOVA for mother’s educational
level and social atmosphere, with n non-college-educated mother = 73 and n college-educated mother =
136. These findings indicate that there was a statistically significant difference (p = .032)
between students with college-educated mothers (M = 4.1415) and students with non-
college-educated mothers (M = 4.3493) in relation to the perceived importance of social
atmosphere at the .05 significance level. The effect size (η2) of .022, is considered
small-to-medium (Cohen, 1988).
Table 28
Analysis of Variance for Mother's Educational Level and Social Atmosphere
Source SS df MS F p η2
Between .254 1 .254 4.649* .032 .022
Within 11.298 207 .055
Total 11.552 208
Note. *p < .05. **p < .001.
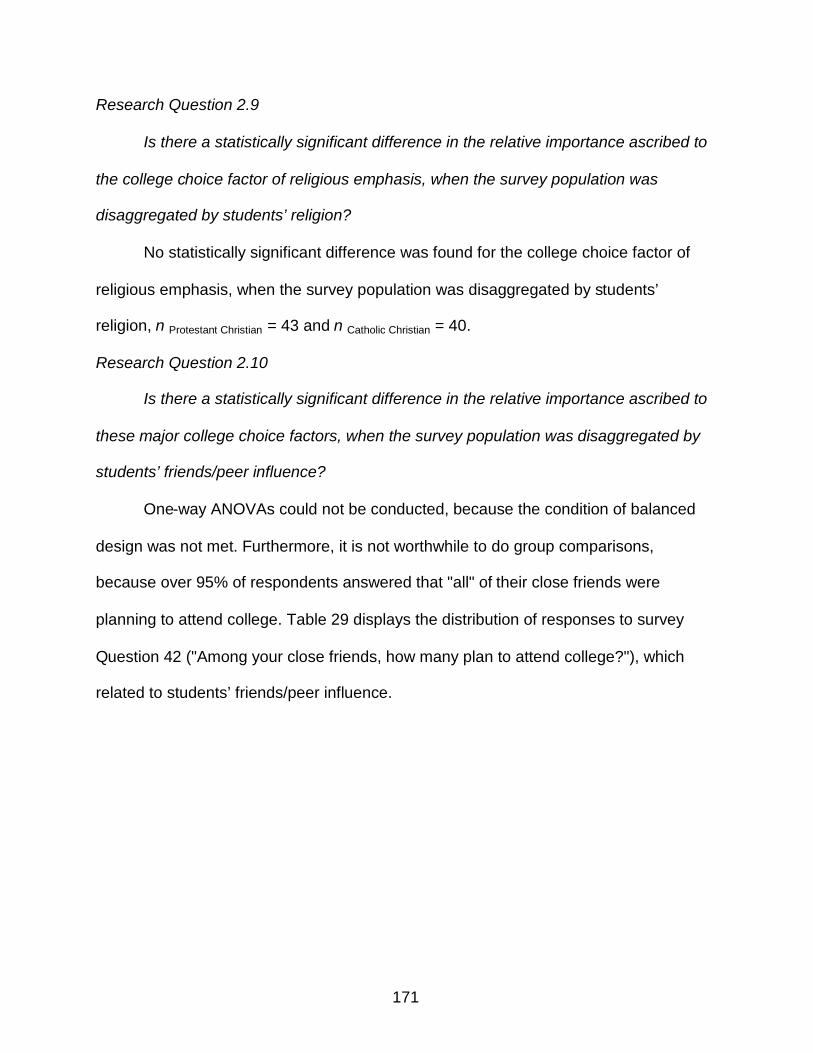
171
Research Question 2.9
Is there a statistically significant difference in the relative importance ascribed to
the college choice factor of religious emphasis, when the survey population was
disaggregated by students’ religion?
No statistically significant difference was found for the college choice factor of
religious emphasis, when the survey population was disaggregated by students’
religion, n Protestant Christian = 43 and n Catholic Christian = 40.
Research Question 2.10
Is there a statistically significant difference in the relative importance ascribed to
these major college choice factors, when the survey population was disaggregated by
students’ friends/peer influence?
One-way ANOVAs could not be conducted, because the condition of balanced
design was not met. Furthermore, it is not worthwhile to do group comparisons,
because over 95% of respondents answered that "all" of their close friends were
planning to attend college. Table 29 displays the distribution of responses to survey
Question 42 ("Among your close friends, how many plan to attend college?"), which
related to students’ friends/peer influence.
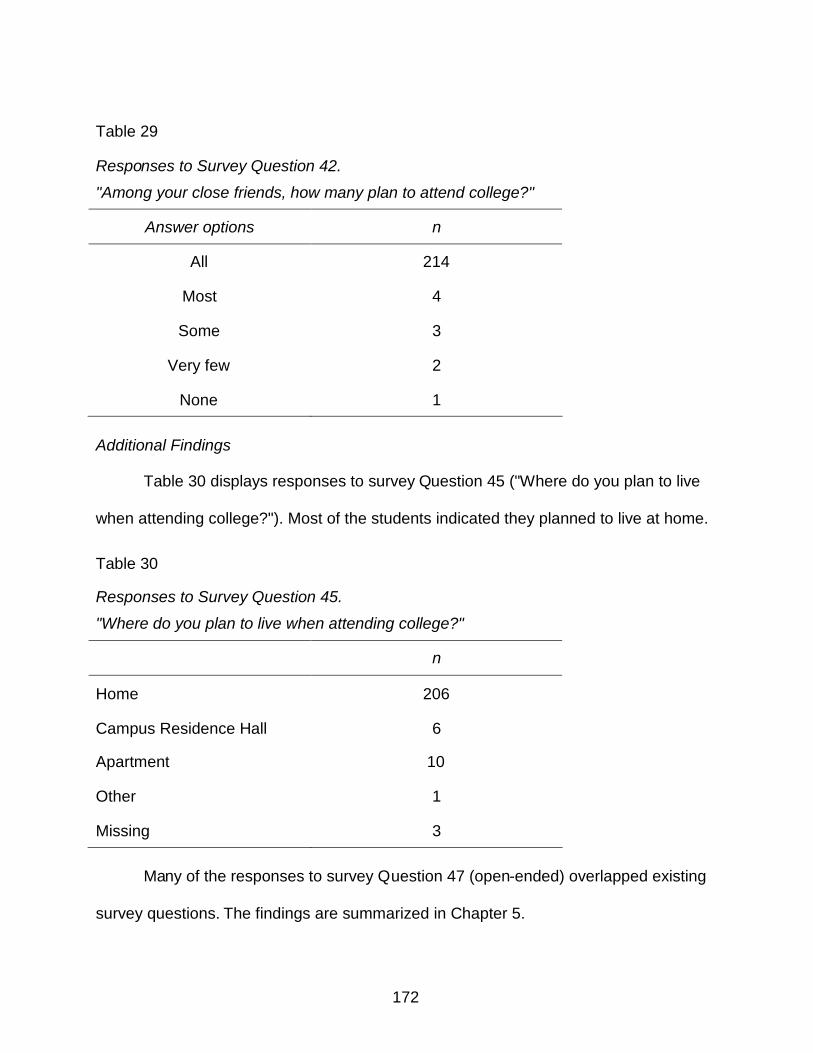
172
Table 29
Responses to Survey Question 42.
"Among your close friends, how many plan to attend college?"
Answer options n
All 214
Most 4
Some 3
Very few 2
None 1
Additional Findings
Table 30 displays responses to survey Question 45 ("Where do you plan to live
when attending college?"). Most of the students indicated they planned to live at home.
Table 30
Responses to Survey Question 45.
"Where do you plan to live when attending college?"
n
Home 206
Campus Residence Hall 6
Apartment 10
Other 1
Missing 3
Many of the responses to survey Question 47 (open-ended) overlapped existing
survey questions. The findings are summarized in Chapter 5.
173
CHAPTER 5
SUMMARY OF FINDINGS, DISCUSSION,
CONCLUSIONS AND RECOMMENDATIONS
Summary and Discussion of Findings
Introduction
The purposes of this nonexperimental, quantitative study were (1) to describe the
relative importance of major college choice factors (as identified in U.S. research) to
Philippine high school seniors, in the search-choice phase of college selection, and (2)
to determine whether there were statistically significant differences in the relative
importance ascribed to these factors, according to students’ demographic attributes.
This study addressed two research questions—the first with a descriptive research
design, and the second with a correlational research design. The survey instrument
College Choice Survey for High School Seniors, developed by the researcher, was
utilized to gather data. Cronbach's alpha for the survey composite index was 0.933, thus
establishing the reliability of the instrument’s scores. Participants included 226 fourth-
year Philippine high school students. Their demographic characteristics are displayed in
Table E.1 (see Appendix E).
For all statistical analyses, SPSS 16.0 software was used. To answer the first
research question, the mean and standard deviation were calculated for each college
choice factor addressed in the survey. To address the second research question,
ANOVAs, Mann-Whitney U tests, and Kruskal-Wallis tests were run, in order to study
the relationship between each of the major college choice factors and the students’
demographic attributes. The major college choice factors (i.e. dependent variables)
174
were academic quality, college marketing, cost and financial aid, friends, guidance
counselors, future job opportunities, location, parents, pastor/religious adviser,
programs of study, religious emphasis, security, and social atmosphere. The pertinent
demographic attributes of students (i.e. independent variables) were academic ability,
socioeconomic status, gender, educational aspirations/expectations, race/ethnicity,
father’s educational level, mother’s educational level, religion, and friends/peer
influence. A summary of major research findings and relevant discussion follow.
Research Question 1
How do high school seniors in the Philippines, in the search and choice phases
of their college selection process, evaluate the relative importance of major college
choice factors (as identified in United States research)?
The college choice factors, rated by students on a 1 to 5 scale (1 = not important
to 5 = most important), are arranged by descending order of importance: future job
opportunities (4.79), security (4.73), programs of study (4.53), academic quality (4.43),
religious emphasis (4.27), social atmosphere (4.23), parents (4.15), location (4.10), cost
and financial aid (3.84), pastor/religious adviser (3.80), college marketing (3.64), friends
(3.58), and guidance counselors (3.39).
All of the major college choice factors surfaced in U.S. literature were important,
to some degree, in the Philippine context. However, students placed more importance
on some factors (e.g. future job opportunities, programs of study) than on others (e.g.
friends, guidance counselors). Thus, overall, the findings correspond to current United
States college choice research.
175
That the “cost and financial aid” factor was not ranked more highly in importance
was somewhat surprising, considering that this was a top factor in U.S. college choice
research (Paulsen, 1990, pp. 47-48; Broekemier, 2002, p. 34; Cabrera and La Nasa,
2000, pp. 9-10). This may be partly explained by the upper-middle class backgrounds of
the students. Paulsen (1990) writes, “College becomes less attractive to students when
tuition expenses, room and board expenses, and distance from home increase.
However, . . . [a]t higher levels of student income and aptitude, these effects become
less important” (pp. 27-28).
That students ranked their “parents” higher than other people (e.g.
pastor/religious adviser, friends, guidance counselor) coheres with U.S. research. After
reviewing previous studies (The Carnegie Foundation, 1986; Dixon and Martin, 1991;
Flint, 1992), Mansfield and Warwick (2005) noted that these “all report[ed] high school
seniors identify[ing] parents as primary influencers in college choice decisions and the
most influential people in helping them select a college” (pp. 50-51).
The low ranking of guidance counselors in this study seems to differ from U.S.
college choice research, in which these people are identified among the factors
“consistently influential” in the search and choice phases of students’ college choice
process (McDonough, 1997, p. 4). Nevertheless, even in U.S. literature, there is some
evidence that points to the “declining influence of the high school counselor in the
college choice process of seniors” (Rowe, 2002, pp. 50-51).
Three factors (security, religious emphasis, and pastor/religious adviser),
although not considered major in the U.S. literature, were added based on feedback
from the pilot studies. That students ranked “security” as second in importance may be
176
due to the increased kidnapping threat in this third world country. That students ranked
“religious emphasis” and “pastor/religious adviser” highly may be attributed, in part, to
the religious nature of the high school.
Research Question 2
Do the relative importance ascribed to these major college choice factors vary
when the survey population was disaggregated by students’ demographic attributes?
Research Question 2.1
Is there a statistically significant difference in the relative importance ascribed to
these major college choice factors, when the survey population was disaggregated by
students’ academic ability (as distinguished by being in honors versus non-honors class
section)?
Statistically significant differences were found for 12 out of the 13 college choice
factors, when the survey population was disaggregated by students’ academic ability,
as distinguished by being in honors versus non-honors class sections. These factors
included academic quality, programs of study, cost and financial aid, location, social
atmosphere, religious emphasis, security, parents, guidance counselors, friends,
pastor/religious adviser, and college marketing. Interestingly, for each of these factors,
the score of the non-honors students was statistically significantly higher than the score
of the honors students.
The “pastor/religious adviser” factor had a large effect size; 26.3% of the
variability in the relative importance attributed to the “pastor/religious adviser” can be
explained by students’ academic ability (honors vs. non-honors class section).
Moreover, eight college choice factors had medium-to-large effect sizes: 22.1% of the
177
variability in the relative importance attributed to “guidance counselors” can be
explained by students’ academic ability (honors vs. non-honors class section); 16.3%
for “social atmosphere,” 13.9% for “college marketing,” 13.8% for “programs of study,”
11.3% for “location,” 11.2% for “security,” 11.1% for “friends,” and 10.4% for “religious
emphasis.”
That non-honors students rated the importance of the “location” and “cost and
financial aid” factors higher than did the honors students correlates with U.S. research.
Avery and Hoxby (2004) found that, in general, “high-aptitude students are nearly
indifferent to a college’s distance from their home, to whether it is in-state, and to
whether it is public” (p. 288). Hossler (2000) observed that “it typically requires larger
scholarships to influence the enrollment decisions of high-ability students.” (pp. 81-82).
However, the finding that non-honors students rated the importance of the
“academic quality” and “programs of study” factors higher than did the honors students
diverges from U.S. research. According to Paulsen (1990), “[t]he higher the academic
ability of a student, the greater the concern about academic standards, program
offerings” (p. 50). Hossler (2000) concurred, concluding that high-ability students are
“more likely to be interested in institutions with higher levels of prestige and greater
selectivity” (pp. 81-82).
178
Research Question 2.2
Is there a statistically significant difference in the relative importance ascribed to
these major college choice factors, when the survey population was disaggregated by
students’ academic ability (as seen in overall high school average)?
Statistically significant differences were found for 4 out of the 13 college choice
factors, when the survey population was disaggregated by students’ academic ability
(as seen in self-reported overall high school average). These factors included social
atmosphere, religious emphasis, friends, and pastor/religious adviser. The effect sizes
for these were small-to-medium.
The findings that B average students rated the importance of “social atmosphere”
higher than their A average counterparts, and that C average students rated the
importance of “friends” higher than A average students, coheres with stereotypes about
high-ability students placing less emphasis on social aspects. However, this researcher
did not find much in U.S. college choice literature to support or disprove these findings.
Interestingly, the B average students rated the importance of the “religious emphasis”
and “pastor/religious adviser” factors higher than their A average counterparts. Again,
U.S. college choice research does not relate much to these findings.
Research Question 2.3
Is there a statistically significant difference in the relative importance ascribed to
these major college choice factors, when the survey population was disaggregated by
students’ socioeconomic status?
Although socioeconomic status is a major demographic attribute in U.S. college
choice literature, analysis of the Philippine data was precluded, due to the fact that, in
179
answering the socioeconomic status question, 79 out of 226 students (or 35% of survey
respondents) chose the option “I prefer not to answer this question/I don’t know.”
Nevertheless, we know that, in general, clientele of AAA High School were from upper-
middle class families. Moreover, around 12-15% of the student population received
scholarships; the vast majority of these were need-based, rather than merit-based.
A counselor from AAA High School attributed this non-response on the survey
question to two possibilities. First, due to the increase in kidnappings nationwide
(especially of persons of Chinese ethnicity), parents have instructed their children not to
disclose such information. Second, as many parents put their primary focus on their
business, and let maids (called yayas) take care of their children, it is possible that the
students do not know their family’s socioeconomic status.
This non-response on the socioeconomic status question suggests a weakness
in this study, namely, the sole use of the survey method to gather information. Perhaps
supplementing this with personal or group interviews, with parents as well as students,
may provide more insights. Determining parental occupations, and then using general
data about income for those careers as a rough estimate of the socioeconomic status,
might have been another option. In regard to the method of collecting college choice
information, following the majority of U.S. college choice literature in using only the
survey method, does not yield the same amount of data in the Philippines. For this
socioeconomic status question, the differences between a prosperous, relatively secure
country (i.e. the United States of America) and a under-developed country beset by
internal security threats (i.e. the Philippines) come into play.
180
Research Question 2.4
Is there a statistically significant difference in the relative importance ascribed to
these major college choice factors, when the survey population was disaggregated by
students’ gender?
Statistically significant differences were found for 2 out of the 13 college choice
factors, when the survey population was disaggregated by students’ gender. These
factors included college marketing and future job opportunities, which had, respectively,
small-to-medium and small effect sizes. Interestingly, female students rated the relative
importance of 12 (out of 13) college choice factors higher than did male students. The
exception was the “friends” factors, for which male students rated its importance higher
than did their female counterparts.
Although not a one-to-one correspondence, these findings were similar to those
of Mansfield and Warwick (2005), who surveyed seniors from eight private, religiously
affiliated schools from five states, evaluating the gender differences between students
as to how they rated the level of importance of 19 college selection criteria. Similar to
this study’s results, Mansfield and Warwick (2005) did not find statistically significant
differences between male and female students for most of their college selection
criteria. However, they found that female students had higher importance levels
attributed to most college selection criteria than did their male counterparts.
181
Research Question 2.5
Is there a statistically significant difference in the relative importance ascribed to
these major college choice factors, when the survey population was disaggregated by
students’ educational aspirations/expectations?
A statistically significant difference was found for 1 out of the 13 college choice
factors, when the survey population was disaggregated by students’ educational
aspirations/expectations. This factor was programs of study, and it had a medium-to-
large effect size. 11.3% of the variability in the relative importance attributed to
“programs of study” can be explained by students’ educational aspirations/expectations
(i.e. whether or not they were college-bound). Although this researcher has not found
much in U.S. research which pertains to this combination (i.e. educational
aspirations/expectations with programs of study), it seems reasonable that college-
bound students would place a higher importance on the programs of study offered by an
institution, than their non-college-bound counterparts.
Research Question 2.6
Is there a statistically significant difference in the relative importance ascribed to
these major college choice factors, when the survey population was disaggregated by
students’ race/ethnicity?
A statistically significant difference was found for 1 out of the 13 college choice
factors, when the survey population was disaggregated by students’ race/ethnicity.
Students of Chinese-Filipino ethnicity rated the importance of the “cost and financial aid”
factor statistically significantly higher than students of Chinese ethnicity. The effect size
is small-to-medium. (The information for students of Filipino ethnicity was not used, due
182
to low numbers.) In reviewing the findings, a counselor from AAA High School
suggested that students may have been confused by the race/ethnicity classifications,
as the distinction between “Chinese” and “Chinese & Filipino” is somewhat blurry. This
weak classification probably led to a distortion in findings. United States college choice
research specifically relating to Asian American subgroups is somewhat sparse, as
Teranishi, Ceja, Antonio, Allen, and McDonough (2004) note,
While there exists a limited amount of research on the educational experiences
of Asian Americans as a whole, even less is known about the educational
experiences of ethnic subgroups within the population . . . . Rather, the Asian
American population has been misrepresented through being categorized and
treated as a single, homogeneous racial group. (p. 528)
Research Question 2.7
Is there a statistically significant difference in the relative importance ascribed to
these major college choice factors, when the survey population was disaggregated by
students’ father’s educational level?
No statistically significant difference was found for any of the 13 college choice
factors, when the survey population was disaggregated by students’ father's educational
level. Interestingly, however, students with non-college-educated fathers rated all 13
college choice factors higher than did students with college-educated fathers.
These findings contradict U.S. research, both in the number of statistically
significant differences, as well as the direction of these differences. Paulsen (1990)
found that U.S. students with parents of higher educational attainment “are more likely
to emphasize the importance of programs and high academic standards, and less likely
183
to show concern about costs” (pp. 48-49). Moreover, these students “tend to rely more
on their parents for information and less on high school counselors” and “are more
inclined to use commercial guidebooks, campus visits, admissions officers, and alumni,”
while students with parents of lower educational attainment “depend more on the advice
of high school counselors and unrequested publications” (Paulsen, 1990, p. 54).
Perhaps this discrepancy between U.S. and Philippine findings may be partly
explained by the milieu of the Philippines, and specifically that of AAA High School.
Roses (1988) explains that, in this Southeast Asian country, the common man seems to
have a strong attraction to tertiary education; so engrained is this in the Filipino psyche
that a father is willing to sell his last piece of land, his work animal, just to be able to see
his son through college (p. 44). The attainment of a diploma is valued, whether or not
one gets a job with it (Gonzalez, 1987, p. 41). On the other hand, there is a stigma
associated if one did not complete his college course (Gonzalez, 1987, pp. 41-42).
Indeed, “many students see access to credentials as providing social mobility to elite
circles” (Swinerton, 1991, p. 31). Moreover, that most students of AAA High School
were from relatively affluent, Chinese backgrounds may have rendered their perspective
on college choice factors more homogeneous than otherwise.
Research Question 2.8
Is there a statistically significant difference in the relative importance ascribed to
these major college choice factors, when the survey population was disaggregated by
students’ mother’s educational level?
A statistically significant difference was found for 1 out of the 13 college choice
factors, when the survey population was disaggregated by students’ mother's
184
educational level. Students with non-college-educated mothers rated the importance of
the “social atmosphere” factor statistically significantly higher than students with college-
educated mothers. The effect size is small-to-medium. Indeed, students with non-
college-educated mothers rated all 13 college choice factors higher than did students
with college-educated mothers.
These findings contradict U.S. research, both in the number of statistically
significant differences, as well as the direction of these differences. (See above
discussion relating to father’s education level.) Perhaps this discrepancy between U.S.
and Philippine findings may be partly explained by the milieu of the Philippines, and
specifically that of AAA High School. (See above discussion relating to father’s
education level.)
Research Question 2.9
Is there a statistically significant difference in the relative importance ascribed to
the college choice factor of religious emphasis, when the survey population was
disaggregated by students’ religion?
No statistically significant difference was found for the college choice factor of
religious emphasis, when the survey population was disaggregated by students’
religion, n Protestant Christian = 43 and n Catholic Christian = 40. (The information for Buddhist
students and students of other religions was not used, due to low numbers.) There is
not much in U.S. college choice literature which pertains to this subject.
Since the “religious emphasis” factor was operationalized in the survey as
“Christian (Protestant) environment” (due to AAA High School’s Protestant theology),
the finding was somewhat surprising that Protestant and Catholic students did not differ
185
statistically in their responses. Perhaps future studies could distinguish between
“Christian (Protestant) environment” and “Christian (Catholic) environment” to improve
clarity of the questions.
Research Question 2.10
Is there a statistically significant difference in the relative importance ascribed to
these major college choice factors, when the survey population was disaggregated by
students’ friends/peer influence?
One-way ANOVAs could not be conducted, because the condition of balanced
design was not met; over 95% of respondents answered that "all" of their close friends
were planning to attend college. This finding, together with the demographic finding that
91.2% of survey respondents aspired to attend college, indicate that this is a select,
elite student group. A counselor at AAA High School explained that, in general, parents
of these students have middle-to-high-level income, have the mindset of making money
in order to help in their children’s upbringing, and emphasize education. Moreover, AAA
High School itself puts much emphasis for students to continue on into higher
education. Similarly, McDonough (1997) found that U.S. “[s]eniors enrolled in private
high schools are significantly more likely than public school seniors to enter college and
enroll in four-year institutions, even when track, ability levels, aspirations, and SES are
controlled” (p. 7).
Additional Finding
When asked "Where do you plan to live when attending college?" some 91% of
respondents indicated that they planned to live at home. A guidance counselor at AAA
186
High School attributed this finding to Chinese parents’ protectiveness of their children,
as well as the conveniences of living at home.
Conclusions
Following are the conclusions of this study:
1. The major college choice factors in United States research appear to be
important to private high school students in the Philippines.
2. Two demographic college choice attributes—academic ability and
gender—appear to apply to private high school students in the Philippines, while the
attributes of father's and mother's education levels do not appear to apply.
3. Assessing how two demographic college choice attributes—
socioeconomic status and friends/peer influence—account for college choice is difficult
in private high schools in the Philippines.
4. Among high school students in private high schools in the Philippines,
academic ability may account for differences in assessment of the importance of college
choice factors.
5. Using a survey method alone to study college choice in private high
schools in the Philippines is limiting. Supplementing this with personal and group
interviews—of parents as well as of students—may yield more insights in this area.
Implications
Implications from the data for the recruitment of students from private high
schools in the Philippines by college administrators follow.
Although all of the major college choice factors surfaced in U.S. literature were
important in the Philippine context, students rated some factors higher than others. The
187
factors with the highest ratings were future job opportunities, programs of study,
academic quality, and religious emphasis. Thus, college administrators recruiting
students from private high schools should develop recruiting strategies and procedures
that would emphasize these factors. Possible actions include developing linkages with
corporations to provide opportunities for students to have internships during their
college years, starting a job placement office for alumni, hiring faculty with the highest
academic credentials, having mandatory daily/weekly chapels, and requiring more
religious courses. Also, regarding academic quality, it might be of value to publicize any
external accreditation or academic ranking of the institution. Moreover, having an alumni
office tracking the subsequent careers and/or educational attainments of alumni would
provide valuable information, which could be used in public relations for the institution.
Other college choice factors were added based on pilot studies, and deemed
important in this study. "Security" was the factor with the second highest importance
rating. Thus, school administrators should maintain a high level of security at the
institution.
The factor of "parents" was rated highest among the college choice factors linked
to people. Thus, school administrators should also target parents in advertising
endeavors. Possible actions include having focus groups to determine parents' college
concerns and then addressing those concerns, giving parents literature related to the
college, and providing family tours of the college campus.
Two U.S.-derived demographic college choice attributes—academic ability and
gender—appear to apply to private high school students in the Philippines.
188
In order to attract high-ability students, school administrators should enhance the
institution’s academic quality and program offerings, and emphasize its academic
quality and program offerings when marketing / advertising. Also, they should give
targeted communication (e.g. email, mail, appointments) regarding the high quality of
specific programs, if students’ desired field of study is known. Moreover, they should
understand that high-ability students probably submitted multiple college applications,
and offer very competitive financial aid packages.
In order to attract male students, school administrators should provide
information regarding tuition costs. To attract female students, school administrators
should highlight its academic offerings, and emphasize campus security, its friendly
student body, and available on- and off-campus religious organizations.
Recommendations
Following are several recommendations, based on the findings and conclusions
of this study.
1. Future studies should utilize a variety of methods to collect data, including
personal and group interviews, of parents as well as of students.
2. Future studies should also involve several schools (of various levels of
selectivity and exclusiveness). Using multiple data-collection methods and data
sources, then, would serve to check the validity of findings (i.e. data triangulation) (Gall,
Gall, & Borg, 2003, p. 464).
3. Future studies should verify student’s self-reported grade averages with
their actual scores.
189
4. Future studies should avoid two weaknesses of this survey instrument,
namely, weak race/ethnicity classification, and unclear religious emphasis question.
Personal Reflections on Conducting International Research
When conducting studies in another country, researchers should allow more time
for various deadlines, and understand that existing research in the foreign country may
be more difficult to access. Establishing contacts is key, and maintaining trust with the
people is vital. Researchers should not be afraid to ask basic questions, and not
assume that lifestyles are similar to one’s home country. Researchers should exercise
creativity in investigations, being willing to find alternative ways to answer the question
at hand, in case the traditional method is not effective.

190
APPENDIX A
INSTITUTIONAL REVIEW BOARD APPROVAL LETTER
191
192
APPENDIX B
INFORMED CONSENT AND STUDENT ASSENT FORMS
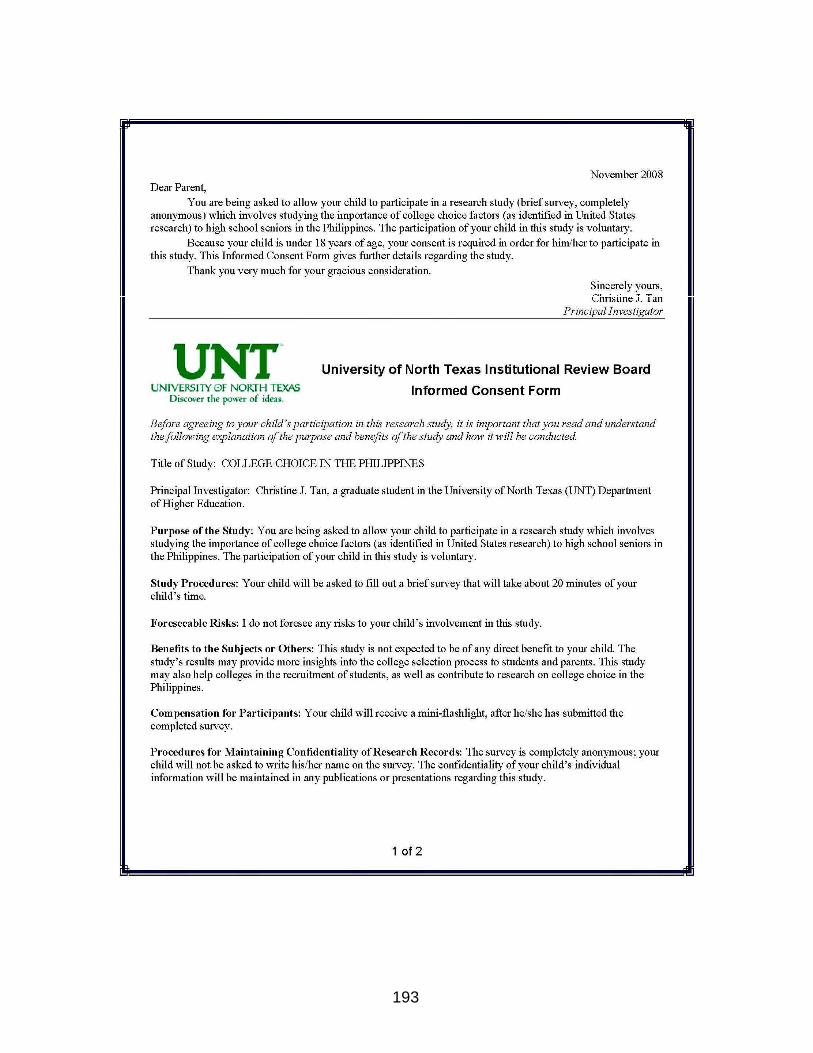
193
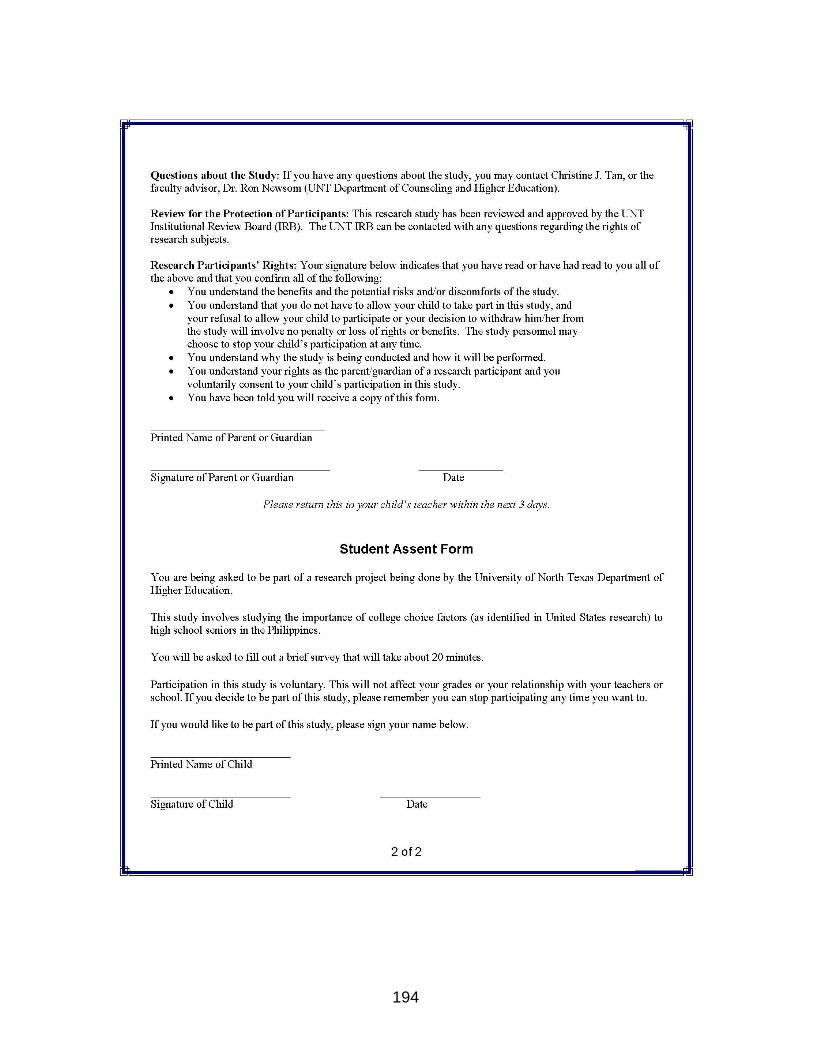
194

195
APPENDIX C
PILOT SURVEY EVALUATION FORM
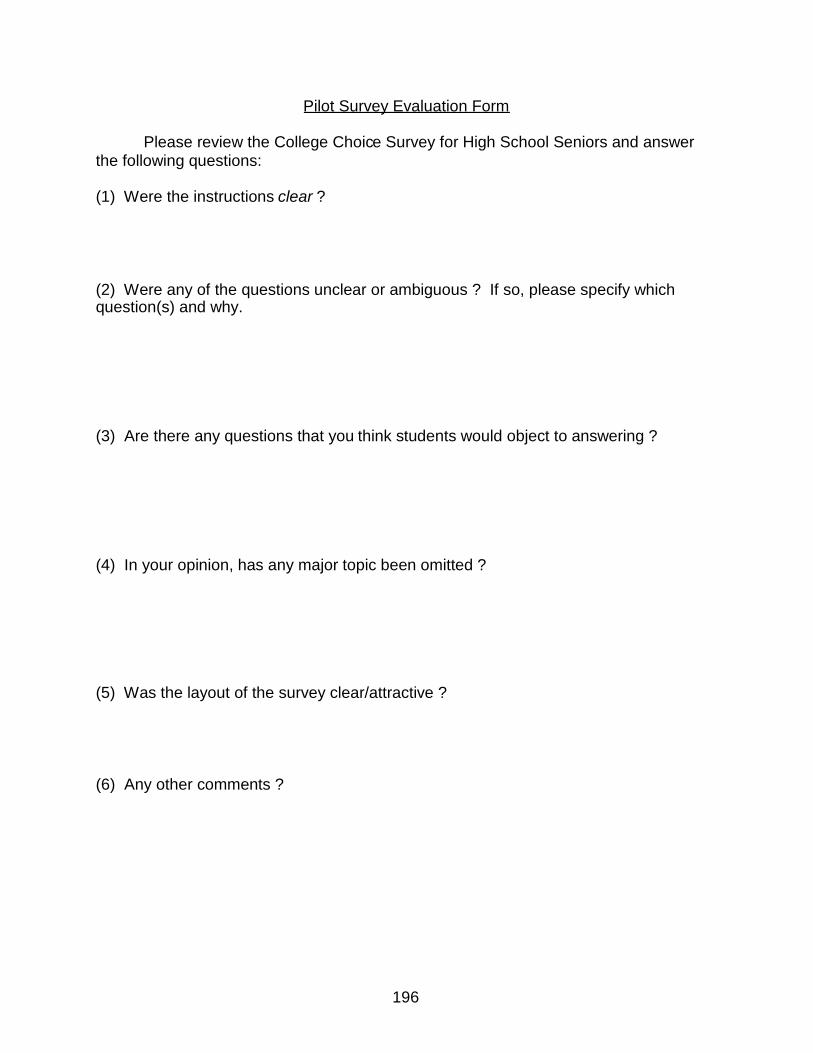
196
Pilot Survey Evaluation Form
Please review the College Choice Survey for High School Seniors and answerthe following questions:
(1) Were the instructions clear ?
(2) Were any of the questions unclear or ambiguous ? If so, please specify whichquestion(s) and why.
(3) Are there any questions that you think students would object to answering ?
(4) In your opinion, has any major topic been omitted ?
(5) Was the layout of the survey clear/attractive ?
(6) Any other comments ?

197
APPENDIX D
SURVEY INSTRUMENT
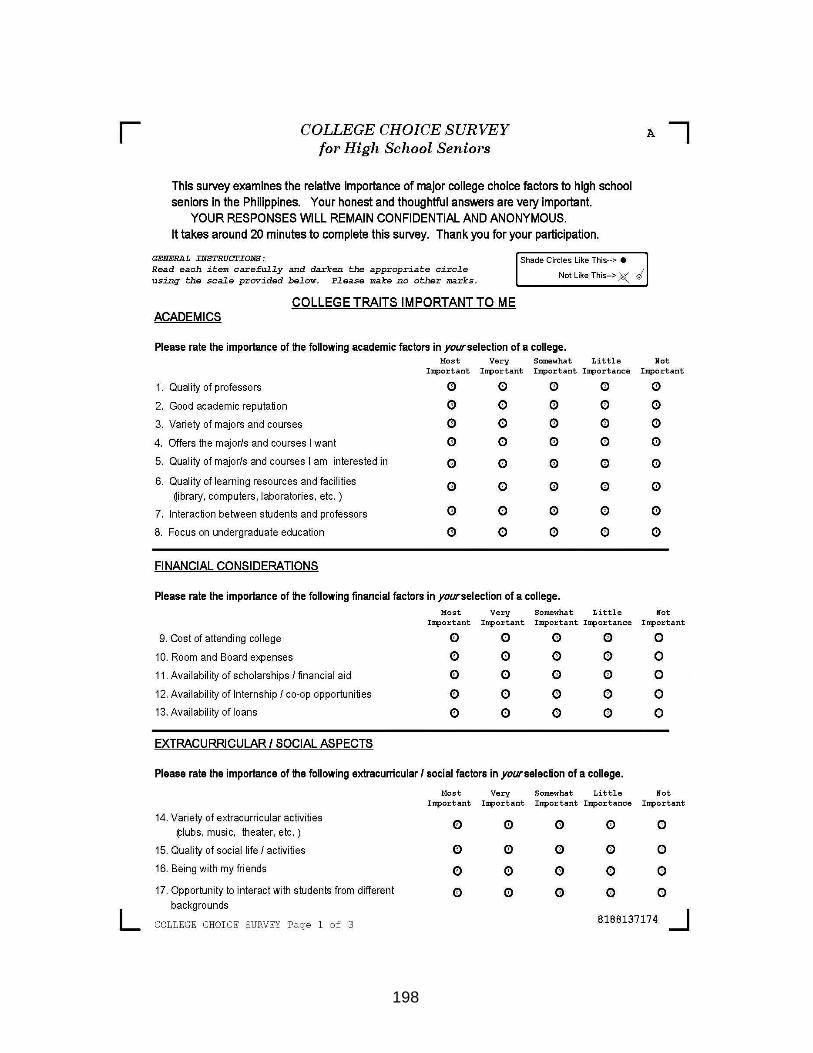
198
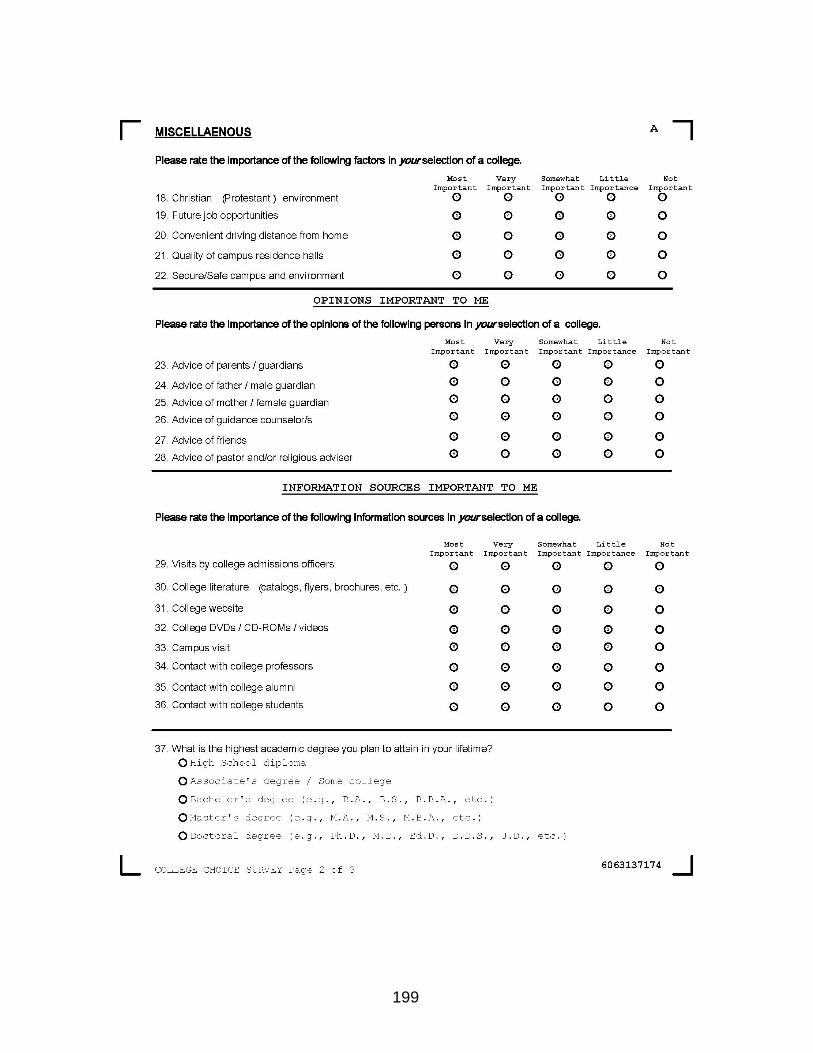
199
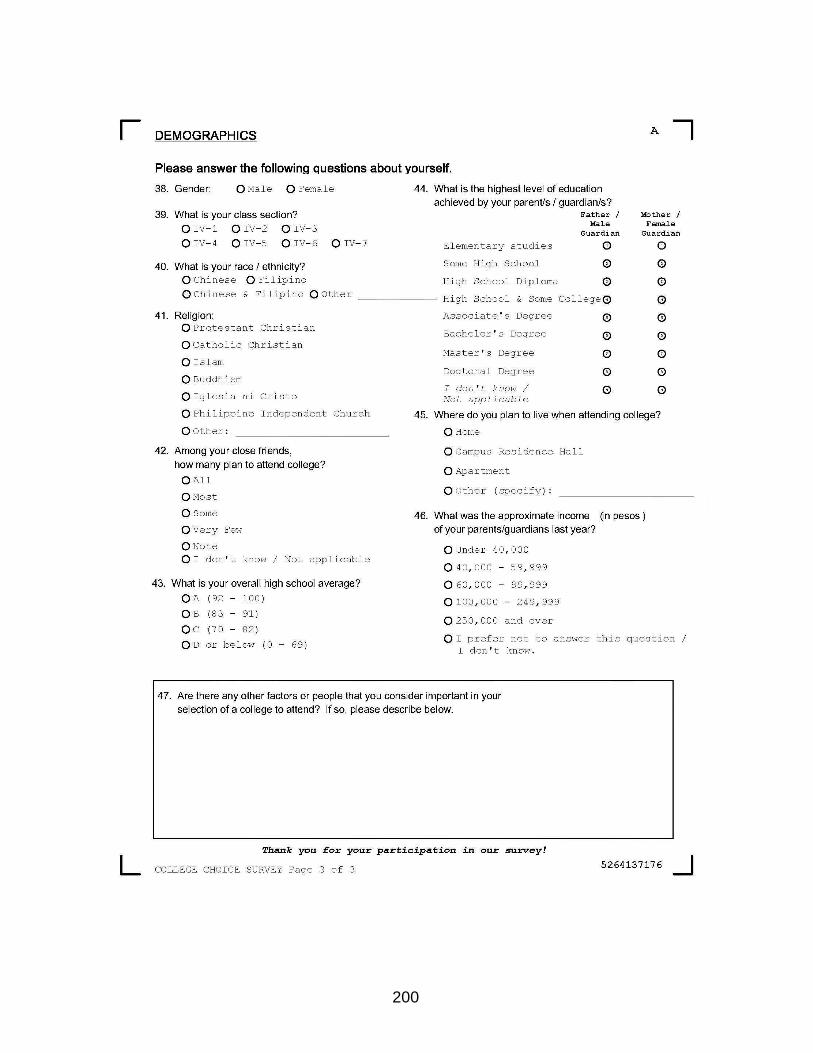
200

201
APPENDIX E
INFORMATION TABLES
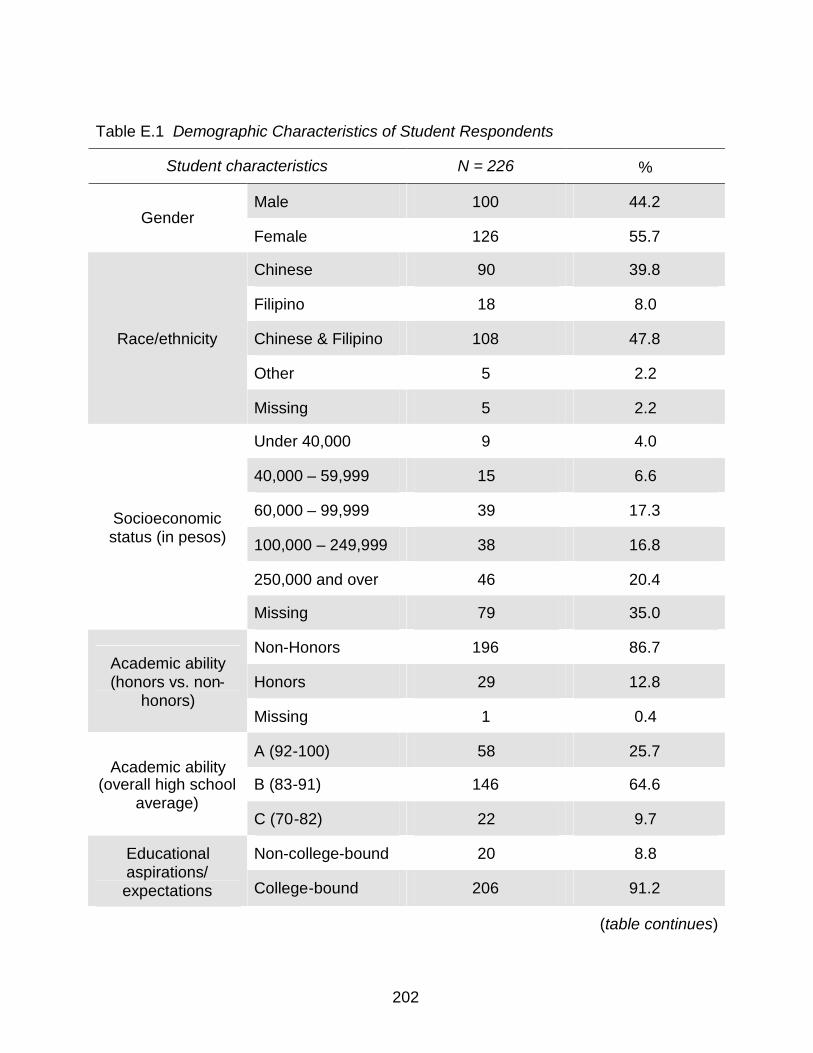
202
Table E.1 Demographic Characteristics of Student Respondents
Student characteristics N = 226 %
Male 100 44.2Gender
Female 126 55.7
Chinese 90 39.8
Filipino 18 8.0
Chinese & Filipino 108 47.8
Other 5 2.2
Race/ethnicity
Missing 5 2.2
Under 40,000 9 4.0
40,000 – 59,999 15 6.6
60,000 – 99,999 39 17.3
100,000 – 249,999 38 16.8
250,000 and over 46 20.4
Socioeconomicstatus (in pesos)
Missing 79 35.0
Non-Honors 196 86.7
Honors 29 12.8Academic ability(honors vs. non-
honors)Missing 1 0.4
A (92-100) 58 25.7
B (83-91) 146 64.6Academic ability
(overall high schoolaverage)
C (70-82) 22 9.7
Non-college-bound 20 8.8Educationalaspirations/expectations College-bound 206 91.2
(table continues)
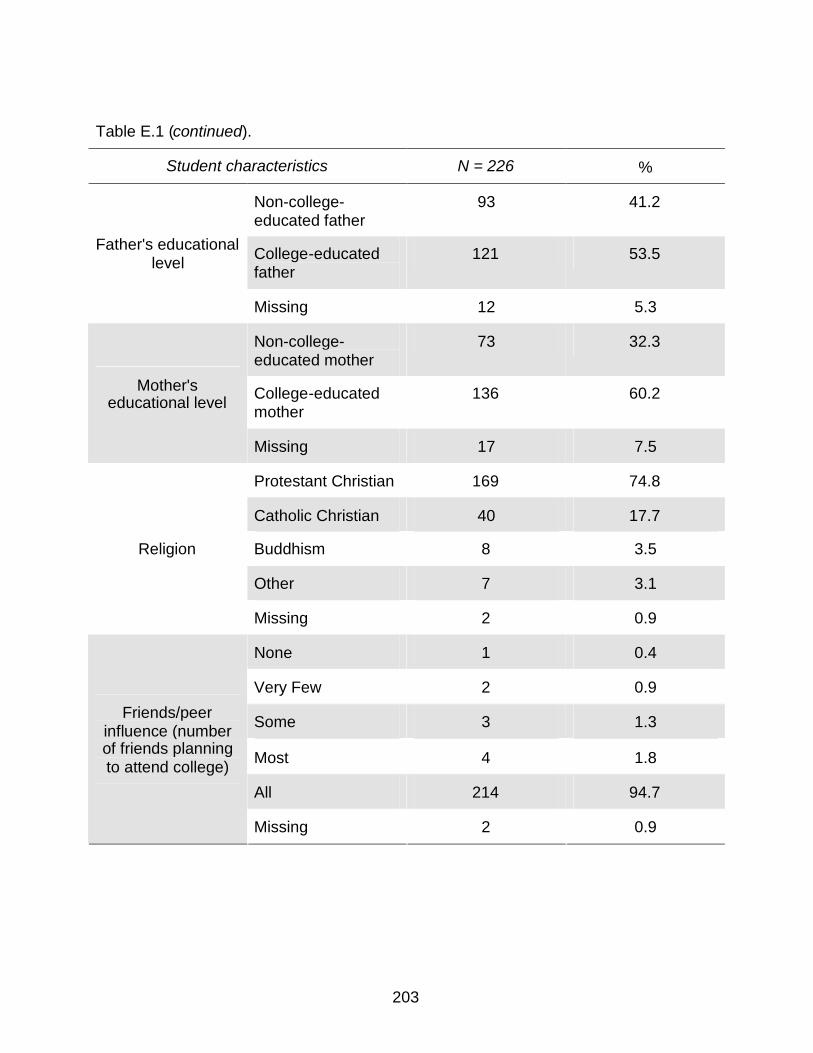
203
Table E.1 (continued).
Student characteristics N = 226 %
Non-college-educated father
93 41.2
College-educatedfather
121 53.5Father's educationallevel
Missing 12 5.3
Non-college-educated mother
73 32.3
College-educatedmother
136 60.2Mother'seducational level
Missing 17 7.5
Protestant Christian 169 74.8
Catholic Christian 40 17.7
Buddhism 8 3.5
Other 7 3.1
Religion
Missing 2 0.9
None 1 0.4
Very Few 2 0.9
Some 3 1.3
Most 4 1.8
All 214 94.7
Friends/peerinfluence (numberof friends planningto attend college)
Missing 2 0.9
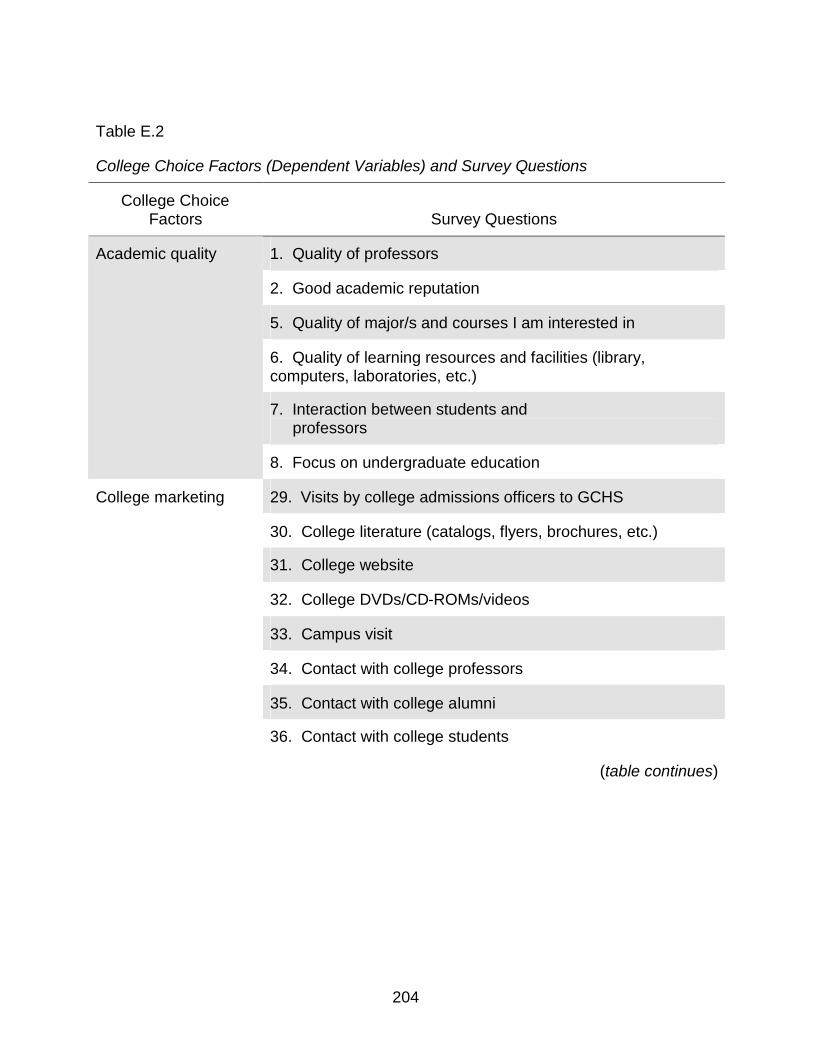
204
Table E.2
College Choice Factors (Dependent Variables) and Survey Questions
College ChoiceFactors Survey Questions
1. Quality of professors
2. Good academic reputation
5. Quality of major/s and courses I am interested in
6. Quality of learning resources and facilities (library,computers, laboratories, etc.)
7. Interaction between students andprofessors
Academic quality
8. Focus on undergraduate education
29. Visits by college admissions officers to GCHS
30. College literature (catalogs, flyers, brochures, etc.)
31. College website
32. College DVDs/CD-ROMs/videos
33. Campus visit
34. Contact with college professors
35. Contact with college alumni
College marketing
36. Contact with college students
(table continues)
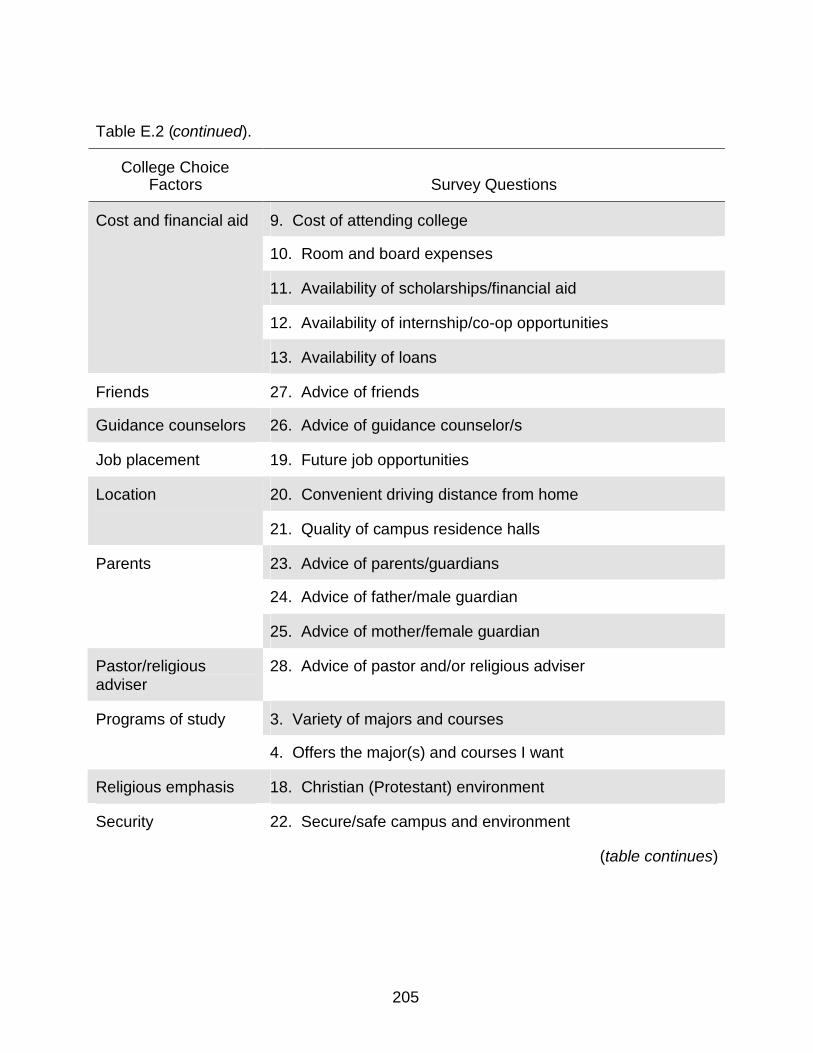
205
Table E.2 (continued).
College ChoiceFactors Survey Questions
9. Cost of attending college
10. Room and board expenses
11. Availability of scholarships/financial aid
12. Availability of internship/co-op opportunities
Cost and financial aid
13. Availability of loans
Friends 27. Advice of friends
Guidance counselors 26. Advice of guidance counselor/s
Job placement 19. Future job opportunities
20. Convenient driving distance from homeLocation
21. Quality of campus residence halls
23. Advice of parents/guardians
24. Advice of father/male guardian
Parents
25. Advice of mother/female guardian
Pastor/religiousadviser
28. Advice of pastor and/or religious adviser
3. Variety of majors and coursesPrograms of study
4. Offers the major(s) and courses I want
Religious emphasis 18. Christian (Protestant) environment
Security 22. Secure/safe campus and environment
(table continues)
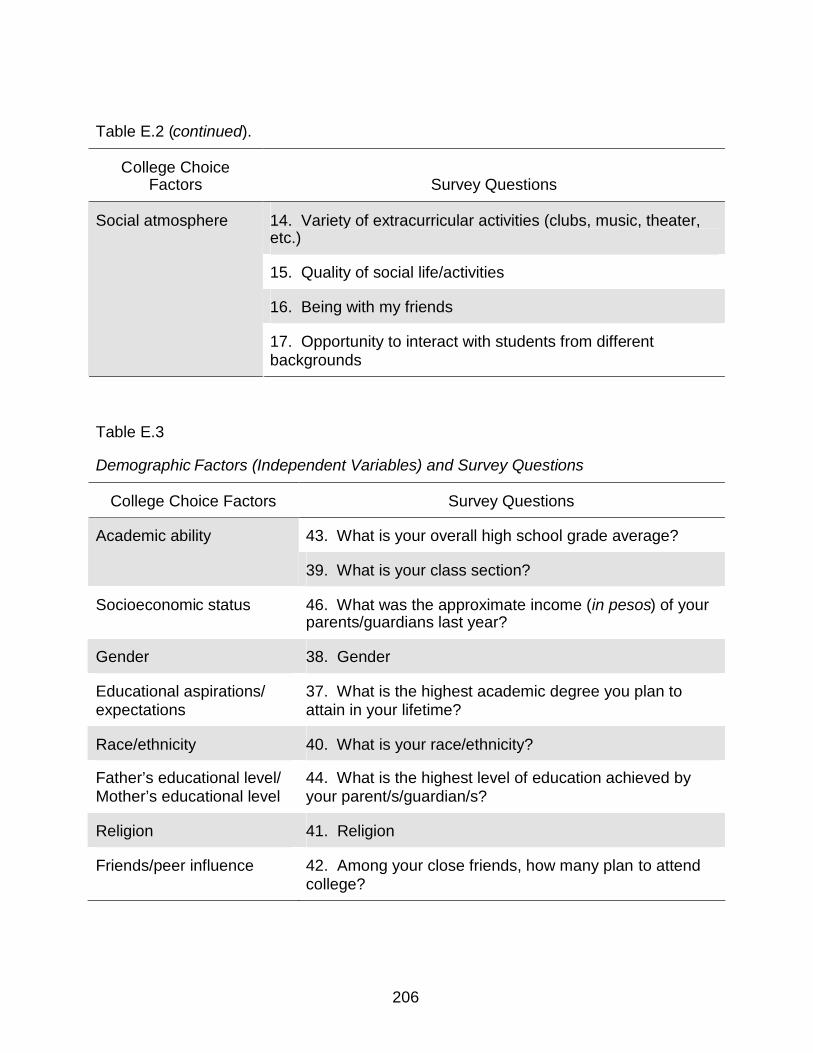
206
Table E.2 (continued).
College ChoiceFactors Survey Questions
14. Variety of extracurricular activities (clubs, music, theater,etc.)
15. Quality of social life/activities
16. Being with my friends
Social atmosphere
17. Opportunity to interact with students from differentbackgrounds
Table E.3
Demographic Factors (Independent Variables) and Survey Questions
College Choice Factors Survey Questions
43. What is your overall high school grade average?Academic ability
39. What is your class section?
Socioeconomic status 46. What was the approximate income (in pesos) of yourparents/guardians last year?
Gender 38. Gender
Educational aspirations/expectations
37. What is the highest academic degree you plan toattain in your lifetime?
Race/ethnicity 40. What is your race/ethnicity?
Father’s educational level/Mother’s educational level
44. What is the highest level of education achieved byyour parent/s/guardian/s?
Religion 41. Religion
Friends/peer influence 42. Among your close friends, how many plan to attendcollege?
207
APPENDIX F
STUDENT CHARACTERISTICS AND INSTITUTIONAL PRACTICE
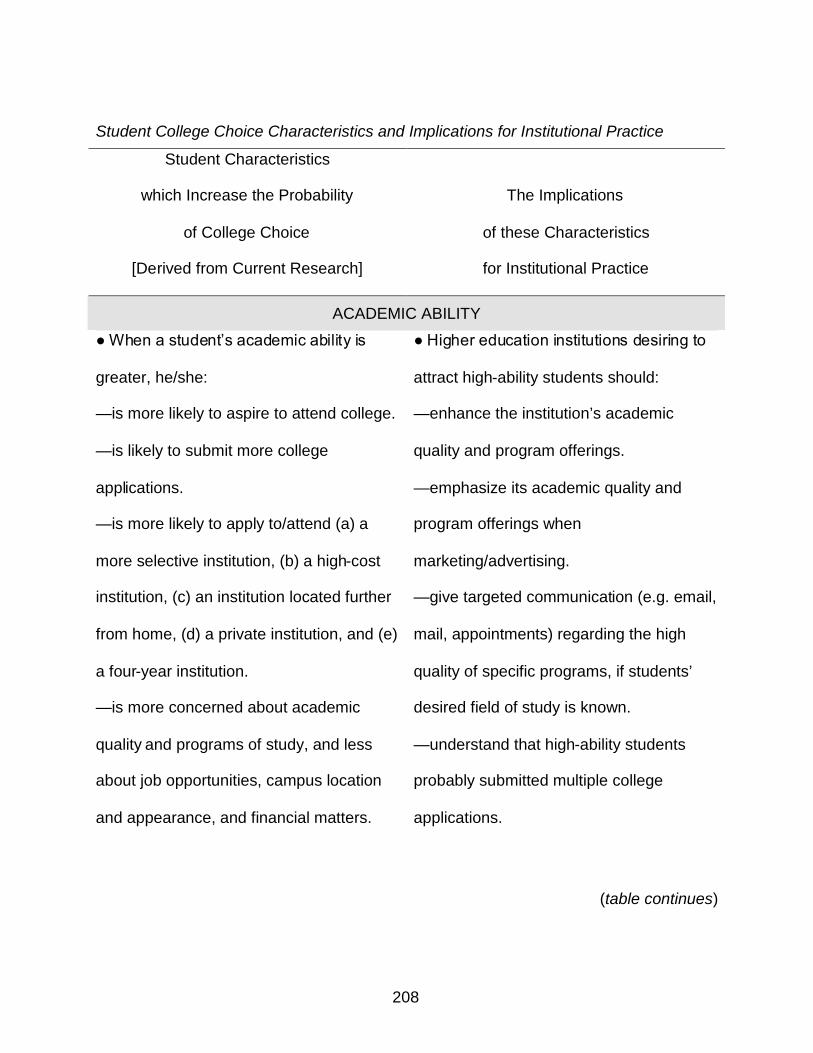
208
Student College Choice Characteristics and Implications for Institutional Practice
Student Characteristics
which Increase the Probability
of College Choice
[Derived from Current Research]
The Implications
of these Characteristics
for Institutional Practice
ACADEMIC ABILITY
● When a student’s academic ability is
greater, he/she:
—is more likely to aspire to attend college.
—is likely to submit more college
applications.
—is more likely to apply to/attend (a) a
more selective institution, (b) a high-cost
institution, (c) an institution located further
from home, (d) a private institution, and (e)
a four-year institution.
—is more concerned about academic
quality and programs of study, and less
about job opportunities, campus location
and appearance, and financial matters.
● Higher education institutions desiring to
attract high-ability students should:
—enhance the institution’s academic
quality and program offerings.
—emphasize its academic quality and
program offerings when
marketing/advertising.
—give targeted communication (e.g. email,
mail, appointments) regarding the high
quality of specific programs, if students’
desired field of study is known.
—understand that high-ability students
probably submitted multiple college
applications.
(table continues)
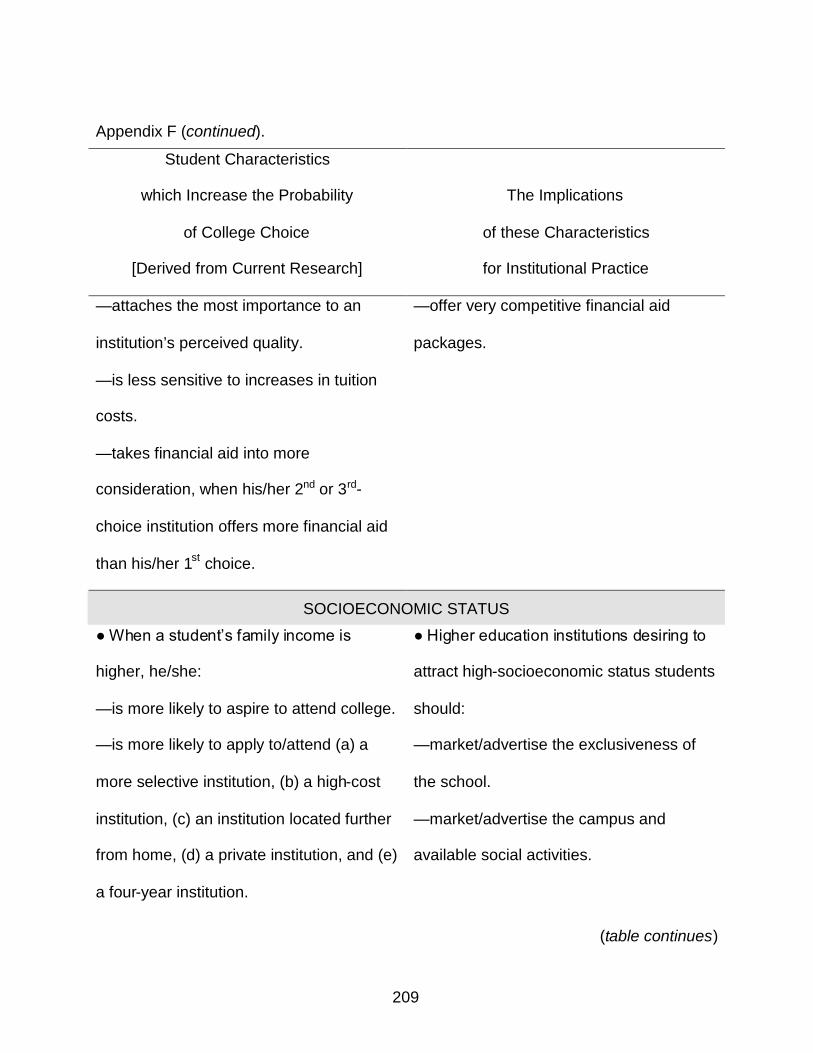
209
Appendix F (continued).
Student Characteristics
which Increase the Probability
of College Choice
[Derived from Current Research]
The Implications
of these Characteristics
for Institutional Practice
—attaches the most importance to an
institution’s perceived quality.
—is less sensitive to increases in tuition
costs.
—takes financial aid into more
consideration, when his/her 2nd or 3rd-
choice institution offers more financial aid
than his/her 1st choice.
—offer very competitive financial aid
packages.
SOCIOECONOMIC STATUS
● When a student’s family income is
higher, he/she:
—is more likely to aspire to attend college.
—is more likely to apply to/attend (a) a
more selective institution, (b) a high-cost
institution, (c) an institution located further
from home, (d) a private institution, and (e)
a four-year institution.
● Higher education institutions desiring to
attract high-socioeconomic status students
should:
—market/advertise the exclusiveness of
the school.
—market/advertise the campus and
available social activities.
(table continues)
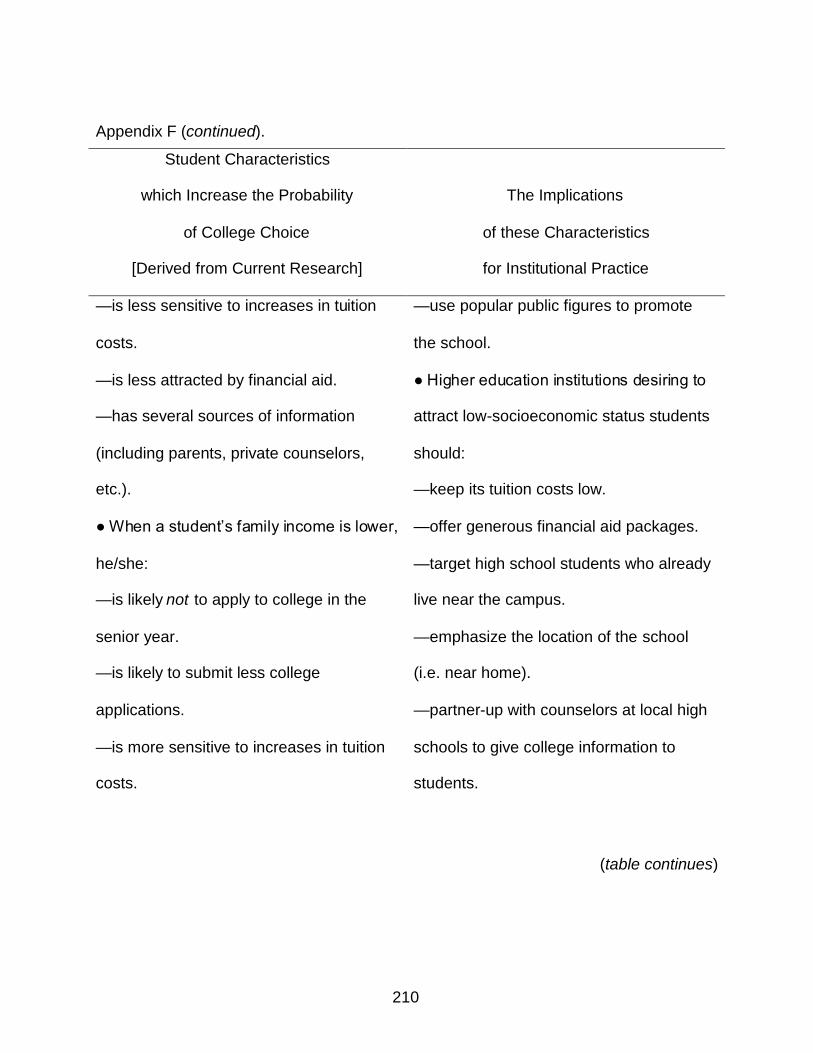
210
Appendix F (continued).
Student Characteristics
which Increase the Probability
of College Choice
[Derived from Current Research]
The Implications
of these Characteristics
for Institutional Practice
—is less sensitive to increases in tuition
costs.
—is less attracted by financial aid.
—has several sources of information
(including parents, private counselors,
etc.).
● When a student’s family income is lower,
he/she:
—is likely not to apply to college in the
senior year.
—is likely to submit less college
applications.
—is more sensitive to increases in tuition
costs.
—use popular public figures to promote
the school.
● Higher education institutions desiring to
attract low-socioeconomic status students
should:
—keep its tuition costs low.
—offer generous financial aid packages.
—target high school students who already
live near the campus.
—emphasize the location of the school
(i.e. near home).
—partner-up with counselors at local high
schools to give college information to
students.
(table continues)
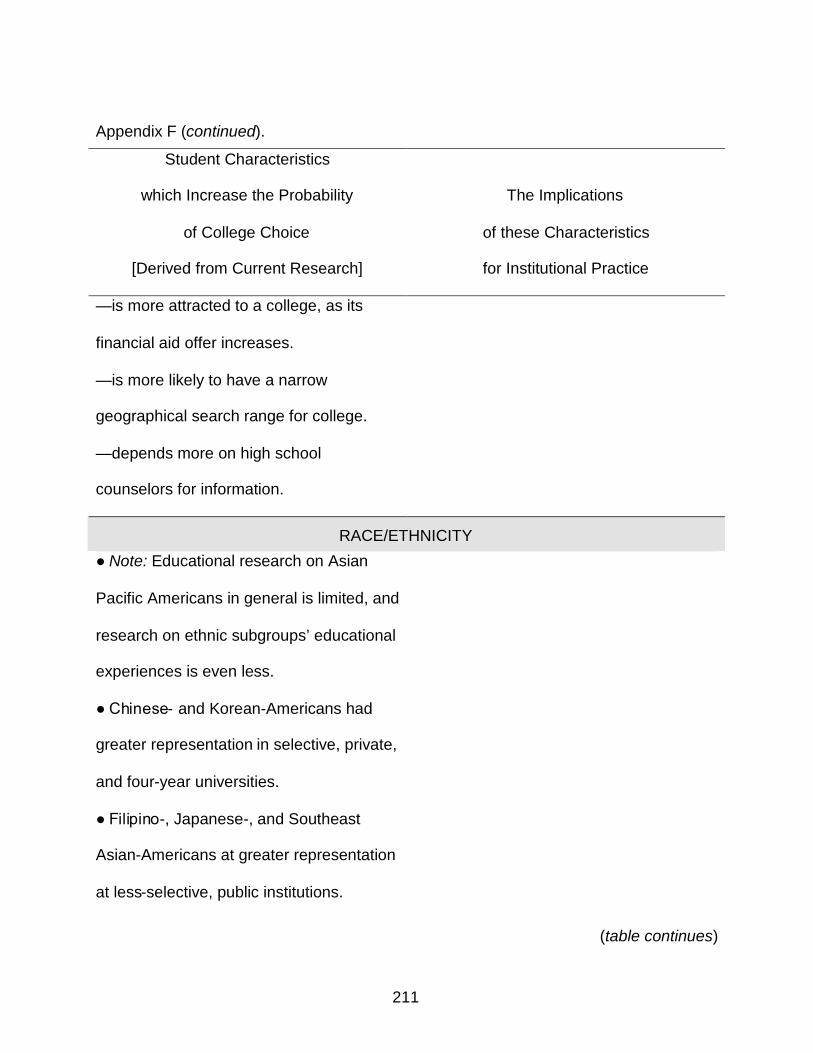
211
Appendix F (continued).
Student Characteristics
which Increase the Probability
of College Choice
[Derived from Current Research]
The Implications
of these Characteristics
for Institutional Practice
—is more attracted to a college, as its
financial aid offer increases.
—is more likely to have a narrow
geographical search range for college.
—depends more on high school
counselors for information.
RACE/ETHNICITY
● Note: Educational research on Asian
Pacific Americans in general is limited, and
research on ethnic subgroups’ educational
experiences is even less.
● Chinese- and Korean-Americans had
greater representation in selective, private,
and four-year universities.
● Filipino-, Japanese-, and Southeast
Asian-Americans at greater representation
at less-selective, public institutions.
(table continues)
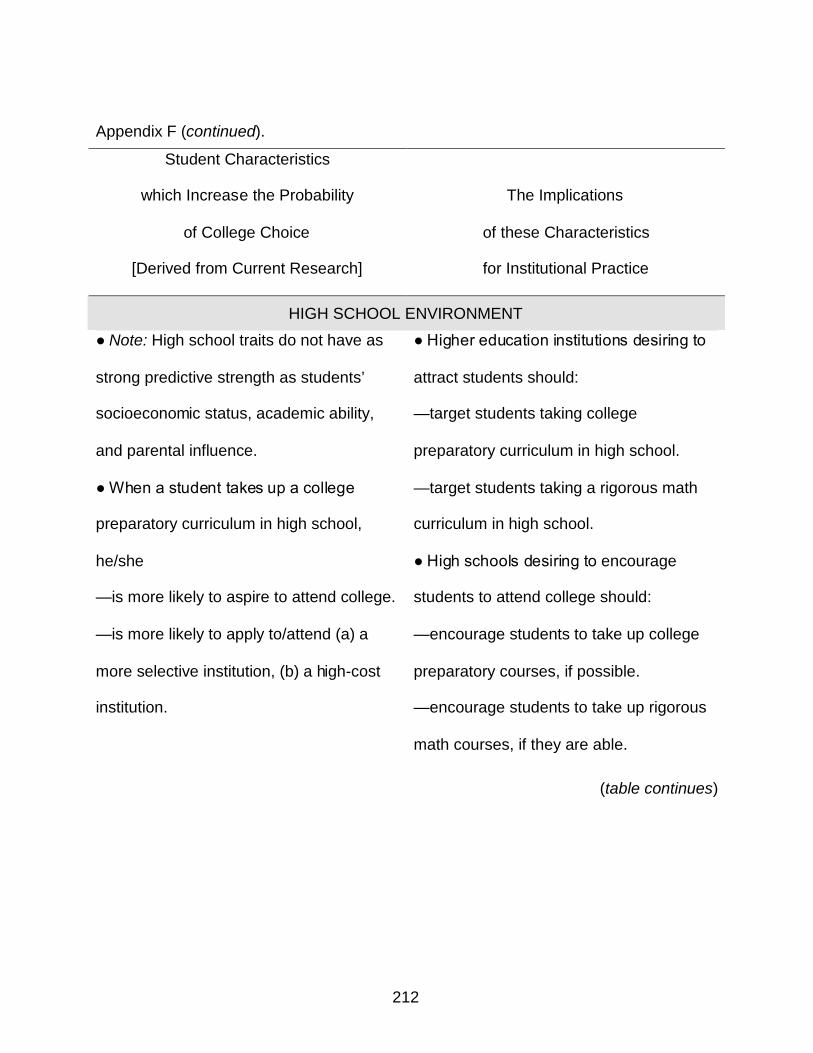
212
Appendix F (continued).
Student Characteristics
which Increase the Probability
of College Choice
[Derived from Current Research]
The Implications
of these Characteristics
for Institutional Practice
HIGH SCHOOL ENVIRONMENT
● Note: High school traits do not have as
strong predictive strength as students’
socioeconomic status, academic ability,
and parental influence.
● When a student takes up a college
preparatory curriculum in high school,
he/she
—is more likely to aspire to attend college.
—is more likely to apply to/attend (a) a
more selective institution, (b) a high-cost
institution.
● Higher education institutions desiring to
attract students should:
—target students taking college
preparatory curriculum in high school.
—target students taking a rigorous math
curriculum in high school.
● High schools desiring to encourage
students to attend college should:
—encourage students to take up college
preparatory courses, if possible.
—encourage students to take up rigorous
math courses, if they are able.
(table continues)
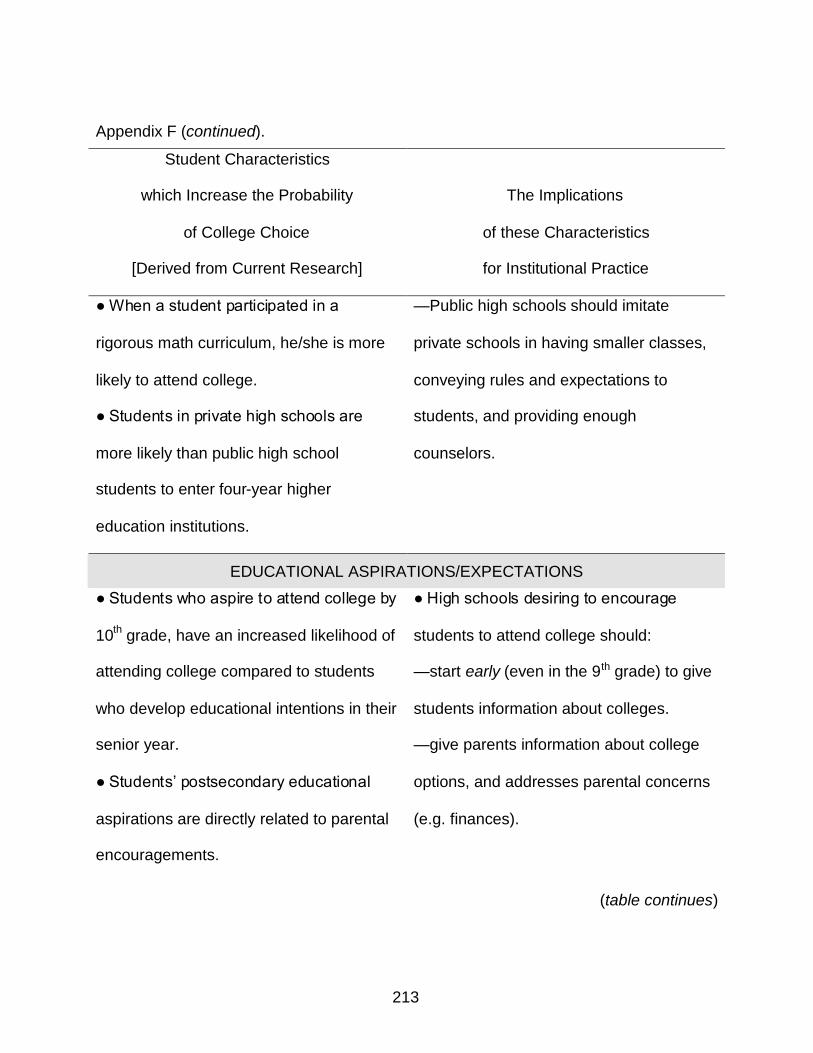
213
Appendix F (continued).
Student Characteristics
which Increase the Probability
of College Choice
[Derived from Current Research]
The Implications
of these Characteristics
for Institutional Practice
● When a student participated in a
rigorous math curriculum, he/she is more
likely to attend college.
● Students in private high schools are
more likely than public high school
students to enter four-year higher
education institutions.
—Public high schools should imitate
private schools in having smaller classes,
conveying rules and expectations to
students, and providing enough
counselors.
EDUCATIONAL ASPIRATIONS/EXPECTATIONS
● Students who aspire to attend college by
10th grade, have an increased likelihood of
attending college compared to students
who develop educational intentions in their
senior year.
● Students’ postsecondary educational
aspirations are directly related to parental
encouragements.
● High schools desiring to encourage
students to attend college should:
—start early (even in the 9th grade) to give
students information about colleges.
—give parents information about college
options, and addresses parental concerns
(e.g. finances).
(table continues)
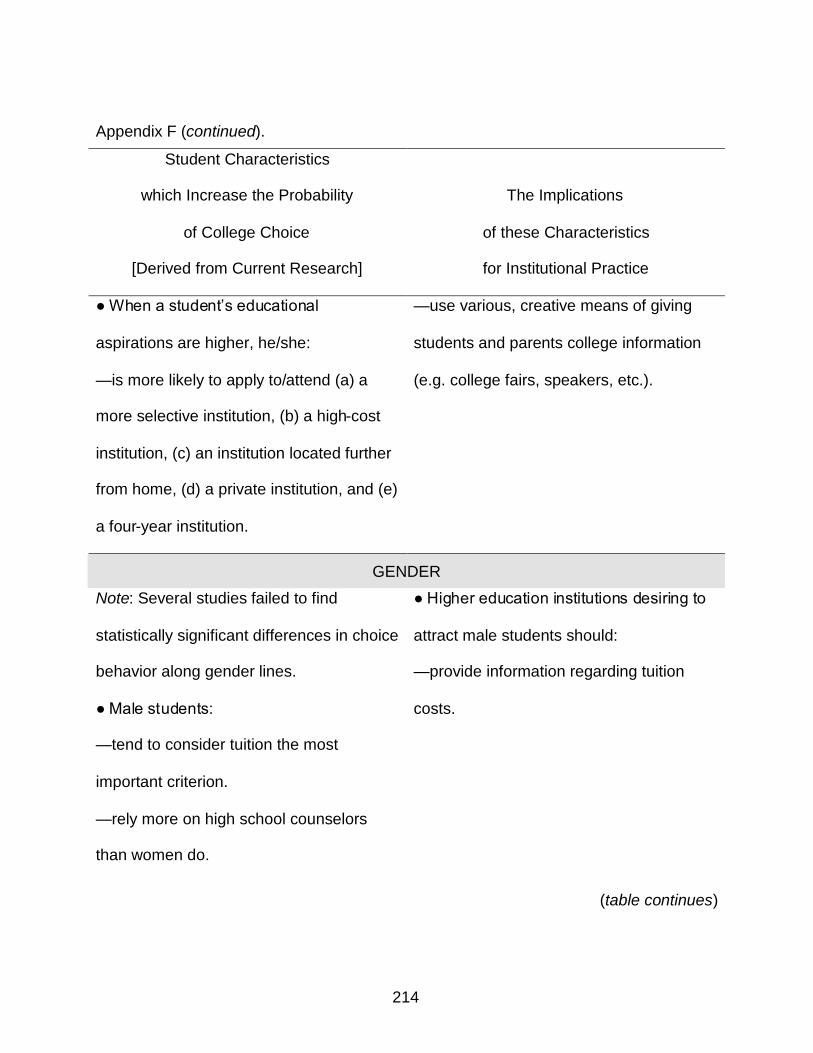
214
Appendix F (continued).
Student Characteristics
which Increase the Probability
of College Choice
[Derived from Current Research]
The Implications
of these Characteristics
for Institutional Practice
● When a student’s educational
aspirations are higher, he/she:
—is more likely to apply to/attend (a) a
more selective institution, (b) a high-cost
institution, (c) an institution located further
from home, (d) a private institution, and (e)
a four-year institution.
—use various, creative means of giving
students and parents college information
(e.g. college fairs, speakers, etc.).
GENDER
Note: Several studies failed to find
statistically significant differences in choice
behavior along gender lines.
● Male students:
—tend to consider tuition the most
important criterion.
—rely more on high school counselors
than women do.
● Higher education institutions desiring to
attract male students should:
—provide information regarding tuition
costs.
(table continues)
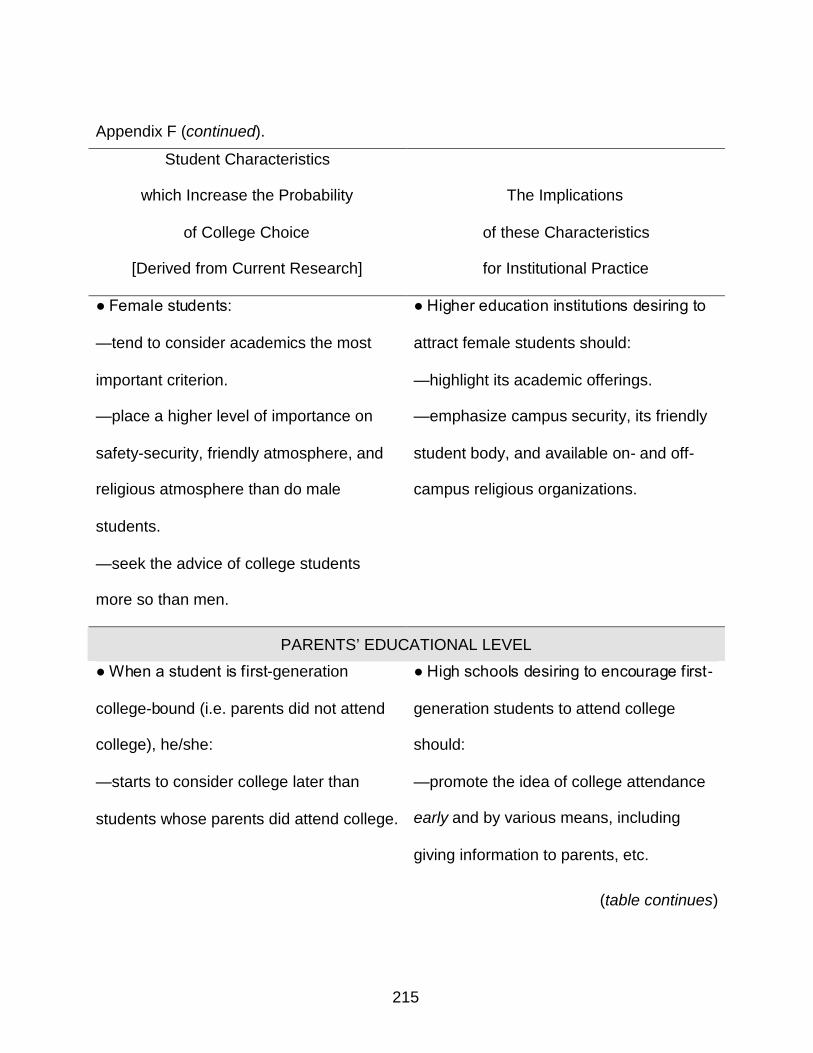
215
Appendix F (continued).
Student Characteristics
which Increase the Probability
of College Choice
[Derived from Current Research]
The Implications
of these Characteristics
for Institutional Practice
● Female students:
—tend to consider academics the most
important criterion.
—place a higher level of importance on
safety-security, friendly atmosphere, and
religious atmosphere than do male
students.
—seek the advice of college students
more so than men.
● Higher education institutions desiring to
attract female students should:
—highlight its academic offerings.
—emphasize campus security, its friendly
student body, and available on- and off-
campus religious organizations.
PARENTS’ EDUCATIONAL LEVEL
● When a student is first-generation
college-bound (i.e. parents did not attend
college), he/she:
—starts to consider college later than
students whose parents did attend college.
● High schools desiring to encourage first-
generation students to attend college
should:
—promote the idea of college attendance
early and by various means, including
giving information to parents, etc.
(table continues)
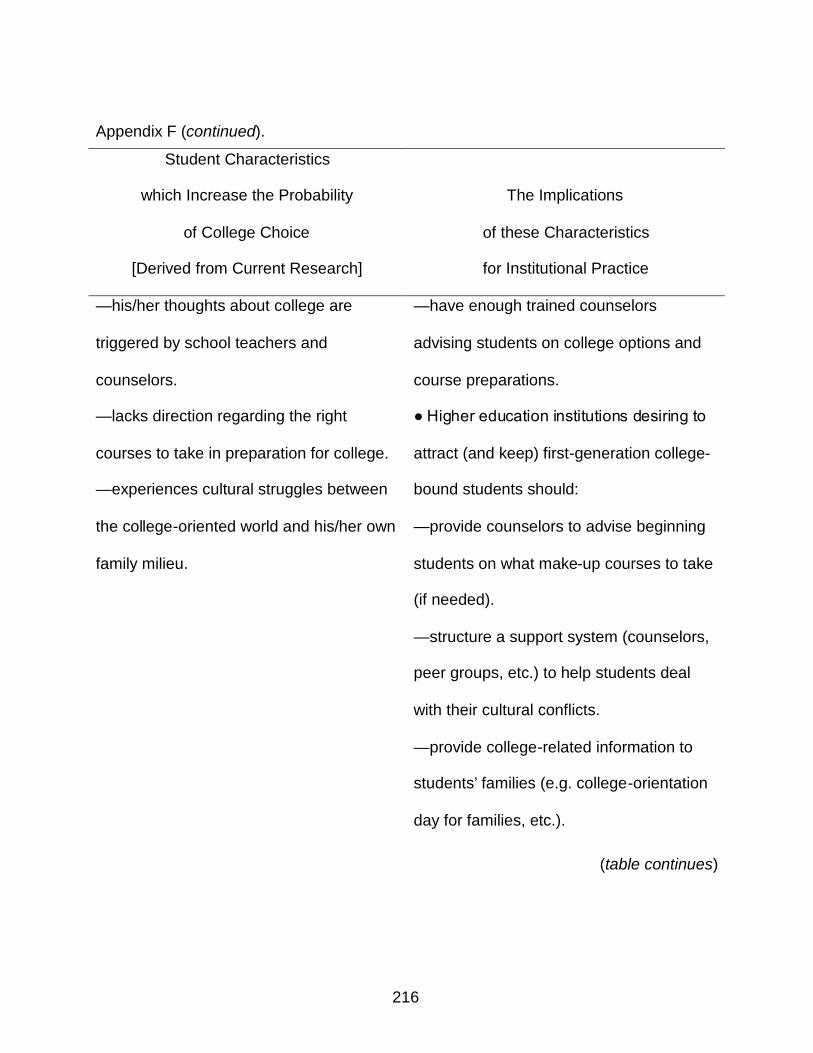
216
Appendix F (continued).
Student Characteristics
which Increase the Probability
of College Choice
[Derived from Current Research]
The Implications
of these Characteristics
for Institutional Practice
—his/her thoughts about college are
triggered by school teachers and
counselors.
—lacks direction regarding the right
courses to take in preparation for college.
—experiences cultural struggles between
the college-oriented world and his/her own
family milieu.
—have enough trained counselors
advising students on college options and
course preparations.
● Higher education institutions desiring to
attract (and keep) first-generation college-
bound students should:
—provide counselors to advise beginning
students on what make-up courses to take
(if needed).
—structure a support system (counselors,
peer groups, etc.) to help students deal
with their cultural conflicts.
—provide college-related information to
students’ families (e.g. college-orientation
day for families, etc.).
(table continues)
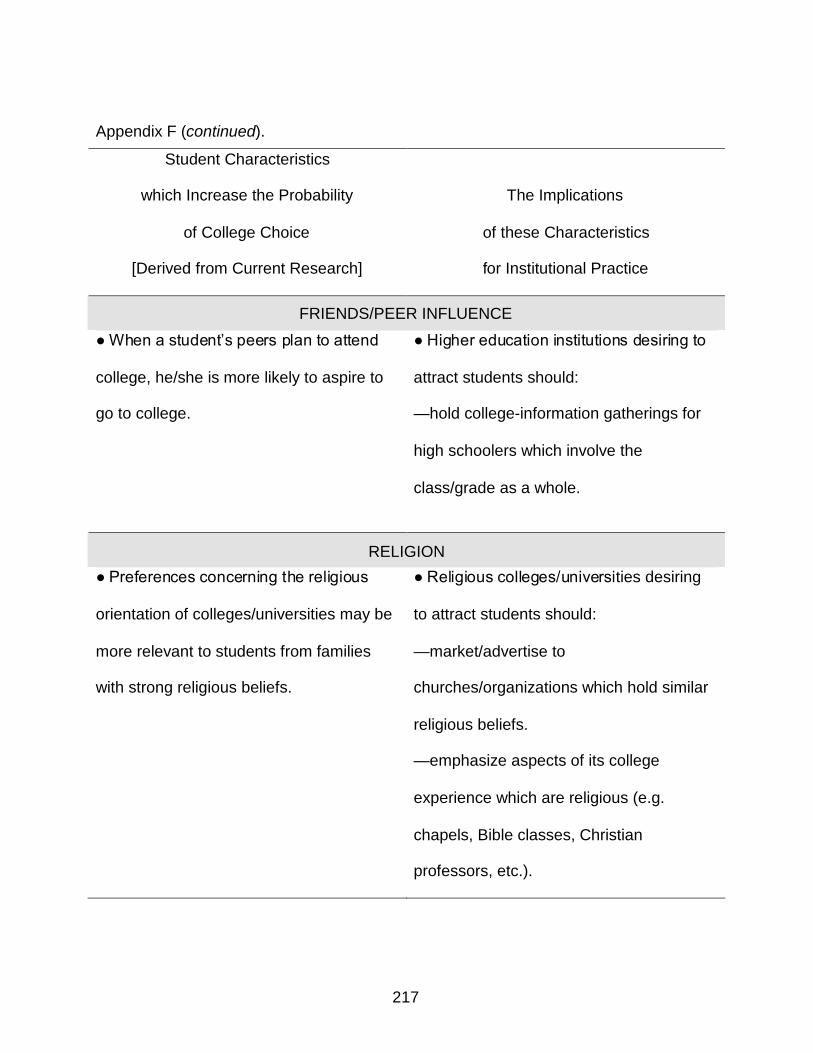
217
Appendix F (continued).
Student Characteristics
which Increase the Probability
of College Choice
[Derived from Current Research]
The Implications
of these Characteristics
for Institutional Practice
FRIENDS/PEER INFLUENCE
● When a student’s peers plan to attend
college, he/she is more likely to aspire to
go to college.
● Higher education institutions desiring to
attract students should:
—hold college-information gatherings for
high schoolers which involve the
class/grade as a whole.
RELIGION
● Preferences concerning the religious
orientation of colleges/universities may be
more relevant to students from families
with strong religious beliefs.
● Religious colleges/universities desiring
to attract students should:
—market/advertise to
churches/organizations which hold similar
religious beliefs.
—emphasize aspects of its college
experience which are religious (e.g.
chapels, Bible classes, Christian
professors, etc.).
218
REFERENCES
Absher, K., & Crawford, G. (1996). Marketing the community college starts withunderstanding students' perspectives. Community College Review, 23(4), 59-68.
Anderson, P. (1999). Factors influencing student choice in higher education.Perspectives, 3(4), 128-131.
Ateneo de Manila University: Undergraduate program admission: Latest updates.(2008). Retrieved September 16, 2008, fromhttp://www.admu.edu.ph/index.php?p=1622.
Avery, C., & Hoxby, C. M. (2004). Do and should financial aid packages affect students'college choices? In C. M. Hoxby (Ed.), College choices: The economics of whereto go, when to go, and how to pay for it (A National Bureau of EconomicResearch Conference Report) (pp. 239-301). Chicago: University of ChicagoPress.
Babbie, E. (1995). The practice of social research (7th ed.). New York: WadsworthPublishing Company.
Bell, J. (2005). Doing your research project: A guide for first-time researchers ineducation, health and social science. New York: Open University Press.
Berkner, L., Choy, S., & Hunt-White, T. (2008). Descriptive summary of 2003-04Beginning Postsecondary Students: Three years later (NCES 2008-174).Washington, DC: National Center for Education Statistics, Institute of EducationSciences.
Bers, T. H., & Galowich, P. M. (2002). Using survey and focus group research to learnabout parents' roles in the community college choice process. CommunityCollege Review, 29(4), 67-82.
Boyer, E. L. (1987). College: The undergraduate experience in America. New York:Harper & Row.
Braxton, J. M. (1990). How students choose colleges. In D. Hossler, J. P. Bean &Associates (Eds.), The strategic management of college enrollments (pp. 57-67).San Francisco: Jossey-Bass Publishers.
Broekemier, G. M. (2002). A comparison of two-year and four-year adult students:Motivations to attend college and the importance of choice criteria. Journal ofMarketing for Higher Education, 12(1), 31-48.
Brooks, R. (2005). Friendship and educational choice: Peer influence and planning forthe future. New York: Palgrave Macmillan.
219
Brown, S. (2008). Measures of shape: Skewness and kurtosis, Retrieved February 3,2009, from http://www.tc3.edu/instruct/sbrown/stat/shape.htm.
Cabrera, A. F., & Nasa, S. M. L. (2000). Understanding the college-choice process. InA. F. Cabrera & S. M. L. Nasa (Eds.), Understanding the college choice ofdisadvantaged students (pp. 5-22). San Francisco: Jossey-Bass Publishers.
Campaigne, D. A., & Hossler, D. (1998). How do loans affect the educational decisionsof students?: Access, aspirations, college choice, and persistence. In R. Fossey& M. Bateman (Eds.), Condemning students to debt: College loans and publicpolicy (pp. 85-104). New York: Teachers College Press.
Canale, J. R., & Dunlap, L. (1996). The relative importance of various collegecharacteristics to students in influencing their choice of a college. CollegeStudent Journal, 30(2), 214.
Canterbury, R. M. (1999). Higher education marketing: A challenge. Journal of CollegeAdmission, 165, 22-30.
Capraro, A. J., Patrick, M. L., & Wilson, M. (2004). Attracting college candidates: Theimpact of perceived social life. Journal of Marketing for Higher Education, 14(1),93-106.
Cheng, B. (2006). Editor's Review [Review of the book College choices: The economicsof where to go, when to go, and how to pay for if]. Harvard Educational Review,76(1), 110-119.
Choy, S. P., Horn, L. J., Nuñez, A.-M., & Chen, X. (2000). Transition to college: Whathelps at-risk students and students whose parents did not attend college. In A. F.Cabrera & S. M. L. Nasa (Eds.), Understanding the college choice ofdisadvantaged students (pp. 45-64). San Francisco: Jossey-Bass.
Clark-Carter, D. (1997). Doing quantitative psychological research: From design toreport: East Sussex, UK: Psychology Press.
Cobb, G. W. (1998). Introduction to design and analysis of experiments. Springer-Verlag, NY: Key College Publishing.
Cohen, J. (1988). Statistical power analysis for the behavioral sciences (2nd ed.).Hillsdale, NJ: Lawrence Erlbaum Associates.
College Board. (2008). Admitted Student Questionnaire and Admitted StudentQuestionnaire Plus Sample Questionnaires. Retrieved May 27, 2008, fromhttp://professionals.collegeboard.com/profdownload/asq-and-plus-sample-questionnaires.pdf.
Commission on Higher Education: Higher education system. (2008). RetrievedSeptember 1, 2008, from http://www.ched.gov.ph/hes/index.html.
220
Commission on Higher Education: Statistics: Accreditation of higher educationprograms. (2008). Retrieved September 1, 2008, fromhttp://www.ched.gov.ph/statistics/accreditation.of.higher.education.programs.html
Concepcion, C. R. (1973). Factors which influence students to enroll at Baguio CollegesFoundation. Unpublished master's thesis, Baguio Colleges Foundation, BaguioCity, Philippines.
Datuharon-Yahya, A. T. (1989). Factors affecting the MSU Muslim High Schoolgraduates' choice of the Mindanao State University, or of the other institutions ofhigher learning. Unpublished doctoral dissertation, University of the Philippines,1989.
Dawes, P. L., & Brown, J. (2002). Determinants of awareness, consideration, andchoice set size in university choice. Journal of Marketing for Higher Education,12(1), 49-75.
Dawes, P. L., & Brown, J. (2004). The composition of consideration and choice sets inundergraduate university choice: An exploratory study. Journal of Marketing forHigher Education, 14(2), 37-59.
De La Salle University Manila: Applications/entrance exams timetable. (2008).Retrieved September 16, 2008, fromhttp://www.dlsu.edu.ph/admissions/cad/timetable.asp.
Dizon, R. R. (in press). Higher education during the Arroyo presidency andadministration (2001-2004). Pasig City, Philippines: Commission on HigherEducation.
Endo, J. J. (1990). Assessing the educational performance of minority students: Thecase of Asian and Pacific Americans. In M. T. Nettles (Ed.), The effect ofassessment on minority student participation (pp. 37-52). San Francisco: Jossey-Bass.
Espinoza, S. (2001). College decision-making of enrolling undergraduates: Theinfluence of institutional factors. (Doctoral dissertation, University of Utah, 2001).Dissertation Abstracts International, 62/11, 3636.
Field, A. (2000). Discovering statistics using SPSS for windows: Advanced techniquesfor the beginner. London: SAGE Publications.
Fuller, W. C., Manski, C. F., & Wise, D. A. (1983). Selecting a postsecondary school. InC. F. Manski & D. A. Wise (Eds.), College choice in America (pp. 105-117).Cambridge, MA: Harvard University Press.
Gall, M. D., Gall, J. P., & Borg, W. R. (2003). Educational research: An introduction (7thed.). New York: Allyn and Bacon.
221
Gonyea, R. M. (2005). Self-reported data in institutional research: Review andrecommendations. In P. D. Umbach (Ed.), Survey research: Emerging issues(pp. 73-89). San Francisco: Jossey-Bass.
Gonzalez, A. (1989). The western impact on Philippine higher education. In P. G.Altbach & V. Selvaratnam (Eds.), From dependence to autonomy: Thedevelopment of Asian universities (pp. 117-142). Boston: Kluwer AcademicPublishers.
Gonzalez, A. B. (1987). Public and private sectors in Philippine higher education. InPublic and private sectors in Asian higher education systems: Issues andprospects (pp. 35-48). Hiroshima University: Research Institute for HigherEducation.
Gonzalez, A. B. (1997). Philippines. In G. A. Postiglione & G. C. L. Mak (Eds.), Asianhigher education: An international handbook and reference guide (pp. 265-284).Westport, CT: Greenwood Press.
Goss, B. D., Jubenville, C. B., & Orejan, J. (2006). An examination of influences andfactors on the institutional selection processes of freshman student-athletes atsmall colleges and universities. Journal of Marketing for Higher Education, 16(2),105-134.
Graham, J. W., Cumsille, P. E., & Elek-Fisk, E. (2003). Chapter 4: Methods for handlingmissing data. In I. B. Weiner, D. K. Freedheim, J. A. Schinka & W. F. Velicer(Eds.), Handbook of psychology (pp. 87-114): John Wiley and Sons.
He, S. C. (2008). Meeting the challenges of diversity: Beliefs of Taiwanese preserviceearly childhood teachers. Unpublished doctoral dissertation, University of NorthTexas, 2008.
Hemsley-Brown, J. (1999). College choice: Perceptions and priorities. EducationalManagement & Administration, 27(1), 85-98.
Henson, R. K. (2006). Effect-size measures and meta-analytic thinking in counselingpsychology research. The Counseling Psychologist, 34, 601-629.
Higher education statistical bulletin: Academic year 2004-2005. (2006). Pasig City,Philippines: Commission on Higher Education.
Higher education statistical bulletin: Definition of terms. (2006). Pasig City, Philippines:Commission on Higher Education.
Hinkle, D. E., Wiersma, W., & Jurs, S. G. (2003). Applied statistics for the behavioralsciences (5th ed.). New York: Houghton Mifflin Company.
222
Hossler, D. (1999). Effective admissions recruitment. In G. H. Gaither (Ed.), Promisingpractices in recruitment, remediation, and retention (pp. 15-30). San Francisco:Jossey-Bass Publishers.
Hossler, D. (2000). The role of financial aid in enrollment management. In The rolestudent aid plays in enrollment management (pp. 77-90). San Francisco: Jossey-Bass Publishers.
Hossler, D., Braxton, J., & Coopersmith, G. (1989). Understanding student collegechoice. In J. C. Smart (Ed.), Higher education: Handbook of theory and research(Vol. V, pp. 231-288). New York: Agathon Press.
Hossler, D., & Foley, E. M. (1995). Reducing the noise in the college choice process:The use of college guidebooks and ratings. In R. D. Walleri & M. K. Moss (Eds.),Evaluating and responding to college guidebooks and rankings (pp. 21-30). SanFrancisco: Jossey-Bass.
Hossler, D., & Gallagher, K. S. (1987). Studying student college choice: A three-phasemodel and the implications for policymakers. College and University, 62(3), 207-221.
Hossler, D., Schmit, J., & Vesper, N. (1999). Going to college: How social, economic,and educational factors influence the decisions students make. London: JohnsHopkins University Press.
Huck, S. W. (2000). Reading statistics and research (3rd ed.). New York: Longman.
Huck, S. W. (2004). Reading statistics and research (4th ed.). Boston: Pearson and AB.
Hurtado, S., Inkelas, K. K., Briggs, C., & Rhee, B.-S. (1997). Differences in collegeaccess and choice among racial/ethnic groups: Identifying continuing barriers.Research in Higher Education, 38(1), 43-75.
Ihlanfeldt, W. (1980). Achieving optimal enrollments and tuition revenues: A guide tomodern methods of market research, student recruitment, and institutionalpricing. San Francisco: Jossey-Bass.
Jackson, G. A. (1982). Public efficiency and private choice in higher education.Educational Evaluation and Policy Analysis, 4(2), 237-247.
Johanson, R. K. (1999). The 1998 Philippines education sector study: Higher educationin the Philippines (Technical background paper no. 3). Manila: AsianDevelopment Bank and World Bank.
Kellaris, J. J., & Kellaris Jr., W. K. (1988). An exploration of the factors influencingstudents' college choice decision at a small private college. College & University,63(2), 187-197.
223
Kinzie, J., Palmer, M., Hayek, J., Hossler, D., Jacob, S. A., & Cummings, H. (2004).Fifty years of college choice: Social, political and institutional influences on thedecision-making process. Indianapolis, IN: Lumina Foundation for Education.
Lange, D. K., & Stone, M. E. (2001). Parental involvement in admissions and financialaid. In B. V. Daniel & B. S. Ross (Eds.), Consumers, adversaries, and partners:Working with the families of undergraduates (pp. 15-26). San Francisco: Jossey-Bass Publishers.
Leech, N. L., & Onwuegbuzie, A. J. (2002, November). A call for greater use ofnonparametric statistics. Paper presented at the Annual Meeting of the Mid-South Educational Research Association, Chattanooga, TN. (ERIC DocumentReproduction Service No. ED471346).
Litten, L. H. (1982). Different strokes in the applicant pool: Some refinements in a modelof student college choice. Journal of Higher Education, 53(4), 383-402.
Liu, J. (2005). Factors influencing students' choice of selected private universities inChina. (Doctoral dissertation, Brigham Young University, 2005). DissertationAbstracts International, 66/09, 3173.
MacDermott, K. G., Conn, P. A., & Owen, J. W. (1987). The level of parental educationlevel on college choice. Journal of College Admissions, 115, 3-10.
Mansfield, P. M., & Warwick, J. (2005). Gender differences in students' and parents'evaluative criteria when selecting a college. Journal of Marketing for HigherEducation, 15(2), 47-80.
Manski, C. F., & Wise, D. A. (1983). Econometric modeling of student behavior. In C. F.Manski & D. A. Wise (Eds.), College choice in America (pp. 26-42). Cambridge,MA: Harvard University Press.
Maringe, F. (2006). University and course choice: Implications for positioning,recruitment and marketing. International Journal of Educational Management,20(6), 466-479.
McDonough, P. M. (1997). Choosing colleges: How social class and schools structureopportunity: State University of New York Press.
McDonough, P. M., Antonio, A. L., Walpole, M., & Pérez, L. X. (1998). College rankings:Democritized college knowledge for whom? Research in Higher Education,39(5), 513-537.
Medium-term higher education development and investment plan (MTHEDIP), 2001-2004. (2001). Pasig City, Philippines: Commission on Higher Education.
224
Merranko, S. E. (2005). Factors that influence the college choice selection process offirst-generation college students attending 4-year public institutions. (Doctoraldissertation, George Washington University, 2005). Dissertation AbstractsInternational, 66/07, 2511.
Mills, M. (2004). [Review of the paper Do and should financial aid packages affectstudents' college choices]. Journal of College Admission, 183, 28-29.
Moss, G., & Cockriel, I. W. (1990). Graduates' reasons for choosing to attend religiousand public colleges. Paper presented at the Hardin-Simmons UniversityCentennial Symposium "The Future of Church-Related Colleges in AmericanSociety: Role and Effect", Abilene, TX. (ERIC Document Reproduction ServiceNo. ED325035)
Nunnally, J. C., & Bernstein, I. H. (1994). Psychometric theory (3rd ed.). New York:McGraw-Hill.
The official website of the Republic of the Philippines: General information. (2008).Retrieved August 27, 2008, from http://www.gov.ph/aboutphil/general.asp.
Paulsen, M. B. (1990). College choice: Understanding student enrollment behavior(ASHE-ERIC Higher Education Report 6). Washington, D.C.: GeorgeWashington University.
Perna, L. W. (2000). Racial and ethnic group differences in college enrollmentdecisions. In A. F. Cabrera & S. M. L. Nasa (Eds.), Understanding the collegechoice of disadvantaged students (pp. 65-84). San Francisco: Jossey-Bass.
Perna, L. W. (2007). The sources of racial-ethnic group differences in collegeenrollment: A critical examination. In F. K. Stage (Ed.), Using quantitative data toanswer critical questions (pp. 51-66). San Francisco: Jossey-Bass.
Philippine higher education in the 21st century: Strategies for excellence and equity.(1995). Philippines: Commission on Higher Education, Task Force on HigherEducation.
Philippine higher education: A brief guide. (n.d.). Pasig City, Philippines: Commission onHigher Education
Philippines national statistics office. (2008). Retrieved September 16, 2008, fromhttp://www.census.gov.ph/data/sectordata/dataincome.html.
Porter, S. R., & Whitcomb, M. E. (2004). Understanding the effect of prizes on responserates. In S. R. Porter (Ed.), Overcoming survey research problems (pp. 51-62).San Francisco: Jossey-Bass.
Pugsley, L. (2004). The university challenge: Higher education markets and socialstratification. Burlington, VT: Ashgate.
225
Recalde, D. J. (1977). Factors which deter Adventist college students from attending anAdventist college. Unpublished master's thesis, Philippine Union College, Cavite,Philippines.
Reeves, T. J., & Bennett, C. E. (2004). We the people: Asians in the United States(CENSR-17): U.S. Census Bureau.
Republic of the Philippines department of education: Historical perspective of thePhilippine educational system. (2008). Retrieved September 1, 2008, fromhttp://www.deped.gov.ph/about_deped/history.asp.
Roberts, J. K. (2004). EDER 6010: Statistics for educational research. UnpublishedPowerPoint presentation, University of North Texas.
Rosas, N. L. (1988). The role of government in the Philippine higher education system:Issues and prospects. In The role of government in Asian higher educationsystems: Issues and prospects (pp. 39-49). Hiroshima University: ResearchInstitute for Higher Education.
Roszkowski, M. J., & Reilly, P. J. (2005). At the end of the day, I want to be close tohome: Adult students' preferences for college proximity to work and home.Journal of Marketing for Higher Education, 15(1), 81-95.
Rowe, K. B. (2002). The college choice process of high school seniors: An investigationof significant influences. (Doctoral dissertation, Dowling College, 2002).Dissertation Abstracts International, 66/01, 112.
Saggio, J. J. (2001). Family and its effect on institutional choice and post-freshmanretention of American Indian/Alaska native students at a Bible college. Paperpresented at the Annual Meeting of the Association for the Study of HigherEducation, Richmond, VA. (ERIC Document Reproduction Service No.ED460810).
Santos, J. R. A. (1999). Cronbach's alpha: A tool for assessing the reliability of scales.Journal of Extension, 37(2), Retrieved September 19, 2008, fromhttp://www.ched.gov.ph/hes/index.html.
Sewell, W. H., Haller, A. O., & Portes, A. (1969). The educational and earlyoccupational attainment process. American Sociological Review, 34(1), 82-92.
Sewell, W. H., & Shah, V. P. (1968). Social class, parental encouragement, andeducational aspirations. American Journal of Sociology, 73(5), 559-572.
Smith, H. (2007). Playing a different game: The contextualised decision-makingprocesses of minority ethnic students in choosing a higher education institution.Race, Ethnicity and Education, 10(4), 415-437.
226
Southerland, J. N. (2006, November). Formulating a new model of college choice andpersistence. Paper presented at the Annual Meeting of the Association for theStudy of Higher Education, Anaheim, CA. (ERIC Document ReproductionService No. ED493861).
Swinerton, E. N. (1991). Philippine higher education: Toward the twenty-first century.New York: Praeger.
Tabachnick, B. G., & Fidell, L. S. (2007). Using multivariate statistics (5th ed.). Boston:Pearson and AB.
Teranishi, R. T. (2007). Race, ethnicity, and higher education policy: The use of criticalquantitative research. In F. K. Stage (Ed.), Using quantitative data to answercritical questions (pp. 37-50). San Francisco: Jossey-Bass.
Teranishi, R. T., Ceja, M., Antonio, A. L., Allen, W. R., & McDonough, P. (2004). Thecollege choice process for Asian Pacific Americans: Ethnicity and socioeconomicclass in context. Review of Higher Education, 27(4), 527-551.
Thomas, S. J. L. (2003). The college choice phenomenon: An exploration of parentalperceptions. (Doctoral dissertation, University of Nevada, Las Vegas, 2003).Dissertation Abstracts International, 64/05, 1556.
Thompson, B. (2006). Foundations of behavioral statistics: An insight-based approach.New York: Guilford Press.
University of the Philippines Diliman: Academic calendar: Academic year 2008-2009.(2008). Retrieved September 16, 2008, fromhttp://www.upd.edu.ph/acadcal08_09.html.
Vander Schee, B. A. (2006). Parents as a target market in college admissions.Recruitment & Retention in Higher Education, 20(12), 7-8.
Zwaenepoel, P. P. (1975). Tertiary education in the Philippines, 1611-1972: A systemsanalysis. Quezon City, Manila, Philippines: Alemar-Phoenix Publishing House.