
Collection and exploratory analysis of attitude sensor ... · Collection and exploratory analysis...
5
Collection and exploratory analysis of attitude sensor data in an epilepsy monitoring unit Guillaume Becq, St´ ephane Bonnet, Lorella Minotti, Michel Antonakios, R´ egis Guillemaud, Philippe Kahane To cite this version: Guillaume Becq, St´ ephane Bonnet, Lorella Minotti, Michel Antonakios, R´ egis Guillemaud, et al.. Collection and exploratory analysis of attitude sensor data in an epilepsy monitoring unit. Annual International Conference of the IEEE Engineering in Medicine and Biology Society, Aug 2007, Lyon, France. 1, pp.2775-8, 2007, <10.1109/IEMBS.2007.4352904>. <hal-00124735v2> HAL Id: hal-00124735 https://hal.archives-ouvertes.fr/hal-00124735v2 Submitted on 11 Dec 2007 HAL is a multi-disciplinary open access archive for the deposit and dissemination of sci- entific research documents, whether they are pub- lished or not. The documents may come from teaching and research institutions in France or abroad, or from public or private research centers. L’archive ouverte pluridisciplinaire HAL, est destin´ ee au d´ epˆ ot et ` a la diffusion de documents scientifiques de niveau recherche, publi´ es ou non, ´ emanant des ´ etablissements d’enseignement et de recherche fran¸cais ou ´ etrangers, des laboratoires publics ou priv´ es.
Transcript of Collection and exploratory analysis of attitude sensor ... · Collection and exploratory analysis...

Collection and exploratory analysis of attitude sensor
data in an epilepsy monitoring unit
Guillaume Becq, Stephane Bonnet, Lorella Minotti, Michel Antonakios, Regis
Guillemaud, Philippe Kahane
To cite this version:
Guillaume Becq, Stephane Bonnet, Lorella Minotti, Michel Antonakios, Regis Guillemaud, etal.. Collection and exploratory analysis of attitude sensor data in an epilepsy monitoring unit.Annual International Conference of the IEEE Engineering in Medicine and Biology Society, Aug2007, Lyon, France. 1, pp.2775-8, 2007, <10.1109/IEMBS.2007.4352904>. <hal-00124735v2>
HAL Id: hal-00124735
https://hal.archives-ouvertes.fr/hal-00124735v2
Submitted on 11 Dec 2007
HAL is a multi-disciplinary open accessarchive for the deposit and dissemination of sci-entific research documents, whether they are pub-lished or not. The documents may come fromteaching and research institutions in France orabroad, or from public or private research centers.
L’archive ouverte pluridisciplinaire HAL, estdestinee au depot et a la diffusion de documentsscientifiques de niveau recherche, publies ou non,emanant des etablissements d’enseignement et derecherche francais ou etrangers, des laboratoirespublics ou prives.

Collection and Exploratory Analysis of Attitude Sensor Data in anEpilepsy Monitoring Unit
Guillaume Becq*, Stephane Bonnet, Lorella MinottiMichel Antonakios, Regis Guillemaud and Philippe Kahane
Abstract— The aim of this paper is to present the collectionof attitude sensor data from an epilepsy monitoring unit andthe results of standard exploration using principal componentanalysis. The collection of data from attitude sensors positionedon three limbs of epileptic patients at their bedside is described.The analysis of the data focuses, on one hand, on motor featuresextraction from attitude sensor data and on the other hand,on visual segmentation of seizures into events corresponding tomotor manifestations classes by an expert. Principal componentanalysis is then realized over these features and groups ofdata are localized according to the expert classification. Thisexploration indicates a possible discrimination between thesemotor manifestation classes.
Index Terms— epilepsy, movement, seizures, attitude sensors,feature extraction, principal component analysis, monitoring,accelerometer, magnetometer.
I. INTRODUCTION
EPILEPSY is one of the most important neurologi-cal disorders affecting both adults and children [1].
Epilepsy is characterized by the spontaneous repetition ofepileptic seizures which denote brain dysfunction. Duringan epileptic seizure, an excessive electrical discharge, arisingfrom one brain area, may propagate into other brain areas andinduce different clinical manifestations. The chronologicalorganization of these ictal clinical manifestations is actuallyreflecting the electrical pathway during the discharge. Forinstance, frontal epileptic seizures are often characterized bythe occurrence of one-sided or two-sided motor manifesta-tions of limbs, head or body axis.
The semiological seizure analysis is usually performed inan Epilepsy Monitoring Unit (EMU) by recordings and visu-alizing seizures with video-EEG recordings. This is essentialfor the identification of epileptogenic areas in the brain andthe comprehension of different clinical and EEG patterns.
Although EEG recording is the gold standard to analyzeepileptic seizure, video gives also many clues for the diag-nostic. However, video essentially presents qualitative infor-mation, which is often hard and long to process. Moreoverdata visual inspection by EEG technicians is rather subjectiveand does not allow comparing between different motorpatterns. Several solutions have been proposed recently to
Asterisk indicates corresponding author.This work was supported by the ITS 2006.G. becq, L. Minotti and P. Kahane are with Inserm U704, Dynamic of
neural networks, in the CHU Grenoble, BP217, 38043 Grenoble cedex 9,France [email protected])
S. Bonnet, M. Antonakios and R. Guillemaud are with the CEA/Leti/DTBS/STD/Lisa, 17 rue des martyrs, 38054 Grenoble cedex, France([email protected])
quantify movement in an automated, unsupervised and real-time manner.
Different authors have proposed to detect and diagnoseepileptic seizures using video analysis with or without mark-ers fixed on human body [2]–[4]. This approach is attractivebecause it can be based on the routine video-EEG procedureperformed in every EMU but a major limitation is that theperson (or the markers) should remain in the field-of-viewof the camera.
A much powerful approach is based on body-mounted sen-sors like accelerometers or rate gyroscopes [5]–[8]. MEMStechnology is well-suited to monitor epilepsy since it allowsquantifying intensity, frequency and duration of movements.Furthermore inertial sensors are well adapted for applicationsof ambulatory measurement of human movements: highintegration, small weight and low cost. As a consequencethey can be used outside the clinical setting.
In order to obtain a full characterization of 3D epilepticmovements, we propose to combine magnetic sensors withaccelerometers into the same attitude sensor module [9].Magnetometers are primarily intended to characterize move-ment in the horizontal plane as it can be observed duringtonic episodes. Furthermore, these sensors are also sensitiveto tremors while being insensitive to accelerations.
This paper aims at showing that quantitative analysis ofwrist and head movements, by means of attitude sensors, pro-vides objective measures for the characterization of epilepticseizures and reveals that an automated classification of motormanifestations could be possible. This is done by usingprincipal component analysis (PCA).
In the first section, we describe the clinical environmentof this study and then we present the different features thatwere extracted to characterize epileptic motor manifestationsoccurring during seizures. Preliminary results are proposedin the last section.
II. MATERIALS
The EMU in CHU Grenoble is composed of two bed-rooms, each one equipped with Brain Quick video-EEGacquisition system from Micromed [10]. It is composed of anamplifier accepting up to 128 leads with selectable samplingrate from 256 to 1024Hz (16 bits resolution). An optical linkinsures data transmission to a computer in the monitoringroom. Audios-videos and EEG recordings are synchronizedwith Micromed System Plus patient data management systemsoftware. In addition to the daily routine, a protocol was
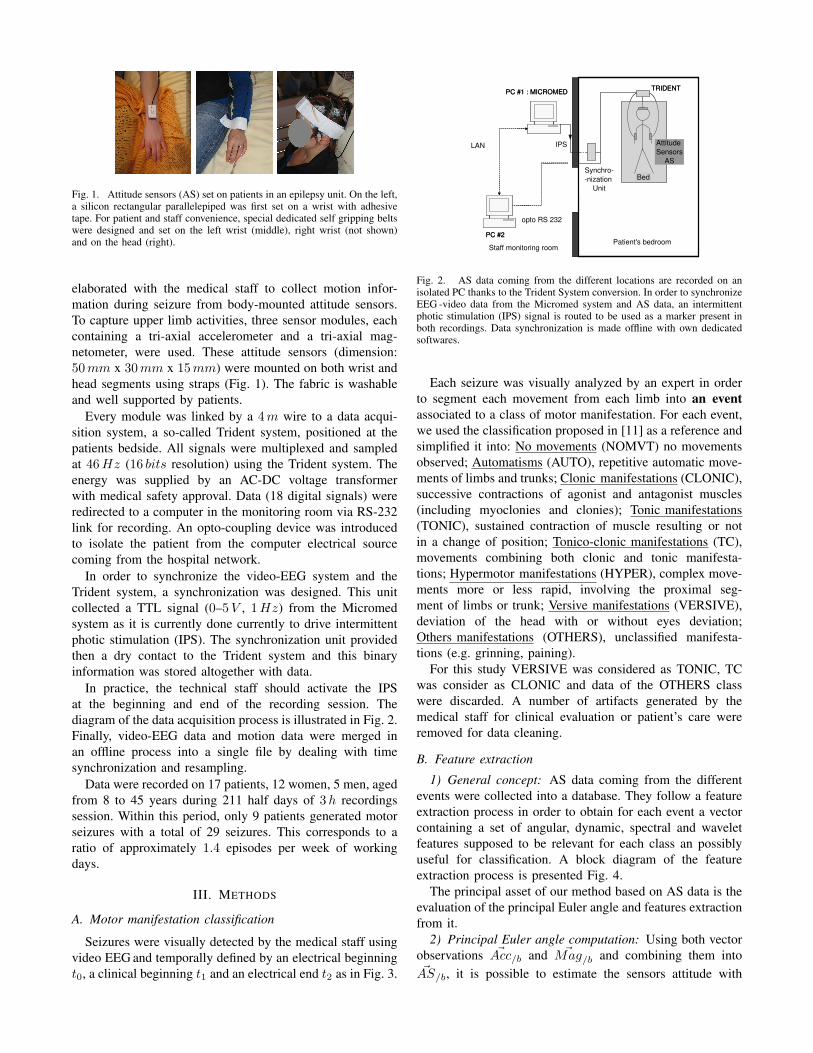
Fig. 1. Attitude sensors (AS) set on patients in an epilepsy unit. On the left,a silicon rectangular parallelepiped was first set on a wrist with adhesivetape. For patient and staff convenience, special dedicated self gripping beltswere designed and set on the left wrist (middle), right wrist (not shown)and on the head (right).
elaborated with the medical staff to collect motion infor-mation during seizure from body-mounted attitude sensors.To capture upper limb activities, three sensor modules, eachcontaining a tri-axial accelerometer and a tri-axial mag-netometer, were used. These attitude sensors (dimension:50mm x 30mm x 15mm) were mounted on both wrist andhead segments using straps (Fig. 1). The fabric is washableand well supported by patients.
Every module was linked by a 4m wire to a data acqui-sition system, a so-called Trident system, positioned at thepatients bedside. All signals were multiplexed and sampledat 46Hz (16 bits resolution) using the Trident system. Theenergy was supplied by an AC-DC voltage transformerwith medical safety approval. Data (18 digital signals) wereredirected to a computer in the monitoring room via RS-232link for recording. An opto-coupling device was introducedto isolate the patient from the computer electrical sourcecoming from the hospital network.
In order to synchronize the video-EEG system and theTrident system, a synchronization was designed. This unitcollected a TTL signal (0–5V , 1Hz) from the Micromedsystem as it is currently done currently to drive intermittentphotic stimulation (IPS). The synchronization unit providedthen a dry contact to the Trident system and this binaryinformation was stored altogether with data.
In practice, the technical staff should activate the IPSat the beginning and end of the recording session. Thediagram of the data acquisition process is illustrated in Fig. 2.Finally, video-EEG data and motion data were merged inan offline process into a single file by dealing with timesynchronization and resampling.
Data were recorded on 17 patients, 12 women, 5 men, agedfrom 8 to 45 years during 211 half days of 3h recordingssession. Within this period, only 9 patients generated motorseizures with a total of 29 seizures. This corresponds to aratio of approximately 1.4 episodes per week of workingdays.
III. METHODS
A. Motor manifestation classification
Seizures were visually detected by the medical staff usingvideo EEG and temporally defined by an electrical beginningt0, a clinical beginning t1 and an electrical end t2 as in Fig. 3.
Câble RS232
TRIDENT
lit
Connexionréseau
PC #2
PC #1 : MICROMED
DISPOSITIF DE SYNCHRO
Capteur de mouvement
Câble RS232
TRIDENT
lit
Connexionréseau
PC #2
PC #1 : MICROMED
DISPOSITIF DE SYNCHRO
Capteur de mouvement
LAN
opto RS 232
Synchronization
UnitBed
Attitude Sensors
AS
Patient's bedroomStaff monitoring room
IPS
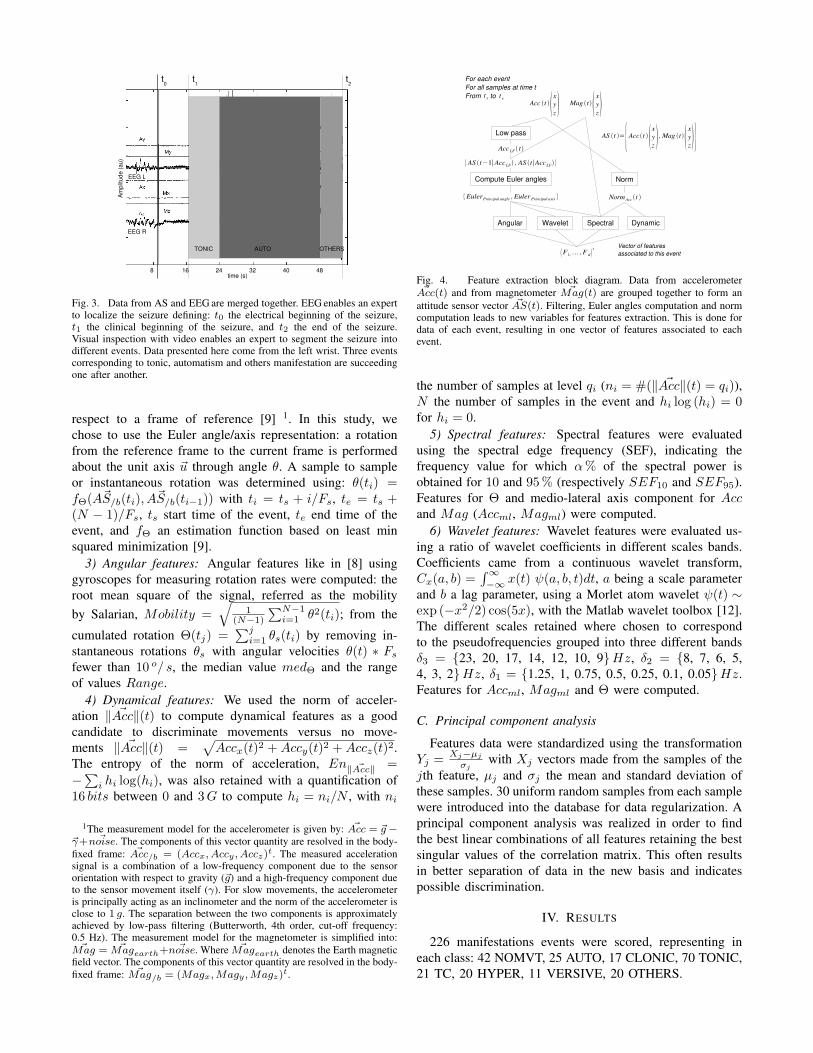
Fig. 2. AS data coming from the different locations are recorded on anisolated PC thanks to the Trident System conversion. In order to synchronizeEEG -video data from the Micromed system and AS data, an intermittentphotic stimulation (IPS) signal is routed to be used as a marker present inboth recordings. Data synchronization is made offline with own dedicatedsoftwares.
Each seizure was visually analyzed by an expert in orderto segment each movement from each limb into an eventassociated to a class of motor manifestation. For each event,we used the classification proposed in [11] as a reference andsimplified it into: No movements (NOMVT) no movementsobserved; Automatisms (AUTO), repetitive automatic move-ments of limbs and trunks; Clonic manifestations (CLONIC),successive contractions of agonist and antagonist muscles(including myoclonies and clonies); Tonic manifestations(TONIC), sustained contraction of muscle resulting or notin a change of position; Tonico-clonic manifestations (TC),movements combining both clonic and tonic manifesta-tions; Hypermotor manifestations (HYPER), complex move-ments more or less rapid, involving the proximal seg-ment of limbs or trunk; Versive manifestations (VERSIVE),deviation of the head with or without eyes deviation;Others manifestations (OTHERS), unclassified manifesta-tions (e.g. grinning, paining).
For this study VERSIVE was considered as TONIC, TCwas consider as CLONIC and data of the OTHERS classwere discarded. A number of artifacts generated by themedical staff for clinical evaluation or patient’s care wereremoved for data cleaning.
B. Feature extraction
1) General concept: AS data coming from the differentevents were collected into a database. They follow a featureextraction process in order to obtain for each event a vectorcontaining a set of angular, dynamic, spectral and waveletfeatures supposed to be relevant for each class an possiblyuseful for classification. A block diagram of the featureextraction process is presented Fig. 4.
The principal asset of our method based on AS data is theevaluation of the principal Euler angle and features extractionfrom it.
2) Principal Euler angle computation: Using both vectorobservations ~Acc/b and ~Mag/b and combining them into~AS/b, it is possible to estimate the sensors attitude with
AUTOTONIC OTHERS
t0
t1
t2
EEG L
EEG R
8 16 24 32 40 48time (s)
Am
plitu
de (a
u)
Fig. 3. Data from AS and EEG are merged together. EEG enables an expertto localize the seizure defining: t0 the electrical beginning of the seizure,t1 the clinical beginning of the seizure, and t2 the end of the seizure.Visual inspection with video enables an expert to segment the seizure intodifferent events. Data presented here come from the left wrist. Three eventscorresponding to tonic, automatism and others manifestation are succeedingone after another.
respect to a frame of reference [9] 1. In this study, wechose to use the Euler angle/axis representation: a rotationfrom the reference frame to the current frame is performedabout the unit axis ~u through angle θ. A sample to sampleor instantaneous rotation was determined using: θ(ti) =fΘ( ~AS/b(ti), ~AS/b(ti−1)) with ti = ts + i/Fs, te = ts +(N − 1)/Fs, ts start time of the event, te end time of theevent, and fΘ an estimation function based on least minsquared minimization [9].
3) Angular features: Angular features like in [8] usinggyroscopes for measuring rotation rates were computed: theroot mean square of the signal, referred as the mobilityby Salarian, Mobility =
√1
(N−1)
∑N−1i=1 θ2(ti); from the
cumulated rotation Θ(tj) =∑j
i=1 θs(ti) by removing in-stantaneous rotations θs with angular velocities θ(t) ∗ Fs
fewer than 10 o/ s, the median value medΘ and the rangeof values Range.
4) Dynamical features: We used the norm of acceler-ation ‖ ~Acc‖(t) to compute dynamical features as a goodcandidate to discriminate movements versus no move-ments ‖ ~Acc‖(t) =
√Accx(t)2 +Accy(t)2 +Accz(t)2.
The entropy of the norm of acceleration, En‖ ~Acc‖ =−
∑i hi log(hi), was also retained with a quantification of
16 bits between 0 and 3G to compute hi = ni/N , with ni
1The measurement model for the accelerometer is given by: ~Acc = ~g −~γ+ ~noise. The components of this vector quantity are resolved in the body-fixed frame: ~Acc/b = (Accx, Accy , Accz)t. The measured accelerationsignal is a combination of a low-frequency component due to the sensororientation with respect to gravity (~g) and a high-frequency component dueto the sensor movement itself (γ). For slow movements, the accelerometeris principally acting as an inclinometer and the norm of the accelerometer isclose to 1 g. The separation between the two components is approximatelyachieved by low-pass filtering (Butterworth, 4th order, cut-off frequency:0.5 Hz). The measurement model for the magnetometer is simplified into:
~Mag = ~Magearth+ ~noise. Where ~Magearth denotes the Earth magneticfield vector. The components of this vector quantity are resolved in the body-fixed frame: ~Mag/b = (Magx, Magy , Magz)t.
{AS t−1∣AccLF , AS t∣AccLF}
Compute Euler angles
Angular Spectral DynamicWavelet
{EulerPrincipal angle ,Euler Principal axis }
AS t ={Acct xyz , Mag t
xyz }
Acc t xyz Mag t
xyz
AccLF t
Norm
NormAcc t
Low pass
For each eventFor all samples at time tFrom to t s t e
F1, , F d t Vector of features
associated to this event
Fig. 4. Feature extraction block diagram. Data from accelerometer~Acc(t) and from magnetometer ~Mag(t) are grouped together to form an
attitude sensor vector ~AS(t). Filtering, Euler angles computation and normcomputation leads to new variables for features extraction. This is done fordata of each event, resulting in one vector of features associated to eachevent.
the number of samples at level qi (ni = #(‖ ~Acc‖(t) = qi)),N the number of samples in the event and hi log (hi) = 0for hi = 0.
5) Spectral features: Spectral features were evaluatedusing the spectral edge frequency (SEF), indicating thefrequency value for which α% of the spectral power isobtained for 10 and 95 % (respectively SEF10 and SEF95).Features for Θ and medio-lateral axis component for Accand Mag (Accml, Magml) were computed.
6) Wavelet features: Wavelet features were evaluated us-ing a ratio of wavelet coefficients in different scales bands.Coefficients came from a continuous wavelet transform,Cx(a, b) =
∫∞−∞ x(t) ψ(a, b, t)dt, a being a scale parameter
and b a lag parameter, using a Morlet atom wavelet ψ(t) ∼exp (−x2/2) cos(5x), with the Matlab wavelet toolbox [12].The different scales retained where chosen to correspondto the pseudofrequencies grouped into three different bandsδ3 = {23, 20, 17, 14, 12, 10, 9}Hz, δ2 = {8, 7, 6, 5,4, 3, 2}Hz, δ1 = {1.25, 1, 0.75, 0.5, 0.25, 0.1, 0.05}Hz.Features for Accml, Magml and Θ were computed.
C. Principal component analysis
Features data were standardized using the transformationYj = Xj−µj
σjwith Xj vectors made from the samples of the
jth feature, µj and σj the mean and standard deviation ofthese samples. 30 uniform random samples from each samplewere introduced into the database for data regularization. Aprincipal component analysis was realized in order to findthe best linear combinations of all features retaining the bestsingular values of the correlation matrix. This often resultsin better separation of data in the new basis and indicatespossible discrimination.
IV. RESULTS
226 manifestations events were scored, representing ineach class: 42 NOMVT, 25 AUTO, 17 CLONIC, 70 TONIC,21 TC, 20 HYPER, 11 VERSIVE, 20 OTHERS.
NOMVTTONICCLONICHYPERAUTO
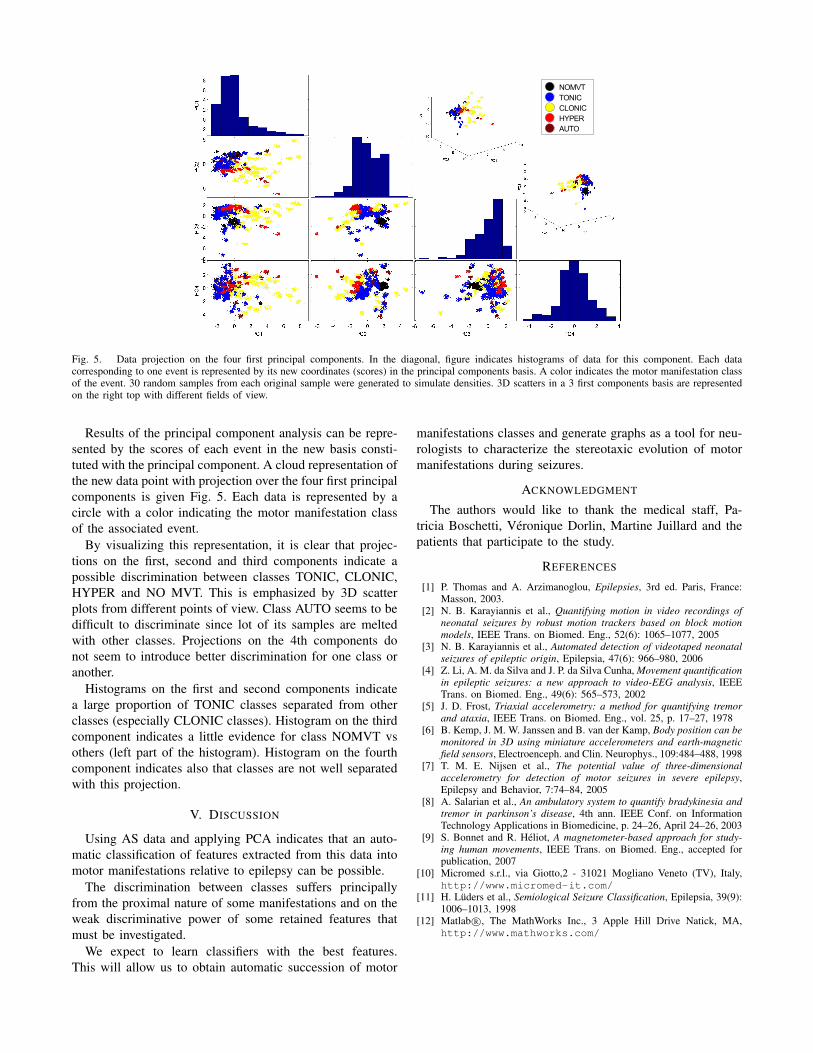
Fig. 5. Data projection on the four first principal components. In the diagonal, figure indicates histograms of data for this component. Each datacorresponding to one event is represented by its new coordinates (scores) in the principal components basis. A color indicates the motor manifestation classof the event. 30 random samples from each original sample were generated to simulate densities. 3D scatters in a 3 first components basis are representedon the right top with different fields of view.
Results of the principal component analysis can be repre-sented by the scores of each event in the new basis consti-tuted with the principal component. A cloud representation ofthe new data point with projection over the four first principalcomponents is given Fig. 5. Each data is represented by acircle with a color indicating the motor manifestation classof the associated event.
By visualizing this representation, it is clear that projec-tions on the first, second and third components indicate apossible discrimination between classes TONIC, CLONIC,HYPER and NO MVT. This is emphasized by 3D scatterplots from different points of view. Class AUTO seems to bedifficult to discriminate since lot of its samples are meltedwith other classes. Projections on the 4th components donot seem to introduce better discrimination for one class oranother.
Histograms on the first and second components indicatea large proportion of TONIC classes separated from otherclasses (especially CLONIC classes). Histogram on the thirdcomponent indicates a little evidence for class NOMVT vsothers (left part of the histogram). Histogram on the fourthcomponent indicates also that classes are not well separatedwith this projection.
V. DISCUSSION
Using AS data and applying PCA indicates that an auto-matic classification of features extracted from this data intomotor manifestations relative to epilepsy can be possible.
The discrimination between classes suffers principallyfrom the proximal nature of some manifestations and on theweak discriminative power of some retained features thatmust be investigated.
We expect to learn classifiers with the best features.This will allow us to obtain automatic succession of motor
manifestations classes and generate graphs as a tool for neu-rologists to characterize the stereotaxic evolution of motormanifestations during seizures.
ACKNOWLEDGMENT
The authors would like to thank the medical staff, Pa-tricia Boschetti, Veronique Dorlin, Martine Juillard and thepatients that participate to the study.
REFERENCES
[1] P. Thomas and A. Arzimanoglou, Epilepsies, 3rd ed. Paris, France:Masson, 2003.
[2] N. B. Karayiannis et al., Quantifying motion in video recordings ofneonatal seizures by robust motion trackers based on block motionmodels, IEEE Trans. on Biomed. Eng., 52(6): 1065–1077, 2005
[3] N. B. Karayiannis et al., Automated detection of videotaped neonatalseizures of epileptic origin, Epilepsia, 47(6): 966–980, 2006
[4] Z. Li, A. M. da Silva and J. P. da Silva Cunha, Movement quantificationin epileptic seizures: a new approach to video-EEG analysis, IEEETrans. on Biomed. Eng., 49(6): 565–573, 2002
[5] J. D. Frost, Triaxial accelerometry: a method for quantifying tremorand ataxia, IEEE Trans. on Biomed. Eng., vol. 25, p. 17–27, 1978
[6] B. Kemp, J. M. W. Janssen and B. van der Kamp, Body position can bemonitored in 3D using miniature accelerometers and earth-magneticfield sensors, Electroenceph. and Clin. Neurophys., 109:484–488, 1998
[7] T. M. E. Nijsen et al., The potential value of three-dimensionalaccelerometry for detection of motor seizures in severe epilepsy,Epilepsy and Behavior, 7:74–84, 2005
[8] A. Salarian et al., An ambulatory system to quantify bradykinesia andtremor in parkinson’s disease, 4th ann. IEEE Conf. on InformationTechnology Applications in Biomedicine, p. 24–26, April 24–26, 2003
[9] S. Bonnet and R. Heliot, A magnetometer-based approach for study-ing human movements, IEEE Trans. on Biomed. Eng., accepted forpublication, 2007
[10] Micromed s.r.l., via Giotto,2 - 31021 Mogliano Veneto (TV), Italy,http://www.micromed-it.com/
[11] H. Luders et al., Semiological Seizure Classification, Epilepsia, 39(9):1006–1013, 1998
[12] Matlab R©, The MathWorks Inc., 3 Apple Hill Drive Natick, MA,http://www.mathworks.com/