Catalysing inter-regional network-enabled collaboration through workshopping v1.0
Upload
duongkhuongCategory
view
213download
0
ITcon Vol. 15 (2010), Guha et al., pg. 86
www.itcon.org - Journal of Information Technology in Construction - ISSN 1874-4753
COLLABORATION IN A WEB ENABLED DESIGN MANAGEMENT
SYSTEM – A CASE STUDY IN KOLKATA, INDIA
PUBLISHED: January 2010 at http://www.itcon.org/2010/6
EDITOR: Björk, B-C
Shion. Guha,
Graduate Student; Indian Statistical Institute, Bangalore, India
[email protected]; www.sssolutionsonline.com
Thakur Biswajit
Senior Lecturer; Civil Engineering, Meghnad Saha Institute of Technology, Kolkata, India
Shibnath Chakrabarty
Professor; Civil Engineering, Jadavpur University , Kolkata, India
SUMMARY: Project specific websites for construction management have become common in developed
countries. Such a web space was introduced in Kolkata, India in 2006 for a hotel restoration and development
project. The collaboration performances of the participants are presented in this case study. Relevant literature
and the background conditions were first studied for planning of the web site. The response and participation of
the end users were the most important aspects for success of such a collaborative web site. A number of tools
like sociogram, sociometry, statistical analysis, social network analysis and factor analysis have been used to
investigate the users’ participation in the web site. The responses in the web forum followed a Pareto
distribution in conformity with the literature. A sociogram and indexes as proposed in Moreno methods in
sociometry were reported. A social network analysis was executed. These results could be used for comparisons
with similar internet forums. It can be also used in future for checking performance of this web space. A factor
analysis was performed to map the users’ opinion about the web site. Users felt that the web site performed well
in respect of coordination and benefit perspective but expected more in the areas of quality improvement and
users’ satisfaction perspective.
KEYWORDS: web enabled project management, collaborative design, social network analysis, factor analysis
REFERENCE: Guha S, Biswajit T, Chakrabarty S (2010) Collaboration in a web enabled design management
system - a case study in Kolkata, India, Journal of Information Technology in Construction (ITcon), Vol. 15, pg.
86-107, http://www.itcon.org/2010/6
COPYRIGHT: © 2010 The authors. This is an open access article distributed under the terms of the Creative
Commons Attribution 3.0 unported (http://creativecommons.org/licenses/by/3.0/), which
permits unrestricted use, distribution, and reproduction in any medium, provided the
original work is properly cited.
1. INTRODUCTION
A Majority of the construction firms in India are family operated small business. The industry is highly
fragmented. Information technology (IT) applications are slow to percolate through the industry. Computer
applications in design and drafting have become routine in India but even large corporations employ very little
IT for construction management. Ahuja et al (2009) conducted a questionnaire survey across India. They found
that internet enabled communication technology was in use in the industry, but comprehensive web based project
management solution had not been adopted by any of the respondent organizations. The project management
(PM) productivity has therefore remained low. The situation is not unique only for India. Shen et al (2009)
remarked in the context of industrially advanced countries that despite the emergence and adoption of IT to assist
construction management the industry’s productivity has remained low.

ITcon Vol. 15 (2010), Guha et al., pg. 87
Project specific web space for management that is in use in the developed nations for the last ten years has not
yet taken a root in India. A project specific construction management web space has been installed in Kolkata,
India in 2006 for a hotel restoration and expansion project. Observations and experiences about its
implementation are presented in this case study. Users’ responses and opinions are very important for success
of a collaborative web site. This was particularly important in the present case because the system was new and
many of the users were not computer savvy. It was therefore decided that the responses of the users would be
studied closely after introduction of the system.
A ‘Literature Review’ about the web implementation of construction informatics provided guidelines for
selection of components that should be included in the proposed web space. The plan for the study is presented
in the ‘Method’ section. The present status of IT application in construction management in Kolkata, India has
been investigated in ‘Case Background’ for assessing the local condition before implementation of the system.
The scope of the study is also described. The scheme and facilities of the web site is presented in ‘Case
Description’. The interaction of the users in the website is presented in ‘Results’. Quantitative estimates about
users’ responses, social networking behavior and opinions are also assessed in this section. The impact of the
study is presented in ‘Discussions’ and ‘Conclusion’.
2. LITERATURE REVIEW
Project management through web based platform has lately become an important topic in construction.
Substantial researches have been undertaken in developed countries for web enabled construction knowledge
management system. For example, the e-COGNOS project had been initiated by a consortium of the European
construction industries. It aims at specifying and developing an open model-based infrastructure and a tool set to
promote knowledge management within collaborative construction environments (Wetherill et al 2002).
Sanchez et al (2009) proposed a model that relies on a business process management strategy. In this approach,
the e-Business interfaces are independent of the PMC’s (Project Management Consultant) management system
allowing the firm to use always the same interface to receive and notify events. In addition, the firms only deal
with the information they need without being aware of the complexity of the whole project.
According to the European Construction Technology Platform (ECTP 2009), the future construction sector will
involve innovative business concepts that will be enabled by seamless communication throughout the
construction life-cycles (e-NVISION 2007). Researchers have been developing languages and computing
machinery for making web content unambiguously interpretable by computer programs, with a view to
automation of a diversity of web tasks. In addition, researchers are developing automated reasoning machinery to
address some of the more difficult tasks necessary for seamless interoperation including a richer form of
automated web service. (e-NVISION 2007).
The process of e-Tendering, e-Procurement, e-Site and e-Quality, where “e” stands both for electronic and
envisioning, constitute the core construction processes of the e-NVISION e-Business platform. The main
objective of this project is to integrate the enterprise applications with the overall goal of facilitating the
participation in European e-Business scenarios (e-NVISION 2009). The future e-Site scenario’s main objective
is to coordinate operations on the site in real time taking into account the events that occur at the building site:
breakdown of machinery, unacceptable weather conditions, absence of manpower, change in the documentation,
etc. In order to fulfill this objective a semantic model has been defined for the documentation needed to control
the construction site, including the design documentation, scheduling and payment information (Bilbao 2008).
In Istanbul Technical University’s Project Management Center, a research project in enabling an effective
management system was undertaken (Dikbas et al 1999). The model entails an automated system for multiple
construction projects, enabling efficient budget utilization by offering an elaborate decision-support system.
Being web-based, the system provides easy and rapid access to project information ensuring timely decision-
making.
In Japan, Sunaga et al (2000) conducted case studies for application of IT in building construction. They
examined the feasibilities and the problems of IT adoption. They found that in order to obtain high efficiencies
of IT adoption, the business process change needs to expand to a wider transformation of the entire process.
They found that cost of maintenance is an issue for smaller sites. They also found that a practical evaluation
method of effectiveness for IT adoption needs to be developed.
In a survey in US, roughly eighty percent of owners surveyed thought project collaboration software could help
to reduce miscommunication and project disputes (Cox 2007). At the same time, owners appear to be reluctant

ITcon Vol. 15 (2010), Guha et al., pg. 88
to mandate its use. Given that these tools have only been available since the late 1990’s, it is encouraging that
nearly a third of owners surveyed reported that they are using these tools and roughly one-third of owners
reported that using these tools have shown sufficient benefit. Issa et al (2003) reported a study about E-Business
Implementation in the US Construction Industry. The study focuses on determining the level of adoption of e-
Business within project management systems by general contractors. The e-Business Assessment Survey used in
this study showed that the US construction industry respondents were actually receptive to implement e-Business
solutions that were designed specifically for the construction industry.
Rivard et al (2004) gathered eleven case studies across Canada for observing the impact of IT on construction
industry. The case studies cover architecture, engineering, construction management, and specialized
contractors. The following technologies were demonstrated: 3D CAD; custom Web sites; commercial Web
portals; and in-house software development. They have agreed that electronic document transfer is the most
efficient method. They have further observed that the short time-line and the tight budgets make it difficult to
introduce new technologies on projects; it is costly to maintain trained CAD and IT personnel; and companies
that lag behind reduce the potential benefits of IT.
Dave and Koskela (2009) reported a case study for implementation of a web site for knowledge sharing within a
company. The company operates geographically dispersed workshops for maintaining machinery. Due to a lack
of sharing procedure, the knowledge for maintenance was not retained. Wiki, blog and internet forums were
considered for networking. With the proposed platform, all operators should have either direct or indirect access
to company's information systems. Users should be able to store rich content i.e. photo and drawings with the
posts. Forum software called phpBB (www.phpbb.com) was finally selected as the knowledge sharing platform
due to its market leading position, ease of use, active community development and support. For performance
evaluation criteria such as number of new topics started, numbers of posts per topic etc were suggested. The
objective of the project was considered successful because the solution provided a searchable knowledge
repository capturing both tacit and explicit knowledge and requiring minimal maintenance. It could not have
been done without application of web 2.0 technologies.
Nitithamyong, Skibniewski (2004) described research conducted on the identification of factors determining
success of web-based construction project management systems. The effectiveness of the services provided by
the application service providers is evaluated. They have reported that about 16% of the US firms in construction
trade avail the services of web based project management systems. The facilities offered by a number of service
providers are compared. A number of such service providers were consulted in connection with the development
of the web site for the present case study. Details about the study were reported by Guha (2007).
Chan and Leung (2004) proposed a metadata based information system for data exchange among web based
documents for construction project management. The system retrieves useful data from the original documents,
reorganizes the information according to specific tasks or users, and displays the information in an integrated
web page. There are five packages in the conceptual model, representing five important feature categories:
Document Management, Workflow Management, Team Communication, My Project Place, and Administrate
Project. The study bridges the gap between present and future development of the internet by exploring the
possibility of intelligent search as one direction for the development of a Web-based project management tool.
Such intelligent data exchange is a web 2.0 technology. It has been decided that the facility is not appropriate
for the present case which would be a first generation web collaboration system.
An Internet-based project management system called Total Information Transfer System has been developed by
Deng et al (2001). Major functions like file transfer; email, chat, internet video, remote data collection etc have
been planned. After consideration for the present project, it has been decided that chat, video etc would not be
feasible on account of cost and internet behavior of the participants. For file transfer required for drawings and
documents posting, service provider’s facilities have been used in the present case.
At University of Salford UK, WISPER which is a collaborative project management environment has been
developed Faraj et al (2000). This environment supports design, CAD, visualization, virtual reality, Drawing
Web Format (DWF), estimating, planning, specifications, supplier information and remote operations. It
provides flexibility and portability, thereby enabling construction professionals to contribute as well as to
perform and manage their own activities. After evaluating the issues for the present case, it was felt that the
designers would be reluctant to shift from their existing delivery models only for one site. The drafting and
technical system shall remain underutilized. The web system for the present case shall be kept very simple.

ITcon Vol. 15 (2010), Guha et al., pg. 89
Katranuschkov et al (2001) reported about a major research project for concurrent engineering sponsored by
European Framework Information Society. The goal was to develop an open collaboration platform where new
services and tools may be easily integrated and where providers of engineering information, services and tools
meet stakeholders. However, the main business goal was to hide the complexities and present the user with a
simple interface. In a similar research Hearn et al (2002) observed that the real challenge is to convince the
organizations that the additional effort for implementation would generate adequate benefit to the people in the
organization. It is decided that the system operation of the system shall be kept very simple.
Ahuja et al (2009) reported a survey comprising of 149 usable responses about adoption of IT for building
project management across India. The survey analysis showed that initial cost is not a barrier for larger firms and
they have higher adoption of IT. The IT adoption differs for three groups of sample organizations i.e. PM
consultants, builders and architectural organizations and decreases in this order. Comprehensive web based PM
solution had not been adopted by any of the respondents. It was found that only in about 3% of the surveyed
organizations, external or collaborative use of IT was more than the internal use of IT. Only about 1% of the
surveyed organizations partially adopted web based PM. Survey results categorize issues at three levels namely
industries, organizations and people and the issues identified are technical, managerial and people issues.
Scores of ‘off the shelf’ systems both open source and commercial, are available for web enabled project
management. A few of these were discussed by Guha (2007) in connection with the development of a PM web
space suitable for Kolkata, India. Alshawi and Ingirige (2003) also listed a few ‘off the shelf’ systems as sample
for web enabled project management. These systems cover a wide range of facilities and functionalities, which
have made these cost effective and efficient. Some of the software offer more comprehensive solutions for the
entire life cycle of the project including capability of performing the e-commerce function. Andresen et al (2003)
used a commercial ‘off the shelf’ system called Byggeweb (2009) for three projects in a Danish case study and
found that these were implemented too quickly, resulting in users losing patience and thereafter completing their
task using traditional means. The evaluation revealed that the project web did not produce a positive payback in
monetary terms but a number of non-economically measurable benefits were identified.
Rivard et al (2004) analyzed different types of web enabled PM systems in Canada including custom websites,
commercial portals and in-house systems and found that implementation is a difficult process both for financial
and technical reasons. Scheer et al (2007) studied the development of a customized web enabled PM system in
Brazil where the users did not have any prior experience with project extranet. They concluded that the
knowledge managers have to revise their design practices, technology and knowledge base for success of even
the customized system. The key differences between ‘Off the shelf’ and customized software are three folds
namely cost, generic build and updates. ‘Off the shelf’ system is generally economical and very sophisticated
but generic build. Customized systems are costly but can be tailor made for the client’s business model and field
issues can be responded through updates. Even the hybrid approach that builds up a customized system from
numbers of previously used ‘Off the shelf’ modules may encounter substantial hindrances. Practicing
professionals like (Krishnamurthy 2008) and (Murthy 2008) felt that each approach has its merits and problems.
These case studies spanning across continents consistently indicate that design management for construction
through collaborative web spaces is at present an effective means of control for the construction industry in most
economies. However, the implementation and technology adoption demands thorough preparation for success
both for ‘off the shelf’ and customized systems. The system must be simple, economical and extremely user
friendly for successful implementation and client acceptance. It is particularly applicable for an emerging market
with tight budgets like in India. Therefore it was decided that a web space having such characteristics shall be
installed for the present case for design and construction management in Kolkata, India. The system was
customized with open source software for cost control. Popular brands like PhpBB, B2evolution, dot project etc
were used with a hope that the system would remain user friendly. It was further decided that the response of the
users would be also studied for improvements in future editions.
3. METHODS
Posts to the web site forum are studied in different ways to investigate the users’ responses in the proposed PM
solution. A poll among the users is also conducted to map the opinion of the participants about the system.
Since web enabled design collaboration is relatively new in Kolkata interviews for survey among the
professionals has been conducted and results of another survey (Guha 2007) has been consulted to assess the
awareness and acceptability of the concept during installation of the forum in the website.

ITcon Vol. 15 (2010), Guha et al., pg. 90
The characteristics of the posts in the forum are studied in different ways namely sociogram, sociometry, post
analysis and social network analysis (SNA). Each of the methods is briefly presented. Sociograms are maps of
informal networks of relationships, displaying the connections between people based on specific criteria. It is a
scheme for structural analysis of a networked community (Freeman 2000). The degree of involvement of the
actors in the community can be traced in sociogram. In this case, the key actors for the web enabled team are
identified based on the forum postings. Sociometry is a quantitative measure for interpersonal relationships in a
networked community. All groups have intricate networks, based on both short and long term interactions.
Even the network comprising of professionals assembled for a task like in the present case reflect alliances,
agendas, sub systems, sub groups and isolates gathering around identifiable individuals based on their
knowledge experiences and powers. It is hypothesized that similar traces can be identified from the forum posts.
Sociometry has methods for displaying interpersonal choices, attractions and rejections and assists in exploring
relationship dynamics. Sociometic analysis has been conducted to explore the group dynamics of the
collaboration team.
Forum posts analysis of the collaboration forum reveals its statistical characteristics which can be compared with
other similar forums and performances of these can be compared. Kaltenbrunner (2009) found that users
systematically invest more time in certain discussions. It is the topic of the conversation, not the characteristics
of those participating that keeps users interested for a topic. E-mail communication as shown in FIG 3 is agent
based where as forum communication presented in Table 4 is topic based. In a forum, the focus is on the posts
and analysis of it becomes more important (Malsch et al 2004). For a properly functional forum the probability
density of the posts should match with that of similar forums. The probability density of the posts have been
estimated and compared with similar study in literature.
A social network is a set of actors that have relationships with one another. Networks have many actors, and
multiple kinds of relations between pairs of actors. SNA is a further development of sociometry. Sociometrists
explore and measure informal networks of relationships. Often they work in situ with groups. Their intention is
individual and group development through increased spontaneity (Jones 2009). The present day SNA on the
other hand tends to regard the relationship strengths as stochastic and is targeted to deal with large unseen
relationships that often takes place in the internet. Cross et al (2009) found SNA a valuable means for strategic
collaboration. Park et al (2009) used SNA for investigating collaborations of Korean construction firms in
international contracts. Howard and Petersen (2001) used SNA for analyzing the management team of a Dutch
housing project. For the manipulation of network data, it is most useful in SNA to record information as
matrices. For visualizing patterns, graphs are often useful (Hanneman and Riddle 2005). Several software are
available for SNA. In this case, visone (Brandes & Wagner 2004), an open source software is used. The indices
used in the software for describing the network are presented by Baur (2008).
These methods namely socigram, sociometric analysis, forum post analysis and SNA are simultaneously applied
to the internet forum to record the characteristics of the collaboration network in a comprehensive manner for
future comparison. In addition, a poll has been conducted among the design team members for assessing the
opinion of the members about the collaboration system. A factor analysis is applied as a data structure detection
method. The aim of factor analysis is to explain the outcome of many variables in the data matrix using fewer
variables, the so-called factors (Härdle and Léopold 2007). Combining two or more correlated variables into one
factor, is the basic idea of factor analysis. Computationally, it is done by a variance maximizing (varimax)
rotation of the original variable space and the variances extracted by the factors are called eigenvalues (Statsoft
2009). The factor analysis has been conducted on the poll results to reduce the opinions to a few key issues.
The selection of numbers of the reduced factors is a matter of judgment. However, guidelines like criterion
proposed by Kaiser (1970) and scree test proposed by Cattell (1966) both of which are frequently used by the
analysts have been applied to reduce to key factors. The key opinions are then mapped in a radar diagram
(Schultz 2002) to obtain an insight about the opinions of the users. Radar diagram is a combined polar plot of
multiple variables of a data set sometimes used to aid identification of composite performance measure elements
needing improvement. Mohamed and Stewart (2002) and Obonyo and Wu (2008) also used radar diagrams to
present the choices of the participants in construction issues.
4. CASE BACKGROUND
The literature review indicated that level of acceptance of IT in construction management would depend among
other factors upon the existing technology status. The existing technology status in Kolkata, India is therefore
studied. The adoption of IT in any industry in a developing economy is susceptible to myriad hindrances. The
construction industry is resistant to changes in IT based design collaboration even in a developed economy

ITcon Vol. 15 (2010), Guha et al., pg. 91
(Brandon 2009). The issues about technology adoption are studied in this section. The scope of the present
research could thereafter be developed and is also presented here.
4.1 Technology Status
Rapid development of internet technology allowed business firms to communicate in an efficient manner. In case
of Indian architectural, engineering and construction (AEC) firms, communication by e-mails has become
standard and file transfer sites are used for transferring larger files like drawings. Successful completion of
projects would demand collaboration of many and often geographically separated team members. Numerous e-
mails would be inefficient because of duplications. Some stakeholders might still miss the required information
in time. Dedicated web sites that are open to review by all stakeholders are a better method to manage project
specific knowledge. In a developing country like Nigeria, Olukayode and Odusami (2005) studied about the use
of IT in quantity survey and found that users are conservative in adopting IT but cost is the most inhibiting factor
for IT use. Issa et al (2003) studied about spread of e-business in construction industry. They found that US
construction industry is actually receptive to internet technologies and are not unwilling to implement suitable
systems but conservative and careful to adopt new technologies.
Becerik (2004) presented a chart showing the AEC Industry’s adoption cycles for different technologies which is
reproduced at Fig 1 and shown in black lines. The chart is further extrapolated for Indian condition and shown
in blue. In Fig 1, Becerik found that about fifty percent of the AEC firms’ drawings in US are generated in 2D
CAD by 1985. Same situation has been more or less arrived in India by 2005 and is presented in Fig 1. Based
on the 2D CAD status the graphs for other technologies like 3 & 4 D CAD, Construction project Extranet (CPE)
etc have been shifted to the same degree to extrapolate the Indian scenario in Fig 1. It indicates that web enabled
collaboration or CPE is about to start in India in about 2010 and would spread in next five years. The present
application is therefore consistent with the predicted technology adoption cycle.
FIG. 1: AEC Industry’s adoption cycles for different technologies
In 2006, interviews were conducted with the managers of several leading firms in construction trade in Kolkata,
India. The role of IT in their respective firms was discussed. The branches of national level firms were only
surveyed. Information derived from the survey is presented in the Table1. It has been found that national level
firms extensively use computers for drafting and scheduling. However, none of the industry leaders used any
web based collaboration system or BIM for projects managed from their Kolkata office. Software vendors like
resellers of Autodesk, Primavera and Microsoft in Kolkata were contacted but they could not provide
information about any users of Buzzsaw, Primavera Project Portfolio or Microsoft Project Server in Kolkata.
TABLE 1: Evolution of web based communication and its application in the case study
Business
Type
Nos.
Surv-
eyed
Type of software use
Drafting Scheduling Collaboration BIM
Developer 3 No manual
drafting
Commercial
software
Emails are
only used
No
Consultant 3 -Do- -Do- -Do- No
Contractors 4 Occasional
manual drafting
-Do- -Do- No
In Kolkata, the construction industry stakeholders mostly used paper based tools for their routine PM work. A
survey was conducted among construction managers in Kolkata in 2006. About twenty senior professionals of

ITcon Vol. 15 (2010), Guha et al., pg. 92
different construction firms were interviewed. The queries were intended to assess the current level of IT
application in PM. The result of the survey (Guha 2007) is presented in Fig 2. Forty six percent of the managers
opine that the existing PM reports are helpful. Only fifteen percent are aware about the commercial websites
providing services in PM but about sixty five percent feel that such system would be helpful.
FIG. 2: Levels of IT application for PM in Kolkata, India
The proposed web enabled collaboration seems to be one of the first such operations in Kolkata. None of the
stakeholders had any prior experience in such system. Interviews among stakeholders revealed that majority of
the participants were above thirty five years of age and did not have any IT curriculum in their education. The
stakeholders now use e-mails routinely but have almost no prior experience in social networking like forums and
blogs. The web enabled collaboration system was not specified in terms of reference to the consultants and the
use was on a voluntary basis. Resistance and apathy was expected from the stakeholders. Records about
implementation were therefore maintained for future study.
First generation CPE applications have to be simple in any country. In one of the older survey (Howard et al
1998) in Scandinavia, internet use for PM was measured but project specific website was not even separately
mentioned. In a later survey (Samuelson 2008), it was stated that use of project web started by 2000. In 2001,
Katranuschkov et al (2001) commented that internet was only recently used for collaboration and mentioned
about rented web spaces like Bricsnet, Buzzsaw and Citadon. Project specific websites were only loosely
structured till such time. The present situation in Kolkata, India is comparable to such period. The proposed first
generation web enabled system is loosely structured compared to that of the matured systems now in use in the
developed economy.
The present trend of the web is towards collaboration. O’Reilly (2004) coined the word web 2.0 to distinguish it
from the first generation web service. The main feature of web 2.0 is that the users modify the web content.
Klinc et al (2009) commented that social network services like blogs, wiki, RSS etc that are available in web 2.0
is very important because users could see only the information that are important to them. Additional details
about web 2.0 technology available in the present case are presented in Table3.
Alshawi and Ingirige (2003) presented five case studies with the main benefits for each case. These cases are
compared with the present case study in Table 2. In most cases, time and cost were saved by electronic delivery
of drawings and documents. In the present case, stakeholders did not agree to discard hard copy documents while
using an introductory system. The cost on this account could not be saved. However, other benefits like remote
progress monitoring saved cost and time of the stakeholders.
TABLE 2: Comparison with the case studies reported by Alshawi and Ingiride
Project &
System
Brief
Description
Main
Benefits
Comparison with
our case study
INMANCO
(Building Informa
- tion Ware house
system was used).
This case is concerned
with an electronic
document management
system through the web.
Cost savings through
electronic document
management avoiding hard
copy
For important
documents a follow
up hard copy was still
required
ALCOA
(Custom built
solutions were
used)
The objective was to make
world wide connectivity
so that the team could
collaborate.
Elimination of paper reports
as information was sent on
electronic form via the web.
Similar to ALCOA

ITcon Vol. 15 (2010), Guha et al., pg. 93
CATHQUARTER
(‘ProjectsOnline’
system was used)
The project involved
collaboration between a
Dublin based architect and
a Northern Ireland
engineering group
Any member can access or
submit drawings,
documents, etc., and view
all project information on
one secure location.
Widely separated
stakeholders could
follow the progress
from their home
office.
TITS
(Linux and
Windows was
used)
The objective is to transfer
information between head
office and its overseas
construction.
Speedy delivery and savings
on communication by
reducing IDD phone calls
and courier services.
Separate accounting
was not maintained
so the benefits can
not be ascertained
3COM
(3COM provided
software lotus
notes were used)
Drawings were issued
electronically. Approvals
and confirmations were
also accepted
Due to speedy delivery the
group was able to save
about six weeks and a
million British pounds.
Participants were not
yet prepared to do
away with the hard
copy drawings.
4.1 Technology Adoption
A few theoretical researches about technology adoption have been consulted to obtain an insight of the issues.
Gallivan (2001) proposed a hybrid model for innovation adoption with a view to improve the traditional
framework. He suggested a model that can explain the interplay among organizational context variables and
other characteristics that, in aggregate, shape assimilation processes. The study describes the implementation of a
client-server technology and helps to fill in the gaps that intervene between managerial goal-setting for an
innovation and evaluation of its benefits by examining the processes that link objectives with outcomes.
Venkatesh et al (2003) compared the performances of eight IT acceptance models in four organizations over a
six month period and found that the models could explain only between 17 to 53 percent of the variance in user
intentions to use IT. They proposed a unified model with an adjusted R2 of about 70 percent. O’Brien (2000)
argued that the implementation and sociological issues associated with project web sites should be addressed for
making it successful communication vehicles. He felt that planning about how individuals should use the tools in
a project web space requires due attention.
Mitropoulos and Tatum (1999) examined how contractors make decisions to adopt a new technology. The study
focused on eight cases of adoption of electronic document management (EDM) and 3D computer-aided design
systems. The paper summarizes the findings and the recommendations focus on the strategies that managers can
use to increase the likelihood of successful adoption of new technologies. Howard and Petersen (2001) studied a
Dutch government housing project since 1995. They concluded that the level of IT use was not up to the plan but
new technologies including project webs have emerged during the process.
Björk (2002) studied the introduction of EDM technology in the construction industry mainly for the developed
economies. He found that the barriers for rapid introduction of EDM in construction can be classified into
technical, behavioral, cost-related, organizational and legal aspects. In the present case, the behavioral barriers
that people resist to change their way of work seems to be particularly relevant. This has necessitated for
measuring the usage of the web space as proposed in this study. Hjelt and Björk (2007) investigated attitudes
toward EDM from the perspective of individual end-users based on a survey and usage log files of the total
population of over 300 users. The detailed version of the study has been presented by Hjelt (2006). The proposed
model shows that adoption factors are influenced both by the service quality and by end-users. The individual’s
involvement in the information process is a key factor. The model highlights that end-users are subjected to
social influences not only from PM but also from their organizations.
Sulankivi (2004) investigated project specific website for multi partner projects and found significant qualitative
benefits can be achieved. The web space makes it possible to change the traditional information flow radically
improving it during the design and construction stages. The enhanced information flow simplifies daily routines
and allows to work as one team. In addition, quantitative benefits like time and cost reduction is also achieved.
The IT-Barometer, a comprehensive survey for IT application in construction was carried out in 2007 in Sweden
and Finland, as a follow-up to the 1998 and 2000 surveys (Samuelson 2008). The survey was based on
questionnaire from the whole country, divided into all stakeholders. The use of project webs and electronic trade
already started at the time of the survey in 2000 is now widespread in 2007.

ITcon Vol. 15 (2010), Guha et al., pg. 94
4.1 Scope of study
After literature review and background studies it is recognized that successful deployment of a web enabled
design management system would depend on key factors like users’ acceptance and cost. A paradigm shift in
work flow model of the consultants is also required for success of such systems. These changes would not come
in a single project. The consultant community as a group would progressively look for web collaboration only if
they find it economical, convenient and effective. The web system designer should therefore be sensitive about
the continued usage of the installed system to respond to the stakeholders’ requirements in time. This study is
intended for a quantitative measure of such use of the web system in objective manner. For such research
objectives, the scope of the study includes the following:
i) Identifying the key members and the degree of participation of the stakeholders with the help of sociograms.
ii) Group behaviors of the stakeholders and individual’s satisfaction from sociometric analysis.
iii) Forum posts analysis for investigation of its statistical characteristics for objective comparisons.
iv) A SNA for rigorous measurement of the interrelationship among the stakeholders.
v) An opinion poll among the participants and a factor analysis for the key factors of satisfaction.
5. CASE DESCRIPTION
At the project commencement, client’s project manager requested stakeholders to mark a copy of all e-mails to
the architect’s coordinator. The communication pattern has been collected from emails marked to the
coordinator for the first two months and is presented in FIG 3. This web collaboration system was started after
about first two months of the commencement of the project. An organizational chart showing each participating
member with their respective ID in parenthesis is presented in the FIG 4. In total, twenty four members
participated in the internet forum. The consulting architect viewed the web service but communicated separately
only with the architect on record. They have not been included in this network. At the start, the architect (ID 08)
and later the PMC (ID 15) acted as coordinators. The coordinators are highlighted in FIG: 4. The internet forum
was created within a web site (www.sssolutionsonline.com). A restricted web space within the web site that can
be accessed with a password issued by the coordinator contained periodic PM reports uploaded by the PMC.
These reports are either in static web pages or in portable document files (pdf). In addition, collaboration
facilities of web 2.0 like blogs, forums and wikis are provided within the restricted space as shown in Table 3.
TABLE 3: Evolution of web based communication and its application in the case study
Communication Mode Technology Present application Developer
Blogs Web 2.0 Included b2evolution
Bulletin board Web 1.0 Included
Chat rooms Web 1.0 Not available
Discussion forums Web 1.0 Included Php bb
Instant messaging Web 1.0 Not available
Really Simple Syndication
(RSS)
Web 2.0 Not available
Static web page Web 1.0 Included
Web conferencing Web 1.0 Not available
Wikis Web 2.0 Included wikipedia

ITcon Vol. 15 (2010), Guha et al., pg. 95
FIG. 3:E-mail communication pattern among stake holders
FIG. 4: Organizational charts showing the participants
The first ten topics that the stakeholders discussed in the internet forum are presented in Table 4 as samples. A
schematic view of the web site facilities are presented in FIG. 5. The PMC monitored the progress and prepared
the formal reports for tasks, schedules etc. Industry standard software like Microsoft Project was used for work
plan and progress monitoring. The formal reports were uploaded fortnightly in the website. The fortnightly
report generated in a standardized format was used as a progress monitoring tool by the stake holders. The
participating consultants were made aware about their progress performance with respect to their earlier
commitments. More importantly, the consultants could see the progress of other teams and could anticipate the
time in advance for their required inputs.
Table 4 Sample Topic Descriptions

ITcon Vol. 15 (2010), Guha et al., pg. 96
Topic Brief description Topic Owner Posts From To
01 Soil survey for building plan sanction Architect Coordinator(8) 5 05/04/06 05/07/06
02 Environmental Impact Statement Architect Coordinator (8) 10 05/07/06 05/25/06
03 Fire water tank size requirement Architect Coordinator (8) 7 5/10/06 5/14/06
04 Plant room location Architect Coordinator (8) 18 06/02/06 6/30/06
05 Existing transformer room Process Consultant(16) 16 06/01/06 06/14/06
06 Floor Space Index Estimate Architect Coordinator (8) 8 06/12/06 06/20/06
07 Proposed layout of services Process Consultant (16) 36 07/10/06 08/6/06
08 Structural audit of existing building PMC (15) 23 05/10/06 06/20/06
09 Structural load requirements Struct. Consultant (9) 5 06/23/06 07/14/06
10 Service area requirements Architect Coordinator (8) 2 06/24/06 07/16/06
FIG. 5: Schematic view of the website (www.sssolutionsonline.com) components
6. RESULTS
The success of the proposed web space mainly depended upon the users’ reactions and is investigated in this
section. Several methods like sociogram, post analysis, social network analysis and opinion poll have been used
to investigate the users’ response. A sociogram has been derived for finding the topic owners that have been
responded well. Statistics of the responses in the forum have been analyzed for estimating the probability
distribution of posts for future comparison with similar forums. A goodness of fit has been estimated to obtain an
insight about the findings. A social network analysis has been presented for investigating the internet behaviors
of the design team members. After about six months of installation of the system, an opinion poll was conducted
among the users. A factor analysis of the opinion poll has been performed and their opinions were mapped for
improvements in future editions of the web space.
6.1 Sociogram and sociometry
The discussion forum in the website was used by a number of stakeholders to clarify technical queries. The
summary of the first ten items in the discussion forum is presented in Table 4. The communication pattern in
FIG 3 and the organization chart in FIG 4 do not indicate about the degree of collaboration that has taken place
among the forum participants.
Scientists sometimes use sociograms to identify the important individuals in a group. Moreno first introduced the
concept in 1934 Marineau (1989). Northway (1940) originally proposed a target sociogram similar to FIG. 6.
Andresen et al (2003) created sociograms similar to FIG. 6 for displaying the volume of communication of
stakeholders in a web enabled PM system. In FIG. 6, each nested concentric circle represents a frequency at
which the posts are made. Points in the central circle are more central in the sense that they were chosen more
often. Points at the edge were chosen less often. The lines connecting them represent the primary links of forum
posts between stakeholders. The activities for the first three months of the forum participants represented by their
IDs shown in FIG.4 are presented in FIG. 6. The target socigram is prepared by an application from Adit
Software (2009). The posts of PMC (ID15), architect (ID8) and process consultants (ID16) are more popular in

ITcon Vol. 15 (2010), Guha et al., pg. 97
the forum. ID7 (Accountant) was a viewer but did not post any message and is not connected with any link
lines. ID15 (PMC) was found to be the most important member of the forum which was expected anyway.
However, owner’s managers represented by IDs 1 through 7 who were expected to participate and take lead role
in the forum did not use the facility extensively.
There are a number of indexes in Moreno’s analysis that provide the sociometric status of a group. Postings in
the forum were analyzed in Sociometric Pro (2009) software where the index definitions are available. The
indexes are presented in FIG. 6. It may be noted that in FIG. 6 the group indexes are increasing with time. It
indicates that the activities in the forum are increasing gradually. Private indexes of important forum participants
highlighted in FIG. 6 are also presented. The performance of individuals at a given time can be traced. The
indexes can be used to compare the collaboration performance with similar forums or with this forum in future.
FIG. 6: Sociogram and indexes of the forum posts
6.2 Forum posts analysis
Morzy (2009) proposed a data mining model of the internet forums. Forums or discussion boards have become
the leading form of peer communication. A statistical analysis of an internet forum consists of identifying basic
statistics on topics and posts to map activity, controversy, popularity etc. The analysis of these basic statistics
would provide insight into the characteristics of the network. The first such statistic is the distribution of the
number of posts per topic. In common forums, many of the topics contain a single post. This is either a question
that has never been answered, or a post that did not spark any discussion. In this forum, users are obligated

ITcon Vol. 15 (2010), Guha et al., pg. 98
under a contract with the project sponsors. Therefore users have responded to their relevant assignments and the
topics have multiple posts. Morzy (2009) pointed out that the flat architectures, such as PhpBB, where each post
is a direct answer to the previous posts; do not allow to create deeply threaded discussions. In this website, the
forum is powered by PhpBB. However, the forum is mainly used for clarifications and sustained postings on a
particular topic are not expected. The probability distributions of the posts are investigated. Morzy (2009)
suggested that the posts should follow the Pareto distribution. The Pareto distribution shows exponentially
diminishing probability f(x) of a random variable X to take larger values x. It is often used for representing
distributions of national wealth where a small number of population controls bigger share of wealth. Anderson
(2006) first adopted the same of idea of Pareto distribution to e-commerce and web analysis. He argued that the
dominant 20% of products is favored by the market over the remaining 80% of products (called long tail).
However, the tail part is stronger and bigger in internet than in traditional markets. Internet shops like Amazon
realize their profits within the so called long tail primarily because of their low inventory cost. Morzy (2009)
argued that the same principle holds true for internet forums as well.
FIG. 7: Probability distributions of the posts
TABLE 5: Goodness of fit estimation
Gen. Pareto Distribution Geometric Distribution
Sample: 40 , Statistics: 0.22671 , Rank: 4 Sample: 40 , Statistics: 0.188 , Rank: 3
Kolmogorov-Smirnov Kolmogorov-Smirnov
α 0.2 0.15 0.1 0.05 0.01 0.2 0.15 0.1 0.05 0.01
Critical 0.169 0.180 0.192 0.215 0.257 0.233 0.248 0.266 0.296 0.355
Reject? No No No No No No No No No No
Anderson-Darling Anderson-Darling
Sample: 40 , Statistics: 4.0161 , Rank: 35 Sample: 40 , Statistics: 1.469 , Rank: 1
α 0.2 0.15 0.1 0.05 0.01 0.2 0.15 0.1 0.05 0.01
Critical 1.374 1.602 1.928 2.501 3.907 1.374 1.602 1.928 2.501 3.907
Reject? Yes Yes Yes Yes Yes Yes Yes Yes Yes Yes
The goodness of fit of the probability distributions of the posts is estimated both in Kolmogorov-Smirnov (K-S)
and Anderson-Darling (A-D) methods and is presented in Table 5. ‘Easy Fit’ software has been used for the
results presented in Table 5. The posts have been tested with general Pareto distribution in line with observation
by Anderson (2006). The software compared it with about forty other distributions available in the software and
ranks it in serial 4 as estimated by Kolmogorov-Smirnov method. However, the results estimated by Anderson-
Darling method are not similarly good. It seems geometric probability distributions also fits reasonably well for
the data as shown in Table 5. These results could be used for comparison with similar cases.

ITcon Vol. 15 (2010), Guha et al., pg. 99
6.3 Social Network
FIG 8: Social network diagram of the users’ forum
TABLE 6 : Social Network Analysis Metrics of the Forum Responses
ID User Between-
Ness (%)
Close-
ness (%)
Clustering
Coeff. (%)
Degree
(%)
Eccentricity
(%)
Eigenvector
(%)
1 Civ Lev 1(A) 1.1982 4.3740 0.4 2.4725 3.4482 2.0383
2 Civ Lev 2(A) 1.5709 4.3740 0.8333 1.3736 5.1724 1.5709
3 Civ Lev 2(B) 1.5496 4.3740 0.6666 1.6483 5.1724 1.5494
4 Civ Lev 1(B) 0.0717 4.3740 0.8333 2.4725 5.1724 2.9202
5 Ele Lev 1(A) 0.0 3.7225 1.0 0.5494 3.4482 0.4395
6 Acc Lev 1(A) 0.3831 3.499 1.0 0.2747 3.4482 0.3831
7 Acc Lev 1(B) 0.0 0.0 0.0 0.0 0.0 0.0
8 Arc Lev 2(A) 23.3928 6.033 0.2476 25.0000 5.1724 27.8185
9 Str Lev 2(A) 4.3374 4.7286 0.4761 8.5164 5.1724 7.1664
10 San Lev 1 0.0 3.8880 1.0 2.1978 2.1978 3.0583
11 Ele Lev 1 0.0 4.2673 1.0 1.9230 5.1724 2.5153
12 Ele Lev 2(A) 0.0 4.2673 1.0 1.6483 5.1724 2.1321
13 Hvac Lev 1 0.0 4.2673 1.0 2.1978 5.1724 3.0619
14 Ele Lev 1(A) 0.0 4.2673 1.0 1.9230 5.1724 3.0038
15 PMC 34.5178 6.0331 0.19047 19.5054 5.1724 19.5657
16 Proc Consult 36.3396 6.7292 0.1895 17.3076 5.1724 11.2208
17 Civ Lev 1(A) 0.0 3.9763 1.0 1.6483 3.4482 1.4054
18 Civ Lev 2(A) 0.0179 3.6450 0.0 0.5494 3.4482 0.4231
19 Civ Lev 3 (A) 0.0883 4.3740 0.6666 1.6483 5.1724 1.5496
20 Civ Lev 2(B) 0.0 3.6450 1.0 0.8241 3.4482 0.8255
21 Civ Lev 3 (A) 0.0 3.9763 1.0 3.8461 3.4482 3.9756
22 Ele Lev 1(A) 0.0 4.2673 1.0 1.9230 5.1724 2.6769
23 Hvac Inchar 0.0 3.7225 1.0 0.5494 3.4482 0.4395
24 Mec Lev 1(A) 0.0 4.0688 1.0 1.0989 3.4482 1.0424
A social network diagram of the postings in the forum is presented in FIG. 8. The IDs of the stakeholders used
in FIG 4 are shown in the network analysis in Figure 8 and color coded based on the activity level. The
characteristics of a network are analyzed with graph theory (Hanneman 2005). Various characteristics of the

ITcon Vol. 15 (2010), Guha et al., pg. 100
network based on the graph theory were estimated with the help of ‘visone’ (Baur 2008) software system and are
reported in Table 6. These characteristics describe the attributes of the members in quantitative terms with
relation to social network of the forum as of a particular date. Difference of attributes between the two
stakeholders would show the individual position of the member in this social network.
For example, the architect (ID:8) and the PMC (ID 15) has a betweeness of 23.3928 and 34.5178 respectively
which indicates that PMC is more central to the network in the sense more topics and responses have been
exchanged by the PMC. However, the Eigenvector of the architect (ID 8) and the PMC (ID 15) are 27.8185 and
19.5657 respectively. It broadly indicates that more stakeholders responded to architect’s topic. In practice, it
should be true during design development phase when the architect plays the most important role. PMC’s role
will increase after design development and during coordination stage. As a result, the Eigenvector of the PM
Consultant would possibly change with time. The FIG. 8 and Table 6 show that network is well connected and
has no structural holes. There is less chances of communication failure. Such insight about the network is
available from the SNA of the case study. The network attributes may also be compared to a similar forum or
with this forum in future for investigating the social networking behaviors in the project management forum.
6.4 Factor Analysis
Serafeimidis and Smithson (2000) commented that information system evaluation is a difficult problem in both
theory and practice. They observed that organizations are adopting more entrepreneurial approach for IT system
evaluation. In a case study, they found that failure of an IT system for a utility firm was mainly due to the
resistance to organizational change. In the present case similar resistance like insistence for hardcopy drawings
was found. Ballantine and Stray (1999) reported that the extent of evaluation depends on organizational factors
such as project cost, organization’s turnover etc. They also found that IT investment is essentially evaluated like
other investments of the firm. Economic and quantitative measures for the success of Information Systems are
difficult to obtain Sarrinen (1996). Practitioners relied on subjective assessments. He proposed for a direct
assessment similar to cost-benefit analysis. For performance evaluation of a web enabled MIS, Mohamed and
Stewart (2002) developed a questionnaire categorized into five distinct perspectives namely operation, benefit,
user orientation, strategic competitiveness and technology.
TABLE 7: Summary of the opinion poll
No Questions Mean Standard Dev.
01 Reduced response time to answer queries 4.5000 0.5898
02 Enhanced coordination among stakeholders 4.6667 0.4815
03 Helped updating the records 4.0833 0.7173
04 Enabled immediate feedback 4.2917 0.6241
05 Facilitated document transfer 3.6667 0.8681
06 Helped for design improvements 4.3333 0.6370
07 Enabled cost savings in design 3.5000 0.5898
08 Decreased design errors 4.0833 0.7173
09 Led to satisfied stakeholders 4.3333 0.5647
10 Decreased request for information 4.2083 0.6580
11 User friendly system 4.2083 0.8330
12 Secured against unauthorized use 3.4583 0.8330
13 Suitable for use in Indian projects 4.6667 0.4815
14 Reliable throughout the use 4.0000 0.6594
15 Enhanced user’s image in industry 3.7083 0.6241
16 Helps to attract sophisticated clients 3.6667 0.7020
17 Increased capacity for remote management 4.4167 0.7173
18 The system’s overall performance 4.3333 0.5647
19 Arrangement of training 3.5000 0.7223
20 Increased accuracy in reports 3.7917 0.6580
A similar questionnaire has been prepared and the survey was carried out among the 24 project participants. A
Likert-type scale ranging from 1 = “low/strongly disagree” to 5 = “high/strongly agree” was used to assess the
responses. The mean ratings and standard deviation for the responses are summarized in Table 7. Higher mean
values suggest higher degree of IT-induced performance improvement for the concerned item.
A principal component analysis followed by a varimax rotation carried out on 20 items mentioned in Table 7
using SPSS for determining the underlying factors of IT performance. The initial analysis was run following the
Kaiser’s criterion of retaining the components with eigenvalues greater than one. The Kaiser’s criterion seemed
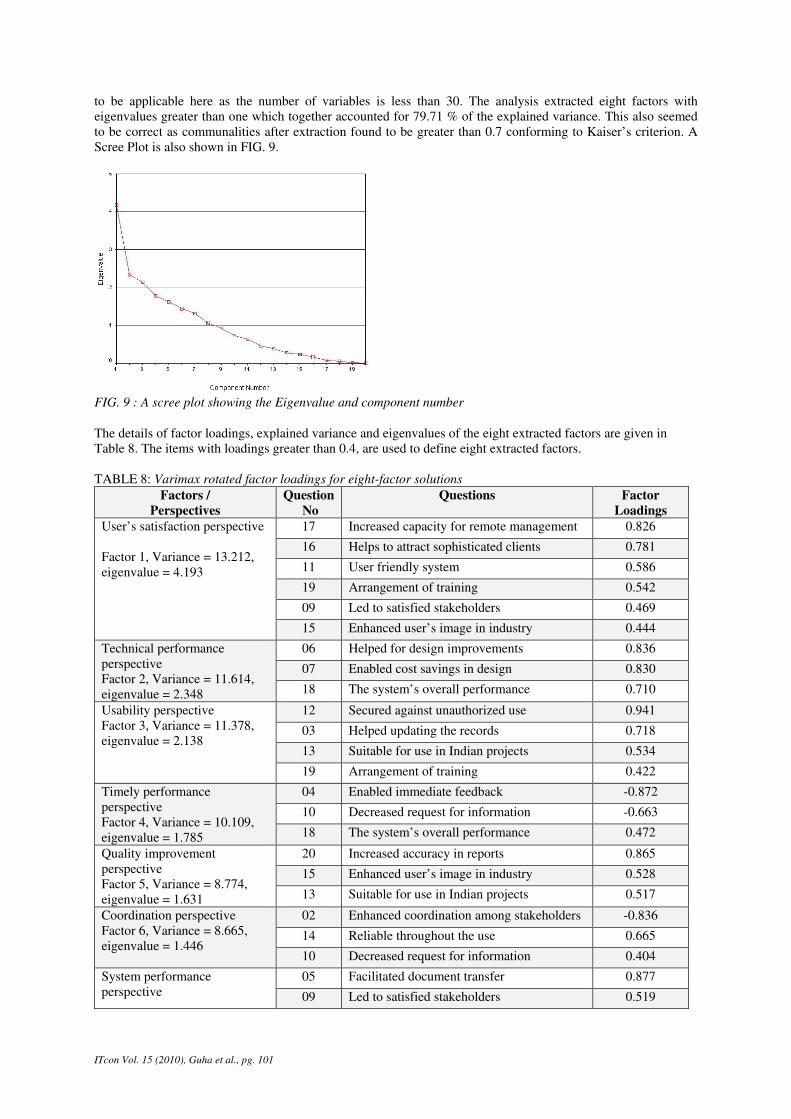
ITcon Vol. 15 (2010), Guha et al., pg. 101
to be applicable here as the number of variables is less than 30. The analysis extracted eight factors with
eigenvalues greater than one which together accounted for 79.71 % of the explained variance. This also seemed
to be correct as communalities after extraction found to be greater than 0.7 conforming to Kaiser’s criterion. A
Scree Plot is also shown in FIG. 9.
FIG. 9 : A scree plot showing the Eigenvalue and component number
The details of factor loadings, explained variance and eigenvalues of the eight extracted factors are given in
Table 8. The items with loadings greater than 0.4, are used to define eight extracted factors.
TABLE 8: Varimax rotated factor loadings for eight-factor solutions
Factors /
Perspectives
Question
No
Questions Factor
Loadings
User’s satisfaction perspective
Factor 1, Variance = 13.212,
eigenvalue = 4.193
17 Increased capacity for remote management 0.826
16 Helps to attract sophisticated clients 0.781
11 User friendly system 0.586
19 Arrangement of training 0.542
09 Led to satisfied stakeholders 0.469
15 Enhanced user’s image in industry 0.444
Technical performance
perspective
Factor 2, Variance = 11.614,
eigenvalue = 2.348
06 Helped for design improvements 0.836
07 Enabled cost savings in design 0.830
18 The system’s overall performance 0.710
Usability perspective
Factor 3, Variance = 11.378,
eigenvalue = 2.138
12 Secured against unauthorized use 0.941
03 Helped updating the records 0.718
13 Suitable for use in Indian projects 0.534
19 Arrangement of training 0.422
Timely performance
perspective
Factor 4, Variance = 10.109,
eigenvalue = 1.785
04 Enabled immediate feedback -0.872
10 Decreased request for information -0.663
18 The system’s overall performance 0.472
Quality improvement
perspective
Factor 5, Variance = 8.774,
eigenvalue = 1.631
20 Increased accuracy in reports 0.865
15 Enhanced user’s image in industry 0.528
13 Suitable for use in Indian projects 0.517
Coordination perspective
Factor 6, Variance = 8.665,
eigenvalue = 1.446
02 Enhanced coordination among stakeholders -0.836
14 Reliable throughout the use 0.665
10 Decreased request for information 0.404
System performance
perspective
05 Facilitated document transfer 0.877
09 Led to satisfied stakeholders 0.519

ITcon Vol. 15 (2010), Guha et al., pg. 102
Factor 7, Variance = 8.117,
eigenvalue = 1.325
11 User friendly system 0.461
19 Arrangement of training -0.428
Benefit perspective
Factor 8, Variance = 7.837,
eigenvalue = 1.075
01 Reduced response time to answer queries 0.893
08 Decreased design errors -0.635
To understand the user’s perception on the web enabled MIS, an overall score of each extracted factor defined on
a scale from 0 to 100% is calculated based on the mean scores for each item related to that factor as shown in
Table 8. There are a few items which has factor loading greater than 0.4 for more than on factor. They are
considered under that factor for which their loading is maximum while calculating the factor’s overall score.
For example, the overall score for the first factor is calculated by the summation of mean scores for items D3,
D2, C1 and E2 divided by the total possible maximum score of these four indicators i.e. (4.42 + 3.67 + 4.21 +
3.50)/(4X5) = 0.7896 = 78.96%. B3 and D1 are excluded from the calculation of performance score of Factor 1
as they have higher loadings in other factors. Each factor’s overall score was plotted on a radar diagram as
shown in Figure 10. Scores for the eight extracted factors are as follows: Factor 1: 78.96%, Factor 2: 81.11%,
Factor 3: 81.39%, Factor 4: 85.00%, Factor 5: 75.00%, Factor 6: 86.67%, Factor 7: 80.00%, Factor 8: 85.80%.
Each factors are weighted equally in contributing to the overall performance of the web based MIS and the
overall score is estimated to be 81.74%.
FIG. 10: Radar diagram showing average score of each extracted factors
The radar diagram in FIG. 10 reflects areas where organizational efforts are required to improve the utilization of
the web based MIS, under investigation, to its maximum potential. The IT induced improvement is most
pronounced for Factor 6, i.e. coordination perspective. For the quality improvement perspective i.e. Factor 5 the
IT induced performance improvement is found to be the least where organizational attention is necessary.
7. DISCUSSION
The study provides an insight about the means of improvement of the design collaboration system in a
developing economy like India. Project specific website is not yet a common practice in India as evidenced from
Ahuja et al (2009). They did not find any web based comprehensive project management solution in small and
medium enterprises in a country wide survey. The sample survey conducted in Kolkata in 2006 and presented in
Table 1 could not locate any project specific web address maintained from Kolkata. It further reinforced the
findings of Ahuja et al (2009) on the local level. The findings are also in conformity with FIG 1 which is an
extrapolation of US experience about the adoption cycle of IT in construction (Becerik 2004). The FIG 1 seems
to predict that such forums in CPE might appear in Indian business environment after 2010.

ITcon Vol. 15 (2010), Guha et al., pg. 103
None of the consultants participating in collaboration forum had any prior experience which was similar to a
case study in Brazil (Scheer et al 2007). They used questionnaire survey among participants for evaluation. Hjelt
and Björk (2007) also used questionnaire survey for end users response. In line with these studies, the analysis
of the stakeholders’ responses simultaneously in several ways reveals substantial information about the
collaboration performances.
Brief results of the five studies executed on the collaboration forum are reported in FIG 11 and the key finding of
each is transferred to ‘Summary Result’. Reviews of summary results in FIG 11 reveal a wealth of information
about the performance of this collaboration operation. Individual member activities and group behaviors can be
estimated from sociogram and sociometry respectively. Operation of the forum with respect to standard can be
judged from post analysis and with other forums can be quantitatively compared with the help of SNA. The risk
of failure of the collaboration system can also be judged from further analysis of SNA. Collaborators’ self
assessment can be derived from factor analysis. The information would help the designer for improvement of the
collaboration tools. It will also help PM consultants to compare similar collaboration systems quantitatively, gain
insight about collaboration activities, correct weak aspects and manage projects efficiently.
FIG. 11: Summary of the study
8. CONCLUSION
The study provides a method for evaluation of collaboration facilities in a project web site in a developing
country like India. Related literature indicates that a simple system is desirable in a nascent market and therefore
the web space is designed in a simple manner. A web enabled project management system at the very core is a
customer oriented system. Unless the stakeholders find it convenient the system is doomed to failure. Several
analyses have been therefore made about the responses of the participants. A sociogram has been presented for
investigating about the relative importance of the participants. The role of architect and the PMC have been
found to be the most prominent in the sociogram which is expected for a design development stage. A number of
indexes in line with Moreno’s methods of sociometric analysis have been reported. These indexes provide a
relative idea about the group dynamics in collaboration. The indexes can be compared with that of a similar web
site or with this site in future to ascertain the level of collaboration.
A statistical analysis of the posts is conducted. The posts seem to follow Pareto distributions which are in
conformity with the literature. A social network diagram and quantitative attributes of the participants have been
reported for investigating the network activities. The results could be compared with similar data in future for

ITcon Vol. 15 (2010), Guha et al., pg. 104
comparing the network activity of this or similar project management forums. Finally, the opinion of the
participants about the web space is investigated with factor analysis and the opinion of the users is mapped. It
seems that users approve the coordination and benefit perspective of the web space but desire quality
improvement and expects more satisfaction out of the system.
Simultaneous evaluations of the users’ responses in different manners reveal substantial knowledge about the
forum as outlined in FIG 11. The project web site designers could improve the facility with this feedback. A
reanalysis of the same in future would reveal the evolution of the forum with progress of the project.
Quantitative analysis of collaboration systems of a project web site in the context of a developing country like
India is not yet common in the technical literature. The study could be used as a benchmark for investigating the
performance of similar cases in other collaborative web sites for project management. The quantitative nature of
the study makes it easy to compare internet forums of different projects.
7. REFERENCES
Adit Limited (2009) Website: http://www.adit.co.uk/index.htm
Ahuja V., et al. (2009). Study of ICT adoption for building project management in the Indian construction
industry, Automation in Construction, V: 18, No: 4, pp: 415 – 423.
Alshawi M. and Ingirige B. (2003) Web-enabled project management: an emerging paradigm in construction,
Automation in construction, V: 12 pp 349-364
Anderson C. (2006) The Long Tail: Why the Future of Business Is Selling Less of More. Hyperion.
Andresen J.L. et al (2003) Project Management with a Project Web, ITcon, V: 8, pp: 29 – 41,
http://www.itcon.org/data/works/att/2003_3.content.00552.pdf
Ballantine J. and Stray S. (1999) Information systems and other capital investments: evaluation practices
compared, Logistics Information Management, V: 12, pp: 78-93
Baur M. (2008) Software for the Analysis and Visualization of Social Networks, PhD Dissertation, Karlsruhe
Institute of Technology, Germany, http://digbib.ubka.uni-karlsruhe.de/volltexte/1000010897
Becerik B. (2004) A review on past, present and future of web based project management & collaboration tools
and their adoption by the US AEC industry, International Journal of IT in Architecture, Engineering and
Construction, V: 2, Issue: 3
Bilbao S. et al (2008) The Future e-Business Scenarios of European Construction SMEs, Project No. IST-
028067, (http://www.e-nvision.org/)
Björk B. (2002) The Impact of Electronic Document Management on Construction Information Management,
Conference Proceedings – distributing knowledge in building, International Council for Research and
Innovation in Building and Construction, http://itc.scix.net/data/works/att/w78-2002-3.content.pdf
Brandes U. and Wagner D. (2004) Visone - Analysis and Visualization of Social Networks, Graph Drawing
Software by Jünger M and Mutzel P (Eds.), pp: 321-340. Springer-Verlag, Berlin
Brandon P. (2009) Collaboration A technology or human interface problem?, Collaborative Construction
Information Management, pp: 18-35, Ed by Shen G et al, Spon Press, London, UK
Byggeweb (2009) Project web service, www.byggweb.dk
Castro D. and Skibniewski M. (2005) Quantitative Assessment of Web-Based Construction Management
Systems: Application in Rebar Design And Estimation, Journal of Information Technology in Construction,
V: 10, pp: 229-244
Cattell, R. (1966). The scree test for the number of factors. Multivariate Behavioral Research, V: 1, pp: 245–
276.

ITcon Vol. 15 (2010), Guha et al., pg. 105
Chan S. and Leung N. (2004) Prototype Web-Based Construction Project Management System, Journal of
Construction Engineering and Management, ASCE, V: 130, pp: 935-941
Cox R. (2007) The Use of Project Specific Websites as a Virtual Office, Digital library of construction
informatics and information technology in civil engineering and construction, (http://itc.scix.net/cgi-
bin/works/Show?809f)
Cross et al. (2009) Making Invisible Work Visible: Using Social Network Analysis to Support Strategic
Collaboration, The Network Roundtable at The University of Virginia, USA
https://webapp.comm.virginia.edu/networkroundtable/portals/0/making_invisible_work_visible.pdf
Dave B and Koskela L. (2009) Collaborative knowledge management—A construction case study, Automation
in Construction, V: 18 pp: 894–902
Deng Z. et al. (2001) An application of the Internet-based project management system, Automation in
Construction, V: 10 pp: 239–246
Dikbas A. et al (1999) An Integrated Decision-Support System Model For Construction Management Executives
Model for construction management executives, Construction Informatics, Paper w78-1999-2452, Digital
Library (http://itc.scix.net/)
ECTP (2009) European Construction Technology Platform, http://www.ectp.org/
e-NVISION (2007) A New Vision for the participation of European SMEs in the future e-Business Scenario,
D2.1: e-Business Scenarios for the Future, No: ST-028067-CSTB-DEL-D2.1-v2.0 (http://www.e-
nvision.org/)
e-NVISION (2009) A New Vision for the participation of European SMEs in the future e-Business Scenario,
D1.4: 30 Month Interim Progress Report, No: IST-028067-ROB-DEL-D1.4-v01 (http://www.e-nvision.org/)
EasyFit (2009) Website: http://www.mathwave.com/
Faraj I. et al. (2000) An industry foundation classes Web-based collaborative construction computer
environment: WISPER, Automation in Construction, V: 10 pp: 79–99
Freeman L. (2000) Visualizing Social Networks, Journal of social Structures,
http://www.cmu.edu/joss/content/articles/volume1/Freeman.html
Gallivan M. (2001) Organizational adoption and assimilation of complex technological innovations,
Development and application of a new framework, Database for Advances in Information Systems, V: 32,
No: 3, pp: 51-81
Guha S. (2007) Construction Management through Web Services in Calcutta, India, Cases and Projects in
Business Informatics, International Business Informatics Challenge and Conference, Dublin, Ireland, Helfert
M, Thi T, Duncan H, ISBN 978-3-8325-1869-1, Logos Verlag Berlin (http://www.logos-verlag.de/cgi-
bin/buch/isbn/1869)
Hanneman R., and Riddle M. (2005) Introduction to Social Network Methods,
http://faculty.ucr.edu/~hanneman/nettext/C2_Formal_Methods.html
Härdle W. and Léopold S. (2007) Applied Multivariate Statistical Analysis, Springer-Verlag Berlin, pp: 251-269
Hearn P. et al. (2002) Building Communities: Organisational Knowledge Management Within The European
Commission´S Information Society Technologies Programme, ITcon, V: 7, pp: 63-68
Hjelt M. (2006) End-user attitudes towards EDM use in project work: A case study of the Kamppi Center
project, M.Sc. Thesis, Information Systems Science, Swedish School of Economics and Business
Administration

ITcon Vol. 15 (2010), Guha et al., pg. 106
Hjelt M. and Björk B. (2007) End-User Attitudes toward EDM Use in Construction Project Work: Case Study,
Journal of Computing In Civil Engineering, ASCE No: July/August /pp: 289-300
Howard R. et al (1998) Surveys of IT in the Construction Industry and Experience of the IT Barometer in
Scandinavia, ITcon, V: 3, pp: 45-56, http://itcon.org/1998/4/
Howard R. and Petersen E. (2001) Monitoring Communications in Partnering Projects, ITcon, V: 6, pp: 1- 15
http://itcon.org/2001/1/
Issa R.R.A. et al.(2003) A Survey of e-Business Implementation in the US Construction Industry, Journal of
Information Technology in Construction, pp 15-28 (www.itcon.org)
Jones D. (2009) The Organization Development Companyhttp://www.sociometry.co.nz/index.htm
Kaiser H. (1970) A second generation little jiffy. Psychometrika, V: 35, pp: 401–415.
Kaltenbrunner A. et al (2009) Communities on the Web: Mechanisms Underlying the Emergence of Online
Discussion Networks, WebSci'09: Society On-Line Athens Greece, http://www.websci09.org/
Katranuschkov P. et al. (2001) Intelligent Services and Tools for Concurrent Engineering - An Approach
Towards the Next Generation of Collaboration Platforms, ITCon, V: 6, pp: 111-128
(http://itcon.org/2001/9/)
Klinc R. et al. (2009) Engineering Collaboration 2.0: Requirements and Expectations, Journal of Information
Technology in Construction, (www.itcon.org), V: 14, pp 473-488
Krishnamurthy R (2008) Factors that Influence Project Management in Package Implementation Projects and
Bespoke Projects, Project Smart Co, http://www.projectsmart.co.uk/pdf/factors-that-influence-project-
management-in-package-implementation-projects-and-bespoke-projects.pdf
Malsch T. et al. (2004) Communication without Agents? From Agent-Oriented to Communication-Oriented
Modeling, Springer, Berlin, pp: 113-133
Marineau R. (1989), Jacob Levy Moreno 1889-1974: Father of Psychodrama, Sociometry, and Group
Psychotherapy, International Library of Group Psychotherapy and Group Processes
Mitropoulos P. and Tatum C. (1999) Technology Adoption Decisions in Construction Organizations, Journal of
Construction Engineering and Management / September/October 1999
Mohamed S. and Stewart R. (2002) An empirical investigation of users’ perceptions of web-based
communication on a construction project, Automation in construction, V: 12 pp 43-53
Murthi S (2008) Build Versus Buy: Making the Right Decision, Project Smart Co,
http://www.projectsmart.co.uk/pdf/build-versus-buy-making-the-right-decision.pdf
Morzy M (2009) On Mining and social discovery in Internet Forums, 1st international conference on Social
Informatics, Warsaw, Poland
Nitithamyong P. and Skibniewski M. (2004) Web-based construction project management systems: how to make
them successful? , Automation in Construction, V: 13 pp: 491– 506
Northway M. (1940) A method for depicting social relationships obtained be sociometric testing, Sociometry,
V:3, pp: 144-150.
O’Brien W. (2000) Implementation Issues In Project Web Sites: A Practitioner’s Viewpoint, Journal of
Management In Engineering, May/Jun, pp: 34-39
O’Reilly T (2004) http://www.oreillynet.com/pub/au/27
Obonyo E. and Wu W. (2008) Using Web-Based Knowledge Forums to Internationalize Construction Education,
ITcon, V: 13, pp: 212 - 223

ITcon Vol. 15 (2010), Guha et al., pg. 107
Olukayode S.O. and Odusami K. (2005) A Study of Computer Usage by Nigerian Quantity Surveyors,
ITcon, V: 10, pp: 291-303, http://www.itcon.org/2005/20/
Park H et al. (2009) Social Network Analysis of Collaborative Entries for Construction Firms in International
Construction Projects, 26th International Symposium on Automation and Robotics in Construction (ISARC
2009)
Rivard H. et al. (2004) Case Studies on the Use of Information Technology in the Canadian Construction
Industry, ITcon, V: 9, pp: 19-34, http://www.itcon.org/2004/2/
Samuelson O. (2008) The IT-barometer – a decade's development of IT use in the Swedish construction sector,
ITcon, V: 13, pp: 1-19, http://www.itcon.org/2008/1
Sanchez V. et al. (2009) Collaborative Working Environments in the Construction Sector, e-NVISION project
No. IST-028067, http://www.e-nvision.org/
Saarinen T. (1996) An expanded instrument for evaluating information system success, Information &
Management, V: 31, pp: 57-118
Scheer S. et al. (2007) The Necessary Background for Implementing and Managing Building Design Processes
Using Web, ITcon, V: 12, pp: 221-230, http://itcon.org/2007/15/
Schultz W. (2009) Mapping Values: Using Radar Diagrams to Articulate, Clarify, and Compare Values in
Images of the Future, http://www.infinitefutures.com/essays/prez/mapping/index.htm
Serafeimidis V. and Smithson S. (2000) Information systems evaluation in practice: a case study of
organizational change, The Electronic Journal Information Systems Evaluation, V: 15 pp: 93-105
Shen et al. (2009) Collaborative Construction Information Management, Spon Press, UK
Sociometry Pro (2009) Website: http://www.ledisgroup.com/eng/index.php
Statsoft (2009) Electronic Textbook Statsoft, Website: http://statsoft.com/textbook/stathome.html
Stewart R. and Mohamed S. (2004) Evaluating web-based project information management in construction:
capturing the long-term value creation process, Automation in Construction, V: 13, pp: 469– 479
Sulankivi K (2004) Benefits of centralized digital information management in multipartner projects, ITcon, V: 9,
pp: 35-63, http://www.itcon.org/2004/3
Sunaga N. et al. (2000) Project Management System for Small-Medium Building Construction Project, Paper
w78-2000-917, Construction Informatics Digital Library (http://itc.scix.net/)
Shen G et al (2009). Collaborative Construction Information Management, Spon Press, London.
Venkatesh, V. et al. (2003), User Acceptance of Information Technology: Toward a Unified View, MIS
Quarterly, V: 27, pp: 425-478
Wetherill M. et al. (2002) Knowledge Management for the Construction Industry: The E-Cognos Project,
Journal of Information Technology in Construction, (www.itcon.org), V: 7, pp: 183-196