Cold-formed Steel Framed Shear Wall Sheathed with ...
161
APPROVED: Cheng Yu, Major Professor Leticia Anaya, Committee Member Shuping Wang, Committee Member Philip R. Foster, Committee Member Enrique Barbieri, Chair of the Department of Engineering Technology Costas Tsatsoulis, Dean of College of Engineering Mark Wardell, Dean of the Toulouse Graduate School COLD-FORMED STEEL FRAMED SHEAR WALL SHEATHED WITH CORRUGATED SHEET STEEL Guowang Yu Thesis Prepared for the Degree of MASTER OF SCIENCE UNIVERSITY OF NORTH TEXAS May 2013
Transcript of Cold-formed Steel Framed Shear Wall Sheathed with ...

APPROVED: Cheng Yu, Major Professor Leticia Anaya, Committee Member Shuping Wang, Committee Member Philip R. Foster, Committee Member Enrique Barbieri, Chair of the Department
of Engineering Technology Costas Tsatsoulis, Dean of College of
Engineering Mark Wardell, Dean of the Toulouse
Graduate School
COLD-FORMED STEEL FRAMED SHEAR WALL SHEATHED
WITH CORRUGATED SHEET STEEL
Guowang Yu
Thesis Prepared for the Degree of
MASTER OF SCIENCE
UNIVERSITY OF NORTH TEXAS
May 2013

Yu, Guowang. Cold-formed Steel Framed Shear Wall Sheathed with Corrugated Sheet
Steel. Master of Science (Engineering Systems – Construction Management), May 2013,153 pp.,
14 tables, 45 figures, references, 29 titles.
Incombustibility is one important advantage of the sheet steel sheathed shear wall over
wood panel sheathed shear wall. Compared to shear wall sheathed with plywood and OSB panel,
shear wall sheathed with flat sheet steel behaved lower shear strength. Although shear wall
sheathed with corrugated sheet steel exhibited high nominal strength and high stiffness, the shear
wall usually behaved lower ductility resulting from brittle failure at the connection between the
sheathing to frames.
This research is aimed at developing modifications on the corrugated sheathing to
improve the ductility of the shear wall as well as derive practical response modification factor by
establishing correct relationship between ductility factor µ and response modification factor R.
Totally 21 monotonic and cyclic full-scale shear wall tests were conducted during the
winter break in 2012 by the author in NUCONSTEEL Materials Testing Laboratory in the
University of North Texas. The research investigated nineteen 8 ft. × 4 ft. shear walls with 68
mil frames and 27 mil corrugation sheet steel in 11 configurations and two more shear walls
sheathed with 6/17-in.OSB and 15/32-in. plywood respectively for comparison. The shear walls,
which were in some special cutting arrangement patterns, performed better under lateral load
conditions according to the behavior of ductility and shear strength and could be used as lateral
system in construction.

Copyright 2013
by
Guowang Yu
ii

ACKNOWLEDGEMENTS
In the depth of my heart, I would first thank my advisor, Professor Cheng Yu for your
invaluable guidance in research during my 2 years study, as well as your great patience, hard
work spirit and endless encouragement in academic.
A thank you is also especially expressed to my master’s companion Noritsugu Yanagi
since the beginning of this academic exploration in UNT. Your help of machine operating during
the tests will be forever remembered.
Undergraduate students Marcus Gonzales, Roger Rovia and Joel Irwin are thanked for
their helping to construct shear wall specimens.
The assistance from UNT lab manager Bobby Grimes in setting up the testing apparatus
and tools using would be highly appreciated.
The donation of materials by Steel Stud Manufacturers Association and Nuconsteel
Commercial Corp., of the corrugated sheet steel are also gratefully acknowledged.
I would also express my gratitude to all the committee members for your invaluable
suggestion and sincerely help.
At last, I would send appreciation to my wife Hong Cao and my daughter Zihan Yu, for
their understanding and support during my studies at University of North Texas.
iii

TABLE OF CONTENTS
Page ACKNOWLEDGEMENTS ........................................................................................................... iii LIST OF TABLES ...........................................................................................................................v LIST OF FIGURES ....................................................................................................................... vi CHAPTER 1. INTRODUCTION ....................................................................................................1 CHAPTER 2. LITERATURE REVIEW .........................................................................................4 CHAPTER 3. RESEARCH OBJECTIVE .....................................................................................15 CHAPTER 4. TEST PROGRAM ..................................................................................................18
4.1 Test Setup...............................................................................................................18
4.2 Test Procedure .......................................................................................................21
4.3 Test Specimens ......................................................................................................23
4.4 Material Properties .................................................................................................35 CHAPTER 5. TEST RESULTS AND DISCUSSION ..................................................................36 CHAPTER 6. SEISMIC RESPONSE MODIFICATION FACTOR FOR COLD- FORMED STEEL FRAME / CORRUGATED SHEET STEEL ....................................................................52
6.1 Introduction ............................................................................................................52
6.2 The Evolvement of Seismic Provisions in Corresponding Code ...........................52
6.3 Ductility .................................................................................................................54
6.4 Evaluation of Response Modification Factor ........................................................57
6.5 Determination of the Response Modification Factor for Shear Wall Sheathed with Corrugated Sheet Steel ...........................................................................................60
CHAPTER 7. CONCLUSION AND RECOMMENDATION .....................................................63 APPENDIX A. DATA SHEET S FOR CORRUGATED SHEET SHEAR WALL TESTS ........66 APPENDIX B. COMBINED HYSTERESIS CURVE, ENVELOPE CURVE, EEEP CURVE AND DUCTILITY FACTOR ......................................................................................................125 APPENDIX C. FINAL LENTH OF RUPTURED HOLES AND SLITS ...................................137 REFERENCES ............................................................................................................................150
iv

LIST OF TABLES
Page 1. Test matrix for shear wall test in Yu (2009) ......................................................................12
2. Nominal shear strength (Rn) for shear walls (AISI S213,2007) ........................................13
3. Summary of shear wall test results in Yu (2009) ...............................................................13
4. Ductility of representative shear wall specimens in Yu (2009) .........................................14
5. CUREE basic loading history ............................................................................................22
6. Test matrix for shear wall test ............................................................................................30
7. Material properties .............................................................................................................35
8. Summary of shear wall test results ....................................................................................37
9. Failure mode of the tested shear walls ...............................................................................38
10. Shear wall modified nominal strength ...............................................................................51
11. Horizontal force factor .......................................................................................................52
12. Seismic parameters comparison .........................................................................................54
13. Statistic of Natural Period for cold-formed steel buildings ...............................................60
14. Response modification factor R and ductility factor μ ......................................................61
v

LIST OF ILLUSTRATIONS
Page
1. Shear wall assembly .............................................................................................................2
2. Boundary stud configurations in Yu (2009) ......................................................................12
3. Testing frame with 8 ft. × 4 ft. wall assembly ...................................................................19
4. Front view of the test setup ................................................................................................20
5. Back view of the test setup ................................................................................................20
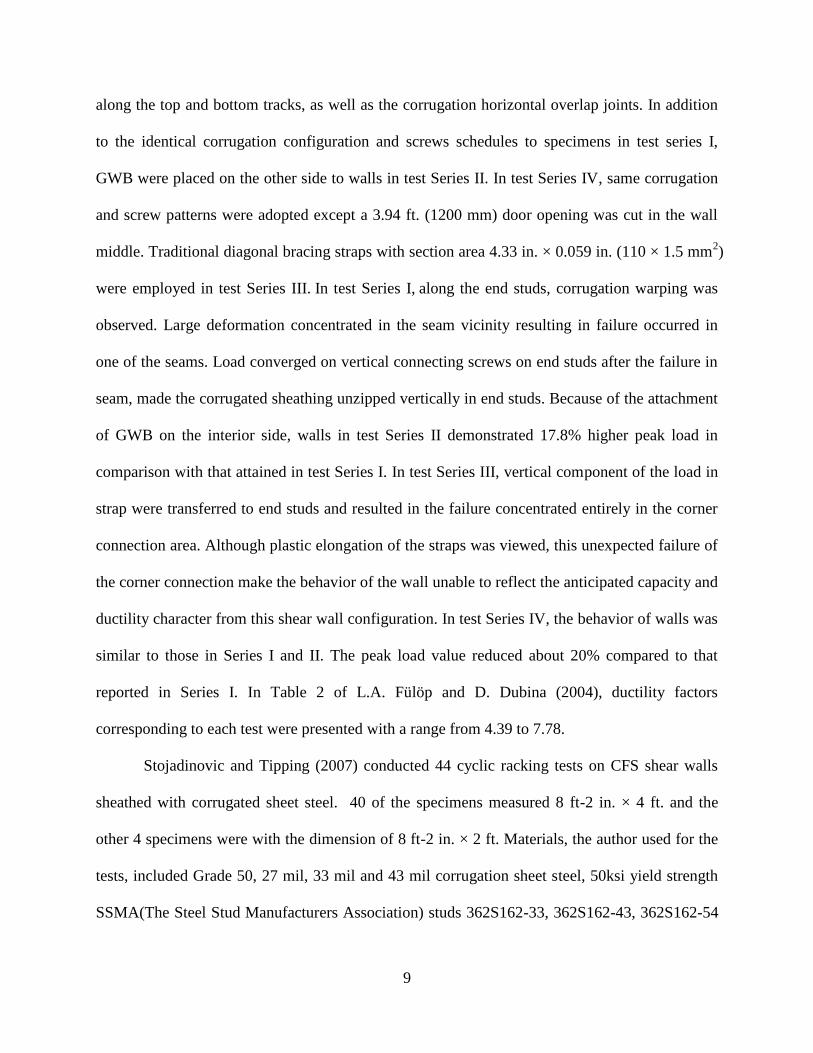
6. CUREE basic loading history (0.2 Hz) ..............................................................................23
7. Corrugated sheet steel profile ............................................................................................24
8. Wall configuration Type 1 .................................................................................................25
9. Wall configuration Type 2 .................................................................................................25
10. Wall configuration Type 3 .................................................................................................26
11. Wall configuration Type 4 .................................................................................................25
12. Wall configuration Type 5 .................................................................................................25
13. Wall configuration Type 6 .................................................................................................25
14. Wall configuration Type 7 .................................................................................................27
15. Wall configuration Type 8 .................................................................................................27
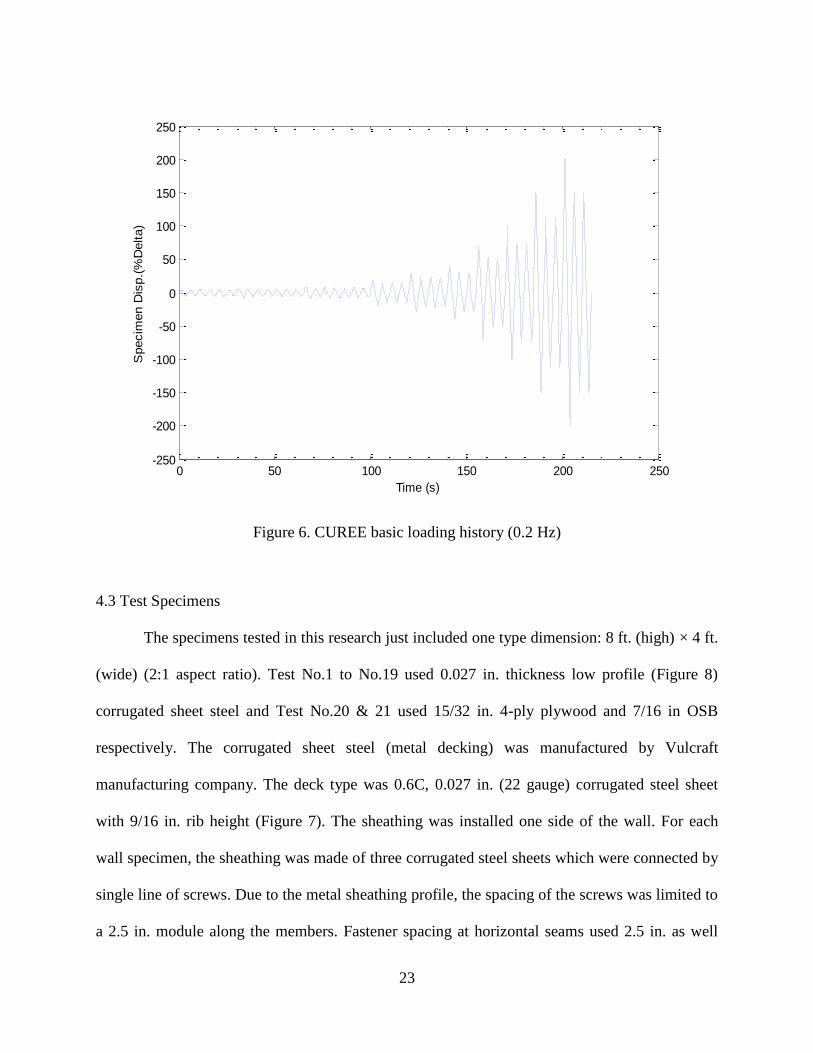
16. Wall configuration Type 9 .................................................................................................29
17. Wall configuration Type 10 ...............................................................................................29
18. Wall configuration Type 11 ...............................................................................................29
19. Wall configuration Type 12 ...............................................................................................27
20. Simpson Strong-Tie® S/HD15S ........................................................................................29
21. Simpson Strong-Tie® S/HD15S Hold-down welding connection ....................................29
22. Corrugation cutting pattern ................................................................................................31
23. Plasma cutter operation ......................................................................................................32
vi

24. Grinder cutter operation .....................................................................................................32
25. Cutting width of slits ..........................................................................................................33
26. Failure mode of wall configuration Type 1 .......................................................................39
27. Relative deformation of metal sheet of shear wall .............................................................40
28. Failure mode of wall configuration Type 2 .......................................................................40
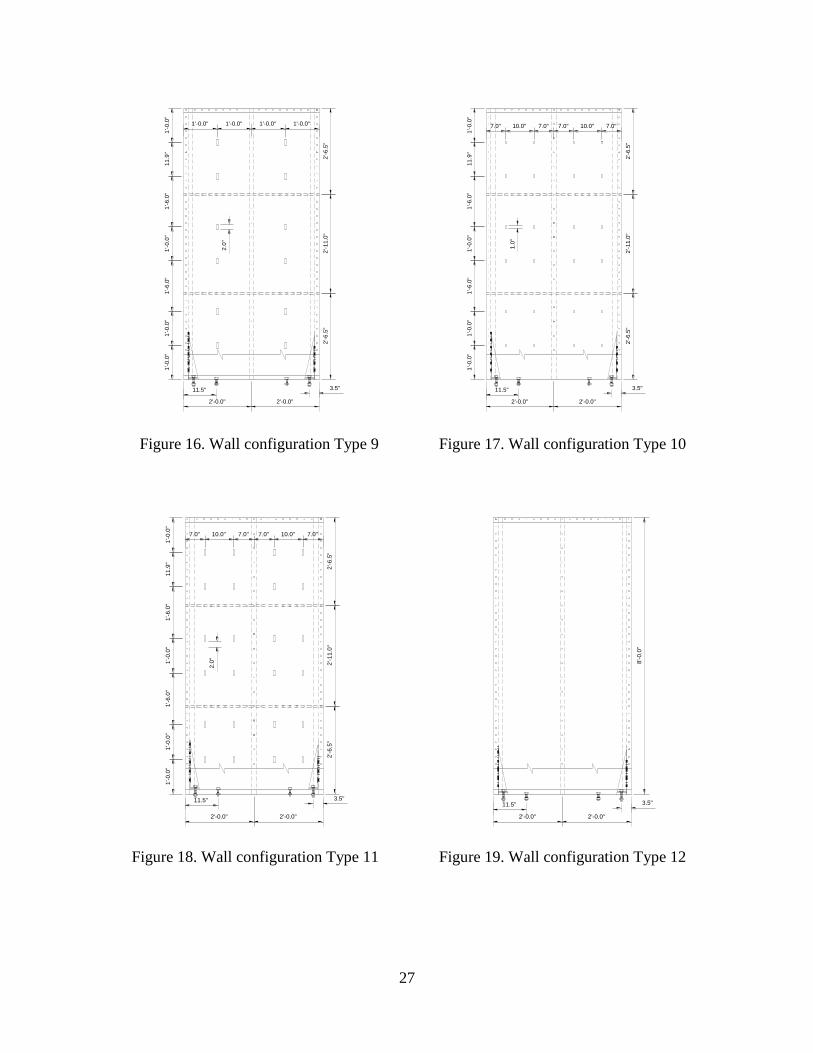
29. Failure mode of wall configuration Type 3 .......................................................................41
30. Failure mode of wall configuration Type 4 .......................................................................42
31. Failure mode of wall configuration Type 5 .......................................................................43
32. Failure mode of wall configuration Type 6 .......................................................................44
33. Failure mode of wall configuration Type 7 .......................................................................45
34. Failure mode of wall configuration Type 8 .......................................................................45
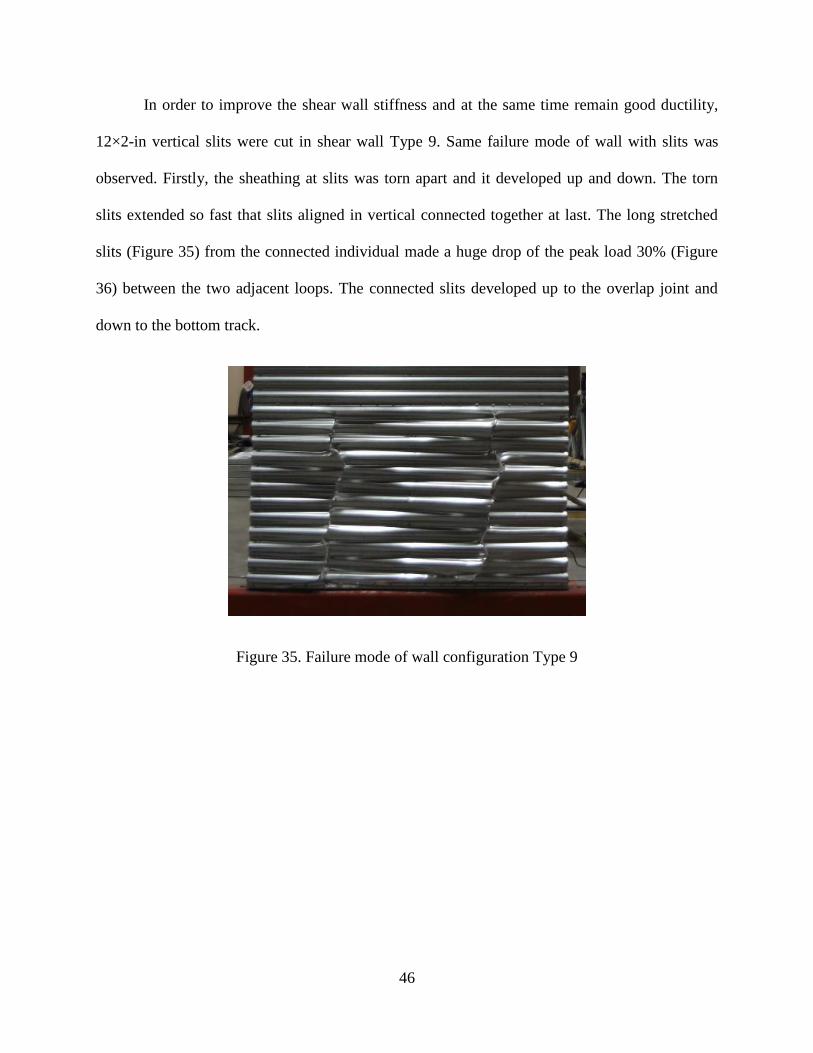
35. Failure mode of wall configuration Type 9 .......................................................................46
36. Hysteresis curve of wall configuration Type 9 ..................................................................47
37. Failure mode of wall configuration Type 10 .....................................................................48
38. Hysteresis curve of test No. 17 of Type 11wall configuration ..........................................48
39. Failure mode of plywood wall of configuration Type 12 ..................................................49
40. Failure mode of OSB of configuration Type 12 ................................................................49
41. Shear wall load-displacement relationship curve ..............................................................50
42. EEEP curve for monotonic test ..........................................................................................56
43. EEEP bilinear curves for cyclic test...................................................................................57
44. Idealized elastic design spectrum, horizontal motion (Nemark and Hall) .........................58
45. Combined elastic and inelastic response spectra (Nemark and Hall) ................................59
vii

1
CHAPTER 1
INTRODUCTION
Cold-formed steel is widely used in buildings, automobiles, equipment, home and office
furniture, utility poles, storage racks, grain bins, highway products, drainage facilities, and
bridges. Its popularity can be attributed to ease of mass production and pre-fabrication, uniform
quality, lightweight designs, economy in transportation and handling, and quick and simple
erection or installation (New Steel 2007).
In building construction, cold-formed steel products can be into three categories:
members, panels, and prefabricated assemblies. Typical cold-formed steel members such as studs,
tracks, purlins, girts and angles are mainly used for carrying loads while panels and decks
constitute useful surfaces such as floors, roofs and walls, in addition to resisting in-plane and
out-of-plane surface loads. Prefabricated cold-formed steel assemblies include roof trusses,
panelized walls or floors, and other prefabricated structural assemblies. Cold-formed steel
possesses a significant market shear because of its advantages over other construction materials
and the industry-wide support provided by various organizations that promote cold-formed steel
research and products, including codes and standards development that is spearheaded by the
American Iron and Steel Institute (New Steel 2007).
In residential and commercial construction, steel studs and tracks are generally covered
with cladding to form a wall assembly with significant shear strength. It is common design
practice to use this wall shear strength to resist lateral loads, such as those caused by wind and
earthquake. Most commonly used walls constructed with materials included: (1) plywood and
oriented strand board (OSB) on the exterior wall surfaces, (2) steel X-bracing on one side, (3)
flat and corrugation steel sheathing on one side. In terms of the requirement for the using

2
function, gypsum wall board (GWB) could be used as the interior wall, which assembly, to some
extent, would improve the performance of the building under lateral loads. A typical cold-formed
sheathing configuration is showed in Figure 1.
8'-0"
4'-0"
Sheathing
Fasteners
Studs
Track
Figure 1. Shear wall assembly
The strength of a wall system highly depends on the interaction of many factors including
size and strength of the sheathing; the strength, size of the frame members; the type, size and
spacing of the fasteners used to fix the sheathing; and the shear wall aspect ratio (ratio of long to
short dimension). Because of these variables, the design strength of shear walls is usually based
on test of full-scale specimens.
Since the early 1990s, wide research works have been done investigating the behavior of
cold-formed shear wall sheathed with OSB and plywood. Whereas, shear walls sheathed with

3
steel corrugation, which could be the strongest lateral force resistant unit, still need intensive
study to obtain a thorough understanding of the performance.
Based on fore-mentioned background, this research studied the cold-formed steel framed
shear walls sheathed with corrugation steel sheet under monotonic and cyclic loading modes.
The testing and the analyzing were presented in detail of this research. The research focus was
on the improvement of the ductility of shear wall for seismic application.
This research work was organized as: chapter 1 gives the introduction of the cold-formed
steel industry and the products used in construction and corresponding study background. The
second chapter of the thesis reviewed the literatures which were conducted in relevant studies
that have been done by some other researchers. Chapter 3 stated the research background and
objective in terms of current research vacancy. Test program is stated in chapter 4 which
includes test setup, test procedures, materials and test specimens. Test result and analysis was
discussed in chapter 5. The sixth chapter of the thesis described the ductility and response
modification factor of the shear wall assembly. Finally, chapter 7 provided the conclusions for
this study and recommendations for further research on cold-formed frame shear walls sheathed
with steel corrugation.

4
CHAPTER 2
LITERATURE REVIEW
Cold-formed steel (CFS) has become a favorite construction material for multi-family
homes, mid-rise hotel and office buildings because of its advantages of light weight, high
durability, fast site installation and relatively lower costs comparing with conventional materials,
hot-rolled steel and concrete masonry. The lateral force resisting system in cold-formed steel
construction typically adopts CFS frame members, sheet steel or woody sheathing and self-
drilling screws which fastens them together.
Serrette (1996) investigated the behavior of CFS framed shear walls sheathed with
plywood, OSB and GWB with a total of 48 tests in three phases. In phase 1, the goal of the
program was to investigate the differences in static behavior of 15/32 in. plywood and 7/16 in.
OSB shear walls. Four aspects behavior were examined: (a). Static strength of 8 ft. × 8 ft. OSB
vs. plywood walls—sheathing on one side of the wall; (b). performance of the weaker of OSB
and plywood with panels on one side of the wall; (c). performance of the weaker of OSB and
plywood with studs framed at 24 in. and 16 in.—panels on one side of the wall; (d). performance
of the 8 ft. × 8 ft. and 8 ft. × 4 ft. walls of the same panel (which was picked from the weaker of
OSB and plywood)—panels on one side of the wall. The materials used in the test program
included: 33ksi yield strength, 33 mil (20 gauge) 3.5 in. depth stud with 1.625 in. flange and
0.375 in. lip; 33ksi yield strength, 33 mil (20 gauge) 3.5 in. depth track with 1.25 in. flange; No.8
× 0.5 in. self-drilling framing screws and No.8 × 1 in. Flat Head plywood and OSB screws.
Phase 2 was conducted static tests by using the weaker of OSB and plywood panels
which focused on: (i). behavior of OSB walls with small fastener spacing-panels on one side of
the wall; (ii). behavior of OSB panels one side and GWB panels on the other side; (iii). behavior

5
of walls with GWB panels on both sides. In the third phase, comprehensive investigations were
carried out on the panels with OSB and plywood, covering all fastener schedules. The author
concluded that: the nominal capacity of the 8 ft. × 8 ft. plywood wall was approximately 17%
higher than that of the 7/16 in. OSB wall; Plywood walls presented much larger deformation
capacity at the maximum load compared to the OSB wall. Compared to the wall with panels
parallel to studs, OSB wall with panels in perpendicular installation has a higher load and
deformation capacity; Among the 8 ft. × 4 ft. OSB walls, a denser fastener schedule pattern
exhibited a higher maximum load capacity; Attaching the GWB on the other side of OSB wall,
could improve the capacity of the shear with 6 in./12 in. fastener schedules, whereas no
significant increase in capacity was observed due to the addition of GWB panel; In the cyclic test
under a given screw schedule, the plywood walls had generally outperformance corresponding
OSB walls approximately 10% in their capacity.
Serrette (1997) initiated a wide range investigation which, in addition the OSB and
plywood wall, included flap strap X-braced walls and steel flat sheathed walls. The
comprehensive test program was categorized into five phases on the expected projects objective:
Phase 1 (cyclic): Examine the performance of 8 ft. x 4 ft. 15/32 in. plywood and 7/16 in.
OSB wall assemblies framed with 0.033 in. middle studs and 0.043 in. back to back end studs in
fasteners schedules 3 in./12 in. and 2 in./ 12 in.
Phase 2 (cyclic): For panels attached with No. 8 screws, investigated at what thickness
does the behavior of the shear wall system change to establish the limit on framing members
thickness (up to 0.054 in.).
Phase 3 (monotonic & cyclic): Examine the performance of 0.033 in. flat strap X-braced
walls framed with 0.033 in. and 0.043 in. studs.

6
Phase 4 (monotonic & cyclic): shear walls sheathed with 0.018 in. and 0.027 in. steel
sheets were investigated in this step. And also those were the first whole steel- composed shear
walls which ever have been tested.
Phase 5 (monotonic & cyclic): Observed the behavior of high aspect ratio (4:1) walls
sheathed with 15/32 in. plywood and 7/16 in. OSB.
In phase 1, the shear wall assemblies failed in the screw heads pulling through the
plywood and OSB panels and this failure mode resulted in the detachment of the wood board
along the chord studs and bottom track of wall assembly. It was strong enough of the back-to-
back 0.043 chord studs to prevent the member from local buckling. In phase 2, 7/64 in dia.
predrilled holes were employed for the No. 8 screws, since the 0.054 in. studs were too tough to
drill though. The failure in the 0.054 in. framed assemblies resulted from shearing of the screws
and the screw heads pulling through the sheathing. While a combination of the screws pulling
out of the bottom track and chord studs and screw heads pulling though the sheathing was
observed. Both the static and cyclic tests were carried out on 4-1/2 in. wide strap and 7-1/2 in.
wide strap in phase 3. Under static load, the assemblies with 4-1/2 in. wide strap failed in the
local buckling of the compression chord stud. Due to out-of-plane bending, the failure in
assemblies with 7-1/2 in. wide strap resulted from local buckling of the top chord track in the test.
For assemblies with the 4-1/2 in. wide strap possessed the identical failure mode whatever the
static test and cyclic were carried out. In cyclic test, a combined failure mode of local buckling in
the chord stud and local buckling in the top track due to out-of-plane force was recorded. In the
static test of the fourth phase, metal sheathing on high aspect ratio wall assemblies (8 ft. × 2 ft.)
were investigated. The metal sheathing deformed so significantly that resulted in unzipping of
sheathing due to the rupture at the sheathing edges. But when the fastener schedule was reduced

7
from 6 in. /12 in. to 4 in. /12 in., the length of unzipped shorten and occurred at the corner. In the
meanwhile, local buckling in the chord studs was viewed. In addition to the failure mode
observed during the static test, fasteners pulling out of the framing were recorded as well. In
phase 5, in either static and cyclic, reduced fastener schedule transited the failure from the
unzipped to chord stud buckling.
Based on above observation, the author concluded that: in the 8 ft. × 4 ft. plywood and
OSB assembly tests, with the using of back-to-back 0.043 in. chord studs, the plywood walls
were found to be stronger and more ductile than the OSB walls. No. 8 screws performed well in
0.043 in. studs but fractured in shear when 0.054 in. studs were employed. So larger diameter
screws would be better matched accessories to 0.054 in. or even bigger studs. Eccentricity
installation on one side tends to put both the chord studs and track in strong axis bending. The
eccentricity imperfection, plus the usually higher actual yield strength of the strap, drags the
track out of plane which leading to in premature failure of the wall assembly. As for the steel
sheathed wall assemblies, failure resulted from a combination of bearing in the sheet steel along
the edges and pullout of screws from the studs. No tension field action was visible in the tests.
High aspect ratio wall are capable of resisting high loads at relatively large displacement,
however, after large events, the wall has low to zero initial stiffness.
Serrette (2002) conducted a series of tests which aimed at evaluating the performance of
new wall configurations not permitted in the building codes then. The test program included four
areas: reversed cyclic performance of shear wall framed with 54 mil and 68 mil studs and
sheathed with 7/16 in. OSB one side; Reversed cyclic performance of shear wall framed with 54
mil and 68 mil studs and sheathed with 7/16 in. OSB double sides; Reversed cyclic performance
shear walls sheathed with 2 pieces of 27 mil sheet steel with simple lap shear connections at the

8
abutting edges of the panels (the abutting edge perpendicular to framing); Monotonic
performance of 1/2 in. GWB sheathed shear walls (one side) with different blocking
configurations and fastener spacing patterns. The OSB wall tests indicated that No.8 screws and
54 mil framing, No. 10 screws and 68 mil framing matched very well and the failure in
connection has good ductile character. For the double-sided OSB walls framed with 54 mil studs,
demands on the chord studs exceeded the capacity of the studs resulting in failure at the location
of punch-out. While walls framed with 68 mil studs, screws fastening the hold-down to the chord
studs failed. The two premature failure modes in the double-sided OSB shear wall assemblies
prevented of development sheathing full strength. In the sheet steel walls, diagonal shear
buckling and diagonal tension were observed. The tension field crossed the adjoining edge and
unzipped the joint before the sheet steel could reach its capacity. Failure mode in the GWB
monotonic tests were consistent to that were observed in the previous tests.
The North American Standard for Cold-Formed Steel Framing - Lateral Design (AISI
S213-07) provides shear strength values for CFS framed shear walls with three type of sheathing
materials: 15/32 in. Structural 1 plywood sheathing, 7/16 in. oriented strand board (OSB), and
0.018 in. and 0.027 in. flat steel sheet. Those published values were based on Serrette (1996,
1997, and 2002).
L.A. Fülöp and D. Dubina (2004) directed six series full-scale test on 11.81 ft. × 7.87 ft.
(3600 mm × 2400 mm) shear walls constructed with different sheathing. For all of test
specimens tested in the investigation, the walls were framed with U154/1.5 tracks and C154/1.5
studs. In test Series I, corrugated sheets were horizontally sheathed on the frames with 4.8 mm
diameter self-drilling screws. Fasteners were scheduled in every corrugation rib along the
vertical end studs, every other corrugation rib in the vertical field studs and 7.87 in. (200 mm)
9
along the top and bottom tracks, as well as the corrugation horizontal overlap joints. In addition
to the identical corrugation configuration and screws schedules to specimens in test series I,
GWB were placed on the other side to walls in test Series II. In test Series IV, same corrugation
and screw patterns were adopted except a 3.94 ft. (1200 mm) door opening was cut in the wall
middle. Traditional diagonal bracing straps with section area 4.33 in. × 0.059 in. (110 × 1.5 mm2)
were employed in test Series III. In test Series I,
along the end studs, corrugation warping was
observed. Large deformation concentrated in the seam vicinity resulting in failure occurred in
one of the seams. Load converged on vertical connecting screws on end studs after the failure in
seam, made the corrugated sheathing unzipped vertically in end studs. Because of the attachment
of GWB on the interior side, walls in test Series II demonstrated 17.8% higher peak load in
comparison with that attained in test Series I. In test Series III, vertical component of the load in
strap were transferred to end studs and resulted in the failure concentrated entirely in the corner
connection area. Although plastic elongation of the straps was viewed, this unexpected failure of
the corner connection make the behavior of the wall unable to reflect the anticipated capacity and
ductility character from this shear wall configuration. In test Series IV, the behavior of walls was
similar to those in Series I and II. The peak load value reduced about 20% compared to that
reported in Series I. In Table 2 of L.A. Fülöp and D. Dubina (2004), ductility factors
corresponding to each test were presented with a range from 4.39 to 7.78.
Stojadinovic and Tipping (2007) conducted 44 cyclic racking tests on CFS shear walls
sheathed with corrugated sheet steel. 40 of the specimens measured 8 ft-2 in. × 4 ft. and the
other 4 specimens were with the dimension of 8 ft-2 in. × 2 ft. Materials, the author used for the
tests, included Grade 50, 27 mil, 33 mil and 43 mil corrugation sheet steel, 50ksi yield strength
SSMA(The Steel Stud Manufacturers Association) studs 362S162-33, 362S162-43, 362S162-54

10
and 362S162-68. The fasteners applied in the tests were No.10-16 × ¾ in., No.12-14 × 1 ¼ in.,
No.14-20 × 1 ½ in. hex head self-drilling screws at 3” on center along the perimeter frames and
seams but 6” on center in the middle stud. Two specimens were constructed with 5/8 in. GWB
applied over the corrugated metal sheathing to evaluate the effect on the strength and stiffness of
the specimens. The GWB was attached to the sheathing with No.6 screws spaced at 6 in. along
the panel edges and field, a different attachment pattern from those in Serrette’ tests. And two
walls were tested with corrugation sheathing on both sides. In the test, as the panels cyclically
deformed, screws gouge elongated holes in the metal studs and/or sheeting due to racking shear.
And because of the increment of the inter-story drift, warping of the end corrugation became
evident and coinciding diagonal tension and compression fields developed across the panel. As
the holes around the fasteners enlarged, tensile capacity of the screws was reduced and
eventually that resulted in the “popping” out (pulling out) of the screws along the boundary
members due to the distortion of the corrugated sheet steel. Meanwhile, the author also given a
recommendation of some relevant factors that employed in the design of seismic force resisting
systems, which have the design parameters: Response Modification Factor (R) = 5.5, System
Overstrength Factor (Ω o) = 2.5, Deflection Amplification Factor (Cd) = 3.25.
Since 2006, Nippon Steel (JHU-Nippon CFS Meeting, October 11th
, 2011) conducted a
series investigation on cold-formed shear walls with different metal sheathing configuration
which aimed to be applied as the lateral force resisting unit in 4 to 5-story buildings. Various
steel sheets were examined to see their behavioral characteristics, including flat sheet steel, sheet
steel with slits, sheet steel with holes, but none of them showed preferable behavior due to large
local deformation of sheets and members, decreased strength and stiffness, etc. However, their
study on horizontally placed corrugated panels proved the sheathing configuration has superior

11
performance. Although the failure mode resulted from the bearing of the metal sheet could
provide ductility to some degree, the shear wall behaved in a slip manner due to the bearing in
sheet which possessed less energy absorption capacity and large stiffness degradation.
Yu (2009) performed 8 tests on 8 ft. × 4 ft. cold-formed shear walls with horizontally
placed metal sheathing on one side. Three configurations for the boundary studs used in Yu’s test
as shown in Figure 2. The configuration A used two studs connected back-to-back by No.8
screws one pair 6 in. o.c. along member. The outer stud was strengthened by a matching track
member fastened to the stud flanges, face-to-face, by No. 8 screws 6 in. on center. The
configuration B used three studs, two studs were attached back-to-back by No. 8 screws 6 in. on
center, and the third stud attached to the double studs face-to-face by ½ in. length stitch weld
every 12 in. on center. The boundary stud configuration C used double studs, back-to-back, fixed
by No.12 screws one pair 6 in. on center. Simpson Strong-Tie S/HD 10S and S/HD15 hold-down
were used in shear wall to resist the uplift force. The corrugated sheet steel was manufactured by
Vulcraft Manufacturing Company. The deck type is 0.6C, 0.027 in. corrugated steel sheet with
9/16 in. rib height. The sheathing was installed one side of the wall. For each shear wall
specimen, the sheathing was composed of three corrugated steel sheets which overlapped one rib
and were connected by a line of screws. The screw spaced 2.5 in. on the panel edges due to the
decking profile, as well as that in the overlap joint and along the top and bottom tracks. Screws
were scheduled every other corrugation along the middle stud, i.e. 5 in.
In the tests, corrugated sheathing showed significantly higher shear strength and larger
displacement at peak load (Table 3.) than that of other sheathing materials. Test 3 gave the
lowest shear strength of 1389 plf, which was still greater than the published values in Table 2
(AISI S213, 2007) 1000plf, 1235plf, 1330plf for the 0.027 in. flat sheet steel, the 7/16 in. OSB,

12
and the 15/32 in. Structural 1 sheathing respectively. However the corrugated sheet test failed in
buckling of the studs and joint connections which resulted in immediate drop in load after peak
and then caused a lower ductility factor. The ductility of representative flat and corrugated sheet
sheathed CFS shear walls and that of OSB sheathed CFS shear walls are listed in Table 4.
Table 1. Test matrix for shear wall test in Yu (2009)
Test Label
(protocol)
Nominal
Framing
thickness
Sheathing and
Framing
Fastener2
Fastener
Spacing
End Studs
Config3
Hold-down
1
(monotonic) 43 mils #8 ¾” 5”/12 ½” A
S/HD10S
Raised
2
(monotonic) 43 mils #8 ¾” 5”/12 ½” B
S/HD10S
Raised
3
(cyclic) 43 mils #8 ¾” 5”/12 ½” B
S/HD10S
Raised
4
(monotonic) 68 mils #12 1-¼” 2 ½”/5” C
S/HD10S
Raised
5
(cyclic) 68 mils #12 1-¼” 2 ½”/5” C
S/HD10S
Raised, Reinforced
6
(cyclic) 68 mils #12 1-¼” 2 ½”/5” C
S/HD10S
Raised, Reinforced
7
(cyclic) 68 mils #12 1-¼” 2 ½”/5” C
S/HD10S
Flushed, Reinforced
8
(monotonic) 68 mils #12 1-¼” 2 ½”/5” C
S/HD15
Flushed
Note: 1- all tests used 0.027 in corrugated sheet with rib height 9/16 in. for sheathing; 2- #8 screws were
modified truss head self-drilling screws, #12 screws were hex washer head self-drilling screws; 3- stud
configuration refers to Figure 4.
350T150-43 350T162-43
No.8 screw
350T162-43
No.8 screw
350T162-68
No.12 screw
Intermittent weld
Figure 2. Boundary stud configurations in Yu (2009)

13
Table 2. Nominal shear strength (Rn) for shear walls (AISI S213,2007)
Table 3. Summary of shear wall test results in Yu (2009)
Test Label
Peak load (plf)
Lateral deflection at
peak load (in.)
Avg. Peak Load (plf)
Avg. Δ
(in.) Failure Mode
+P -P +Δ -Δ
1 1942 - 2.85 - 1942 2.85 Stud buckled
2 1625 - 2.60 - 1625 2.60 Sheathing screw
pullout
3 1628 1150 1.75 1.39 1389 1.57 Sheathing screw
pullout
4 2451 - 0.81 - 2451 0.81 Hold-down screws
sheared
5 3717 3656 1.28 1.30 3688 1.29 Lateral support
failed
6 3957 3986 2.73 2.54 3972 2.64 No failure
7 4113 4315 2.84 3.12 4214 2.98 Hold down failed
8 4804 - 3.20 - 4804 3.20 Sheathing joint
failed

14
Table 4. Ductility of representative shear wall specimens in Yu (2009)
Specimen Test Screw
Spacing 400
(in/in) F400 (plf)
Fy (plf)
e (in/in)
max (in/in)
µ
68 mil 4’x8’ 0.027” Corrugated
Mono-tonic
5”/12” 0.0025 805 4148 0.0129 0.0347 2.70
68 mil 4’x’8 7/16” OSB
Cyclic 2”/12” 0.0025 1229 2968 0.0061 0.0189 3.11
43 mil 4’x8’ 0.027” Corrugated
Mono-tonic
5”/12” 0.0025 213 1791 0.0211 0.0305 1.44
43 mil 4’x8’ 0.027” Flat sheet
Mono-tonic
4”/12” 0.0025 339 1015 0.0075 0.0225 3.00

15
CHAPTER 3
RESEARCH OBJECTIVE
The research works conducted by Tipping and L.A. Fülöp showed that the corrugated
metal sheathing shear walls have good ductility and high shear strength and could be used as
lateral system applied in seismic zones. However, either the material used in L.A. Fülöp or the
shear wall construction method of Tipping was not the typical practice in the North American
construction market.
Previous research done by Yu et al. (2009) indicated that the corrugated steel sheathing
can provide significantly higher strength and stiffness compared to the conventional OSB,
plywood sheathing and flat steel sheet sheathing. However brittle failures were observed in Yu’s
research and further research is needed to improve the ductility of the corrugated steel sheet
shear walls in order to use it in seismic zones. This research is aimed at developing modifications
on the corrugated sheathing to improve the ductility of the shear wall as well as derive practical
response modification factor by establishing correct relationship between ductility factor µ and
response modification factor R. The tasks conducted in this research included 2 major steps:
(1) Conducted full scale tests on shear walls with different opening configurations, and
produced nominal shear strength, drift limit, hysteresis parameter for CFS shear walls by using
modified corrugated steel sheathing.
(2) Calculated the ductility of shear walls with different opening configurations, optimized
the best opening configurations and derived the practical response modification factor.
To avoid failure mode in the boundary elements and connections which usually results
in a suddenly drop after the peak load, a method was employed to improve the ductility of the

16
corrugated CFS shear wall by forcing failure mode to be material yielding and local buckling in
the sheathing.
Introducing openings in the field of sheathing will be considered as an alternative
method as well to improve the ductility. The similar approach has been studied by a number of
researchers on hot-rolled steel plate shear walls. Hitaka and Matsui (2003) conducted a total of
43 hot-rolled steel plate shear walls under monotonic and cyclic lateral loading to investigate
the shear wall behavior.
Varied opening sizes, locations, and orientation on the corrugated sheathing will result
in different strength and stiffness of shear wall. Also, the location of buckling and initial
yielding in the sheathing material is affected by those same configurations of openings. Because
of the light gauge of the CFS materials, it is feasible to make openings on the site and no special
tools are required. Additionally, the openings probably are utilized as the paths for duct,
plumbing, and electrical wires.
This research focused on how to find appropriate opening locations so that the shear
strength of shear wall will not drop significantly while the ductility was improved. Material
yielding and out-of-plan buckling around the opening were designed intentionally to be the
dominant failure mechanism and the method of energy dissipation in the new corrugated CFS
shear wall. Both circular openings and slits were considered in this research.
For each shear wall specimen, the sheathing was composed of three corrugated steel
sheets which overlapped one rib. Instead of opening in the sheathing field, shear wall which
without stitch screws along the overlap joints was another case that was investigated.
The work in step 1 included full scale tests on the CFS shear wall with different opening
patterns. The full-scale tests started from the shear wall without stitch screws at the connection

17
joints. Because the task of this research was to optimize the desired opening configuration, some
unplanned opening patterns were developed as the tests progressed.
The work in step 2 developed a practical equation associated the ductility factor µ and
response modification factor R. The desired opening configurations were decided and the
responding response modification factor was derived accordingly.

18
CHAPTER 4
TEST PROGRAM
The test program of this research was conducted during the time period from November
2012 to February 2013 in the NUCONSTEEL Materials Testing Laboratory at the University of
North Texas, Denton Texas. A total of 21 monotonic and cyclic shear wall tests were included in
the scope of this research, of which the author was responsible for the testing and data
explanation. For each shear wall configuration, minimum one monotonic and one cyclic test
were carried out to ensure a minimum level of reliability / validity of the test data.
With the intension to develop the optimal opening pattern on the sheathing, the shear wall
configurations were designed as the test events were performed accordingly. For particular wall
configurations, because of their attracted behavior character, additional specimen was built and
to acquire sufficient validation.
4.1 Test Setup
The monotonic tests and the cyclic tests were conducted on a 16 ft. span, 12 ft. high self-
equilibrating steel testing frame installed in the NUCONSTEEL Materials Testing Laboratory of
the University of North Texas. The testing frame was equipped with one MTS35-kip hydraulic
actuator with 5-in. stroke. A MTS407 controller and a 20-GPM MTS
hydraulic power unit
were employed to drive the loading system. A 20 kips TRANSDUCER TECHNIQUESSWO
universal compression/tension load cell was pin-connected the actuator loading shaft to the T
shape load beam. Five NOVOTECHNICposition transducers were employed to measure the
horizontal displacement at the top of the wall, and the vertical and horizontal displacements of
the bottoms of the two boundary studs. The data acquisition system consisted of a National
Instrumentsunit (including a PCI6225 DAQ card, a SCXI1100 chassis with SCXI1520 load cell

19
sensor module and SCXI1540 LVDT input module) and an HP Compaqdesktop. The applied
force and the five displacements were measured and recorded instantaneously during the test.
The test wall was bolted to the base beam and loaded horizontally at the top. The base
beam was 5 in. × 5 in. × ½-in. structural steel tube and was bolted to a W16 × 67 structural steel
beam which was anchored to the concrete floor. One web of the structural tube base beam was
cut out in several locations to provide access of the anchor bolts connecting hold-downs to the
base beam. Figure 3 illustrates the test setup of a typical 8 ft. × 4 ft. CFS shear wall assembly.
Figure 4 shows the front view of the test frame with an 8 ft. × 4 ft. steel shear wall and Figure 5
shows the back view of the test installation.
Figure 3. Testing frame with 8 ft. × 4 ft. wall assembly

20
Figure 4. Front view of the test setup
Figure 5. Back view of the test setup
Out-of-plane support
Load cell Hydraulic
actuator
Steel base beam
Transducer
Out-of-plane support
Hydraulic
actuator
Holes cut for anchor bolts fixing
T-shape load beam

21
The lateral load initiated by the actuator was applied directly to the T-shape steel load
beam which was attached to the top track with 2 – No.12-14 × 1 ¼ in. hex head self-drilling
screws scheduled every 3 in. on center. Consequently, a uniform linear racking force could be
transmitted to the top track of the shear wall. The stem of the T-shape beam was placed in the 1.0
in. gap between the rollers located on the front and back side of the shear wall specimen so that
the out-of-plane movement of the wall was prevented by the rollers. The rotation of the rollers
could not only reduce the friction generated from the T-shape beam in plane movement to avoid
stuck during the test but also worked as a guide for the loading T-shape as well. Two Simpson
Strong-Tie ®
S/HD15S hold-down with 33 pre-drilled holes corresponding to No.14-14 × 1 in.
hex head self-drilling were used as the anchorage system.
4.2 Test Procedure
Both the monotonic and the cyclic tests were conducted in a displacement control mode.
The procedure of the monotonic tests was in accordance with ASTM E564 (2006) “Standard
Practice for Static Load Test for Shear Resistance of Framed Walls for Buildings.” A preload of
approximately 10% of the estimated ultimate load was applied first to the specimen and held for 5
minutes to seat all connections. After the preload was removed, the incremental loading procedure
followed until structural failure was achieved using a load increment of 1/3 of the estimated
ultimate load.
The CUREE protocol, in accordance with ICC-ES AC130 (2004), was chosen for the
reversed cyclic tests. The CUREE basic loading history shown in Figure 6 includes 43 cycles
with specific displacement amplitudes, which are listed in Table 5. The specified displacement
amplitudes are based on a percentage of the ultimate displacement capacity determined from the
monotonic tests. The ultimate displacement capacity is defined as a portion (i.e. γ=0.60) of

22
maximum inelastic response, Δ, which corresponds to the displacement at 80% peak load.
However, the CUREE protocol was originally developed for wood frame structures, and it was
found in this test program that using 0.60Δm as the reference displacement was not large enough
to capture the post peak behavior of the sheet steel walls in the cyclic test. Therefore, the lesser
of 2.5% of the wall height (2.4-in.for 8 ft. high wall) and the displacement at the peak load in the
monotonic tests was used as the reference displacement in the CUREE protocol. A constant
cycling frequency of 0.2-Hz (5 seconds) for the CUREE loading history was adopted for all the
cyclic tests in this research.
Table 5. CUREE basic loading history
Cyclic No. % Δ Cyclic No. % Δ Cyclic No. % Δ Cyclic No. % Δ
1 5 12 5.6 23 15 34 53
2 5 13 5.6 24 15 35 100
3 5 14 10 25 30 36 75
4 5 15 7.5 26 23 37 75
5 5 16 7.5 27 23 38 150
6 5 17 7.5 28 23 39 113
7 7.5 18 7.5 29 40 40 113
8 5.6 19 7.5 30 30 41 200
9 5.6 20 7.5 31 30 42 150
10 5.6 21 20 32 70 43 150
11 5.6 22 15 33 53
23
0 50 100 150 200 250-250
-200
-150
-100
-50
0
50
100
150
200
250
Time (s)
Specim
en D
isp.(
%D
elta)
Figure 6. CUREE basic loading history (0.2 Hz)
4.3 Test Specimens
The specimens tested in this research just included one type dimension: 8 ft. (high) × 4 ft.
(wide) (2:1 aspect ratio). Test No.1 to No.19 used 0.027 in. thickness low profile (Figure 8)
corrugated sheet steel and Test No.20 & 21 used 15/32 in. 4-ply plywood and 7/16 in OSB
respectively. The corrugated sheet steel (metal decking) was manufactured by Vulcraft
manufacturing company. The deck type was 0.6C, 0.027 in. (22 gauge) corrugated steel sheet
with 9/16 in. rib height (Figure 7). The sheathing was installed one side of the wall. For each
wall specimen, the sheathing was made of three corrugated steel sheets which were connected by
single line of screws. Due to the metal sheathing profile, the spacing of the screws was limited to
a 2.5 in. module along the members. Fastener spacing at horizontal seams used 2.5 in. as well

24
while 5 in. fastener spacing was used along the middle stud. 12 types of the sheathing opening
configurations were designed and examined in this research as listed in Table 6: Type 1:
corrugated sheathing without holes; Type 2: corrugated sheathing without stitch fasteners along
the horizontal seam joint; Type 3: corrugated sheathing with six 6-in. diameter circular holes;
Type 4: corrugated sheathing with six 4-in. diameter holes; Type 5: corrugated sheathing with
six 6-in. length vertical slits; Type 6: corrugated sheathing with twenty-four 3-in. diameter holes;
Type 7: corrugated sheathing with twenty-four 3-in. vertical slits; Type 8: corrugated sheathing
with twenty-four 3-in. horizontal slits; Type 9: corrugated sheathing with twelve 2-in. vertical
slits; Type 10: corrugated sheathing with twenty-four 1-in. vertical slits; Type 11: corrugated
sheathing with twenty-four 2-in. vertical slits; Type 12: one plywood and one OSB shear wall for
comparison. Table 6 listed the test matrix and Figure 8~19 shows the opening configuration of
the corrugation sheathed steel framed shear wall. Enlarged figures of the wall configurations
were attached in Appendix C.
3'-15/16''
9/16
"
9/16''2 1/2''
Figure 7. Corrugated sheet steel profile

25
2'-0.0"2'-0.0"
2.5"
3.5"11.5" 3.5"11.5"
2'-0.0"
2'-6
.5"
2'-1
1.0
"2
'-6
.5"
2'-0.0"
2'-6
.5"
2'-1
1.0
"2
'-6
.5"
5.0
"
2.5
"
Figure 8. Wall configuration Type 1 Figure 9. Wall configuration Type 2
Dia.6.0"Dia.4.0"
3.5"11.5"3.5"11.5"
2'-0.0"2'-0.0" 2'-0.0"2'-0.0"
1'-10.5
"1'-10.5
"2'-1.5
"2'-1.5
"
10.0" 1'-2.0" 10.0"1'-2.0" 1'-10.5
"1'-10.5
"2'-1.5
"2'-1.5
"
10.0" 1'-2.0" 10.0"1'-2.0"
2'-6.5
"2'-11.0
"2'-6.5
"
2'-6.5
"2'-11.0
"2'-6.5
"
Figure 10. Wall configuration Type 3 Figure 11. Wall configuration Type 4

26
Dia.3.0"
3.5"11.5" 3.5"11.5"
2'-0.0"2'-0.0"
6.0
"
2'-0.0"2'-0.0"
1'-1
0.5
"1
'-1
0.5
"2
'-1.5
"2
'-1.5
"
10.0" 1'-2.0" 10.0"1'-2.0"
7.0" 10.0" 7.0"
1'-0.0
"
7.0"10.0"7.0"
1'-0.0
"1
'-0.0
"1
'-0.0
"1
'-6.0
"1
'-0.0
"1
'-6.0
"
2'-6.5
"2
'-1
1.0
"2
'-6.5
"
2'-6.5
"2
'-1
1.0
"2
'-6.5
"
Figure 12. Wall configuration Type 5 Figure 13. Wall configuration Type 6
3.5"11.5" 3.5"11.5"
2'-0.0"2'-0.0"
7.0" 10.0" 7.0" 7.0"10.0"7.0"
2'-0.0"2'-0.0"
7.0" 10.0" 7.0" 7.0"10.0"7.0"
1'-0
.0"
11
.9"
1'-0
.0"
1'-0
.0"
1'-6
.0"
1'-0
.0"
1'-6
.0"
3.0
"
1'-0
.0"
11
.9"
1'-0
.0"
1'-0
.0"
1'-6
.0"
1'-0
.0"
1'-6
.0"
3.0"2'-6
.5"
2'-1
1.0
"2
'-6
.5"
2'-6
.5"
2'-1
1.0
"2
'-6
.5"
Figure 14. Wall configuration Type 7 Figure 15. Wall configuration Type 8
27
3.5"11.5" 3.5"11.5"
2'-0.0"2'-0.0"
7.0" 10.0" 7.0" 7.0"10.0"7.0"
2'-0.0"2'-0.0"
1'-0.0" 1'-0.0"
1'-0.0
"
1'-0.0"1'-0.0"
11.9
"1'-0.0
"1'-0.0
"1'-6.0
"1'-0.0
"1'-6.0
"
2.0
"
1'-0.0
"11.9
"1'-0.0
"1'-0.0
"1'-6.0
"1'-0.0
"1'-6.0
"
1.0
"
2'-6.5
"2'-11.0
"2'-6.5
"
2'-6.5
"2'-11.0
"2'-6.5
"
Figure 16. Wall configuration Type 9 Figure 17. Wall configuration Type 10
3.5"11.5"3.5"11.5"
2'-0.0"2'-0.0"
8'-0.0
"
2'-0.0"2'-0.0"
7.0" 10.0" 7.0" 7.0"10.0"7.0"
1'-0.0
"11
.9"
1'-0.0
"1'-0.0
"1'-6.0
"1'-0.0
"1'-6.0
"
2.0
"
2'-6.5
"2'-11.0
"2'-6.5
"
Figure 18. Wall configuration Type 11 Figure 19. Wall configuration Type 12

28
Above figures show the dimensions of the corrugation sheathed steel framed shear wall,
opening pattern and size, anchor bolts, and the hold-downs. Both boundary studs used double C-
shaped studs fastened together back -to-back with No. 12 ×1 in. hex head self-drilling screws
pairs at 6-in on center. While the middle stud used one C-shaped stud at the half width of the
wall. One U-shaped steel member used as top and bottom tracks respectively. Studs were
inserted into tracks and flanges were attached with No. 8 × 18-1/2 in. modified truss head self-
drilling screws on the front side while No. 12 ×1 in. hex head self-drilling screws, which
assembly constructed the shear wall frame at back side. 0.068-in. thickness SSMA (Steel Studs
Manufacturers Association) standard framing members were adopted as the wall assembles. Two
Simpson Strong-Tie®
S/HD15S (Figure 20) hold-down were attached to both boundary studs
from inside by using a total of 33 - No. 14×1 in. hex washer head self-drilling screws. Since
shear failure resulting from the screws connecting hold-down to boundary studs occurred in Yu
(2009), in this research, the connection was strengthened by welding the hold-down to boundary
studs at the stud punch-out location and hold-down top edge (Figure 21). Also the material
strengths were obtained by coupon tests on the untested but same batch of materials at the end of
this test program.

29
Figure 20. Simpson Strong-Tie® S/HD15S
Figure 21. Simpson Strong-Tie® S/HD15S Hold-down welding connection

30
Table 6. Test matrix for shear wall test
Test
lable
Opening
configuration Test protocal
Test
Number
Nominal
framing
thickness
Nominal
sheathing
thickness
Fastener
spacing Hold-down
Type 1 no opening
Monotonic-ASTM
E564 No.2 & 12
68 mil 27 mil 2.5"/5" S/HD15S
Cyclic-CUREE No.7 & 19
Type 2 no seam
screws
- - 68 mil 27 mil 2.5"/5" S/HD15S
Cyclic-CUREE No.1
Type 3 6x6" circular
holes
Monotonic-ASTM
E564 No.3
68 mil 27 mil 2.5"/5" S/HD15S
Cyclic-CUREE No.4 & 8
Type 4 6x4" circular
holes
- - 68 mil 27 mil 2.5"/5" S/HD15S
Cyclic-CUREE No.5
Type 5 6x6" vertical
slit
- - 68 mil 27 mil 2.5"/5" S/HD15S
Cyclic-CUREE No.6
Type 6 24x3" circular
holes
- - 68 mil 27 mil 2.5"/5" S/HD15S
Cyclic-CUREE No.9
Type 7 24x3"
vertical slit
-
68 mil 27 mil 2.5"/5" S/HD15S Cyclic-CUREE
No.10 &
13
Type 8 24x3"
horizontal slit
- - 68 mil 27 mil 2.5"/5" S/HD15S
Cyclic-CUREE No.11
Type 9 12x2"
vertical slit
- 68 mil 27 mil 2.5"/5" S/HD15S
Cyclic-CUREE No.14
Type 10 24x1" vertical
slit
- - 68 mil 27 mil 2.5"/5" S/HD15S
Cyclic-CUREE No.16
Type 11 24x2" vertical
slit
Monotonic-ASTM
E564 No.18
68 mil 27 mil 2.5"/5" S/HD15S
Cyclic-CUREE No.15 &
17
Type 12 plywood &
OSB
- -
68 mil 27 mil 2.5"/5" S/HD15S Cyclic-CUREE
No.20 &
21
A small length curve was created between flange and web when the U-shaped track was
cold formed from a thin flat sheet steel. When the 8 ft. long studs were inserted into the track
opened flanges, the studs end contacted the track web tightly and a gap between them was
existed. This gap, plus the web thickness made the shear wall height a little longer than 8 ft., i.e.
8 ft. 0.2 in. Considering the original manufacturing width of the corrugated sheathing 3ft.-15/16

31
in., one shear wall should comprise of three corrugated sheets but need to be cut off a length to
fit the shear wall height. Figure 22 shows the detailed cutting pattern of the metal sheathing.
Figure 23 shows the utilization of plasma cutter in the cutting of sheathing edge and circular
holes while Figure 24 shows that a grinder with 0.045 in. thickness sand blade was used in the
cutting of slits. The cutting pattern of slits used less labor time and simple machines and it was
easy to control the cutting quality, moreover there is hardly limitation to carry out this work
procedure on the job site. Whereas in the cutting of circular holes, the sheathing should either be
pre-cut by a special machine before the wall is constructed or cut by a very skilled worker after
constructed but it is very hard to control the cutting quality. Figure 25 illustrating gives the
cutting width of 3-in. long vertical slits and an average width 0.059-in. was adopted in this
research.
cut off
cut off
0.1"
2'-6.0" 2'-11.0"
8'-0.0"
2'-6.0"
8'-0.2"
Figure 22. Corrugation cutting pattern

32
Figure 23. Plasma cutter operation
Figure 24. Grinder cutter operation

33
0.073" 0.070" 0.048" 0.058"
0.070" 0.056" 0.060" 0.060"
0.054" 0.057" 0.064" 0.054"
0.059" 0.061" 0.060" 0.054"
0.058" 0.064" 0.056" 0.052"
0.060" 0.059" 0.055" 0.069"
Figure 25. Cutting width of slits
The details of the components of the tested steel sheet walls are given as follows:
Studs:
• 350S162-68 SSMA structural stud, 0.068-in. 3-1/2-in. × 1-5/8-in. made of ASTM A
1003 Grade 33 steel.
Tracks:
• 350T150-68 SSMA structural track, 0.068-in. 3-1/2-in. × 1-1/2-in. made of

34
ASTM A 1003 Grade 33 steel.
Sheathing:
• 0.027-in. thick ASTM A1003 Fy= 90 ksi high strength steel.
• Steel sheet was installed on one side of the wall assembly.
• 15/32-in. thick plywood.
• 7/16-in. thick OSB.
Framing and Sheathing Screws:
• No. 12×1-in. hex washer head screws. Spacing along panel edge is 2.5-in. o.c.. Spacing
in the field of the sheathing is 5-in. for all specimen configurations.
Hold-Downs:
• Simpson Strong-Tie®
S/HD15S hold-downs with 33 - No. 14×1-in. HWH self- drilling
screws, and were welded to boundary studs with 1/8-in. fillet weld around the stud
punch-out and top edge of the hold-downs.
Tension Anchor Bolts:
• 5/8-in. diameter Grade 8 anchor bolts with standard cut washers and nuts. Two
bolts were used for each wall assembly to anchor the boundary studs to base beam.
• 3/4-in. diameter Grade 8 anchor bolts with standard cut washers and nuts. Two
bolts were used for each wall assembly to anchor the boundary studs to base beam.
Shear Anchor Bolts:
• 5/8-in. diameter Grade 5 anchor bolts with standard cut washers and nuts. Two
bolts were used for each wall assembly.

35
4.4 Material Properties
Coupon tests were conducted according to the ASTM A370 (2006) “Standard Test
Methods and Definitions for Mechanical Testing of Steel Products” to obtain the actual
properties of the test materials in this project. The coupon test results were summarized in Table
7. The coating on the steel was removed by hydrochloric acid prior to the coupon tests. The
coupons test specimens were tensioned on the INSTRON®
4482 universal testing machine. An
INSTRON®
2630-106 extensometer was employed to measure the tensile strain. The tests were
conducted in displacement control at a constant rate of 0.05 in./min. A total of three coupons
were tested for each member, and the average results are provided in Table 7.
Table 7. Material properties
Component
Uncoated
Thickness
(in.)
Yield
Stress
Fy (ksi)
Tensile
Strength
Fu (ksi)
Fu/Fy
Ratio
Elongation
for 2 in. Gage
Length (%)
0.027 in. corrugated sheet 0.0290 95.00 96.50 1.02 22.2%
68 mil stud 0.0711 55.85 69.81 1.25 18.2%
68 mil track 0.0721 54.33 71.63 1.32 20.0%
All the coupons meet the minimum ductility requirement by North American
Specification for Design of Cold-Formed Steel Structural Members (2007) Edition (NASPEC
2007), which requires the tensile strength to yield strength ratio greater than 1.08, and the
elongation on a 2-in. gage length higher than 10%.

36
CHAPTER 5
TEST RESULTS AND DISCUSSION
A total of 21 monotonic and cyclic tests were conducted in this research. The specimens
tested in this research included one type dimension: 8 ft. (high) × 4 ft. (wide) (2:1 aspect ratio).
Test No.1 to No.19 used 0.027 in. thickness low profile corrugated sheet steel and Test No.20 &
21 used 15/32 in. 4-ply plywood and 7/16 in OSB respectively. Fastener spacing along boundary
studs and at horizontal seams used 2.5 in. while 5 in. fastener spacing was employed along the
middle stud. The test results for this research are summarized in Table 8. The displacements in
Table 8 represent the lateral displacement of the wall top at the peak load. The ductility factor, µ,
is defined as the ratio of the ultimate displacement (Δu) and the yield displacement (Δy), µ=Δu/Δy.
The response modification factor R, was calculated from the ductility factor and expressed by
equation R= . The Δu and Δy are determined in accordance with ASTM E2126 (2007).
The observed failure mechanism is listed in Table 9. The detailed test results are provided in
Appendix A, in which measured responses of all of the tested shear walls, Matlab EEEP plotting,
and related photos showing shear wall behavior are included.
Type 1 configuration, shear wall without any opening on the 27 mil corrugated sheathing,
included 4 individual tests, two monotonic and two cyclic. In No.2 monotonic test, when the
shear wall peak load reached 17 kips resulting 39.18 kips applied force in the tension anchor bolt,
the tension bolt of the hold-down was broken. The tensile capacity of Grade 8 5/8-in. diameter
bolt is 46.02 kips which is greater than the actual applied force 39.18 kips. Since the anchor bolts
have been used in previous cyclic tests, this failure probably resulted from the high fatigue stress
in the bolts. In No.7 cyclic test, to avoid the bolts tension failure, two new Grade 8 5/8-in.
diameter bolts were employed. In the test, one anchor broken in the positive actuator stroke at

37
first post-peak loop and another bolt failed in the negative actuator stroke at first post-peak loop
as well. The working load in the anchor were 39.65 kips and 39.24 kips respectively, which
value are still less than the tensile capacity. The test results from test No.2 & No.7 should not be
included in further analysis because the failure modes were not expected.
Table 8. Summary of shear wall test results
wall
configuratio
n
test number peak load (lbf) lateral
deflection at
peak load (in.)
average
peak
load
(lbf)
average
deflection
(in)
average
stiffness
(lb/in.)
+p -p +Δ -Δ
Type 1
No.2_no holes_monotonic 4152.5 - 2.326 - 4152.5 2.326 9195
No.12_no holes_monotonic 5007.5 - 3.032 - 5007.5 3.032 10879
No.7_no holes_cyclic 4265.0 4312.5 2.490 2.278 4288.8 2.384 10430
No.19_no holes_cyclic 5257.5 4807.5 2.800 2.326 5032.5 2.563 10971
Type 2 No.1 no stitch screws 2276.3 2102.3 2.585 2.598 2189.3 2.592 8601
Type 3
No.3_6x6 holes_monotonic 3222.5 - 3.097 - 3222.5 3.097 5399
No.4_6x6 holes_cyclic 3295.0 3002.5 2.820 2.266 3148.8 2.543 6333
No.8_6x6 holes_cyclic 3027.5 2817.5 3.027 2.314 2922.5 2.671 6892
Type 4 No.5_6x4 holes_cyclic 3882.5 3582.5 2.865 2.167 3732.5 2.516 8489
Type 5 No.6_6x6 slits_cyclic 2865.0 2640.0 2.153 1.586 2752.5 1.870 8045
Type 6 No.9_24x3 holes_cyclic 3027.5 2850.0 3.461 3.187 2938.8 3.324 5678
Type 7 No.10_24x3 slits_cyclic 2950.0 2925.0 3.223 3.308 2937.5 3.266 8568
No.13_24x3 slits_cyclic 3180.0 2747.5 2.598 2.290 2963.8 2.444 8310
Type 8 No.11_24x3 horiz.
slits_cyclic 4130.0 4182.5 1.921 2.010 4156.3 1.966 11132
Type 9 No.14_12x2 slits_cyclic 3920.0 3217.5 2.138 1.584 3568.8 1.861 11392
Type 10 No.16_24x1 slits_cyclic 4757.5 4475.0 2.432 2.339 4616.3 2.385 11129
Type 11
No.18_24x2
slits_monotonic 3092.5 - 2.801 - 3092.5 2.801 8480
No.15_24x2 slits_cyclic 3207.5 2982.5 3.465 2.150 3095.0 2.808 11126
No.17_24x2 slits_cyclic 3110.0 3095.0 2.861 2.315 3102.5 2.588 9987
Type 12 No.20_plywood_cyclic 3505.0 2927.5 3.263 2.337 3216.3 2.800 6939
No.21_OSB_cyclic 3595.0 3282.5 3.336 3.542 3438.8 3.439 8318

38
Table 9. Failure mode of the tested shear walls wall
configuration
Test
number
Observed failure mode
Type 1 No.2, 7, 12
& 19
two specimens failed in the breaking of hold down bolts. In other two test, the sheathing
buckled, screws in the middle studs were pulled over.
Type 2 No.1 the upper sheet steel was gouged slot hole due to the reverse cyclic movement, screws in the
boundary studs were pulled over.
Type 3 No.3, 4, 8 large relative out-of-plane movement of the sheet elements at the both sides of circles ,
resulting in the rupture of sheathing.
Type 4 No.5 large relative out-of-plane movement of the sheet elements at the both sides of circles,
resulting in the rupture of sheathing. some screws were pulled over through head.
Type 5 No.6 large relative out-of-plane movement of the sheet elements at the both side of vertical slits,
resulting in the rupture of sheathing.
Type 6 No.9 large relative out-of-plane movement of the sheet elements at the both side of circles,
resulting in the rupture of sheathing. screws along the lower seam joint became loose.
Type 7 No.10 & 13 large relative out-of-plane movement of the sheet elements at the both side of vertical slits,
resulting in the rupture of sheathing. screws along the lower seam joint became loose.
Type 8 No.11 specimen failed in the breaking of hold down bolts. No other failure was observed.
Type 9 No.14
large relative out-of-plane movement of the sheet elements at the both side of vertical slits,
resulting in the rupture of sheathing. The slits which was aligned vertically connected
together.
Type 10 No.16 the lower sheet steel overall buckled and unzipped.
Type 11 No.15, 17 &
18
large relative out-of-plane movement of the sheet elements at the both side of vertical slits,
resulting in the rupture of sheathing. Some screws became loose.
Type 12
No.20 shear failure resulting in rupture of sheathing horizontally. Then sheathing failed in bearing
around screws on the boundary stud.
No.21 screws were pulled through head along boundary stud and bottom track.
In No.12 and No.19 tests, Grade 8 3/4-in. diameter bolts were applied, which have theoretically
minimum tensile capacity 66.27 kips. In test No.12, on the bottom corrugated sheet, shear
bucking was first observed and became evident with the increasing of horizontal shear force.
When the peak load was achieved, the metal sheathing failed suddenly with large out-of-plane
deformation accompanied by screws pulling over. And a 30 degree half-wave appeared. Same
failure mode was observed in No.19 cyclic test. From the validated test No. 12 & 19, shear walls
without any opening were found to be stronger but less ductile.

39
Figure 26. Failure mode of wall configuration Type 1
Shear wall Type 2, because no stitch screws were applied along the horizontal overlap
joints, the metal sheets worked individually while not a whole sheathing under external force. In
the test, large relative horizontal movement was found between every two adjacent sheets. In
below Figure 27, because of missing of stitch screws, horizontal shear force could not be
transferred to bottom track, the force in the screws along the both edges made the boundary studs
in bending about the weak section axis. Screws at the sheet corner have the maximum shear
force. The metal sheet was gouged long slots on the vertical edge and middle horizontal edge due
to large relative movement. When the shear wall works in a real building, vertical force due to
live load and dead load will also be applied on the studs. Without the stitch screws along the
overlap joint, the metal sheathing will not supply enough restraint of the studs, the effective
length of boundary members under compression will increase. This will result in premature
failure of the wall assembly before development of shear wall capacity. Based on the failure

40
mode and the wall capacity and stiffness, this configuration was concluded as undesired and
improvement in the opening configuration was needed.
Figure 27. Relative deformation of metal sheet of shear wall
Figure 28. Failure mode of wall configuration Type 2
For Type 3 shear wall with six 6-in. diameter circular openings, one monotonic and two
cyclic specimens were tested. The circular opening weakened the sheathing integrity and reduced
the out-of-plane stiffness. In the test, relatively large out-of-plane movement of the corrugation
41
portion mirrored by vertical diameter of the circular was observed. The relative deformation
would be incremental with the increasing of the shear wall top displacement. The materials of
sheet steel at top and bottom point in the circular opening perimeter yielded first and then passed
harden stage and at last the steel elongation exceeded material capacity. And then the sheet was
torn apart at top and bottom point of the circle due to out-of-plane deformation. The average
shear wall strength of Type 3 tested wall was 3181 plf. which was greater than the highest
recommendation value of 3080 plf. of 7/16-in. OSB sheathing shear wall from the AISI S213-07.
But the stiffness degraded 37% and peak load dropped about 39.5% compared with no-opening
shear wall.
Figure 29. Failure mode of wall configuration Type 3
Type 4 shear wall with six 4-in diameter circular opening had the failure mode as Type 3.
In addition, screws on the lower sheet-to-sheet connection joint became loose. Even though the
stiffness and peak load improved in comparison with walls in Type 3, the ductility factor reduced
from 2.415 to 2.039 which make the opening configuration be dropped.

42
Figure 30. Failure mode of wall configuration Type 4
Type 5 shear wall with six 6-in vertical slits, has the same opening arrangement pattern as
Type 3. The 6-in cutting caused the two portions of the sheathing along the slits free edge and
make it unstable and be apt to buckle under in-plane shear force. Large relative out-of-plane
movement of the sheet elements at the both side of vertical slits was observed. The rupture
started from the two end points of slits and extended vertically up and down. The two adjacent
slits aligned in vertical not connected together after both were stretched longer than their original
dimension. Comparing to 6×6-in circular opening, the shear wall stiffness increased, but it didn’t
present an expected higher ductility factor.

43
Figure 31. Failure mode of wall configuration Type 5
The cutting pattern 24×3-in circular opening of shear wall Type 6 derived from the
“equal opening area”, i.e. twenty-four 3-in. diameter circle equal to six 6-in. diameter circle in
area. Those twenty-four circular openings spread on the sheathing uniformly, so the stiffness
reduction of the metal sheet at each opening location was not as higher as that of 6-in. circular
holes. Same failure mode as that of 6-in holes wall was observed, and similar shear wall stiffness
and ductility exhibited in this 24x3-in pattern wall.

44
Figure 32. Failure mode of wall configuration Type 6
With the concept of the cutting “small size but more quantity”, 24x3-in vertical slits
cutting configuration was applied in shear wall test Type 7, which cutting arrangement was
identical to 24x3-in holes in Type 6. Also, the stiffness reduction of the metal sheet at each
cutting location was lower than that of 6-in vertical slits in shear wall Type 5. Same failure mode
as that of 6-in vertical slits wall was found, but because the original short cutting did not weaken
the wall a lot, the slits were extended progressively and the shear wall stiffness degraded
gradually. And a good average ductility of 3.532 was achieved.

45
Figure 33. Failure mode of wall configuration Type 7
A high expectation was given to shear wall Type 8, 24x3-in. horizontal slits, but the shear
wall behaved same as wall test No.7 in Type 1. The 5/8-in. bolts failed in tension and the wall
did not exhibit any damage which means the short horizontal slits will not affect the shear wall
behavior.
Figure 34. Failure mode of wall configuration Type 8
46
In order to improve the shear wall stiffness and at the same time remain good ductility,
12×2-in vertical slits were cut in shear wall Type 9. Same failure mode of wall with slits was
observed. Firstly, the sheathing at slits was torn apart and it developed up and down. The torn
slits extended so fast that slits aligned in vertical connected together at last. The long stretched
slits (Figure 35) from the connected individual made a huge drop of the peak load 30% (Figure
36) between the two adjacent loops. The connected slits developed up to the overlap joint and
down to the bottom track.
Figure 35. Failure mode of wall configuration Type 9

47
-5 -4 -3 -2 -1 0 1 2 3 4 5-4000
-3000
-2000
-1000
0
1000
2000
3000
4000
Drift (in.)
Shear
resis
tance (
lbs/in.)
Figure 36. Hysteresis curve of wall configuration Type 9
Type 10, 24x1-in. vertical slits shear wall was tested in No. 16. Same as the failure mode
in the no-opening shear wall test No.12 and 19, the metal sheathing of test No.16 buckled due to
in-plane shear force and that resulted in the screws pulling over along the edge and middle studs
and the sheet steel detached at those connection joints. The shear wall showed high peak load
and stiffness but weak ductility. No slits was observed to be torn apart, it could conclude that
vertical slits which can’t be cut through the corrugation rib will not affect the shear wall behavior.
30%
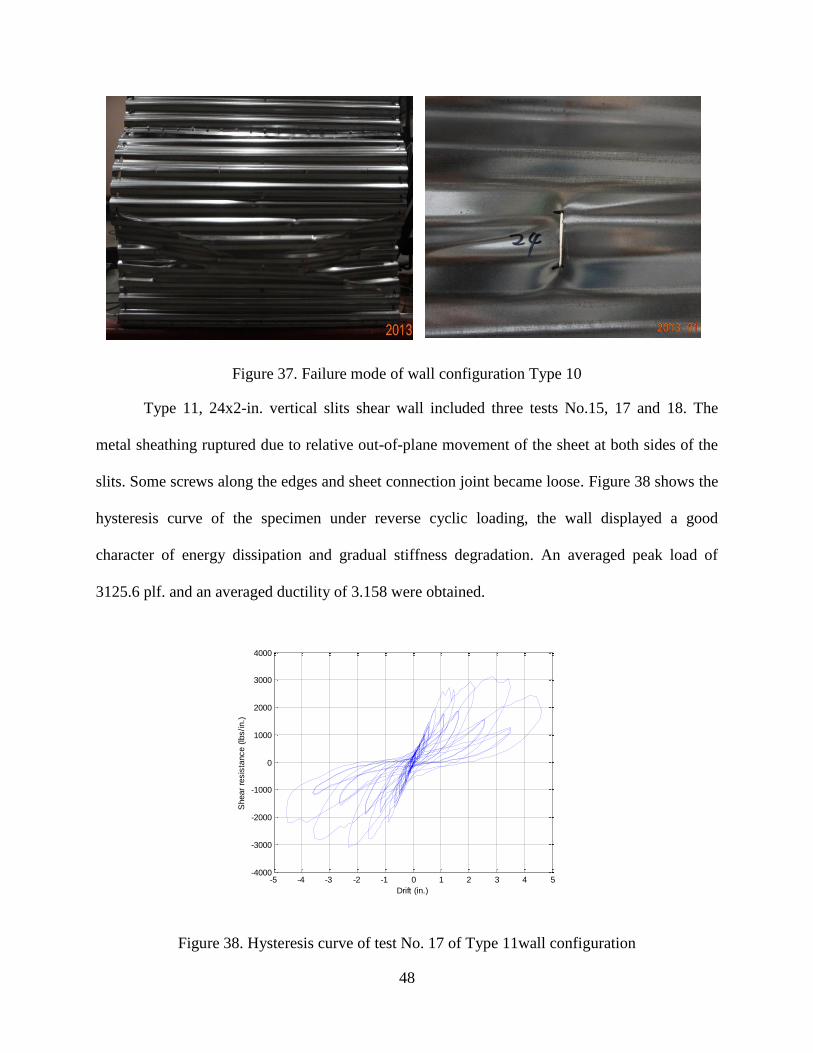
48
Figure 37. Failure mode of wall configuration Type 10
Type 11, 24x2-in. vertical slits shear wall included three tests No.15, 17 and 18. The
metal sheathing ruptured due to relative out-of-plane movement of the sheet at both sides of the
slits. Some screws along the edges and sheet connection joint became loose. Figure 38 shows the
hysteresis curve of the specimen under reverse cyclic loading, the wall displayed a good
character of energy dissipation and gradual stiffness degradation. An averaged peak load of
3125.6 plf. and an averaged ductility of 3.158 were obtained.
-5 -4 -3 -2 -1 0 1 2 3 4 5-4000
-3000
-2000
-1000
0
1000
2000
3000
4000
Drift (in.)
Shear
resis
tance (
lbs/in.)
Figure 38. Hysteresis curve of test No. 17 of Type 11wall configuration

49
For comparison, Type 12, including one plywood and OSB sheathing shear walls were
tested. Specimen of test No.20 failed in shear resulting in transverse fracture of sheathing
horizontally. With increased displacement, bearing of the panel at the vertical edge of the panel
fractured panel edge. Specimen of test No. 21, failed in fasteners along the edge and horizontal
joints pulling through of screw head. The wood panel shear wall showed high shear strength, but
also exhibit unanticipated low stiffness and ductility.
Figure 39. Failure mode of plywood wall of configuration Type 12
Figure 40. Failure mode of OSB of configuration Type 12

50
A limitation on the maximum inelastic lateral displacement of a shear wall may affect the
determination of shear wall nominal strength. ASCE7-05 requires the inelastic drift for structures
use shear wall lateral system less than 2.5% of wall height, i.e. Δ2.5% = 2.4-in for 8 ft. high shear
wall. Figure 41 shows how to determine the nominal strength of the tested shear wall in terms of
magnitude of peak displacement Δu and the inter-storey drift Δ2.5%. In Figure (a), if the inelastic drift
Δ2.5% (2.4-in) is greater than the shear wall peak displacement Δu, the nominal shear strength of the wall is
just valued in the peak load Fpeak. While in Figure (b), when the inelastic drift Δ2.5% falls between the
interval 0 and Δu, the nominal strength of the wall should value in the load on the curve responding to the
displacement of Δ2.5%. And the modified summary of shear wall tested results was given in Table 10.
max400
400F
Test curve
LOAD
DISP.
peakF
u 2.5% max400
400F
Test curve
LOAD
DISP.
peakF
u2.5%
nomi.F
(a) (b)
Figure 41. Shear wall load-displacement relationship curve

51
Table 10. Shear wall modified nominal strength
Wall
configuration test number
nominal
strength
Pn (lbf)
deflection
(in)
average
stiffness
(lb/in.)
Type 1
No.2_no
holes_monotonic 4152.5 2.326 9195
No.12_no
holes_monotonic 4640.0 2.400 10879
No.7_no holes_cyclic 4146.3 2.400 10430
No.19_no holes_cyclic 4782.5 2.363 10971
Type 2 No.1 no stitch screws 2107.1 2.400 8601
Type 3
No.3_6x6
holes_monotonic 2797.5 2.400 5399
No.4_6x6 holes_cyclic 2930.0 2.333 6333
No.8_6x6 holes_cyclic 2628.0 2.357 6892
Type 4 No.5_6x4 holes_cyclic 3732.5 2.283 8489
Type 5 No.6_6x6 slits_cyclic 2752.5 1.870 8045
Type 6 No.9_24x3 holes_cyclic 2633.8 2.360 5678
Type 7 No.10_24x3 slits_cyclic 2697.5 2.278 8568
No.13_24x3 slits_cyclic 2890.0 2.345 8310
Type 8 No.11_24x3 horiz.
slits_cyclic 4156.3 1.966 11132
Type 9 No.14_12x2 slits_cyclic 3568.8 1.861 11392
Type 10 No.16_24x1 slits_cyclic 4616.3 2.189 11129
Type 11
No.18_24x2
slits_monotonic 2965.0 2.400 8480
No.15_24x2 slits_cyclic 3018.8 2.189 11126
No.17_24x2 slits_cyclic 3013.0 2.189 9987
Type 12 No.20_plywood_cyclic 2915.0 2.278 6939
No.21_OSB_cyclic 3166.3 2.267 8318

52
CHAPTER 6
SEISMIC RESPONSE MODIFICATION FACTOR FOR COLD- FORMED STEEL FRAME /
CORRUGATED SHEET STEEL
6.1 Introduction
Seismic design codes in the United States were initiated in the late 1920’s with some
relatively simple equivalent static formulas. The development of earthquake code provisions
proceeded somewhat intermittently until the Structure Engineers Association of California
(SEAOC) in 1959-60 published its Recommended Lateral Force Requirements and Commentary,
which was applicable to California seismic conditions. The SEAOC provisions recognized that
the seismic forces induced in a structure are related to the structure’s mode of deformation and
fundamental period. Seismic codes in the United States and in many other countries have since
been patterned after the SEAOC provisions (N.M. New mark and W.J. Hall 2007).
6.2 The Evolvement of Seismic Provisions in Corresponding Code.
The Seismic design evolution has developed a relationship of load versus strength and
serviceability which was similar to other building loads addressed through the use of equivalent
lateral load procedure. In 1959 published SEAOC Bluebook, the equation presented for building
base shear V was:
V=KCW (1)
In which W was the total dead load, C was related to the building’s natural period, and K
was a “horizontal force factor” related to the building system type:
Table 11. Horizontal Force Factor

53
Building Type K-Horizontal Force Factor
Bearing Wall 1.33
Framing Systems not Classified 1.00
Dual Systems 0.80
Moment Resisting Frames 0.67
In 1985 Uniform Building Code (UBC), the equation expressed in:
V=ZIKCSW (2)
In 1988 Uniform Building Code (UBC), the equation given as the followed form:
V=ZICW/Rw (3)
In equations (2) & (3), the values related to the parameters Z, I, C, S was in a slight different
(Table 12). And from which, the relationship between K and R was derived as:
K=8/Rw (4)
The seismic force values were calculated by equation (3) by dividing forces that would be
associated with elastic response by a response modification factor, often used as the symble “R”.
The concept of a response modification factor was initiated on the basis of the premise that a
well-detailed seismic resistant framing system could bear large inelastic deformation without
collapse (ductile behavior) and could develop lateral strength in excess of their design strength.
The R factor was assumed to represent the ratio of minimum loads required at the design level
ground motion if the framing system were to work entirely elastically to the prescribed design
forces at the significant yield level.

54
Table 12. Seismic parameters comparison
1985 UBC 1988 UBC
V = ZIKCSW V = ZICW/ Rw
Z = 1, ¾, 3/8, 3/16 Z = 0.4, 0.3, 0.2, 0.075
I = 1.0, 1.25, 1.5 I = 1.0, 1.25
C = 1/ 15 T.5 C = 1.25 S/ T
.67
C < 0.12 C < 2.75
C x S < 0.14 C/Rw > 0.075
0.67 ≤ K ≤ 1.33 4 ≤ Rw ≤ 12
In the 2000 version of National Earthquake Hazards Reduction Program (NEHRP), the
total lateral force, i.e. the base shear created by earthquake on a building was given by the
formula:
V=ISDSW/R (5)
V=TISD1W/R (6)
In which, W is the total dead load, I is the importance factor, SDS & SD1 are the design spectral
response acceleration at short periods and at 1 second respectively, T is structure period within the
constant response velocity portion of the design spectrum. Equations (5) & (6), which remained the
format of the response modification factor R to the denominator, are adopted by the current code ASCE-
05 and IBC-06.
6.3 Ductility.
Most structures are not expected, or even designed, to remain elastic under violent
ground motions. Rather, structures are expected to enter the inelastic region-the extent to which
they behave inelastically can be defined by the ductility factor. Using the concept of equivalent
energy elastic plastic model (EEEP) to calculate ductility was first proposed by Park (1989) and
has been adopted by Kawai et al. (1997) in ASCE Structures Congress to analyze light gauge
steel framed walls. The EEEP model results in an idealized bilinear shaped load deflection curve

55
which can provide a realistic depiction of the experimental data in terms of energy dissipation
levels. The EEEP model is based on the notation that the energy dissipated by the wall specimen
during a monotonic or cyclic test is equivalent to the energy represented by the bilinear curve.
The curve represents an ideal perfectly elastic-perfectly plastic shear wall system that is capable
of dissipating an equivalent amount of energy as compared with the real shear wall. EEEP curve
of each specimen under monotonic test was constructed based on the equivalent energy approach,
as illustrated in Figure 42. The first step was to determine the displacement, 400, and the
matching resistance F400. The 400 equaled the shear wall height H divided by 400, H/400, an
estimation of the maximum service displacement level. 400 and F400 were used to define the
stiffness of the elastic portion, Ke, of the bilinear EEEP curve.
Ke=F400/Δ400 (7)
A horizontal line depicting the plastic portion of the EEEP curve was then positioned.
The areas located above and below the EEEP curve, which enclosed by the EEEP curve and the
real test curve were equal. The resulting plastic portion was then defined as the nominal shear
strength, Fy. The failure load is the point on the envelope curve corresponding to the last data
point with the absolute load equal or greater than |0.8*Fpeak| as illustrated in Figure 42. max, the
maximum displacement, which corresponds to the failure load, was then defined accordingly.
And the maximum elastic displacement, y, was defined by the intersection point of the EEEP
curve elastic and plastic portion. As a result, the ductility, µ, could be obtained as the ratio of
maximum displacement to the maximum elastic displacement.
µ=Δmax/Δy (8)
In the case of cyclic test, a backbone curve was first constructed by connecting the peak
point of each excursion using linear lines. Then the same EEEP procedure for monotonic test

56
data was used to produce the EEEP bilinear curve and calculate the ductility for cyclic test result.
The EEEP bilinear curves for representative cyclic tests are depicted in Figure 43.
maxy400
400F
yF
Test curve
EEEP curve
LOAD
DISP.
A1
A2 A1=A2
peakF
uF > peak0.8F
Figure 42. EEEP curve for monotonic test

57
-5 -4 -3 -2 -1 0 1 2 3 4 5-4000
-3000
-2000
-1000
0
1000
2000
3000
4000
Drift (in.)
Shear
resis
tance (
lbs/in.)
Positive envelope
Negative envelope
EEEP curve
Hysteresis loop
Figure 43. EEEP bilinear curves for cyclic test
6.4 Evaluation of Response Modification Factor.
A large portion of discussion of the ductility factor µ has been given above, the question
is how does the ductility factor µ affect the behavior of framing system in a building, after all, it
was not expressed as explicitly as the response modification factor, R, included in base shear
equations for seismic action.
Nemark and Hall (1982) derived the relationship between the ductility factor µ and the
response modification factor R, according to which elastic response spectra can be readily
modified to reflect inelastic behavior (Figure 44 & 45).
R= µ Hz < 2 i.e. T > 0.5 sec (9)
R= 2 ≤ Hz ≤ 8 i.e. 0.125≤T≤0.5 sec (10)
R= 1 Hz > 33 i.e. T < 0.03 sec (11)

58
Expression of Equation (11) permits no strength reduction in highly stiff systems which
possess limited ductility capacity. In Equation (9), it shows that the system behaves very flexible,
and the maximum relative displacement tends toward the maximum ground displacement. For
any given ground acceleration time history the inelastic strength is attained from the elastic
strength demand divided by the displacement ductility ratio. Framing behavior indicated by
Equation (10) will fall between the two extremities stated by Equation (9) and (11).
Figure 44. Idealized elastic design spectrum, horizontal motion ( Nemark and Hall )
(ZPA=0.5g, 5% damping)

59
Figure 45. Combined elastic and inelastic response spectra ( Nemark and Hall )
Besides Newmark and Hall, other researchers like Krawinkler and Nassar, Miranda and
Bertero, Vidic et al. also derived their formulas which established the relationship between
modification factor R and ductility factor µ, but all in all, the response modification factor
depends not only on the characteristics of the system, but also on the ground acceleration time
history. For a given ground motion, R is a function of the period of vibration T of the structure,
the damping, the type of hysteretic behavior and the level of displacement ductility ratio. For a
given acceleration time history the response modification factor is primarily influenced by the
period of vibration and the level of inelastic deformation, and to a much lesser degree by the
damping and hysteretic behavior of the system (Miranda 1994).

60
6.5 Determination of the Response Modification Factor for Shear Wall Sheathed with
Corrugated Sheet Steel.
It was agreed and verified by researcher that response modification factor R is the
function of building natural period T and ductility ratio µ. The equations proposed by Krawinkler
and Nassar, Miranda and Bertero, Vidic et al. were quite complicated due to double variants of
T and µ which were combined together to express the function. For a quick evaluation of the
behavior and conducting a practical design of the shear walls, the simplified expressions
proposed by Nemark and Hall (1982) could be employed in this research. So the problem will be
focusing on knowing what will be the physical periods the building experienced under the
earthquake. Boudreault (2005) given a summaries about the natural periods which based on the
past studies and calculation estimates for cold-formed steel building (Table 13).
Table 13. Statistic of Natural Period for cold-formed steel buildings
Building Type Reference Natural Period T (sec)
One, one and a half, and two-storey
North American residential house Soltis et al. (1981) 0.06 to 0.25
Two and three-storey
North American residential house Sugiyama (1984) 0.14 to 0.32
Residential House (1999a)
Gad et al. 0.25
Low rise wood frame structure Foliente and Zacher (1994) 0.05 to 0.1
Residential houses (Univ. of BC code estimate)
Folz and Filiatrault (2001a) 0.18
Typical 8’x4’ shear wall (NBCC 1995 estimate) Zhao (2002) 0.20
From above reference information and considering the properties of the corrugated metal
sheathing and the potential application of shear wall in multi-storey commercial building, the
natural period would converge between the interval (0.1s, 0.5s). As a result, Equation (10) will
be applied to ductility factor that was acquired with EEEP technique to calculate R, the response

61
modification factor. Table 14 shows the ductility factors and response modification factor for the
21 tests performed in this research.
Table 14. Response modification factor R and ductility factor µ
wall
configuration
Opening
configuration Test protocal
Test
Number
Nominal
sheathing
thickness
Fastener
spacing
Ductility
μ R
Type 1 no opening
Monotonic-ASTM
E564 No.2 27 mil 2.5"/5" 1.511 1.422
Monotonic-ASTM
E564 No.12 27 mil 2.5"/5" 2.051 1.761
Cyclic-CUREE No.7 27 mil 2.5"/5" 1.644 1.513
Cyclic-CUREE No.19 27 mil 2.5"/5" 2.123 1.802
Type 2 no seam
screws Cyclic-CUREE No.1 27 mil 2.5"/5" 4.277 2.748
Type 3 6x6" circular
holes
Monotonic-ASTM
E564 No.3 27 mil 2.5"/5" 1.678 1.535
Cyclic-CUREE No.4 27 mil 2.5"/5" 1.679 1.535
Cyclic-CUREE No.8 27 mil 2.5"/5" 2.415 1.957
Type 4 6x4" circular
holes Cyclic-CUREE No.5 27 mil 2.5"/5" 2.039 1.754
Type 5 6x6"
vertical slit Cyclic-CUREE No.6 27 mil 2.5"/5" 2.204 1.846
Type 6
24x3"
circular
holes
Cyclic-CUREE No.9 27 mil 2.5"/5" 2.485 1.992
Type 7 24x3"
vertical slit
Cyclic-CUREE No.10 27 mil 2.5"/5" 3.699 2.530
Cyclic-CUREE No.13 27 mil 2.5"/5" 3.365 2.394
Type 8
24x3"
horizontal
slit
Cyclic-CUREE No.11 27 mil 2.5"/5" 1.534 1.438
Type 9 12x2"
vertical slit Cyclic-CUREE No.14 27 mil 2.5"/5" 2.128 1.804
Type 10 24x1"
vertical slit Cyclic-CUREE No.16 27 mil 2.5"/5" 1.295 1.261
Type 11 24x2"
vertical slit
Monotonic-ASTM
E564 No.18 27 mil 2.5"/5" 3.090 2.276
Cyclic-CUREE No.15 27 mil 2.5"/5" 3.646 2.508
Cyclic-CUREE No.17 27 mil 2.5"/5" 3.027 2.248
Type 12 plywood Cyclic-CUREE No.20 15/32 in. 2.5"/5" 1.964 1.711
OSB Cyclic-CUREE No.21 7/16 in. 2.5"/5" 2.488 1.994

62
As shown in Table 14, shear walls with opening configuration of 24x3 in. vertical slits,
24x2 in. vertical slits, and no seam screws were observed to provide relatively higher values of
the ductility factors which are greater than 3.0 and response modification factors with an average
value of 2.45.

63
CHAPTER 7
CONCLUSION AND RECOMMENDATION
Corrugated sheet steel CFS shear walls in various opening configurations were
experimentally examined and numerically analyzed for two goals: (1) to investigate the shear
capacity of the shear wall under racking load caused by earthquake and wind, and (2) study the
behavior of shear walls with different opening pattern and explore the ductility factor μ and
derive response modification factor R of corrugated metal sheet shear wall.
North American Standard for Cold-Formed Steel Framing – Lateral Design 2007 (AISI
S213-07) provided the nominal strength (Table 2) for shear walls under in-plane load, meanwhile
requires “the nominal shear strength for light-framed wall systems for buildings, where the
seismic response modification coefficient, R, used to determine the lateral forces is taken greater
than 3. Considering the combined factors of nominal strength, stiffness and ductility of the tested
specimens in this research, shear wall without opening and wall with 24x2-in vertical slits were
interested based on their performance. Compared to the nominal strength under in-plane loads
for shear wall from Standard AISI S213 showed in Table 2, shear wall without opening exhibited
strength capacity 4782.5 plf which is 55.3% higher than the published value 3080 plf of 7/16 in.
OSB shear wall. Shear wall with 24x2-in vertical slits demonstrated same nominal strength as
the published shear capacity. However the response modification factor R of no-opening shear
wall is only 1.802 and 2.508 for 24x2-in vertical slits wall, which are both less than the required
value 3.0.
The corrugated no-opening shear wall could be used as the lateral system in building
constructions even if it showed low ductility character. Based on the equivalent energy and the

64
using of EEEP curve, shear wall yielding strength could be calculated as higher as 4030.5 plf
which could be used as the design strength of shear wall working elastically under earthquake.
Shear wall with 24x2-in vertical slits presented higher lateral force resistance capacity,
shear wall stiffness and exhibited the behavior of ductility to some extent but lower than the
stipulated value in Standard AISI S213-07.
Based on the experimental research, the following further studies are recommended for
the shear walls with 24x2-in vertical slits and other opening configurations
This research verified that less quantity number, big size cutting reduced much of the wall
stiffness. While more quantity of small size cutting make the wall behave well on stiffness,
nominal strength and ductility. Therefore further study could be focus on shear wall with
24x2-in vertical slits, 24x3-in vertical slits and 24x2-in circular opening.
Undoubtedly, Finite Element Model could capture the structural behavior of cold-formed
steel shear wall. FEA should be emphasized to predict the performance of shear wall with
different opening configuration. Meanwhile, connection test of screw seam-connection,
panel to frame connection and frame to frame connection should be conducted to provide
accurate connection data for FE simulation.
To probe a suitable relationship between ductility factor µ and response modification factor
R and building natural period T, therefore a practical response modification factor R could
be derived based on the behavior of tested specimens. And conclude a correct response
modification factor R for corrugated shear wall with certain cutting pattern on the sheathing.
The circular holes of the sheathing in this research were cut manually with plasma cutter.
This work depended on the operator’s individual skill. But no matter how skilled of the
worker, the quality of the holes perimeter could not as good as machine cutting edge,

65
therefore stress concentration was caused and this imperfection made the premature failure
of the sheathing. In the future construction of the shear wall with holes, pre-punched holes in
the manufacturer’s mill should be applied.
Develop a preliminary design and detailing manual. Upon the analysis and test results, the
design manual should be applicable for shear walls with different corrugated sheathing.
A series of 21 full-scale tests were carried out to evaluate the capacity of cold-formed steel
framed shear wall with corrugated sheet steel having different cutting openings. The derived test
data provided a basic optimized study of the corrugation opening configuration. In the future
study, more tests need be performed to verify the conclusion of this research and much data
should be acquired to validate the ductility factor and response modification factor.

APPENDIX A
DATA SHEET S FOR CORRUGATED SHEET SHEAR WALL TESTS
66

67
Opening Type 1: No cutting-opening shear wall. Test No. 02
Test date: Dec. 18, 2012
Specimen Configuration:
Wall dimensions : 8 ft. x 4 ft. Studs: 350S162-68, 33ksi Tracks: 350T150-68, 33ksi
Steel sheathing : 0.027 in. 90ksi, Vulcraft 0.6C decking
Fastener: #12x 1-1/4” hex head washer self-drilling screws, 2.5/5.0 in. spacing.
Hold-down: Simpson Strong Tie S/HD15S
Test protocol: Monotonic-ASTM
Test results:
+Peak load: 4152.5plf.
Lateral displacement of wall top at +peak load: 2.326 in.
-Peak load: NA
Lateral displacement of wall top at -peak load: NA
Average peak load: 4152.5plf.
Average lateral displacement of wall top: 2.326 in.
Observed Failure Mode: specimen failed in the broken at hold down bolt.
Screw Pull Out: None
Sheathing Tear: None
Screw Pull Over: None
-0.5 0 0.5 1 1.5 2 2.5 3-3000
-2000
-1000
0
1000
2000
3000
4000
5000
Horizontal displacement of top track (in.)
Applie
d h
orizonta
l fo
rce (
plf)

68
3.5"11.5"
2'-0.0"2'-0.0"
2'-6.5
"2'-11.0
"2'-6.5
"
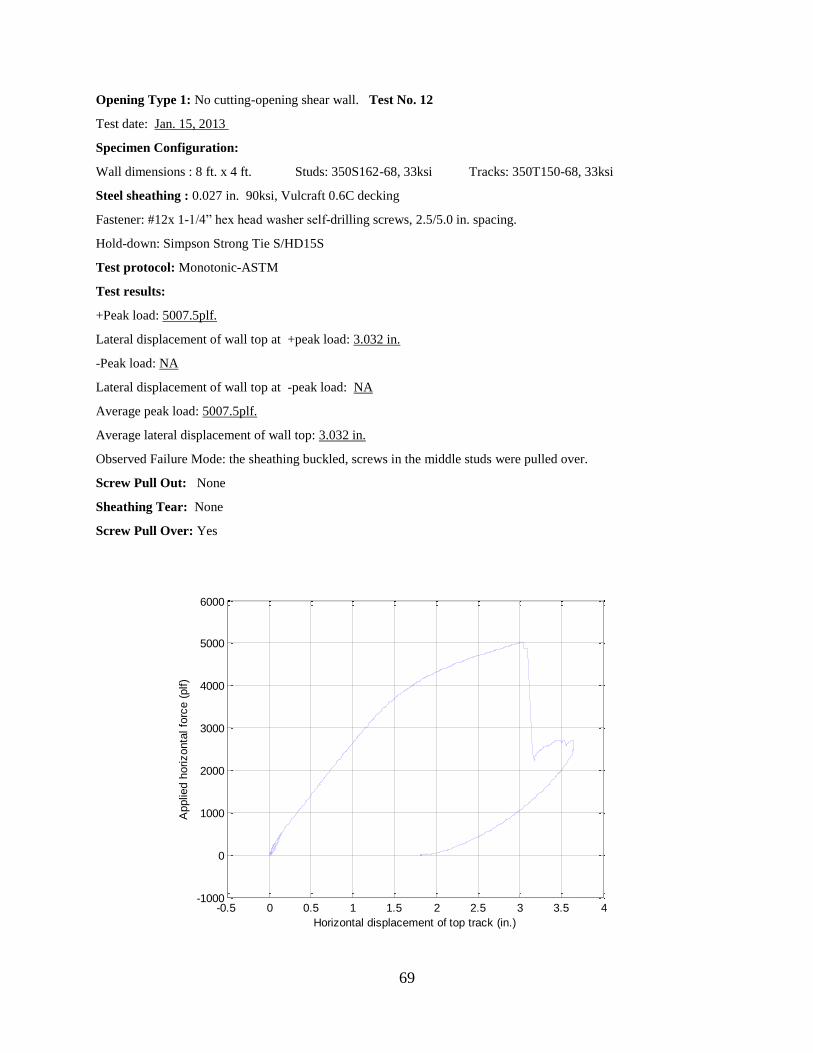
69
Opening Type 1: No cutting-opening shear wall. Test No. 12
Test date: Jan. 15, 2013
Specimen Configuration:
Wall dimensions : 8 ft. x 4 ft. Studs: 350S162-68, 33ksi Tracks: 350T150-68, 33ksi
Steel sheathing : 0.027 in. 90ksi, Vulcraft 0.6C decking
Fastener: #12x 1-1/4” hex head washer self-drilling screws, 2.5/5.0 in. spacing.
Hold-down: Simpson Strong Tie S/HD15S
Test protocol: Monotonic-ASTM
Test results:
+Peak load: 5007.5plf.
Lateral displacement of wall top at +peak load: 3.032 in.
-Peak load: NA
Lateral displacement of wall top at -peak load: NA
Average peak load: 5007.5plf.
Average lateral displacement of wall top: 3.032 in.
Observed Failure Mode: the sheathing buckled, screws in the middle studs were pulled over.
Screw Pull Out: None
Sheathing Tear: None
Screw Pull Over: Yes
-0.5 0 0.5 1 1.5 2 2.5 3 3.5 4-1000
0
1000
2000
3000
4000
5000
6000
Horizontal displacement of top track (in.)
Applie
d h
orizonta
l fo
rce (
plf)
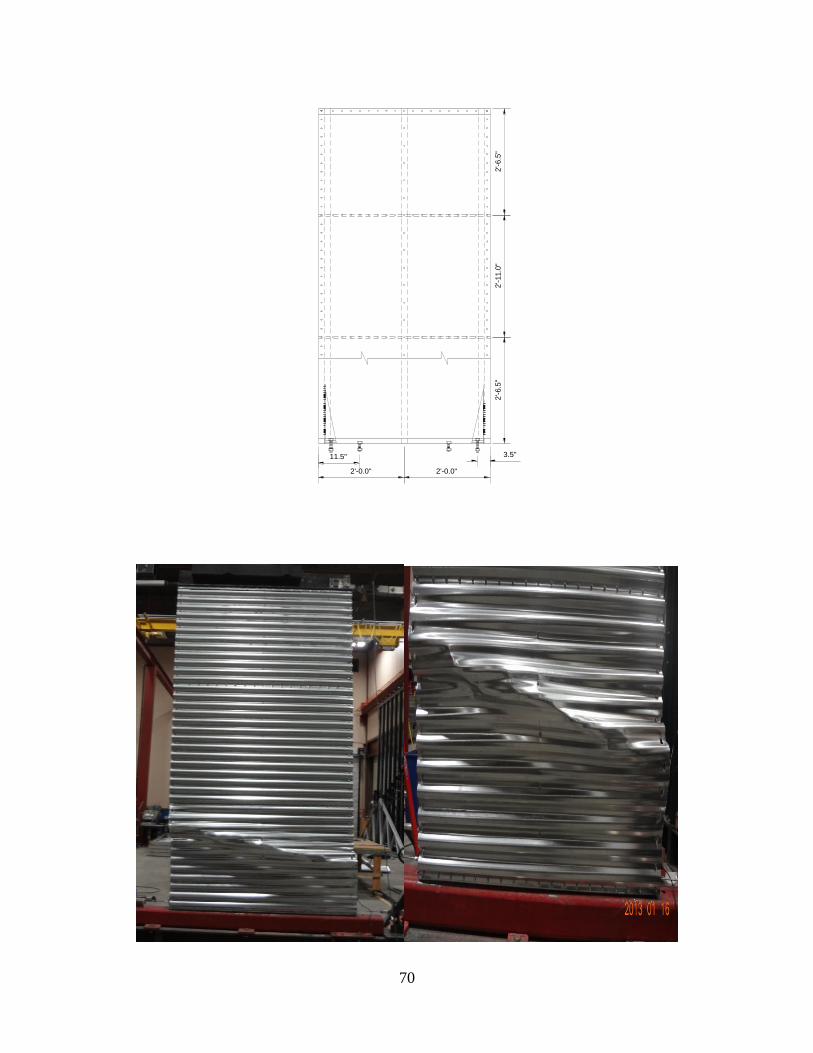
70
3.5"11.5"
2'-0.0"2'-0.0"
2'-6.5
"2'-11.0
"2'-6.5
"

71
Opening Type 1: No cutting-opening shear wall. Test No. 07
Test date: Dec. 27, 2012
Specimen Configuration:
Wall dimensions : 8 ft. x 4 ft. Studs: 350S162-68, 33ksi Tracks: 350T150-68, 33ksi
Steel sheathing : 0.027 in. 90ksi, Vulcraft 0.6C decking
Fastener: #12x 1-1/4” hex head washer self-drilling screws, 2.5/5.0 in. spacing.
Hold-down: Simpson Strong Tie S/HD15S
Test protocol: Cyclic-CUREE
Test results:
+Peak load: 4265plf.
Lateral displacement of wall top at +peak load: 2.49 in.
-Peak load: 4312.5plf
Lateral displacement of wall top at -peak load: 2.78 in.
Average peak load: 4288.8plf.
Average lateral displacement of wall top: 2.635 in.
Observed Failure Mode: specimen failed in the broken at hold down bolts.
Screw Pull Out: None
Sheathing Tear: None
Screw Pull Over: None
-5 -4 -3 -2 -1 0 1 2 3 4 5-5000
-4000
-3000
-2000
-1000
0
1000
2000
3000
4000
5000
Horizontal displacement of top track (in.)
Applie
d h
orizonta
l fo
rce (
plf)

72
3.5"11.5"
2'-0.0"2'-0.0"2'-6.5
"2'-11.0
"2'-6.5
"

73
Opening Type 1: No cutting-opening shear wall. Test No. 19
Test date: Jan. 24, 2013
Specimen Configuration:
Wall dimensions : 8 ft. x 4 ft. Studs: 350S162-68, 33ksi Tracks: 350T150-68, 33ksi
Steel sheathing : 0.027 in. 90ksi, Vulcraft 0.6C decking
Fastener: #12x 1-1/4” hex head washer self-drilling screws, 2.5/5.0 in. spacing.
Hold-down: Simpson Strong Tie S/HD15S
Test protocol: Cyclic-CUREE
Test results:
+Peak load: 5257.5plf.
Lateral displacement of wall top at +peak load: 2.8 in.
-Peak load: 4807.5plf
Lateral displacement of wall top at -peak load: 2.236 in.
Average peak load: 5032.5plf.
Average lateral displacement of wall top: 2.563 in.
Observed Failure Mode: the sheathing buckled, screws in the middle studs were pulled over.
Screw Pull Out: Yes
Sheathing Tear: None
Screw Pull Over: Yes
-5 -4 -3 -2 -1 0 1 2 3 4 5-6000
-4000
-2000
0
2000
4000
6000
Horizontal displacement of top track (in.)
Applie
d h
orizonta
l fo
rce (
plf)

74
3.5"11.5"
2'-0.0"2'-0.0"
2'-6.5
"2'-11.0
"2'-6.5
"

75
Opening Type 2: No seam stitch-screws shear wall. Test No. 1
Test date: May 03, 2012
Specimen Configuration:
Wall dimensions : 8 ft. x 4 ft. Studs: 350S162-68, 33ksi Tracks: 350T150-68, 33ksi
Steel sheathing : 0.027 in. 90ksi, Vulcraft 0.6C decking
Fastener: #12x 1-1/4” hex head washer self-drilling screws, 2.5/5.0 in. spacing.
Hold-down: Simpson Strong Tie S/HD15S
Test protocol: Cyclic-CUREE
Test results:
+Peak load: 2276.3plf.
Lateral displacement of wall top at +peak load: 2.585 in.
-Peak load: 2102.3plf.
Lateral displacement of wall top at -peak load: 2.598 in.
Average peak load: 2189.3plf.
Average lateral displacement of wall top: 2.592 in.
Observed Failure Mode: The upper sheet steel was gouged slot hole due to the reverse cyclic movement, Screws in the boundary studs were pulled over.
Screw Pull Out: None
Sheathing Tear: Yes
Screw Pull Over: Yes
-4 -3 -2 -1 0 1 2 3 4-2500
-2000
-1500
-1000
-500
0
500
1000
1500
2000
2500
Horizontal displacement of top track (in.)
Applie
d h
orizonta
l fo
rce (
plf)
Corrugated Shear Wall

76
3.5"11.5"
2'-0.0"2'-0.0"
2'-6
.5"
2'-1
1.0
"2
'-6
.5"

77
Opening Type 3: 6x6-in circular holes. Test No. 3
Test date: Dec. 19, 2012
Specimen Configuration:
Wall dimensions : 8 ft. x 4 ft. Studs: 350S162-68, 33ksi Tracks: 350T150-68, 33ksi
Steel sheathing : 0.027 in. 90ksi, Vulcraft 0.6C decking
Fastener: #12x 1-1/4” hex head washer self-drilling screws, 2.5/5.0 in. spacing.
Hold-down: Simpson Strong Tie S/HD15S
Test protocol: Monotonic-ASTM
Test results:
+Peak load: 3222.5plf.
Lateral displacement of wall top at +peak load: 3.097 in.
-Peak load: NA
Lateral displacement of wall top at -peak load: NA
Average peak load: 3222.5plf.
Average lateral displacement of wall top: 3.097 in.
Observed Failure Mode: large relative out-of-plane movement of the sheet elements at the both sides of circles, resulting in the repture of sheathing.
Screw Pull Out: None
Sheathing Tear: Yes
Screw Pull Over: None
-0.5 0 0.5 1 1.5 2 2.5 3 3.5 4 4.5-500
0
500
1000
1500
2000
2500
3000
3500
Horizontal displacement of top track (in.)
Applie
d h
orizonta
l fo
rce (
plf)

78
3.5"11.5"
2'-0.0"2'-0.0"
Dia.6.0"
1'-10.5
"1'-10.5
"2'-1.5
"2'-1.5
"
10.0" 1'-2.0" 10.0"1'-2.0"
2'-6.5
"2
'-11.0
"2'-6.5
"

79

80
Opening Type 3: 6x6-in circular holes. Test No. 4
Test date: Dec. 19, 2012
Specimen Configuration:
Wall dimensions : 8 ft. x 4 ft. Studs: 350S162-68, 33ksi Tracks: 350T150-68, 33ksi
Steel sheathing : 0.027 in. 90ksi, Vulcraft 0.6C decking
Fastener: #12x 1-1/4” hex head washer self-drilling screws, 2.5/5.0 in. spacing.
Hold-down: Simpson Strong Tie S/HD15S
Test protocol: Cyclic-CUREE
Test results:
+Peak load: 3295.0plf.
Lateral displacement of wall top at +peak load: 2.82 in.
-Peak load: 3002.5plf.
Lateral displacement of wall top at -peak load: 2.266 in.
Average peak load: 3148.8plf.
Average lateral displacement of wall top: 2.543 in.
Observed Failure Mode: large relative out-of-plane movement of the sheet elements at the both sides of circles, resulting in the repture of sheathing.
Screw Pull Out: None
Sheathing Tear: Yes
Screw Pull Over: None
-4 -3 -2 -1 0 1 2 3 4-4000
-3000
-2000
-1000
0
1000
2000
3000
4000
Horizontal displacement of top track (in.)
Applie
d h
orizonta
l fo
rce (
plf)

81
3.5"11.5"
2'-0.0"2'-0.0"
Dia.6.0"
1'-10.5
"1'-10.5
"2'-1.5
"2'-1.5
"
10.0" 1'-2.0" 10.0"1'-2.0"
2'-6.5
"2'-11.0
"2'-6.5
"

82

83
Opening Type 3: 6x6-in circular holes. Test No. 8
Test date: Dec. 28, 2012
Specimen Configuration:
Wall dimensions : 8 ft. x 4 ft. Studs: 350S162-68, 33ksi Tracks: 350T150-68, 33ksi
Steel sheathing : 0.027 in. 90ksi, Vulcraft 0.6C decking
Fastener: #12x 1-1/4” hex head washer self-drilling screws, 2.5/5.0 in. spacing.
Hold-down: Simpson Strong Tie S/HD15S
Test protocol: Cyclic-CUREE
Test results:
+Peak load: 3027.5plf.
Lateral displacement of wall top at +peak load: 3.027 in.
-Peak load: 2817.5plf.
Lateral displacement of wall top at -peak load: 2.314 in.
Average peak load: 2922.5plf.
Average lateral displacement of wall top: 2.671 in.
Observed Failure Mode: large relative out-of-plane movement of the sheet elements at the both sides of circles, resulting in the repture of sheathing.
Screw Pull Out: Yes
Sheathing Tear: Yes
Screw Pull Over: None
-5 -4 -3 -2 -1 0 1 2 3 4 5-3000
-2000
-1000
0
1000
2000
3000
4000
Horizontal displacement of top track (in.)
Applie
d h
orizonta
l fo
rce (
plf)

84
3.5"11.5"
2'-0.0"2'-0.0"
Dia.6.0"
1'-1
0.5
"1
'-1
0.5
"2
'-1
.5"
2'-1
.5"
10.0" 1'-2.0" 10.0"1'-2.0"
2'-6
.5"
2'-1
1.0
"2
'-6
.5"

85

86
Opening Type 4: 6x4-in circular holes. Test No. 5
Test date: Dec. 20, 2012
Specimen Configuration:
Wall dimensions : 8 ft. x 4 ft. Studs: 350S162-68, 33ksi Tracks: 350T150-68, 33ksi
Steel sheathing : 0.027 in. 90ksi, Vulcraft 0.6C decking
Fastener: #12x 1-1/4” hex head washer self-drilling screws, 2.5/5.0 in. spacing.
Hold-down: Simpson Strong Tie S/HD15S
Test protocol: Cyclic-CUREE
Test results:
+Peak load: 3882.5plf.
Lateral displacement of wall top at +peak load: 2.865 in.
-Peak load: 3582.5plf.
Lateral displacement of wall top at -peak load: 2.167 in.
Average peak load: 3732.5plf.
Average lateral displacement of wall top: 2.516 in.
Observed Failure Mode: large relative out-of-plane movement of the sheet elements at the both sides of circles, resulting in the repture of sheathing. some screws were pulled over through head.
Screw Pull Out: None
Sheathing Tear: Yes
Screw Pull Over: Yes
-4 -3 -2 -1 0 1 2 3 4-4000
-3000
-2000
-1000
0
1000
2000
3000
4000
Horizontal displacement of top track (in.)
Applie
d h
orizonta
l fo
rce (
plf)

87
3.5"11.5"
2'-0.0"2'-0.0"
Dia.4.0"
1'-1
0.5
"1
'-1
0.5
"2
'-1.5
"2
'-1
.5"
10.0" 1'-2.0" 10.0"1'-2.0"
2'-6
.5"
2'-1
1.0
"2
'-6
.5"

88

89
Opening Type 5: 6x6-in vertical slits. Test No. 6
Test date: Dec. 21, 2012
Specimen Configuration:
Wall dimensions : 8 ft. x 4 ft. Studs: 350S162-68, 33ksi Tracks: 350T150-68, 33ksi
Steel sheathing : 0.027 in. 90ksi, Vulcraft 0.6C decking
Fastener: #12x 1-1/4” hex head washer self-drilling screws, 2.5/5.0 in. spacing.
Hold-down: Simpson Strong Tie S/HD15S
Test protocol: Cyclic-CUREE
Test results:
+Peak load: 2865plf.
Lateral displacement of wall top at +peak load: 2.153 in.
-Peak load: 2640plf.
Lateral displacement of wall top at -peak load: 1.586 in.
Average peak load: 2752.5plf.
Average lateral displacement of wall top: 1.87 in.
Observed Failure Mode: large relative out-of-plane movement of the sheet elements at the both side of vertical slits, resulting in the repture of sheathing.
Screw Pull Out: None
Sheathing Tear: Yes
Screw Pull Over: None
-4 -3 -2 -1 0 1 2 3 4-3000
-2000
-1000
0
1000
2000
3000
Horizontal displacement of top track (in.)
Applie
d h
orizonta
l fo
rce (
plf)

90
3.5"11.5"
2'-0.0"2'-0.0"
6.0
"
1'-10
.5"
1'-10
.5"
2'-1.5
"2'-1.5
"
10.0" 1'-2.0" 10.0"1'-2.0"
2'-6.5
"2'-11
.0"
2'-6.5
"

91

92
Opening Type 6: 24x3-in circular holes. Test No. 9
Test date: Jan. 08, 2013
Specimen Configuration:
Wall dimensions : 8 ft. x 4 ft. Studs: 350S162-68, 33ksi Tracks: 350T150-68, 33ksi
Steel sheathing : 0.027 in. 90ksi, Vulcraft 0.6C decking
Fastener: #12x 1-1/4” hex head washer self-drilling screws, 2.5/5.0 in. spacing.
Hold-down: Simpson Strong Tie S/HD15S
Test protocol: Cyclic-CUREE
Test results:
+Peak load: 3027.5plf.
Lateral displacement of wall top at +peak load: 3.461 in.
-Peak load: 2850plf.
Lateral displacement of wall top at -peak load: 3.187 in.
Average peak load: 2938.8plf.
Average lateral displacement of wall top: 3.324 in.
Observed Failure Mode: large relative out-of-plane movement of the sheet elements at the both side of circles, resulting in the repture of sheathing. screws along the lower seam joint became loose.
Screw Pull Out: None
Sheathing Tear: Yes
Screw Pull Over: Yes
-5 -4 -3 -2 -1 0 1 2 3 4 5-3000
-2000
-1000
0
1000
2000
3000
4000
Horizontal displacement of top track (in.)
Applie
d h
orizonta
l fo
rce (
plf)
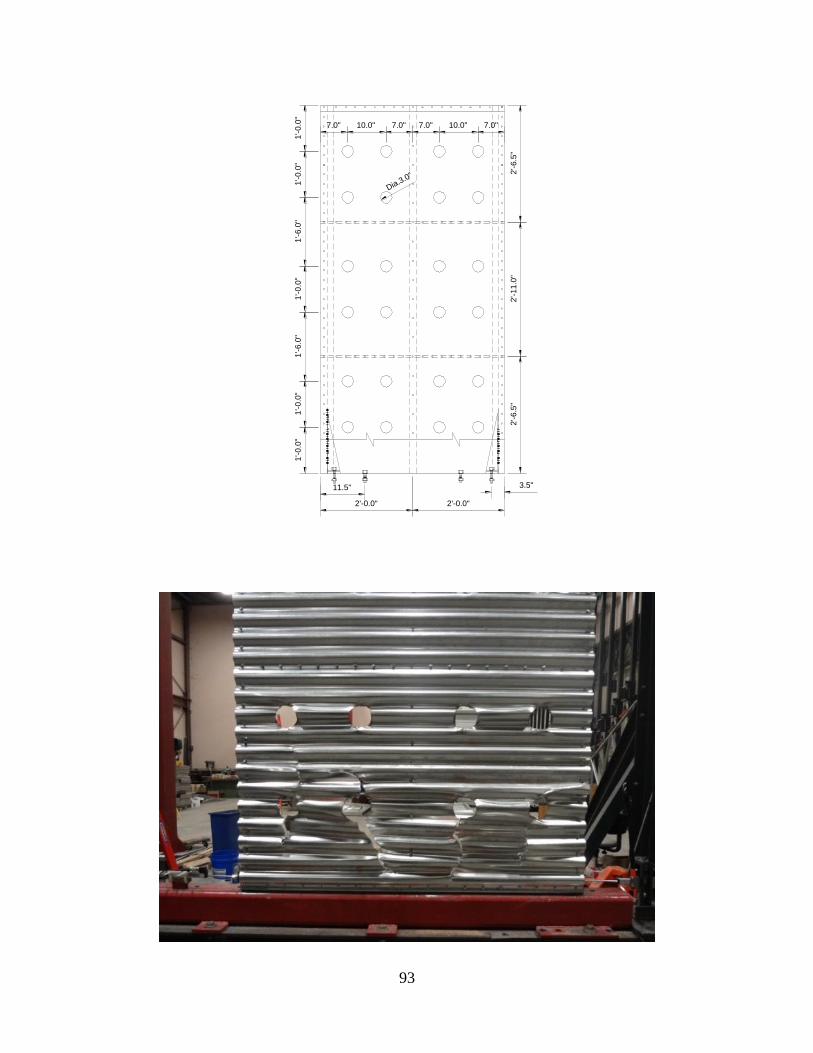
93
3.5"11.5"
2'-0.0"2'-0.0"
Dia.3.0"
7.0" 10.0" 7.0"
1'-0.0
"
7.0"10.0"7.0"
1'-0.0
"1'-0.0
"1'-0.0
"1'-6.0
"1'-0.0
"1'-6.0
"
2'-6.5
"2'-11.0
"2'-6.5
"

94

95
Opening Type 7: 24x3-in vertical slits. Test No. 10
Test date: Jan. 09, 2013
Specimen Configuration:
Wall dimensions : 8 ft. x 4 ft. Studs: 350S162-68, 33ksi Tracks: 350T150-68, 33ksi
Steel sheathing : 0.027 in. 90ksi, Vulcraft 0.6C decking
Fastener: #12x 1-1/4” hex head washer self-drilling screws, 2.5/5.0 in. spacing.
Hold-down: Simpson Strong Tie S/HD15S
Test protocol: Cyclic-CUREE
Test results:
+Peak load: 2950plf.
Lateral displacement of wall top at +peak load: 3.223 in.
-Peak load: 2925plf.
Lateral displacement of wall top at -peak load: 3.308 in.
Average peak load: 2937.5plf.
Average lateral displacement of wall top: 3.266 in.
Observed Failure Mode: large relative out-of-plane movement of the sheet elements at the both side of vertical slits, resulting in the repture of sheathing. screws along the lower seam joint became loose.
Screw Pull Out: None
Sheathing Tear: Yes
Screw Pull Over: None
-5 -4 -3 -2 -1 0 1 2 3 4 5-3000
-2000
-1000
0
1000
2000
3000
Horizontal displacement of top track (in.)
Applie
d h
orizonta
l fo
rce (
plf)

96
3.5"11.5"
7.0" 10.0" 7.0" 7.0"10.0"7.0"
2'-0.0"2'-0.0"
1'-0.0
"11.9
"1'-0.0
"1'-0.0
"1'-6.0
"1'-0.0
"1'-6.0
"
3.0
"
2'-6.5
"2'-11.0
"2'-6.5
"

97

98
Opening Type 7: 24x3-in vertical slits. Test No. 13
Test date: Jan. 16, 2013
Specimen Configuration:
Wall dimensions : 8 ft. x 4 ft. Studs: 350S162-68, 33ksi Tracks: 350T150-68, 33ksi
Steel sheathing : 0.027 in. 90ksi, Vulcraft 0.6C decking
Fastener: #12x 1-1/4” hex head washer self-drilling screws, 2.5/5.0 in. spacing.
Hold-down: Simpson Strong Tie S/HD15S
Test protocol: Cyclic-CUREE
Test results:
+Peak load: 3180plf.
Lateral displacement of wall top at +peak load: 2.598 in.
-Peak load: 2747.5plf.
Lateral displacement of wall top at -peak load: 2.29 in.
Average peak load: 2963.8plf.
Average lateral displacement of wall top: 2.444 in.
Observed Failure Mode: large relative out-of-plane movement of the sheet elements at the both side of vertical slits, resulting in the repture of sheathing. screws along the lower seam joint became loose.
Screw Pull Out: None
Sheathing Tear: Yes
Screw Pull Over: None
-5 -4 -3 -2 -1 0 1 2 3 4 5-3000
-2000
-1000
0
1000
2000
3000
4000
Horizontal displacement of top track (in.)
Applie
d h
orizonta
l fo
rce (
plf)

99
3.5"11.5"
7.0" 10.0" 7.0" 7.0"10.0"7.0"
2'-0.0"2'-0.0"
1'-0.0
"11.9
"1'-0.0
"1'-0.0
"1'-6.0
"1'-0.0
"1'-6.0
"
3.0
"
2'-6.5
"2'-11.0
"2'-6.5
"

100

101
Opening Type 8: 24x3-in horizontal slits. Test No. 11
Test date: Jan. 10, 2013
Specimen Configuration:
Wall dimensions : 8 ft. x 4 ft. Studs: 350S162-68, 33ksi Tracks: 350T150-68, 33ksi
Steel sheathing : 0.027 in. 90ksi, Vulcraft 0.6C decking
Fastener: #12x 1-1/4” hex head washer self-drilling screws, 2.5/5.0 in. spacing.
Hold-down: Simpson Strong Tie S/HD15S
Test protocol: Cyclic-CUREE
Test results:
+Peak load: 3180plf.
Lateral displacement of wall top at +peak load: 2.598 in.
-Peak load: 2747.5plf.
Lateral displacement of wall top at -peak load: 2.29 in.
Average peak load: 2963.8plf.
Average lateral displacement of wall top: 2.444 in.
Observed Failure Mode: specimen failed in the broken at hold down bolts. No other failure was observed.
Screw Pull Out: None
Sheathing Tear: None
Screw Pull Over: None
-5 -4 -3 -2 -1 0 1 2 3 4 5-5000
-4000
-3000
-2000
-1000
0
1000
2000
3000
4000
5000
Horizontal displacement of top track (in.)
Applie
d h
orizonta
l fo
rce (
plf)

102
3.5"11.5"
7.0" 10.0" 7.0" 7.0"10.0"7.0"
2'-0.0"2'-0.0"
1'-0
.0"
11
.9"
1'-0
.0"
1'-0
.0"
1'-6
.0"
1'-0
.0"
1'-6
.0"
3.0" 2'-6
.5"
2'-1
1.0
"2
'-6
.5"
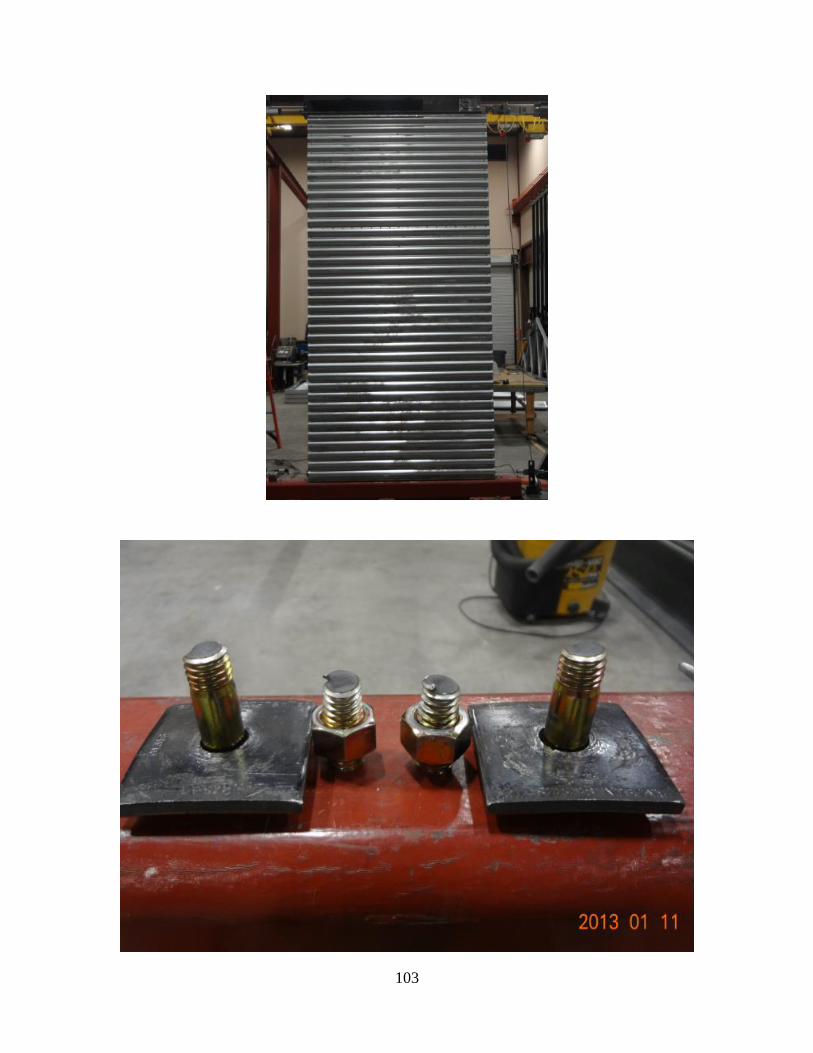
103

104
Opening Type 9: 12x2-in vertical slits. Test No. 14
Test date: Jan. 18, 2013
Specimen Configuration:
Wall dimensions : 8 ft. x 4 ft. Studs: 350S162-68, 33ksi Tracks: 350T150-68, 33ksi
Steel sheathing : 0.027 in. 90ksi, Vulcraft 0.6C decking
Fastener: #12x 1-1/4” hex head washer self-drilling screws, 2.5/5.0 in. spacing.
Hold-down: Simpson Strong Tie S/HD15S
Test protocol: Cyclic-CUREE
Test results:
+Peak load: 3920plf.
Lateral displacement of wall top at +peak load: 2.138 in.
-Peak load: 3217.5plf.
Lateral displacement of wall top at -peak load: 1.584 in.
Average peak load: 3568.8plf.
Average lateral displacement of wall top: 1.861 in.
Observed Failure Mode: large relative out-of-plane movement of the sheet elements at the both side of vertical slits, resulting in the repture of sheathing. The slits which were aligned vertically connected together.
Screw Pull Out: None
Sheathing Tear: Yes
Screw Pull Over: None
-5 -4 -3 -2 -1 0 1 2 3 4 5-4000
-3000
-2000
-1000
0
1000
2000
3000
4000
Horizontal displacement of top track (in.)
Applie
d h
orizonta
l fo
rce (
plf)

105
3.5"11.5"
2'-0.0"2'-0.0"
1'-0.0" 1'-0.0"
1'-0.0
"
1'-0.0"1'-0.0"
11
.9"
1'-0.0
"1'-0.0
"1'-6.0
"1'-0.0
"1'-6.0
"
2.0
"
2'-6.5
"2'-11.0
"2'-6.5
"

106

107
Opening Type 10: 24x1-in vertical slits. Test No. 16
Test date: Jan. 18, 2013
Specimen Configuration:
Wall dimensions : 8 ft. x 4 ft. Studs: 350S162-68, 33ksi Tracks: 350T150-68, 33ksi
Steel sheathing : 0.027 in. 90ksi, Vulcraft 0.6C decking
Fastener: #12x 1-1/4” hex head washer self-drilling screws, 2.5/5.0 in. spacing.
Hold-down: Simpson Strong Tie S/HD15S
Test protocol: Cyclic-CUREE
Test results:
+Peak load: 3920plf.
Lateral displacement of wall top at +peak load: 2.138 in.
-Peak load: 3217.5plf.
Lateral displacement of wall top at -peak load: 1.584 in.
Average peak load: 3568.8plf.
Average lateral displacement of wall top: 1.861 in.
Observed Failure Mode: the lower sheet steel overall buckled and unzipped.
Screw Pull Out: Yes
Sheathing Tear: None
Screw Pull Over: Yes
-5 -4 -3 -2 -1 0 1 2 3 4 5-5000
-4000
-3000
-2000
-1000
0
1000
2000
3000
4000
5000
Horizontal displacement of top track (in.)
Applie
d h
orizonta
l fo
rce (
plf)

108
3.5"11.5"
7.0" 10.0" 7.0" 7.0"10.0"7.0"
2'-0.0"2'-0.0"
1'-0
.0"
11.9
"1'-0
.0"
1'-0
.0"
1'-6
.0"
1'-0
.0"
1'-6
.0"
1.0
"
2'-6
.5"
2'-1
1.0
"2'-6
.5"

109
.

110
Opening Type 11: 24x2-in vertical slits. Test No. 18
Test date: Jan. 23, 2013
Specimen Configuration:
Wall dimensions : 8 ft. x 4 ft. Studs: 350S162-68, 33ksi Tracks: 350T150-68, 33ksi
Steel sheathing : 0.027 in. 90ksi, Vulcraft 0.6C decking
Fastener: #12x 1-1/4” hex head washer self-drilling screws, 2.5/5.0 in. spacing.
Hold-down: Simpson Strong Tie S/HD15S
Test protocol: Monotonic-ASTM
Test results:
+Peak load: 3092.5plf.
Lateral displacement of wall top at +peak load: 3.741 in.
-Peak load: NA.
Lateral displacement of wall top at -peak load: NA
Average peak load: 3092.5plf.
Average lateral displacement of wall top: 3.741 in.
Observed Failure Mode: large relative out-of-plane movement of the sheet elements at the both side of vertical slits, resulting in the repture of sheathing. Some screws became loose.
Screw Pull Out: None
Sheathing Tear: Yes
Screw Pull Over: None
-1 0 1 2 3 4 5-1000
-500
0
500
1000
1500
2000
2500
3000
3500
Horizontal displacement of top track (in.)
Applie
d h
orizonta
l fo
rce (
plf)
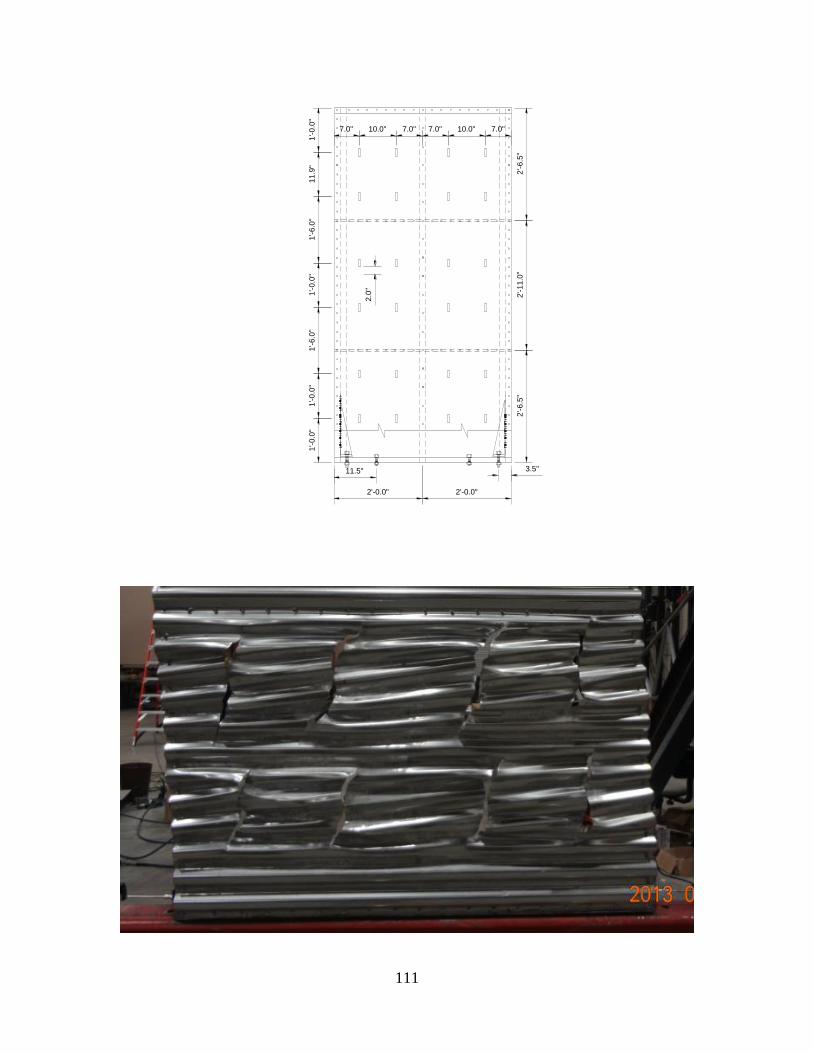
111
3.5"11.5"
7.0" 10.0" 7.0" 7.0"10.0"7.0"
2'-0.0"2'-0.0"
1'-0
.0"
11.9
"1'-0
.0"
1'-0
.0"
1'-6
.0"
1'-0
.0"
1'-6
.0"
2.0
"
2'-6
.5"
2'-1
1.0
"2'-6
.5"

112

113
Opening Type 11: 24x2-in vertical slits. Test No. 15
Test date: Jan. 18, 2013
Specimen Configuration:
Wall dimensions : 8 ft. x 4 ft. Studs: 350S162-68, 33ksi Tracks: 350T150-68, 33ksi
Steel sheathing : 0.027 in. 90ksi, Vulcraft 0.6C decking
Fastener: #12x 1-1/4” hex head washer self-drilling screws, 2.5/5.0 in. spacing.
Hold-down: Simpson Strong Tie S/HD15S
Test protocol: Cyclic-CUREE
Test results:
+Peak load: 3207.5plf.
Lateral displacement of wall top at +peak load: 3.465 in.
-Peak load: 2982.5plf
Lateral displacement of wall top at -peak load: 2.15 in.
Average peak load: 3095plf.
Average lateral displacement of wall top: 2.808 in.
Observed Failure Mode: large relative out-of-plane movement of the sheet elements at the both side of vertical slits, resulting in the repture of sheathing. Some screws became loose.
Screw Pull Out: None
Sheathing Tear: Yes
Screw Pull Over: None
-5 -4 -3 -2 -1 0 1 2 3 4 5-3000
-2000
-1000
0
1000
2000
3000
4000
Horizontal displacement of top track (in.)
Applie
d h
orizonta
l fo
rce (
plf)

114
3.5"11.5"
7.0" 10.0" 7.0" 7.0"10.0"7.0"
2'-0.0"2'-0.0"
1'-0
.0"
11.9
"1'-0
.0"
1'-0
.0"
1'-6
.0"
1'-0
.0"
1'-6
.0"
2.0
"
2'-6
.5"
2'-1
1.0
"2'-6
.5"

115

116
Opening Type 11: 24x2-in vertical slits. Test No. 17
Test date: Jan. 23, 2013
Specimen Configuration:
Wall dimensions : 8 ft. x 4 ft. Studs: 350S162-68, 33ksi Tracks: 350T150-68, 33ksi
Steel sheathing : 0.027 in. 90ksi, Vulcraft 0.6C decking
Fastener: #12x 1-1/4” hex head washer self-drilling screws, 2.5/5.0 in. spacing.
Hold-down: Simpson Strong Tie S/HD15S
Test protocol: Cyclic-CUREE
Test results:
+Peak load: 3110plf.
Lateral displacement of wall top at +peak load: 3.43 in.
-Peak load: 3095plf
Lateral displacement of wall top at -peak load: 3.397 in.
Average peak load: 3102.5plf.
Average lateral displacement of wall top: 3.414 in.
Observed Failure Mode: large relative out-of-plane movement of the sheet elements at the both side of vertical slits, resulting in the repture of sheathing. Some screws became loose.
Screw Pull Out: None
Sheathing Tear: Yes
Screw Pull Over: None
-5 -4 -3 -2 -1 0 1 2 3 4 5-4000
-3000
-2000
-1000
0
1000
2000
3000
4000
Horizontal displacement of top track (in.)
Applie
d h
orizonta
l fo
rce (
plf)
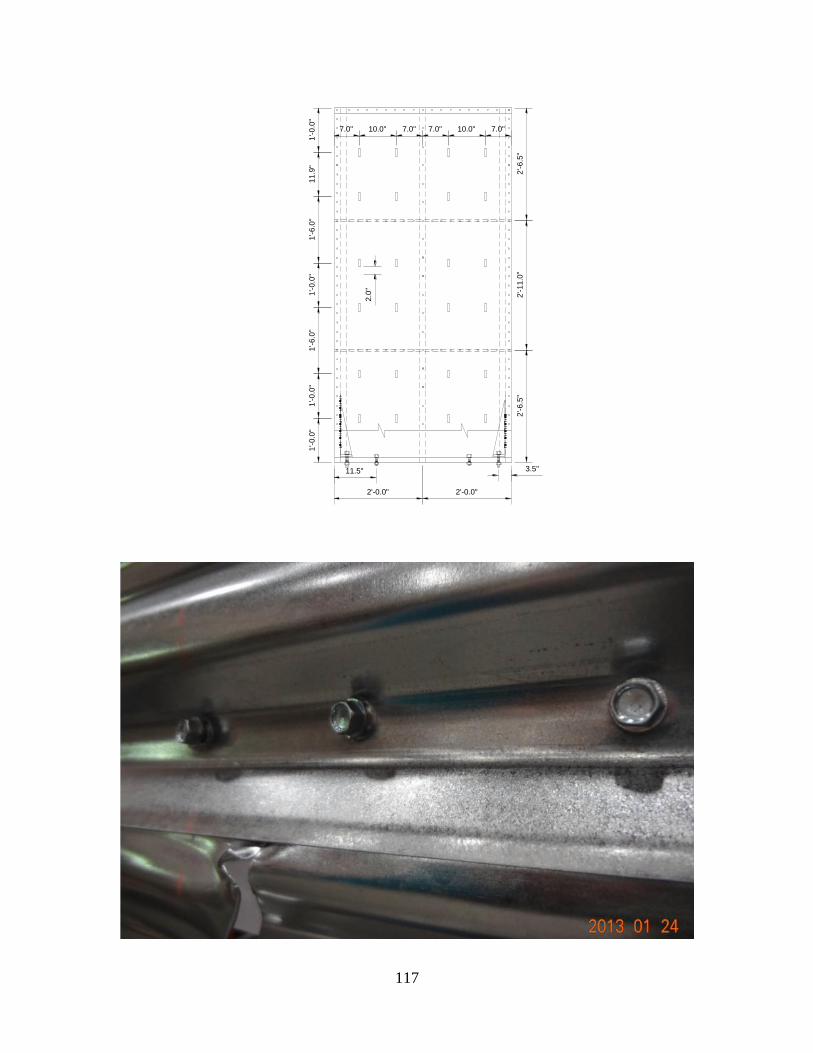
117
3.5"11.5"
7.0" 10.0" 7.0" 7.0"10.0"7.0"
2'-0.0"2'-0.0"
1'-0
.0"
11.9
"1'-0
.0"
1'-0
.0"
1'-6
.0"
1'-0
.0"
1'-6
.0"
2.0
"
2'-6
.5"
2'-1
1.0
"2'-6
.5"

118

119
Opening Type 12: plywood Test No. 20
Test date: Jan. 25, 2013
Specimen Configuration:
Wall dimensions : 8 ft. x 4 ft. Studs: 350S162-68, 33ksi Tracks: 350T150-68, 33ksi
Steel sheathing : 15/32 in. plywood
Fastener: #12x 1-1/4” hex head washer self-drilling screws, 2.5/5.0 in. spacing.
Hold-down: Simpson Strong Tie S/HD15S
Test protocol: Cyclic-CUREE
Test results:
+Peak load: 3505plf.
Lateral displacement of wall top at +peak load: 3.263 in.
-Peak load: 2927.5plf
Lateral displacement of wall top at -peak load: 2.337 in.
Average peak load: 3216.3plf.
Average lateral displacement of wall top: 2.8 in.
Observed Failure Mode: shear failure resulting in rupture of sheathing horizontally. Then sheathing was beared around screws on the boundary stud.
Screw Pull Out: None
Sheathing Tear: Yes
Screw Pull Through: Yes
-5 -4 -3 -2 -1 0 1 2 3 4 5-3000
-2000
-1000
0
1000
2000
3000
4000
Horizontal displacement of top track (in.)
Applie
d h
orizonta
l fo
rce (
plf)

120
3.5"11.5"
2'-0.0"2'-0.0"
8'-0
.0"

121

122
Opening Type 12: OSB Test No. 21
Test date: Jan. 28, 2013
Specimen Configuration:
Wall dimensions : 8 ft. x 4 ft. Studs: 350S162-68, 33ksi Tracks: 350T150-68, 33ksi
Steel sheathing : 7/16 in. OSB
Fastener: #12x 1-1/4” hex head washer self-drilling screws, 2.5/5.0 in. spacing.
Hold-down: Simpson Strong Tie S/HD159
Test protocol: Cyclic-CUREE
Test results:
+Peak load: 3595plf.
Lateral displacement of wall top at +peak load: 3.336 in.
-Peak load: 3282.5plf
Lateral displacement of wall top at -peak load: 3.542 in.
Average peak load: 3438.8plf.
Average lateral displacement of wall top: 3.439 in.
Observed Failure Mode: screws were pulled through head along bounday stud and bottom track.
Screw Pull Out: None
Sheathing Tear: Yes
Screw Pull Through: Yes
-5 -4 -3 -2 -1 0 1 2 3 4 5-4000
-3000
-2000
-1000
0
1000
2000
3000
4000
Horizontal deflection of top plate (in.)
Horizonta
l fo
rce (
lbs)

123
3.5"11.5"
2'-0.0"2'-0.0"
8'-0
.0"

124

APPENDIX B
COMBINED HYSTERESIS CURVE, ENVELOPE CURVE, EEEP CURVE AND DUCTILITY
FACTOR
125

126
Label Ductility
factor Graph
Type 1:
No-opening
No.02
1.511
-0.5 0 0.5 1 1.5 2 2.5 3-3000
-2000
-1000
0
1000
2000
3000
4000
5000
Drift (in.)
Shear
resis
tance (
lbs/in.)
EEEP curve
Hysteresis loop
Type 1:
No-opening
No.12
2.051
-0.5 0 0.5 1 1.5 2 2.5 3 3.5 4-1000
0
1000
2000
3000
4000
5000
6000
Drift (in.)
Shear
resis
tance (
lbs/in.)
EEEP curve
Hysteresis loop

127
Type 1:
No-opening
No.07
1.644
-5 -4 -3 -2 -1 0 1 2 3 4 5-5000
-4000
-3000
-2000
-1000
0
1000
2000
3000
4000
5000
Drift (in.)
Shear
resis
tance (
lbs/in.)
Positive envelope
Negative envelope
EEEP curve
Hysteresis loop
Type 1:
No-opening
No.19
2.123
-5 -4 -3 -2 -1 0 1 2 3 4 5-6000
-4000
-2000
0
2000
4000
6000
Drift (in.)
Shear
resis
tance (
lbs/in.)
Positive envelope
Negative envelope
EEEP curve
Hysteresis loop

128
Type 2:
No-seam
stitch screws
No.01
4.277
-4 -3 -2 -1 0 1 2 3 4-2500
-2000
-1500
-1000
-500
0
500
1000
1500
2000
2500
Drift (in.)
Shear
resis
tance (
lbs/in.)
Positive envelope
Negative envelope
EEEP curve
Hysteresis loop
Type 3:
6x6 in.
circular
holes
No.03
1.678
-0.5 0 0.5 1 1.5 2 2.5 3 3.5 4 4.5-500
0
500
1000
1500
2000
2500
3000
3500
Drift (in.)
Shear
resis
tance (
lbs/in.)
EEEP curve
Hysteresis loop

129
Type 3:
6x6 in.
circular
holes
No.04
1.679
-4 -3 -2 -1 0 1 2 3 4-4000
-3000
-2000
-1000
0
1000
2000
3000
4000
Drift (in.)
Shear
resis
tance (
lbs/in.)
Positive envelope
Negative envelope
EEEP curve
Hysteresis loop
Type 3:
6x6 in.
circular
holes
No.08
2.415
-5 -4 -3 -2 -1 0 1 2 3 4 5-3000
-2000
-1000
0
1000
2000
3000
4000
Drift (in.)
Shear
resis
tance (
lbs/in.)
Positive envelope
Negative envelope
EEEP curve
Hysteresis loop

130
Type 4:
6x4 in.
circular
holes
No.05
2.039
-4 -3 -2 -1 0 1 2 3 4-4000
-3000
-2000
-1000
0
1000
2000
3000
4000
Drift (in.)
Shear
resis
tance (
lbs/in.)
Positive envelope
Negative envelope
EEEP curve
Hysteresis loop
Type 5:
6x6 in.
vertical
slits
No.06
2.204
-4 -3 -2 -1 0 1 2 3 4-3000
-2000
-1000
0
1000
2000
3000
Drift (in.)
Shear
resis
tance (
lbs/in.)
Positive envelope
Negative envelope
EEEP curve
Hysteresis loop

131
Type 6:
24x3 in.
circular
holes
No.09
2.485
-5 -4 -3 -2 -1 0 1 2 3 4 5-3000
-2000
-1000
0
1000
2000
3000
4000
Drift (in.)
Shear
resis
tance (
lbs/in.)
Positive envelope
Negative envelope
EEEP curve
Hysteresis loop
Type 7:
24x3 in.
vertical
slits
No.10
3.699
-5 -4 -3 -2 -1 0 1 2 3 4 5-3000
-2000
-1000
0
1000
2000
3000
Drift (in.)
Shear
resis
tance (
lbs/in.)
Positive envelope
Negative envelope
EEEP curve
Hysteresis loop

132
Type 7:
24x3 in.
vertical
slits
No.13
3.365
-5 -4 -3 -2 -1 0 1 2 3 4 5-3000
-2000
-1000
0
1000
2000
3000
4000
Drift (in.)
Shear
resis
tance (
lbs/in.)
Positive envelope
Negative envelope
EEEP curve
Hysteresis loop
Type 8:
24x3 in.
horizontal
slits
No.11
1.534
-5 -4 -3 -2 -1 0 1 2 3 4 5-5000
-4000
-3000
-2000
-1000
0
1000
2000
3000
4000
5000
Drift (in.)
Shear
resis
tance (
lbs/in.)
Positive envelope
Negative envelope
EEEP curve
Hysteresis loop

133
Type 9:
12x2 in.
vertical
slits
No.14
2.128
-5 -4 -3 -2 -1 0 1 2 3 4 5-4000
-3000
-2000
-1000
0
1000
2000
3000
4000
Drift (in.)
Shear
resis
tance (
lbs/in.)
Positive envelope
Negative envelope
EEEP curve
Hysteresis loop
Type 10:
24x1 in.
vertical
slits
No.16
1.295
-5 -4 -3 -2 -1 0 1 2 3 4 5-5000
-4000
-3000
-2000
-1000
0
1000
2000
3000
4000
5000
Drift (in.)
Shear
resis
tance (
lbs/in.)
Positive envelope
Negative envelope
EEEP curve
Hysteresis loop

134
Type 11:
24x2 in.
vertical
slits
No.18
3.090
-1 0 1 2 3 4 5-1000
-500
0
500
1000
1500
2000
2500
3000
3500
Drift (in.)
Shear
resis
tance (
lbs/in.)
EEEP curve
Hysteresis loop
Type 11:
24x2 in.
vertical
slits
No.15
3.646
-5 -4 -3 -2 -1 0 1 2 3 4 5-3000
-2000
-1000
0
1000
2000
3000
4000
Drift (in.)
Shear
resis
tance (
lbs/in.)
Positive envelope
Negative envelope
EEEP curve
Hysteresis loop

135
Type 11:
24x2 in.
vertical
slits
No.16
3.207
-5 -4 -3 -2 -1 0 1 2 3 4 5-4000
-3000
-2000
-1000
0
1000
2000
3000
4000
Drift (in.)
Shear
resis
tance (
lbs/in.)
Positive envelope
Negative envelope
EEEP curve
Hysteresis loop
Type 12:
15/32 in.
plywood
No.20
-
-5 -4 -3 -2 -1 0 1 2 3 4 5-3000
-2000
-1000
0
1000
2000
3000
4000
Horizontal displacement of top track (in.)
Applie
d h
orizonta
l fo
rce (
plf)

136
Type 12:
7/16 in.
OSB
No.21
-
-5 -4 -3 -2 -1 0 1 2 3 4 5-4000
-3000
-2000
-1000
0
1000
2000
3000
4000
Horizontal deflection of top plate (in.)
Horizonta
l fo
rce (
lbs)

APPENDIX C
FINAL LENTH OF RUPTURED HOLES AND SLITS
137

138
Type 3: 6x6-in circular holes
No. 03
3.5"11.5"
2'-0.0"2'-0.0"
11.6" 7.5"
1'-1
0.5
"1
'-1
0.5
"
Dia.6.0"
2'-1
.5"
2'-1
.5"
10.0" 1'-2.0" 10.0"1'-2.0"
2'-6
.5"
2'-1
1.0
"2
'-6.5
"

139
Type 3: 6x6-in circular holes
No. 04
3.5"11.5"
2'-0.0"2'-0.0"
19.5" 19.7"
8"
1'-1
0.5
"1
'-1
0.5
"
Dia.6.0"
2'-1
.5"
2'-1
.5"
10.0" 1'-2.0" 10.0"1'-2.0"
2'-6
.5"
2'-1
1.0
"2
'-6
.5"

140
Type 3: 6x6-in circular holes
No. 08
3.5"11.5"
2'-0.0"2'-0.0"
25" 19.8"
8"
8.75"
1'-1
0.5
"1
'-1
0.5
"
Dia.6.0"
2'-1
.5"
2'-1
.5"
10.0" 1'-2.0" 10.0"1'-2.0"
2'-6
.5"
2'-1
1.0
"2
'-6
.5"

141
Type 4: 6x4-in circular holes
No. 05
3.5"11.5"
2'-0.0"2'-0.0"
1'-10.5
"1'-10.5
"2'-1.5
"2'-1.5
"
10.0" 1'-2.0" 10.0"1'-2.0"
Dia.4.0"
2'-6.5
"2'-11.0
"2'-6.5
"
5" 6"
15.5"

142
Type 5: 6x6-in vertical slits
No. 06
3.5"11.5"
2'-0.0"2'-0.0"
6.0
"
8.1" 7.4"
16.5" 16.5"
18" 18.4"
1'-10.5
"1'-10.5
"2'-1.5
"2'-1.5
"
10.0" 1'-2.0" 10.0"1'-2.0"
2'-6.5
"2'-11.0
"2'-6.5
"

143
Type 6: 24x3-in circular holes
No. 09
3.5"11.5"
2'-0.0"2'-0.0"
7.0" 10.0" 7.0"
1'-0
.0"
7.0"10.0"7.0"
1'-0
.0"
1'-0
.0"
1'-0
.0"
1'-6
.0"
1'-0
.0"
1'-6
.0"
Dia.3.0" 2'-6
.5"
2'-1
1.0
"2
'-6
.5"
14.5" 14.3" 11.5" 9.5"

144
Type 7: 24x3-in vertical slits
No. 10
3.5"11.5"
7.0" 10.0" 7.0" 7.0"10.0"7.0"
2'-0.0"2'-0.0"
3.0
"
2'-6
.5"
2'-1
1.0
"2
'-6
.5"
3.9" 4.4" 4.4" 3.8"
4.0" 4.5" 4.4" 4.1"
4.0" 4.4" 4.4" 4.1"
4.4" 4.5" 4.5" 4.0"
4.9" 11" 10.4" 9.5"
11" 14.3" 13.9" 13.9"
1'-0
.0"
11
.9"
1'-0
.0"
1'-0
.0"
1'-6
.0"
1'-0
.0"
1'-6
.0"

145
Type 7: 24x3-in vertical slits
No. 13
3.5"11.5"
7.0" 10.0" 7.0" 7.0"10.0"7.0"
2'-0.0"2'-0.0"
3.4" 4.0" 4.0" 4.1"
3.9" 4.4" 4.4" 4.2"
4.0" 4.4" 4.4" 4.0"
6.9" 6.8" 6.6" 8.5"
9.5" 10.5" 12" 8.9"
8.2" 13.6" 12.8" 10.4"
1'-0
.0"
11
.9"
1'-0
.0"
1'-0
.0"
1'-6
.0"
1'-0
.0"
1'-6
.0"
3.0
"
2'-6
.5"
2'-1
1.0
"2
'-6
.5"
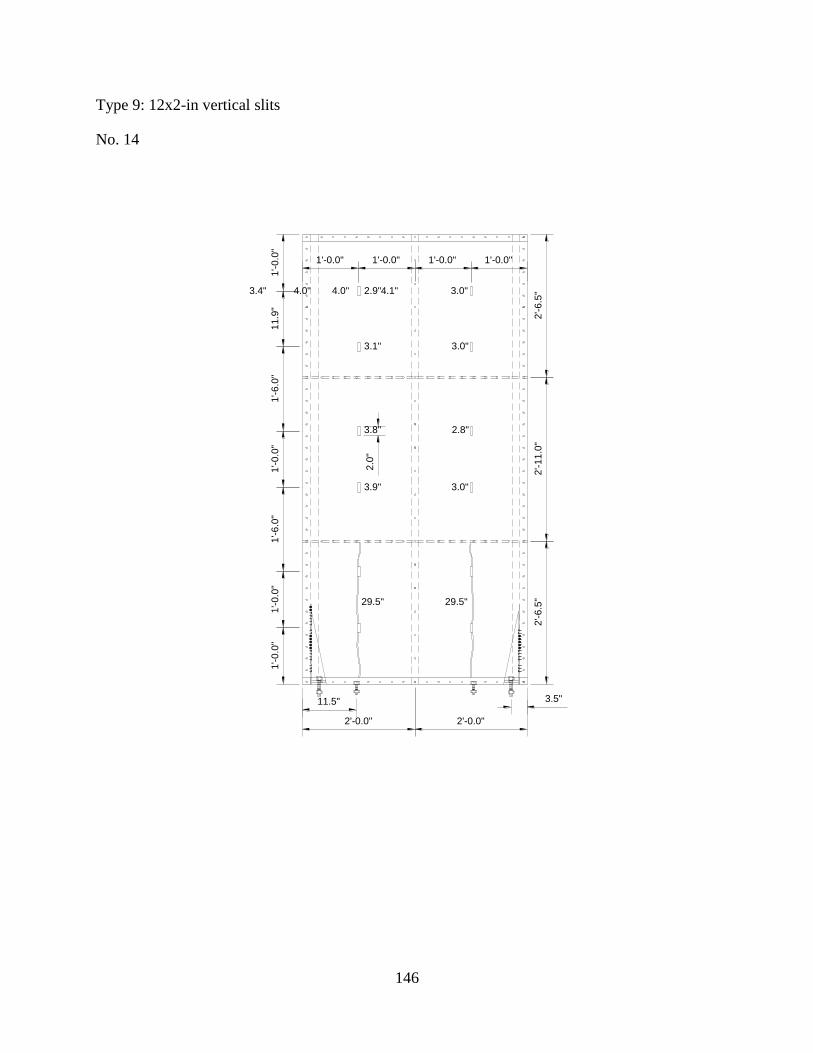
146
Type 9: 12x2-in vertical slits
No. 14
3.5"11.5"
2'-0.0"2'-0.0"
2.9" 3.0"
3.1" 3.0"
3.8" 2.8"
3.9" 3.0"
29.5" 29.5"
1'-0.0" 1'-0.0"
1'-0
.0"
1'-0.0"1'-0.0"
11
.9"
1'-0
.0"
1'-0
.0"
1'-6
.0"
1'-0
.0"
1'-6
.0"
2.0
"
2'-6
.5"
2'-1
1.0
"2
'-6
.5"
3.4" 4.0" 4.0" 4.1"

147
Type 11: 24x2-in vertical slits
No. 15
1'-0
.0"
11
.9"
1'-0
.0"
1'-0
.0"
1'-6
.0"
1'-0
.0"
1'-6
.0"
2'-6
.5"
2'-1
1.0
"2
'-6
.5"
3.5"11.5"
7.0" 10.0" 7.0" 7.0"10.0"7.0"
2'-0.0"2'-0.0"
2.8" 2.9" 4.0" 3"
2.9" 3.1" 3.8" 3.1"
3.0" 3.0" 3.8" 3.7"
3.6" 3.1" 3.5" 3.0"
8.5" 9.3" 9.3" 7.9"
13.1" 13.4" 12.7" 15.5"

148
Type 11: 24x2-in vertical slits
No. 17
3.5"11.5"
7.0" 10.0" 7.0" 7.0"10.0"7.0"
2'-0.0"2'-0.0"
3.0" 3.0" 4.0" 3.0"
3.1" 3.0" 3.4" 3.1"
4.0" 4.1" 4.1" 3.1"
4.0" 4.4" 5.1" 3.7"
6.1" 13.1" 10.1" 9.7"
11.6" 13.6" 11.5" 14.4"
1'-0
.0"
11
.9"
1'-0
.0"
1'-0
.0"
1'-6
.0"
1'-0
.0"
1'-6
.0"
2'-6
.5"
2'-1
1.0
"2
'-6
.5"

149
Type 11: 24x2-in vertical slits
No. 18
3.5"11.5"
7.0" 10.0" 7.0" 7.0"10.0"7.0"
2'-0.0"2'-0.0"
2.8" 4.1" 3.0" 2.2"
3.3" 3.6" 3.3" 2.8"
3.0" 3.4" 3.0" 2.8"
2.8" 3.0" 3.5" 2.9"
10.4" 10.5" 10.6" 9.0"
8.5" 8.5" 9.5" 8.6"
1'-0
.0"
11
.9"
1'-0
.0"
1'-0
.0"
1'-6
.0"
1'-0
.0"
1'-6
.0"
2'-6
.5"
2'-1
1.0
"2
'-6
.5"

150
REFERENCES
AC130 (2004). “Acceptance Criteria for Prefabricated Wood Shear Panels”, ICC Evaluation
Service, INC., Whittier, CA.
AC154 (2005). “Acceptance Criteria for Cyclic Racing Shear Test for Metal-Sheathed Shear
Walls with Steel Framing”, ICC Evaluation Service, INC., Whittier, CA.
AISI S213 (2007). “The North American Standard for Cold-Formed Steel Framing - Lateral
Design”, American Iron and Steel Institute, Washington, DC.
ASME B18.22.1 (1998). “Plan Washers”, American Society of Mechanical Engineers, New
York, NY.
ASTM A370-06 (2006). “A370-06 Standard Test Methods and Definitions for Mechanical
Testing of Steel Products”, American Society for Testing and Materials, West Conshohocken,
PA.
ASTM E564-06 (2006). “Standard Practice for Static Load Test for Shear Resistance of Framed
Walls for Buildings”, American Society for Testing and Materials, West Conshohocken, PA.
Andrew Whittaker, Gary Hart, Christopher Rojahn. “Seismic Response Modification Factors”
Journal of Structural Engineering 1999.125:438~444.
Boudreault. (2005) “SEISMIC ANALYSIS OF STEEL FRAME /WOOD PANEL
SHEAR WALLS” Master Thesis, McGill University.
Branston, Boudreault, Chen, and Rogers (2006). “Light-gauge steel-frame – wood structural
panel shear wall design method”, Canadian Journal of Civil Engineering, 33:872-889.

151
Chia-Ming Uang. “Establishing R(or Rw) and Cd Factors For Building Seismic Provisions.”
Journal of Structural Engineering 1991.117:19~28.
ECCS (1985). “Recommended Testing Procedure for Assessing the Behavior of Structural Steel
Elements under Cyclic Loads”, European Convention for Constructional Steelwork, TWG 13
Seismic Design, Report No. 45, 1985.
Fülöp and Dubina (2004). “Performance of wall-stud cold-formed shear panels under monotonic
and cyclic loading Part I: Experimental research”, Thin-Walled Structures, 42 (2004) 321-338.
Gad, E.F., Duffield, C.F., Chandler, A.M., Stark, G. (1998). Testing of Cold-formed Steel
Framed Domestic Structures. Proceedings of the 11th European Conference on
Earthquake Engineering, Paris, France.
Gad, E.F., Chandler, A.M., Duffield, C.F., Hutchinson, G.L. (1999a). Earthquake
ductility and over-strength in residential structures. Structural Engineering and
Mechanics, Vol. 8, No. 4, 361-382.
James Malley, Peter Cheever. “History of Structural Response Modification Factors”
ASCE-2007 Structures Congress: New Horizon and Better Practices
Kawai, Kanno, and Hanya (1997). “Cyclic shear resistance of light-gauge steel framed walls”,
ASCE Structural Congress, Poland.
Krawinkler, Parisi, Ibarra, Ayoub, and Medina (2000). “Development of a Testing Protocol for
Woodframe Structures”, Report W-02, Woodframe Project. Consortium of Universities for
Research in Earthquake Engineering (CUREE), Richmond, California.

152
Eduardo Miranda, M.EERI, Vitelmo V. Bertero.(1994) “Evaluation of Strength Reduction
Factors for Earthquake-Resistant Design.” Earthquake Spectra, Vol.10, No.2,1994
Newark, N.M. and Hall, W.J. (1982). Earthquake Spectra and Design. Engineering
Monograph, Earthquake Engineering Research Institute, Berkeley, CA, USA.
Nippon Steel Corporation (2011) “Seismic resisting cold-formed wall system with corrugated
steel sheets and energy dissipating fuses for housing use”
Park (1989). “Evaluation of ductility of structures and structural assemblages from laboratory
testing”, Bulletin of the New Zealand national Society of Earthquake Engineering, 22(3): 155-
166.
Serrette, R.L., Nguyen, H., Hall, G. (1996). “Shear wall values for light weight steel framing.”
Report No. LGSRG-3-96, Santa Clara University. Santa Clara, CA.
Serrette, R.L. (1997). “Additional Shear Wall Values for Light Weight Steel Framing.” Report
No. LGSRG-1-97, Santa Clara University. Santa Clara, CA.
Serrette, R.L. (2002). “Performance of Cold-Formed Steel-Framed Shear Walls: Alternative
Configurations,” Final Report: LGSRG-06-02, Santa Clara University. Santa Clara, CA.
SSMA (2001). “Product Technical Information ICBO ER-4943P”, Steel Stud Manufacturer
Association, Chicago, IL.
Stojadinovic and Tipping (2007), “Structural testing of corrugated sheet steel shear walls.”
Report submitted to Charles Pankow Foundation, Ontario, CA.
Yu, C. (2007). “Steel Sheet Sheathing Options for Cold-Formed Steel Framed Shear Wall

153
Assemblies Providing Shear Resistance”, Report No. UNT-G76234 submitted to American Iron
and Steel Institute, Washington, DC.
Yu, C. (2008). “Shear Resistance of Cold-Formed Steel Framed Shear Wall Assemblies
with0.027-.0.030-,0.033-inch Sheet Steel Sheathing”, the 19th International Specialty
Conference on Cold-Formed Steel Structures, St. Louis, MO.
Yu, C., Huang, Z., Vora, H. (2009). Cold-Formed Steel Framed Shear Wall Assemblies with
Corrugated Sheet Steel Sheathing, Proceedings of the Annual Stability Conference, Structural
Stability Research Council, Phoenix, AZ, April 2009.


![City Research Online · model was initially developed for modern timber shear walls sheathed with plywood board (see for example [14]) and later adopted to traditional TF walls. This](https://static.fdocuments.us/doc/165x107/5e827005975f2214a028b2c8/city-research-online-model-was-initially-developed-for-modern-timber-shear-walls.jpg)