
Colchester Avenue Corridor Plan Ward 1 NPA Meeting March 10, 2010.

Colchester Local Plan Modelling
Colchester Local Plan Traffic Modelling Technical Report
C:\Users\WhittlM\Documents\My_Docs\Essex\Colchester\00 Mar 17\report\July 17 final edit\Colchester Local Plan Traffic Modelling TN - V5.1.docx i
Document Control Sheet
Document prepared by:
Transport Planning Victoria House Chelmsford CM1 1JR
T 0845 603 7631 E [email protected] W www.essex.gov.uk/highways
Record of Issue
Issue Status Author Date Check Date Review Date
1 Draft AZ/SL 04/01/17 MB 05/01/17 TW 01/02/17
2 Draft AZ/MW 02/03/17 MW 03/03/17 TW 03/03/17
3 Draft AZ/MW 31/03/17 MW 31/03/17 TW 31/03/17
4 Final AZ/MW 26/04/17 MW 27/04/17 TW 28/04/17
5 Final AZ/MW 12/05/17 MW 12/05/17 TW 17/05/17
5.1 Final
(typos pp. 43-44,46)
AZ/MW 12/05/17 MW 18/07/17 TW 17/05/17
Approved for Issue By Date
Tom Withey 17/05/17
Report Title Colchester Local Plan Traffic Modelling
Project Number B3353R0Q
Status Final
Revision 5.1
Control Date 18/07/2017
C:\Users\WhittlM\Documents\My_Docs\Essex\Colchester\00 Mar 17\report\July 17 final edit\Colchester Local Plan Traffic Modelling TN - V5.1.docx ii
Distribution
Organisation Contact Number of Copies ECC
Alan Lindsay 1- Electronic
ECC Matthew Jericho 1- Electronic
CBC Paul Wilkinson 1- Electronic
CBC Rachel Forkin 1- Electronic
Limitation Statement
This report has been prepared on behalf of, and for the exclusive use of, Essex County Council by Jacobs and is subject to, and issued in accordance with, the provisions of the contract between Jacobs and Essex County Council. Jacobs accepts no liability or responsibility whatsoever for, or in respect of, any use of, or reliance upon, this report by any third party.
The analysis and forecasts contained in this report make use of information and input assumptions made available to Jacobs at a point in time. As conditions change the analysis and forecasts would be expected to change. Hence the findings set out in this report should be understood as relevant to that point in time when the information and assumptions were made.
© Copyright 2017 Jacobs UK Ltd. The concepts and information contained in this document are the property of Jacobs. Use or copying of this document in whole or in part without the written permission of Jacobs constitutes an infringement of copyright.
C:\Users\WhittlM\Documents\My_Docs\Essex\Colchester\00 Mar 17\report\July 17 final edit\Colchester Local Plan Traffic Modelling TN - V5.1.docx iii
Contents 1 Introduction .................................................................................................. 4
2 Ongoing studies and projects ...................................................................... 6
3 Development Scenarios ............................................................................... 8 4 Modelling Methodology .............................................................................. 10
5 Results ....................................................................................................... 15
6 Link and Junction Analysis ......................................................................... 20 7 Sensitivity testing ....................................................................................... 28
8 Mitigation Measures ................................................................................... 49
Appendix A: List of Development ..................................................................... 52 Appendix B: Overcapacity Junction Analysis.................................................... 55
Appendix C: Options for mitigation measures .................................................. 67
Tables Table 1 Local Plan development summary........................................................ 8 Table 2 ECC trip rates for housing ................................................................... 11 Table 3 ECC employment and retail trip rates .................................................. 11 Table 4 Trip rates for (E)O land use ................................................................. 12 Table 5 Trip rates for (E)IE land use ................................................................ 12 Table 6 Trip rates for (E)WC land use .............................................................. 12 Table 7 Trip rates for (Re)RP-EF land use ....................................................... 12 Table 8 Total arrivals and departures to local development sites ..................... 14 Table 9 Full development NTEM adjustment................................................... 15 Table 10 Summary statistics for initial assignment scenarios 0b-1c ................. 16 Table 11 Demand model convergence ............................................................ 17 Table 12 Summary statistics for final assignment scenarios 0b-1c .................. 18 Table 13 Difference between initial and final assignments for scenarios 0b-1c 18 Table 14 Summary of model scenarios for sensitivity testing ........................... 29 Table 14 Summary statistics for final assignment scenarios 1c-1d .................. 30 Table 15 Summary statistics for final assignment scenarios 1c-1e .................. 36 Table 16 Summary statistics for final assignment scenarios 1c-1f ................... 42 Table 17 Summary statistics for final assignment scenarios 1c-1g .................. 46
C:\Users\WhittlM\Documents\My_Docs\Essex\Colchester\00 Mar 17\report\July 17 final edit\Colchester Local Plan Traffic Modelling TN - V5.1.docx iv
Figures Figure 1 % change in Summary Statistics compared to Current Allocated Development Scenario for the initial assignment scenario 1c .......................... 16 Figure 2 % change in Summary Statistics compared to Current Allocated Development Scenario for the final assignment scenarios 0b-1c ..................... 19 Figure 3 Locations of Overcapacity Links Scenario 0b – AM ........................... 21 Figure 4 Locations of Overcapacity Links Scenario 1c Post-VDM – AM .......... 21 Figure 5 Locations of Overcapacity Links Scenario 0b – PM ........................... 22 Figure 6 Locations of Overcapacity Links Scenario 1c Post-VDM – PM .......... 22 Figure 7 Locations of Overcapacity Junctions Scenario 0b – AM..................... 24 Figure 8 Locations of Overcapacity Junctions Scenario 1c Post-VDM – AM ... 24 Figure 9 Locations of Overcapacity Junctions Scenario 0b – PM..................... 25 Figure 10 Locations of Overcapacity Junctions Scenario 1c Post-VDM – PM . 25 Figure 11 Overcapacity Junctions A120 West of Colchester - 1c Post-VDM AM ......................................................................................................................... 26 Figure 12 Overcapacity Junctions A120 West of Colchester - 1c Post-VDM PM ......................................................................................................................... 26 Figure 13 % change in summary statistics for scenarios 1c-1d ........................ 30 Figure 14 Locations of Overcapacity Links and Junctions Scenario 1d Post-VDM – AM ........................................................................................................ 31 Figure 15 Locations of Overcapacity Links and Junctions Scenario 1d Post-VDM – PM ........................................................................................................ 32 Figure 16 Junction 26 A12 ............................................................................... 33 Figure 17 Traffic signal positions in the base model at Junction 26 ................. 33 Figure 18 Map of Greenstead roundabout ....................................................... 34 Figure 19 Changes at Greenstead roundabout ................................................ 35 Figure 20 % change in summary statistics for scenarios 1c-1e ........................ 36 Figure 21 Overcapacity Links and Junctions Scenario 1e Post-VDM – AM ..... 37 Figure 22 Overcapacity Links and Junctions Scenario 1e Post-VDM – PM ..... 37 Figure 23 Overcapacity changes at A12 Junction 26 in the AM peak in local plan scenario .................................................................................................... 38 Figure 24 Overcapacity changes at A12 Junction 26 in the PM peak in local plan scenario .................................................................................................... 39 Figure 25 Overcapacity changes at Greenstead roundabout in the AM peak in local plan scenario ............................................................................................ 39 Figure 26 Overcapacity changes at Greenstead roundabout in the PM peak in local plan scenario ............................................................................................ 40
C:\Users\WhittlM\Documents\My_Docs\Essex\Colchester\00 Mar 17\report\July 17 final edit\Colchester Local Plan Traffic Modelling TN - V5.1.docx v
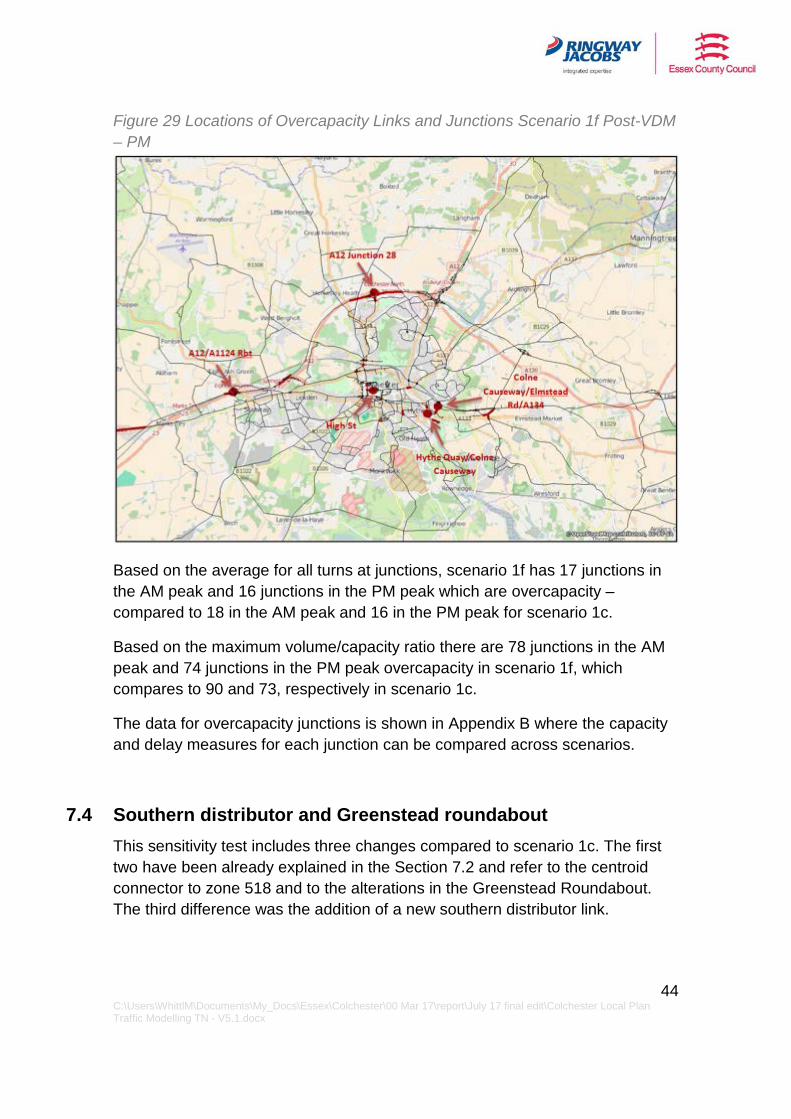
Figure 27 % change in summary statistics for scenarios 1c-1f ......................... 42 Figure 28 Locations of Overcapacity Links and Junctions Scenario 1f Post-VDM – AM ................................................................................................................. 43 Figure 29 Locations of Overcapacity Links and Junctions Scenario 1f Post-VDM – PM ................................................................................................................. 44 Figure 30 Location of the Southern Distributor ................................................. 45 Figure 31 % change in summary statistics for scenarios 1c-1g ........................ 46 Figure 32 Overcapacity Links and Junctions Scenario 1g Post-VDM – AM ..... 47
1 C:\Users\WhittlM\Documents\My_Docs\Essex\Colchester\00 Mar 17\report\July 17 final edit\Colchester Local Plan Traffic Modelling TN - V5.1.docx
Executive Summary This report contains updated and detailed transport modelling evidence for testing the preferred option of Colchester Borough Council’s Local Plan (2017-2033). The model used was based on the existing Colchester Area SATURN model, and a variable demand model developed specifically for the task. A nominal forecast year of 2032 was chosen which, although differing from the local plan horizon year, nonetheless contains all of the local plan development up to 2033.
A new committed development scenario and a new local plan development scenario were produced:
• Scenario 0b (2032) – Committed development scenario, which includes those developments contained in the current local plan and those which were completed subsequent to the modelled base year;
• Scenario 1c (2032) – Non-committed, preferred option, local plan scenario.
For each scenario a list of junctions and links, for which demand exceeded capacity, has been produced. In each case, the volume to capacity ratio has been identified along with the resulting delays which occur.
The network wide summary results show that the local plan development scenario experiences a reduction in average network speed with a corresponding increase in congestion and delay when compared against the committed development scenario.
Key local impacts were identified for the two forecast scenarios by comparing the amount of traffic through a link or junction with that link or junction’s traffic capacity. A link or junction that is overcapacity or close to capacity would be expected to experience delay. The local impacts identified include:
• The A12 between Junctions 28 and 29 in both directions in the forecast year in both scenarios – the impacts are exacerbated by the presence of local plan development and the proposed A120/A133 link road, which reroutes high volumes of traffic to the A12;
• The A12 at Junction 26 in the PM peak – the cumulative impacts of the various committed and local plan developments in the area contribute to traffic through this junction;
• Haven Road and Colne Causeway – The Colchester Tendring borders Garden Settlement contributes to traffic issues in the local plan scenario.
2 C:\Users\WhittlM\Documents\My_Docs\Essex\Colchester\00 Mar 17\report\July 17 final edit\Colchester Local Plan Traffic Modelling TN - V5.1.docx
• Greenstead Roundabout – traffic through this junction is comprised of various trip generators, including the committed employment site of Essex University;
• Ipswich Road – although not overcapacity it is close to capacity, which means the junction is susceptible to delays;
• Lexden Road/Southway – already overcapacity in the base year model and issues are exacerbated in 2032 due to traffic growth.
Four sensitivity tests of both the committed and local plan scenarios were conducted in order to identify the traffic implications on the road network from:
1. Widening the A12 between junctions 25 and 29 – this provided additional capacity to relieve the overcapacity problems identified above for the A12, and resulted in some rerouting in the model;
2. Removing traffic signals at junction 26 of the A12 combined with increased capacity at Greenstead roundabout – the latter reduced capacity problems in the AM peak at the roundabout but increased traffic on Eastern approach, while in PM peak there was an overall worsening of overcapacity problems as more traffic chose routes via Greenstead roundabout;
3. Assuming a lower level of car trip generation at the garden community developments combined with improvements at Greenstead roundabout – this partially resolved some overcapacity problems, but local rerouting created new overcapacity issues along Eastern Approach and on roads close to Greenstead roundabout as in the previous sensitivity test;
4. Introducing a southern distributor road in the Stanway area combined with improvements at Greenstead roundabout – this did not show any significant changes as the Stanway area was not presenting overcapacity problems in the reference case. Most of the changes in this scenario could be attributed to the Greenstead roundabout improvement.
In addition, options for a series of mitigation measures at key junctions and links which could be adversely affected by local plan developments have been generated. Consideration was given to previous and current studies in order that this SATURN study reflects and is consistent with other work.
For each location where over-capacity issues were identified, options were generated for traffic management, infrastructure and sustainable transportation measures, such as improvements for public transport, walking and cycling. In reality a combination of measures would be used which would need to be co-ordinated along the routes. The four main packages of mitigation measures identified would help to address:
3 C:\Users\WhittlM\Documents\My_Docs\Essex\Colchester\00 Mar 17\report\July 17 final edit\Colchester Local Plan Traffic Modelling TN - V5.1.docx
• A12 corridor; • East Colchester A134/A133 corridor; • South and West Colchester A134 and A1124 corridor; • Other locations including Colne Bank/Cymbeline Way, Harwich Road/East
Street, Circular Road South, Shrub End Road/Maldon Road, Old Heath Road/Wimpole Road, Brook Street, Mersea Road/Normandy Avenue junction and junctions on the proposed new A120/A133 link road in East Colchester.
It should be recognised that the mitigation measures identified are at the option generation stage although, as far as possible, grounded in current studies and plans. Further research, design and appraisal would be essential, for which the scheme specific studies, where they exist, would be an optimum starting point.
4 C:\Users\WhittlM\Documents\My_Docs\Essex\Colchester\00 Mar 17\report\July 17 final edit\Colchester Local Plan Traffic Modelling TN - V5.1.docx
1 Introduction
1.1 Background In June 2015, Colchester Borough Council (CBC) asked Essex County Council (ECC) to provide transport modelling evidence to support their emerging Local Plan proposals. Through a staged process, two phases of work with associated reporting was conducted. Following this, CBC requested, as a third phase of work, additional modelling support to test the preferred option scenario for the local plan, and investigate potential mitigation measures. Essex Highways subsequently commissioned Jacobs to carry out this work.
1.2 Objectives The objectives of the project are to:
• Conduct a review of assumptions in the forecasting model against known data sources;
• Produce revised forecast models reflecting CBC’s preferred development scenario and other updates to the modelling methodology;
• Identify links and junctions within the model which have capacity and delay issues;
• Carry out sensitivity tests to explore how the capacity and delay issues are affected by changes to the network;
• Propose highway mitigation measures; • Produce a report detailing the work, methodology and outcomes in line
with National Planning Policy Guidance.
The methodology for producing the models to test the preferred local plan developments is consistent with previous work. As such, only the AM and PM peak hours have been assessed.
New forecasts scenarios 0b and 1c have been produced – with 0b containing committed developments only, and 1c containing additional non-committed local plan growth. In scenario 1c the total level of development (from specifically identified development and TEMPro background growth) is maintained at 2032 TEMPro levels, with 0b below TEMPro growth.
A list of junctions and links for which demand exceeded capacity has been produced for each scenario. In each case, the volume to capacity ratio has been identified, along with the resulting delays which occur. The forecast
5 C:\Users\WhittlM\Documents\My_Docs\Essex\Colchester\00 Mar 17\report\July 17 final edit\Colchester Local Plan Traffic Modelling TN - V5.1.docx
scenarios have also been compared with each other to identify the relative impacts using a set of network summary statistics.
The sensitivity tests are described in detail in Section 7 and have explored how capacity and delay problems change by:
1. Widening the A12 to three lanes in both directions between junctions 25-29; 2. Removing signals at the roundabout at Junction 26 of the A12 since there is
uncertainty around when plans to signalise the off ramps at this junction would be implemented;
3. Reducing the number of vehicle trips (reflecting a lower mode share by car) to and from the proposed garden community developments in order to reflect the aspiration that more sustainable transportation options will be an integral part of the design of these communities;
4. Adding the ‘southern distributor scheme’ to the model which links Warren Lane to Cunobelin Way in the Stanway area of Colchester.
In addition, sensitivity tests (2) to (4) above have been combined with an improvement to Greenstead roundabout.
Mitigation measures have been derived for locations where capacity and delay problems have been identified. With reference to previous and current studies options cover traffic management, infrastructure improvements and sustainable transportation measures.
It is recognised that further research, design and appraisal of options for mitigation measures would be required, in those cases where they are not based on established studies.
6 C:\Users\WhittlM\Documents\My_Docs\Essex\Colchester\00 Mar 17\report\July 17 final edit\Colchester Local Plan Traffic Modelling TN - V5.1.docx
2 Ongoing studies and projects There are a number of studies for future transport improvements and developments that are currently ongoing. While these are acknowledged, it has not always been possible to incorporate them fully into this work either due to their current status or the stage which they are at. It is important to note that these transport schemes and developments in surrounding areas will have an impact on travel patterns in the Colchester area. So while the Colchester transport model has used the best information available at the time, it should be recognised that, schemes in the wider area may have an impact on forecasts being made.
2.1 A120 Braintree to Marks Tey Junction Improvements Highways England (HE) is currently investigating the potential for junction improvements to the A120 between Braintree and Marks Tey.
2.2 A120 Braintree to A12 Route Options The Department for Transport (DfT), HE and ECC agreed that ECC will lead on feasibility work in order to determine options for a new A120 route between Braintree and the A12, with a suggested option to be determined by Summer 2017. It is envisaged that ECC will recommend to HE and the Secretary of State for Transport a preferred route to Government for inclusion in the next Government Road Investment Strategy (RIS2), which will run from 2020 to 2025.
In the route options under consideration the A120 either joins the A12 just north of Kelvedon or just south of Kelvedon, which lies to the south west of Colchester. This affects traffic levels on the B1023 to Tiptree and along the B1022 between Tiptree and Colchester. This indicates potential changes in route choice south west of Colchester, which have not been taken into consideration in this study.
2.3 A12 Widening between M25 and A12 J25. HE are currently investigating widening the A12 to three lanes in each direction between the M25 and Junction 25 and beyond. The section between J19 and J25, that is between Chelmsford and Marks Tey, has been identified in the RIS1 document to be delivered first, with construction outlined to start by the end of the financial year 2019/20. The widening of the remainder of the route is to be included in RIS2 with the aim to complete construction by the end of 2025. As
7 C:\Users\WhittlM\Documents\My_Docs\Essex\Colchester\00 Mar 17\report\July 17 final edit\Colchester Local Plan Traffic Modelling TN - V5.1.docx
the scheme has a high level of certainty the A12 up to Junction 25 is modelled as proposed with three lanes in each direction.
2.4 A12 Widening between J25 and J29 HE are beginning the process of investigating widening the A12 to three lanes in each direction on the A12 between Junctions 25 and 29. Also known as the Colchester A12 bypass the scheme could be part of RIS2. A sensitivity test of the Colchester model has been carried out to assess the impacts of this scheme.
2.5 Garden Communities Three new Garden Communities have been proposed within the local plan period:
• Tendring/Colchester border – to provide up to 2,500 homes; • Colchester/Braintree Borders – to provide up to 2,500 homes; • West of Braintree – to provide up to 2,500 homes.
As part of the planning and design for the Garden Communities, a separate study has been undertaken to forecast the likely traffic impacts of the new communities, including evaluating the potential public transport requirements during the plan period, the potential for the internalisation of trips, and the likely trip distribution. There is an aspiration of achieving a modal split of: 40% Active, 30% Public Transport and 30% Car. The garden communities study has developed a simple transport demand tool for each of the developments, which provides trip ends to use in transport models, based on different modal splits being achieved.
This transport demand tool was not available when the Colchester local plan modelling commenced, however, it was used to inform one of the sensitivity tests described in Section 7 of this report.
2.6 Braintree and Tendring Local Plan Studies Both Braintree District and Tendring District have undertaken traffic modelling in order to inform their respective local plans. Although the methodology used in these studies and the Colchester modelling project does differ, there is consistency in the assumptions for any developments on the borders of these districts and the trip rates applied.
8 C:\Users\WhittlM\Documents\My_Docs\Essex\Colchester\00 Mar 17\report\July 17 final edit\Colchester Local Plan Traffic Modelling TN - V5.1.docx
3 Development Scenarios
3.1 Overview The year 2032 scenarios 0b and 1c have been developed to represent the updated committed and local plan assumptions:
• Scenario 0b (2032) – committed development;
• Scenario 1c (2032) – non-committed, preferred option local plan development.
3.2 Committed development scenario The committed development scenario includes those developments contained in the current local plan and those developments which have been built out since the modelled base year (2007). This committed development scenario was modelled to provide a reference case scenario – Scenario 0b.
A full list of housing developments assumed for this scenario is contained in Appendix A. A total of 11,053 dwellings, 193,052sqm gross floor area (GFA) of employment and 49,400sqm (GFA) of retail space have been included in the committed development scenario.
3.3 Preferred Option Local Plan development scenario A scenario which included all committed development plus the preferred option local plan development was modelled as the test case – Scenario 1c.
A full list of developments is in Appendix A. A total of 10,268 dwellings, 30,750sqm (GFA) employment and 13,860sqm (GFA) retail, in addition to committed development, have been included.
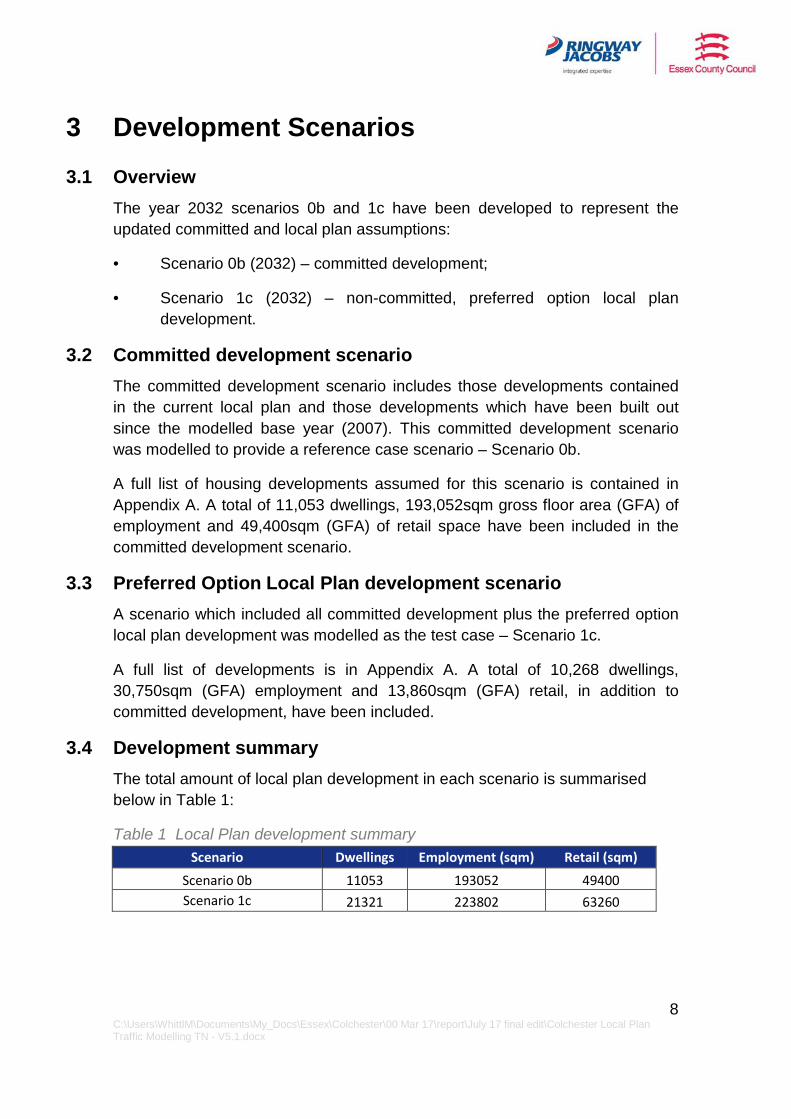
3.4 Development summary The total amount of local plan development in each scenario is summarised below in Table 1:
Table 1 Local Plan development summary Scenario Dwellings Employment (sqm) Retail (sqm)
Scenario 0b 11053 193052 49400 Scenario 1c 21321 223802 63260

9 C:\Users\WhittlM\Documents\My_Docs\Essex\Colchester\00 Mar 17\report\July 17 final edit\Colchester Local Plan Traffic Modelling TN - V5.1.docx
Note that alongside these development increases, TEMPro growth was used to set the background growth in dwellings and employment (including retail sites).
The housing assumption for local plan scenario is also identified in Appendix A.
10 C:\Users\WhittlM\Documents\My_Docs\Essex\Colchester\00 Mar 17\report\July 17 final edit\Colchester Local Plan Traffic Modelling TN - V5.1.docx
4 Modelling Methodology
4.1 Model Used The transport model used for this assessment was derived from the original assessment commissioned by ECC in June 2015.
The proposed A133/A120 link road has been included in the local plan scenario with one junction in the middle connecting to the garden community development.
Some of the larger local plan developments have been modelled with new, separate zones. These zones have their own access points onto the network, reflecting the access arrangements for the specific development. Therefore, the total number of zones has increased to 265.
4.2 Demand Calculation Although the same demand calculation methodology was used as in the previous phases on the Colchester modelling project, different adjustments were applied to the TEMPro NTEM v6.2 database due to a different quantum of development in the preferred option local plan scenario. The total level of growth in scenario 1c remains consistent with NTEM forecasts discounting the modelled developments. In scenario 0b the background growth is assumed the same as 1c, thus the only difference is the local plan growth.
4.3 Variable Demand Model A variable demand model (VDM) was developed to assess the demand response to changes in highway travel time between the test scenario and the current allocated development scenario. The premise of a VDM is that any change in travel cost, through traffic intervention or changes in travel demand, is liable to either induce or suppress traffic. Therefore as traffic is added to the network from the local plan developments, with the result that travel time increases, this will impact on travel behaviour. Some trips may not be made at that time, be made by another mode or not be made at all.
Any changes in travel demand, will in turn affect travel times, which will consequentially affect travel demand again. The VDM model therefore follows an iterative process of modifying travel demand in response to changes in travel time. The model iterates until the changes in demand calculated from one iteration to the next are sufficiently small; this is termed ‘convergence’, and is measured by a statistic known as the ‘relative gap’, expressed as a percentage,
11 C:\Users\WhittlM\Documents\My_Docs\Essex\Colchester\00 Mar 17\report\July 17 final edit\Colchester Local Plan Traffic Modelling TN - V5.1.docx
and often referred to as %GAP. Guidance (TAG Unit M2 – Paragraph 6.3.8) suggests that a relative gap (%GAP) under 0.1% is a favourable level of convergence. The %GAP values achieved in the scenario tests are provided in section 5.3.
4.4 Trips to and from development sites
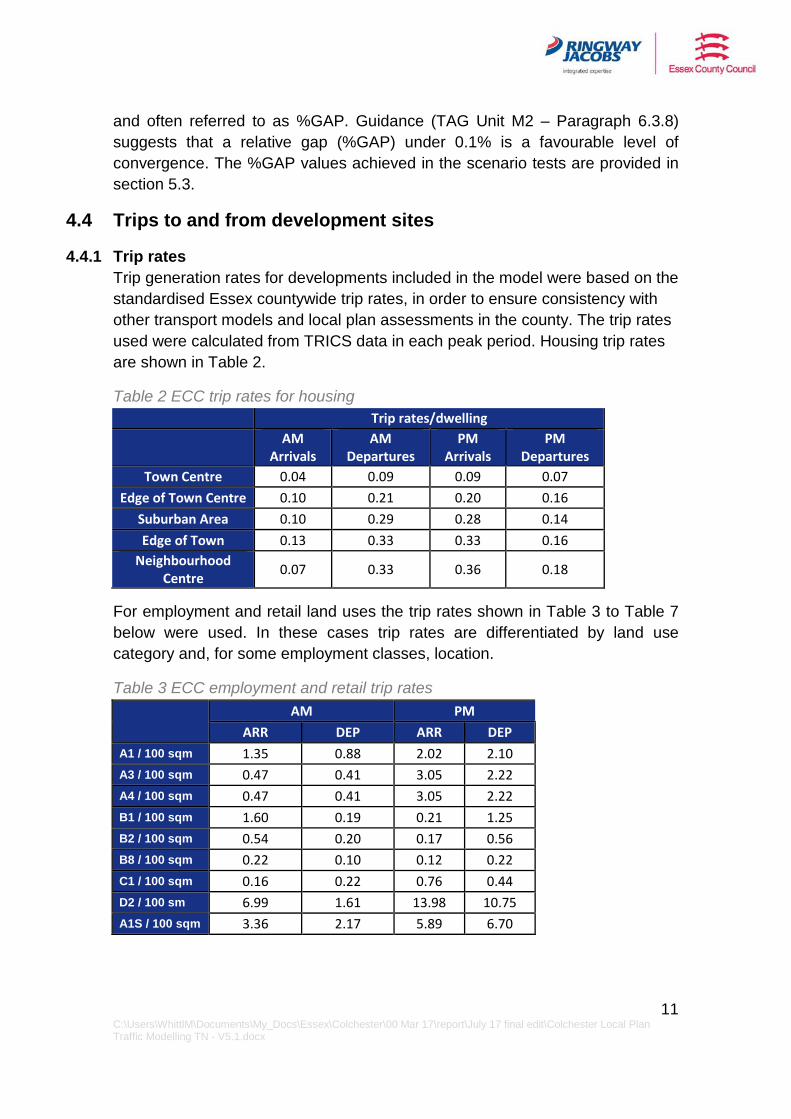
4.4.1 Trip rates Trip generation rates for developments included in the model were based on the standardised Essex countywide trip rates, in order to ensure consistency with other transport models and local plan assessments in the county. The trip rates used were calculated from TRICS data in each peak period. Housing trip rates are shown in Table 2.
Table 2 ECC trip rates for housing Trip rates/dwelling
AM Arrivals
AM Departures
PM Arrivals
PM Departures
Town Centre 0.04 0.09 0.09 0.07 Edge of Town Centre 0.10 0.21 0.20 0.16
Suburban Area 0.10 0.29 0.28 0.14 Edge of Town 0.13 0.33 0.33 0.16
Neighbourhood Centre 0.07 0.33 0.36 0.18
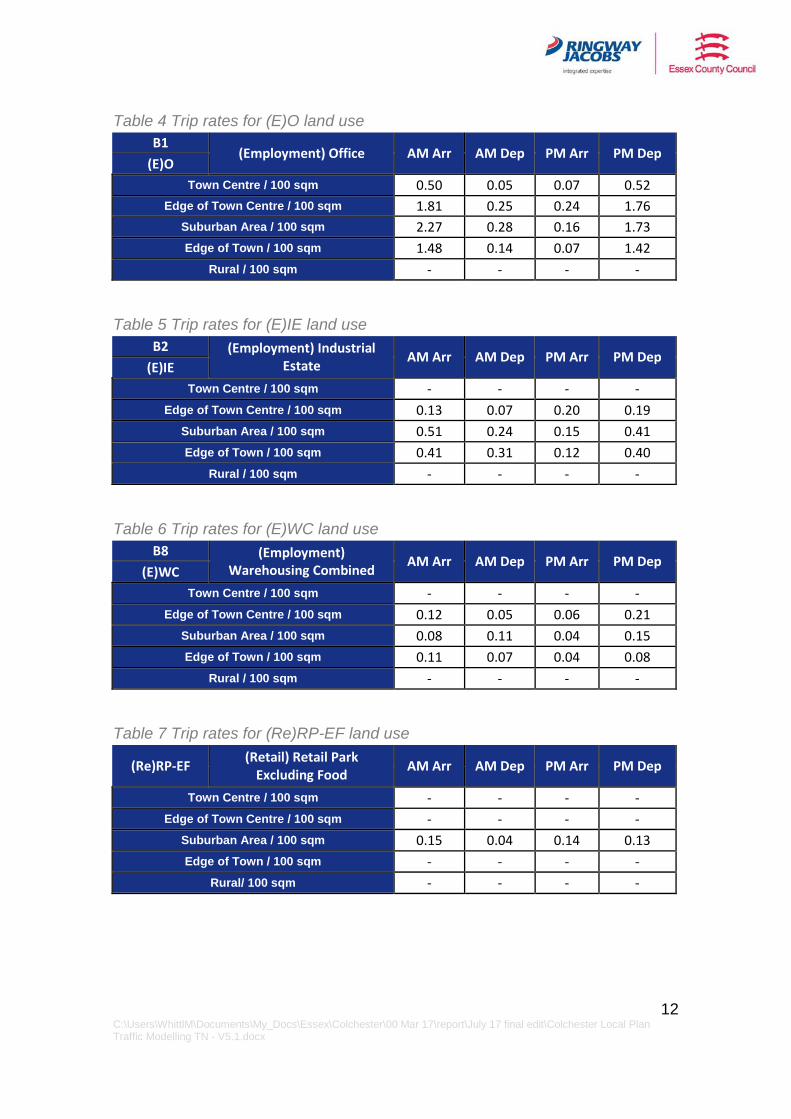
For employment and retail land uses the trip rates shown in Table 3 to Table 7 below were used. In these cases trip rates are differentiated by land use category and, for some employment classes, location.
Table 3 ECC employment and retail trip rates
AM PM
ARR DEP ARR DEP A1 / 100 sqm 1.35 0.88 2.02 2.10 A3 / 100 sqm 0.47 0.41 3.05 2.22 A4 / 100 sqm 0.47 0.41 3.05 2.22 B1 / 100 sqm 1.60 0.19 0.21 1.25 B2 / 100 sqm 0.54 0.20 0.17 0.56 B8 / 100 sqm 0.22 0.10 0.12 0.22 C1 / 100 sqm 0.16 0.22 0.76 0.44 D2 / 100 sm 6.99 1.61 13.98 10.75 A1S / 100 sqm 3.36 2.17 5.89 6.70
12 C:\Users\WhittlM\Documents\My_Docs\Essex\Colchester\00 Mar 17\report\July 17 final edit\Colchester Local Plan Traffic Modelling TN - V5.1.docx
Table 4 Trip rates for (E)O land use B1
(Employment) Office AM Arr AM Dep PM Arr PM Dep (E)O
Town Centre / 100 sqm 0.50 0.05 0.07 0.52 Edge of Town Centre / 100 sqm 1.81 0.25 0.24 1.76
Suburban Area / 100 sqm 2.27 0.28 0.16 1.73 Edge of Town / 100 sqm 1.48 0.14 0.07 1.42
Rural / 100 sqm - - - -
Table 5 Trip rates for (E)IE land use B2 (Employment) Industrial
Estate AM Arr AM Dep PM Arr PM Dep (E)IE
Town Centre / 100 sqm - - - - Edge of Town Centre / 100 sqm 0.13 0.07 0.20 0.19
Suburban Area / 100 sqm 0.51 0.24 0.15 0.41 Edge of Town / 100 sqm 0.41 0.31 0.12 0.40
Rural / 100 sqm - - - -
Table 6 Trip rates for (E)WC land use B8 (Employment)
Warehousing Combined AM Arr AM Dep PM Arr PM Dep (E)WC
Town Centre / 100 sqm - - - - Edge of Town Centre / 100 sqm 0.12 0.05 0.06 0.21
Suburban Area / 100 sqm 0.08 0.11 0.04 0.15 Edge of Town / 100 sqm 0.11 0.07 0.04 0.08
Rural / 100 sqm - - - -
Table 7 Trip rates for (Re)RP-EF land use
(Re)RP-EF (Retail) Retail Park Excluding Food AM Arr AM Dep PM Arr PM Dep
Town Centre / 100 sqm - - - - Edge of Town Centre / 100 sqm - - - -
Suburban Area / 100 sqm 0.15 0.04 0.14 0.13 Edge of Town / 100 sqm - - - -
Rural/ 100 sqm - - - -
13 C:\Users\WhittlM\Documents\My_Docs\Essex\Colchester\00 Mar 17\report\July 17 final edit\Colchester Local Plan Traffic Modelling TN - V5.1.docx
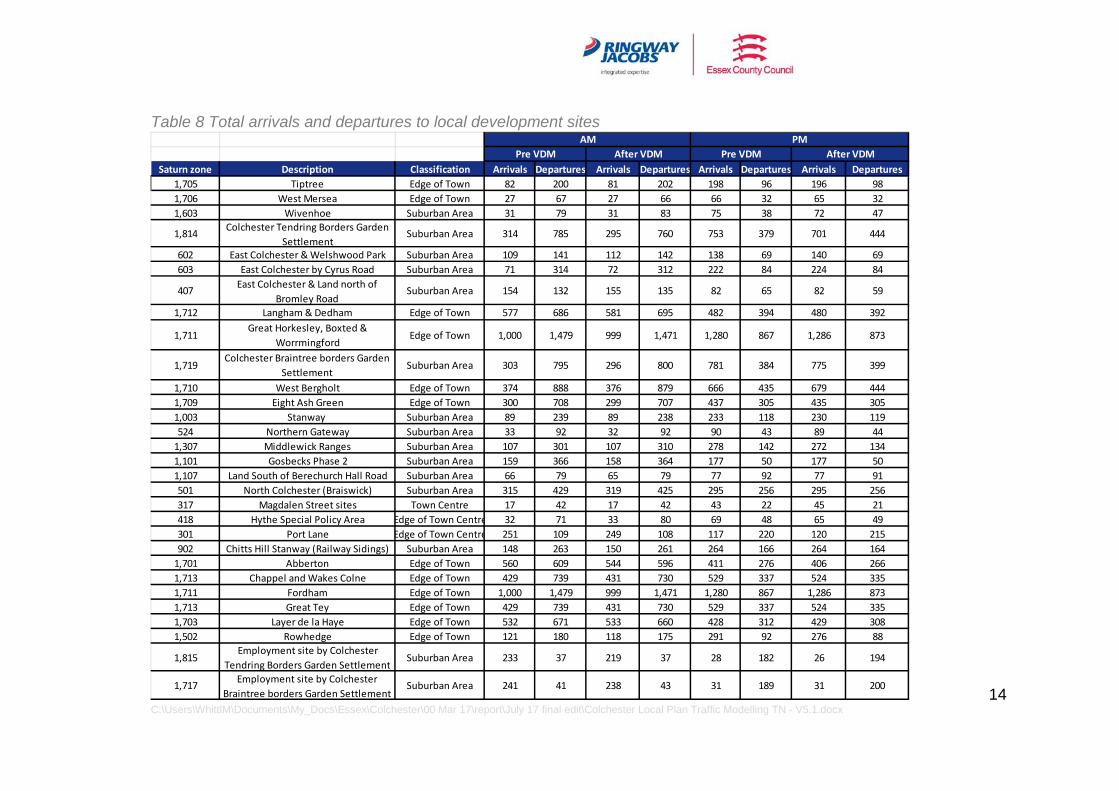
4.4.2 Total origins and destinations by local plan development zones
Table 8 shows the total arrivals and departures for each preferred option local plan development site.
14 C:\Users\WhittlM\Documents\My_Docs\Essex\Colchester\00 Mar 17\report\July 17 final edit\Colchester Local Plan Traffic Modelling TN - V5.1.docx
Table 8 Total arrivals and departures to local development sites
Saturn zone Description Classification Arrivals Departures Arrivals Departures Arrivals Departures Arrivals Departures
1,705 Tiptree Edge of Town 82 200 81 202 198 96 196 981,706 West Mersea Edge of Town 27 67 27 66 66 32 65 321,603 Wivenhoe Suburban Area 31 79 31 83 75 38 72 47
1,814 Colchester Tendring Borders Garden Settlement
Suburban Area 314 785 295 760 753 379 701 444
602 East Colchester & Welshwood Park Suburban Area 109 141 112 142 138 69 140 69603 East Colchester by Cyrus Road Suburban Area 71 314 72 312 222 84 224 84
407 East Colchester & Land north of Bromley Road
Suburban Area 154 132 155 135 82 65 82 59
1,712 Langham & Dedham Edge of Town 577 686 581 695 482 394 480 392
1,711Great Horkesley, Boxted &
WorrmingfordEdge of Town 1,000 1,479 999 1,471 1,280 867 1,286 873
1,719Colchester Braintree borders Garden
SettlementSuburban Area 303 795 296 800 781 384 775 399
1,710 West Bergholt Edge of Town 374 888 376 879 666 435 679 4441,709 Eight Ash Green Edge of Town 300 708 299 707 437 305 435 3051,003 Stanway Suburban Area 89 239 89 238 233 118 230 119524 Northern Gateway Suburban Area 33 92 32 92 90 43 89 44
1,307 Middlewick Ranges Suburban Area 107 301 107 310 278 142 272 1341,101 Gosbecks Phase 2 Suburban Area 159 366 158 364 177 50 177 501,107 Land South of Berechurch Hall Road Suburban Area 66 79 65 79 77 92 77 91501 North Colchester (Braiswick) Suburban Area 315 429 319 425 295 256 295 256317 Magdalen Street sites Town Centre 17 42 17 42 43 22 45 21418 Hythe Special Policy Area Edge of Town Centre 32 71 33 80 69 48 65 49301 Port Lane Edge of Town Centre 251 109 249 108 117 220 120 215902 Chitts Hill Stanway (Railway Sidings) Suburban Area 148 263 150 261 264 166 264 164
1,701 Abberton Edge of Town 560 609 544 596 411 276 406 2661,713 Chappel and Wakes Colne Edge of Town 429 739 431 730 529 337 524 3351,711 Fordham Edge of Town 1,000 1,479 999 1,471 1,280 867 1,286 8731,713 Great Tey Edge of Town 429 739 431 730 529 337 524 3351,703 Layer de la Haye Edge of Town 532 671 533 660 428 312 429 3081,502 Rowhedge Edge of Town 121 180 118 175 291 92 276 88
1,815Employment site by Colchester
Tendring Borders Garden SettlementSuburban Area 233 37 219 37 28 182 26 194
1,717 Employment site by Colchester Braintree borders Garden Settlement
Suburban Area 241 41 238 43 31 189 31 200
PMAMPre VDM After VDM Pre VDM After VDM
15 C:\Users\WhittlM\Documents\My_Docs\Essex\Colchester\00 Mar 17\report\July 17 final edit\Colchester Local Plan Traffic Modelling TN - V5.1.docx
5 Results
5.1 Initial Demand The trip totals in Passenger Car Units (PCUs) across base year, committed and local plan scenarios are summarised below in Table 9. The table includes intra-zonal trips in the total.
Table 9 Full development NTEM adjustment
Scenario Time period Year No of
trips Increase from base
Increase from 0b
Base year AM
2007 42535 n/a n/a Scenario 0b
2032 55451 12916 n/a
Scenario 1c 58700 16164 3248 Base year
PM 2007 39234 n/a n/a
Scenario 0b 2032
51896 12661 n/a Scenario 1c 55034 15799 3138
In both AM and PM peak hours, approximately 3,000 additional trips are generated as a result of the local plan developments in scenario 1c compared to scenario 0b. Over 12,500 additional trips are generated due to the already committed developments in both AM and PM peaks compared with the base year and about 16,000 trips if local plan developments are delivered.
5.2 Assignment of initial demand The matrices referred to in the previous section were assigned to the model networks for each scenario. The assignment results prior to running VDM are detailed below.
The standard SATURN assignment summary statistics for scenarios 0b and 1c are given in Table 10.
16 C:\Users\WhittlM\Documents\My_Docs\Essex\Colchester\00 Mar 17\report\July 17 final edit\Colchester Local Plan Traffic Modelling TN - V5.1.docx
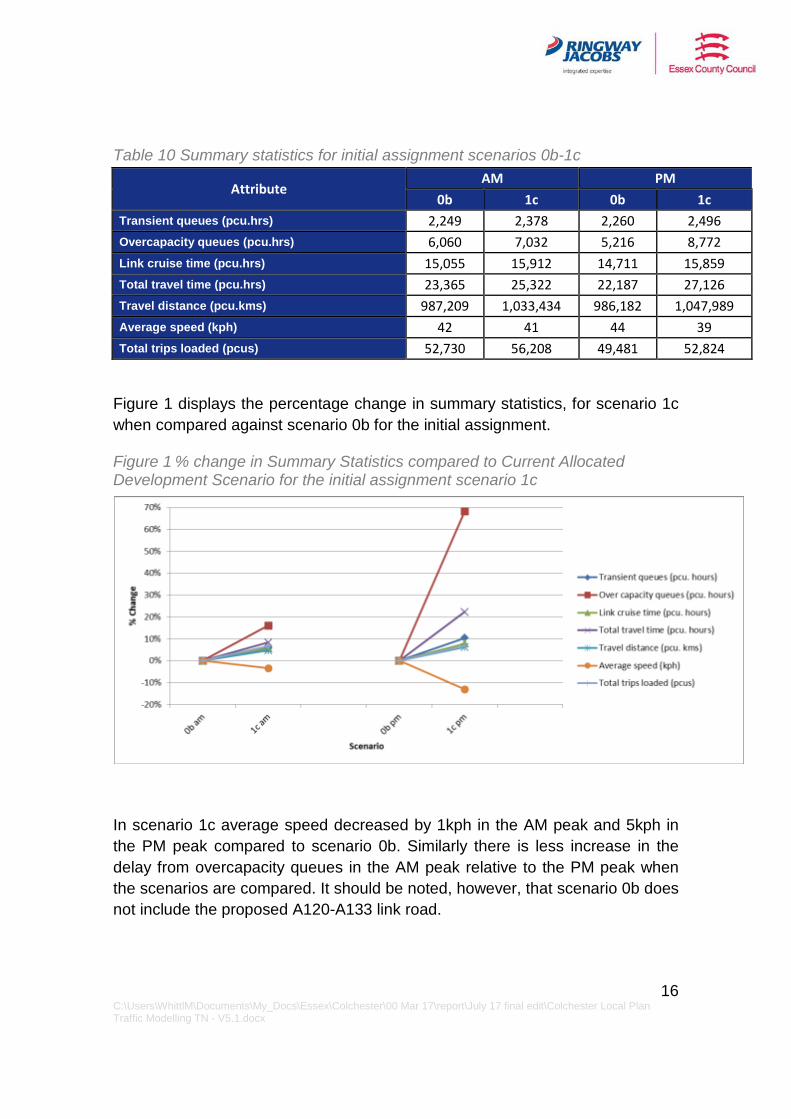
Table 10 Summary statistics for initial assignment scenarios 0b-1c
Attribute AM PM
0b 1c 0b 1c Transient queues (pcu.hrs) 2,249 2,378 2,260 2,496 Overcapacity queues (pcu.hrs) 6,060 7,032 5,216 8,772 Link cruise time (pcu.hrs) 15,055 15,912 14,711 15,859 Total travel time (pcu.hrs) 23,365 25,322 22,187 27,126 Travel distance (pcu.kms) 987,209 1,033,434 986,182 1,047,989 Average speed (kph) 42 41 44 39 Total trips loaded (pcus) 52,730 56,208 49,481 52,824
Figure 1 displays the percentage change in summary statistics, for scenario 1c when compared against scenario 0b for the initial assignment.
Figure 1 % change in Summary Statistics compared to Current Allocated Development Scenario for the initial assignment scenario 1c
In scenario 1c average speed decreased by 1kph in the AM peak and 5kph in the PM peak compared to scenario 0b. Similarly there is less increase in the delay from overcapacity queues in the AM peak relative to the PM peak when the scenarios are compared. It should be noted, however, that scenario 0b does not include the proposed A120-A133 link road.
17 C:\Users\WhittlM\Documents\My_Docs\Essex\Colchester\00 Mar 17\report\July 17 final edit\Colchester Local Plan Traffic Modelling TN - V5.1.docx
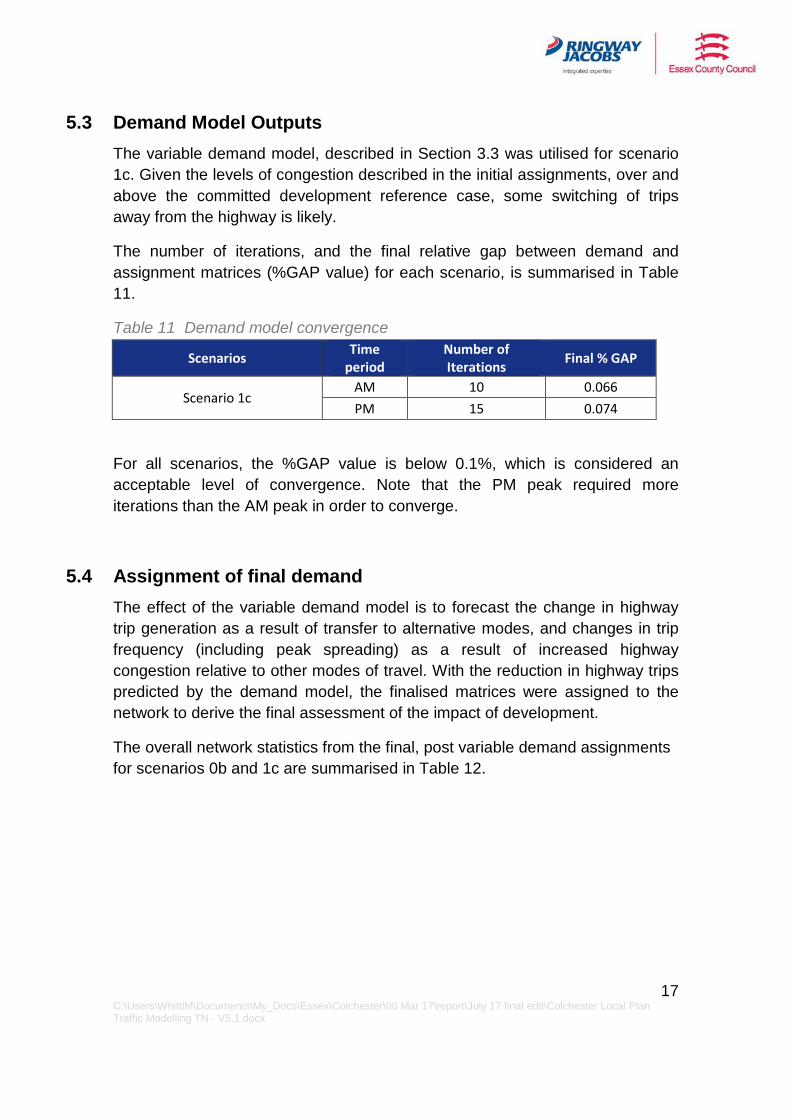
5.3 Demand Model Outputs The variable demand model, described in Section 3.3 was utilised for scenario 1c. Given the levels of congestion described in the initial assignments, over and above the committed development reference case, some switching of trips away from the highway is likely.
The number of iterations, and the final relative gap between demand and assignment matrices (%GAP value) for each scenario, is summarised in Table 11.
Table 11 Demand model convergence
Scenarios Time period
Number of Iterations Final % GAP
Scenario 1c AM 10 0.066 PM 15 0.074
For all scenarios, the %GAP value is below 0.1%, which is considered an acceptable level of convergence. Note that the PM peak required more iterations than the AM peak in order to converge.
5.4 Assignment of final demand The effect of the variable demand model is to forecast the change in highway trip generation as a result of transfer to alternative modes, and changes in trip frequency (including peak spreading) as a result of increased highway congestion relative to other modes of travel. With the reduction in highway trips predicted by the demand model, the finalised matrices were assigned to the network to derive the final assessment of the impact of development.
The overall network statistics from the final, post variable demand assignments for scenarios 0b and 1c are summarised in Table 12.
18 C:\Users\WhittlM\Documents\My_Docs\Essex\Colchester\00 Mar 17\report\July 17 final edit\Colchester Local Plan Traffic Modelling TN - V5.1.docx
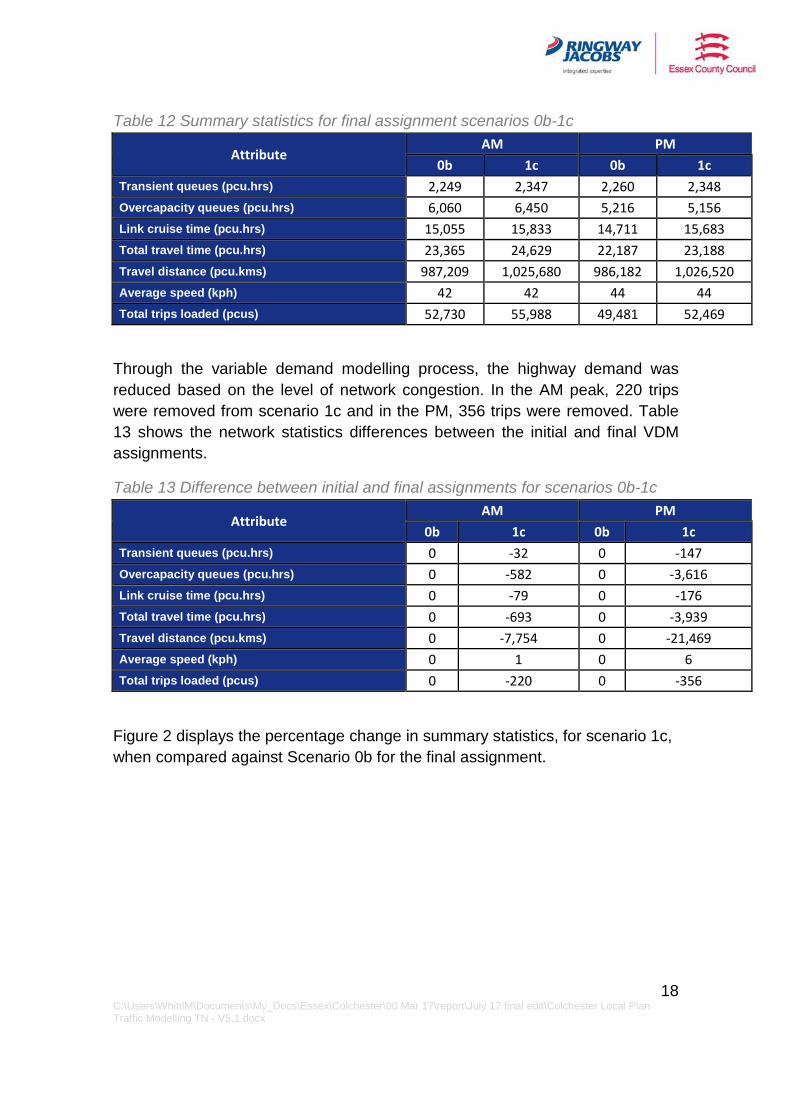
Table 12 Summary statistics for final assignment scenarios 0b-1c
Attribute AM PM
0b 1c 0b 1c Transient queues (pcu.hrs) 2,249 2,347 2,260 2,348 Overcapacity queues (pcu.hrs) 6,060 6,450 5,216 5,156 Link cruise time (pcu.hrs) 15,055 15,833 14,711 15,683 Total travel time (pcu.hrs) 23,365 24,629 22,187 23,188 Travel distance (pcu.kms) 987,209 1,025,680 986,182 1,026,520 Average speed (kph) 42 42 44 44 Total trips loaded (pcus) 52,730 55,988 49,481 52,469
Through the variable demand modelling process, the highway demand was reduced based on the level of network congestion. In the AM peak, 220 trips were removed from scenario 1c and in the PM, 356 trips were removed. Table 13 shows the network statistics differences between the initial and final VDM assignments.
Table 13 Difference between initial and final assignments for scenarios 0b-1c
Attribute AM PM
0b 1c 0b 1c Transient queues (pcu.hrs) 0 -32 0 -147 Overcapacity queues (pcu.hrs) 0 -582 0 -3,616 Link cruise time (pcu.hrs) 0 -79 0 -176 Total travel time (pcu.hrs) 0 -693 0 -3,939 Travel distance (pcu.kms) 0 -7,754 0 -21,469 Average speed (kph) 0 1 0 6 Total trips loaded (pcus) 0 -220 0 -356
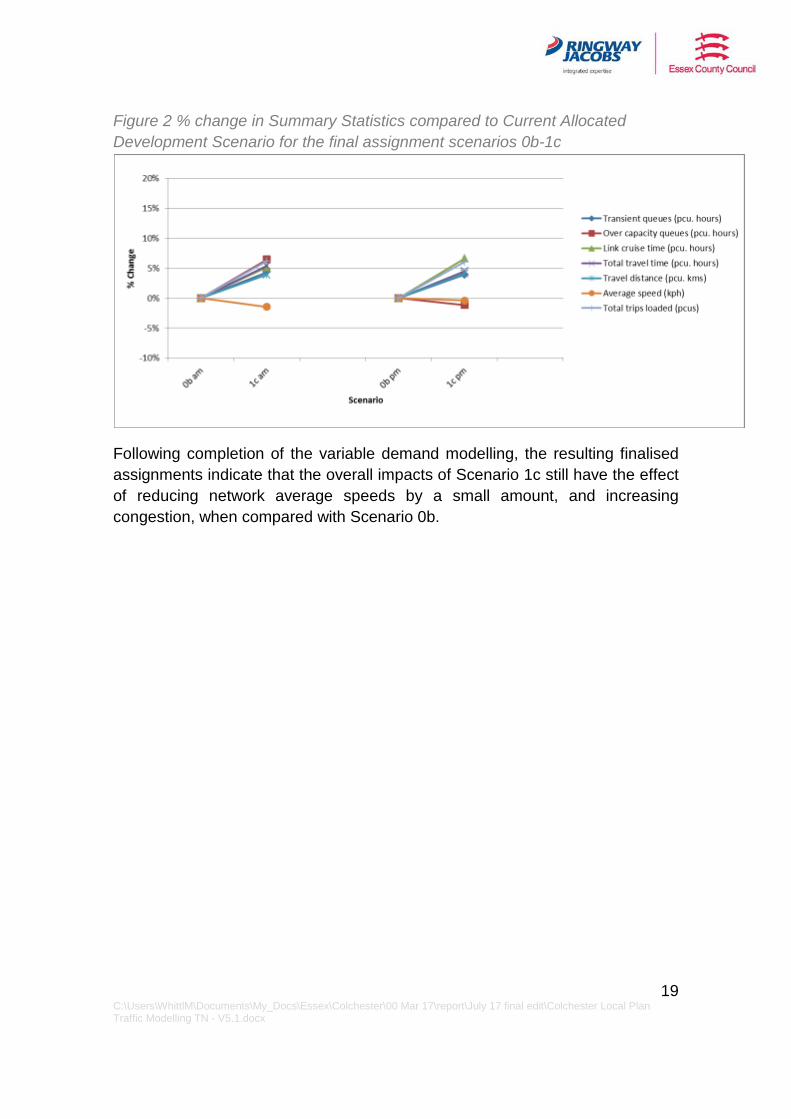
Figure 2 displays the percentage change in summary statistics, for scenario 1c, when compared against Scenario 0b for the final assignment.
19 C:\Users\WhittlM\Documents\My_Docs\Essex\Colchester\00 Mar 17\report\July 17 final edit\Colchester Local Plan Traffic Modelling TN - V5.1.docx
Figure 2 % change in Summary Statistics compared to Current Allocated Development Scenario for the final assignment scenarios 0b-1c
Following completion of the variable demand modelling, the resulting finalised assignments indicate that the overall impacts of Scenario 1c still have the effect of reducing network average speeds by a small amount, and increasing congestion, when compared with Scenario 0b.
20 C:\Users\WhittlM\Documents\My_Docs\Essex\Colchester\00 Mar 17\report\July 17 final edit\Colchester Local Plan Traffic Modelling TN - V5.1.docx
6 Link and Junction Analysis
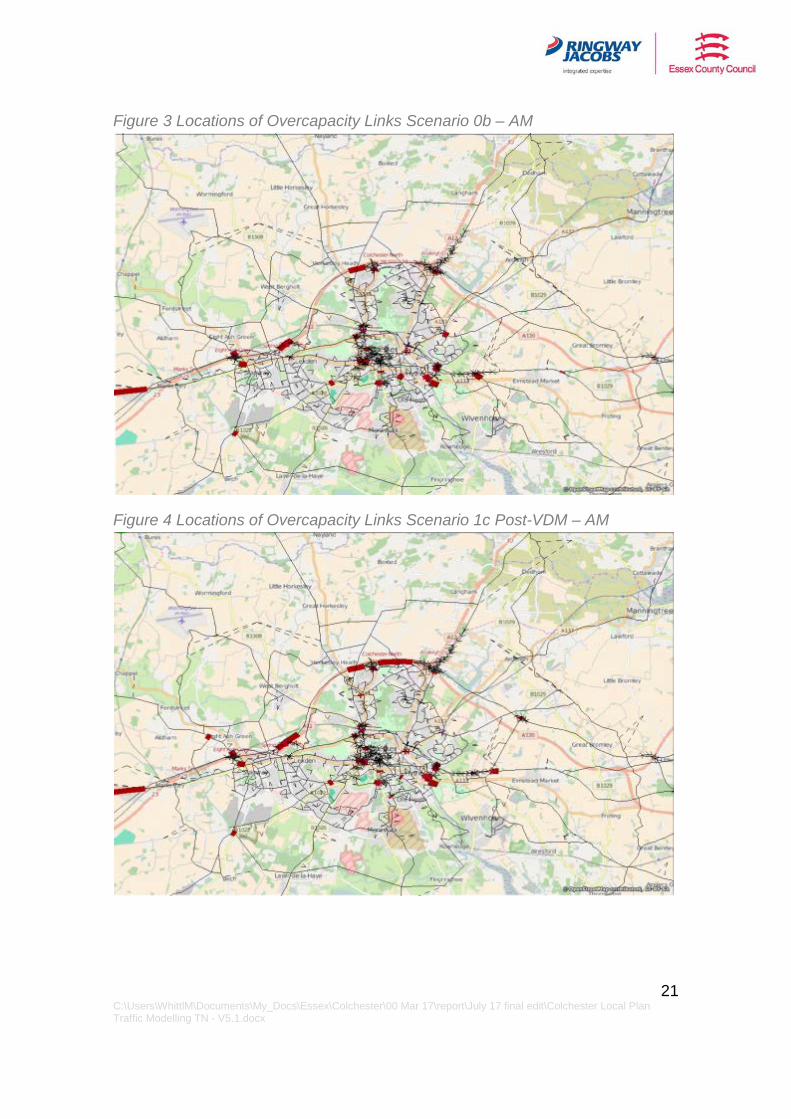
6.1 Link Analysis In the Colchester area model there are 5,314 links in scenario 0b and 5,341 links in scenario 1c. For the link analysis all links with traffic volume in excess of capacity were analysed. In scenario 0b, 87 links are operating above capacity in the AM peak and 80 in the PM peak while in scenario 1c there are 96 links performing overcapacity in the AM peak and 88 in the PM peak. The locations of the links are highlighted in red in Figures 3 - 6 below.
It should be noted that the figures below highlight only links that are forecast as overcapacity and not the areas of network that may experience congestion related to other factors such as junction delay. For the local plan development scenario, the links which become overcapacity in the AM and PM peaks, in addition to those in the committed development scenario, are mainly located on the A12 between Junctions 28 and 29.
21 C:\Users\WhittlM\Documents\My_Docs\Essex\Colchester\00 Mar 17\report\July 17 final edit\Colchester Local Plan Traffic Modelling TN - V5.1.docx
Figure 3 Locations of Overcapacity Links Scenario 0b – AM
Figure 4 Locations of Overcapacity Links Scenario 1c Post-VDM – AM
22 C:\Users\WhittlM\Documents\My_Docs\Essex\Colchester\00 Mar 17\report\July 17 final edit\Colchester Local Plan Traffic Modelling TN - V5.1.docx
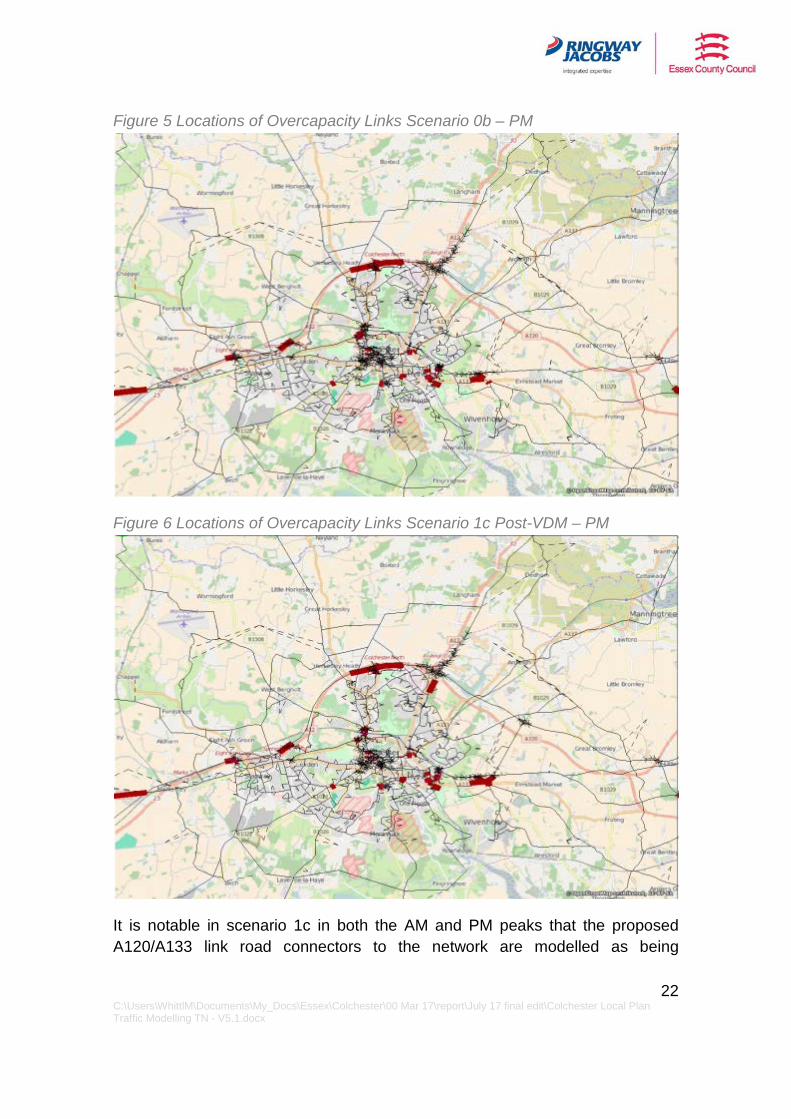
Figure 5 Locations of Overcapacity Links Scenario 0b – PM
Figure 6 Locations of Overcapacity Links Scenario 1c Post-VDM – PM
It is notable in scenario 1c in both the AM and PM peaks that the proposed A120/A133 link road connectors to the network are modelled as being

23 C:\Users\WhittlM\Documents\My_Docs\Essex\Colchester\00 Mar 17\report\July 17 final edit\Colchester Local Plan Traffic Modelling TN - V5.1.docx
overcapacity. However, the model loads all trips from the 2,500 dwellings in Colchester Tendring Borders Garden Settlement onto the link road when in reality there might be other access points of the development on to the network. The link is modelled as a 40mph single carriageway link with a junction at each end and an intermediate development access.
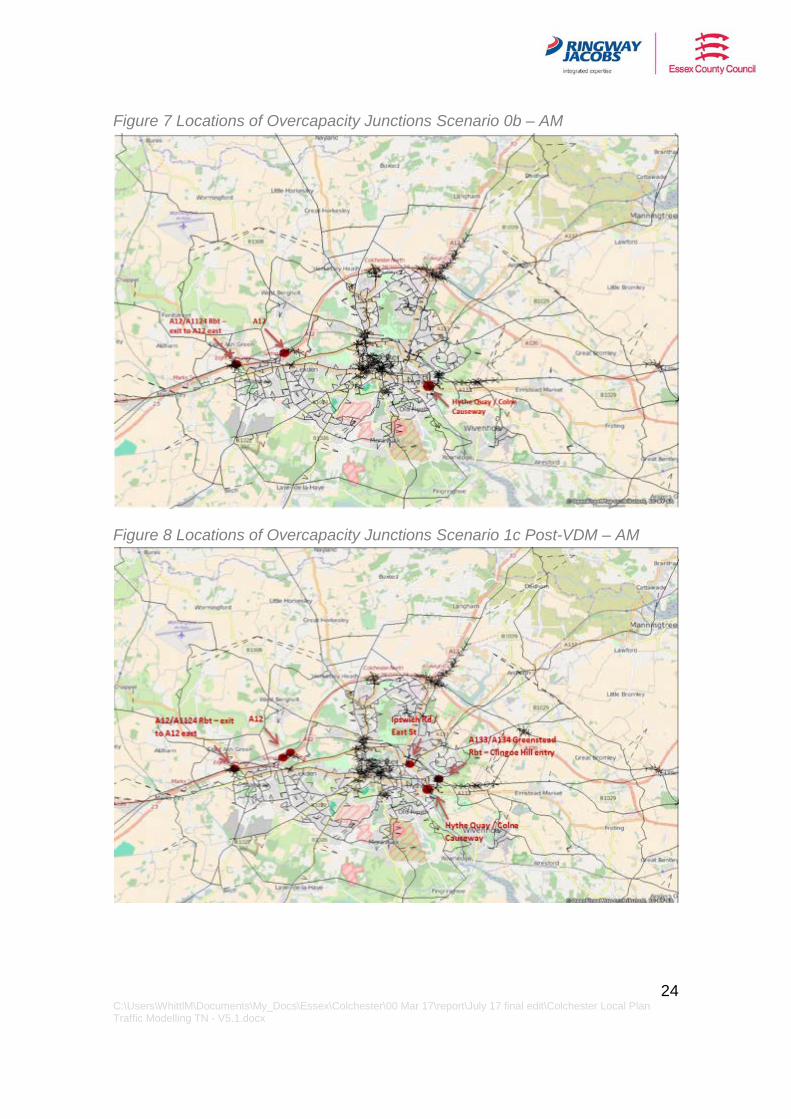
6.2 Junction Analysis In addition to capacity issues on links, congestion often occurs at junctions where the flow of traffic is constrained. Junction congestion is not shown in the images above, and would occur in addition to the link capacity issues. The analysis of average volume / capacity (v/c) and delay among all the approaches to a junction and the analysis of maximum v/c and delay among all the approaches to a junction have been carried out.
In the Colchester Area model, there are 2,561 junctions within the model simulation area in scenario 0b and 2,574 junctions within the model simulation area in scenario 1c. Within Colchester town, the locations of over-capacity junctions (based on average v/c among all turns) in the committed scenario and the local plan development scenario are shown in Figures 7-8 and 9-10. The locations of junctions outside of Colchester which are overcapacity are illustrated in Figure 11 and Figure 12.
In scenario 0b, there are 15 junctions in total across the model (some within Colchester town, and some in the wider area) operating in excess of capacity; while in scenario 1c there are 18 junctions operating overcapacity in the AM peak and 16 in the PM peak, based on the average for all turns at the junction. The figures indicate junctions that may experience capacity issues as a result of additional land use development.
24 C:\Users\WhittlM\Documents\My_Docs\Essex\Colchester\00 Mar 17\report\July 17 final edit\Colchester Local Plan Traffic Modelling TN - V5.1.docx
Figure 7 Locations of Overcapacity Junctions Scenario 0b – AM
Figure 8 Locations of Overcapacity Junctions Scenario 1c Post-VDM – AM
25 C:\Users\WhittlM\Documents\My_Docs\Essex\Colchester\00 Mar 17\report\July 17 final edit\Colchester Local Plan Traffic Modelling TN - V5.1.docx
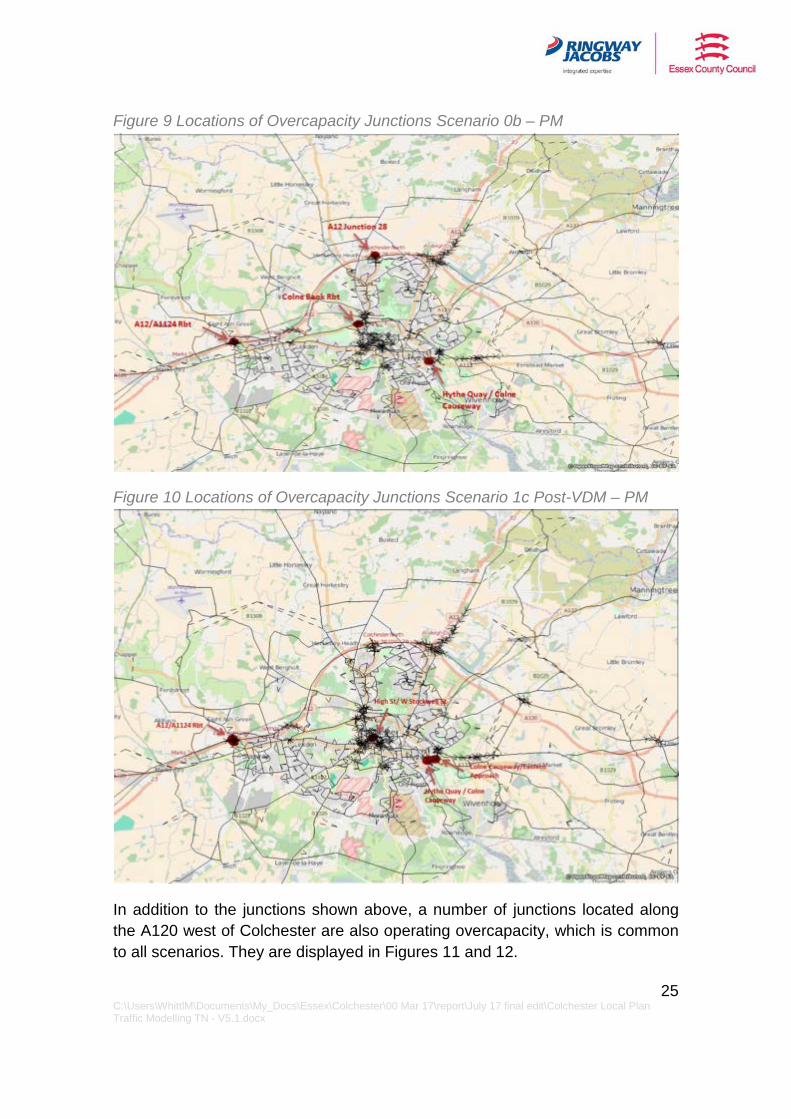
Figure 9 Locations of Overcapacity Junctions Scenario 0b – PM
Figure 10 Locations of Overcapacity Junctions Scenario 1c Post-VDM – PM
In addition to the junctions shown above, a number of junctions located along the A120 west of Colchester are also operating overcapacity, which is common to all scenarios. They are displayed in Figures 11 and 12.
26 C:\Users\WhittlM\Documents\My_Docs\Essex\Colchester\00 Mar 17\report\July 17 final edit\Colchester Local Plan Traffic Modelling TN - V5.1.docx
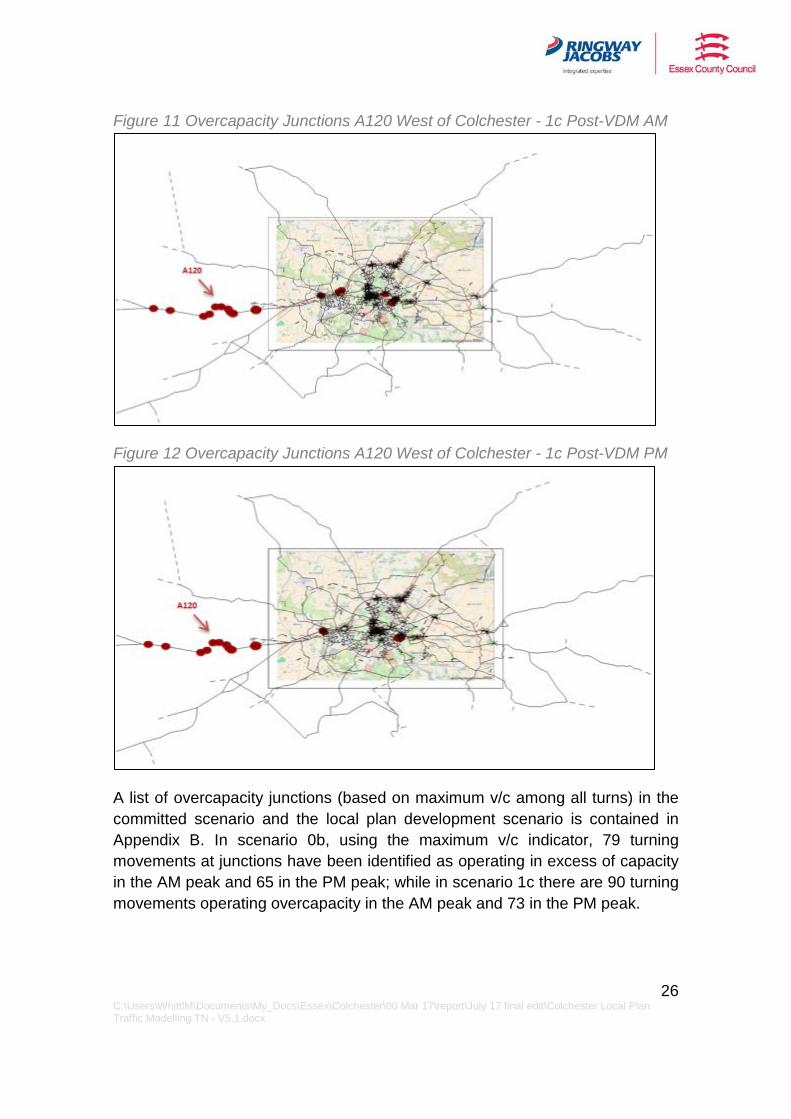
Figure 11 Overcapacity Junctions A120 West of Colchester - 1c Post-VDM AM
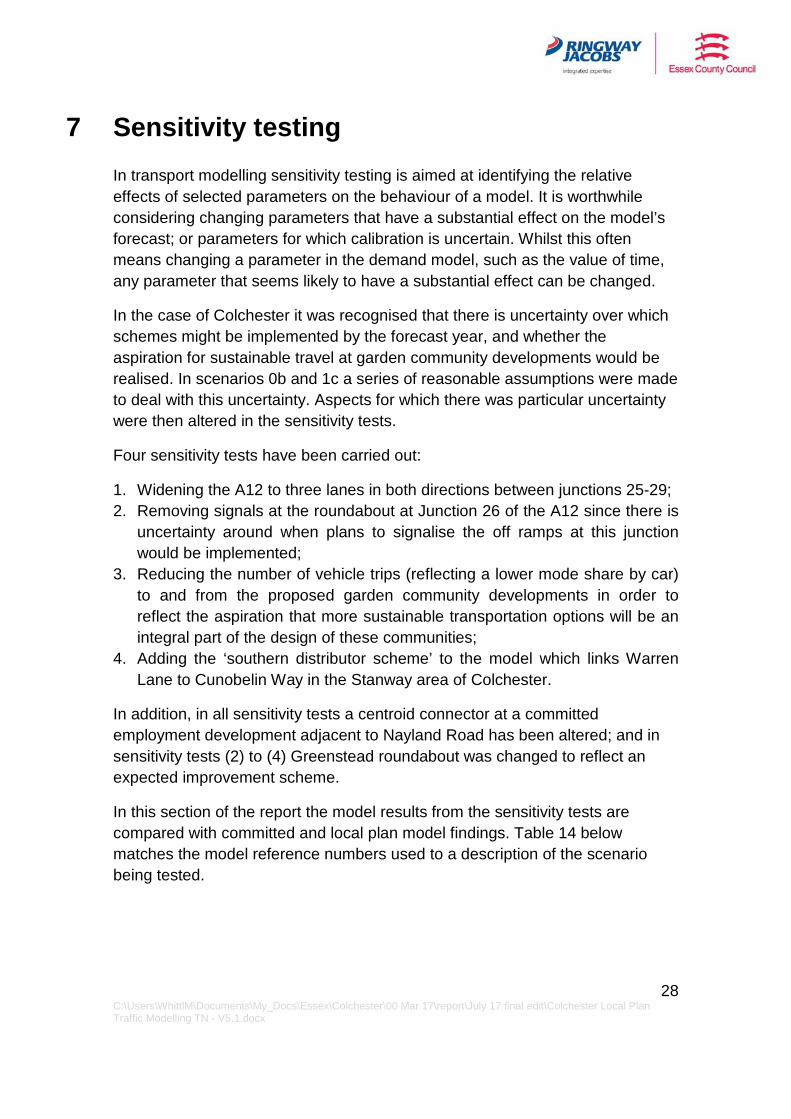
Figure 12 Overcapacity Junctions A120 West of Colchester - 1c Post-VDM PM
A list of overcapacity junctions (based on maximum v/c among all turns) in the committed scenario and the local plan development scenario is contained in Appendix B. In scenario 0b, using the maximum v/c indicator, 79 turning movements at junctions have been identified as operating in excess of capacity in the AM peak and 65 in the PM peak; while in scenario 1c there are 90 turning movements operating overcapacity in the AM peak and 73 in the PM peak.

27 C:\Users\WhittlM\Documents\My_Docs\Essex\Colchester\00 Mar 17\report\July 17 final edit\Colchester Local Plan Traffic Modelling TN - V5.1.docx
Of note are junctions along the A12 which suffer increased congestion in the local plan scenario. This is a result of the additional demand, and the new A120-A133 link road which facilitates trips onto the A12.
28 C:\Users\WhittlM\Documents\My_Docs\Essex\Colchester\00 Mar 17\report\July 17 final edit\Colchester Local Plan Traffic Modelling TN - V5.1.docx
7 Sensitivity testing In transport modelling sensitivity testing is aimed at identifying the relative effects of selected parameters on the behaviour of a model. It is worthwhile considering changing parameters that have a substantial effect on the model’s forecast; or parameters for which calibration is uncertain. Whilst this often means changing a parameter in the demand model, such as the value of time, any parameter that seems likely to have a substantial effect can be changed.
In the case of Colchester it was recognised that there is uncertainty over which schemes might be implemented by the forecast year, and whether the aspiration for sustainable travel at garden community developments would be realised. In scenarios 0b and 1c a series of reasonable assumptions were made to deal with this uncertainty. Aspects for which there was particular uncertainty were then altered in the sensitivity tests.
Four sensitivity tests have been carried out:
1. Widening the A12 to three lanes in both directions between junctions 25-29; 2. Removing signals at the roundabout at Junction 26 of the A12 since there is
uncertainty around when plans to signalise the off ramps at this junction would be implemented;
3. Reducing the number of vehicle trips (reflecting a lower mode share by car) to and from the proposed garden community developments in order to reflect the aspiration that more sustainable transportation options will be an integral part of the design of these communities;
4. Adding the ‘southern distributor scheme’ to the model which links Warren Lane to Cunobelin Way in the Stanway area of Colchester.
In addition, in all sensitivity tests a centroid connector at a committed employment development adjacent to Nayland Road has been altered; and in sensitivity tests (2) to (4) Greenstead roundabout was changed to reflect an expected improvement scheme.
In this section of the report the model results from the sensitivity tests are compared with committed and local plan model findings. Table 14 below matches the model reference numbers used to a description of the scenario being tested.
29 C:\Users\WhittlM\Documents\My_Docs\Essex\Colchester\00 Mar 17\report\July 17 final edit\Colchester Local Plan Traffic Modelling TN - V5.1.docx
Table 14 Summary of model scenarios for sensitivity testing
Scenario model reference Description
0b Committed growth 1c Local Plan growth 1d Sensitivity test – Local plan growth with A12 widening J25-29
1e Sensitivity test – Local plan growth without A12 J26 improvements but with Greenstead Roundabout improvements
1f Sensitivity test – Local plan growth with greater sustainable travel at Garden Community developments
1g Sensitivity test – Local plan growth with the southern distributor and with Greenstead Roundabout improvements
7.1 Widening A12 between J25 and 29 This sensitivity test explores if capacity and delay problems are sensitive to increasing the capacity on the A12 between junctions 25 and 29.
The network was altered in order that the A12 was modelled with three lanes in each direction between junctions 25 and 29 as indicated in RIS. In the base model it has two lanes in each direction.
In addition it had been noticed that centroid 518 in the model, which represents an employment development on a golf course site adjacent to Nayland Road in the committed development scenario, had been linked to the network with multiple connectors towards the southern end of Nayland Road. This was altered to a single connector positioned on Nayland Road just north of the Boxted Road junction, which is a more accurate reflection of how such a development would be accessed.
The model was run for both the committed and preferred option scenarios. These scenarios were named 0c and 1d, respectively. Scenario 1d was also run using the variable demand model.
This report compares the outputs of preferred option 1c (without A12 widening) with preferred option 1d (with A12 widening) using the variable demand model. Further outputs and analysis are available.
As might be expected the summary statistics shown in Table 14 show small but overall network improvements for most measures.
30 C:\Users\WhittlM\Documents\My_Docs\Essex\Colchester\00 Mar 17\report\July 17 final edit\Colchester Local Plan Traffic Modelling TN - V5.1.docx
Table 15 Summary statistics for final assignment scenarios 1c-1d
Attribute AM PM
1c 1d 1c 1d Transient queues (pcu.hrs) 2,347 2,324 2,348 2,322 Overcapacity queues (pcu.hrs) 6,450 6,356 5,156 5,035 Link cruise time (pcu.hrs) 15,833 15,806 15,683 15,460 Total travel time (pcu.hrs) 24,629 24,487 23,188 22,817 Travel distance (pcu.kms) 1,025,680 1,029,259 1,026,520 1,022,327 Average speed (kph) 42 42 44 45 Total trips loaded (pcus) 55,988 56,044 52,469 52,189
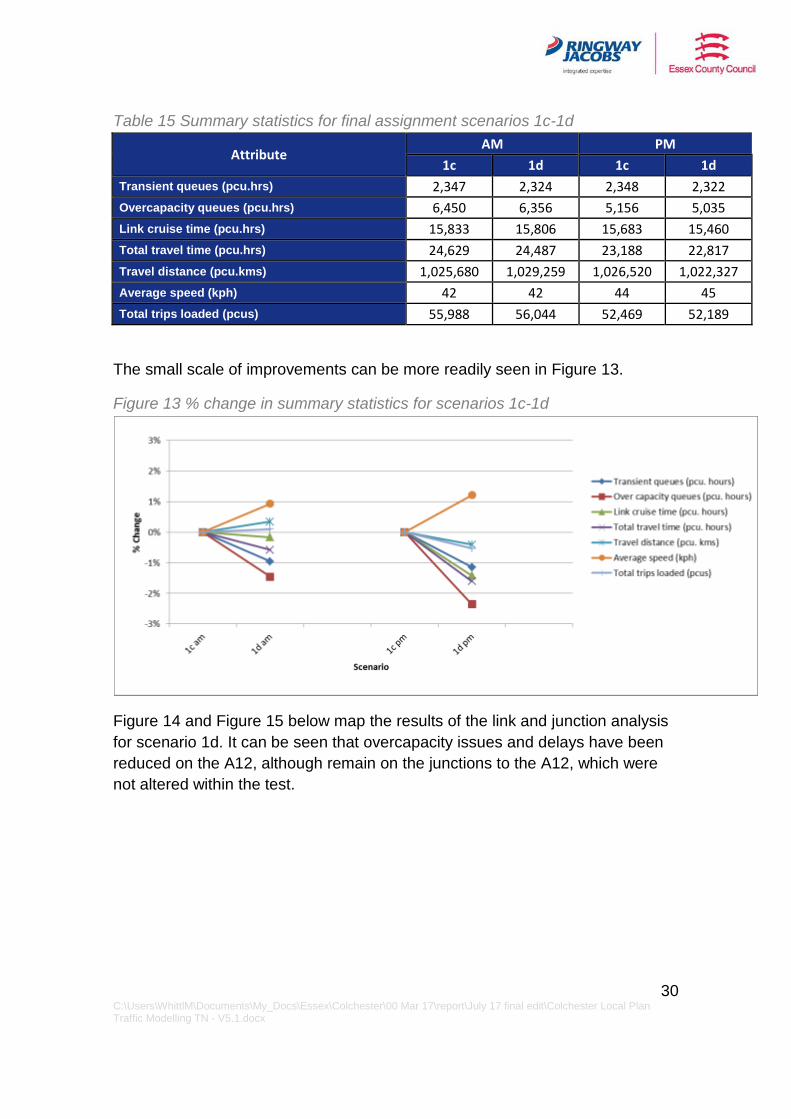
The small scale of improvements can be more readily seen in Figure 13.
Figure 13 % change in summary statistics for scenarios 1c-1d
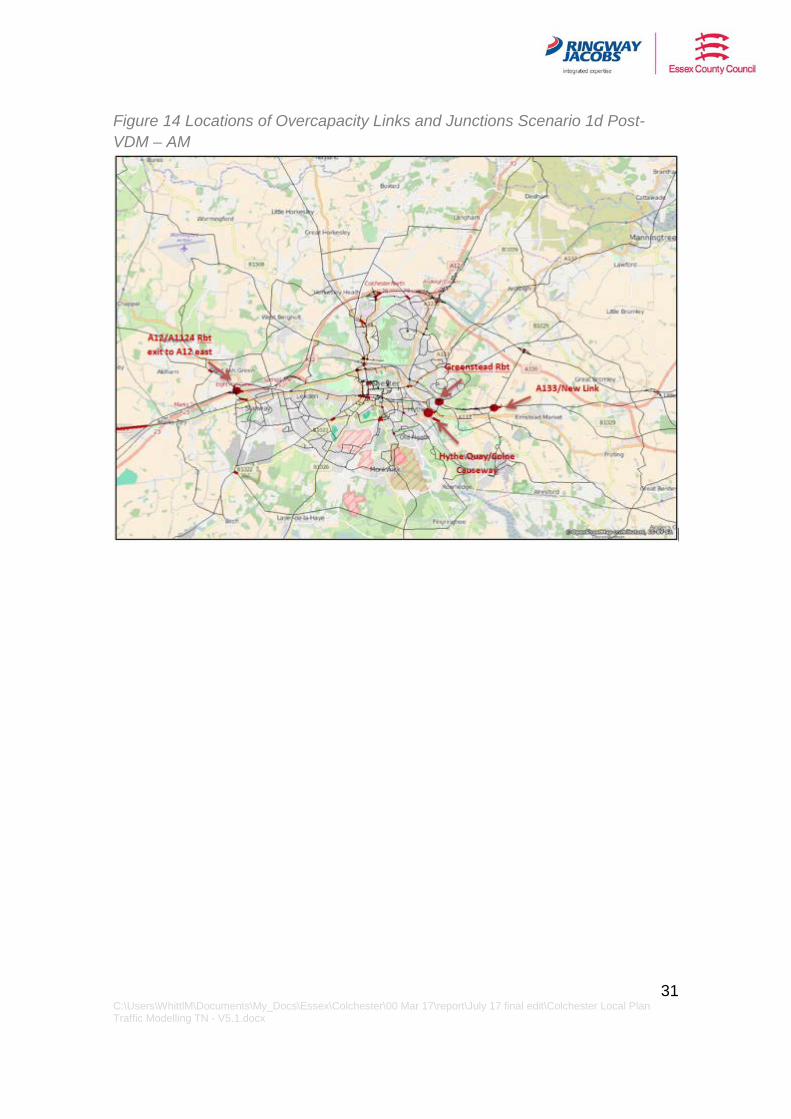
Figure 14 and Figure 15 below map the results of the link and junction analysis for scenario 1d. It can be seen that overcapacity issues and delays have been reduced on the A12, although remain on the junctions to the A12, which were not altered within the test.
31 C:\Users\WhittlM\Documents\My_Docs\Essex\Colchester\00 Mar 17\report\July 17 final edit\Colchester Local Plan Traffic Modelling TN - V5.1.docx
Figure 14 Locations of Overcapacity Links and Junctions Scenario 1d Post-VDM – AM
32 C:\Users\WhittlM\Documents\My_Docs\Essex\Colchester\00 Mar 17\report\July 17 final edit\Colchester Local Plan Traffic Modelling TN - V5.1.docx
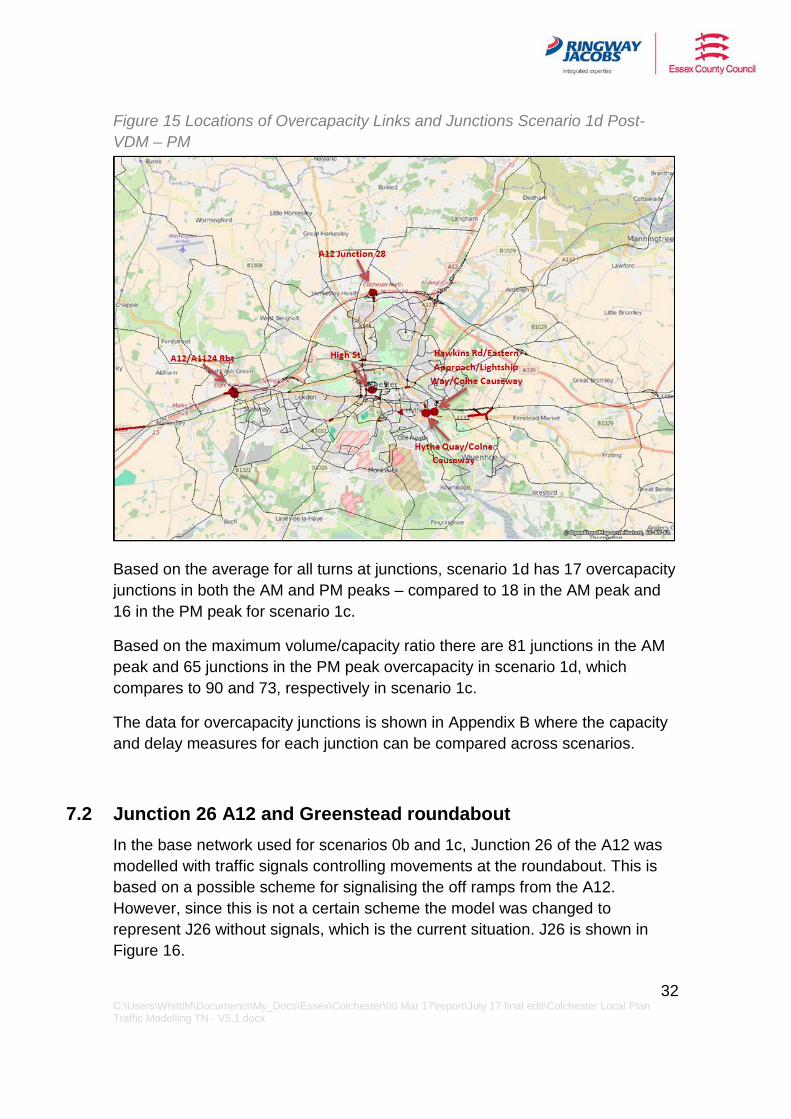
Figure 15 Locations of Overcapacity Links and Junctions Scenario 1d Post-VDM – PM
Based on the average for all turns at junctions, scenario 1d has 17 overcapacity junctions in both the AM and PM peaks – compared to 18 in the AM peak and 16 in the PM peak for scenario 1c.
Based on the maximum volume/capacity ratio there are 81 junctions in the AM peak and 65 junctions in the PM peak overcapacity in scenario 1d, which compares to 90 and 73, respectively in scenario 1c.
The data for overcapacity junctions is shown in Appendix B where the capacity and delay measures for each junction can be compared across scenarios.
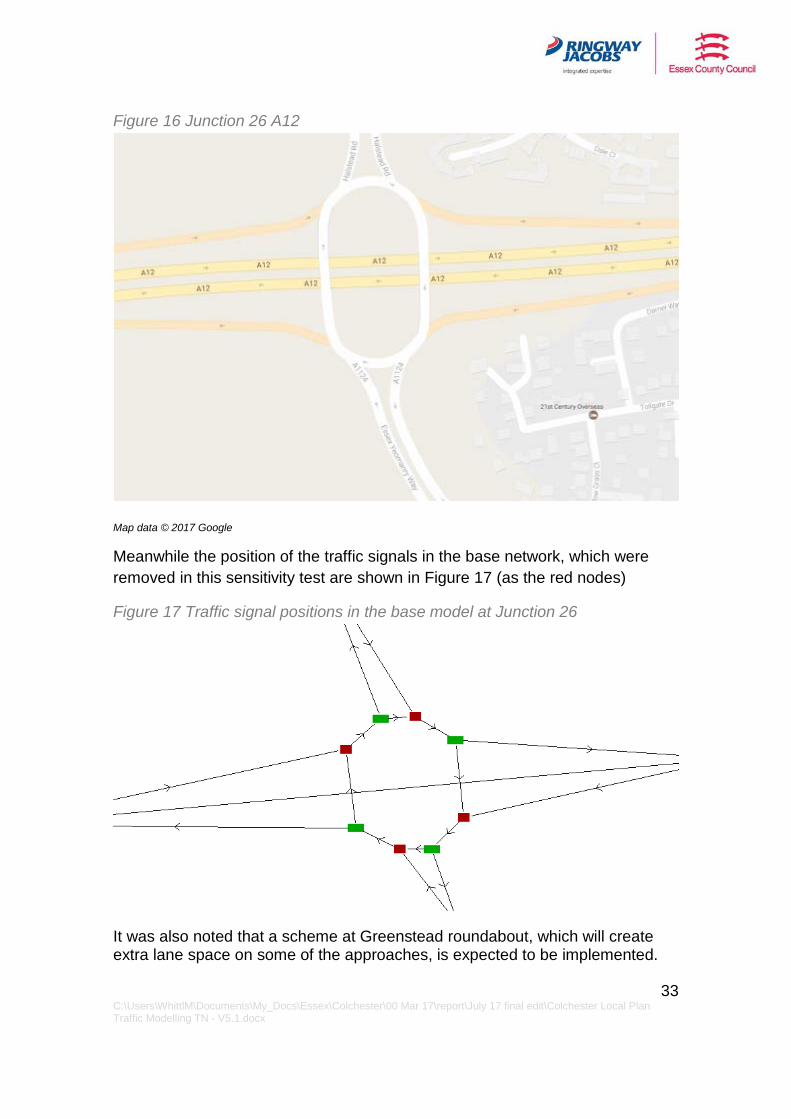
7.2 Junction 26 A12 and Greenstead roundabout In the base network used for scenarios 0b and 1c, Junction 26 of the A12 was modelled with traffic signals controlling movements at the roundabout. This is based on a possible scheme for signalising the off ramps from the A12. However, since this is not a certain scheme the model was changed to represent J26 without signals, which is the current situation. J26 is shown in Figure 16.
33 C:\Users\WhittlM\Documents\My_Docs\Essex\Colchester\00 Mar 17\report\July 17 final edit\Colchester Local Plan Traffic Modelling TN - V5.1.docx
Figure 16 Junction 26 A12
Map data © 2017 Google
Meanwhile the position of the traffic signals in the base network, which were removed in this sensitivity test are shown in Figure 17 (as the red nodes)
Figure 17 Traffic signal positions in the base model at Junction 26
It was also noted that a scheme at Greenstead roundabout, which will create extra lane space on some of the approaches, is expected to be implemented.
34 C:\Users\WhittlM\Documents\My_Docs\Essex\Colchester\00 Mar 17\report\July 17 final edit\Colchester Local Plan Traffic Modelling TN - V5.1.docx
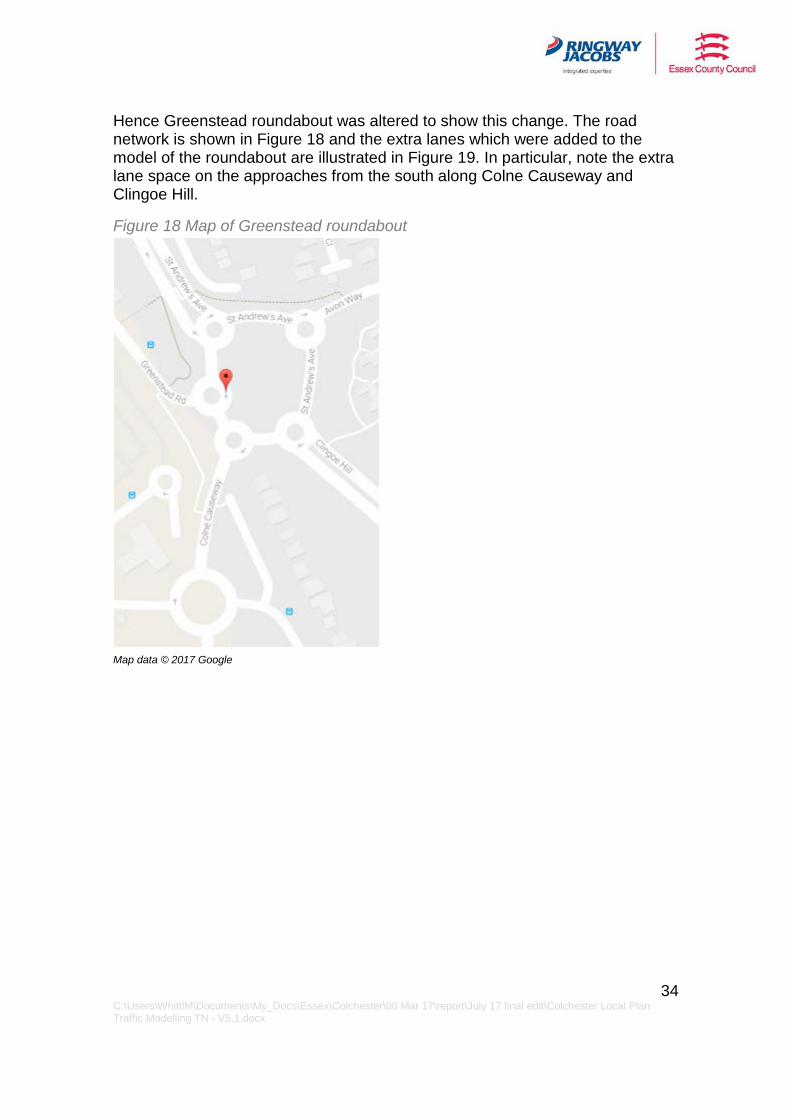
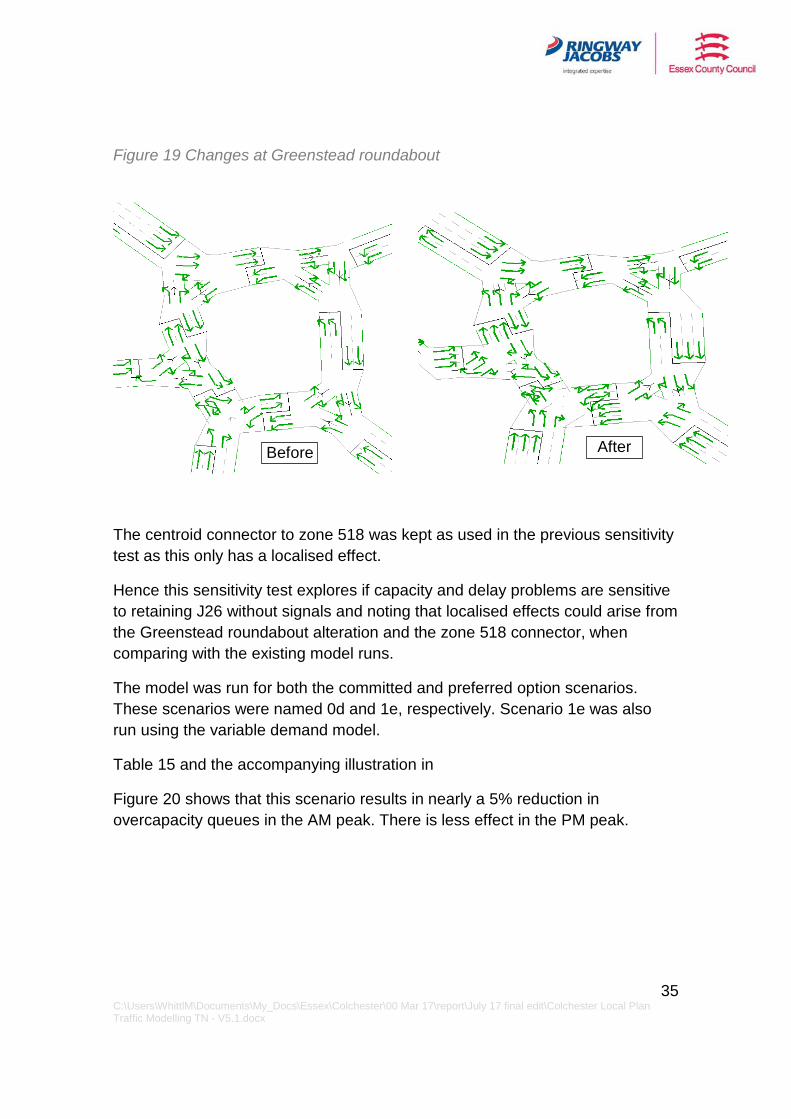
Hence Greenstead roundabout was altered to show this change. The road network is shown in Figure 18 and the extra lanes which were added to the model of the roundabout are illustrated in Figure 19. In particular, note the extra lane space on the approaches from the south along Colne Causeway and Clingoe Hill.
Figure 18 Map of Greenstead roundabout
Map data © 2017 Google
35 C:\Users\WhittlM\Documents\My_Docs\Essex\Colchester\00 Mar 17\report\July 17 final edit\Colchester Local Plan Traffic Modelling TN - V5.1.docx
Figure 19 Changes at Greenstead roundabout
The centroid connector to zone 518 was kept as used in the previous sensitivity test as this only has a localised effect.
Hence this sensitivity test explores if capacity and delay problems are sensitive to retaining J26 without signals and noting that localised effects could arise from the Greenstead roundabout alteration and the zone 518 connector, when comparing with the existing model runs.
The model was run for both the committed and preferred option scenarios. These scenarios were named 0d and 1e, respectively. Scenario 1e was also run using the variable demand model.
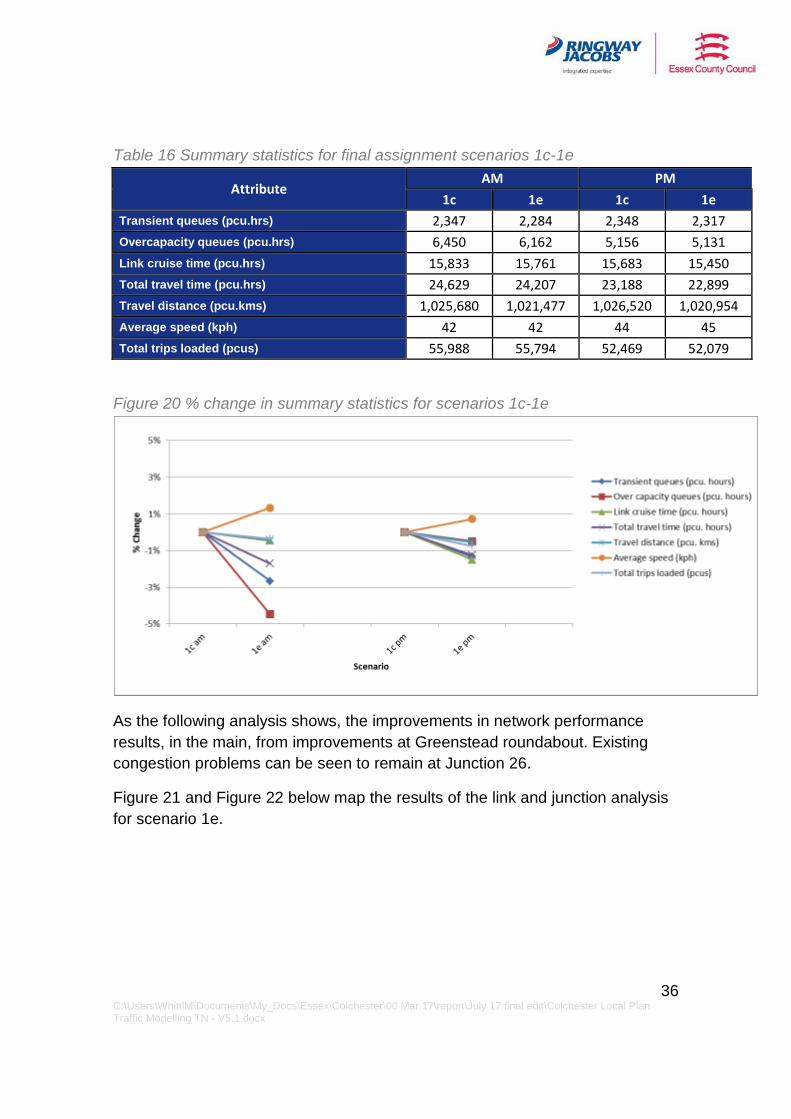
Table 15 and the accompanying illustration in
Figure 20 shows that this scenario results in nearly a 5% reduction in overcapacity queues in the AM peak. There is less effect in the PM peak.
After Before
36 C:\Users\WhittlM\Documents\My_Docs\Essex\Colchester\00 Mar 17\report\July 17 final edit\Colchester Local Plan Traffic Modelling TN - V5.1.docx
Table 16 Summary statistics for final assignment scenarios 1c-1e
Attribute AM PM
1c 1e 1c 1e Transient queues (pcu.hrs) 2,347 2,284 2,348 2,317 Overcapacity queues (pcu.hrs) 6,450 6,162 5,156 5,131 Link cruise time (pcu.hrs) 15,833 15,761 15,683 15,450 Total travel time (pcu.hrs) 24,629 24,207 23,188 22,899 Travel distance (pcu.kms) 1,025,680 1,021,477 1,026,520 1,020,954 Average speed (kph) 42 42 44 45 Total trips loaded (pcus) 55,988 55,794 52,469 52,079
Figure 20 % change in summary statistics for scenarios 1c-1e
As the following analysis shows, the improvements in network performance results, in the main, from improvements at Greenstead roundabout. Existing congestion problems can be seen to remain at Junction 26.
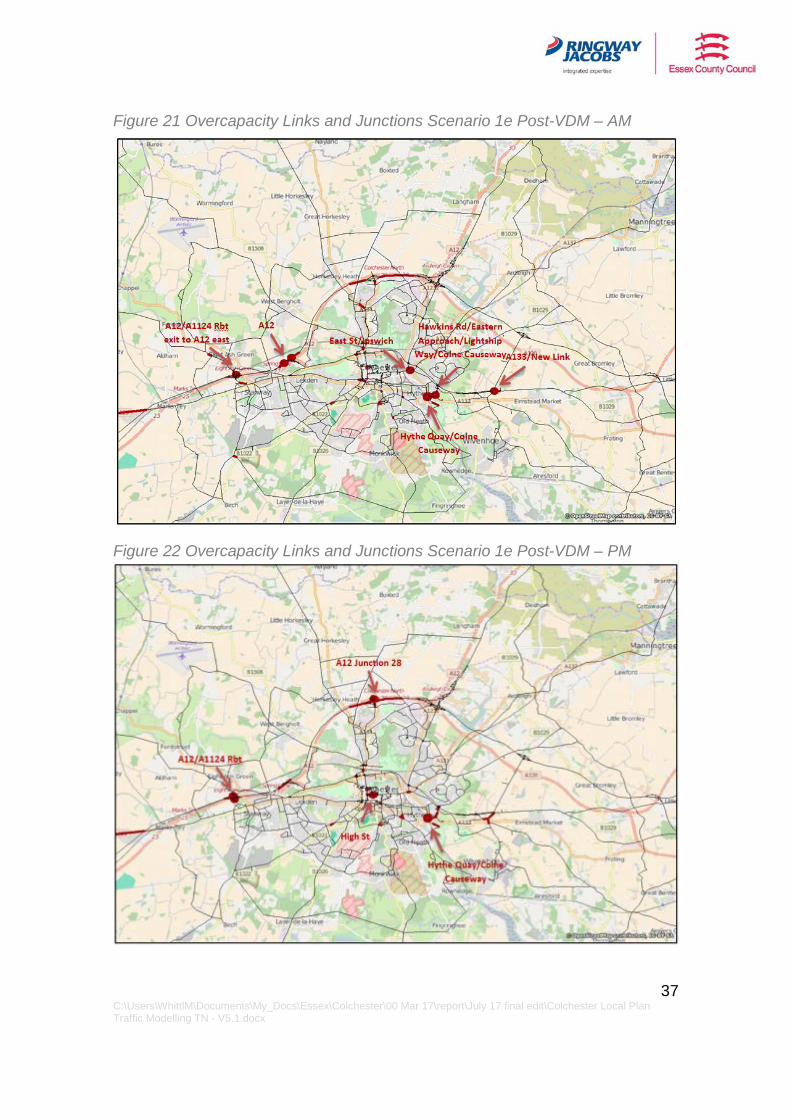
Figure 21 and Figure 22 below map the results of the link and junction analysis for scenario 1e.
37 C:\Users\WhittlM\Documents\My_Docs\Essex\Colchester\00 Mar 17\report\July 17 final edit\Colchester Local Plan Traffic Modelling TN - V5.1.docx
Figure 21 Overcapacity Links and Junctions Scenario 1e Post-VDM – AM
Figure 22 Overcapacity Links and Junctions Scenario 1e Post-VDM – PM
38 C:\Users\WhittlM\Documents\My_Docs\Essex\Colchester\00 Mar 17\report\July 17 final edit\Colchester Local Plan Traffic Modelling TN - V5.1.docx
Based on the average for all turns at junctions, scenario 1e has 18 junctions in the AM peak and 17 junctions in the PM peak which are overcapacity – compared to 18 in the AM peak and 16 in the PM peak for scenario 1c.
Based on the maximum volume/capacity ratio there are 79 junctions in the AM peak and 74 junctions in the PM peak overcapacity in scenario 1e, which compares to 90 and 73, respectively in scenario 1c.
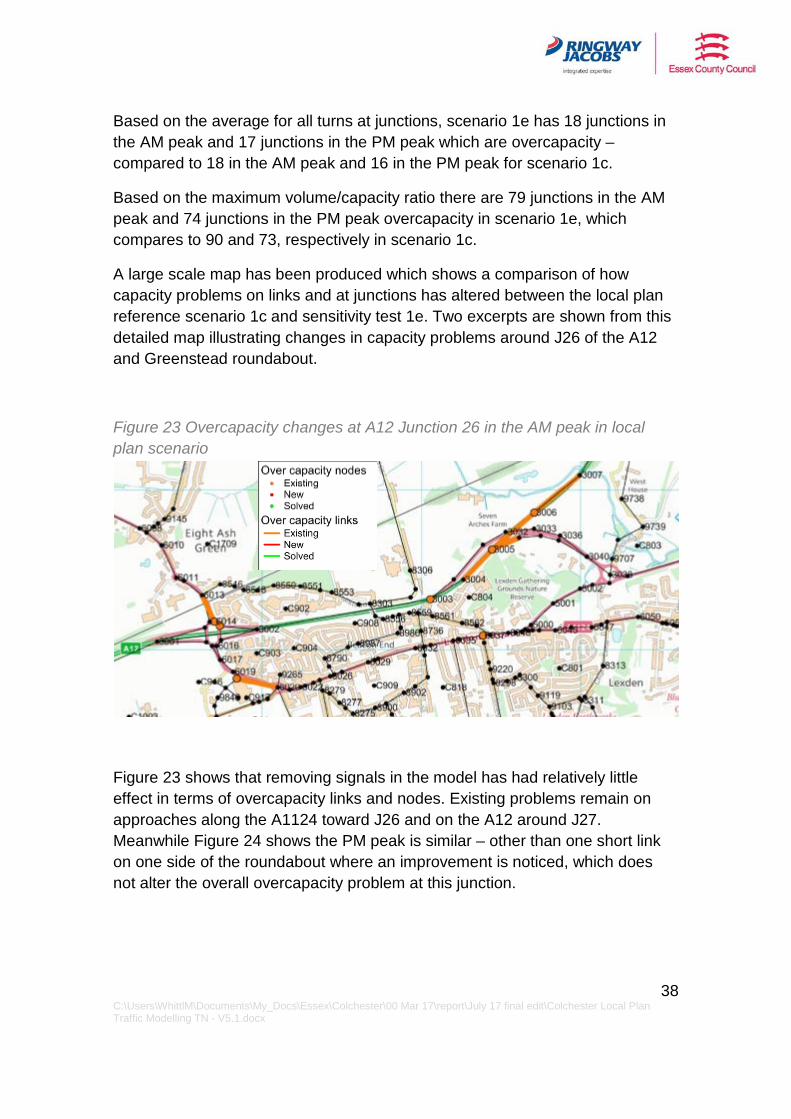
A large scale map has been produced which shows a comparison of how capacity problems on links and at junctions has altered between the local plan reference scenario 1c and sensitivity test 1e. Two excerpts are shown from this detailed map illustrating changes in capacity problems around J26 of the A12 and Greenstead roundabout.
Figure 23 Overcapacity changes at A12 Junction 26 in the AM peak in local plan scenario
Figure 23 shows that removing signals in the model has had relatively little effect in terms of overcapacity links and nodes. Existing problems remain on approaches along the A1124 toward J26 and on the A12 around J27. Meanwhile Figure 24 shows the PM peak is similar – other than one short link on one side of the roundabout where an improvement is noticed, which does not alter the overall overcapacity problem at this junction.
39 C:\Users\WhittlM\Documents\My_Docs\Essex\Colchester\00 Mar 17\report\July 17 final edit\Colchester Local Plan Traffic Modelling TN - V5.1.docx
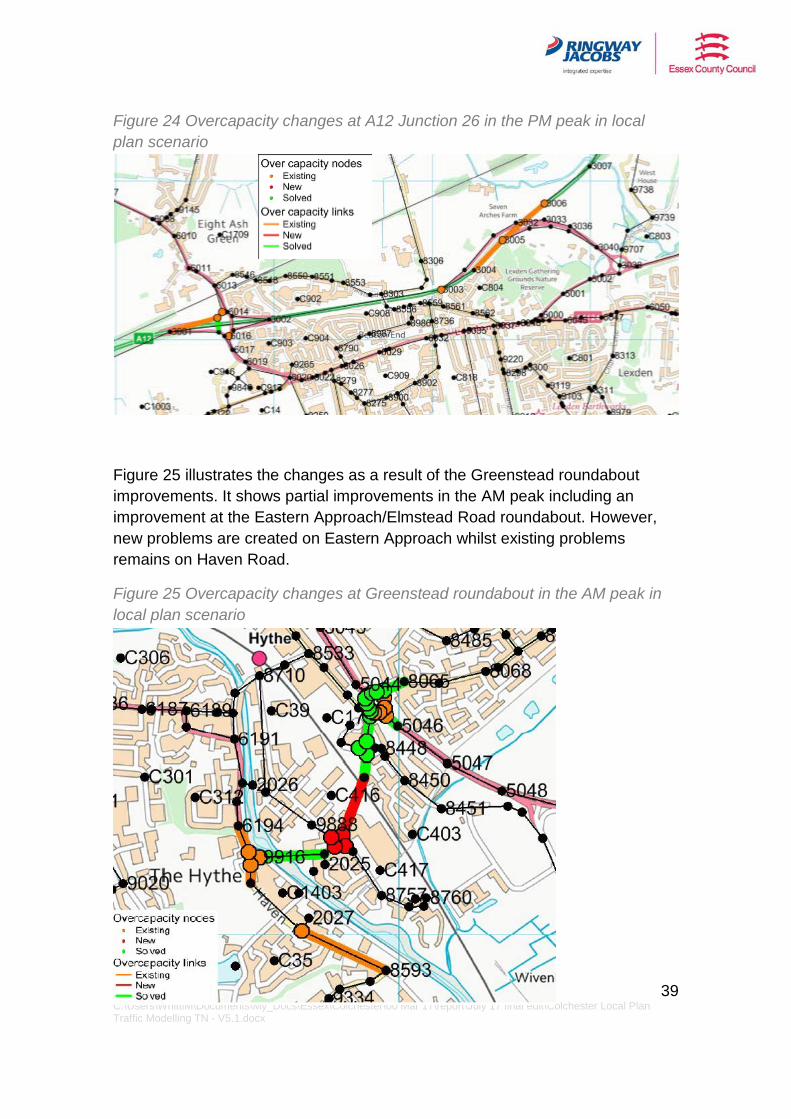
Figure 24 Overcapacity changes at A12 Junction 26 in the PM peak in local plan scenario
Figure 25 illustrates the changes as a result of the Greenstead roundabout improvements. It shows partial improvements in the AM peak including an improvement at the Eastern Approach/Elmstead Road roundabout. However, new problems are created on Eastern Approach whilst existing problems remains on Haven Road.
Figure 25 Overcapacity changes at Greenstead roundabout in the AM peak in local plan scenario
40 C:\Users\WhittlM\Documents\My_Docs\Essex\Colchester\00 Mar 17\report\July 17 final edit\Colchester Local Plan Traffic Modelling TN - V5.1.docx
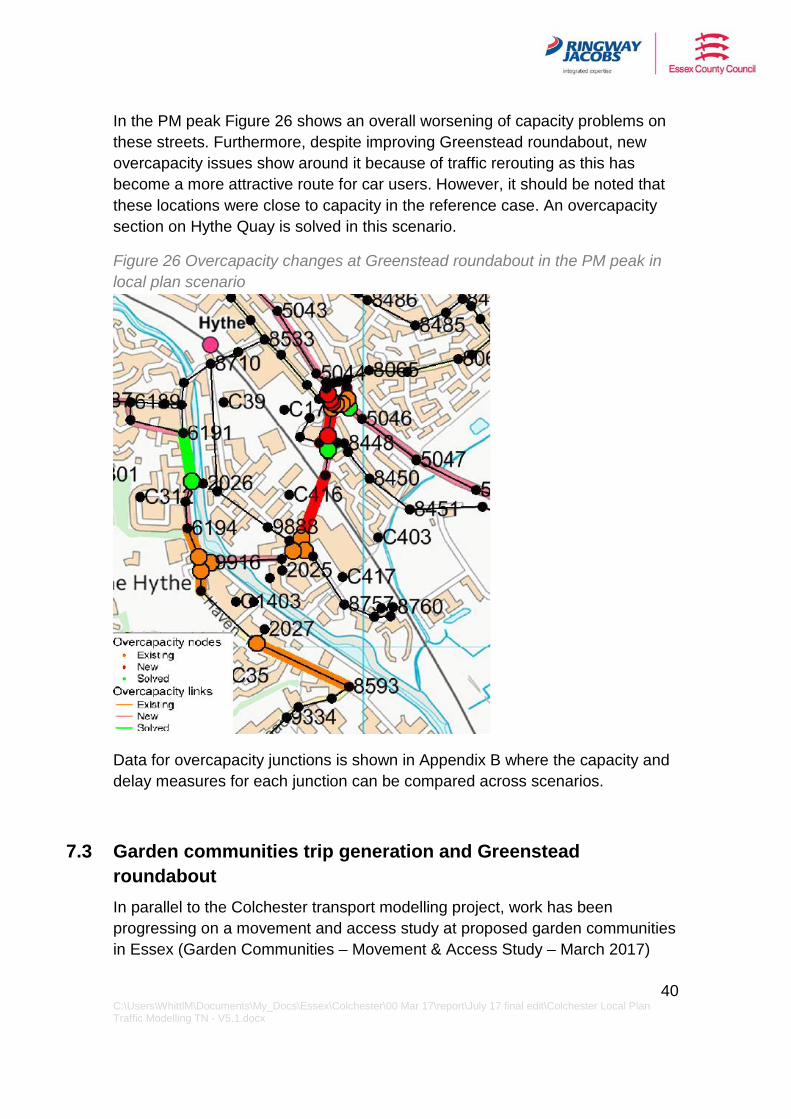
In the PM peak Figure 26 shows an overall worsening of capacity problems on these streets. Furthermore, despite improving Greenstead roundabout, new overcapacity issues show around it because of traffic rerouting as this has become a more attractive route for car users. However, it should be noted that these locations were close to capacity in the reference case. An overcapacity section on Hythe Quay is solved in this scenario.
Figure 26 Overcapacity changes at Greenstead roundabout in the PM peak in local plan scenario
Data for overcapacity junctions is shown in Appendix B where the capacity and delay measures for each junction can be compared across scenarios.
7.3 Garden communities trip generation and Greenstead roundabout In parallel to the Colchester transport modelling project, work has been progressing on a movement and access study at proposed garden communities in Essex (Garden Communities – Movement & Access Study – March 2017)
41 C:\Users\WhittlM\Documents\My_Docs\Essex\Colchester\00 Mar 17\report\July 17 final edit\Colchester Local Plan Traffic Modelling TN - V5.1.docx
Following the recommendation of this study, car trips to and from these developments have been reduced by approximately one half in the model. This reduction is based on an ambitious target to achieve a modal split of: 40% Active, 30% Public Transport and 30% Car. The garden communities study has developed a simple transport demand tool for each of the developments, which provides trip ends to use in transport models, based on different modal splits being achieved.
Based on achieving the ambitious 40/30/30 mode split the demand tool was used to provide trip ends for arrivals and departures at two garden community developments called Colchester Braintree Borders Garden Settlement and Colchester Tendring Borders Garden Settlement. The trip end data applies only to home-based and employment trips since the retail on these development sites is assumed to be local and hence attracting only intra-zonal trips.
The trip matrix in the Colchester transport model was altered to match the trip ends provided by the garden communities demand model. This reduces car trips to and from these developments by approximately half. The centroid connector to zone 518 described in Section 6.1 and the improvement to Greenstead roundabout described in Section 6.2 were both retained.
Accordingly this sensitivity test explores if capacity and delay problems are sensitive to greater modal split away from cars at the proposed garden community developments. When making comparison with scenarios 0b and 1c it should be noted that localised effects could result from the Greenstead roundabout alteration and the zone 518 connector change described in Section 7.2.
The model was run for both the committed and preferred option scenarios. Although the garden communities are not in the committed scenario this enabled the model to be run with the changes to Greenstead roundabout included. These scenarios were named 0e and 1f, respectively. Scenario 1f was also run using the variable demand model.
Table 16 and the accompanying illustration in Figure 27 show that there is a noticeable improvement of approximately 7% in the measure for overcapacity queues across the network in the AM peak, alongside a slight improvement in average speed. Similar but not as pronounced patterns of change in network performance are observed in the PM peak.

42 C:\Users\WhittlM\Documents\My_Docs\Essex\Colchester\00 Mar 17\report\July 17 final edit\Colchester Local Plan Traffic Modelling TN - V5.1.docx
Table 17 Summary statistics for final assignment scenarios 1c-1f
Attribute AM PM
1c 1f 1c 1f Transient queues (pcu.hrs) 2,347 2,280 2,348 2,316 Over capacity queues (pcu.hrs) 6,450 5,985 5,156 5,039 Link cruise time (pcu.hrs) 15,833 15,588 15,683 15,243 Total travel time (pcu.hrs) 24,629 23,853 23,188 22,598 Travel distance (pcu.kms) 1,025,680 1,014,620 1,026,520 1,011,154 Average speed (kph) 42 43 44 45 Total trips loaded (pcus) 55,988 55,152 52,469 51,392
Figure 27 % change in summary statistics for scenarios 1c-1f
43 C:\Users\WhittlM\Documents\My_Docs\Essex\Colchester\00 Mar 17\report\July 17 final edit\Colchester Local Plan Traffic Modelling TN - V5.1.docx
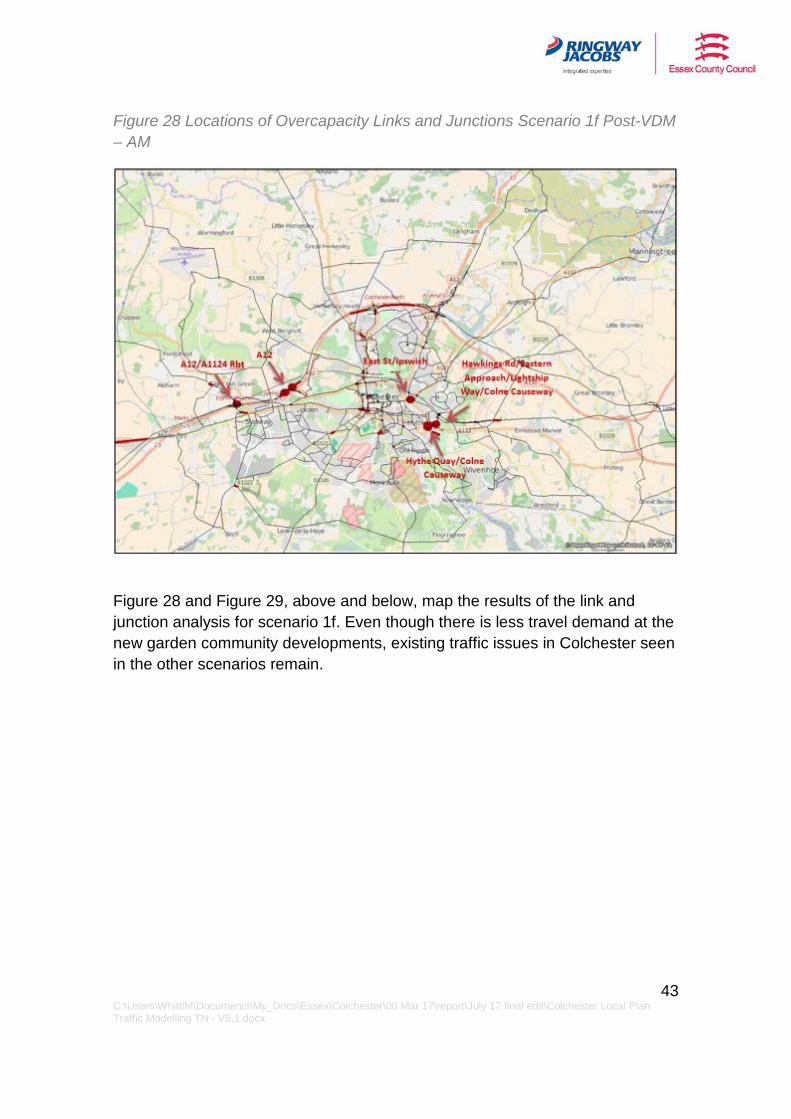
Figure 28 Locations of Overcapacity Links and Junctions Scenario 1f Post-VDM – AM
Figure 28 and Figure 29, above and below, map the results of the link and junction analysis for scenario 1f. Even though there is less travel demand at the new garden community developments, existing traffic issues in Colchester seen in the other scenarios remain.
44 C:\Users\WhittlM\Documents\My_Docs\Essex\Colchester\00 Mar 17\report\July 17 final edit\Colchester Local Plan Traffic Modelling TN - V5.1.docx
Figure 29 Locations of Overcapacity Links and Junctions Scenario 1f Post-VDM – PM
Based on the average for all turns at junctions, scenario 1f has 17 junctions in the AM peak and 16 junctions in the PM peak which are overcapacity – compared to 18 in the AM peak and 16 in the PM peak for scenario 1c.
Based on the maximum volume/capacity ratio there are 78 junctions in the AM peak and 74 junctions in the PM peak overcapacity in scenario 1f, which compares to 90 and 73, respectively in scenario 1c.
The data for overcapacity junctions is shown in Appendix B where the capacity and delay measures for each junction can be compared across scenarios.
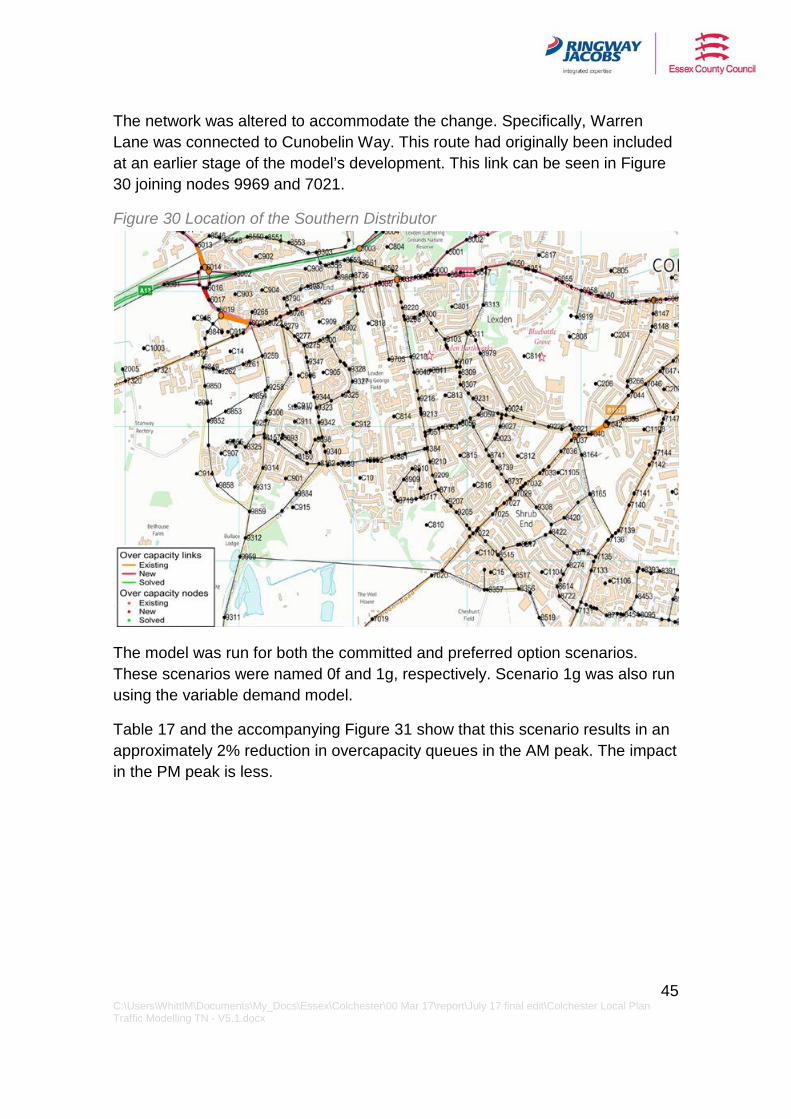
7.4 Southern distributor and Greenstead roundabout This sensitivity test includes three changes compared to scenario 1c. The first two have been already explained in the Section 7.2 and refer to the centroid connector to zone 518 and to the alterations in the Greenstead Roundabout. The third difference was the addition of a new southern distributor link.
45 C:\Users\WhittlM\Documents\My_Docs\Essex\Colchester\00 Mar 17\report\July 17 final edit\Colchester Local Plan Traffic Modelling TN - V5.1.docx
The network was altered to accommodate the change. Specifically, Warren Lane was connected to Cunobelin Way. This route had originally been included at an earlier stage of the model’s development. This link can be seen in Figure 30 joining nodes 9969 and 7021.
Figure 30 Location of the Southern Distributor
The model was run for both the committed and preferred option scenarios. These scenarios were named 0f and 1g, respectively. Scenario 1g was also run using the variable demand model.
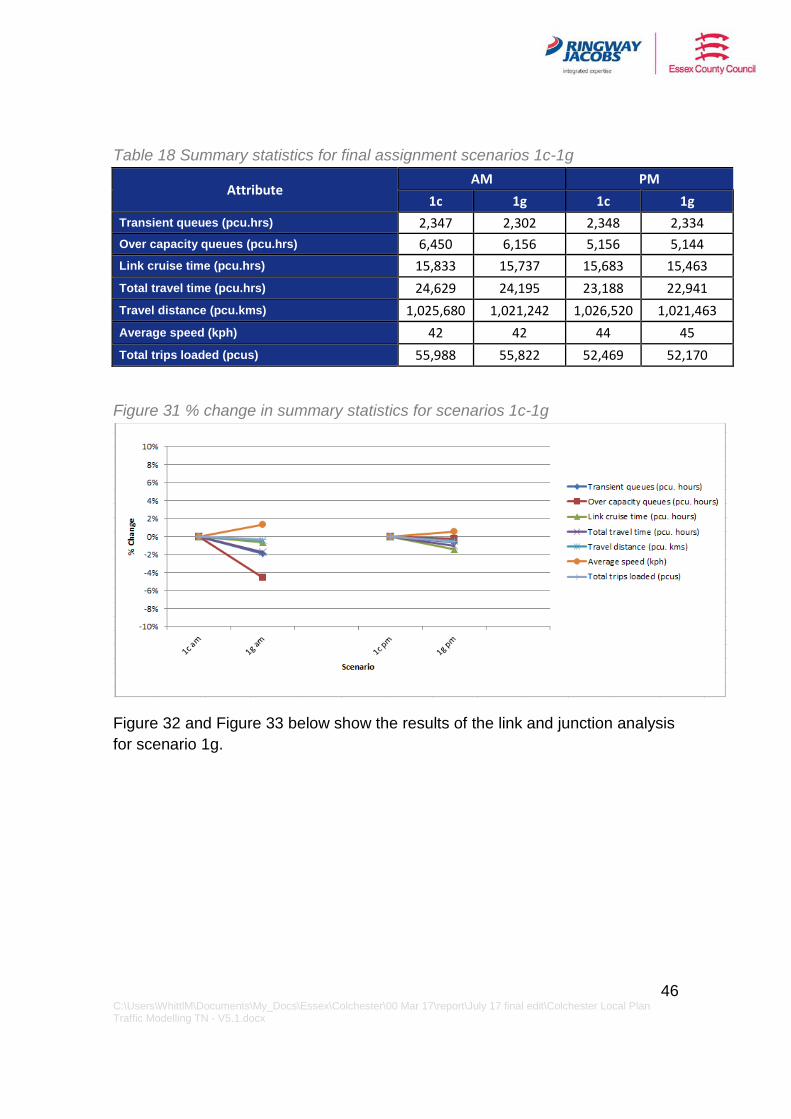
Table 17 and the accompanying Figure 31 show that this scenario results in an approximately 2% reduction in overcapacity queues in the AM peak. The impact in the PM peak is less.
46 C:\Users\WhittlM\Documents\My_Docs\Essex\Colchester\00 Mar 17\report\July 17 final edit\Colchester Local Plan Traffic Modelling TN - V5.1.docx
Table 18 Summary statistics for final assignment scenarios 1c-1g
Attribute AM PM
1c 1g 1c 1g Transient queues (pcu.hrs) 2,347 2,302 2,348 2,334 Over capacity queues (pcu.hrs) 6,450 6,156 5,156 5,144 Link cruise time (pcu.hrs) 15,833 15,737 15,683 15,463 Total travel time (pcu.hrs) 24,629 24,195 23,188 22,941 Travel distance (pcu.kms) 1,025,680 1,021,242 1,026,520 1,021,463 Average speed (kph) 42 42 44 45 Total trips loaded (pcus) 55,988 55,822 52,469 52,170
Figure 31 % change in summary statistics for scenarios 1c-1g
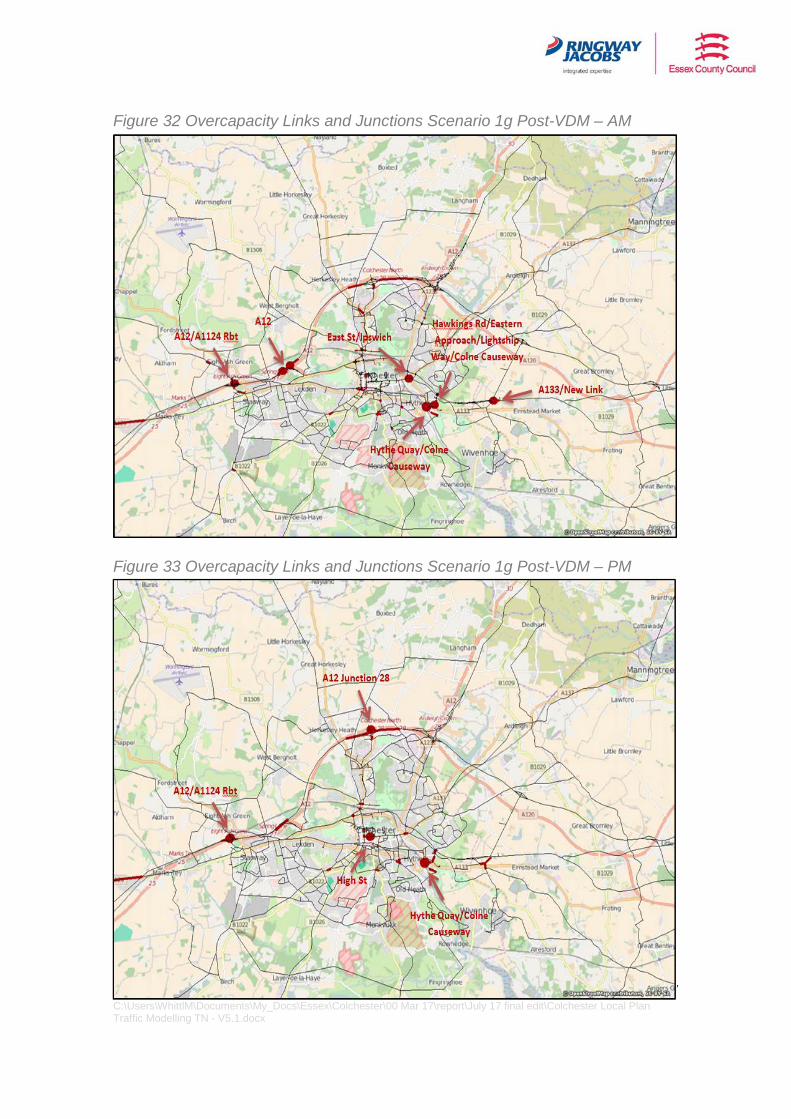
Figure 32 and Figure 33 below show the results of the link and junction analysis for scenario 1g.
47 C:\Users\WhittlM\Documents\My_Docs\Essex\Colchester\00 Mar 17\report\July 17 final edit\Colchester Local Plan Traffic Modelling TN - V5.1.docx
Figure 32 Overcapacity Links and Junctions Scenario 1g Post-VDM – AM
Figure 33 Overcapacity Links and Junctions Scenario 1g Post-VDM – PM

48 C:\Users\WhittlM\Documents\My_Docs\Essex\Colchester\00 Mar 17\report\July 17 final edit\Colchester Local Plan Traffic Modelling TN - V5.1.docx
Based on the average for all turns at junctions, scenario 1g has 18 junctions in the AM peak and 17 in the PM peak which are overcapacity compared to 18 in the AM peak and 16 in the PM peak of scenario 1c.
Based on the maximum volume/capacity ratio there are 78 junctions in the AM peak and 74 junctions in the PM peak overcapacity in scenario 1g, compared to 90 and 73, respectively in scenario 1c.
More information about the overcapacity junctions is included in Appendix B where capacity measures for each junction can be compared across scenarios.
49 C:\Users\WhittlM\Documents\My_Docs\Essex\Colchester\00 Mar 17\report\July 17 final edit\Colchester Local Plan Traffic Modelling TN - V5.1.docx
8 Mitigation Measures In Chapters 5 and 6 numerous links and junctions have been identified that have over-capacity issues during peak times in either or both the committed and local plan scenarios; and links and junctions which are susceptible to becoming overcapacity should changes to the network be made. In order to respond to forecast changes at these locations and routes a series of potential mitigation measures have been developed. The locations identified are based on analysing an AM and PM peak weekday traffic model. It is recognised that there are traffic congestion and impacts at other times and locations, for example on Saturday mornings, which should also be considered as part of any transport statement or assessment.
The proposals for mitigation measures link to relevant previous and current studies in the Colchester area; and show how this modelling study reflects and is consistent with other work. While the options presented have not been fully assessed for feasibility as part of this study they, nevertheless, reflect a realistic approach to mitigation – being carefully grounded in evidence and past experience.
Should any of the options be taken forward, further feasibility studies would be required, for which the best starting point would be one of the previous or current scheme studies, where they exist, which have been referenced. Potential measures need to be further tested against policy, deliverability, viability and timing – especially in relation to the timing of the delivery of any developments.
Four locations have been identified in the model’s forecasts based on analysis of overcapacity links and junctions. These are:
• A12 corridor; • East Colchester A134/A133 corridor; • South and West Colchester A134 and A1124 corridor; • Other locations including Colne Bank/Cymbeline Way, Harwich Road/East
Street, Circular Road South, Shrub End Road/Maldon Road, Old Heath Road/Wimpole Road, Brook Street, Mersea Road/Normandy Avenue junction and junctions on the proposed new A120/A133 link road in East Colchester.
For each of the junctions and links in these groups of locations, a series of suggestions for mitigation measures have been developed which include:
50 C:\Users\WhittlM\Documents\My_Docs\Essex\Colchester\00 Mar 17\report\July 17 final edit\Colchester Local Plan Traffic Modelling TN - V5.1.docx
• Basic traffic management – such as signing and lining, part signalisation, changing kerb lines to increase stop line capacity and turning restrictions;
• Enhanced traffic management – such as upgrades to and investment in signal control systems especially when there are junctions in close proximity;
• Minor infrastructure upgrades – such as widening of approaches to increase lane capacity and left turn slips at junctions (which takes place within the designated highway boundary);
• Major infrastructure upgrades – such as major reconstruction to add capacity (which requires land outside the designated highway boundary and involves complex engineering);
• Complementary measures – which includes sustainable transportation improvements to public transport, walking and cycling, and park and ride.
For each measure a qualitative assessment of why it could be worth considering has been given along with an indicative cost range. In addition, reference to previous and current studies that might also be considering that measure has been provided.
It should be noted that in practice a package of measures would be chosen from the range of those presented, which would include combinations of traffic management, infrastructure and sustainable transport measures. In addition, improvements would be considered along routes and not as isolated junction schemes. Development will still need to produce Transport Statements or Assessments in line with national and local guidance. This local plan modelling work will help inform the scope of such transport statements and assessments.
A full list of these measures is provided in Appendix C.

51 C:\Users\WhittlM\Documents\My_Docs\Essex\Colchester\00 Mar 17\report\July 17 final edit\Colchester Local Plan Traffic Modelling TN - V5.1.docx
Appendices
52 C:\Users\WhittlM\Documents\My_Docs\Essex\Colchester\00 Mar 17\report\July 17 final edit\Colchester Local Plan Traffic Modelling TN - V5.1.docx
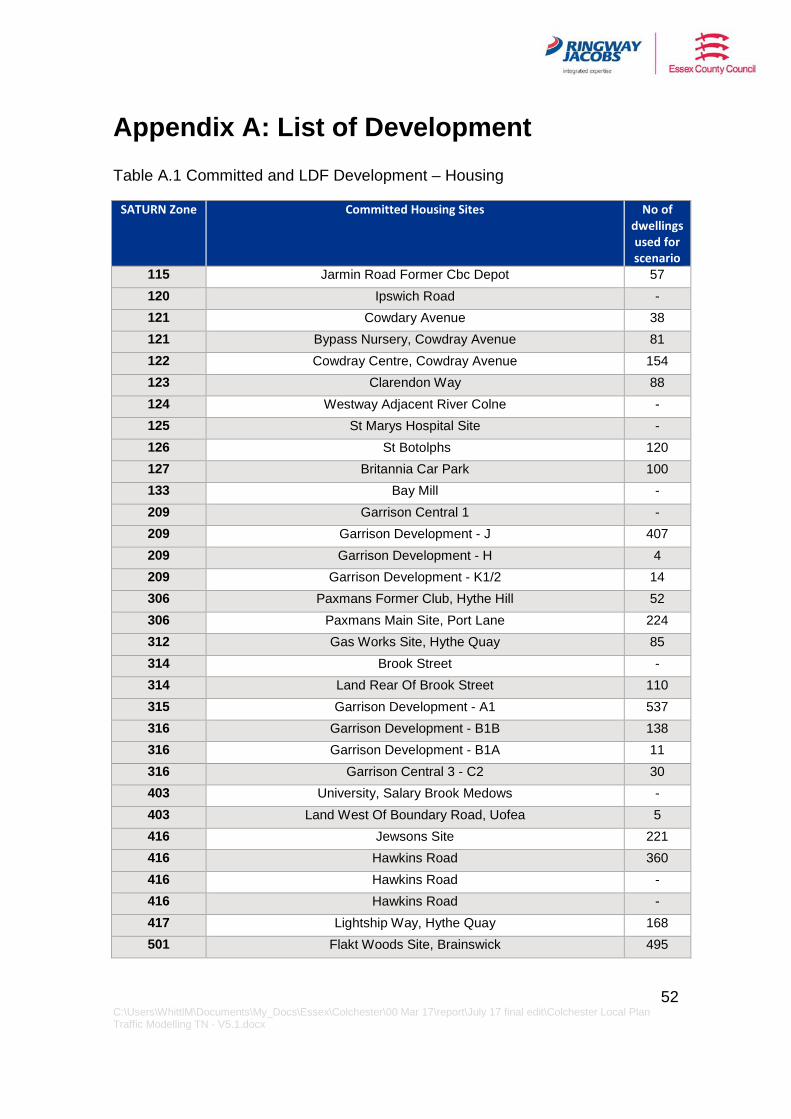
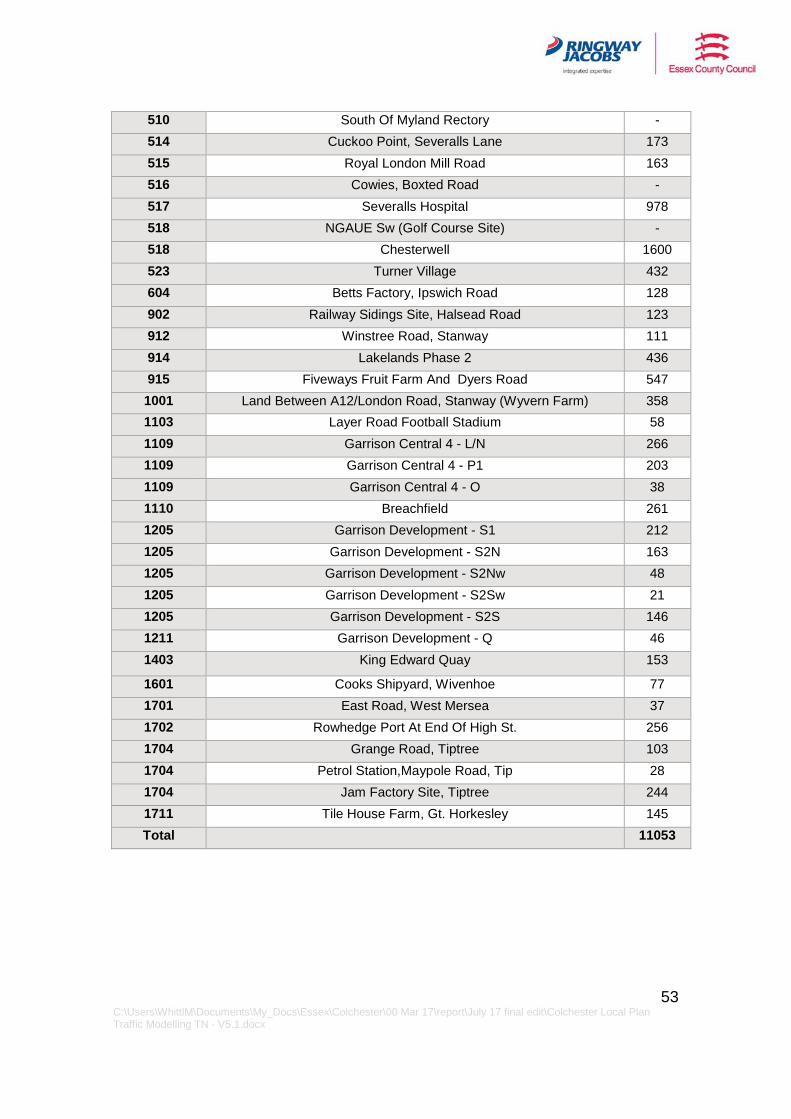
Appendix A: List of Development Table A.1 Committed and LDF Development – Housing
SATURN Zone Committed Housing Sites No of dwellings used for scenario
115 Jarmin Road Former Cbc Depot 57 120 Ipswich Road - 121 Cowdary Avenue 38 121 Bypass Nursery, Cowdray Avenue 81 122 Cowdray Centre, Cowdray Avenue 154 123 Clarendon Way 88 124 Westway Adjacent River Colne - 125 St Marys Hospital Site - 126 St Botolphs 120 127 Britannia Car Park 100 133 Bay Mill - 209 Garrison Central 1 - 209 Garrison Development - J 407 209 Garrison Development - H 4 209 Garrison Development - K1/2 14 306 Paxmans Former Club, Hythe Hill 52 306 Paxmans Main Site, Port Lane 224 312 Gas Works Site, Hythe Quay 85 314 Brook Street - 314 Land Rear Of Brook Street 110 315 Garrison Development - A1 537 316 Garrison Development - B1B 138 316 Garrison Development - B1A 11 316 Garrison Central 3 - C2 30 403 University, Salary Brook Medows - 403 Land West Of Boundary Road, Uofea 5 416 Jewsons Site 221 416 Hawkins Road 360 416 Hawkins Road - 416 Hawkins Road - 417 Lightship Way, Hythe Quay 168 501 Flakt Woods Site, Brainswick 495
53 C:\Users\WhittlM\Documents\My_Docs\Essex\Colchester\00 Mar 17\report\July 17 final edit\Colchester Local Plan Traffic Modelling TN - V5.1.docx
510 South Of Myland Rectory - 514 Cuckoo Point, Severalls Lane 173 515 Royal London Mill Road 163 516 Cowies, Boxted Road - 517 Severalls Hospital 978 518 NGAUE Sw (Golf Course Site) - 518 Chesterwell 1600 523 Turner Village 432 604 Betts Factory, Ipswich Road 128 902 Railway Sidings Site, Halsead Road 123 912 Winstree Road, Stanway 111 914 Lakelands Phase 2 436 915 Fiveways Fruit Farm And Dyers Road 547 1001 Land Between A12/London Road, Stanway (Wyvern Farm) 358 1103 Layer Road Football Stadium 58 1109 Garrison Central 4 - L/N 266 1109 Garrison Central 4 - P1 203 1109 Garrison Central 4 - O 38 1110 Breachfield 261 1205 Garrison Development - S1 212 1205 Garrison Development - S2N 163 1205 Garrison Development - S2Nw 48 1205 Garrison Development - S2Sw 21 1205 Garrison Development - S2S 146 1211 Garrison Development - Q 46 1403 King Edward Quay 153
1601 Cooks Shipyard, Wivenhoe 77 1701 East Road, West Mersea 37 1702 Rowhedge Port At End Of High St. 256 1704 Grange Road, Tiptree 103 1704 Petrol Station,Maypole Road, Tip 28 1704 Jam Factory Site, Tiptree 244 1711 Tile House Farm, Gt. Horkesley 145 Total 11053
54 C:\Users\WhittlM\Documents\My_Docs\Essex\Colchester\00 Mar 17\report\July 17 final edit\Colchester Local Plan Traffic Modelling TN - V5.1.docx
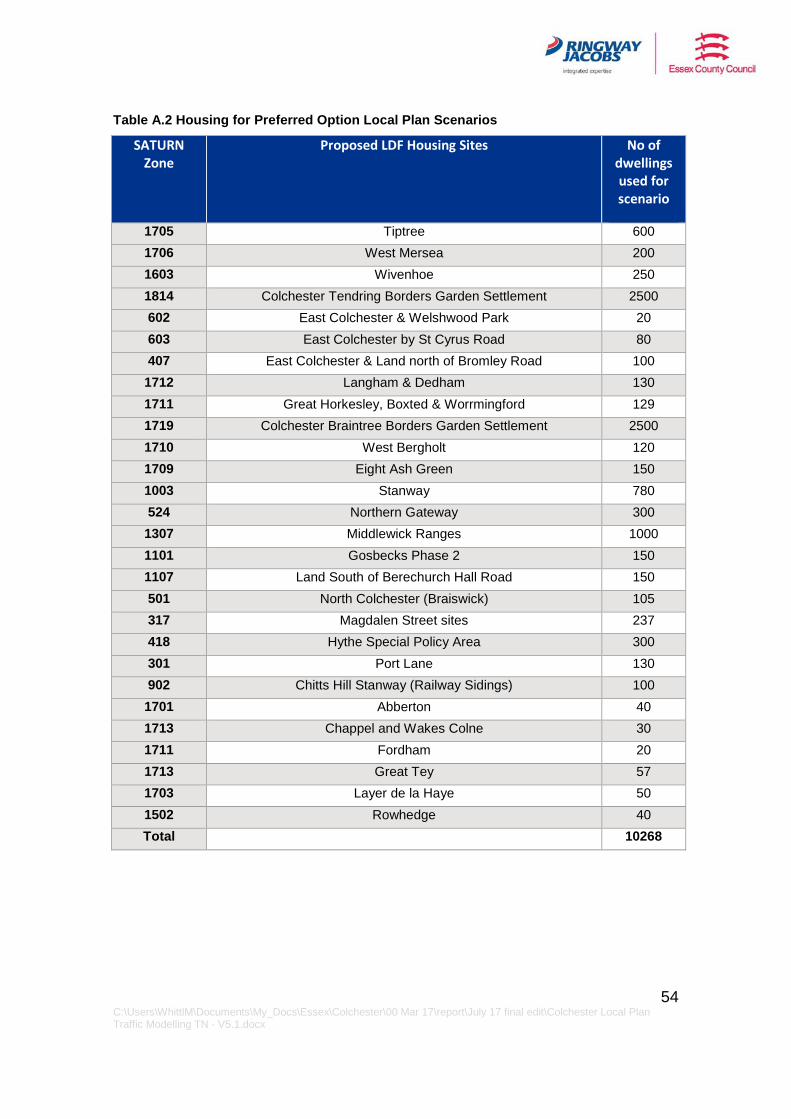
Table A.2 Housing for Preferred Option Local Plan Scenarios
SATURN Zone
Proposed LDF Housing Sites
No of dwellings used for scenario
1705 Tiptree 600 1706 West Mersea 200 1603 Wivenhoe 250 1814 Colchester Tendring Borders Garden Settlement 2500 602 East Colchester & Welshwood Park 20 603 East Colchester by St Cyrus Road 80 407 East Colchester & Land north of Bromley Road 100 1712 Langham & Dedham 130 1711 Great Horkesley, Boxted & Worrmingford 129 1719 Colchester Braintree Borders Garden Settlement 2500 1710 West Bergholt 120 1709 Eight Ash Green 150 1003 Stanway 780 524 Northern Gateway 300 1307 Middlewick Ranges 1000 1101 Gosbecks Phase 2 150 1107 Land South of Berechurch Hall Road 150 501 North Colchester (Braiswick) 105 317 Magdalen Street sites 237 418 Hythe Special Policy Area 300 301 Port Lane 130 902 Chitts Hill Stanway (Railway Sidings) 100 1701 Abberton 40 1713 Chappel and Wakes Colne 30 1711 Fordham 20 1713 Great Tey 57 1703 Layer de la Haye 50 1502 Rowhedge 40 Total 10268
55 C:\Users\WhittlM\Documents\My_Docs\Essex\Colchester\00 Mar 17\report\July 17 final edit\Colchester Local Plan Traffic Modelling TN - V5.1.docx
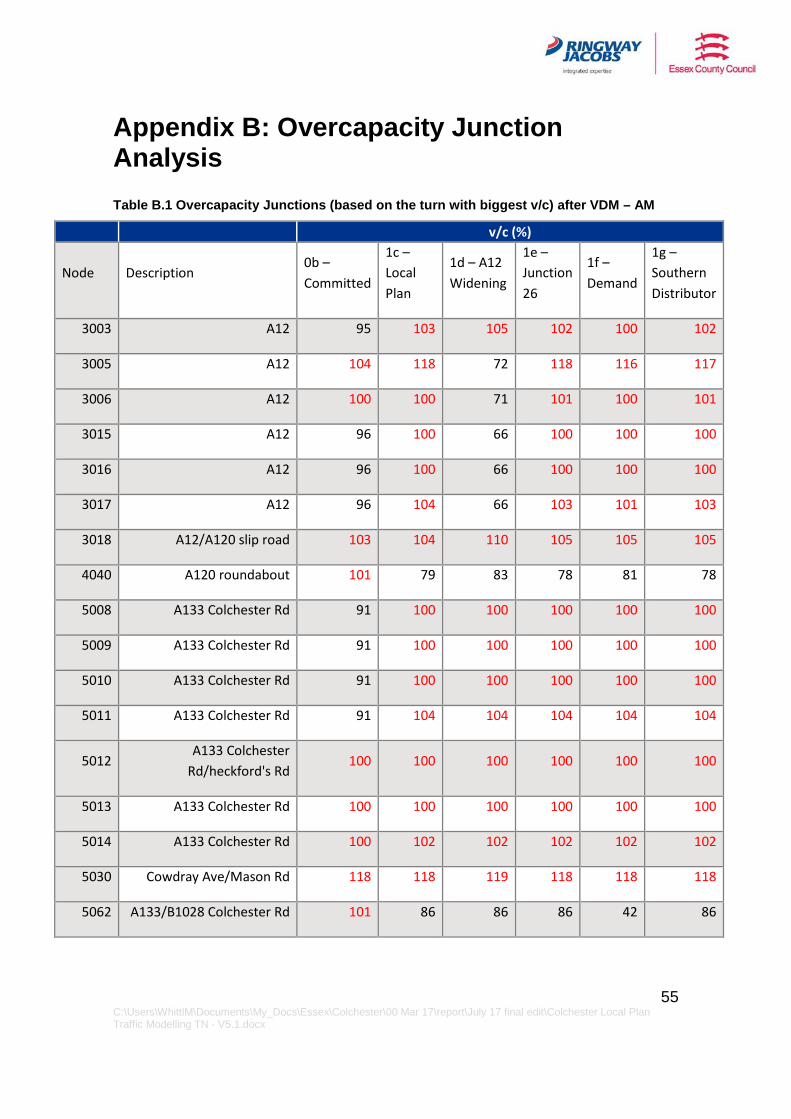
Appendix B: Overcapacity Junction Analysis Table B.1 Overcapacity Junctions (based on the turn with biggest v/c) after VDM – AM
v/c (%)
Node Description 0b – Committed
1c – Local Plan
1d – A12 Widening
1e – Junction 26
1f – Demand
1g – Southern Distributor
3003 A12 95 103 105 102 100 102
3005 A12 104 118 72 118 116 117
3006 A12 100 100 71 101 100 101
3015 A12 96 100 66 100 100 100
3016 A12 96 100 66 100 100 100
3017 A12 96 104 66 103 101 103
3018 A12/A120 slip road 103 104 110 105 105 105
4040 A120 roundabout 101 79 83 78 81 78
5008 A133 Colchester Rd 91 100 100 100 100 100
5009 A133 Colchester Rd 91 100 100 100 100 100
5010 A133 Colchester Rd 91 100 100 100 100 100
5011 A133 Colchester Rd 91 104 104 104 104 104
5012 A133 Colchester
Rd/heckford's Rd 100 100 100 100 100 100
5013 A133 Colchester Rd 100 100 100 100 100 100
5014 A133 Colchester Rd 100 102 102 102 102 102
5030 Cowdray Ave/Mason Rd 118 118 119 118 118 118
5062 A133/B1028 Colchester Rd 101 86 86 86 42 86
56 C:\Users\WhittlM\Documents\My_Docs\Essex\Colchester\00 Mar 17\report\July 17 final edit\Colchester Local Plan Traffic Modelling TN - V5.1.docx
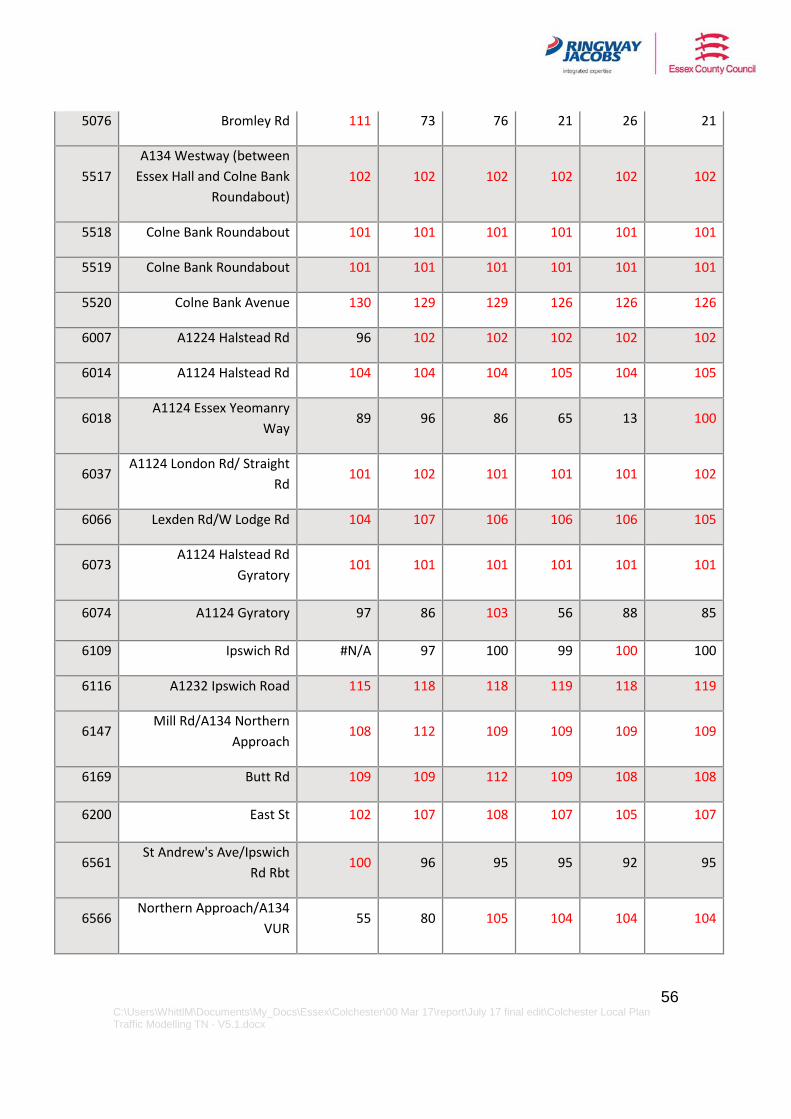
5076 Bromley Rd 111 73 76 21 26 21
5517 A134 Westway (between
Essex Hall and Colne Bank Roundabout)
102 102 102 102 102 102
5518 Colne Bank Roundabout 101 101 101 101 101 101
5519 Colne Bank Roundabout 101 101 101 101 101 101
5520 Colne Bank Avenue 130 129 129 126 126 126
6007 A1224 Halstead Rd 96 102 102 102 102 102
6014 A1124 Halstead Rd 104 104 104 105 104 105
6018 A1124 Essex Yeomanry
Way 89 96 86 65 13 100
6037 A1124 London Rd/ Straight
Rd 101 102 101 101 101 102
6066 Lexden Rd/W Lodge Rd 104 107 106 106 106 105
6073 A1124 Halstead Rd
Gyratory 101 101 101 101 101 101
6074 A1124 Gyratory 97 86 103 56 88 85
6109 Ipswich Rd #N/A 97 100 99 100 100
6116 A1232 Ipswich Road 115 118 118 119 118 119
6147 Mill Rd/A134 Northern
Approach 108 112 109 109 109 109
6169 Butt Rd 109 109 112 109 108 108
6200 East St 102 107 108 107 105 107
6561 St Andrew's Ave/Ipswich
Rd Rbt 100 96 95 95 92 95
6566 Northern Approach/A134
VUR 55 80 105 104 104 104
57 C:\Users\WhittlM\Documents\My_Docs\Essex\Colchester\00 Mar 17\report\July 17 final edit\Colchester Local Plan Traffic Modelling TN - V5.1.docx
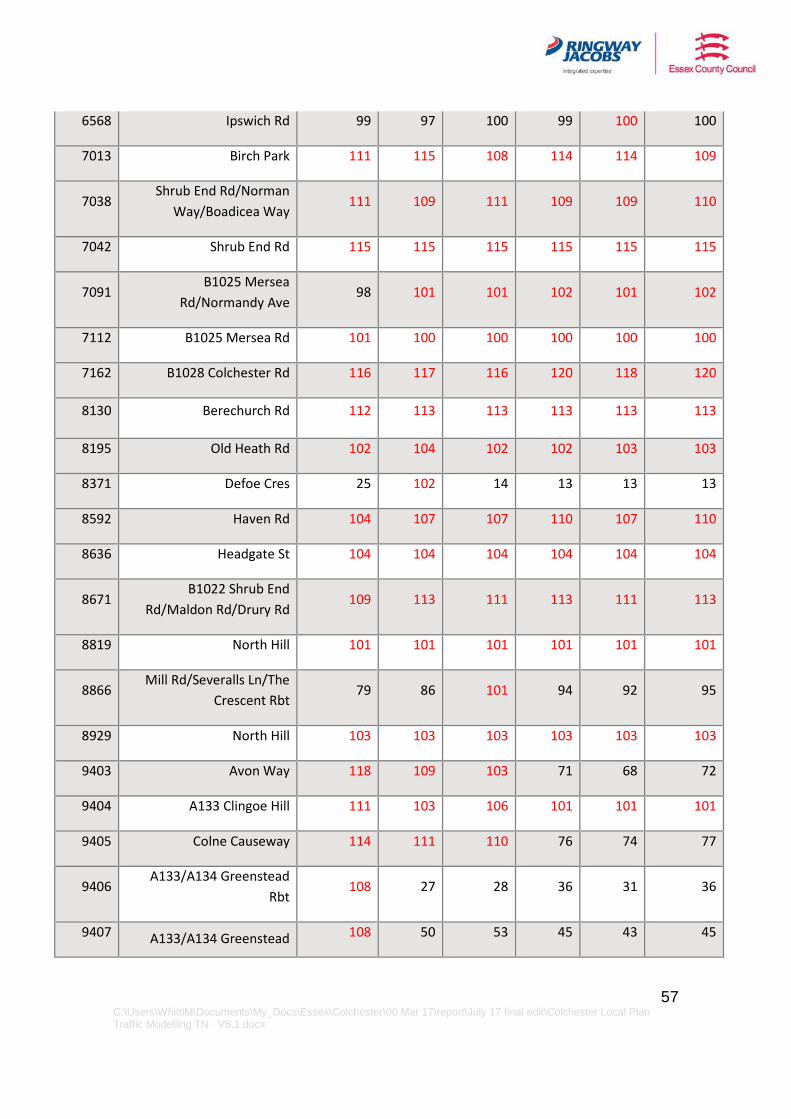
6568 Ipswich Rd 99 97 100 99 100 100
7013 Birch Park 111 115 108 114 114 109
7038 Shrub End Rd/Norman
Way/Boadicea Way 111 109 111 109 109 110
7042 Shrub End Rd 115 115 115 115 115 115
7091 B1025 Mersea
Rd/Normandy Ave 98 101 101 102 101 102
7112 B1025 Mersea Rd 101 100 100 100 100 100
7162 B1028 Colchester Rd 116 117 116 120 118 120
8130 Berechurch Rd 112 113 113 113 113 113
8195 Old Heath Rd 102 104 102 102 103 103
8371 Defoe Cres 25 102 14 13 13 13
8592 Haven Rd 104 107 107 110 107 110
8636 Headgate St 104 104 104 104 104 104
8671 B1022 Shrub End
Rd/Maldon Rd/Drury Rd 109 113 111 113 111 113
8819 North Hill 101 101 101 101 101 101
8866 Mill Rd/Severalls Ln/The
Crescent Rbt 79 86 101 94 92 95
8929 North Hill 103 103 103 103 103 103
9403 Avon Way 118 109 103 71 68 72
9404 A133 Clingoe Hill 111 103 106 101 101 101
9405 Colne Causeway 114 111 110 76 74 77
9406 A133/A134 Greenstead
Rbt 108 27 28 36 31 36
9407 A133/A134 Greenstead 108 50 53 45 43 45
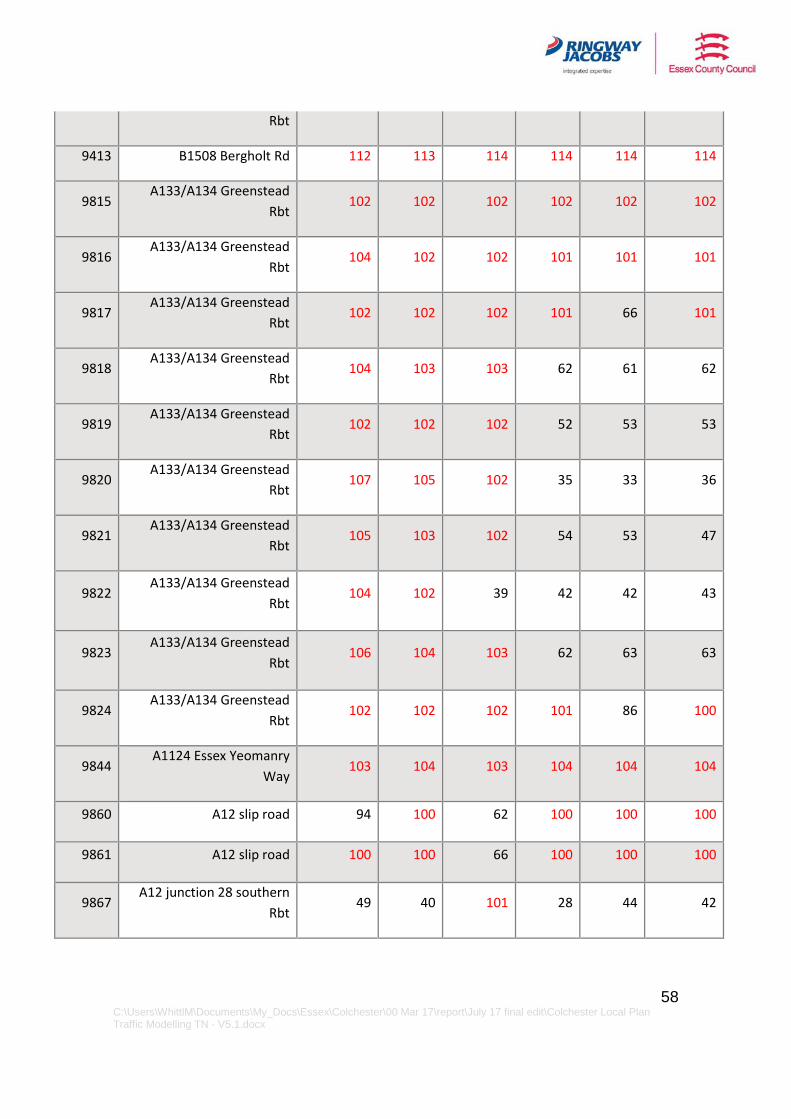
58 C:\Users\WhittlM\Documents\My_Docs\Essex\Colchester\00 Mar 17\report\July 17 final edit\Colchester Local Plan Traffic Modelling TN - V5.1.docx
Rbt
9413 B1508 Bergholt Rd 112 113 114 114 114 114
9815 A133/A134 Greenstead
Rbt 102 102 102 102 102 102
9816 A133/A134 Greenstead
Rbt 104 102 102 101 101 101
9817 A133/A134 Greenstead
Rbt 102 102 102 101 66 101
9818 A133/A134 Greenstead
Rbt 104 103 103 62 61 62
9819 A133/A134 Greenstead
Rbt 102 102 102 52 53 53
9820 A133/A134 Greenstead
Rbt 107 105 102 35 33 36
9821 A133/A134 Greenstead
Rbt 105 103 102 54 53 47
9822 A133/A134 Greenstead
Rbt 104 102 39 42 42 43
9823 A133/A134 Greenstead
Rbt 106 104 103 62 63 63
9824 A133/A134 Greenstead
Rbt 102 102 102 101 86 100
9844 A1124 Essex Yeomanry
Way 103 104 103 104 104 104
9860 A12 slip road 94 100 62 100 100 100
9861 A12 slip road 100 100 66 100 100 100
9867 A12 junction 28 southern
Rbt 49 40 101 28 44 42
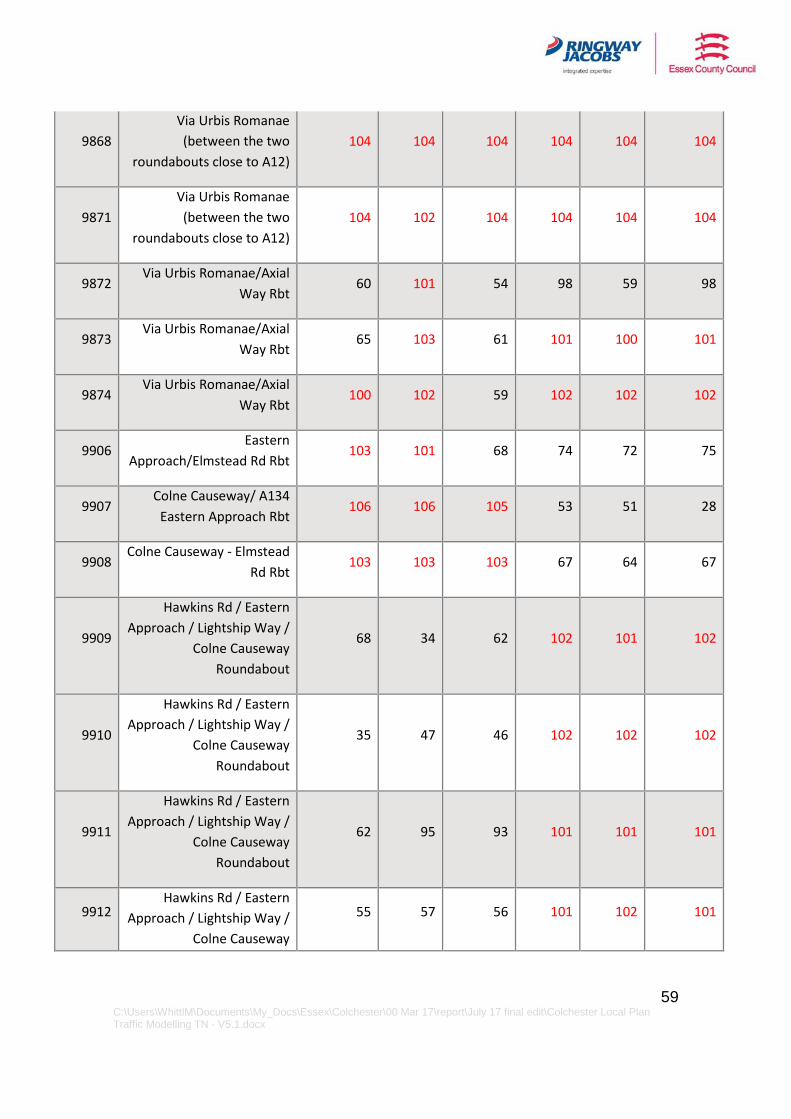
59 C:\Users\WhittlM\Documents\My_Docs\Essex\Colchester\00 Mar 17\report\July 17 final edit\Colchester Local Plan Traffic Modelling TN - V5.1.docx
9868 Via Urbis Romanae (between the two
roundabouts close to A12) 104 104 104 104 104 104
9871 Via Urbis Romanae (between the two
roundabouts close to A12) 104 102 104 104 104 104
9872 Via Urbis Romanae/Axial
Way Rbt 60 101 54 98 59 98
9873 Via Urbis Romanae/Axial
Way Rbt 65 103 61 101 100 101
9874 Via Urbis Romanae/Axial
Way Rbt 100 102 59 102 102 102
9906 Eastern
Approach/Elmstead Rd Rbt 103 101 68 74 72 75
9907 Colne Causeway/ A134
Eastern Approach Rbt 106 106 105 53 51 28
9908 Colne Causeway - Elmstead
Rd Rbt 103 103 103 67 64 67
9909
Hawkins Rd / Eastern Approach / Lightship Way /
Colne Causeway Roundabout
68 34 62 102 101 102
9910
Hawkins Rd / Eastern Approach / Lightship Way /
Colne Causeway Roundabout
35 47 46 102 102 102
9911
Hawkins Rd / Eastern Approach / Lightship Way /
Colne Causeway Roundabout
62 95 93 101 101 101
9912 Hawkins Rd / Eastern
Approach / Lightship Way / Colne Causeway
55 57 56 101 102 101
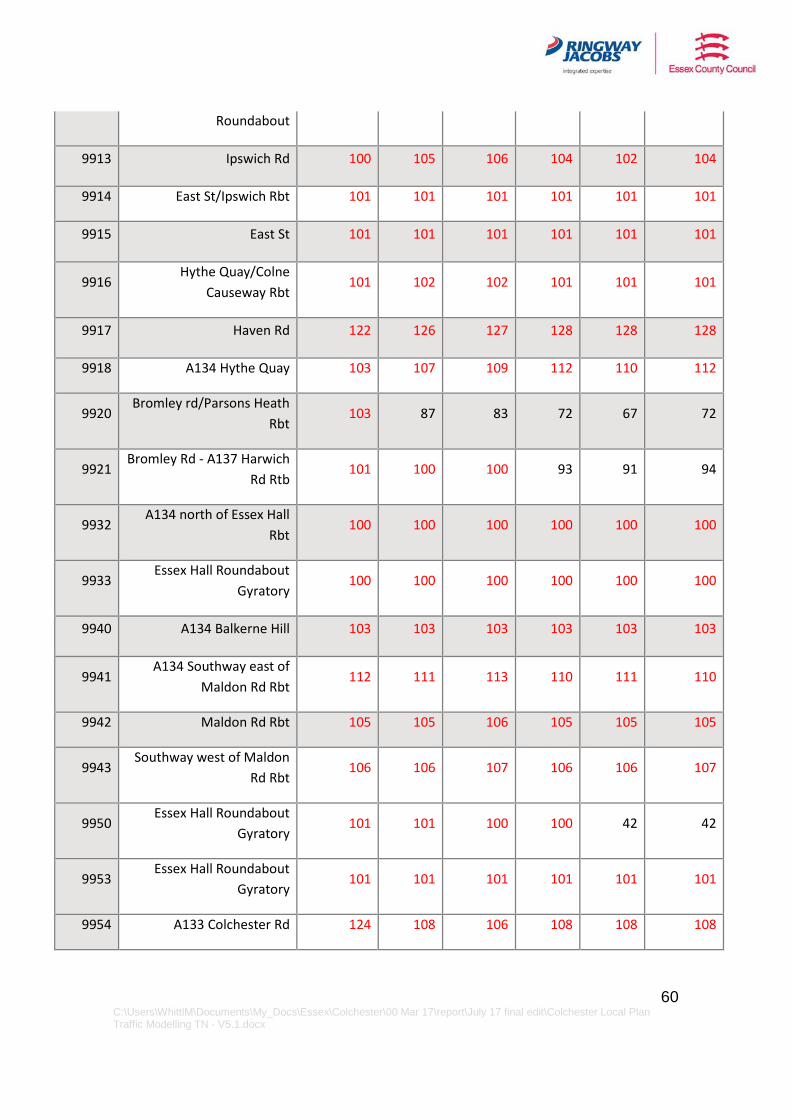
60 C:\Users\WhittlM\Documents\My_Docs\Essex\Colchester\00 Mar 17\report\July 17 final edit\Colchester Local Plan Traffic Modelling TN - V5.1.docx
Roundabout
9913 Ipswich Rd 100 105 106 104 102 104
9914 East St/Ipswich Rbt 101 101 101 101 101 101
9915 East St 101 101 101 101 101 101
9916 Hythe Quay/Colne
Causeway Rbt 101 102 102 101 101 101
9917 Haven Rd 122 126 127 128 128 128
9918 A134 Hythe Quay 103 107 109 112 110 112
9920 Bromley rd/Parsons Heath
Rbt 103 87 83 72 67 72
9921 Bromley Rd - A137 Harwich
Rd Rtb 101 100 100 93 91 94
9932 A134 north of Essex Hall
Rbt 100 100 100 100 100 100
9933 Essex Hall Roundabout
Gyratory 100 100 100 100 100 100
9940 A134 Balkerne Hill 103 103 103 103 103 103
9941 A134 Southway east of
Maldon Rd Rbt 112 111 113 110 111 110
9942 Maldon Rd Rbt 105 105 106 105 105 105
9943 Southway west of Maldon
Rd Rbt 106 106 107 106 106 107
9950 Essex Hall Roundabout
Gyratory 101 101 100 100 42 42
9953 Essex Hall Roundabout
Gyratory 101 101 101 101 101 101
9954 A133 Colchester Rd 124 108 106 108 108 108
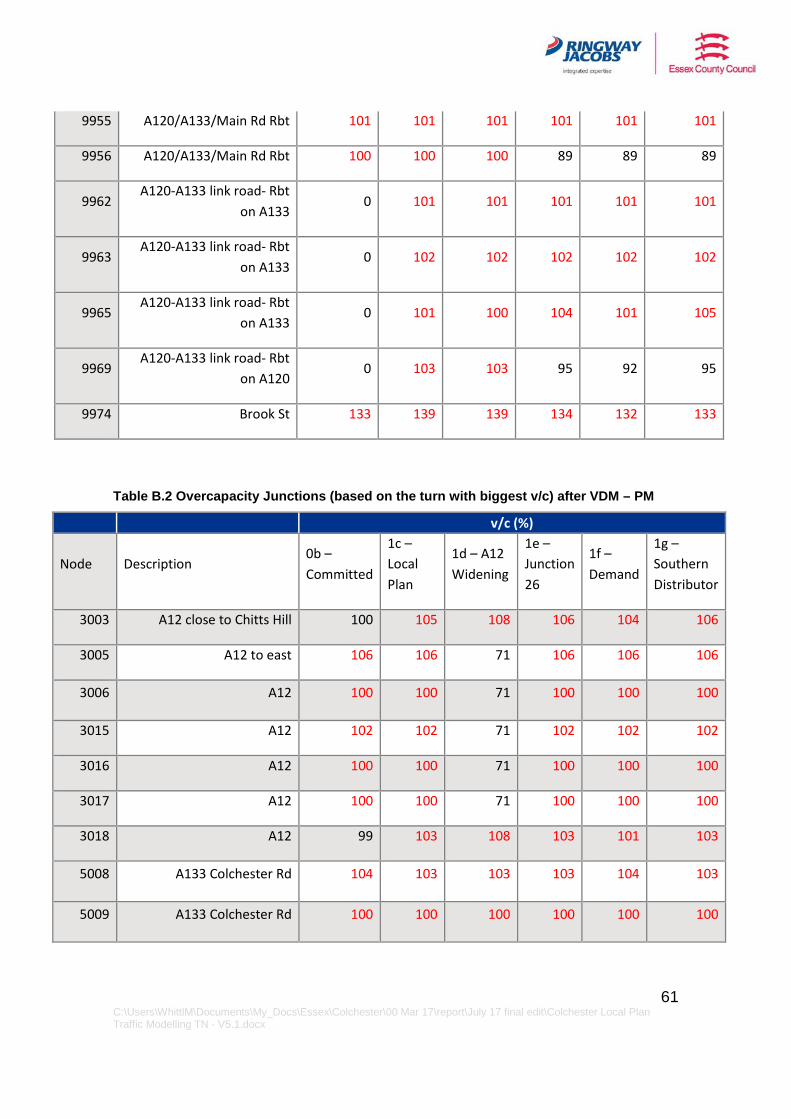
61 C:\Users\WhittlM\Documents\My_Docs\Essex\Colchester\00 Mar 17\report\July 17 final edit\Colchester Local Plan Traffic Modelling TN - V5.1.docx
9955 A120/A133/Main Rd Rbt 101 101 101 101 101 101
9956 A120/A133/Main Rd Rbt 100 100 100 89 89 89
9962 A120-A133 link road- Rbt
on A133 0 101 101 101 101 101
9963 A120-A133 link road- Rbt
on A133 0 102 102 102 102 102
9965 A120-A133 link road- Rbt
on A133 0 101 100 104 101 105
9969 A120-A133 link road- Rbt
on A120 0 103 103 95 92 95
9974 Brook St 133 139 139 134 132 133
Table B.2 Overcapacity Junctions (based on the turn with biggest v/c) after VDM – PM
v/c (%)
Node Description 0b – Committed
1c – Local Plan
1d – A12 Widening
1e – Junction 26
1f – Demand
1g – Southern Distributor
3003 A12 close to Chitts Hill 100 105 108 106 104 106
3005 A12 to east 106 106 71 106 106 106
3006 A12 100 100 71 100 100 100
3015 A12 102 102 71 102 102 102
3016 A12 100 100 71 100 100 100
3017 A12 100 100 71 100 100 100
3018 A12 99 103 108 103 101 103
5008 A133 Colchester Rd 104 103 103 103 104 103
5009 A133 Colchester Rd 100 100 100 100 100 100
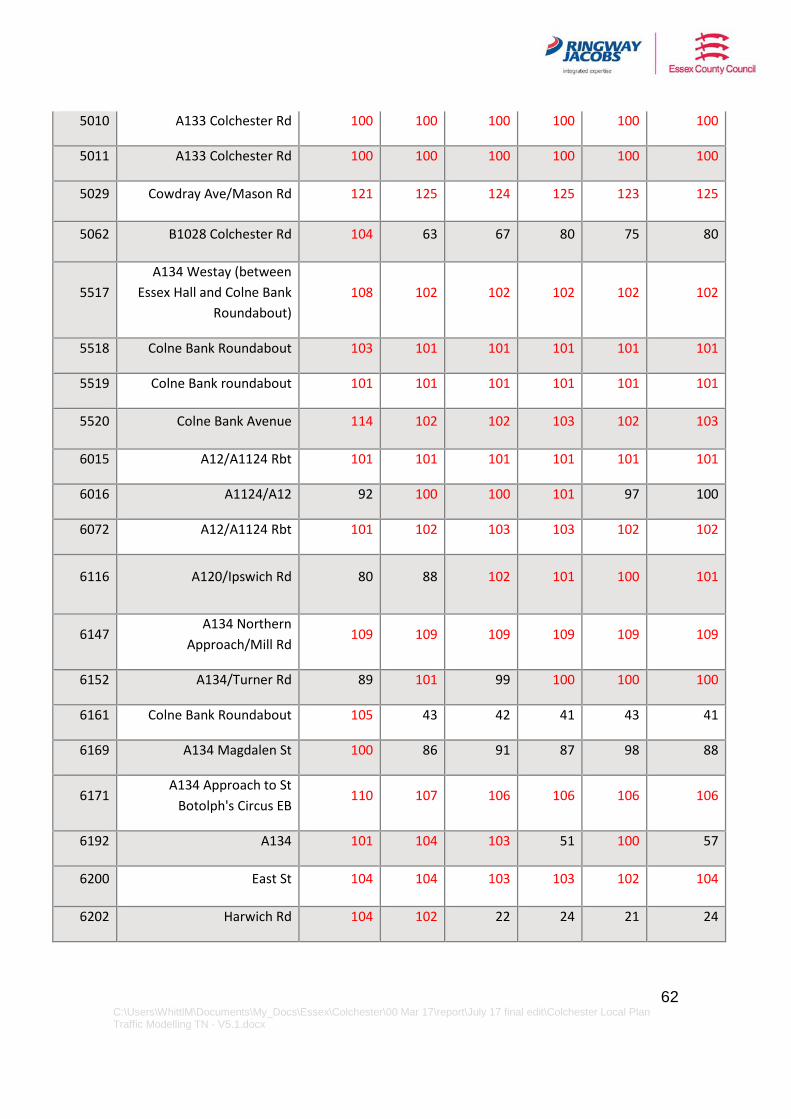
62 C:\Users\WhittlM\Documents\My_Docs\Essex\Colchester\00 Mar 17\report\July 17 final edit\Colchester Local Plan Traffic Modelling TN - V5.1.docx
5010 A133 Colchester Rd 100 100 100 100 100 100
5011 A133 Colchester Rd 100 100 100 100 100 100
5029 Cowdray Ave/Mason Rd 121 125 124 125 123 125
5062 B1028 Colchester Rd 104 63 67 80 75 80
5517 A134 Westay (between
Essex Hall and Colne Bank Roundabout)
108 102 102 102 102 102
5518 Colne Bank Roundabout 103 101 101 101 101 101
5519 Colne Bank roundabout 101 101 101 101 101 101
5520 Colne Bank Avenue 114 102 102 103 102 103
6015 A12/A1124 Rbt 101 101 101 101 101 101
6016 A1124/A12 92 100 100 101 97 100
6072 A12/A1124 Rbt 101 102 103 103 102 102
6116 A120/Ipswich Rd 80 88 102 101 100 101
6147 A134 Northern
Approach/Mill Rd 109 109 109 109 109 109
6152 A134/Turner Rd 89 101 99 100 100 100
6161 Colne Bank Roundabout 105 43 42 41 43 41
6169 A134 Magdalen St 100 86 91 87 98 88
6171 A134 Approach to St
Botolph's Circus EB 110 107 106 106 106 106
6192 A134 101 104 103 51 100 57
6200 East St 104 104 103 103 102 104
6202 Harwich Rd 104 102 22 24 21 24
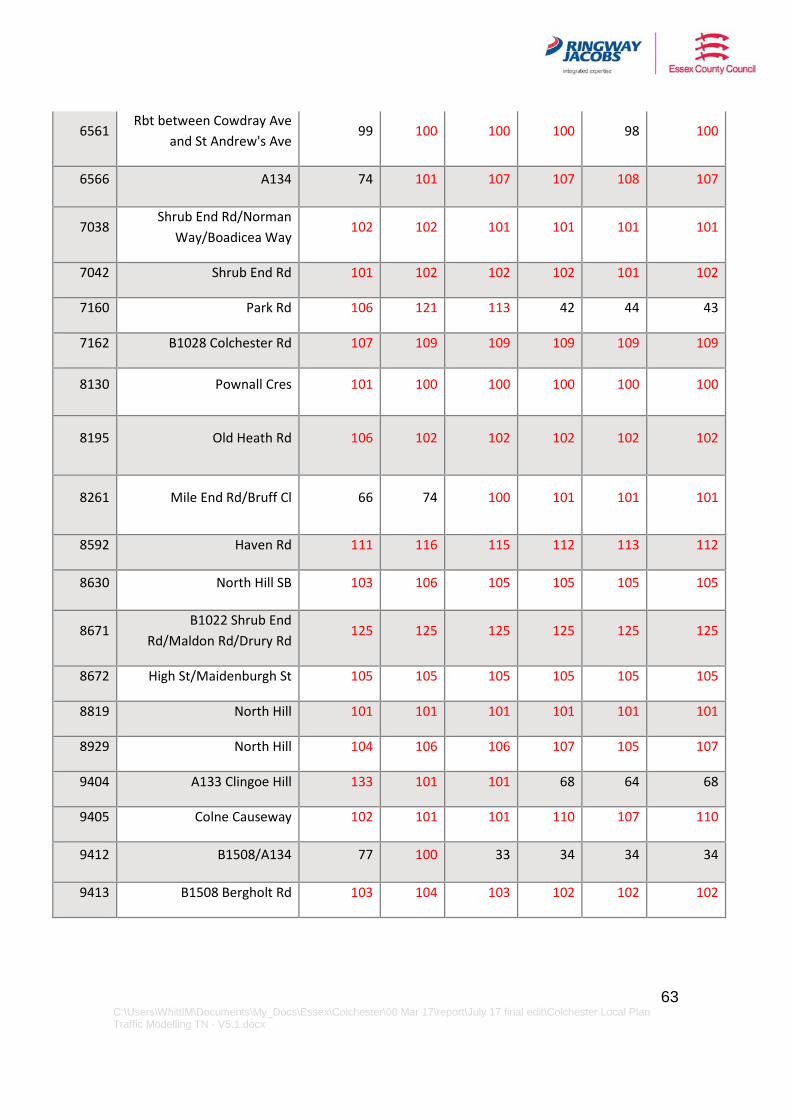
63 C:\Users\WhittlM\Documents\My_Docs\Essex\Colchester\00 Mar 17\report\July 17 final edit\Colchester Local Plan Traffic Modelling TN - V5.1.docx
6561 Rbt between Cowdray Ave
and St Andrew's Ave 99 100 100 100 98 100
6566 A134 74 101 107 107 108 107
7038 Shrub End Rd/Norman
Way/Boadicea Way 102 102 101 101 101 101
7042 Shrub End Rd 101 102 102 102 101 102
7160 Park Rd 106 121 113 42 44 43
7162 B1028 Colchester Rd 107 109 109 109 109 109
8130 Pownall Cres 101 100 100 100 100 100
8195 Old Heath Rd 106 102 102 102 102 102
8261 Mile End Rd/Bruff Cl 66 74 100 101 101 101
8592 Haven Rd 111 116 115 112 113 112
8630 North Hill SB 103 106 105 105 105 105
8671 B1022 Shrub End
Rd/Maldon Rd/Drury Rd 125 125 125 125 125 125
8672 High St/Maidenburgh St 105 105 105 105 105 105
8819 North Hill 101 101 101 101 101 101
8929 North Hill 104 106 106 107 105 107
9404 A133 Clingoe Hill 133 101 101 68 64 68
9405 Colne Causeway 102 101 101 110 107 110
9412 B1508/A134 77 100 33 34 34 34
9413 B1508 Bergholt Rd 103 104 103 102 102 102
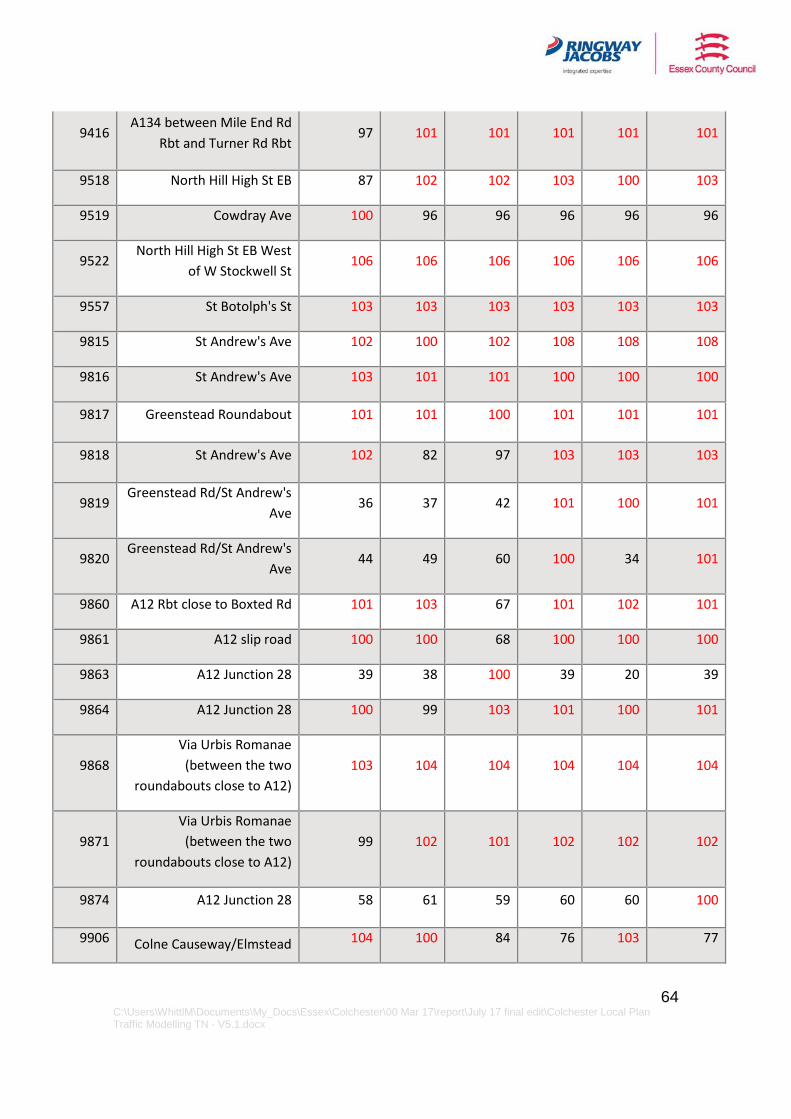
64 C:\Users\WhittlM\Documents\My_Docs\Essex\Colchester\00 Mar 17\report\July 17 final edit\Colchester Local Plan Traffic Modelling TN - V5.1.docx
9416 A134 between Mile End Rd
Rbt and Turner Rd Rbt 97 101 101 101 101 101
9518 North Hill High St EB 87 102 102 103 100 103
9519 Cowdray Ave 100 96 96 96 96 96
9522 North Hill High St EB West
of W Stockwell St 106 106 106 106 106 106
9557 St Botolph's St 103 103 103 103 103 103
9815 St Andrew's Ave 102 100 102 108 108 108
9816 St Andrew's Ave 103 101 101 100 100 100
9817 Greenstead Roundabout 101 101 100 101 101 101
9818 St Andrew's Ave 102 82 97 103 103 103
9819 Greenstead Rd/St Andrew's
Ave 36 37 42 101 100 101
9820 Greenstead Rd/St Andrew's
Ave 44 49 60 100 34 101
9860 A12 Rbt close to Boxted Rd 101 103 67 101 102 101
9861 A12 slip road 100 100 68 100 100 100
9863 A12 Junction 28 39 38 100 39 20 39
9864 A12 Junction 28 100 99 103 101 100 101
9868 Via Urbis Romanae (between the two
roundabouts close to A12) 103 104 104 104 104 104
9871 Via Urbis Romanae (between the two
roundabouts close to A12) 99 102 101 102 102 102
9874 A12 Junction 28 58 61 59 60 60 100
9906 Colne Causeway/Elmstead 104 100 84 76 103 77
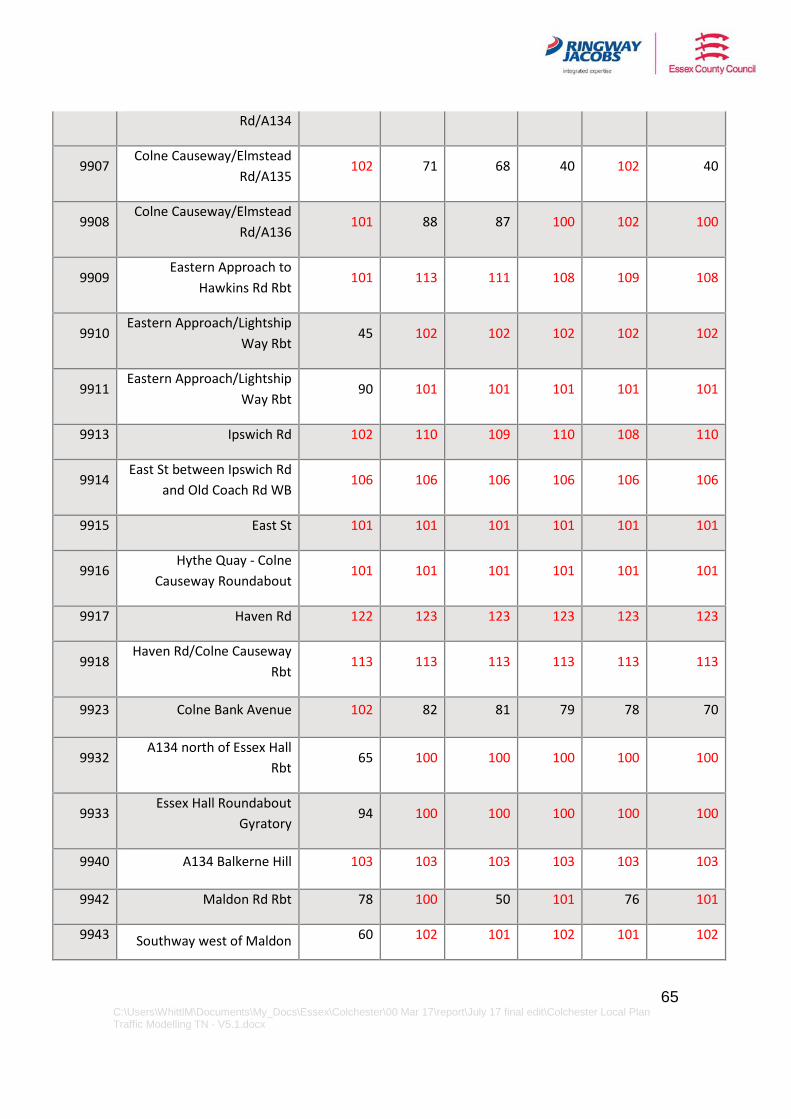
65 C:\Users\WhittlM\Documents\My_Docs\Essex\Colchester\00 Mar 17\report\July 17 final edit\Colchester Local Plan Traffic Modelling TN - V5.1.docx
Rd/A134
9907 Colne Causeway/Elmstead
Rd/A135 102 71 68 40 102 40
9908 Colne Causeway/Elmstead
Rd/A136 101 88 87 100 102 100
9909 Eastern Approach to
Hawkins Rd Rbt 101 113 111 108 109 108
9910 Eastern Approach/Lightship
Way Rbt 45 102 102 102 102 102
9911 Eastern Approach/Lightship
Way Rbt 90 101 101 101 101 101
9913 Ipswich Rd 102 110 109 110 108 110
9914 East St between Ipswich Rd
and Old Coach Rd WB 106 106 106 106 106 106
9915 East St 101 101 101 101 101 101
9916 Hythe Quay - Colne
Causeway Roundabout 101 101 101 101 101 101
9917 Haven Rd 122 123 123 123 123 123
9918 Haven Rd/Colne Causeway
Rbt 113 113 113 113 113 113
9923 Colne Bank Avenue 102 82 81 79 78 70
9932 A134 north of Essex Hall
Rbt 65 100 100 100 100 100
9933 Essex Hall Roundabout
Gyratory 94 100 100 100 100 100
9940 A134 Balkerne Hill 103 103 103 103 103 103
9942 Maldon Rd Rbt 78 100 50 101 76 101
9943 Southway west of Maldon 60 102 101 102 101 102
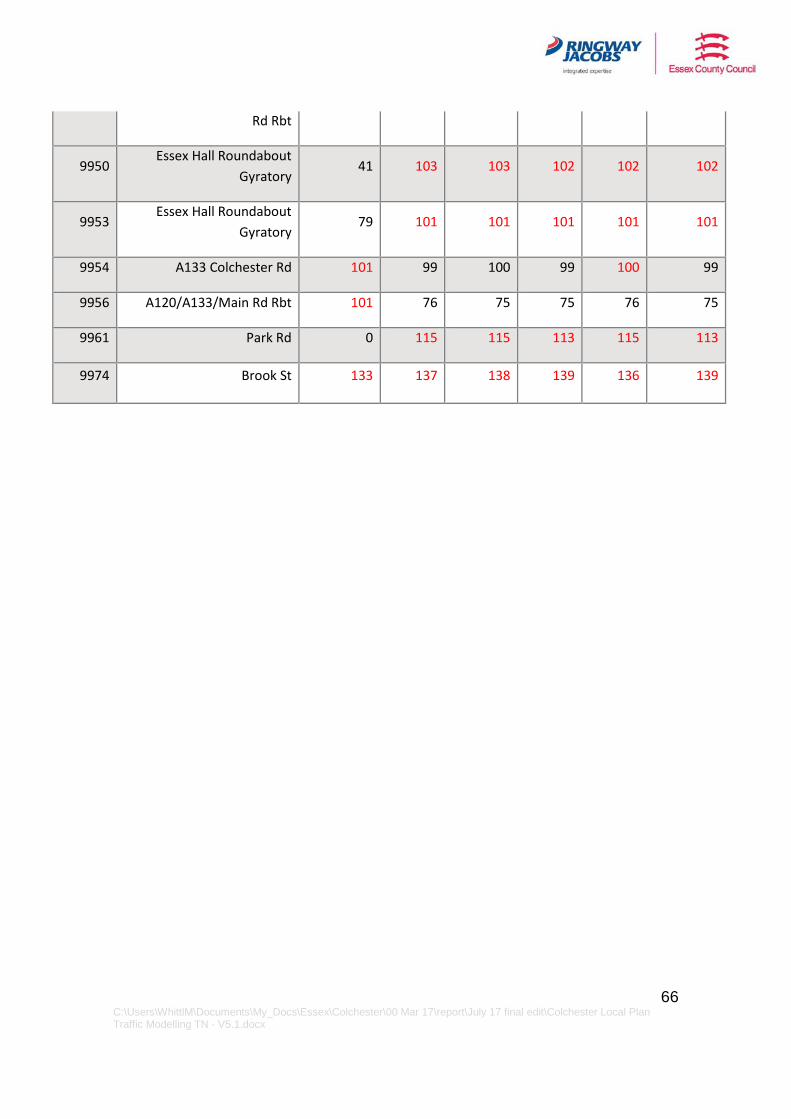
66 C:\Users\WhittlM\Documents\My_Docs\Essex\Colchester\00 Mar 17\report\July 17 final edit\Colchester Local Plan Traffic Modelling TN - V5.1.docx
Rd Rbt
9950 Essex Hall Roundabout
Gyratory 41 103 103 102 102 102
9953 Essex Hall Roundabout
Gyratory 79 101 101 101 101 101
9954 A133 Colchester Rd 101 99 100 99 100 99
9956 A120/A133/Main Rd Rbt 101 76 75 75 76 75
9961 Park Rd 0 115 115 113 115 113
9974 Brook St 133 137 138 139 136 139
67 C:\Users\WhittlM\Documents\My_Docs\Essex\Colchester\00 Mar 17\report\July 17 final edit\Colchester Local Plan Traffic Modelling TN - V5.1.docx
Appendix C: Options for mitigation measures
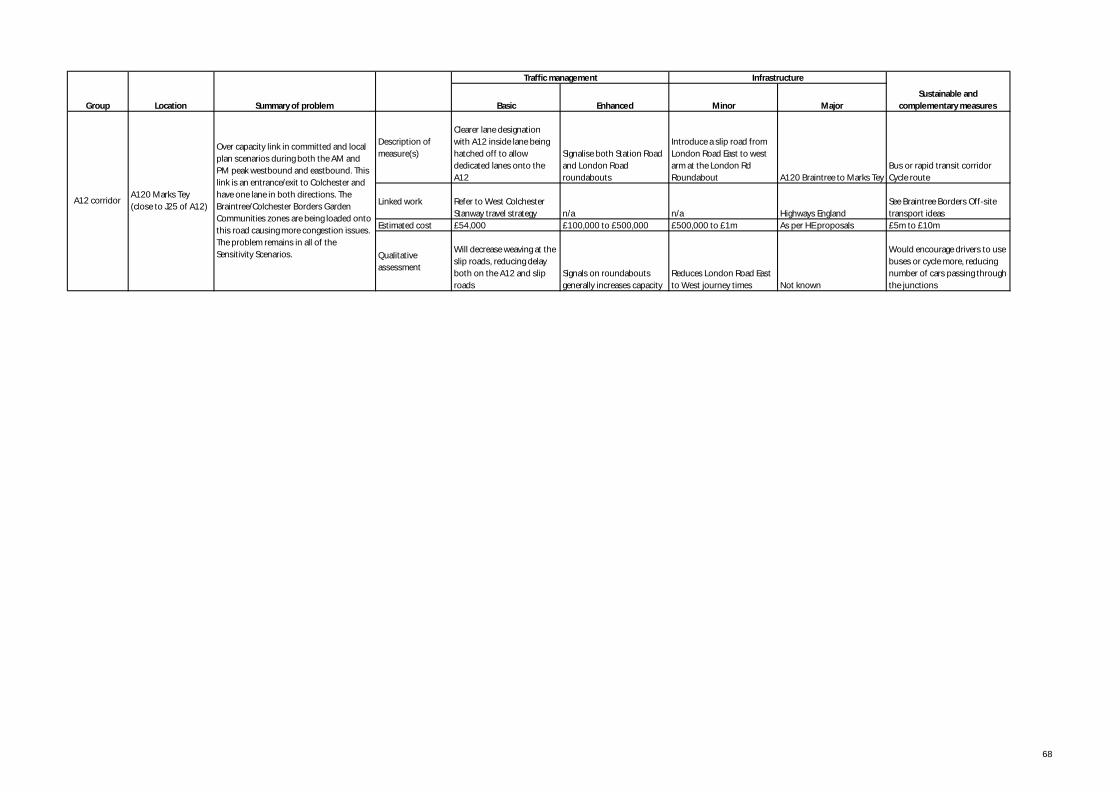
Basic Enhanced Minor Major
Description ofmeasure(s)
Clearer lane designationwith A12 inside lane beinghatched off to allowdedicated lanes onto theA12
Signalise both Station Roadand London Roadroundabouts
Introduce a slip road fromLondon Road East to westarm at the London RdRoundabout A120 Braintree to Marks Tey
Bus or rapid transit corridorCycle route
Linked work Refer to West ColchesterStanway travel strategy n/a n/a Highways England
See Braintree Borders Off-sitetransport ideas
Estimated cost £54,000 £100,000 to £500,000 £500,000 to £1m As per HE proposals £5m to £10m
Qualitativeassessment
Will decrease weaving at theslip roads, reducing delayboth on the A12 and sliproads
Signals on roundaboutsgenerally increases capacity
Reduces London Road Eastto West journey times Not known
Would encourage drivers to usebuses or cycle more, reducingnumber of cars passing throughthe junctions
Group
A12 corridor
Infrastructure
Sustainable andcomplementary measuresLocation Summary of problem
A120 Marks Tey(close to J25 of A12)
Over capacity link in committed and localplan scenarios during both the AM andPM peak westbound and eastbound. Thislink is an entrance/exit to Colchester andhave one lane in both directions. TheBraintree/Colchester Borders GardenCommunities zones are being loaded ontothis road causing more congestion issues.The problem remains in all of theSensitivity Scenarios.
Traffic management
68
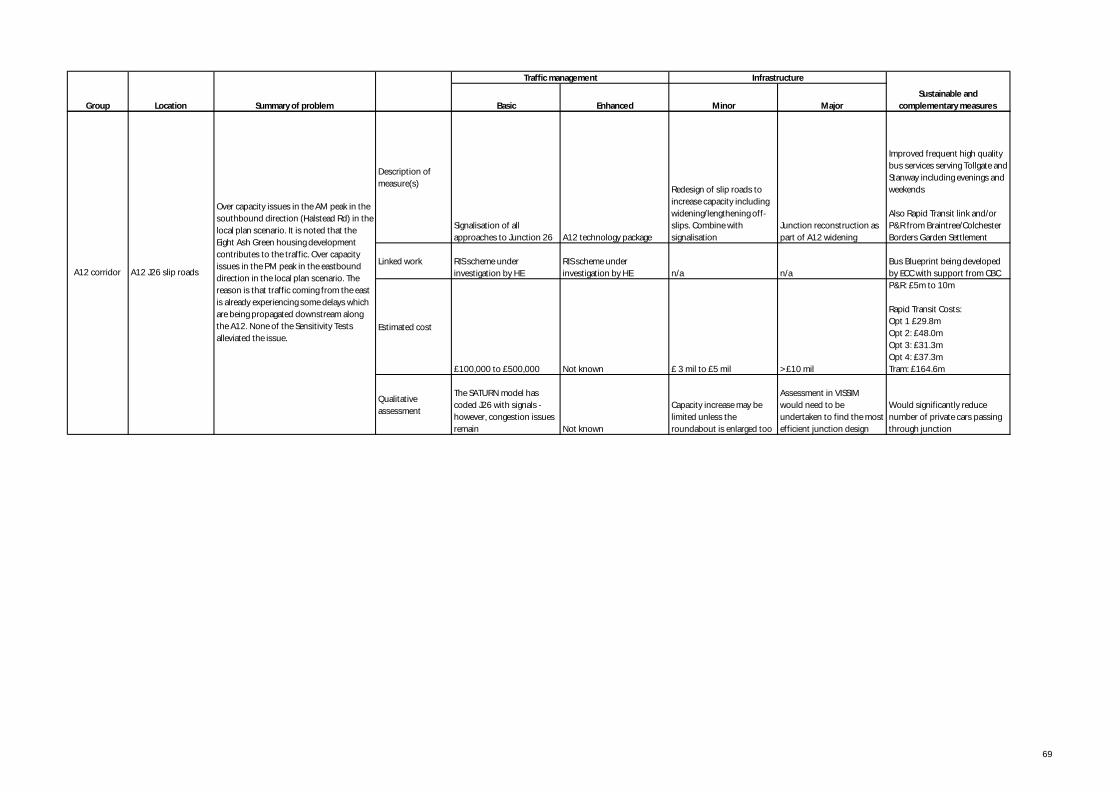
Basic Enhanced Minor MajorGroup
Infrastructure
Sustainable andcomplementary measuresLocation Summary of problem
Traffic management
Description ofmeasure(s)
Signalisation of allapproaches to Junction 26 A12 technology package
Redesign of slip roads toincrease capacity includingwidening/lengthening off-slips. Combine withsignalisation
Junction reconstruction aspart of A12 widening
Improved frequent high qualitybus services serving Tollgate andStanway including evenings andweekends
Also Rapid Transit link and/orP&R from Braintree/ColchesterBorders Garden Settlement
Linked work RIS scheme underinvestigation by HE
RIS scheme underinvestigation by HE n/a n/a
Bus Blueprint being developedby ECC with support from CBC
Estimated cost
£100,000 to £500,000 Not known £ 3 mil to £5 mil > £10 mil
P&R: £5m to 10m
Rapid Transit Costs:Opt 1 £29.8mOpt 2: £48.0mOpt 3: £31.3mOpt 4: £37.3mTram: £164.6m
Qualitativeassessment
The SATURN model hascoded J26 with signals -however, congestion issuesremain Not known
Capacity increase may belimited unless theroundabout is enlarged too
Assessment in VISSIMwould need to beundertaken to find the mostefficient junction design
Would significantly reducenumber of private cars passingthrough junction
A12 J26 slip roads
Over capacity issues in the AM peak in thesouthbound direction (Halstead Rd) in thelocal plan scenario. It is noted that theEight Ash Green housing developmentcontributes to the traffic. Over capacityissues in the PM peak in the eastbounddirection in the local plan scenario. Thereason is that traffic coming from the eastis already experiencing some delays whichare being propagated downstream alongthe A12. None of the Sensitivity Testsalleviated the issue.
A12 corridor
69
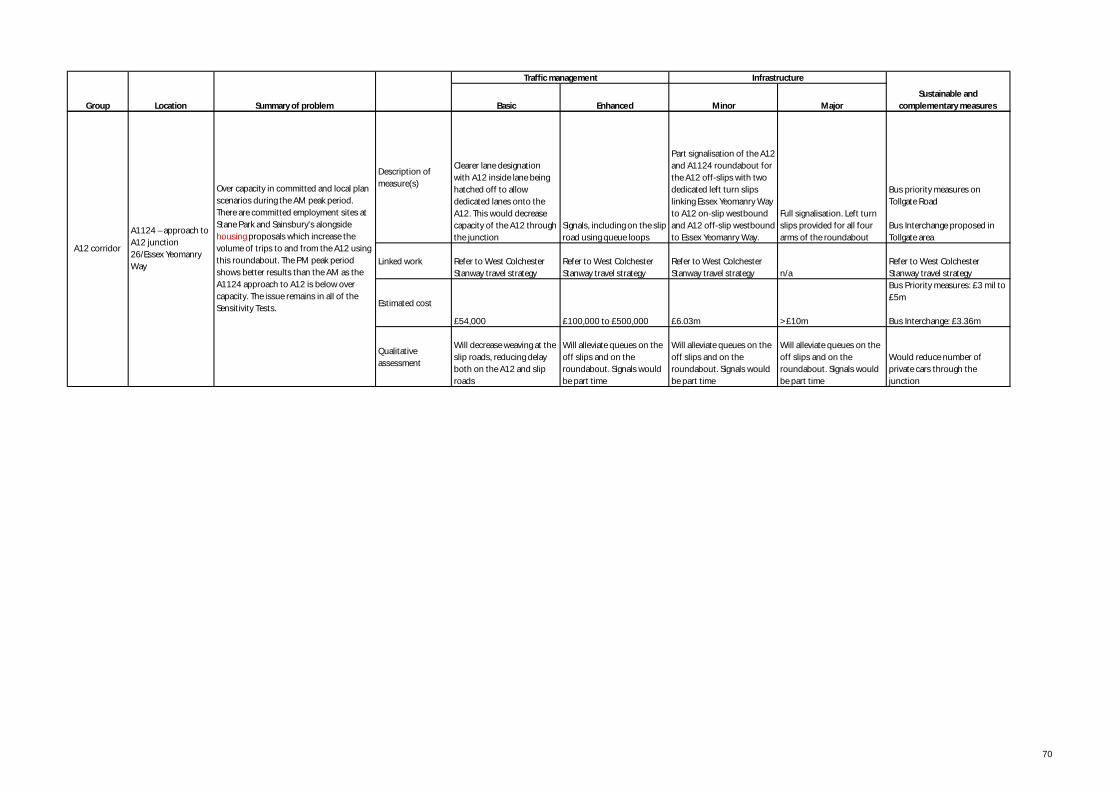
Basic Enhanced Minor MajorGroup
Infrastructure
Sustainable andcomplementary measuresLocation Summary of problem
Traffic management
Description ofmeasure(s)
Clearer lane designationwith A12 inside lane beinghatched off to allowdedicated lanes onto theA12. This would decreasecapacity of the A12 throughthe junction
Signals, including on the sliproad using queue loops
Part signalisation of the A12and A1124 roundabout forthe A12 off-slips with twodedicated left turn slipslinking Essex Yeomanry Wayto A12 on-slip westboundand A12 off-slip westboundto Essex Yeomanry Way.
Full signalisation. Left turnslips provided for all fourarms of the roundabout
Bus priority measures onTollgate Road
Bus Interchange proposed inTollgate area
Linked work Refer to West ColchesterStanway travel strategy
Refer to West ColchesterStanway travel strategy
Refer to West ColchesterStanway travel strategy n/a
Refer to West ColchesterStanway travel strategy
Estimated cost
£54,000 £100,000 to £500,000 £6.03m > £10m
Bus Priority measures: £3 mil to£5m
Bus Interchange: £3.36m
Qualitativeassessment
Will decrease weaving at theslip roads, reducing delayboth on the A12 and sliproads
Will alleviate queues on theoff slips and on theroundabout. Signals wouldbe part time
Will alleviate queues on theoff slips and on theroundabout. Signals wouldbe part time
Will alleviate queues on theoff slips and on theroundabout. Signals wouldbe part time
Would reduce number ofprivate cars through thejunction
A1124 – approach toA12 junction26/Essex YeomanryWay
Over capacity in committed and local planscenarios during the AM peak period.There are committed employment sites atStane Park and Sainsbury's alongsidehousing proposals which increase thevolume of trips to and from the A12 usingthis roundabout. The PM peak periodshows better results than the AM as theA1124 approach to A12 is below overcapacity. The issue remains in all of theSensitivity Tests.
A12 corridor
70
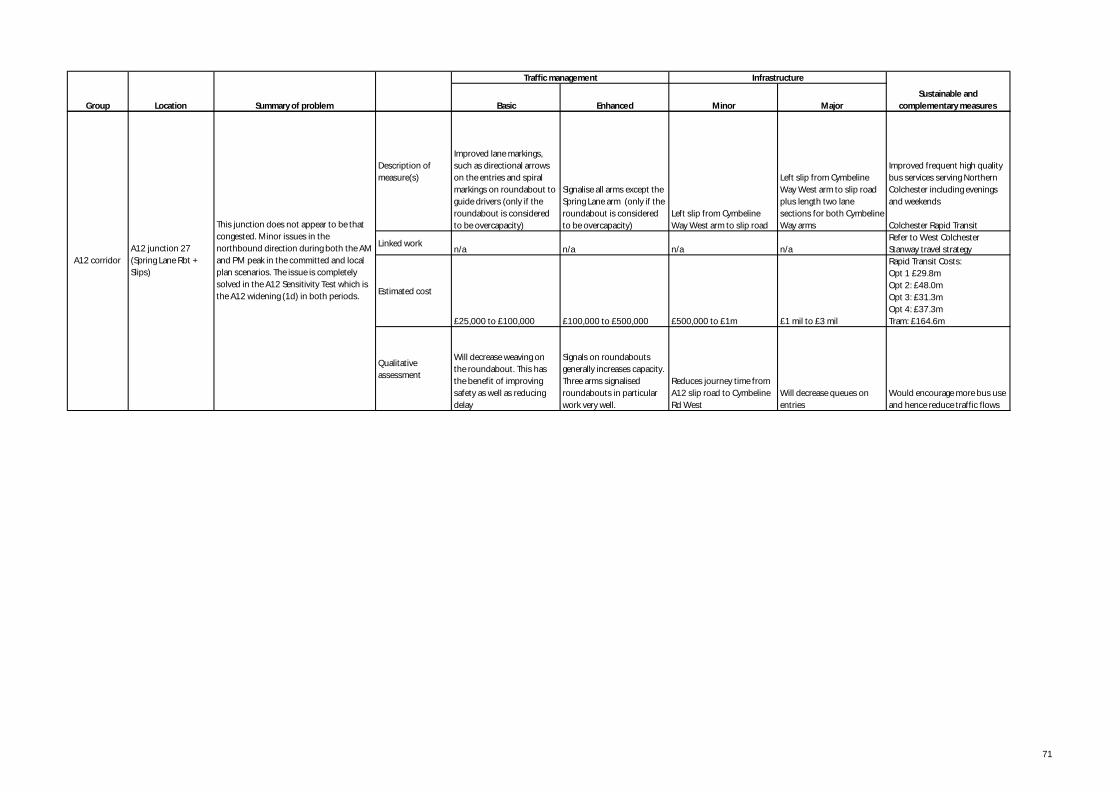
Basic Enhanced Minor MajorGroup
Infrastructure
Sustainable andcomplementary measuresLocation Summary of problem
Traffic management
Description ofmeasure(s)
Improved lane markings,such as directional arrowson the entries and spiralmarkings on roundabout toguide drivers (only if theroundabout is consideredto be overcapacity)
Signalise all arms except theSpring Lane arm (only if theroundabout is consideredto be overcapacity)
Left slip from CymbelineWay West arm to slip road
Left slip from CymbelineWay West arm to slip roadplus length two lanesections for both CymbelineWay arms
Improved frequent high qualitybus services serving NorthernColchester including eveningsand weekends
Colchester Rapid Transit
Linked workn/a n/a n/a n/a
Refer to West ColchesterStanway travel strategy
Estimated cost
£25,000 to £100,000 £100,000 to £500,000 £500,000 to £1m £1 mil to £3 mil
Rapid Transit Costs:Opt 1 £29.8mOpt 2: £48.0mOpt 3: £31.3mOpt 4: £37.3mTram: £164.6m
Qualitativeassessment
Will decrease weaving onthe roundabout. This hasthe benefit of improvingsafety as well as reducingdelay
Signals on roundaboutsgenerally increases capacity.Three arms signalisedroundabouts in particularwork very well.
Reduces journey time fromA12 slip road to CymbelineRd West
Will decrease queues onentries
Would encourage more bus useand hence reduce traffic flows
A12 corridorA12 junction 27(Spring Lane Rbt +Slips)
This junction does not appear to be thatcongested. Minor issues in thenorthbound direction during both the AMand PM peak in the committed and localplan scenarios. The issue is completelysolved in the A12 Sensitivity Test which isthe A12 widening (1d) in both periods.
71
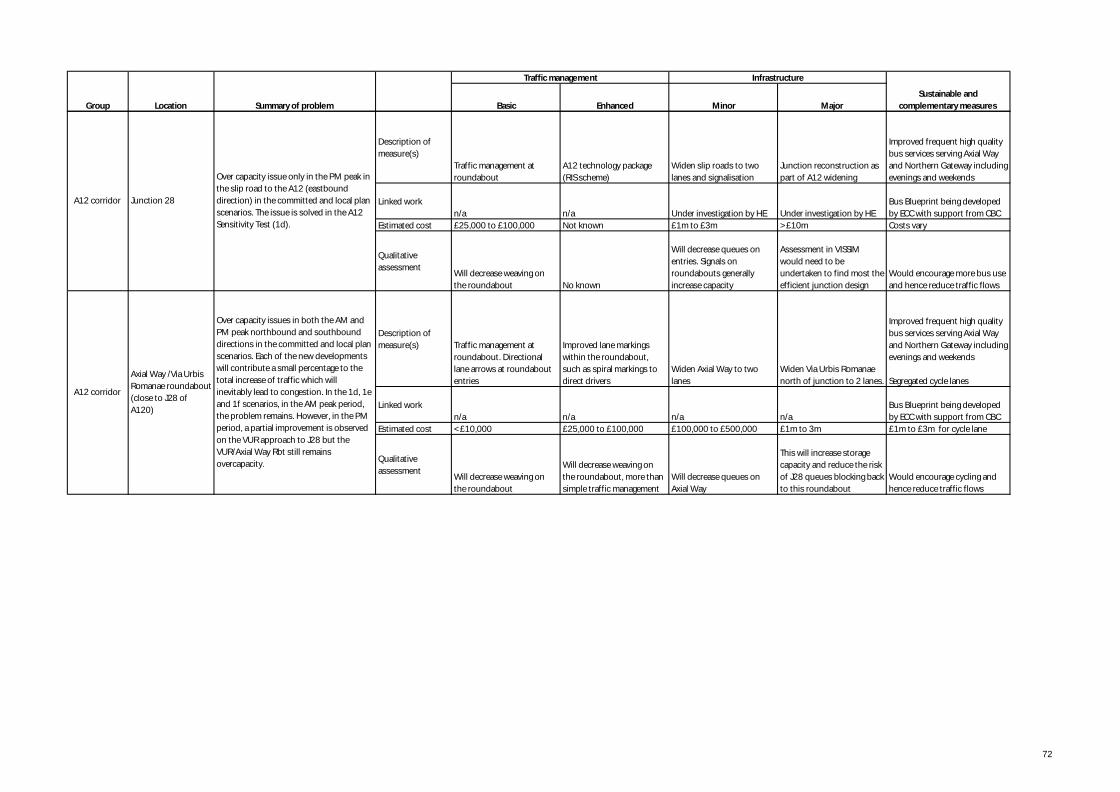
Basic Enhanced Minor MajorGroup
Infrastructure
Sustainable andcomplementary measuresLocation Summary of problem
Traffic management
Description ofmeasure(s)
Traffic management atroundabout
A12 technology package(RIS scheme)
Widen slip roads to twolanes and signalisation
Junction reconstruction aspart of A12 widening
Improved frequent high qualitybus services serving Axial Wayand Northern Gateway includingevenings and weekends
Linked workn/a n/a Under investigation by HE Under investigation by HE
Bus Blueprint being developedby ECC with support from CBC
Estimated cost £25,000 to £100,000 Not known £1m to £3m > £10m Costs vary
Qualitativeassessment
Will decrease weaving onthe roundabout No known
Will decrease queues onentries. Signals onroundabouts generallyincrease capacity
Assessment in VISSIMwould need to beundertaken to find most theefficient junction design
Would encourage more bus useand hence reduce traffic flows
Description ofmeasure(s) Traffic management at
roundabout. Directionallane arrows at roundaboutentries
Improved lane markingswithin the roundabout,such as spiral markings todirect drivers
Widen Axial Way to twolanes
Widen Via Urbis Romanaenorth of junction to 2 lanes.
Improved frequent high qualitybus services serving Axial Wayand Northern Gateway includingevenings and weekends
Segregated cycle lanes
Linked workn/a n/a n/a n/a
Bus Blueprint being developedby ECC with support from CBC
Estimated cost < £10,000 £25,000 to £100,000 £100,000 to £500,000 £1m to 3m £1m to £3m for cycle lane
Qualitativeassessment
Will decrease weaving onthe roundabout
Will decrease weaving onthe roundabout, more thansimple traffic management
Will decrease queues onAxial Way
This will increase storagecapacity and reduce the riskof J28 queues blocking backto this roundabout
Would encourage cycling andhence reduce traffic flows
A12 corridor
A12 corridor
Junction 28
Over capacity issues in both the AM andPM peak northbound and southbounddirections in the committed and local planscenarios. Each of the new developmentswill contribute a small percentage to thetotal increase of traffic which willinevitably lead to congestion. In the 1d, 1eand 1f scenarios, in the AM peak period,the problem remains. However, in the PMperiod, a partial improvement is observedon the VUR approach to J28 but theVUR/Axial Way Rbt still remainsovercapacity.
Axial Way /Via UrbisRomanae roundabout(close to J28 ofA120)
Over capacity issue only in the PM peak inthe slip road to the A12 (eastbounddirection) in the committed and local planscenarios. The issue is solved in the A12Sensitivity Test (1d).
72
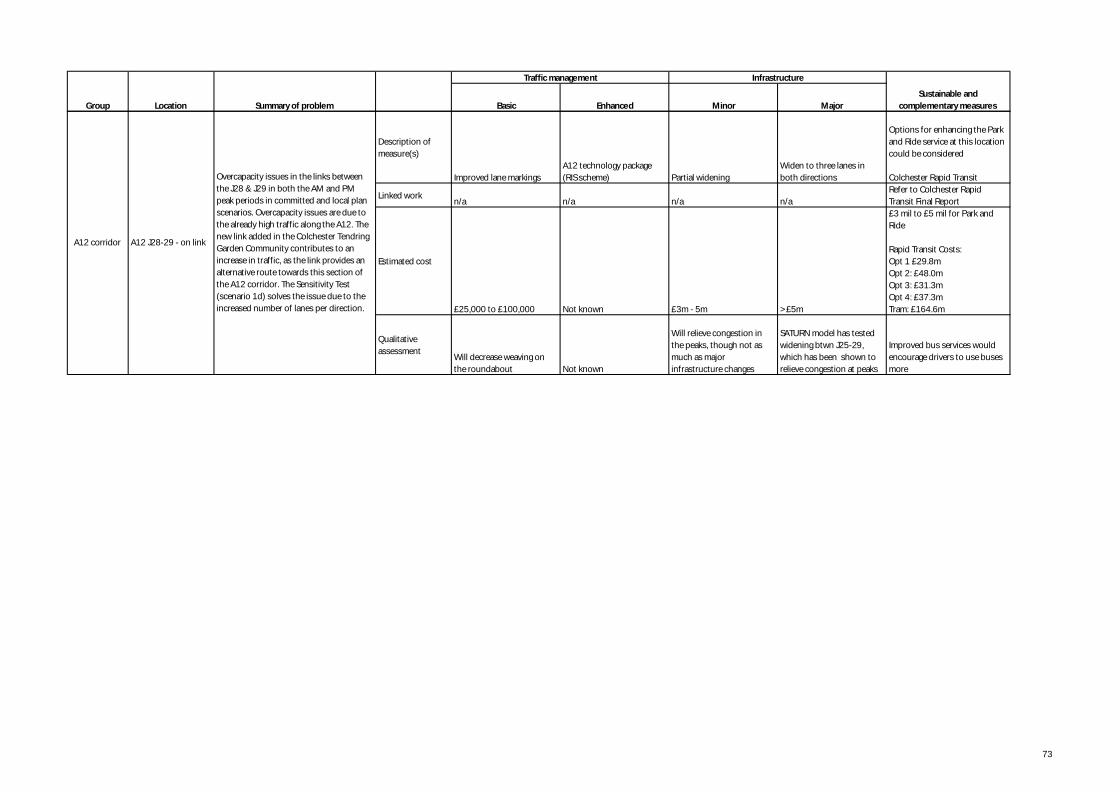
Basic Enhanced Minor MajorGroup
Infrastructure
Sustainable andcomplementary measuresLocation Summary of problem
Traffic management
Description ofmeasure(s)
Improved lane markingsA12 technology package(RIS scheme) Partial widening
Widen to three lanes inboth directions
Options for enhancing the Parkand Ride service at this locationcould be considered
Colchester Rapid Transit
Linked workn/a n/a n/a n/a
Refer to Colchester RapidTransit Final Report
Estimated cost
£25,000 to £100,000 Not known £3m - 5m > £5m
£3 mil to £5 mil for Park andRide
Rapid Transit Costs:Opt 1 £29.8mOpt 2: £48.0mOpt 3: £31.3mOpt 4: £37.3mTram: £164.6m
Qualitativeassessment
Will decrease weaving onthe roundabout Not known
Will relieve congestion inthe peaks, though not asmuch as majorinfrastructure changes
SATURN model has testedwidening btwn J25-29,which has been shown torelieve congestion at peaks
Improved bus services wouldencourage drivers to use busesmore
A12 J28-29 - on link
Overcapacity issues in the links betweenthe J28 & J29 in both the AM and PMpeak periods in committed and local planscenarios. Overcapacity issues are due tothe already high traffic along the A12. Thenew link added in the Colchester TendringGarden Community contributes to anincrease in traffic, as the link provides analternative route towards this section ofthe A12 corridor. The Sensitivity Test(scenario 1d) solves the issue due to theincreased number of lanes per direction.
A12 corridor
73
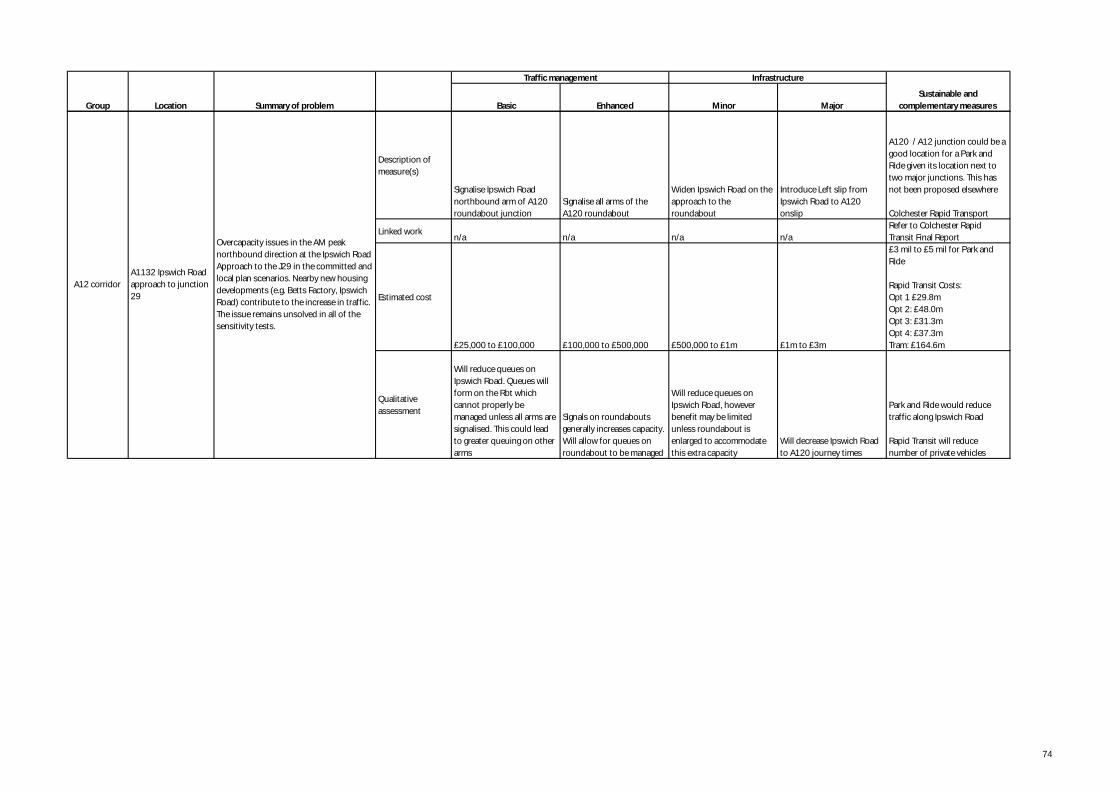
Basic Enhanced Minor MajorGroup
Infrastructure
Sustainable andcomplementary measuresLocation Summary of problem
Traffic management
Description ofmeasure(s)
Signalise Ipswich Roadnorthbound arm of A120roundabout junction
Signalise all arms of theA120 roundabout
Widen Ipswich Road on theapproach to theroundabout
Introduce Left slip fromIpswich Road to A120onslip
A120 / A12 junction could be agood location for a Park andRide given its location next totwo major junctions. This hasnot been proposed elsewhere
Colchester Rapid Transport
Linked workn/a n/a n/a n/a
Refer to Colchester RapidTransit Final Report
Estimated cost
£25,000 to £100,000 £100,000 to £500,000 £500,000 to £1m £1m to £3m
£3 mil to £5 mil for Park andRide
Rapid Transit Costs:Opt 1 £29.8mOpt 2: £48.0mOpt 3: £31.3mOpt 4: £37.3mTram: £164.6m
Qualitativeassessment
Will reduce queues onIpswich Road. Queues willform on the Rbt whichcannot properly bemanaged unless all arms aresignalised. This could leadto greater queuing on otherarms
Signals on roundaboutsgenerally increases capacity.Will allow for queues onroundabout to be managed
Will reduce queues onIpswich Road, howeverbenefit may be limitedunless roundabout isenlarged to accommodatethis extra capacity
Will decrease Ipswich Roadto A120 journey times
Park and Ride would reducetraffic along Ipswich Road
Rapid Transit will reducenumber of private vehicles
A12 corridorA1132 Ipswich Roadapproach to junction29
Overcapacity issues in the AM peaknorthbound direction at the Ipswich RoadApproach to the J29 in the committed andlocal plan scenarios. Nearby new housingdevelopments (e.g. Betts Factory, IpswichRoad) contribute to the increase in traffic.The issue remains unsolved in all of thesensitivity tests.
74
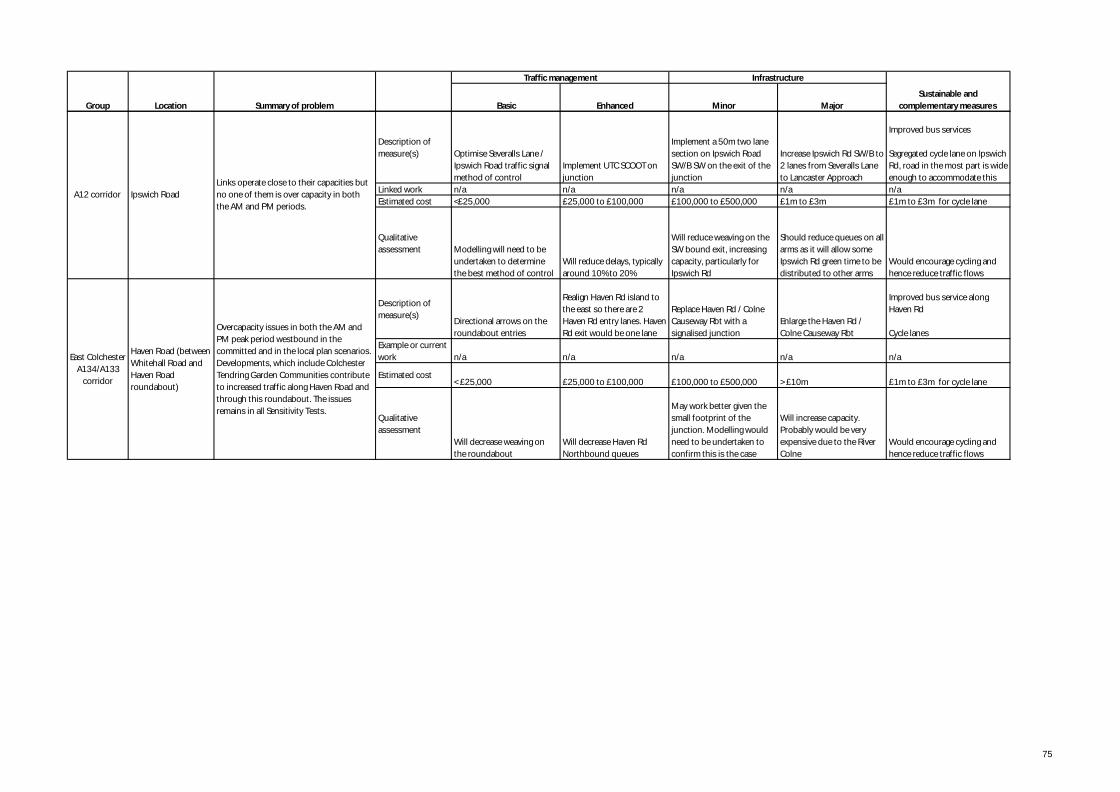
Basic Enhanced Minor MajorGroup
Infrastructure
Sustainable andcomplementary measuresLocation Summary of problem
Traffic management
Description ofmeasure(s) Optimise Severalls Lane /
Ipswich Road traffic signalmethod of control
Implement UTC SCOOT onjunction
Implement a 50m two lanesection on Ipswich RoadSW/B SW on the exit of thejunction
Increase Ipswich Rd SW/B to2 lanes from Severalls Laneto Lancaster Approach
Improved bus services
Segregated cycle lane on IpswichRd, road in the most part is wideenough to accommodate this
Linked work n/a n/a n/a n/a n/aEstimated cost <£25,000 £25,000 to £100,000 £100,000 to £500,000 £1m to £3m £1m to £3m for cycle lane
Qualitativeassessment Modelling will need to be
undertaken to determinethe best method of control
Will reduce delays, typicallyaround 10% to 20%
Will reduce weaving on theSW bound exit, increasingcapacity, particularly forIpswich Rd
Should reduce queues on allarms as it will allow someIpswich Rd green time to bedistributed to other arms
Would encourage cycling andhence reduce traffic flows
Description ofmeasure(s)
Directional arrows on theroundabout entries
Realign Haven Rd island tothe east so there are 2Haven Rd entry lanes. HavenRd exit would be one lane
Replace Haven Rd / ColneCauseway Rbt with asignalised junction
Enlarge the Haven Rd /Colne Causeway Rbt
Improved bus service alongHaven Rd
Cycle lanesExample or currentwork n/a n/a n/a n/a n/a
Estimated cost< £25,000 £25,000 to £100,000 £100,000 to £500,000 > £10m £1m to £3m for cycle lane
Qualitativeassessment
Will decrease weaving onthe roundabout
Will decrease Haven RdNorthbound queues
May work better given thesmall footprint of thejunction. Modelling wouldneed to be undertaken toconfirm this is the case
Will increase capacity.Probably would be veryexpensive due to the RiverColne
Would encourage cycling andhence reduce traffic flows
Links operate close to their capacities butno one of them is over capacity in boththe AM and PM periods.
A12 corridor
Haven Road (betweenWhitehall Road andHaven Roadroundabout)
Ipswich Road
East ColchesterA134/A133
corridor
Overcapacity issues in both the AM andPM peak period westbound in thecommitted and in the local plan scenarios.Developments, which include ColchesterTendring Garden Communities contributeto increased traffic along Haven Road andthrough this roundabout. The issuesremains in all Sensitivity Tests.
75
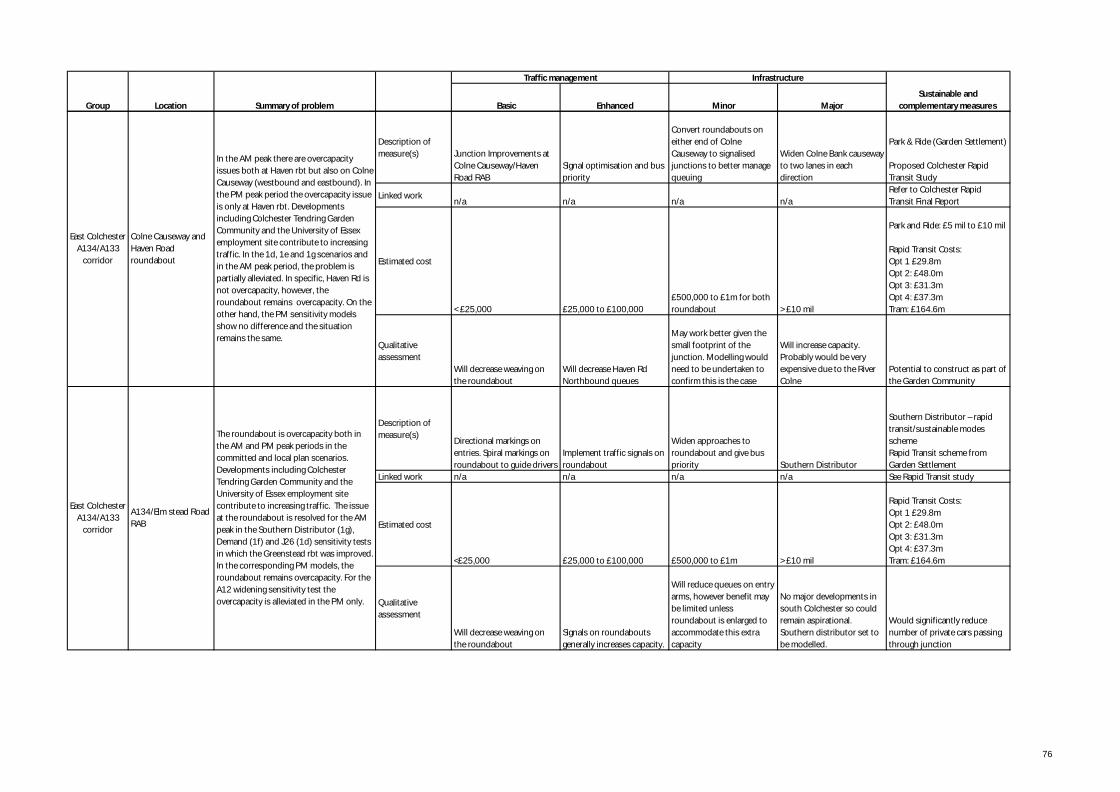
Basic Enhanced Minor MajorGroup
Infrastructure
Sustainable andcomplementary measuresLocation Summary of problem
Traffic management
Description ofmeasure(s) Junction Improvements at
Colne Causeway/HavenRoad RAB
Signal optimisation and buspriority
Convert roundabouts oneither end of ColneCauseway to signalisedjunctions to better managequeuing
Widen Colne Bank causewayto two lanes in eachdirection
Park & Ride (Garden Settlement)
Proposed Colchester RapidTransit Study
Linked workn/a n/a n/a n/a
Refer to Colchester RapidTransit Final Report
Estimated cost
< £25,000 £25,000 to £100,000£500,000 to £1m for bothroundabout > £10 mil
Park and Ride: £5 mil to £10 mil
Rapid Transit Costs:Opt 1 £29.8mOpt 2: £48.0mOpt 3: £31.3mOpt 4: £37.3mTram: £164.6m
Qualitativeassessment
Will decrease weaving onthe roundabout
Will decrease Haven RdNorthbound queues
May work better given thesmall footprint of thejunction. Modelling wouldneed to be undertaken toconfirm this is the case
Will increase capacity.Probably would be veryexpensive due to the RiverColne
Potential to construct as part ofthe Garden Community
Description ofmeasure(s)
Directional markings onentries. Spiral markings onroundabout to guide drivers
Implement traffic signals onroundabout
Widen approaches toroundabout and give buspriority Southern Distributor
Southern Distributor – rapidtransit/sustainable modesschemeRapid Transit scheme fromGarden Settlement
Linked work n/a n/a n/a n/a See Rapid Transit study
Estimated cost
<£25,000 £25,000 to £100,000 £500,000 to £1m > £10 mil
Rapid Transit Costs:Opt 1 £29.8mOpt 2: £48.0mOpt 3: £31.3mOpt 4: £37.3mTram: £164.6m
Qualitativeassessment
Will decrease weaving onthe roundabout
Signals on roundaboutsgenerally increases capacity.
Will reduce queues on entryarms, however benefit maybe limited unlessroundabout is enlarged toaccommodate this extracapacity
No major developments insouth Colchester so couldremain aspirational.Southern distributor set tobe modelled.
Would significantly reducenumber of private cars passingthrough junction
Colne Causeway andHaven Roadroundabout
A134/Elm stead RoadRAB
In the AM peak there are overcapacityissues both at Haven rbt but also on ColneCauseway (westbound and eastbound). Inthe PM peak period the overcapacity issueis only at Haven rbt. Developmentsincluding Colchester Tendring GardenCommunity and the University of Essexemployment site contribute to increasingtraffic. In the 1d, 1e and 1g scenarios andin the AM peak period, the problem ispartially alleviated. In specific, Haven Rd isnot overcapacity, however, theroundabout remains overcapacity. On theother hand, the PM sensitivity modelsshow no difference and the situationremains the same.
East ColchesterA134/A133
corridor
East ColchesterA134/A133
corridor
The roundabout is overcapacity both inthe AM and PM peak periods in thecommitted and local plan scenarios.Developments including ColchesterTendring Garden Community and theUniversity of Essex employment sitecontribute to increasing traffic. The issueat the roundabout is resolved for the AMpeak in the Southern Distributor (1g),Demand (1f) and J26 (1d) sensitivity testsin which the Greenstead rbt was improved.In the corresponding PM models, theroundabout remains overcapacity. For theA12 widening sensitivity test theovercapacity is alleviated in the PM only.
76
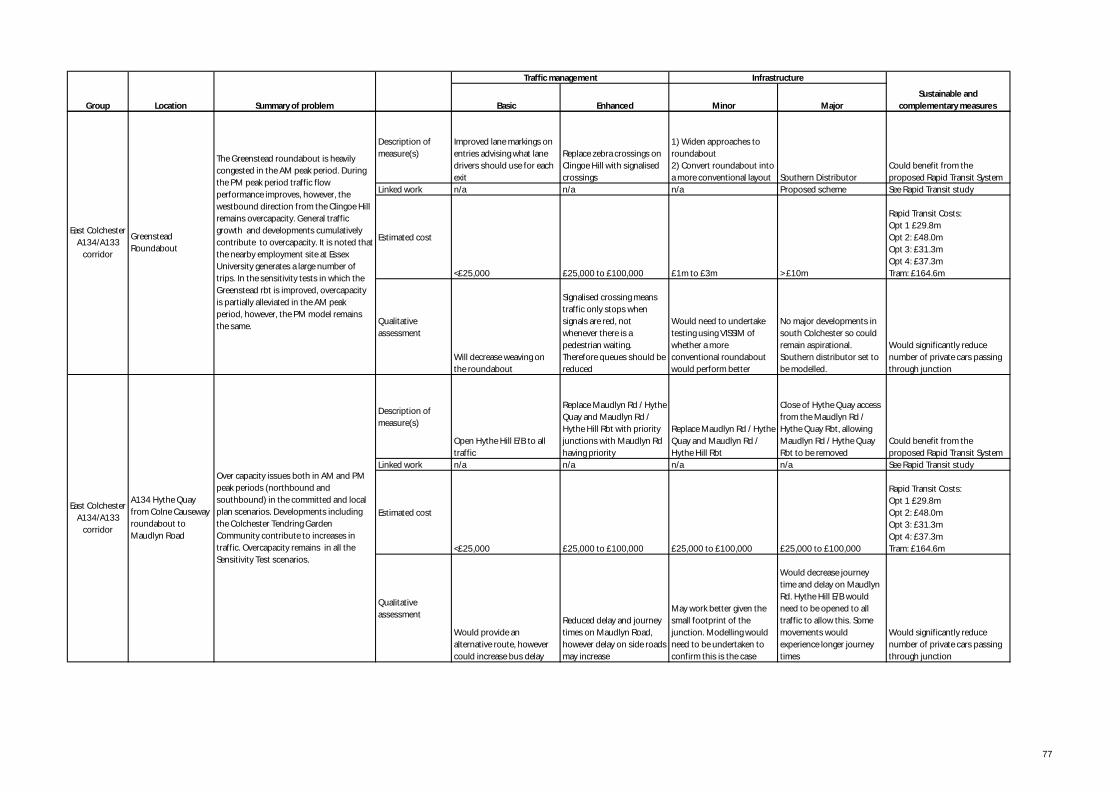
Basic Enhanced Minor MajorGroup
Infrastructure
Sustainable andcomplementary measuresLocation Summary of problem
Traffic management
Description ofmeasure(s)
Improved lane markings onentries advising what lanedrivers should use for eachexit
Replace zebra crossings onClingoe Hill with signalisedcrossings
1) Widen approaches toroundabout2) Convert roundabout intoa more conventional layout Southern Distributor
Could benefit from theproposed Rapid Transit System
Linked work n/a n/a n/a Proposed scheme See Rapid Transit study
Estimated cost
<£25,000 £25,000 to £100,000 £1m to £3m > £10m
Rapid Transit Costs:Opt 1 £29.8mOpt 2: £48.0mOpt 3: £31.3mOpt 4: £37.3mTram: £164.6m
Qualitativeassessment
Will decrease weaving onthe roundabout
Signalised crossing meanstraffic only stops whensignals are red, notwhenever there is apedestrian waiting.Therefore queues should bereduced
Would need to undertaketesting using VISSIM ofwhether a moreconventional roundaboutwould perform better
No major developments insouth Colchester so couldremain aspirational.Southern distributor set tobe modelled.
Would significantly reducenumber of private cars passingthrough junction
Description ofmeasure(s)
Open Hythe Hill E/B to alltraffic
Replace Maudlyn Rd / HytheQuay and Maudlyn Rd /Hythe Hill Rbt with priorityjunctions with Maudlyn Rdhaving priority
Replace Maudlyn Rd / HytheQuay and Maudlyn Rd /Hythe Hill Rbt
Close of Hythe Quay accessfrom the Maudlyn Rd /Hythe Quay Rbt, allowingMaudlyn Rd / Hythe QuayRbt to be removed
Could benefit from theproposed Rapid Transit System
Linked work n/a n/a n/a n/a See Rapid Transit study
Estimated cost
<£25,000 £25,000 to £100,000 £25,000 to £100,000 £25,000 to £100,000
Rapid Transit Costs:Opt 1 £29.8mOpt 2: £48.0mOpt 3: £31.3mOpt 4: £37.3mTram: £164.6m
Qualitativeassessment
Would provide analternative route, howevercould increase bus delay
Reduced delay and journeytimes on Maudlyn Road,however delay on side roadsmay increase
May work better given thesmall footprint of thejunction. Modelling wouldneed to be undertaken toconfirm this is the case
Would decrease journeytime and delay on MaudlynRd. Hythe Hill E/B wouldneed to be opened to alltraffic to allow this. Somemovements wouldexperience longer journeytimes
Would significantly reducenumber of private cars passingthrough junction
Over capacity issues both in AM and PMpeak periods (northbound andsouthbound) in the committed and localplan scenarios. Developments includingthe Colchester Tendring GardenCommunity contribute to increases intraffic. Overcapacity remains in all theSensitivity Test scenarios.
East ColchesterA134/A133
corridor
East ColchesterA134/A133
corridor
The Greenstead roundabout is heavilycongested in the AM peak period. Duringthe PM peak period traffic flowperformance improves, however, thewestbound direction from the Clingoe Hillremains overcapacity. General trafficgrowth and developments cumulativelycontribute to overcapacity. It is noted thatthe nearby employment site at EssexUniversity generates a large number oftrips. In the sensitivity tests in which theGreenstead rbt is improved, overcapacityis partially alleviated in the AM peakperiod, however, the PM model remainsthe same.
GreensteadRoundabout
A134 Hythe Quayfrom Colne Causewayroundabout toMaudlyn Road
77
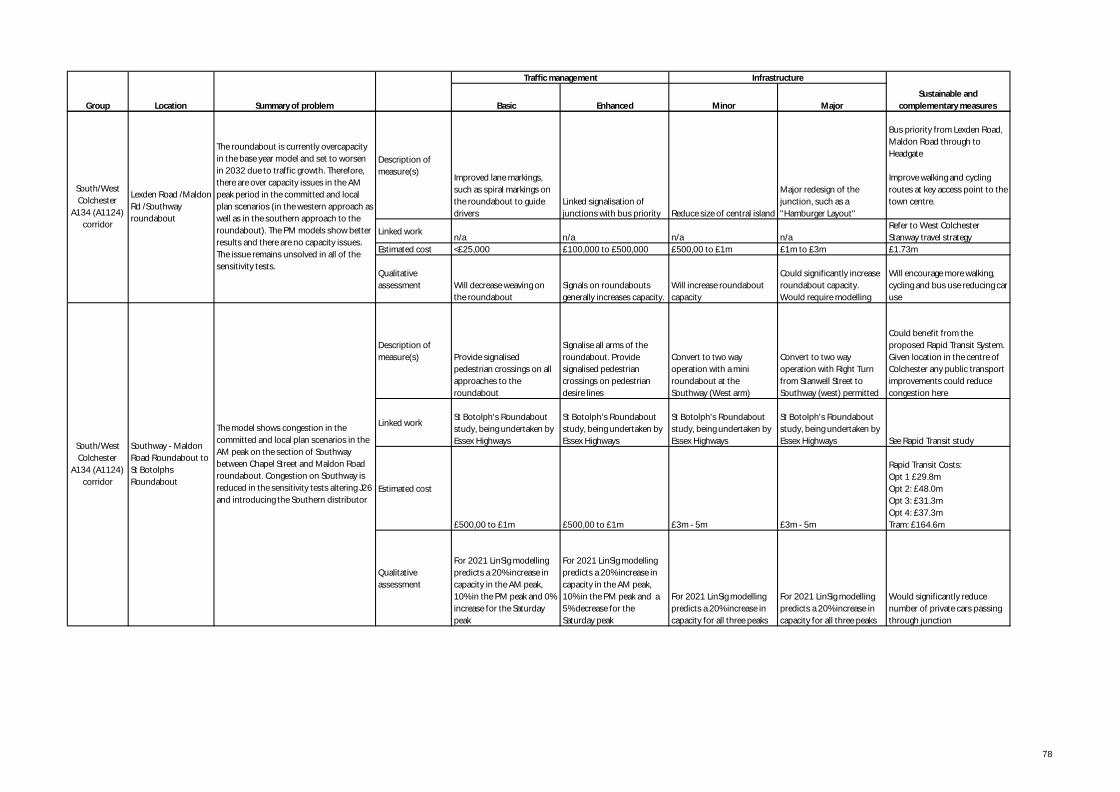
Basic Enhanced Minor MajorGroup
Infrastructure
Sustainable andcomplementary measuresLocation Summary of problem
Traffic management
Description ofmeasure(s)
Improved lane markings,such as spiral markings onthe roundabout to guidedrivers
Linked signalisation ofjunctions with bus priority Reduce size of central island
Major redesign of thejunction, such as a"Hamburger Layout"
Bus priority from Lexden Road,Maldon Road through toHeadgate
Improve walking and cyclingroutes at key access point to thetown centre.
Linked workn/a n/a n/a n/a
Refer to West ColchesterStanway travel strategy
Estimated cost <£25,000 £100,000 to £500,000 £500,00 to £1m £1m to £3m £1.73m
Qualitativeassessment Will decrease weaving on
the roundaboutSignals on roundaboutsgenerally increases capacity.
Will increase roundaboutcapacity
Could significantly increaseroundabout capacity.Would require modelling
Will encourage more walking,cycling and bus use reducing caruse
Description ofmeasure(s) Provide signalised
pedestrian crossings on allapproaches to theroundabout
Signalise all arms of theroundabout. Providesignalised pedestriancrossings on pedestriandesire lines
Convert to two wayoperation with a miniroundabout at theSouthway (West arm)
Convert to two wayoperation with Right Turnfrom Stanwell Street toSouthway (west) permitted
Could benefit from theproposed Rapid Transit System.Given location in the centre ofColchester any public transportimprovements could reducecongestion here
Linked workSt Botolph's Roundaboutstudy, being undertaken byEssex Highways
St Botolph's Roundaboutstudy, being undertaken byEssex Highways
St Botolph's Roundaboutstudy, being undertaken byEssex Highways
St Botolph's Roundaboutstudy, being undertaken byEssex Highways See Rapid Transit study
Estimated cost
£500,00 to £1m £500,00 to £1m £3m - 5m £3m - 5m
Rapid Transit Costs:Opt 1 £29.8mOpt 2: £48.0mOpt 3: £31.3mOpt 4: £37.3mTram: £164.6m
Qualitativeassessment
For 2021 LinSig modellingpredicts a 20% increase incapacity in the AM peak,10% in the PM peak and 0%increase for the Saturdaypeak
For 2021 LinSig modellingpredicts a 20% increase incapacity in the AM peak,10% in the PM peak and a5% decrease for theSaturday peak
For 2021 LinSig modellingpredicts a 20% increase incapacity for all three peaks
For 2021 LinSig modellingpredicts a 20% increase incapacity for all three peaks
Would significantly reducenumber of private cars passingthrough junction
Lexden Road /MaldonRd /Southwayroundabout
The roundabout is currently overcapacityin the base year model and set to worsenin 2032 due to traffic growth. Therefore,there are over capacity issues in the AMpeak period in the committed and localplan scenarios (in the western approach aswell as in the southern approach to theroundabout). The PM models show betterresults and there are no capacity issues.The issue remains unsolved in all of thesensitivity tests.
South/WestColchester
A134 (A1124)corridor
South/WestColchester
A134 (A1124)corridor
Southway - MaldonRoad Roundabout toSt BotolphsRoundabout
The model shows congestion in thecommitted and local plan scenarios in theAM peak on the section of Southwaybetween Chapel Street and Maldon Roadroundabout. Congestion on Southway isreduced in the sensitivity tests altering J26and introducing the Southern distributor
78
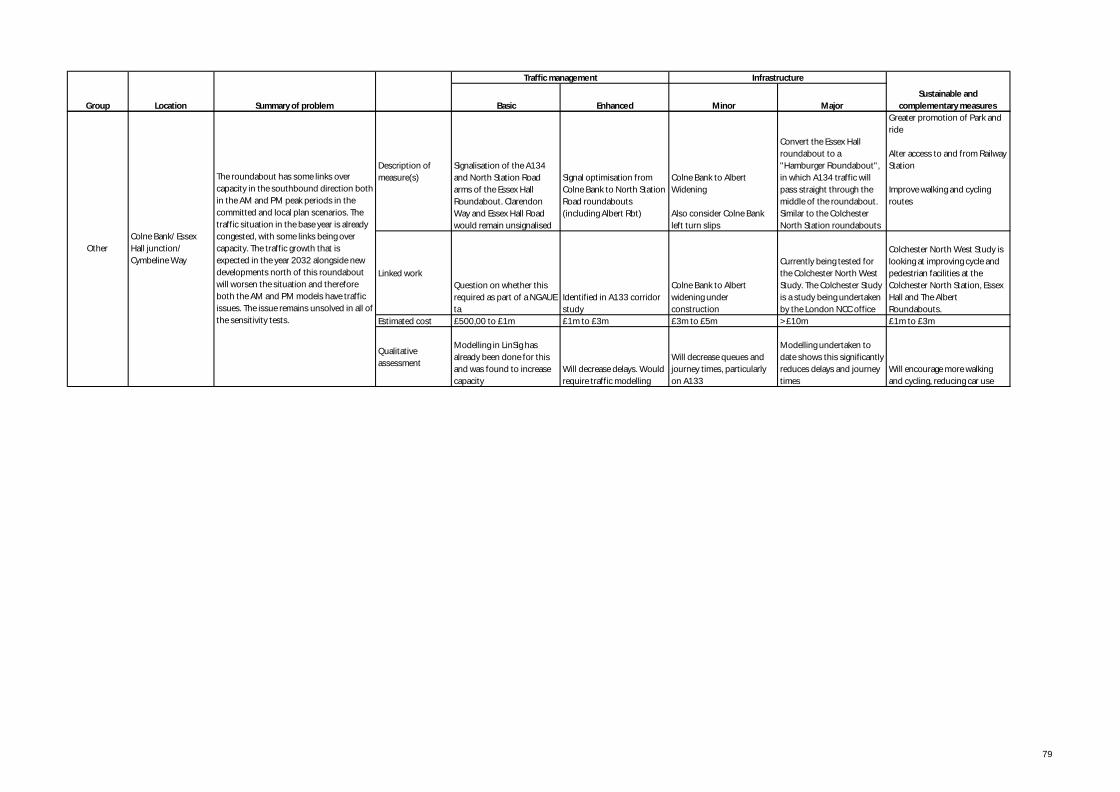
Basic Enhanced Minor MajorGroup
Infrastructure
Sustainable andcomplementary measuresLocation Summary of problem
Traffic management
Description ofmeasure(s)
Signalisation of the A134and North Station Roadarms of the Essex HallRoundabout. ClarendonWay and Essex Hall Roadwould remain unsignalised
Signal optimisation fromColne Bank to North StationRoad roundabouts(including Albert Rbt)
Colne Bank to AlbertWidening
Also consider Colne Bankleft turn slips
Convert the Essex Hallroundabout to a"Hamburger Roundabout",in which A134 traffic willpass straight through themiddle of the roundabout.Similar to the ColchesterNorth Station roundabouts
Greater promotion of Park andride
Alter access to and from RailwayStation
Improve walking and cyclingroutes
Linked workQuestion on whether thisrequired as part of a NGAUEta
Identified in A133 corridorstudy
Colne Bank to Albertwidening underconstruction
Currently being tested forthe Colchester North WestStudy. The Colchester Studyis a study being undertakenby the London NCC office
Colchester North West Study islooking at improving cycle andpedestrian facilities at theColchester North Station, EssexHall and The AlbertRoundabouts.
Estimated cost £500,00 to £1m £1m to £3m £3m to £5m > £10m £1m to £3m
Qualitativeassessment
Modelling in LinSig hasalready been done for thisand was found to increasecapacity
Will decrease delays. Wouldrequire traffic modelling
Will decrease queues andjourney times, particularlyon A133
Modelling undertaken todate shows this significantlyreduces delays and journeytimes
Will encourage more walkingand cycling, reducing car use
The roundabout has some links overcapacity in the southbound direction bothin the AM and PM peak periods in thecommitted and local plan scenarios. Thetraffic situation in the base year is alreadycongested, with some links being overcapacity. The traffic growth that isexpected in the year 2032 alongside newdevelopments north of this roundaboutwill worsen the situation and thereforeboth the AM and PM models have trafficissues. The issue remains unsolved in all ofthe sensitivity tests.
OtherColne Bank/ EssexHall junction/Cymbeline Way
79
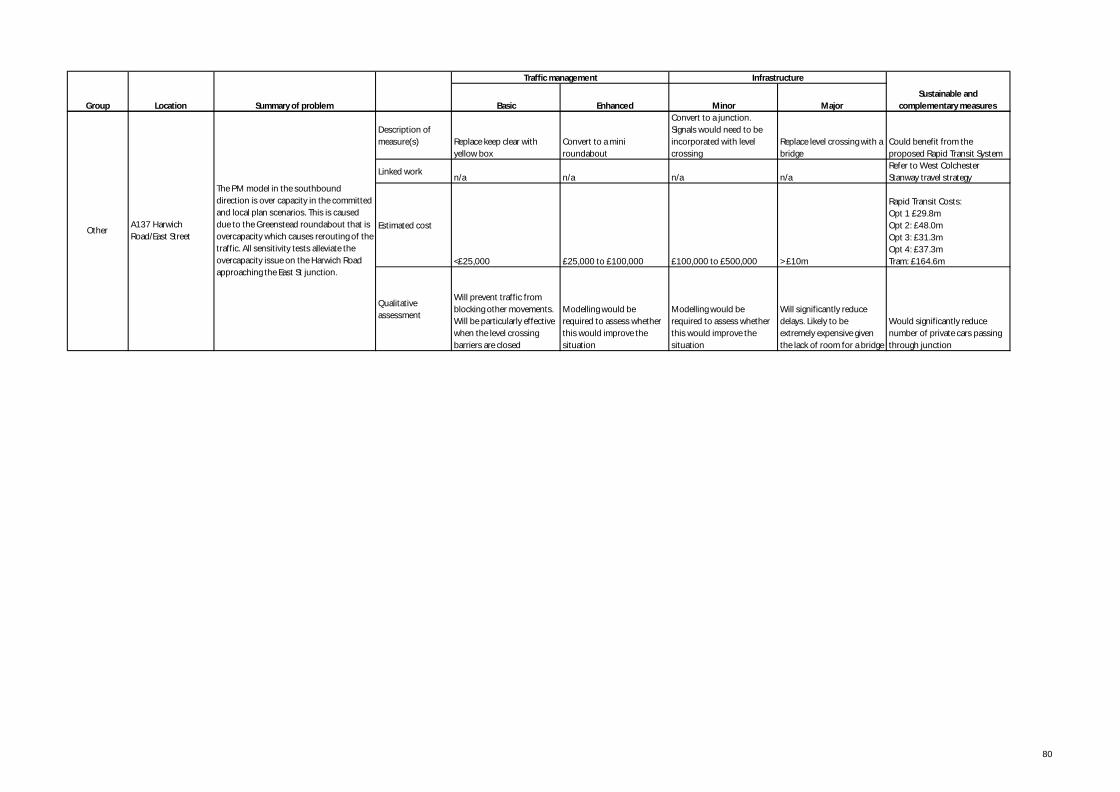
Basic Enhanced Minor MajorGroup
Infrastructure
Sustainable andcomplementary measuresLocation Summary of problem
Traffic management
Description ofmeasure(s) Replace keep clear with
yellow boxConvert to a miniroundabout
Convert to a junction.Signals would need to beincorporated with levelcrossing
Replace level crossing with abridge
Could benefit from theproposed Rapid Transit System
Linked workn/a n/a n/a n/a
Refer to West ColchesterStanway travel strategy
Estimated cost
<£25,000 £25,000 to £100,000 £100,000 to £500,000 > £10m
Rapid Transit Costs:Opt 1 £29.8mOpt 2: £48.0mOpt 3: £31.3mOpt 4: £37.3mTram: £164.6m
Qualitativeassessment
Will prevent traffic fromblocking other movements.Will be particularly effectivewhen the level crossingbarriers are closed
Modelling would berequired to assess whetherthis would improve thesituation
Modelling would berequired to assess whetherthis would improve thesituation
Will significantly reducedelays. Likely to beextremely expensive giventhe lack of room for a bridge
Would significantly reducenumber of private cars passingthrough junction
The PM model in the southbounddirection is over capacity in the committedand local plan scenarios. This is causeddue to the Greenstead roundabout that isovercapacity which causes rerouting of thetraffic. All sensitivity tests alleviate theovercapacity issue on the Harwich Roadapproaching the East St junction.
OtherA137 HarwichRoad/East Street
80
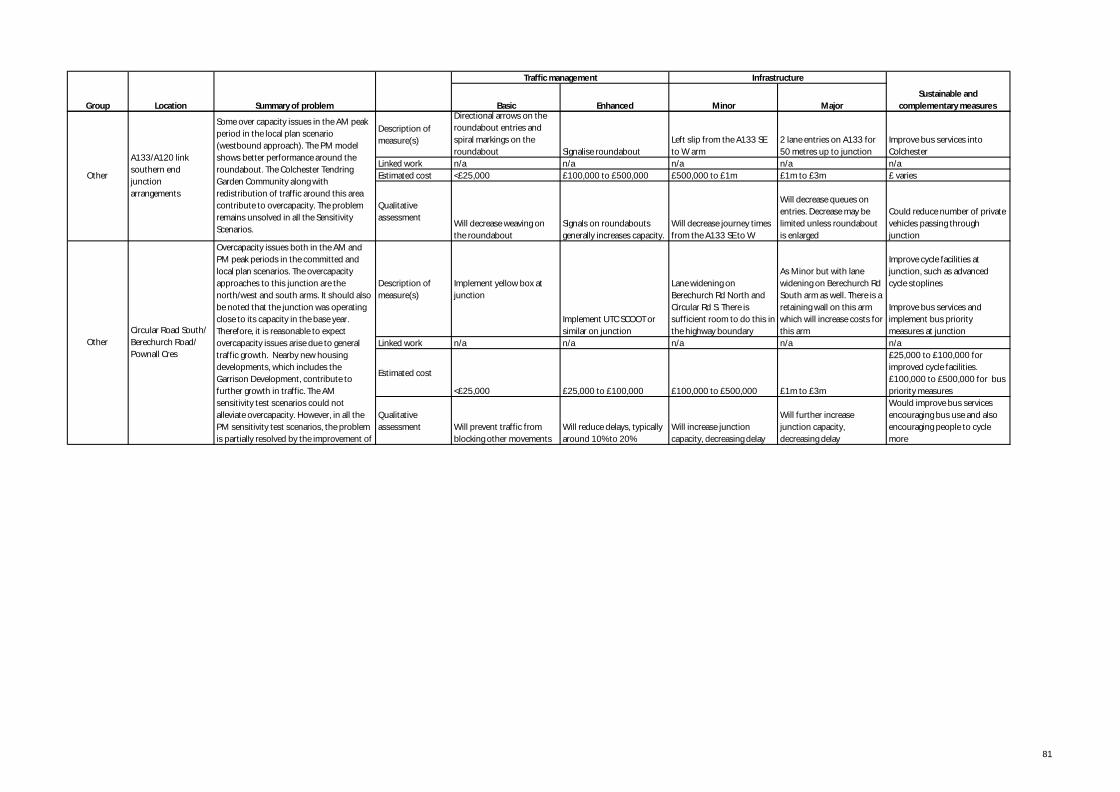
Basic Enhanced Minor MajorGroup
Infrastructure
Sustainable andcomplementary measuresLocation Summary of problem
Traffic management
Description ofmeasure(s)
Directional arrows on theroundabout entries andspiral markings on theroundabout Signalise roundabout
Left slip from the A133 SEto W arm
2 lane entries on A133 for50 metres up to junction
Improve bus services intoColchester
Linked work n/a n/a n/a n/a n/aEstimated cost <£25,000 £100,000 to £500,000 £500,000 to £1m £1m to £3m £ varies
Qualitativeassessment
Will decrease weaving onthe roundabout
Signals on roundaboutsgenerally increases capacity.
Will decrease journey timesfrom the A133 SE to W
Will decrease queues onentries. Decrease may belimited unless roundaboutis enlarged
Could reduce number of privatevehicles passing throughjunction
Description ofmeasure(s)
Implement yellow box atjunction
Implement UTC SCOOT orsimilar on junction
Lane widening onBerechurch Rd North andCircular Rd S. There issufficient room to do this inthe highway boundary
As Minor but with lanewidening on Berechurch RdSouth arm as well. There is aretaining wall on this armwhich will increase costs forthis arm
Improve cycle facilities atjunction, such as advancedcycle stoplines
Improve bus services andimplement bus prioritymeasures at junction
Linked work n/a n/a n/a n/a n/a
Estimated cost
<£25,000 £25,000 to £100,000 £100,000 to £500,000 £1m to £3m
£25,000 to £100,000 forimproved cycle facilities.£100,000 to £500,000 for buspriority measures
Qualitativeassessment Will prevent traffic from
blocking other movementsWill reduce delays, typicallyaround 10% to 20%
Will increase junctioncapacity, decreasing delay
Will further increasejunction capacity,decreasing delay
Would improve bus servicesencouraging bus use and alsoencouraging people to cyclemore
OtherCircular Road South/Berechurch Road/Pownall Cres
Overcapacity issues both in the AM andPM peak periods in the committed andlocal plan scenarios. The overcapacityapproaches to this junction are thenorth/west and south arms. It should alsobe noted that the junction was operatingclose to its capacity in the base year.Therefore, it is reasonable to expectovercapacity issues arise due to generaltraffic growth. Nearby new housingdevelopments, which includes theGarrison Development, contribute tofurther growth in traffic. The AMsensitivity test scenarios could notalleviate overcapacity. However, in all thePM sensitivity test scenarios, the problemis partially resolved by the improvement of
Other
A133/A120 linksouthern endjunctionarrangements
Some over capacity issues in the AM peakperiod in the local plan scenario(westbound approach). The PM modelshows better performance around theroundabout. The Colchester TendringGarden Community along withredistribution of traffic around this areacontribute to overcapacity. The problemremains unsolved in all the SensitivityScenarios.
81
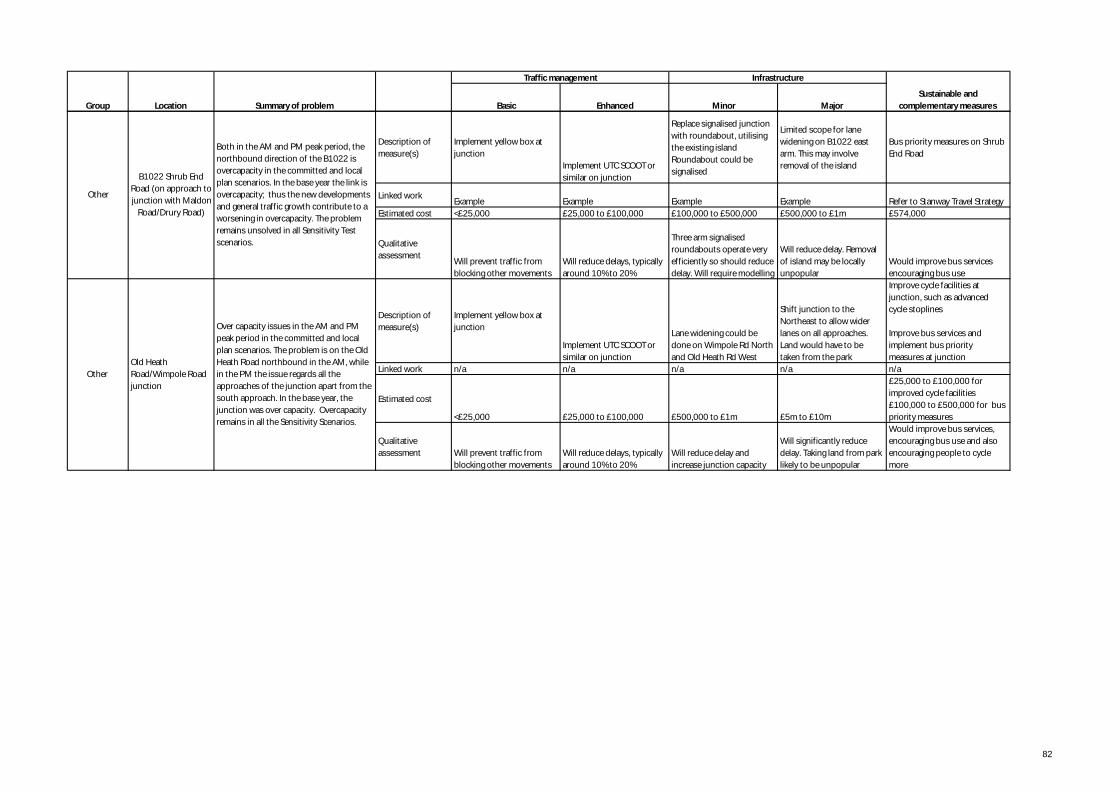
Basic Enhanced Minor MajorGroup
Infrastructure
Sustainable andcomplementary measuresLocation Summary of problem
Traffic management
Description ofmeasure(s)
Implement yellow box atjunction
Implement UTC SCOOT orsimilar on junction
Replace signalised junctionwith roundabout, utilisingthe existing islandRoundabout could besignalised
Limited scope for lanewidening on B1022 eastarm. This may involveremoval of the island
Bus priority measures on ShrubEnd Road
Linked workExample Example Example Example Refer to Stanway Travel Strategy
Estimated cost <£25,000 £25,000 to £100,000 £100,000 to £500,000 £500,000 to £1m £574,000
Qualitativeassessment
Will prevent traffic fromblocking other movements
Will reduce delays, typicallyaround 10% to 20%
Three arm signalisedroundabouts operate veryefficiently so should reducedelay. Will require modelling
Will reduce delay. Removalof island may be locallyunpopular
Would improve bus servicesencouraging bus use
Description ofmeasure(s)
Implement yellow box atjunction
Implement UTC SCOOT orsimilar on junction
Lane widening could bedone on Wimpole Rd Northand Old Heath Rd West
Shift junction to theNortheast to allow widerlanes on all approaches.Land would have to betaken from the park
Improve cycle facilities atjunction, such as advancedcycle stoplines
Improve bus services andimplement bus prioritymeasures at junction
Linked work n/a n/a n/a n/a n/a
Estimated cost
<£25,000 £25,000 to £100,000 £500,000 to £1m £5m to £10m
£25,000 to £100,000 forimproved cycle facilities£100,000 to £500,000 for buspriority measures
Qualitativeassessment Will prevent traffic from
blocking other movementsWill reduce delays, typicallyaround 10% to 20%
Will reduce delay andincrease junction capacity
Will significantly reducedelay. Taking land from parklikely to be unpopular
Would improve bus services,encouraging bus use and alsoencouraging people to cyclemore
Other
B1022 Shrub EndRoad (on approach tojunction with Maldon
Road/Drury Road)
Both in the AM and PM peak period, thenorthbound direction of the B1022 isovercapacity in the committed and localplan scenarios. In the base year the link isovercapacity; thus the new developmentsand general traffic growth contribute to aworsening in overcapacity. The problemremains unsolved in all Sensitivity Testscenarios.
OtherOld HeathRoad/Wimpole Roadjunction
Over capacity issues in the AM and PMpeak period in the committed and localplan scenarios. The problem is on the OldHeath Road northbound in the AM, whilein the PM the issue regards all theapproaches of the junction apart from thesouth approach. In the base year, thejunction was over capacity. Overcapacityremains in all the Sensitivity Scenarios.
82
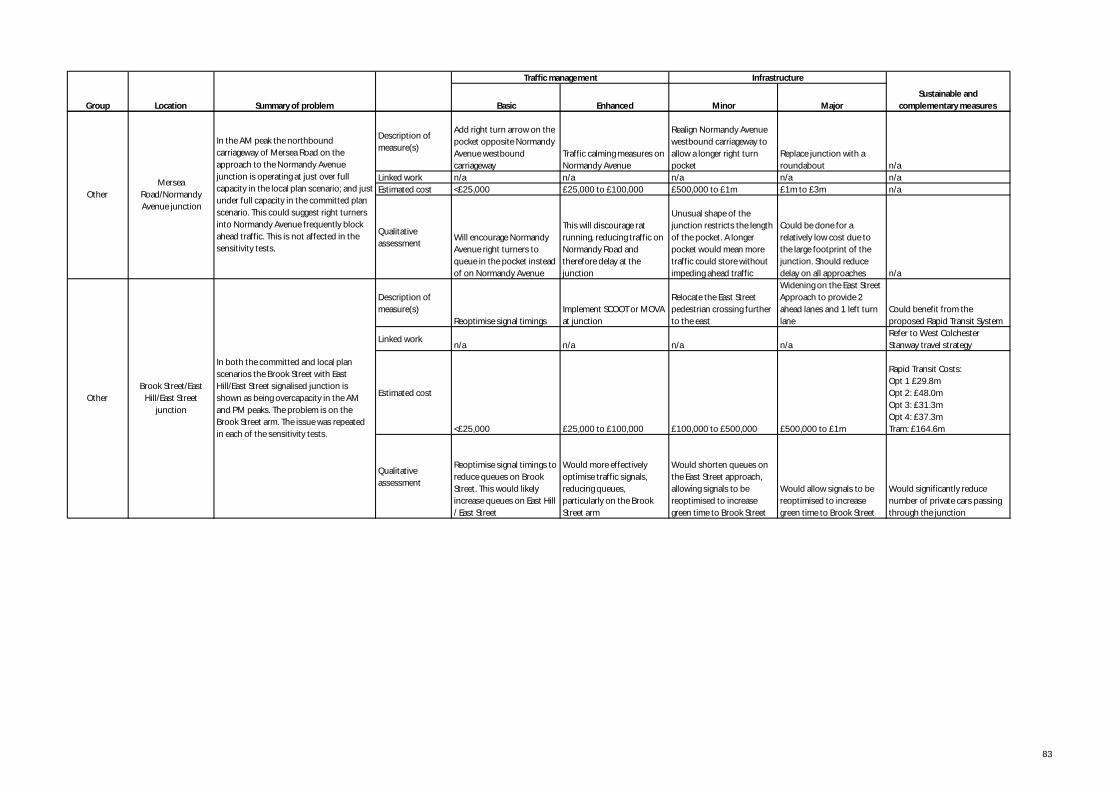
Basic Enhanced Minor MajorGroup
Infrastructure
Sustainable andcomplementary measuresLocation Summary of problem
Traffic management
Description ofmeasure(s)
Add right turn arrow on thepocket opposite NormandyAvenue westboundcarriageway
Traffic calming measures onNormandy Avenue
Realign Normandy Avenuewestbound carriageway toallow a longer right turnpocket
Replace junction with aroundabout n/a
Linked work n/a n/a n/a n/a n/aEstimated cost <£25,000 £25,000 to £100,000 £500,000 to £1m £1m to £3m n/a
Qualitativeassessment
Will encourage NormandyAvenue right turners toqueue in the pocket insteadof on Normandy Avenue
This will discourage ratrunning, reducing traffic onNormandy Road andtherefore delay at thejunction
Unusual shape of thejunction restricts the lengthof the pocket. A longerpocket would mean moretraffic could store withoutimpeding ahead traffic
Could be done for arelatively low cost due tothe large footprint of thejunction. Should reducedelay on all approaches n/a
Description ofmeasure(s)
Reoptimise signal timingsImplement SCOOT or MOVAat junction
Relocate the East Streetpedestrian crossing furtherto the east
Widening on the East StreetApproach to provide 2ahead lanes and 1 left turnlane
Could benefit from theproposed Rapid Transit System
Linked workn/a n/a n/a n/a
Refer to West ColchesterStanway travel strategy
Estimated cost
<£25,000 £25,000 to £100,000 £100,000 to £500,000 £500,000 to £1m
Rapid Transit Costs:Opt 1 £29.8mOpt 2: £48.0mOpt 3: £31.3mOpt 4: £37.3mTram: £164.6m
Qualitativeassessment
Reoptimise signal timings toreduce queues on BrookStreet. This would likelyincrease queues on East Hill/ East Street
Would more effectivelyoptimise traffic signals,reducing queues,particularly on the BrookStreet arm
Would shorten queues onthe East Street approach,allowing signals to bereoptimised to increasegreen time to Brook Street
Would allow signals to bereoptimised to increasegreen time to Brook Street
Would significantly reducenumber of private cars passingthrough the junction
OtherBrook Street/East
Hill/East Streetjunction
In both the committed and local planscenarios the Brook Street with EastHill/East Street signalised junction isshown as being overcapacity in the AMand PM peaks. The problem is on theBrook Street arm. The issue was repeatedin each of the sensitivity tests.
OtherMersea
Road/NormandyAvenue junction
In the AM peak the northboundcarriageway of Mersea Road on theapproach to the Normandy Avenuejunction is operating at just over fullcapacity in the local plan scenario; and justunder full capacity in the committed planscenario. This could suggest right turnersinto Normandy Avenue frequently blockahead traffic. This is not affected in thesensitivity tests.
83