
Cohort Studies, Relative Risk, and Attributable Risk STAT 6395 Spring 2008 Filardo and Ng.
69
Cohort Studies, Relative Risk, and Attributable Risk STAT 6395 Spring 2008 Filardo and Ng
-
Upload
piers-tyler -
Category
Documents
-
view
225 -
download
1
Transcript of Cohort Studies, Relative Risk, and Attributable Risk STAT 6395 Spring 2008 Filardo and Ng.

Cohort Studies, Relative Risk, and Attributable Risk
STAT 6395
Spring 2008
Filardo and Ng
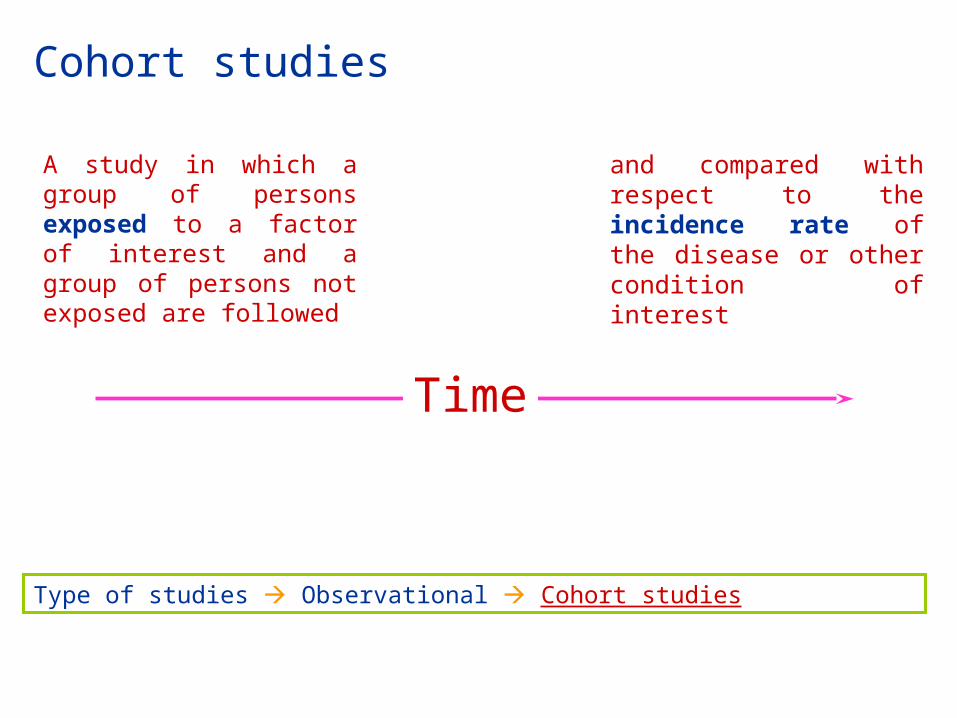
Cohort studies
A study in which a group of persons exposed to a factor of interest and a group of persons not exposed are followed
Type of studies Observational Cohort studies
and compared with respect to the incidence rate of the disease or other condition of interest
Time

Types of Epidemiologic studies

Cohort
A designated group of subjects who are followed (traced) over a period of time
Type of studies Observational Cohort studies

Time
Type of studies Observational Cohort studies

Cohort studies are also called:
• Prospective studies
• Retrospective cohort studies
• Follow-up studies
• Longitudinal studies
Type of studies Observational Cohort studies

Cohort studies (study schema)
Type of studies Observational Cohort studies

Among observational studies, cohort studies are the ‘gold standard’
• Exposure precedes onset of disease (a necessary condition of causality)
• No differential recall of exposures by those who develop the disease compared to those who do not (recall bias)
• Exposure measurements are taken at baseline, as opposed to querying about past exposures that occurred before the onset of disease or assuming that current levels of biologic markers reflect past exposures (as in case-control studies)
Type of studies Observational Cohort studies

Limitations of cohort studies
• Large number of study participants
• Many years of follow-up
• Expensive
• Losses to follow-up
• Main limitation: observational and not experimental
Type of studies Observational Cohort studies

Non exposed comparison group can be internal or external
• When the cohort includes both exposed and unexposed individuals, the comparison group is internal, within the cohort
• When the entire cohort is exposed, need an external group for purposes of comparison
Non exposed group Internal or External

Internal comparison group: Occupational cohort study.
Hypothesis: exposure to Chemical X causes one or more types of cancer.
• Cohort of workers employed in Factory A• 40% of workers are exposed to Chemical X• 60% of workers are not exposed to Chemical X.
• The unexposed workers would serve as in internal comparison group
Non exposed group Internal or External

External comparison group: Occupational cohort study
• Cohort of workers employed in Factory B• All workers in Factory B are exposed to Chemical X
• External comparison group• Workers in Factory C, where the workers have similar demographic
characteristics to the workers in Factory B and not exposed to Chemical X
• General U.S. population (mortality rates from vital statistics data)
Non exposed group Internal or External

Two types of cohorts
• Cohort defined by an exposure or group of related exposures• Purpose: test specific hypotheses about the exposure• Study of rare exposures• External comparison group if entire cohort is exposed
• Cohort defined by a factor unrelated to any particular exposure• Data collection systems to test multiple hypotheses• Sample of general population of defined geographic area• Convenience sample
• Willingness of members to participate• Logistic advantages, such as ease of follow-up
Two types of cohorts defined by the exposure or unrelated

Cohort defined by an exposure or group of related exposures
• Occupational cohort
• Japanese atomic bomb cohort
• Cohort of persons treated with radiotherapy for ankylosing spondylitis (inflammatory disease of the spine)
• Cohort of persons taking a particular drug
• Multicenter AIDS Cohort Study (drug addicts)
Two types of cohorts defined by the exposure or unrelated

Cohort defined by a factor unrelated to any particular exposure
• Framingham Heart Study• Began in 1948 with 5,127 participants
• Cancer Prevention Study II• Began in 1982 with 1,184,657 participants
• Nurses Health Study (females)• Began in 1976 with 121,700 women
Two types of cohorts defined by the exposure or unrelated
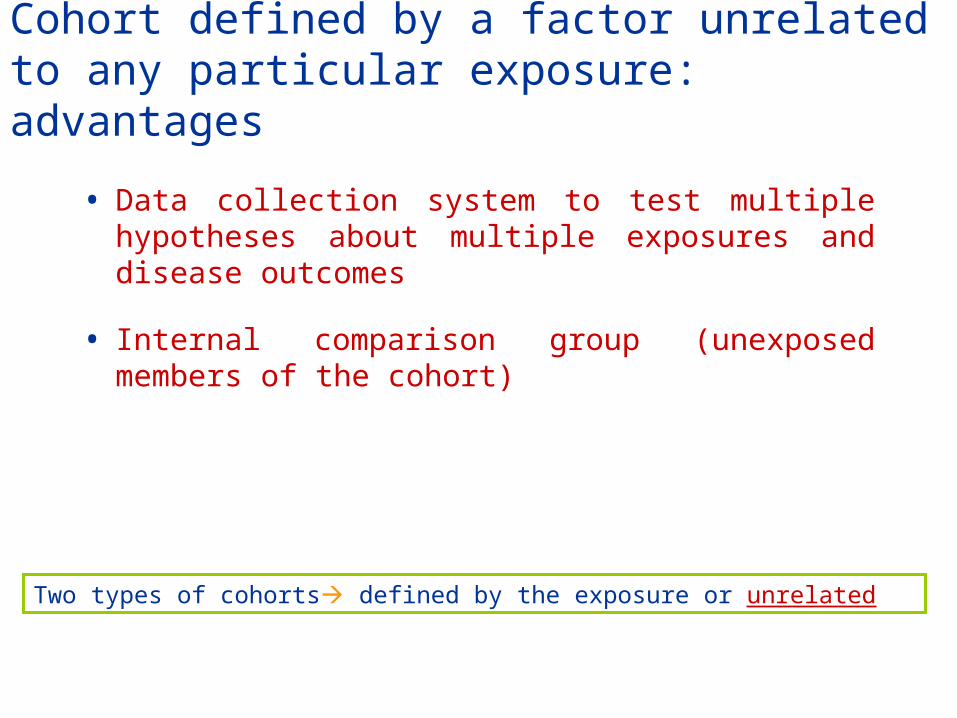
Cohort defined by a factor unrelated to any particular exposure: advantages
• Data collection system to test multiple hypotheses about multiple exposures and disease outcomes
• Internal comparison group (unexposed members of the cohort)
Two types of cohorts defined by the exposure or unrelated

Analysis of a cohort study: Measure of associations
Disease develops
Person-years at risk
Incidence rate (I)
Exposed a b a/b
Non exposed c d c/d
Incidence rate (absolute risk) in exposed group: Iexp = a/b
Relative risk (RR) = Iexp/Inonexp

Disease develops
Disease does NOT develop
Total
Disease incidence
(I)
Exposed a b a+b a/( a+b)
Non exposed c d c+d c/( c+d)
Iexp = a/(a+b)
Relative risk (RR) = Iexp/Inonexp
Analysis of a cohort study: Measure of associations

Comparison is fundamental to epidemiology:
Relative risk (RR) = incidence in exposed /incidence in non exposed
• The relative risk is a ratio (dimensionless)
• Always make clear which group is exposed and which is non exposed
Measure of associations Relative Risk
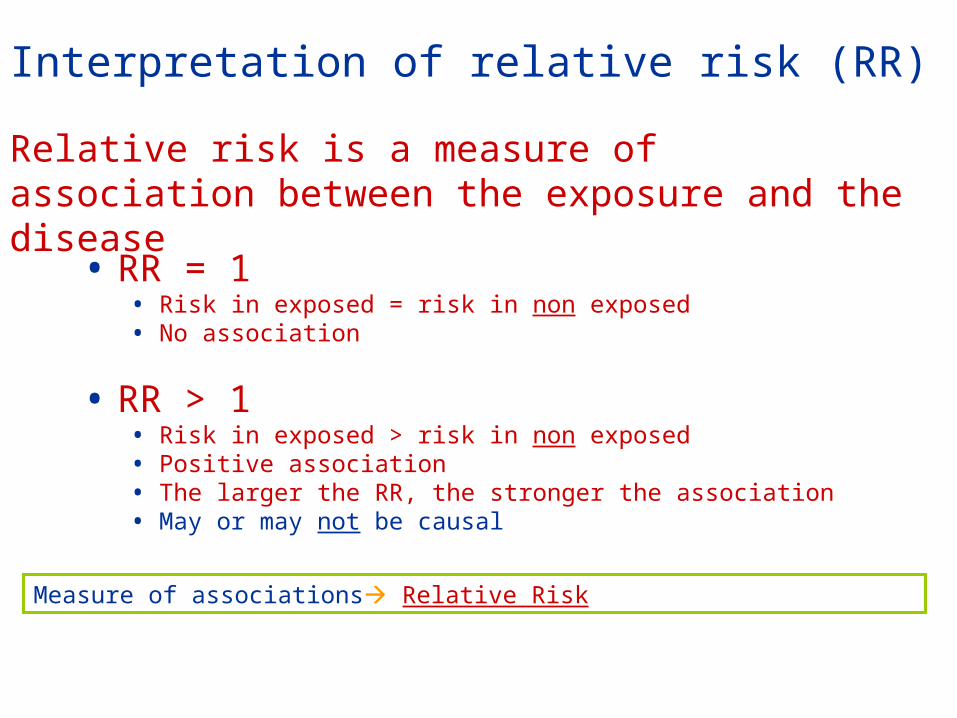
Interpretation of relative risk (RR)
• RR = 1• Risk in exposed = risk in non exposed• No association
• RR > 1• Risk in exposed > risk in non exposed• Positive association• The larger the RR, the stronger the association• May or may not be causal
Measure of associations Relative Risk
Relative risk is a measure of association between the exposure and the disease

Interpretation of relative risk (RR)
• RR < 1• Risk in exposed < risk in non exposed• Negative association• The smaller the RR, the larger the negative association• May or may not be causal• If causal, indicates a protective effect
Measure of associations Relative Risk

Hypothetical cohort study of benzene (exposure) and leukemia (outcome)
Hypothesis: benzene exposure increases the risk of leukemia
Non exposed groupto benzene
Follow the two groups for 10 years
Exposed groupto benzene
Time
Yes leukemia
No leukemia

Benzene exposure and leukemia
Group
N
Leu-
kemia
Person-years at
risk
Inci-
dence*
RR
Exposed 10,500 40 100,000 40 8.0
Non-exposed
10,500 5 100,000 5 1.0
*Per 100,000 person-years

Group
N
Leu-
kemia
Person-years at
risk
Inci-
dence*
RR
High Exposure
5,250 30 50,000 60 12.0
Low Exposure
5,250 10 50,000 20 4.0
Non-exposed
10,500 5 100,000 5 1.0
*Per 100,000 person-years
Benzene exposure and leukemia

How much of the disease that occurs can be attributed to a particular exposure?
• Relative risk -- is a measure of association between an exposure and a disease
• Attributable risk -- the magnitude of disease incidence attributable to a specific exposure
• Attributable risk percent -- the percent of disease incidence attributable to a specific exposure
The answer to this question tells us how much of the disease we can prevent if we eliminate the exposure
Measure of associations Attributable risk (exposure)

Attributable risk for the exposed group
• Attributable risk (exposed) = Iexp – Inonexp
• Attributable risk percent (exposed) = [(Iexp - Inonexp)/ Iexp] x 100 = = [(RR - 1)/RR] x 100
• Incidence in non exposed group can be considered the background incidence, which would occur regardless of the exposure
Measure of associations Attributable risk (exposure)

Attributable risk for the exposed group
Measure of associations Attributable risk (exposure)

Attributable risk (exposed) tells us the most we can hope to accomplish in reducing the risk of disease among the exposed if we totally eliminated the exposure
Measure of associations Attributable risk (exposure)

AR(exposed) = 40 - 5 = 35 per 100,000 person-yearsAR percent (exposed) = [(40-5)/40] x 100 = 87.5%
Benzene exposure and leukemia
Group
N
Leu-
kemia
Person-years at
risk
Inci-
dence*
RR
Exposed 10,500 40 100,000 40 8.0
Non-exposed
10,500 5 100,000 5 1.0
*Per 100,000 person-years
Measure of associations Attributable risk

Attributable risk for the total population
• Attributable risk (population) = Ipop – Inonexp
• Attributable risk percent* (population) = [(Ipop - Inonexp)/ Ipop] x 100 =
Measure of associations Attributable risk (population)
Tells us what percent of disease in the total population is due to the exposure

Attributable risk (population) tells us the most we can hope to accomplish in reducing the incidence of disease in the total population if we totally eliminated the exposure
Measure of associations Attributable risk (population)

Attributable risk percent (population): alternate formula
P x (RR-1) x 100 P x (RR-1) + 1Where P is the population prevalence of the exposure
• Algebraically equivalent to the original formula
• AR percent (population) increases with:• Increasing RR• Increasing population prevalence of the exposure
Measure of associations Attributable risk (population)

Rare exposure (low population prevalence)
RR = 2(p
er y
ear)

Common exposure (high population prevalence)(p
er y
ear)

‘Dependence’ of AR% (population) on RR and prevalence of exposure
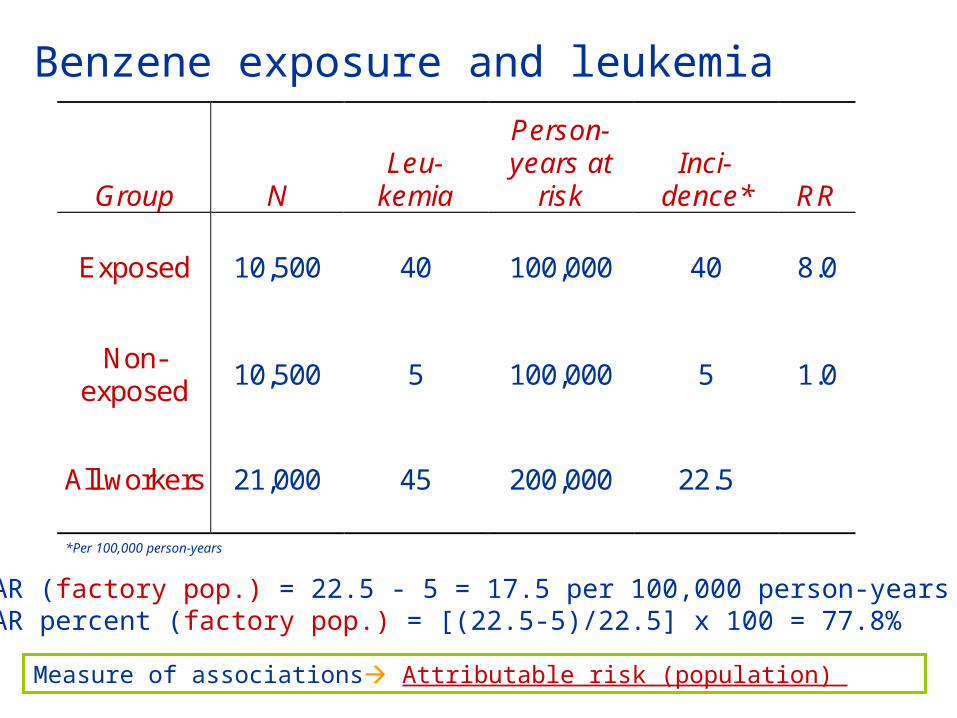
AR (factory pop.) = 22.5 - 5 = 17.5 per 100,000 person-yearsAR percent (factory pop.) = [(22.5-5)/22.5] x 100 = 77.8%
Benzene exposure and leukemia
Group
N
Leu-
kemia
Person-years at
risk
Inci-
dence*
RR
Exposed 10,500 40 100,000 40 8.0
Non-exposed
10,500 5 100,000 5 1.0
All workers 21,000 45 200,000 22.5
*Per 100,000 person-years
Measure of associations Attributable risk (population)

Attributable risk percent (population): alternate formula
P x (RR-1) _ x 100 P x (RR-1) + 1Where P is the prevalence of the exposure in the population
Measure of associations Attributable risk (population)
0.5 (8 -1) x 100 = 77.8%0.5 (8 -1) + 1

Incidence of leukemia in the general population attributable to benzene: hypothetical example…
• AR (population) = 5.25 - 5 = 0.25 per 100,000 per year
• AR percent (population) = [(5.25 - 5)/5.25] x 100 = 4.8%
Measure of associations Attributable risk (example)
From cancer registry data we determine the incidence of leukemia in the general population to be 5.25 per 100,000 per year

Incidence of leukemia in the general population attributable to benzene: hypothetical example, alternate formula…
AR percent (population) = P x (RR-1) x 100 = P x (RR-1) + 1
= [.007 x (8-1)] x 100 = 4.7% ≈ 4.8 [.007 x (8-1) +1]
Measure of associations Attributable risk (example)
We are able to estimate that 0.7% of the general population has significant exposure to benzene

Relative risk vs. attributable risk
• RR is a measure of the strength of an association between an exposure and a disease, and is the measure used in etiologic studies
• AR is a measure of how much of the disease incidence is attributable to the exposure, and is useful in assessing the exposure’s public health importance
• AR (population) will vary among populations, depending upon the prevalence of the exposure
Measure of associations Relative risk vs. attributable risk

(Retrospective)
Year 2008 Year 2020
Year 2008
Year 1960
Year 2008Year 1990
Year 2010
Cohort studies by calendar time period of follow-up

Concurrent cohort study
A cohort study in which the investigator assembles the cohort and measures baseline exposures in present time. The cohort is followed forward from present time into the future for a number of years (calendar time and follow-up time are concurrent), during which time disease outcomes are observed.
Cohort Studies Concurrent, retrospective, mixed design
TimePresent time
Study endsStudy cohort follow-up begins

Concurrent cohort study (cont.)
Advantage: • baseline exposure assessment and methods of follow-up for
disease outcome are planned and implemented for purposes of the study
Disadvantages• Study takes many years to conduct• High cost
Cohort Studies Concurrent, retrospective, mixed design

Historical (retrospective) cohort study
A cohort study in which the investigator uses historical data, based on existing records of past exposures, to go back in time to assemble a cohort. Also using existing records, the investigator reconstructs the disease experience of the cohort from a defined point in the past to a point in the near present.
Study cohort follow-up begins Study ends
Present timeTime
Cohort Studies Concurrent, retrospective, mixed design

Historical (retrospective) cohort study (cont.)
Cohort Studies Concurrent, retrospective, mixed design
Advantage: • less expensive than concurrent studies• less time to conduct than concurrent studies
Disadvantages• the quality of exposure or disease outcome data is often inferior to
the quality obtained in concurrent studies (due to the reliance on records that usually were collected for a purpose other than conducting an epidemiologic study)

Mixed design cohort study
A cohort study in which the investigator uses historical data, based on existing records of past exposures, to go back in time to assemble a cohort. Also using existing records, the investigator reconstructs the disease experience of the cohort from a defined point in the past to a point in the future. Data for the cohort includes data from the past and data from present time into the future.
Study cohort follow-up begins Study ends
Present timeTime
Cohort Studies Concurrent, retrospective, mixed design

Concurrent cohort study: Hepatocelluar carcinoma and hepatitis B virus -- a prospective study of 22,707 men in Taiwan (Beasley et al.).
Cohort: male Taiwanese government civil servants
Why civil servants?• Life and health insurance system provided almost total ascertainment
of death• Retained insurance after retirement
Hypothesis: hepatitis B virus infection causes hepatocellular carcinoma (HCC)
Cohort Studies Concurrent (example), retrospective, mixed design

Concurrent cohort study: Hepatocelluar carcinoma and hepatitis B virus -- a prospective study of 22,707 men in Taiwan (Beasley et al.).
First cohort study of hepatitis B virus infection and Hepatocelluar carcinoma
Cohort Studies Concurrent (example), retrospective, mixed design

Why study was restricted to men?
• Incidence of HCC 3-4 times higher in men than in women
• There were many more male civil servants
• Average age of male civil servants higher than that of female civil servants
• Men stay in government service longer than women, and it is usually their only occupation
Cohort Studies Concurrent (example), retrospective, mixed design

Recruitment of study participants
• Men attending the Government Employees Clinic Center
• Men participating in another study (Cardiovascular Disease Study)
• Recruitment took place between November 3, 1975 and June 30, 1978
• 22,707 male government employees were recruited into the cohort
Cohort Studies Concurrent (example), retrospective, mixed design

Exposure measurement at baseline
Blood sample to test for hepatitis B surface antigen
(exposed group) 3,454 men tested positive
Cohort Studies Concurrent (example), retrospective, mixed design
(nonexposed group)19,253 men tested negative

Follow-up methods
Cohort followed forward in time from the present (calendar time and follow-up time concurrent) to assess outcome (death from HCC)
Cohort Studies Concurrent (example), retrospective, mixed design

Follow-up methods
Detection of deathHealth and life insurance system
Identification of deaths caused by HCCHospital records of all decedents were reviewed
Study cohortsubjects positive to hepatitis B subjects negative to hepatitis B
death from HCC
Cohort Studies Concurrent (example), retrospective, mixed design

Results of follow-up
• Follow-up through December 31, 1980
• 307 members of cohort died
• 74 members of cohort had retired and canceled their insurance and could not be traced
• About 75,000 person-years of follow-up; average of 3.3 years per man
Cohort Studies Concurrent (example), retrospective, mixed design

HCC mortality Hepatitis B antigen
HCC
deaths
Population at baseline
HCC cumulative mortality*
Positive
40
3,454
1,158
Negative
1
19,253
5.2
Relative risk = 1,158/5.2 = 223
*(per 100,000); Mean follow-up 3.3 years
Cohort Studies Concurrent (example), retrospective, mixed design

Conclusions
• hepatitis B virus infection preceded (causes) the development of Hepatocelluar carcinoma
• The estimated relative risk (223) provides strong evidence that hepatitis B virus infection causes Hepatocelluar carcinoma
Cohort Studies Concurrent (example), retrospective, mixed design

Comparing incidence rates in different populations
• Calculate the number of deaths or cases of disease expected in the cohort if it had the same age-specific mortality or incidence rates as the external comparison group (usually general population)
• Compare the expected number with the actual observed number of deaths or disease in the cohort
• Usually also adjust for calendar-year time of death or disease incidence (Selikoff et al.)
Indirect age-adjustment (often used in retrospective cohort studies) uses standard age-specific mortality or incidence rates from an external comparison group (usually the general population)
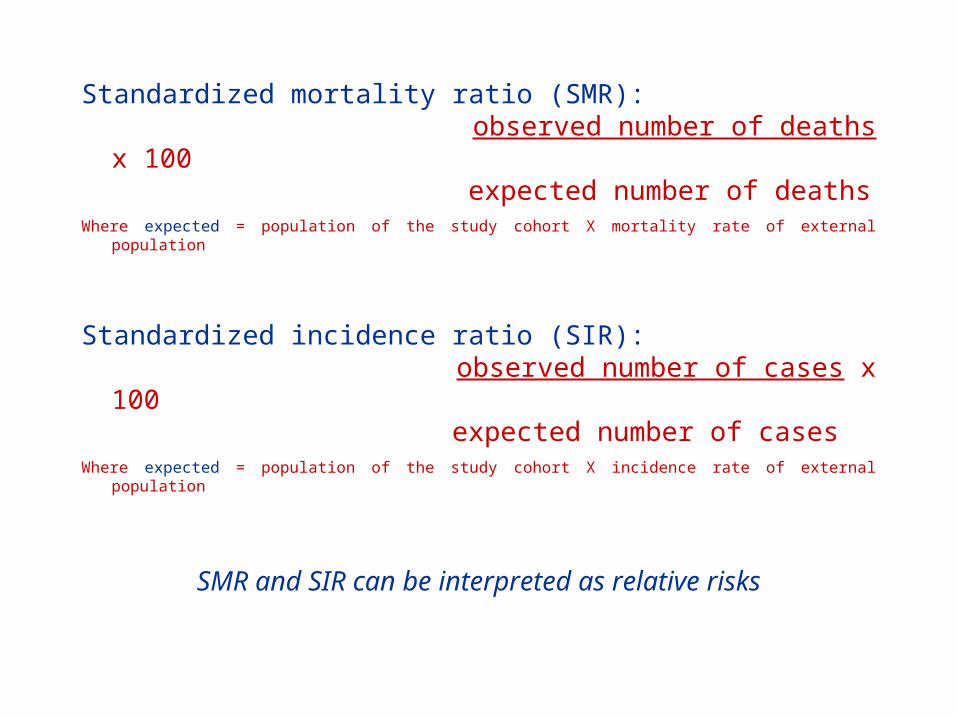
Standardized mortality ratio (SMR): observed number of deaths x 100 expected number of deathsWhere expected = population of the study cohort X mortality rate of external population
Standardized incidence ratio (SIR): observed number of cases x 100 expected number of casesWhere expected = population of the study cohort X incidence rate of external population
SMR and SIR can be interpreted as relative risks

…a key factor for the interpretation of standardized mortality ratios and incidence ratios is the construction of reliable 95% confidence intervals
Cohort Studies Concurrent, retrospective, mixed design

Hypothetical historical cohort study of lung cancer in uranium miners…
Person-years lung cancer at mortality rate Expected Observed Age risk (per 100,000) deaths deaths40-44 5,000 10 0.5 645-49 10,000 20 2.0 10 50-54 8,000 35 2.8 15 Totals 5.3 31
SMR = (31/5.3) x 100 = 585
Cohort Studies Concurrent, retrospective, mixed design

Example of historical cohort study: Teta et al. Cancer incidence among cosmetologists
• Hypothesis: cosmetologists are at greater than average risk of respiratory cancer because they use many chemicals in their work
• Cohort: licensed Connecticut cosmetologists
Cohort Studies Concurrent, retrospective (example), mixed design
Since 1925, cosmetologists in Connecticut were required to register annually with the State Dept. of Health

Construction of cohort
• The target population: 17,121 cosmetologists who:• Were CT residents• Were ever licensed as cosmetologists• Began hairdressing school before Jan. 1, 1966
• Data abstracted from registration records• Full name, including former surnames• Sex• Date of birth• Dates of first and last licenses• Last known address
Cohort Studies Concurrent, retrospective (example), mixed design

Final cohort11,845 females and 1,805 males
Construction of cohort (continued)
Cohort Studies Concurrent, retrospective (example), mixed design
Persons excluded from cohort 2,530 who had been licensed less than 5 years, 33 who had reported being diagnosed
with cancer prior study, 908 for whom date of birth or sex were missing
Initial cohort17,121 subjects

Follow-up
• For a given individual, follow-up began either• 4th year after the date of first license or• 1935 for the few first licensed before 1931
• Ascertained cancer incidence through Connecticut Tumor Registry
• Ascertained vital status through CT death certificate records
• Ascertained residence in CT through lists of licensed CT drivers and city directories
Follow-up period: January 1, 1935 through September 30, 1978

• For each cohort member, person-years at risk were counted until one of the following, whichever came first:
» Last known year at a CT address» Date of death» Cancer diagnosis» September 30, 1978
• 241,580 person-years of follow-up
Follow-up (continued)

Cancer in cosmetologists: Indirect age adjustment
• The general CT population was the external comparison group
• Used the cancer incidence rates from the Connecticut Tumor Registry as the standard incidence rates, specific for:
• Age• Sex• Calendar year• Cancer site

Length of follow-up (years) Obs. Exp. SIR 5-14 4 4.85 8215-24 8 7.22 111 25-34 14 11.49 122 > 35 23 11.28 204*Total 49 34.84 141*
*P < 0.05
Cancer in cosmetologists (continued)

Cancer in cosmetologists: limitations
• History of specific exposures unavailable
• Smoking histories unavailable• Authors present anecdotal evidence that cosmetologists had higher
smoking rates than general female population
• ‘Adjustment’ for important confounders not possible

Conceptually, the designs of concurrent cohort studies and historical cohort studies are identical
• Start at baseline with exposed and non-exposed groups free of the disease of interest
• Identify new (incident) cases as we go forward in time from baseline
• Difference is the calendar time period of observation• Concurrent cohort study
• Baseline: in the present• Follow-up: forward into the future
• Historical cohort study• Baseline: a time point in the past• Follow-up: forward from that time point to the present


