Cohort report uploaded to my LinkedIn profile 1Nov2016
46
Education for All 2004-09 Formative Research Project Study Report Longitudinal Study on System Indicators Cohort Analysis Tribhuvan University Research Centre for Educational Innovation and Development 2007
-
Upload
roshan-chitrakar -
Category
Documents
-
view
113 -
download
3
Transcript of Cohort report uploaded to my LinkedIn profile 1Nov2016

Education for All 2004-09 Formative Research Project
Study Report
Longitudinal Study on System Indicators
Cohort Analysis
Tribhuvan University
Research Centre for Educational Innovation and Development 2007
Study Team Researcher
Dr. Roshan Chitrakar
Associate Researchers
Mr. Raju Manandhar
Mr. Rom Prasad Bhattarai
Mr. Purushottam Manandhar
Resource Persons
Dr. Shreeram Prasad Lamichhane
Mr. Shankar Thapa
Research Assistant
Mr. Yogendra Prasad Lekhak
Mr. Prabhakar Dhungel
Mr. Kamal Adhikari
Mr. Arjun Kumar Pandey
Ms. Prativa Pradhan
Ms. Anjana Rajbhandari
Mr. Amul Uprety
Mr. Kashilal Chaudhari
Mr. Jayaram Thapa
Mr. Bahadur Singh Bhat
Formative Research Project, CERID Project Advisors: Project Coordinator: Dr. Kishore Shrestha Prof. Dr. Hridaya R. Bajracharya Associate Researcher: Mr. Rom Prasad Bhattarai Dr. Shreeram P. Lamichhane

i
Acronyms and Abbreviations
ADA Average Daily Attendance
BPEP Basic and Primary Education Programme
BS Bikram Sambat
CDC Curriculum Development Centre
CERID Research Centre for Educational Innovation and Development
DAG Disadvantaged Group
DDC District Development Committee
DEO District Education Office(r)
DEP District Education Plan
DOE Department of Education
ECD Early Childhood Development
EFA Education For All
EMIS Education Management Information System
ETC Education Training Centre
FRP Formative Research Project
GER Gross Enrolment Rate
GIR Gross Intake Rate
ID Identity
INGO International Non-Governmental Organization
NIPA Nepal Indigenous Peoples’ Association
LongSIS Longitudinal Study on System Indicators
MOES Ministry of Education and Sports
NCED National Centre for Education Development
NER Net Enrolment Rate
NGO Non-Governmental Organization
NIR Net Intake Rate
PRD Promotion, Repetition and Dropout
PTA Parent Teacher Association
RED Regional Education Directorate
RP Resource Person
SIP School Improvement Plan
SLC School Leaving Certificate
SMC School Management Committee
SS School Supervisor
STR Student Teacher Ratio
TG Teacher’s Guide
TMIS Teacher Management Information System
VDC Village Development Committee
VEP Village Education Plan

ii
Acknowledgment
This is the first report of the Longitudinal Study on System Indicators of the Formative Research Project that has specifically consolidated the student cohort data for a 5-year primary cycle of 2002-2006. The study has added new quantitative information to FRP’s knowledge series. The information is based on individual student record of the 62 sampled school, which the Ministry of Education and Sports of Government of Nepal is expected to find relevant to facilitate its process of planning, implementing, monitoring and managing EFA programs. As well, the study findings have unfolded new questions for further investigation on pertinent issues under the FRP.
The study team continues to acknowledge the cooperation and valuable support of all the head teachers, teachers, and representatives from related VDC/Municipalities of the schools covered by this study for the role they have played in collecting and ensuring the quality of data. The team is also grateful to the representatives of Regional Education Directorates, and District Education Offices, School Supervisors and Resource Persons of the sampled districts for their continuous support in undertaking the field work. Thanks are also due to all the field researchers who conducted cluster level data collection workshops and visited districts and schools for the collection of data.
The contributions of the reviewers of the draft of this report are highly appreciated. The study team has benefited from the critical comments and insightful feedback received from the reviewers. We thank Secretary of Ministry of Education and Sports Dr. Vidhyadhar Mallik, Chair of FRP Advisory Group Dr. Ishor Prasad Upadhyaya, Member of FRP Advisory Group Dr. Bajra Raj Shakya, Deputy Director MOES Dr. Lava Dev Awasthi, Deputy Director DoE Mr. Hari Lamsal, Deputy Director DoE Mr. Soviet Ram Bista, Deputy Director DoE Mr. Babu Ram Poudel, and Section Officer DoE Mr. Shankar Thapa for graciously agreeing to review the draft and providing their expert feedback.
Mr. Lars Kirkebøen deserves special thanks for his technical assistance in leading the study team to analyze the LongSIS data using advanced statistical methods, computer software and aptly interpreting the results thus obtained.
The Longitudinal Study team is thankful to CERID Executive Director Professor Dr. Hridaya Ratna Bajracharya, FRP Coordinator Dr. Kishor Shrestha and Advisor Dr. Shreeram Lammichhane for their support. The heavy task of logistic management involved in the study has been successfully undertaken, as usual, by CERID administrative staff members. The study team appreciates their support and thanks them all for their unceasing commitments to the study. Last but not the least, thanks are also due to the study’s Resource Persons for their valuable comments and technical support.
Dr. Roshan Chitrakar Researcher July 2007
iii
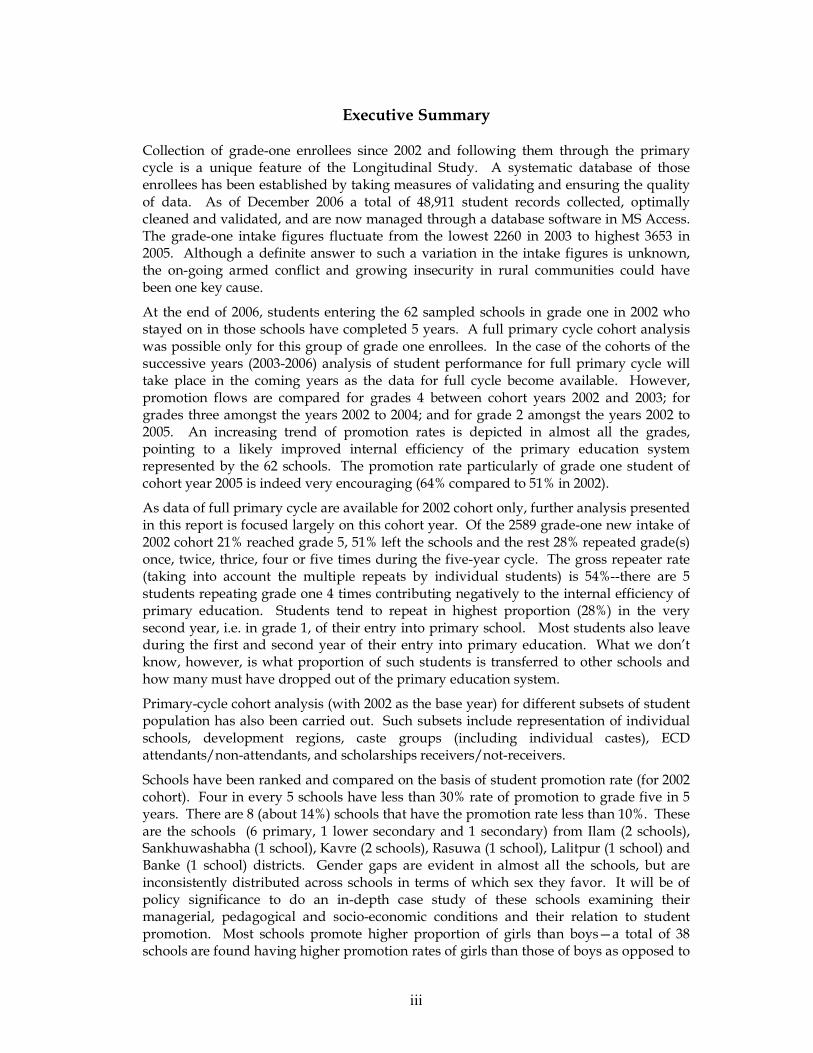
Executive Summary
Collection of grade-one enrollees since 2002 and following them through the primary cycle is a unique feature of the Longitudinal Study. A systematic database of those enrollees has been established by taking measures of validating and ensuring the quality of data. As of December 2006 a total of 48,911 student records collected, optimally cleaned and validated, and are now managed through a database software in MS Access. The grade-one intake figures fluctuate from the lowest 2260 in 2003 to highest 3653 in 2005. Although a definite answer to such a variation in the intake figures is unknown, the on-going armed conflict and growing insecurity in rural communities could have been one key cause.
At the end of 2006, students entering the 62 sampled schools in grade one in 2002 who stayed on in those schools have completed 5 years. A full primary cycle cohort analysis was possible only for this group of grade one enrollees. In the case of the cohorts of the successive years (2003-2006) analysis of student performance for full primary cycle will take place in the coming years as the data for full cycle become available. However, promotion flows are compared for grades 4 between cohort years 2002 and 2003; for grades three amongst the years 2002 to 2004; and for grade 2 amongst the years 2002 to 2005. An increasing trend of promotion rates is depicted in almost all the grades, pointing to a likely improved internal efficiency of the primary education system represented by the 62 schools. The promotion rate particularly of grade one student of cohort year 2005 is indeed very encouraging (64% compared to 51% in 2002).
As data of full primary cycle are available for 2002 cohort only, further analysis presented in this report is focused largely on this cohort year. Of the 2589 grade-one new intake of 2002 cohort 21% reached grade 5, 51% left the schools and the rest 28% repeated grade(s) once, twice, thrice, four or five times during the five-year cycle. The gross repeater rate (taking into account the multiple repeats by individual students) is 54%--there are 5 students repeating grade one 4 times contributing negatively to the internal efficiency of primary education. Students tend to repeat in highest proportion (28%) in the very second year, i.e. in grade 1, of their entry into primary school. Most students also leave during the first and second year of their entry into primary education. What we don’t know, however, is what proportion of such students is transferred to other schools and how many must have dropped out of the primary education system.
Primary-cycle cohort analysis (with 2002 as the base year) for different subsets of student population has also been carried out. Such subsets include representation of individual schools, development regions, caste groups (including individual castes), ECD attendants/non-attendants, and scholarships receivers/not-receivers.
Schools have been ranked and compared on the basis of student promotion rate (for 2002 cohort). Four in every 5 schools have less than 30% rate of promotion to grade five in 5 years. There are 8 (about 14%) schools that have the promotion rate less than 10%. These are the schools (6 primary, 1 lower secondary and 1 secondary) from Ilam (2 schools), Sankhuwashabha (1 school), Kavre (2 schools), Rasuwa (1 school), Lalitpur (1 school) and Banke (1 school) districts. Gender gaps are evident in almost all the schools, but are inconsistently distributed across schools in terms of which sex they favor. It will be of policy significance to do an in-depth case study of these schools examining their managerial, pedagogical and socio-economic conditions and their relation to student promotion. Most schools promote higher proportion of girls than boys—a total of 38 schools are found having higher promotion rates of girls than those of boys as opposed to

iv
20 schools having higher rates of boys. This apparent better performance of girls needs to be understood in the context of typical public school system where learning outcome for student is still too poor compared to private schools and better performing public schools. The study is limited with its scope in assessing the extent to which girls have access to such schools and if so, have they continued to out perform boys?
While students representing Eastern region have done best in terms of promotion up to grade 5, those from Mid-West have performed least. Students from Central and Far West too have shown below the overall average performance. This result, however, should not be generalized as the statistical validity of school sample size and its representative power is not confirmed.
The study sample includes only a small number of ethnic group, Terai dalit and Muslim groups making the comparison of promotion rates difficult and dubious. The ethnic group categorized by the Indigenous Peoples’ Association of Nepal as “endangered” is not represented at all by the sample. Dalit numbers 436 (50% girls) which is about 17% of the total grade-one enrollees of 2002, while Muslim makes up 119 less than 5% of the total. The numbers of terai dalit (Chamar, Harijan and Ram) and highly marginalized ethnic group are 10 and 20 respectively. Muslim children are most disadvantaged in the rate they are promoted to grade five., which is less than 12%. Dalits with the promotion rate of 17% and Terai dalits with 20% fall below the overall average of 21%. Clearly Muslim and dalit groups seek policy intervention to improve the promotion rate.
Factors related to school inputs and student characteristics are analyzed to examine how the change in student outcomes (examination scores and promotion) could be attributed to such factors. Effect of ECD, for example, is analyzed through simple tabulation of promotion percentages across cohort years (2002-2005) as well as by fitting it as an explanatory variable in a series of regression models.1 Similarly regression analysis is applied also to examine effects of other school inputs such as class size, school expenditure, teacher experience/training/certification/license and planning process (SIP). The results are intriguing. ECD which appeared to have huge effect on promotion and examination scores loses strength as regression model is conditioned with students’ caste composition, parental skills and ecological location. Attendance in ECD program appears to be a luxury, hence restrictive, for students with low parental skills, deprived social background and those coming from outside Kathmandu valley. Taking the apparent high effect in its face value may, therefore, lead us to overstate the importance of attending ECD.
Other school inputs having statistically significant effect on student outcomes (score and promotion) are school expenditure (positive effect) and teacher experience (negative effect). School expenditure does have a highly positive effect on examination score and promotion, but the consideration of students’ background in the analysis reduces the magnitude of the effect. Therefore, the strategy of uniformly allocating resources to schools—without taking into account student composition—may not help optimize student learning outcome. Ideally the resource allocation should be linked with SIPs. Interestingly enough, it is found that the effect of having SIPs prepared in schools is both positive and significant for class-promotion (insignificantly positive for examination score) when the analysis is conditioned with student background variables. This implies that preparation of SIP is all the more important for schools as they strive to serve diverse group of students to learn and be promoted. Finally, but strangely, the analysis reveals that experienced teachers (implying older teachers) negatively contribute to students’
1 See the preliminary report of Lars Kirkebøen in Annex 8.

v
learning outcome. Now, this is a serious and complicated policy issue seeking explanation, because experienced teachers absorb most of the resources that schools obtain from the state. But how does it justify when they block student learning and progress?
Recommendations for Improving Student Promotion
1. Challenging it may be, therefore, it is necessary to diagnose further the issues of access, quality and efficiency pertaining to the excluded children and respond to the issue with necessary policy and program interventions. The key question in the problematic context of student promotion to higher grade is who are the children who will not make it up to grade 5 in 5 years after their entry into grade one and why they will not do so?
2. Given the current situation of student promotion to higher grades, primary school children in mid and Far-west must be supported with appropriate policy and program interventions for improved learning achievement and reduced wastage.
3. Schools need to be involved in analyzing student attrition status of complete primary cycles. At the classroom level class teachers ought to be doing the same for each of their own class. Review and reflection on school performance need to be a formal and regular task—achievement of gender parity evident only in a minimalist outcome should be critically scrutinized to plan and work toward producing overall quantitative and qualitative outcome. Teacher and head teacher training curriculum and programs should include capacity empowerment for participatory school and classroom context analysis.
4. The current situation seeks a proper review and redressing of the existing policy and strategy on ECD and incentives programs and at the same time consider the issue of targeting the deprived groups seriously. More importantly, the missing link between the annual strategic implementation plan (ASIP) of DOE and the reality of students’ low promotion and high repetition rate which is further
compounded by the very high rate (51%) of school leavers calls for proper student, if not child, tracking, so that resources for schools are allocated more realistically and responsibly.
School-specific Recommendations
5. In scattered settlements primary schools may have to be either branched out into lower and upper primary levels to allow easy proximity for smaller children or teachers trained in multi-grade teaching and management needs to be deployed if all 5 grades are to be run with extremely small class size.
6. Rather than excessively emphasizing on geographical location (e.g. remoteness of districts, region, etc), it will be more prudent to consider individual schools’ context for priority resource allocations. It is reiterated that school management committees, parents and teachers should take greater control in analyzing school contexts and the involvement of such stakeholders should feature as a regular and formalized school activity.
7. The promotion, repetition and dropout situation of the disadvantaged groups calls for a more in-depth study of these caste groups’ socio-economic context and the phenomenon of how they have been systematically deprived of educational opportunity. Given such a context it has also become imperative that the state’s generalized policy of social and educational inclusion needs a critical review.

vi
Distribution of dalit scholarship should be made more scientific—decision about amount and coverage needs to be localized. New scholarship scheme is deemed necessary for Muslim groups with emphasis to bring Muslim girls to school making sure that they complete the primary cycle. Resource allocation for scholarship should be based on local stakeholders’ articulation of issues of exclusion, their plans and approach to addressing such issues. Ad-hoc and top-down approach to resource allocation should be abolished. Regarding the small sample issue of highly marginalized ethnic group as well as the complete exclusion of NIPA-defined “endangered” ethnic group, it can only be recommended that a separate case study should be commissioned to accurately map out educational contexts of these groups.
Recommendations for Egalitarian Progress
8. The promotion, repetition and dropout situation of the disadvantaged groups calls for a more in-depth study of these caste groups’ socio-economic context and the phenomenon of how they have been systematically deprived of educational opportunity. Given such a context it has also become imperative that the state’s generalized policy of social and educational inclusion needs a critical review. Distribution of dalit scholarship should be made more scientific—decision about amount and coverage needs to be localized.
9. New scholarship scheme is deemed necessary for Muslim groups with emphasis to bring Muslim girls to school making sure that they complete the primary cycle. Resource allocation for scholarship should be based on local stakeholders’ articulation of issues of exclusion, their plans and approach to addressing such issues. Ad-hoc and top-down approach to resource allocation should be abolished. Regarding the small sample issue of highly marginalized ethnic group as well as the complete exclusion of NIPA-defined “endangered” ethnic group, it can only be recommended that a separate case study should be commissioned to accurately map out educational contexts of these groups.
Optimizing School Inputs for Better Student Learning Outcomes
10. In order to make the coverage and benefit of ECD more egalitarian, not only should ECD centers be expanded to inner rural communities but also the content and delivery process need to be appropriated according to local culture, values and principle. Existing innovations of ECD should be adapted to suit such social milieu. Decision about the locations of the proposed phase-wise expansion of ECD centers should be based on a systematic investigation of genuineness of their needs, which of course needs to be informed by local demands accompanied by convincing articulation of issues, needs, plans and local commitments.
11. Technical and administrative assistance to schools through RCs, DEOs and ETCs should prepare them to be able to link school expenditure with results it produces, particularly the extent of benefits it brings to deprived students. There is no dearth of participatory processes which can be adapted by stakeholders, with well crafted TA, to assess the social and pedagogical conditions of schools as a way to be clear about the benchmark and setup realistic targets to be achieved. The process should empower stakeholders to prepare stronger SIPs, make informed demands for resources, spend them judiciously and remain accountable to the community.

vii
12. Tougher measures need to be in place to hold teachers and school administration accountable to community and primary stakeholders. Periodical social auditing to inform what teachers and head teacher have planned, the targets they have set to bring about improvement in school and the progress they have made should be formalized and made mandatory. Teacher promotion and opportunities for professional development should be strictly informed by their performance and social recommendations. Long experiences on its won should not be a criterion to reward teachers and retain them.
viii
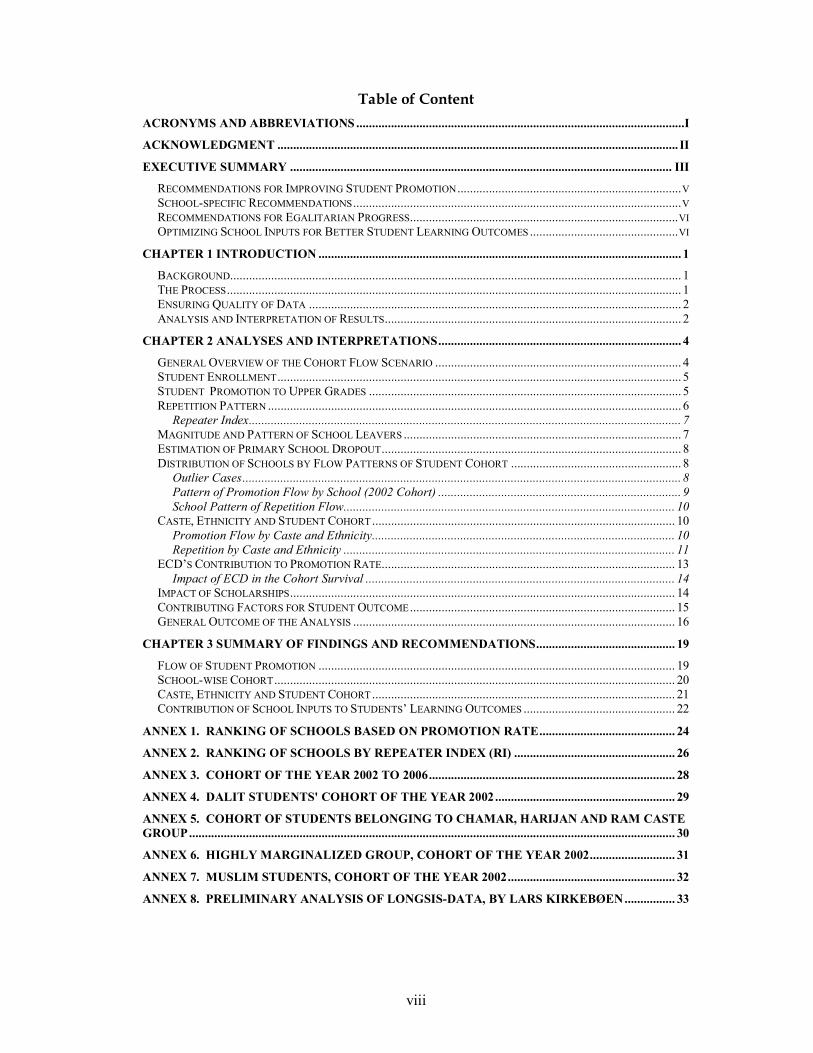
Table of Content
ACRONYMS AND ABBREVIATIONS ........................................................................................................I
ACKNOWLEDGMENT ............................................................................................................................... II
EXECUTIVE SUMMARY ......................................................................................................................... III
RECOMMENDATIONS FOR IMPROVING STUDENT PROMOTION ....................................................................... V SCHOOL-SPECIFIC RECOMMENDATIONS ........................................................................................................ V RECOMMENDATIONS FOR EGALITARIAN PROGRESS ..................................................................................... VI OPTIMIZING SCHOOL INPUTS FOR BETTER STUDENT LEARNING OUTCOMES ............................................... VI
CHAPTER 1 INTRODUCTION ................................................................................................................... 1
BACKGROUND............................................................................................................................................... 1 THE PROCESS ................................................................................................................................................ 1 ENSURING QUALITY OF DATA ...................................................................................................................... 2 ANALYSIS AND INTERPRETATION OF RESULTS .............................................................................................. 2
CHAPTER 2 ANALYSES AND INTERPRETATIONS ............................................................................. 4
GENERAL OVERVIEW OF THE COHORT FLOW SCENARIO .............................................................................. 4 STUDENT ENROLLMENT ................................................................................................................................ 5 STUDENT PROMOTION TO UPPER GRADES ................................................................................................... 5 REPETITION PATTERN ................................................................................................................................... 6
Repeater Index ......................................................................................................................................... 7 MAGNITUDE AND PATTERN OF SCHOOL LEAVERS ........................................................................................ 7 ESTIMATION OF PRIMARY SCHOOL DROPOUT ............................................................................................... 8 DISTRIBUTION OF SCHOOLS BY FLOW PATTERNS OF STUDENT COHORT ...................................................... 8
Outlier Cases ........................................................................................................................................... 8 Pattern of Promotion Flow by School (2002 Cohort) ............................................................................. 9 School Pattern of Repetition Flow......................................................................................................... 10
CASTE, ETHNICITY AND STUDENT COHORT ................................................................................................ 10 Promotion Flow by Caste and Ethnicity................................................................................................ 10 Repetition by Caste and Ethnicity ......................................................................................................... 11
ECD’S CONTRIBUTION TO PROMOTION RATE ............................................................................................. 13 Impact of ECD in the Cohort Survival .................................................................................................. 14
IMPACT OF SCHOLARSHIPS .......................................................................................................................... 14 CONTRIBUTING FACTORS FOR STUDENT OUTCOME .................................................................................... 15 GENERAL OUTCOME OF THE ANALYSIS ...................................................................................................... 16
CHAPTER 3 SUMMARY OF FINDINGS AND RECOMMENDATIONS ............................................ 19
FLOW OF STUDENT PROMOTION ................................................................................................................. 19 SCHOOL-WISE COHORT ............................................................................................................................... 20 CASTE, ETHNICITY AND STUDENT COHORT ................................................................................................ 21 CONTRIBUTION OF SCHOOL INPUTS TO STUDENTS’ LEARNING OUTCOMES ................................................ 22
ANNEX 1. RANKING OF SCHOOLS BASED ON PROMOTION RATE ........................................... 24
ANNEX 2. RANKING OF SCHOOLS BY REPEATER INDEX (RI) ................................................... 26
ANNEX 3. COHORT OF THE YEAR 2002 TO 2006 .............................................................................. 28
ANNEX 4. DALIT STUDENTS' COHORT OF THE YEAR 2002 ......................................................... 29
ANNEX 5. COHORT OF STUDENTS BELONGING TO CHAMAR, HARIJAN AND RAM CASTE
GROUP .......................................................................................................................................................... 30
ANNEX 6. HIGHLY MARGINALIZED GROUP, COHORT OF THE YEAR 2002 ........................... 31
ANNEX 7. MUSLIM STUDENTS, COHORT OF THE YEAR 2002 ..................................................... 32
ANNEX 8. PRELIMINARY ANALYSIS OF LONGSIS-DATA, BY LARS KIRKEBØEN ................ 33

1
Chapter 1
Introduction
Background
This report supplements the previous reports of the Longitudinal Study on System Indicators with information collected and analyzed for the year 2002 to 2006. The details of the background information about the study’s purpose, objectives and approach are outlined in previous reports. This report, therefore, needs to be viewed as the continuum in the process of documenting progress made in key EFA indicators.
This year the study marks its 5th consecutive year of research journey, in which the cohort-flow analysis presented in this report has added new insight to the knowledge base that the study has generated so far. Most notably, it has made a remarkable breakthrough in systematizing the individual student cohort data with 2002 as the base year. Although the process had been time consuming and tedious, the product that has evolved proved useful, particularly to track the educational progress of individual student of the 62 sampled schools entering in the first grade of the primary school system since the year 2002. Unlike in the previous reports, the analysis presented in this report is based on these individual student cohort data as opposed to the aggregate data provided by the schools. In doing so, the study has continued to keep the EFA context at the centre of its inquiry process and has kept collecting and analyzing the primary school data from the usual sample of 62 schools of 16 districts. New and important lessons have been learned which supplement those documented in the previous reports.2
The Process
The shift made last year in its approach to collecting, compiling and analyzing school-supplied information has yielded not only quality data but also revealing findings of the primary education context. The mobilization of school, VDC/municipality and DEO representatives, which started in 2005, has been continued to consolidate the data. The reliability and validity of data have been increasingly assured. As in the previous year, the compiled sets of information analyzed at CERID have been sent back to respective schools with a goal to assure that the schools gradually take the ownership of and control over the process and the product of collecting and analyzing the data of individual student, school and related educational information from the school catchments area.
The study has also seen some progress in the number of VDCs and municipality-wards taking initiatives to consolidate key educational statistics. They have responded positively to the study’s effort to collecting community data such as number of primary school aged children, those not attending schools, number of ECD centers, and so on. However, much still needs to be done to ensure that all the relevant VDCs and municipalities where the 62 schools are located build a system of information that not only fulfils the purpose of studies such as this, but also to strengthen their own development processes through the use of reliable and valid information about the local context.
2 For the details about the study’s rationale, objectives, scope, approach and sampling methods please refer CERID Longitudinal Study Report 2005.

2
Ensuring Quality of Data
The study has remained extremely serious about the need to ensure that the data of the student cohort are of good quality. Every measure that could possibly be conceived of has been taken not only to assure that students are tracked without being left out or assigned multiple codes for the same student but also to make sure that the data corresponding to each student is accurate. The approach to data collection was drastically changed 2 years ago to one that involved respective school representatives in series of workshops to thoroughly review their own school data. They also had the opportunity to assess the significance, purpose and utility of the data that the study had been collecting over the years by critically reviewing the data collection forms developed by the study.3 Despite the tremendous effort that the study and the schools have made, it was impossible to attain perfection, although the huge volume of errors detected has been minutely corrected. The issue of inaccuracy and almost 50% schools submitting incomplete data (FRP Longitudinal Study 2005) has been largely addressed in the past two years. In any case, since the compiled school-wise data and key analysis reports are sent back to respective schools, they are increasingly taking the ownership and final responsibility of data quality.
Analysis and Interpretation of Results
As already mentioned in the background section, the analysis presented in this report is based on the individual student cohort data of the sampled schools. The first lot of those data was collected from all newly enrolled first grade students in 2002. In the successive years, those who continued in their respective schools either by being promoted to higher
Figure 1. Student Cohort flow 2002-2006
Year Grade
1 Grade
2 Grade
3 Grade
4 Grade
5
D
2002 NE N1
R D
2003 NE N2 P
N3
R D
2004 NE
N4 P N5 N6
R D
2005 NE N7 P N8 N9 N10`
R D
2006 NE N11 P N13 N14 N15
N16
grades or by repeating grades were all followed to track their progress. In addition, the first grade new enrollees in the successive years were also tracked so that the year-by-year cohorts could be compared. Thus the Longitudinal Study database is now equipped
3 Details about the re-oriented approach to data collection are documented in the Longitudinal Study report 2005.
3
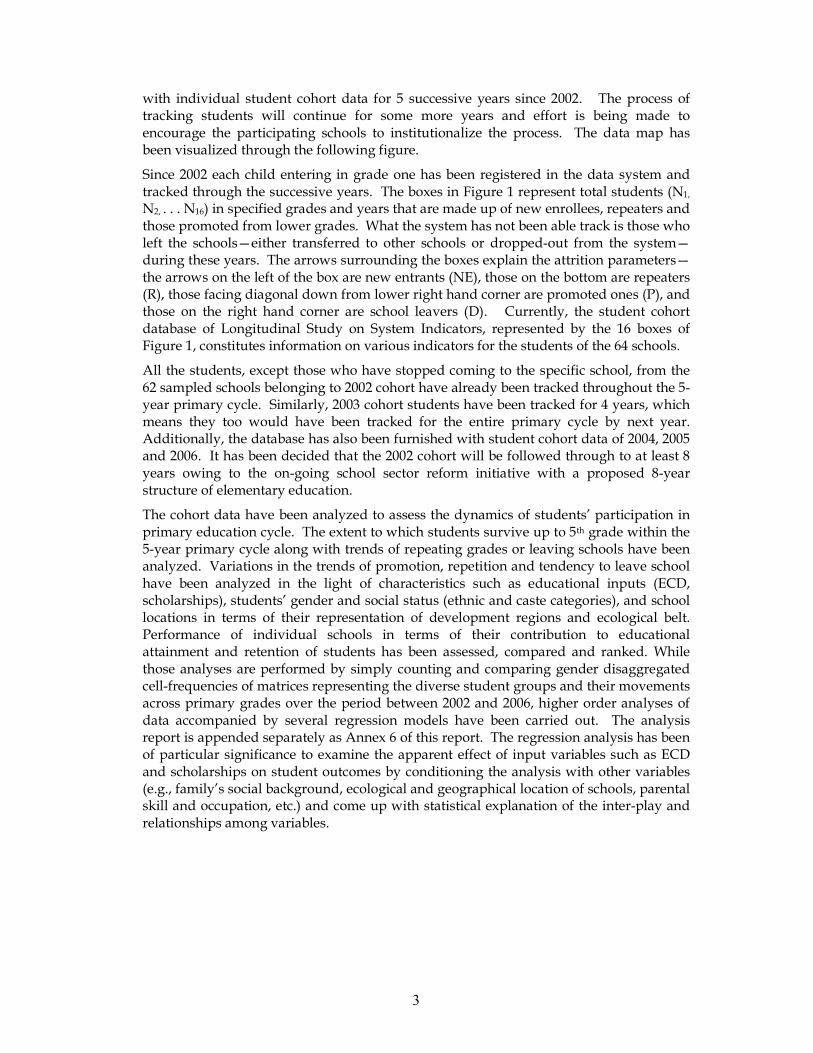
with individual student cohort data for 5 successive years since 2002. The process of tracking students will continue for some more years and effort is being made to encourage the participating schools to institutionalize the process. The data map has been visualized through the following figure.
Since 2002 each child entering in grade one has been registered in the data system and tracked through the successive years. The boxes in Figure 1 represent total students (N1,
N2, . . . N16) in specified grades and years that are made up of new enrollees, repeaters and those promoted from lower grades. What the system has not been able track is those who left the schools—either transferred to other schools or dropped-out from the system—during these years. The arrows surrounding the boxes explain the attrition parameters—the arrows on the left of the box are new entrants (NE), those on the bottom are repeaters (R), those facing diagonal down from lower right hand corner are promoted ones (P), and those on the right hand corner are school leavers (D). Currently, the student cohort database of Longitudinal Study on System Indicators, represented by the 16 boxes of Figure 1, constitutes information on various indicators for the students of the 64 schools.
All the students, except those who have stopped coming to the specific school, from the 62 sampled schools belonging to 2002 cohort have already been tracked throughout the 5-year primary cycle. Similarly, 2003 cohort students have been tracked for 4 years, which means they too would have been tracked for the entire primary cycle by next year. Additionally, the database has also been furnished with student cohort data of 2004, 2005 and 2006. It has been decided that the 2002 cohort will be followed through to at least 8 years owing to the on-going school sector reform initiative with a proposed 8-year structure of elementary education.
The cohort data have been analyzed to assess the dynamics of students’ participation in primary education cycle. The extent to which students survive up to 5th grade within the 5-year primary cycle along with trends of repeating grades or leaving schools have been analyzed. Variations in the trends of promotion, repetition and tendency to leave school have been analyzed in the light of characteristics such as educational inputs (ECD, scholarships), students’ gender and social status (ethnic and caste categories), and school locations in terms of their representation of development regions and ecological belt. Performance of individual schools in terms of their contribution to educational attainment and retention of students has been assessed, compared and ranked. While those analyses are performed by simply counting and comparing gender disaggregated cell-frequencies of matrices representing the diverse student groups and their movements across primary grades over the period between 2002 and 2006, higher order analyses of data accompanied by several regression models have been carried out. The analysis report is appended separately as Annex 6 of this report. The regression analysis has been of particular significance to examine the apparent effect of input variables such as ECD and scholarships on student outcomes by conditioning the analysis with other variables (e.g., family’s social background, ecological and geographical location of schools, parental skill and occupation, etc.) and come up with statistical explanation of the inter-play and relationships among variables.

4
Chapter 2
Analyses and Interpretations
The individual student data of the 62 sampled school—which have been made as reliable and valid as possible through a rigorous process of verification—now allows analysis of the progress trends of key system indicators at a more localized level. The difference from how the system indicators data analyzed in the past lies in the consideration of what the unit of analysis is—now student as opposed to school is the unit of analysis. However, minute micro analysis of data lies beyond the scope of this study. The possibility that lay open by the individual student data should definitely generate interests of the partnering individual schools, educational researchers focusing more on in-depth case studies and ethnography and most importantly class teachers, head-teachers, Resource Persons and the teacher training institutions such as Educational Training Centers (ETCs).
There are at least two distinct advantages. With the systematically organized record system of individual student, schools now have the opportunity to verify, and if necessary correct, the aggregate figures on different indicators which they have come up with (mainly to supply them to DOE for Flash reporting purposes). They can plan school and pedagogical activities more meaningfully convincingly articulating (with concrete and valid evidence) their demands for critically necessary resources. Secondly, statistical analyses of indicators are possible at a minutely micro level of the primary education system, e.g. at classroom or specific groups or individuals within the classroom level. Minute diagnosis of issues and problems related to achieving EFA goal is now possible at least in the context of the 62 sampled schools. In this context, the analyses and interpretations of data that are being presented in the following sections are a clear departure from how the study had been reporting its analysis of system indicator data thus far.
General Overview of the Cohort Flow Scenario
As already described above, tracking of students started in 2002. The data on a set of indicators for a total of 2589 grade-one students of the 62 sampled schools, as a first lot to be followed through to fifth grade (more sensible now to track up to eighth grade), were kept in record. Similarly in the successive years the numbers of new intakes in grade one show some variations but not in any particular pattern.4
4 What the database has lost track of over the years is information of those students who have stopped coming to the 62 schools either to join other school or to dropout of primary schooling altogether. Therefore, student counts as grade promoted and repeaters each year after entry in the first grade do not account those who left the school in any particular year. We know who chose not to come back to the same school but we don’t know how many of them repeated the same grade or promoted to higher grades in the school where they moved, if they have done so. However, these figures can be estimated by playing mathematically with the numbers of new intake and out-flow of students in a particular grade in a particular year.
Estimated dropout in, e.g., grade 1 = (total number of students who have chosen not to return to the school next academic year) – (total number of newly enrolled children in grade one in that particular academic year)

5
Student Enrollment Table 1 presents the numbers of students newly entered in grade ones in the years between
2002 and 2006. The year-wise figures do not show any consistent increase or decrease in
grade one enrollment over the years, except in 2005. The figures vary from the lowest
2260 in 2003 to highest 3653 in 2005. This situation is more or less similar to both boys
and girls. What must not be forgotten is that those were the years when the country was
going through a sever crisis of internal armed conflict. It could be possible that families
might have to be moved to safer locations as and when communities are caught between
the cross-fire and personal safety is at stake. The variation in the grade-one intake could
have been the reflection of the volatile security situation in the local contexts.
Table 1. Total new entrants in grade-one for the years 2002 to 2006
Year Boys Girls Total
2002 1271 1318 2589
2003 1124 1136 2260
2004 1327 1375 2702
2005 1768 1885 3653
2006 1346 1328 2674
Student Promotion to Upper Grades
In the case of 2002 cohort, 21% of students have made it up to grade five in exactly 5 years—slightly higher percentage in the case of girls (22.5 percent) than boys (see Table 2). This figure for the cohorts of 2003 onward can be expected to rise substantially, as there is a clear indication that comparatively more student proportion of 2003 cohort has made it up to grade 4. The percentage-pattern in grade 3 also depicts a clear increasing trend with girls making better progress in 2004. Students of 2005 cohort have done best with 64.0 percent (64.8 percent of girls) promoted to grade 2 in the successive year. The promotion trend since 2004 is particularly notable as more than half of the students are promoted to higher grades.
Table 2. Promotion flow of first grade new enrollees by cohorts
Cohort Year
Students Grade 1 new
intake
Grade 2 in year 2
Grade 3 in year 3
Grade 4 in year 4
Grade 5 in year 5
2002 Total 2589 1327(51.3) 819(31.6) 657 (25.4) 544 (21.0)
Girls 1318 702 (53.3) 449 (34.1) 364 (27.6) 296 (22.5)
2003 Total 2260 957 (42.3) 724 (32.0) 644 (28.8)
Girls 1136 481 (42.3) 364 (32.0) 327 (28.5)
2004 Total 2702 1375 (50.9) 1116 (41.3)
Girls 1375 730 (53.1) 597 (43.4)
2005 Total 3653 2341 (64.0)
Girls 1885 1221 (64.8)
2006 Total 2674
Girls 1328
Estimated promotion rate to grade 2 = Promoted from grade one + New entrants in grade 2 – Estimated repeaters from among the new entrants (calculated by subtracting the proportion of the new entrants from total new entrants as that of the actual repeaters from among the total students)
This report, however, does not include these calculations.

6
Figures within parentheses are percentages compared with the base year enrollment.
The overall scenario of the progression of the 2589 grade-one students of 2002 over the 5-year period tells a very revealing story about the access, quality and efficiency of the 62 sampled schools which may be generalized, with caution,5 for the national primary education system. Clearly the wastage is very high with only 21% of the 2002 grade-one new intake making it up to grade 5. The problem of promotion is most pronounced while assessing student flow from grade one to two. For three successive years since 2002 only about half of grade one new entrants are promoted to grade two. Nonetheless, the promotion rate in 2005 is indeed a significant improvement.
A varying trend is also evident when the student progression is compared regionally (see Table 3). Mid-west lags far behind compared to other regions. Eastern region students have done best in terms of promotion up to grade 5.
Table 3. Promotion flow of 2002 first grade new enrollees through the primary cycle by region
Region Students Grade 1 Grade 2 Grade 3 Grade 4 Grade 5
Overall Total 2589 1327(51.3) 819(31.6) 657 (25.4) 544 (21.0)
Girls 1318 702 (53.3) 449 (34.1) 364 (27.6) 296 (22.5)
Eastern Total 718 329 (45.8) 201 (28.0) 180(25.1) 167 (23.3)
Girls 358 176 (49.2) 109 (30.4) 98 (27.4) 94(26.3)
Central Total 532 223 (41.9) 157 (29.5) 125 (23.5) 103(19.4)
Girls 270 117 (43.3) 87 (32.2) 68 (25.2) 56 (20.7)
Western Total 397 203 (51.1) 134 (33.8) 113 (28.5) 84 (21.2)
Girls 212 116 (54.7) 72 (34.0) 61 (28.8) 44 (20.8)
Mid-west Total 379 146 (38.5) 86(22.7) 66 (17.4) 52 (13.7)
Girls 191 71 (37.2) 44 (23.0) 34 (17.8) 30 (15.7)
Far-West Total 506 202 (39.9) 148 (29.2) 108 (21.5) 95 (18.8)
Girls 259 110 (42.5) 86 (33.2) 59 (22.8) 52 (20.1) Figures within parentheses are percentages compared with the base year enrollment.
Both Table 2 and Table 3 depict an interesting participation and promotion of girls in primary grades. The fact that in all the regions, except in Western region, as well as across almost all years’ cohort girls’ promotion figure outnumbered that of boys does seem to suggest an achievement in gender parity at least in the 62 sampled schools. However, this finding cannot be generalized. If one is to consider the survival rate as a proxy indicator of quality, obviously the quality of primary education delivered by the 62 sampled schools is very poor. The study sample might have represented a typical public school of Nepal but it has in no way represented better performing public and private schools. It should, therefore, be of interest of investigation whether similar gender parity prevails in such schools or if in the contrary whether boys are privileged to go to such schools. The gender scenario depicted in Table 2 and Table 3 should only be understood as half or less of the story told about gender parity in primary education.
Repetition Pattern
Highest number of students tends to repeat the first year of their entry into grade 1, which is true for both boys and girls—half of those who repeat are girls. About 26% of the first time grade-1 repeaters are of the age under 5 years. The number of repeaters
5 The study is cautious to claim that the 62 sampled schools collectively represent the national primary school system as the principle of drawing random samples of school at the regional strata was compromised owing to the need for the study to respond to the practical issue of proximity for data collection purpose. Schools located at extremely isolated areas and those that are privately run are not included in the sample.

7
drastically decreases in the third year and gradually in the successive years. The 28.2% repeaters at grade 1 is a perennial problem experienced by the primary education system. What is even more worrying is that 5 of those are still repeating grade one, which forces any sensible educator to question what purpose our primary education system fulfilling for those 5 children—a serious blow to the spirit of Education for All.
Table 4. Repetition flow of 2589 first grade new enrollees of 2002 through the first 5-year
Year Students Grade 1 Grade 2 Grade 3 Grade 4 Total Repeater
2003 Total 729 (28.2) 729 (28.2)
Girls 373 (28.3) 373 (28.3)
2004 Total 135 (6.0) 173 (7.7) 308 (11.9)
Girls 70 (6.2) 95 (8.4) 165 (12.5)
2005 Total 42 (1.6) 77 (2.8) 94 (3.5) 213 (8.2)
Girls 17 (1.2) 36 (2.6) 51 (3.7) 104 (7.9)
2006 Total 5 (0.1) 25 (0.7) 57 (1.7) 65 (2.0) 152 (5.9)
Girls 1 (0.1) 12 (0.7) 32 (2.0) 35 (2.2) 80 (6.1) Overall Total 911 (35.2) 275 (10.6) 151 (5.8) 65 (2.0) 1402(54.2)
Girls 461 (35.0) 143 (10.8) 83 (6.3) 35 (2.0) 722 (54.8) Figures within parentheses are percentages compared with the base year enrollment which is 2589.
Repeater Index
In order to assess the overall magnitude of repeaters in a given primary cycle in any particular context of students (class, school, district, region and nation) repeater index corresponding to new intake of a particular year for a complete primary cycle can be calculated by taking the ratio of number of actual repeats and total possible repeats. For a given primary cycle, the repeater index RI can be calculated as following:
RI = R/ (NY-D)
Where R is the total actual repeat, N is total number of new intake in grade 1, Y is the number of year (for a 5-year primary cycle the value of Y is 4) and D is the school leavers during years Y.
The RI can be obtained for every school and within school for each grade. Comparisons between repeater indexes of different grades for the same cohort and same grades for different cohorts reveal intriguing findings. As the data of full primary cycle is available only for cohort 2002, the cohort comparison of RI is not yet possible.
In the case of the 2002 cohort of all 62 schools for the entire primary cycle the RI is 0.16. In an ideal case we expect the RI to be close to zero. The RI for year 1 of 2002 cohort is 0.39 which is reduced to 0.12 in year 5.
Magnitude and Pattern of School Leavers
51.0% of the students (1316 out of 2589 students) enrolled in grade 1 in 2002 left their respective schools for unknown cause in the 5-year period between 2002 and 2006. More boys than girls tend to leave schools. The figure for girls (48.5%) is almost 5 percent point lower than that of boys (53.3%). Most boys and girls leave the school the very next year they enroll in grade 1 and 2 and the number gradually decreases with the passage of academic years. Most boys and girls leave the school the very next year they enroll in grade 1 and the number gradually decreases with the passage of academic years. The study sample is constrained by its scope to make any inference about the characteristics of the chunk of student population leaving the current school. Analysis of such a segment of student population contributes more meaningful findings for the EFA policy

8
and program to be more appropriately responsive. Unfortunately, tracking students who move on is beyond the scope of this study.
Table 5. Flow of school-leavers from among the 2589 first grade new enrollees of 2002 through the first 5-year primary cycle
Year Students Grade 1 Grades 1 & 2 Grades 1, 2 & 3 Grades 1, 2, 3 & 4 Total School Leavers
2003 Total 533 (20.6) 533
Girls 242 (18.4) 242
2004 Total 518 (25.2) 518
Girls 261 (24.3) 261
2005 Total 191 (12.0) 191
Girls 86 (11.0) 86
2006 Total 74 (5.5) 74
Girls 50 (6.9) 50
Overall
Total 1316 (51%)
Girls 639 (48.5%)
Boys 677 (53.3 %)
Figures within parentheses are percentages.
Estimation of Primary School Dropout
Within the scope of this study it is not possible to assert the exact number of primary education system drop-out from among the 51.0% of the 2002 first grade entrants who have left their respective schools. Some of them may have been transferred to other schools while others may have dropped out altogether—but primary data is not available to pronounce the exact number in these categories. However, a rough figure of the system dropout may be estimated with the currently available data. Just as students move away from the 62 sampled schools, in the same years they move away, we also have new students joining these schools. The difference between those moving away and the new ones coming in can be considered as a crude figure of the system dropout.
Distribution of Schools by Flow Patterns of Student Cohort
The individual student database allows analyses of cohort flow, among others, at school and even at classroom levels—with the potential to make the task of micro level planning, e.g. classroom pedagogy and SIP, more systematic and the plans more powerful and responsive to local educational needs. In this section, school specific analysis of the cohort flow is presented for some specially featuring schools from among the 62 sampled schools. The 62 schools are ranked (see Annex 1) by the percentages of students reaching grade 5 in 2006 (from among those enrolled in grade 1 in 2002).
Outlier Cases
It is intriguing to find that one of the 62 schools is running only up to grade 3 while one other is running up to grade 4 for the past 5 years. What’s more, the former school (Srijana Primary School of Sankhuwasabha district) had only 1 boy enrolled in grade 1 in 2002 who made it to grade 3 in 2003 and what happened to him after that is not known. This school in successive years continued to enroll very small number of students—only 5 students (4 girls, 1 boy) in 2003, 8 (7 girls, 1 boy) in 2004, 6 in 2005 (4 girls, 2 boys) and 2 (1 girl, 1 boy) in 2006. The school running up to grade 4 is Bhimaly Primary School of Dhunchhe, Rasuwa district. It is surprising that this school located at the very district headquarter has not acquired the status of a full fledged primary school and continues to enroll a very insignificant number of students. The numbers of students enrolled in grade 1 in the past five years are 11 (3 girls, 8 boys—only 2 boys made it up to grade 3 in

9
3 years) in 2002, 15 (3 girls, 12 boys—only one boy made it up to grade 3 in 3 years) in 2003, 10 (8 girls, 2 boys—4 girls are now in grade 3) in 2004, 7 (1 girl, 6 boys—6 are now in grade 2) in 2005 and 12 (4 girls, 8 boys) in 2006. The schools having incomplete primary grades with continued grade-one new intake of less than 15 do not seem to draw the administrative attention. The purpose of letting them operate with the current status is not clear nor have they assured the quality of education if at all they are serving the basic educational needs of hard-to-reach population groups. There is no sign of change or improvement in the way those schools are running for the past 5 years.
Pattern of Promotion Flow by School (2002 Cohort)
There is no particular trend or consistency of school specific performances in terms of survival to grade 5 within any particular district. There are schools from a particular district have ranked among top 10 while others from the same districts are ranked at the bottom 10. Schools from districts such as Ilam, and Lalitpur, have shown such pattern. There are also schools from particular districts (e.g. Rasuwa, Sankhuwasabha, Lalitpur and Kavre) that have consistently ranked at the bottom end of the school list. In general, however, it can be concluded that irrespective of the district where a particular school belongs the scenario of school-specific student survival up to grade 5 within a single primary cycle varies from well below average to well above average rank. Schools especially in the hill districts show wide variations in their ranks.
Schools’ rates of student survival up to grade 5 in 5 years vary from as low as 0% to the highest of 67.5%. Two schools which do not run grade 5 have been categorized as having 0% survival rate. What is alarming is that 51 (82.3%) of the 62 schools have shown very poor status of student promotion with less than 30% surviving up to grade 5 within 5 years of primary cycle (2002 cohort).
Figure 2. School-wise percentage distribution of students surviving up to grade 5 (2002 cohort)
0
10
20
30
40
50
60
70
80
90
1 3 5 7 9 11 13 15 17 19 21 23 25 27 29 31 33 35 37 39 41 43 45 47 49 51 53 55 57 59 61
School rank
Su
rviv
al
perc
en
t
Boys
Girls
Total
Rastirya Saraswati Primary School of Dhankuta displays a wide gender gap in the survival rate with 50% girls against only 0% boys making it up to grade 5 in the 5–year primary cycle. In this school the number of students entering grade 1 in 2002 is rather too small (only 8 with equal number of boys and girls), of which only 2 girls have made it up

10
to 5th grade in 5 years. There are 11 other schools that have similar gender-composition trend in the survival rates but with lesser degree of gender gap (see Figure 2 and Annex 1). The reverse is also true for some schools e.g. the survival to grade 5 in 5 years in the case of Shree Mangla Devi Primary School of Kavre is 0% girls and 20% boys and that in the case of Shree Saraswati Primary School of Sankhuwasahba is 0% girls and 15.4% boys. It is interesting, however, that in most of the schools (38 out of 60) the survival rate of boys is less than that of girls. However, the degree of gender gaps is distributed inconsistently, (and the gap switches in favor of either sex) among the schools. Therefore, the gender distribution of the survival rates sends a rather mixed signal and is very school specific.
School Pattern of Repetition Flow
Repeating grade is a common phenomenon of all the 62 sampled schools. The most striking similarity among them is the proportion of grade one repeater after the completion of the first year of the primary cycle. As listed in Annex 2, schools vary widely in terms of their repeater index. One school in particular gets a perfect zero as its repeater index meaning that no student in the school has ever repeated grade. It is Srijan Primary School of Wana, Sankhuwasabha. On the contrary, some schools are not doing very well in reducing their repeater rate down. Repetition rates, therefore, vary largely because of school characteristic.
Caste, Ethnicity and Student Cohort
This section presents the analysis of the pattern of cohort of students belonging to specific caste, dalit and ethnic groups. This is yet another set of disaggregated analysis that the study could carry out because of the way the individual student data are organized in the database. In fact, the study database is comprised of disaggregated information on specific indicators for all the 102 ethnic and caste groups identified by the Census 2001. It is, therefore, possible that each of these ethnic groups can be separately analyzed. However, this section has assessed the 2002 student cohort based on the ethnic and caste groups that have been categorized according to specific characteristics such as highly marginalized ethnic groups, dalits, highly marginalized Terai dalit caste groups (Chamar, Harizan and Ram) and Muslims. The details of the cohort flow (2002) of these ethnic and castes groups are attached as Annex 4, Annex 5, Annex 6, and Annex 7.
Promotion Flow by Caste and Ethnicity
The representation of ethnic, dalit and highly marginalized dalits from terai (Chamar, Harijan and Ram) in the new grade 1 intake 2002 is very low. The intake does not include any student belonging to the ethnic group categorized by the Nepal Indigenous Peoples’ Association (NIPA) as endangered. Only 12 students (3 girls) enrolled in grade 1 in 2002 are from the ethnic minority categorized as highly marginalized group and 10 students (4 girls) are from Terai dalits with Chamar, Harijan and Ram as surnames. Dalits from both hills and Terai constitute about 17.0% (437) while Muslims constitutes about 5% (119) of the total students enrolled in grade 1 in 2002.
According to Table 6 the 2002 grade 1 new intake from all the minority groups except the Terai dalit (Chamar, Harijan and Ram) and highly marginalized ethnic groups consists of around 50% girls. The new intakes from Terai dalit and highly marginalized ethnic group are small compared to other groups with 40% representation of girls. In the case of dalit and Terain dalit, the percentages of students moving up to 2nd grade in year 2 are almost at par with the overall average for both boys and girls. Least percent of the Muslim

11
students (least even in the case of Muslim girls) manage to move up to grade 2. The proportion of Muslim students making it up to 5th grade in year 5 is the least compared to other ethnic and caste groups, which also is far below the overall average of 21.0%. Similar scenario is evident in the case of dalit and Chamar, Harijan and Ram. In sum it is clear that Chamar, Harijan, Ram, dalits and Muslims have seen their children still lagging far behind in primary school. Therefore, they deserve deliberate policy response.
Table 6. Promotion flow of 2002 first grade new enrollees through the primary cycle by ethnic/caste groups
Caste/ethnic group Students Grade 1 Grade 2 Grade 3 Grade 4 Grade 5
Overall Total 2589 1327(51.3) 819(31.6) 657 (25.4) 544 (21.0)
Girls 1318 702 (53.3) 449 (34.1) 364 (27.6) 296 (22.5)
Highly marginalized ethnic
Total 20 9 (45.0) 7 (35.0) 5 (25.3) 5 (25.0)
Girls 8 3 (37.5) 2 (25.0) 2 (25.0) 2 (25.0)
Dalit Total 436 218 (50.0) 127 (29.1) 102 (23.4) 73 (16.7)
Girls 218 114 (52.3) 68 (31.2) 57 (26.1) 39 (17.9)
Chamar, Harijan and Ram
Total 10 5 (50.0) 5 (50.0) 3 (30.0) 2 (20.0)
Girls 4 2 (50.0) 2 (50.0) 2 (50.0) 1 (25.0)
Muslim Total 119 39 (32.8) 17 (14.3) 15 (12.6) 14 (11.8)
Girls 54 17 (31.5) 8 (14.8) 7 (13.0) 7 (13.0) Figures within parentheses are percentages compared with the base year enrollment of the respective groups.
Repetition by Caste and Ethnicity
The incidence of repeating same grade for number of years is evident in quite a few newly enrolled grade one students of 2002. Table 7 presents 5 students who have remained in grade one for the entire 5-years primary cycle. However, none of the four categories of caste and ethnic groups, except dalit, chosen here for analysis displays the problem of the recurring repetition in grade one. One dalit boy has repeated grade one for 5 consecutive years, while several have repeated 2, 3 or 4 years. The repetitions in 2003 and 2004 of the students from rest of the groups (except highly marginalized ethnic group for 2nd year) are consistent with the overall rate. Except dalit students, none belonging to all the four caste and ethnic groups repeat grade one more than 2 times, while one among 5 cases repeating grade one for 5 successive years and 8 among 39 cases repeating 4 successive years are dalit students (see Table 7).
Table 7. First grade repeaters by caste and ethnic students (during 2002-2006)
Year Students All Highly marginalized ethnic group
Dalit Chamar, Harijan and
Ram
Muslim
2003 Total 729 (28.2) 3 (27.3) 137 (31.4) 3 (27.3) 30 (25.2)
Girls 373 (28.3) 1 (25.0) 66 (30.3) 2 (50.0) 20 (37.0)
2004 Total 173 (6.7) 0 (0.0) 38 (8.7) 2 (18.2) 7 (5.9)
Girls 95 (7.2) 0 (0.0) 22 (10.1) 1 (25.0) 6 (11.1)
2005 Total 42 (1.5) 0 (0.0) 8 (1.8) 0 (0.0) 0 (0.0)
Girls 17 (1.1) 0 (0.0) 4 (1.8) 0 (0.0) 0 (0.0)
2006 Total 5 (0.2) 0 (0.0) 1 (0.2) 0 (0.0) 0 (0.0)
Girls 1 (0.1) 0 (0.0) 0 (0.0) 0 (0.0) 0 (0.0) Figures within parentheses are percentages compared with the base year enrollment of the respective groups.
Repeating grade one is not a serious gender related problem for highly marginalized and dalit groups. But it is for Chamar, Harijan, Ram and Muslim. The girls’ proportion of repetition for these caste groups far exceeds the general as well as male students’ average. Therefore, not only do these groups as a whole lag behind from being promoted to higher grades, but also more girls belonging to these groups in particular are not doing well in primary school. Besides, it is clear from Table 6 that the proportion of students from the
12
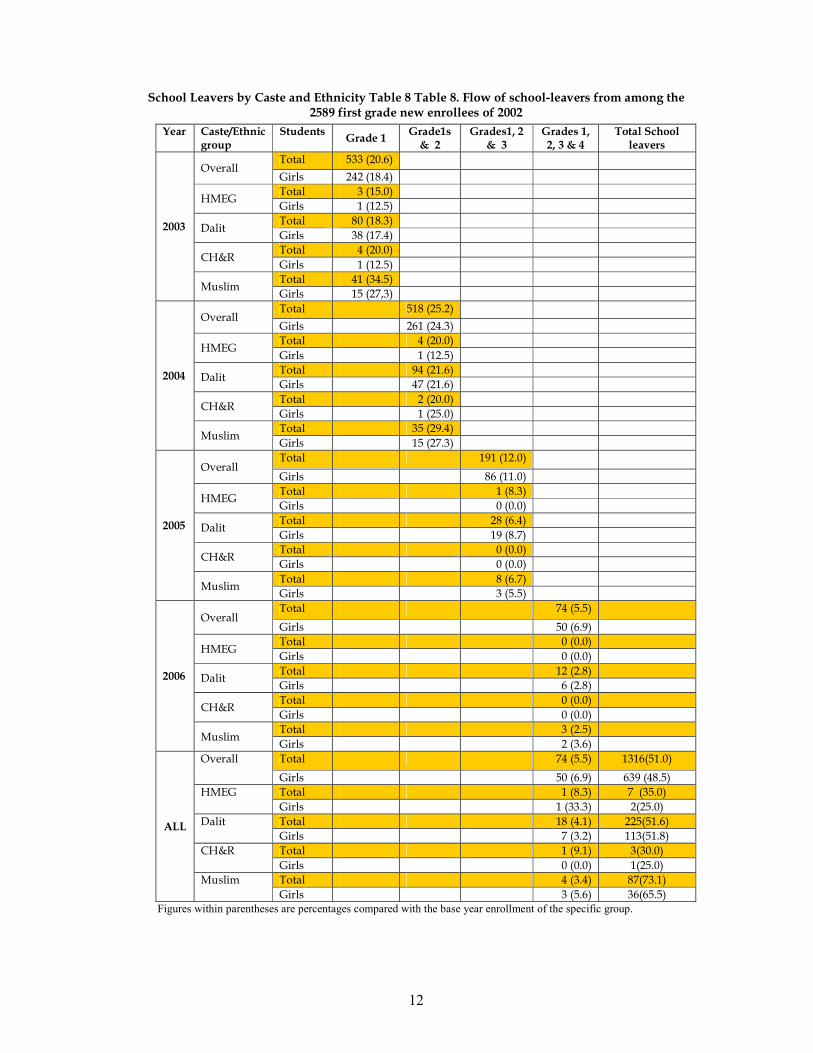
School Leavers by Caste and Ethnicity Table 8 Table 8. Flow of school-leavers from among the 2589 first grade new enrollees of 2002
Year Caste/Ethnic group
Students Grade 1
Grade1s & 2
Grades1, 2 & 3
Grades 1, 2, 3 & 4
Total School leavers
2003
Overall Total 533 (20.6)
Girls 242 (18.4)
HMEG Total 3 (15.0)
Girls 1 (12.5)
Dalit Total 80 (18.3)
Girls 38 (17.4)
CH&R Total 4 (20.0)
Girls 1 (12.5)
Muslim Total 41 (34.5)
Girls 15 (27,3)
2004
Overall Total 518 (25.2)
Girls 261 (24.3)
HMEG Total 4 (20.0)
Girls 1 (12.5)
Dalit Total 94 (21.6)
Girls 47 (21.6)
CH&R Total 2 (20.0)
Girls 1 (25.0)
Muslim Total 35 (29.4)
Girls 15 (27.3)
2005
Overall Total 191 (12.0)
Girls 86 (11.0)
HMEG Total 1 (8.3)
Girls 0 (0.0)
Dalit Total 28 (6.4)
Girls 19 (8.7)
CH&R Total 0 (0.0)
Girls 0 (0.0)
Muslim Total 8 (6.7)
Girls 3 (5.5)
2006
Overall Total 74 (5.5)
Girls 50 (6.9)
HMEG Total 0 (0.0)
Girls 0 (0.0)
Dalit Total 12 (2.8)
Girls 6 (2.8)
CH&R Total 0 (0.0)
Girls 0 (0.0)
Muslim Total 3 (2.5)
Girls 2 (3.6)
ALL
Overall Total 74 (5.5) 1316(51.0)
Girls 50 (6.9) 639 (48.5)
HMEG Total 1 (8.3) 7 (35.0)
Girls 1 (33.3) 2(25.0)
Dalit Total 18 (4.1) 225(51.6)
Girls 7 (3.2) 113(51.8)
CH&R Total 1 (9.1) 3(30.0)
Girls 0 (0.0) 1(25.0)
Muslim Total 4 (3.4) 87(73.1)
Girls 3 (5.6) 36(65.5) Figures within parentheses are percentages compared with the base year enrollment of the specific group.

13
four caste and ethnic groups in the 2002 new intake in grade one is relatively very small, except in the case of dalits. This suggests that access to primary school has continued to be equally a critical issue for three of the four caste/ethnic groups.
Table 8 depicts that the incident of Muslim students (including Muslim girls) leaving the school the very next academic year they enroll in grade one is much higher than the overall average. About three fourth Muslim students left school in 5 years. It is also evident in the table that the Terai dalit (Chamar, Harijan and Ram) and highly marginalized ethnic group have the least proportion of boys and girls leaving school during the same period, while dalit stayed close to the overall average. One of the 4 girls enrolled in grade 1 from Chamar group has left the school in the second year while two of them repeated the grade—one left after two years and two have stayed on.
There is no particular pattern to explain the trend of students from the four castes and ethnic groups leaving schools prior to completing the primary cycle. What is apparent though is that students from these groups do move on whether soon after completing first year or in the 3rd, 4th or 5th year. In the context of ensuring basic education for all the mobility of students makes educational planning and management all the more difficult task.
ECD’s Contribution to Promotion Rate
Of the 13,302 new entrants in grade one during the period 2002 to 2006 whose information on ECD background is available only 2213 (16.6%) are found to have gone through an ECD or pre-school program prior to enrolling in grade one. Table 9 depicts how ECD impacts on promotion of boys and girls in primary grades for the years 2002 to 2005 (promotion data for 2006 were not available at the time of this analysis). The analysis is, however, not conditioned for any other probable factors impacting on the promotion. The figures in Table 9 show that grade-one students with ECD experience tend to be promoted more than that of those without ECD experience for both boys and girls.
Table 9. Promotion flow (in %) of grade-one students by cohort year and ECD background
Cohort year
Girls n=5441
Boys n=5250
With ECD Without ECD
Difference With ECD Without ECD
Difference
2002 NE=2589
67.6 (115)
51.2 (588)
16.4 63.5 (108)
46.9 (516)
16.6
2003 NE=2260
43.7 (107)
42.0 (374)
1.7 41.6 (87)
42.5 (389)
-0.9
2004 NE=2702
62.4 (143)
51.2 (587)
11.2 65.1 (114)
46.1 (531)
19.0
2005 NE=3653
77.0 (231)
62.5 (990)
14.5 76.5 (218)
60.8 (902)
15.7
Figures within parentheses are the number of students
NEs are grade one new entrants in particular cohort years.
The highest difference (16 percent points) in promotion rates between the students (both boys and girls) with and without the ECD experience is observed in the year 2002, which makes a drastic fall to a minimum difference (negative in the case of boys) in 2003. The difference in the promotion rates between the two groups of students has increased, very notably in the case of boys, in 2004 and stayed stable in 2005. This scenario of fluctuating difference in the promotion rates over the years seeks explanations about the type, seriousness and worth of ECD programs, which may be pursued through a more in-depth qualitative study. One of the key questions to be explored may be if the quality of

14
ECD program has suffered as the number and coverage increased over time with a possible consequence of indifferent impact on student promotion.
A more sophisticated statistical analysis adds a new dimension of caution against the claim of goodness of ECD on student performance (exemplified by scoring higher and more frequently promoting to higher grades). A step-by-step regression analysis with student examination score as the dependent variable and, to beginning with, ECD and gender as the independent variables was carried out (see Annex 7). The effect of ECD and gender on examination score was further conditioned by including in the analysis number of other potentially intervening predictors. What emerged interestingly was that ECD effect on score has been reduced as the analysis is conditioned by variables such as ecological zones and parental skills. Therefore, the effect of ECD must not be taken at its face value. The deeper analysis has clearly brought on surface that ECD is mostly the urban or Kathmandu valley centric phenomenon largely benefiting children of highly skilled parents. Children belonging to families faced with regional and educational marginalization are doubly deprived—scant opportunity to attend ECD and, largely because of this, faced with the uncertainty of the benefit that an ECD program might bring to them.
Impact of ECD in the Cohort Survival
Comparatively the number of children entering grade one in 2002 with ECD background is much smaller than those not having such background. However, the number in the former category is still high enough to make an inference about the effect of ECD on student survival. The distribution of grade one enrolees with and without ECD background by caste groups also represent similar pattern (see Annex 8).
Table 10. Cohort flow of 2002 grade one enrollees by ECD background
Students with
2002 Grade I
2003 Grade II
2004 Grade III
2005 Grade IV
2006 Grade V
Boys Girls Total Boys Girls Total Boys Girls Total Boys Girls Total Boys Girls Total
ECD 170
(100) 170
(100) 340
(100) 108 (64)
115 (68)
223 (65)
65 (38)
77 (45)
142 (42)
55 (32)
66 (39)
121 (35)
50 (29)
55 (32)
105 (31)
No ECD 1101 (100)
1148 (100)
2249 (100)
516 (47)
588 (51)
1104 (49)
305 (28)
372 (32)
677 (30)
238 (22)
298 (26)
536 (24)
198 (18)
241 (21)
439 (20)
Total 1271 (100)
1318 (100)
2589 (100)
624 (49)
703 (53)
1327 (51)
370 (29)
449 (34)
819 (32)
293 (23)
364 (28)
657 (25)
248 (20)
296 (22)
544 (21)
Figures within parentheses are percentages
Table 10 shows a difference of 10% points between the two categories of students in their survival up to grade 5 after 5 years of schooling. The effect of ECD on children’s primary education is, therefore, visibly present. The effect is uniform for both boys and girls and according to the table listed in Annex 8 almost all caste groups suggesting ECD program’s gender and caste-neutral impact on children’s attainment in public primary schools. However, the reduced effect of ECD on promotion due to the effect of students’ social and geographical background applies in this case too (see analysis in Annex 8). Hence, the argument that ECD has remained largely a phenomenon of Kathmandu valley benefiting the children belonging to families with relatively better skilled parents needs serious consideration so that the possibility of overrating the effect of ECD on student achievement in primary school is avoided.
Impact of Scholarships
Students’ promotion from grade 1 to 2 in years 2002 through 2006 is presented in Table 11 in relation to the provision of scholarships. The table shows that scholarship is a

15
contributing factor for student promotion from grade 1 to 2. Effect of scholarships is more pronounced in the years 2002, 2005 and 2006. For some unknown reason, however, the effect of scholarship in 2003 is negative. But this negative effect is only an isolated result.
Just as in the case of gender analysis of promotion of students with ECD and non-ECD categories (Table 10), no strong gendered-effect of scholarship is evident in the promotion of grade 1 student to grade 2. Therefore, while scholarship does contribute to student promotion, it does not favor boys over girls or vice-versa.
Table 11. Pass rate (%) of grade 1 students by years and scholarship
Year
Boys Girls
With scholarship
Without scholarship
Change in pass percent
With scholarship
Without scholarship
Change in pass percent
2002 67.90 (128)
49.91 (1143)
17.99 63.75 (174)
54.66 (1144)
9.09
2003 47.86 (104)
54.44 (1020)
-6.58 50.61 (121)
51.97 (1015)
-1.36
2004 60.17 (233)
55.39 (1094)
4.78 62.48 (499)
57.81 (876)
4.67
2005 69.93 (319)
61.44 (1449)
8.49 69.95 (711)
56.73 (1174)
13.22
2006 64.37 (191)
55.04 (1228)
9.33 67.97 (382)
54.42 (1076)
13.55
Figures within parentheses are the number of students.
Contributing Factors for Student Outcome
Student outcome in terms of scores in examinations and promotion to higher grades have been assessed separately by Norwegian economist and short-term advisor to LongSIS Lars Kirkebøen from the point of view of the contributions of different input variables, school and student characteristics (see Annex 8). The analysis was carried out by making use of multiple regression models.
The regression analysis has raised issues related to the possible overrating of ECD’s impact on student outcome when assessed by conditioning the relationships with other relevant factors such as ecological zone and family skills. The analysis also points to ECD program’s positive but indifferent effect on gender and caste/ethnicity.
Assessment of relationships between student performance (examination score and promotion) and input variables (school budget/expenses/SIP practices, teacher qualities and student characteristics) depicts, among others, that student learning outcome (measured as exam scores) tend to increase by almost 7 points with just one percent increase in the total school expenditure. Such increase in expenditure does not continue to yield the same outcome if the analysis is conditioned by student characteristics. This suggests that differential budgetary treatment is required for schools depending upon their location and student composition, so that students’ learning outcome is optimized. But the effect of the expenditure on student promotion, although significantly positive, does not change even if the analysis is conditioned with student characteristics. This suggests that more expenditure does contribute to improving student promotion rate but arrangement of student-group specific differential expenditure does not necessarily produce any better result in the promotion rate. However, to help marginalized students promote class with good scores—a dimension of ensuring quality with access—the government is expected to take affirmative or positively discriminatory policy measure in terms of resource allocation to schools.

16
Another intriguing result pertains to the experience of teachers. The analysis result suggests that it could only be a myth to think that experienced, and by implication older, teachers contribute to improving student learning outcome—the relationship between teacher experience and student learning outcome is significantly negative irrespective of student and school characteristics. This finding touches upon the issue of teacher accountability, thus has a meaningful policy implication.
The negative and statistically significant regression coefficient of the variable ‘teaching certificate’ raises the question of legitimacy of the provision of teaching certification—possibly the process of certification has remained problematic and unjustified. The quality of certified teacher might not have been assured.
The analysis of the effects of school/educational inputs combined with student and family-related factors, thus, have produced important policy related results. While program initiatives in such areas as ECD, teacher qualities, school expenditure, and school planning are expected to contribute to enhancing access of children to basic education, the analysis raises some critical issues related to student learning outcomes as to how the input variables operate both on their own and in relation to student composition. The analysis has produced empirical evidence that justify policy initiatives favoring socially deprived student groups.
General Outcome of the Analysis
Database of grade-one enrollees since 2002 has been established by taking measures of validating and ensuring the quality of data. As of December 2006 a total of 48,911 student records collected, optimally cleaned and validated, and are in the recent year managed through the MS Access computer program. Grade-one intake figures fluctuate from the lowest 2260 in 2003 to highest 3653 in 2005. Although a definite answer to such a variation is unknown, the on-going armed conflict and growing insecurity in rural communities could have been one key cause.
A full primary cycle cohort analysis is carried out only for 2002 cohort of grade one enrollees. However, cohort years are compared for available data, e.g., in the case of promotion flows for grades 4 between cohort years 2002 and 2003; for grades three amongst the years 2002 to 2004; and for grade 2 amongst the years 2002 to 2005. An increasing trend of promotion rates is depicted in almost all the grades, pointing to a likely improved internal efficiency of the primary education system represented by the 62 schools. The promotion rate particularly of grade one student of cohort year 2005 is indeed very encouraging (64% compared to 51% in 2002).
Twenty one percent of the 2589 grade-one new intake of 2002 reached grade 5, 51% left the schools and the rest 28% repeated grade(s) 5 students still repeating grade one in five years. The gross repeater rate (taking into account the multiple repeats by individual students) is 54%--a clear indication of a poor internal efficiency of primary education. Students tend to repeat in highest proportion (28%) in the very second year, i.e. in grade 1, of their entry into primary school. Most students also leave during the first and second year of their entry into primary education. What we don’t know, however, is what proportion of such students is transferred to other schools and how many must have dropped out of the primary education system altogether.
Schools have been ranked and compared on the basis of student promotion rate (for 2002 cohort). Four in every 5 schools have less than 30% rate of promotion to grade five in 5 years. There are 8 (about 14%) schools that have the promotion rate less than 10%. These are the schools (6 primary, 1 lower secondary and 1 secondary) from Ilam (2 schools),

17
Sankhuwashabha (1 school), Kavre (2 schools), Rasuwa (1 school), Lalitpur (1 school) and Banke (1 school) districts. Kavre, Gender gaps are evident in almost all the schools, but are inconsistently distributed across schools in terms of which sex they favor. It will be of policy significance to do an in-depth case study of these schools examining their managerial, pedagogical and socio-economic conditions and their relation to student promotion. Most schools promote higher proportion of girls than boys—a total of 38 schools are found having higher promotion rates of girls than those of boys as opposed to 20 schools having higher rates of boys. This apparent better performance of girls needs to be understood in the context of typical public school system where learning outcome for student is still too poor compared to private schools and better performing public schools. The study is limited with its scope in assessing the extent to which girls have access to such schools and if so, have they continued to out perform boys?
While students representing Eastern region have done best in terms of promotion up to grade 5, those from Mid-West have performed least. Students from Central and Far West too have shown below the overall average performance. This result, however, should not be generalized as the statistical validity of school sample size and its representative power is not confirmed.
Dalit constitutes about 17% (436 with half of them girls) of the total grade-one enrollees of 2002, while Muslim makes up less than 5% (119) of the total. The numbers of terai dalit (Chamar, Harijan and Ram) and highly marginalized ethnic group are 10 and 20 respectively. Muslim children are most disadvantaged in their promotion to grade five., with less than 12% making it there. Dalits with the promotion rate of 17% and Terai dalits with 20% fall below the overall average of 21%. Clearly Muslim and dalit groups seek policy intervention to improve the promotion rate.
Factors related to school inputs and student characteristics are analyzed to examine how the change in student outcomes (examination scores and promotion) could be attributed to such factors. Effect of ECD, for example, is analyzed through simple tabulation of promotion percentages across cohort years (2002-2005) as well as by fitting it as an explanatory variable in a series of regression models. Similarly regression analysis is applied also to examine effects of other school inputs such as class size, school expenditure, teacher experience/training/certification/license and planning process (SIP). The results are intriguing. ECD which appeared to have huge effect on promotion and examination scores loses strength as regression model is conditioned with students’ caste composition, parental skills and ecological location. Attendance in ECD program appears to be a luxury, hence restrictive, for students with low parental skills, deprived social background and those coming from outside Kathmandu valley. Taking the apparent high effect in its face value may, therefore, lead us to overstate the importance of attending ECD.
Other school inputs having statistically significant effect on student outcomes (score and promotion) are school expenditure (positive effect) and teacher experience (negative effect). School expenditure does have a highly positive effect on examination score and promotion, but the consideration of students’ background in the analysis reduces the magnitude of the effect. Therefore, the strategy of uniformly allocating resources to schools—without taking into account student composition—may not help optimize student learning outcome. Ideally the resource allocation should be linked with SIPs. Interestingly enough, it is found that the effect of having SIPs prepared in schools is both positive and significant for class-promotion (insignificantly positive for examination score) when the analysis is conditioned with student background variables. This implies that preparation of SIP is all the more important for schools as they strive to serve diverse

18
group of students to learn and be promoted. Finally, but strangely, the analysis reveals that experienced teachers (implying older teachers) negatively contribute to students’ learning outcome. Now, this is a serious and complicated policy issue seeking explanation, because experienced teachers absorb most of the resources that schools obtain from the state. But how does it justify when they block student learning and progress?

19
Chapter 3
Summary of Findings and Recommendations
Individual student data on key system indicators have been collected, verified, validated and recorded in a systematic computer-aided database. The individual student data for each new intake in grade one began in 2002. The data of a total of 2589 grade one students (after verification and cleaning) have been recorded in that year. These students, except the ones who left school, have been followed through in the successive years. The same process has also been applied to the new grade-one intake of the successive years. The database now has a complete 5-year primary cycle cohort records for 2002 base year along with those of 4, 3, 2 and 1 year for the base years 2003, 2004, 2005 and 2006 respectively. As of December 2006, a total of 48,911 cases of students from the 62 sampled schools have been recorded in the study database. This figure will be increased by about 3000 additional records annually.6
Flow of Student Promotion
Between cohort comparison. The new grade-one intakes vary for all five years between 2002 and 2006, but do not depict any revealing pattern. The intake has been least (2260) in 2003 and highest (3653) in 2005. The cohort comparison (Table 2) of the flow of student-promotion to higher grades clearly indicates that the more recent cohorts show higher percent of student-promotion. In the light of this scenario, the percent of grade one enrolees reaching grade 5 within the given 5 year primary cycle can be expected to increase substantially with better progress for girls. However, the degree of increase will not be justified still from the point of view of the need to ensuring the right of every child to quality basic education by 2015.
Recommendation. Challenging it may be, therefore, it is necessary to diagnose further the issues of access, quality and efficiency pertaining to the excluded children and respond to the issue with necessary policy and program interventions. The key question in the problematic context of student promotion to higher grade is who are the children who will not make it up to grade 5 in 5 years after their entry into grade one and why they will not do so?
Regional comparison. Although not very obvious, there is some degree of regional variation in terms of the extent to which students enrolled in grade one are successful in reaching grade 5 in 5 years. Mid-west is well below the overall average, more so in the case of girls. Second to Mid-west is the Far-west, the figure of which is also below the overall average. The scenario of other regions is not critical.
Recommendation. Given the current situation of student promotion to higher grades, primary school children in mid and Far-west must be supported with appropriate policy and program interventions for improved learning achievement and reduced wastage.
Gender and student promotion. The gender parity in students’ promotion to grade 5 is not an issue in the case of the 62 sampled schools. However, this finding must be treated cautiously as it cannot be generalized. The sample of schools in this study does not represent private and better performing public schools. It is generally assumed that boys
6Despite the involvement of a rigorous process of collecting, verifying and cleaning the data, the database and its constituent variables still consist of several missing observations.

20
get to go to such schools. The gender parity achieved in student promotion can be of great value if it is also matched by quantitative and qualitative outputs, which unfortunately is not the case in the 62 sampled schools. With only 21% of students making their way up to grade 5 in 5 years the target of achieving quantitative and qualitative outputs has remained far-fetched.
Recommendation. Schools need to be involved in analyzing student attrition status of complete primary cycles. At the classroom level class teachers ought to be doing the same for each of their own class. Review and reflection on school performance need to be a formal and regular task—achievement of gender parity evident only in a minimalist outcome should be critically scrutinized to plan and work toward producing overall quantitative and qualitative outcome. Teacher and head teacher training curriculum and programs should include capacity empowerment for participatory school and classroom context analysis.
Grade repetition a serious issue. Promotion of only a small percent of boys and girls to higher grades obviously means high rates of grade repeaters and school leavers. High incident found in these two parameters sends a very alarming message of concern for quality of primary education managed and delivered by the school system. Grade one continues to be the critical spot where more than a quarter students repeat (some for 2, 3, 4 and even 5 years) and about the same number just leave the school by the time they complete one year of schooling. The analysis reveals that more than a quarter grade-one repeaters are under-age children including those belonging to Chamar, Harijan, Ram, dalit and Muslim caste groups.
Recommendation. This situation seeks a proper review and redressing of the existing policy and strategy on ECD and incentives programs and at the same time consider the issue of targeting the deprived groups seriously. More importantly, the missing link between the annual strategic implementation plan (ASIP) of DOE and the reality of students’ low promotion and high repetition rate which is further compounded by the
very high rate (51%) of school leavers calls for proper student, if not child, tracking, so that resources for schools are allocated more realistically and responsibly.
School-wise Cohort
Issue of upgrading schools with incomplete primary grades. Individual schools are ranked on the basis of the percent of students reaching grade 5 in 5 years, repetition and dropout indexes. It is found that 2 schools among the 62 have not been able to upgrade into becoming full-fledged primary school nor are they able to increase the number of students in the 5 years. They were included in the sample with the assumption that they would be upgraded to full-fledged primary school in due course. However, given the current status, student cohorts of these two schools are not comparable with those of other schools. This is not to argue that every primary school must run all 5-grades, but to highlight that schools are running under extreme conditions that deserve non-standard policy treatment and resource allocation.
Recommendation. In scattered settlements primary schools may have to be either branched out into lower and upper primary levels to allow easy proximity for smaller children or teachers trained in multi-grade teaching and management needs to be deployed if all 5 grades are to be run with extremely small class size.
School-specific issues related to survival rate. Schools’ rank according to proportion of grade-one new intake reaching grade 5 in 5 years does not depict any particular trend in terms of schools’ distribution by districts. Schools from the same district have ranked at the top

21
as well as bottom 10 percent. Very high percent (82.3%) of schools show less than 30% students making it up to grade 5 in 5 years. Therefore, in the case of the 62 schools the primary grade survival rate is extremely low that raises serious question about the efficiency of primary education system.
Recommendation. Rather than excessively emphasizing on geographical location (e.g. remoteness of districts, region, etc), it will be more prudent to consider individual schools’ context for priority resource allocations. It is reiterated that school management committees, parents and teachers should take greater control in analyzing school contexts and the involvement of such stakeholders should feature as a regular and formalized school activity.
School-specific promotion pattern by gender. The gender distribution of the promotion pattern, although depict wide gaps in some schools, is not consistent in favor or against any particular sex. Most schools have send almost equal proportion of girls and boys to higher grades while there are also schools where wide gender gap of as high as 60 percent points existed in favor of girls and that of 50 percent points in favor of boys. This scenario questions the appropriateness of single approach to gendered scholarship scheme applied to all schools.
Recommendation. Blanket policy of girls’ scholarship should be reviewed in the light of making its benefit more equitable and optimizing its impact. Equity in education should be one of the central themes to address the gender-related attrition problems that are by and large school-specific—problems are context specific and there is no unique solution. Stakeholders’ capacity building should be prioritized for them to be critically engaged in analyzing local gender and equity issues and in appropriating pedagogical and educational management processes. NCED’s training curriculum and approach to its delivery should be revisited and reformed.
Caste, Ethnicity and Student Cohort
Continued marginalization of DAG. Analysis of cohort flow of selected disadvantaged caste and ethnic groups reveals that Muslim children, more even in the case of Muslim girls, lag behind in terms of regular annual promotion to higher grades. In the case of the other disadvantaged castes (e.g. dalit and overly deprived Chamar, Harijan and Ram) the promotion has been above the overall average only in so far as first two years of primary schooling is concerned. The proportion falls well below the overall average when it comes to progressing further up in higher grades. Almost exactly the same trend is observed when the problems of repetition and school leavers are analyzed for these caste groups. In regards to the highly marginalized ethnic group, although students representing this group has shown comparatively better result of promotion, their number is too small (only 12) which makes the generalization of the finding doubtful.
Recommendation. The promotion, repetition and dropout situation of the disadvantaged groups calls for a more in-depth study of these caste groups’ socio-economic context and the phenomenon of how they have been systematically deprived of educational opportunity. Given such a context it has also become imperative that the state’s generalized policy of social and educational inclusion needs a critical review. Distribution of dalit scholarship should be made more scientific—decision about amount and coverage needs to be localized. New scholarship scheme is deemed necessary for Muslim groups with emphasis to bring Muslim girls to school making sure that they complete the primary cycle. Resource allocation for scholarship should be based on local stakeholders’ articulation of issues of exclusion, their plans and approach to addressing

22
such issues. Ad-hoc and top-down approach to resource allocation should be abolished. Regarding the small sample issue of highly marginalized ethnic group as well as the complete exclusion of NIPA-defined “endangered” ethnic group, it can only be recommended that a separate case study should be commissioned to accurately map out educational contexts of these groups.
Contribution of School Inputs to Students’ Learning Outcomes
Coverage and benefit of ECD. Opportunity for attending ECD program has yielded better promotion result for students. However, the proportion of the newly enrolled students in grade 1 over the 5 year period between 2002 and 2006 is only 16.6%. Many new enrollees, therefore, are not the beneficiaries of ECD program. The study finding that ECD has largely privileged children from Kathmandu valley and those coming from educationally skilled families raises a critical issue against its worth for deprived children. Nonetheless, students with ECD base have visibly outperformed those without such a base. Therefore, widening the opportunities for children to participate in ECD programs can be a highly effective means to ensure children’s right to quality primary education, particularly for those coming from deprived social groups.
Recommendation. In order to make the coverage and benefit of ECD more egalitarian, not only should ECD centers be expanded to inner rural communities but also the content and delivery process need to be appropriated according to local culture, values and principle. Existing innovations of ECD should be adapted to suit such social milieu. Decision about the locations of the proposed phase-wise expansion of ECD centers should be based on a systematic investigation of genuineness of their needs, which of course needs to be informed by local demands accompanied by convincing articulation of issues, needs, plans and local commitments.
School expenditure contributing to enhancing learning outcome. School expenditure is found to be positively contributing to students’ learning outcome (measured by examination score and promotion). However, the consideration of students’ background in the analysis reduces the magnitude of its effect. Therefore, the strategy of uniformly allocating resources to schools—without taking into account student composition—may not help optimize student learning outcome. Ideally SIPs are expected to be prepared for schools to be able to obtain the resource they require of operation. The analysis reveals that the effect of having SIPs prepared in schools is both positive and significant for class-promotion (insignificantly positive for examination score). This implies that preparation of SIP is all the more important for schools as they strive to serve diverse group of students to learn and be promoted.
Recommendation. Technical and administrative assistance to schools through RCs, DEOs and ETCs should prepare them to be able to link school expenditure with results it produces, particularly the extent of benefits it brings to deprived students. There is no dearth of participatory processes which can be adapted by stakeholders, with well crafted TA, to assess the social and pedagogical conditions of schools as a way to be clear about the benchmark and setup realistic targets to be achieved. The process should empower stakeholders to prepare stronger SIPs, make informed demands for resources, spend them judiciously and remain accountable to the community.
Effect of teacher-experience. Strangely, the analysis reveals that experienced teachers (implying older teachers) negatively contribute to students’ learning outcome. This raises a serious and complicated policy issue seeking explanation, because experienced teachers absorb most of the resources that schools obtain from the state. But the expenses on

23
ineffective “experienced” teachers do not justify their worth as they have remained problematic for student learning and progress.
Recommendation. Tougher measures need to be in place to hold teachers and school administration accountable to community and primary stakeholders. Periodical social auditing to inform what teachers and head teacher have planned, the targets they have set to bring about improvement in school and the progress they have made should be formalized and made mandatory. Teacher promotion and opportunities for professional development should be strictly informed by their performance and social recommendations. Long experiences on its won should not be a criterion to reward teachers and retain them.

24
Annex 1. Ranking of Schools Based on Promotion Rate
(Based on the percentages of Survival Ratio from Grade 1 to 5 from 2002 to 2006) Code School Name Address District Boys Girls Total Rank
120311 Gokundeswor Secondary School Dhankuta Dhankuta 70.8 62.5 67.5 1
321041 Amili Thum Primary School Waling Syangja 50 77.8 63.2 2
321040 Durga Devi Primary Schol Putali Bazar Syangja 57.1 66.7 62.5 3
120206 Siddeshwari Primary School Barbote Ilam 50 37.5 43.8 4
240832 Shree Kshyamic Shanti H.S. School Lalitpur Lalitpur 33.3 47.1 40.4 5
531660 Rastriya Primary School Urma Kailali 41.2 36.7 38.3 6
321039 Saraswati Lower Secondary School Sangjya Syangja 33.3 40 36.4 7
130413 Bal Lower Secondary school Sainiktol, Rani Morang 30.2 41.7 35.4 8
320936 Mahendra Lower Secondary School Pokhara Kaski 36.7 33.3 35.1 9
130416 Bhanu Primary School Urlabari Morang 33.3 33.3 33.3 10
531661 Saraswati Higher Secondary School Geta Kailali 29.5 32.1 30.8 11
210518 Rasuwa Secondary School Dhunche Rasuwa 21.9 50 29.5 12
230725 Rashtriya Primary School Shukranagar Chitwan 30 25 27.3 13
120309 Margeswori Primary Dhankuta Dhankuta 33.3 25 26.7 14
331143 Shree Pancha Mahendra P. School Kapilbastu Kapilvastu 25 28.6 26.7 14
230726 Aadrash Lower Secondry Daroili Chitwan 37.5 8.3 25 15
120310 Rastriya Saraswati Primary School Dhankuta Dhankuta 0 50 25 15
130414 Mills Secondary School Biratnagar Morang 19.7 29.4 24.5 16
320933 Shree Divya Jyoti Primary School Hemaja Kaski 26.7 22.6 23.9 17
230727 AadrashSecondary School Divya Nagar Chitwan 21.4 25 23.7 18
521556 Ghatal Secondary School Amargadi Dadeldhura 18.2 33.3 23.5 19
130412 Sharada Primary School Sorabhag Morang 16.1 28.9 22.6 20
320937 Shree Ram Primary School Pokhara Kaski 13.3 28 22.5 21
331144 Kotigram Primary School Gotihawa Kapilvastu 30.8 12.5 22 22
320934 Chandika Primary School Pokhara Kaski 11.1 27.3 20 23
120208 Navin Pragati Primary School Ilam Ilam 12.5 28.6 20 23
421246 Jansewa Secondary School Laatikoili Surkhet 30.8 7.7 19.2 24
230728 Malpur Lower Secondary School Vachauli Chitwan 29.2 5.6 19 25
421249 Kalika Primary School Jarbuta Surkhet 21.4 15.4 18.5 26
331145 Shree Janaki Higher Secondary School Maharajgunj Kapilvastu 18.2 17.6 17.9 27
521557 Mastabajinath Primary School Nawodurga Dadeldhura 33.3 9.1 17.6 28
531662 Rastriya Primary School Dhangadi Kailali 13.3 19.6 16.7 29
521558 JanaJyoti Primary School Amargadi Dadeldhura 0 21.4 15.8 30
421248 Kalika Primary School Laatikoili Surkhet 13.3 17.9 15.5 31
511454 Jagannath Primary School Khalanga Darchula 0 40 15.4 32
531659 Phoolbari Primary School Phoolbari Kailali 12.1 18.4 15 33
421247 Siddhartha Primary School Uttarganga Surkhet 11.4 16.7 14.7 34
431352 Lower Secondary School,Lagdhawa Nepalgunj Banke 15.8 11.8 14.5 35
431350 Shree Nepal Primary School Bageshwari Banke 12 16.7 14.5 35
321038 Bhoome Lower Secondary School Vidhayalaxmi Syangja 25 10 14.3 36
511455 Janpriya Lower Secondary School Khalanga Darchula 12.5 16.7 14.3 36
320935 Mahendra Primary School Dhikur Pokhari Kaski 8.7 21.1 14.3 36
511453 Shree Primary School Khalanga Khalanga Darchula 14.3 14.3 14.3 36
331142 Shree Rastraya Primary School Bijuwa Kapilvastu 22.2 4.2 13.7 37
240829 Bageshwari Primary School Chapagaun, Tahakhel Lalitpur 6.3 19 13.5 38
220624 Gosainkunda Primary School Banepa Kavre 0 20 12.5 39
130415 Raghupati Primary School Biratnagar Morang 10 15.4 12.5 39
220622 Shree Pratibha Primary School Panchkhaal Kavre 14.3 10 11.8 40
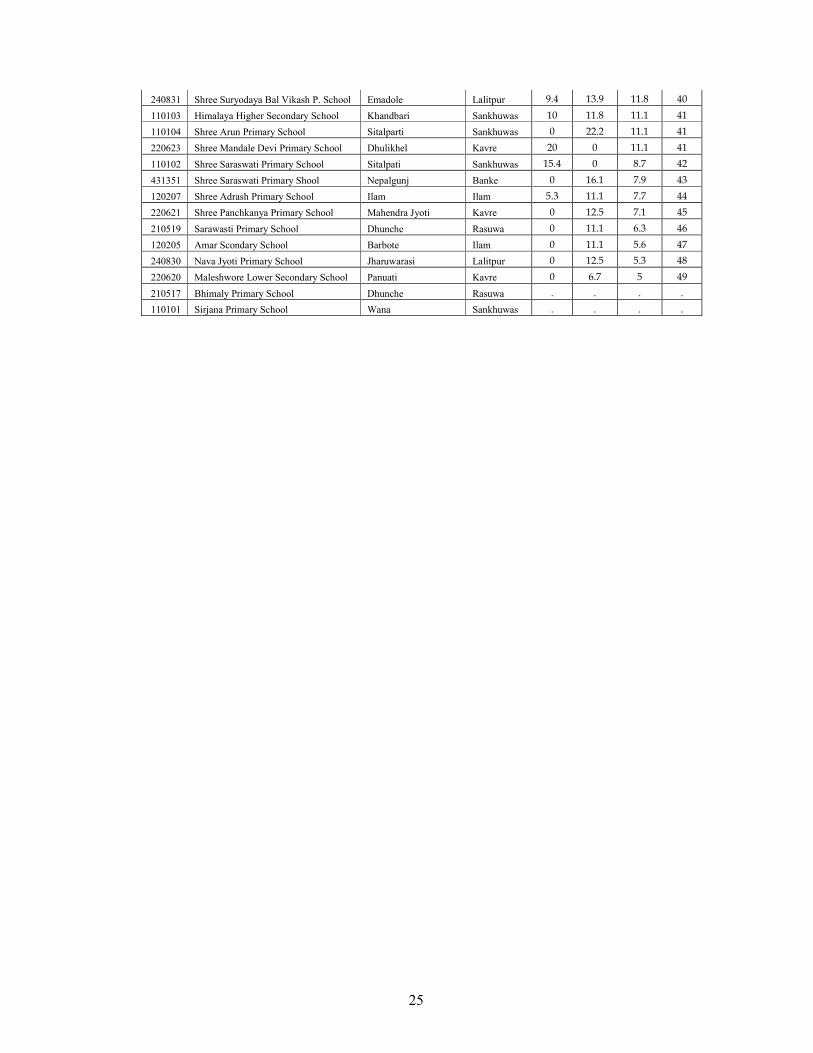
25
240831 Shree Suryodaya Bal Vikash P. School Emadole Lalitpur 9.4 13.9 11.8 40
110103 Himalaya Higher Secondary School Khandbari Sankhuwas 10 11.8 11.1 41
110104 Shree Arun Primary School Sitalparti Sankhuwas 0 22.2 11.1 41
220623 Shree Mandale Devi Primary School Dhulikhel Kavre 20 0 11.1 41
110102 Shree Saraswati Primary School Sitalpati Sankhuwas 15.4 0 8.7 42
431351 Shree Saraswati Primary Shool Nepalgunj Banke 0 16.1 7.9 43
120207 Shree Adrash Primary School Ilam Ilam 5.3 11.1 7.7 44
220621 Shree Panchkanya Primary School Mahendra Jyoti Kavre 0 12.5 7.1 45
210519 Sarawasti Primary School Dhunche Rasuwa 0 11.1 6.3 46
120205 Amar Scondary School Barbote Ilam 0 11.1 5.6 47
240830 Nava Jyoti Primary School Jharuwarasi Lalitpur 0 12.5 5.3 48
220620 Maleshwore Lower Secondary School Panuati Kavre 0 6.7 5 49
210517 Bhimaly Primary School Dhunche Rasuwa . . . .
110101 Sirjana Primary School Wana Sankhuwas . . . .

26
Annex 2. Ranking of Schools by Repeater Index (RI)
(Based on percentages of repeaters of 2002 grade 1 new enrollees in five years)
Code School Name Address District Male Female Total Rank
110101 Sirjana Primary School Wana Sankhuwas 0.00 0.00 0.00 1
120311 Gokundeswor Secondary School Dhankuta Dhankuta 0.01 0.02 0.01 2
320935 Mahendra Primary School Dhikurpokhari Kaski 0.03 0.00 0.02 3
321041 Amili Thum Primary School Waling Syangja 0.03 0.03 0.03 4
321038 Bhoome Lower Secondary School Vidhayalaxmi Syangja 0.00 0.06 0.04 5
130414 Mills Secondary School Biratnagar Morang 0.05 0.04 0.05 7
240830 Nava Jyoti Primary School Jharuwarasi Lalitpur 0.03 0.08 0.05 7
210518 Rasuwa Secondary School Dhunche Rasuwa 0.06 0.02 0.05 7
320936 Mahendra LS School Pokhara Kaski 0.07 0.07 0.07 10
320937 Shree Ram Primary School Pokhara Kaski 0.12 0.05 0.07 10
240832 Shree sramic Shanti H.S School Lalitpur Lalitpur 0.09 0.05 0.07 10
321040 Durga Devi Primary Schol Putali Bazar Syangja 0.07 0.09 0.08 12.5
531660 Rastriya Primary School Urma Kailali 0.08 0.08 0.08 12.5
431352 Lower Secondary School Nepalgunj Banke 0.11 0.05 0.09 14.5
531661 Saraswati HS School Geta Kailali 0.09 0.10 0.09 14.5
110103 Himalaya HS School Khandbari Sankhuwas 0.16 0.07 0.10 16
431351 Shree Saraswati Primary Shool Nepalgunj Banke 0.10 0.11 0.11 17
230728 Malpur Lower Secondary School Vachauli Chitwan 0.09 0.16 0.12 19.5
120207 Shree Adrash Primary School Ilam Ilam 0.10 0.13 0.12 19.5
331145 Shree Janaki HS School Maharajgunj Kapilvastu 0.11 0.14 0.12 19.5
120206 Siddeshwari Primary School Barbote Ilam 0.10 0.13 0.12 19.5
220623 Shree Mandale Devi P. School Dhulikhel Kavre 0.14 0.12 0.13 22
230726 Aadrash Lower Secondry Daroili Chitwan 0.09 0.21 0.14 24.5
130413 Bal Lower Secondary school Rani Morang 0.19 0.08 0.14 24.5
321039 Saraswati LS School Sangjya Syangja 0.13 0.16 0.14 24.5
240831 Shree Suryodaya Bal Vikash PS Emadole Lalitpur 0.12 0.17 0.14 24.5
421248 Kalika Primary School Laatikoili Surkhet 0.20 0.11 0.15 27.5
531662 Rastriya Primary School Dhangadi Kailali 0.17 0.14 0.15 27.5
120310 Rastriya Saraswati P. School Dhankuta Dhankuta 0.25 0.08 0.16 30
130412 Sharada Primary School Sorabhag Morang 0.17 0.16 0.16 30
331143 Shree Pancha Mahendra P. School Kapilbastu Kapilvastu 0.21 0.09 0.16 30
220620 Bhaleshwore LS School Panuati Kavre 0.25 0.15 0.17 33
320934 Chandika Primary School Pokhara Kaski 0.17 0.17 0.17 33
320933 Shree Divya Jyoti P. School Hemaja Kaski 0.09 0.21 0.17 33
421249 Kalika Primary School Jarbuta Surkhet 0.14 0.22 0.18 36
130415 Raghupati Primary School Biratnagar Morang 0.22 0.13 0.18 36
110102 Shree Saraswati Primary School Sitalpati Sankhuwas 0.12 0.26 0.18 36
230727 AadrashSecondary School Divya Nagar Chitwan 0.23 0.17 0.19 39
230725 Rashtriya Primary School Shukranagar Chitwan 0.17 0.23 0.19 39
421247 Siddhartha Primary School Uttarganga Surkhet 0.21 0.18 0.19 39
130416 Bhanu Primary School Urlabari Morang 0.27 0.13 0.20 41.5
220622 Shree Pratibha Primary School Panchkhaal Kavre 0.17 0.21 0.20 41.5
421246 Jansewa Secondary School Laatikoili Surkhet 0.16 0.28 0.22 43.5
511453 Shree Primary School Khalanga Khalanga Darchula 0.24 0.20 0.22 43.5
240829 Bageshwari Primary School Chapagaun, Lalitpur 0.21 0.26 0.23 45
521556 Ghatal Secondary School Amargadi Dadeldhura 0.24 0.23 0.24 46.5
220621 Shree Panchkanya Primary School Mahendra J. Kavre 0.21 0.25 0.24 46.5
511454 Jagannath Primary School Khalanga Darchula 0.14 0.40 0.25 49
120309 Margeswori Primary Dhankuta Dhankuta 0.17 0.27 0.25 49
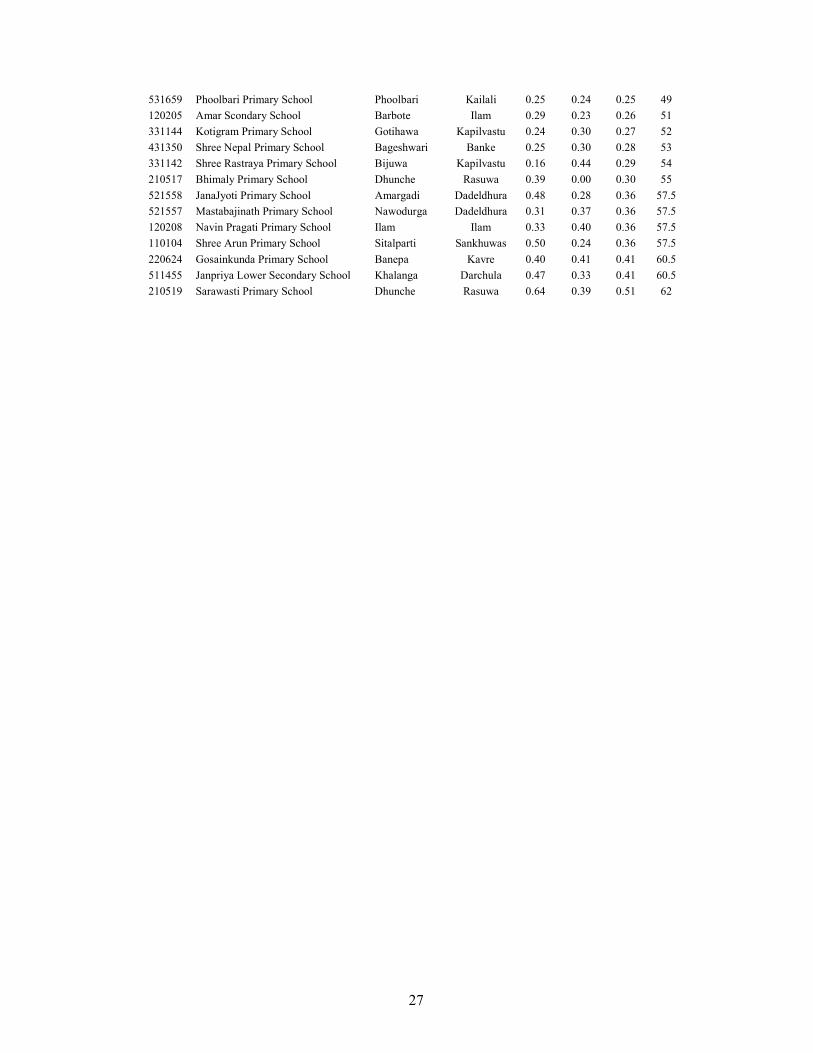
27
531659 Phoolbari Primary School Phoolbari Kailali 0.25 0.24 0.25 49
120205 Amar Scondary School Barbote Ilam 0.29 0.23 0.26 51
331144 Kotigram Primary School Gotihawa Kapilvastu 0.24 0.30 0.27 52
431350 Shree Nepal Primary School Bageshwari Banke 0.25 0.30 0.28 53
331142 Shree Rastraya Primary School Bijuwa Kapilvastu 0.16 0.44 0.29 54
210517 Bhimaly Primary School Dhunche Rasuwa 0.39 0.00 0.30 55
521558 JanaJyoti Primary School Amargadi Dadeldhura 0.48 0.28 0.36 57.5
521557 Mastabajinath Primary School Nawodurga Dadeldhura 0.31 0.37 0.36 57.5
120208 Navin Pragati Primary School Ilam Ilam 0.33 0.40 0.36 57.5
110104 Shree Arun Primary School Sitalparti Sankhuwas 0.50 0.24 0.36 57.5
220624 Gosainkunda Primary School Banepa Kavre 0.40 0.41 0.41 60.5
511455 Janpriya Lower Secondary School Khalanga Darchula 0.47 0.33 0.41 60.5
210519 Sarawasti Primary School Dhunche Rasuwa 0.64 0.39 0.51 62

28
Annex 3. Cohort of the Year 2002 to 2006
2589 Grade 1 Newly Enrolled Students in 2002
Numbers of Percents of
Year Class BeginSts_Name Male Female Total Male Female Total
2002 1 New/Transfer In 1271 1318 2589
2003
2 Promoted 624 703 1327 49.1 53.3 51.3
1 Repeater 356 373 729 28.0 28.3 28.2
School Leavers 291 242 533 22.9 18.4 20.6
2004
3 Promoted 370 449 819 29.1 34.1 31.6
2 Promoted 210 201 411 16.5 15.3 15.9
2 Repeater 65 70 135 5.1 5.3 5.2
1 Repeater 78 95 173 6.1 7.2 6.7
School Leavers 257 261 518 20.2 19.8 20.0
2005
4 Promoted 293 364 657 23.1 27.6 25.4
3 Promoted 173 184 357 13.6 14.0 13.8
3 Repeater 43 51 94 3.4 3.9 3.6
2 Promoted 43 77 120 3.4 5.8 4.6
2 Repeater 41 36 77 3.2 2.7 3.0
1 Repeater 25 17 42 2.0 1.3 1.6
School Leavers 105 86 191 8.3 6.5 7.4
2006
5 Promoted 248 296 544 19.5 22.5 21.0
4 Promoted 186 196 382 14.6 14.9 14.8
4 Repeater 30 35 65 2.4 2.7 2.5
3 Promoted 69 94 163 5.4 7.1 6.3
3 Repeater 25 32 57 2.0 2.4 2.2
2 Promoted 19 13 32 1.5 1.0 1.2
2 Repeater 13 12 25 1.0 0.9 1.0
1 Repeater 4 1 5 0.3 0.1 0.2
School Leavers 24 50 74 1.9 3.8 2.9
Total School Leavers 677 639 1316 53.3 48.5 50.8
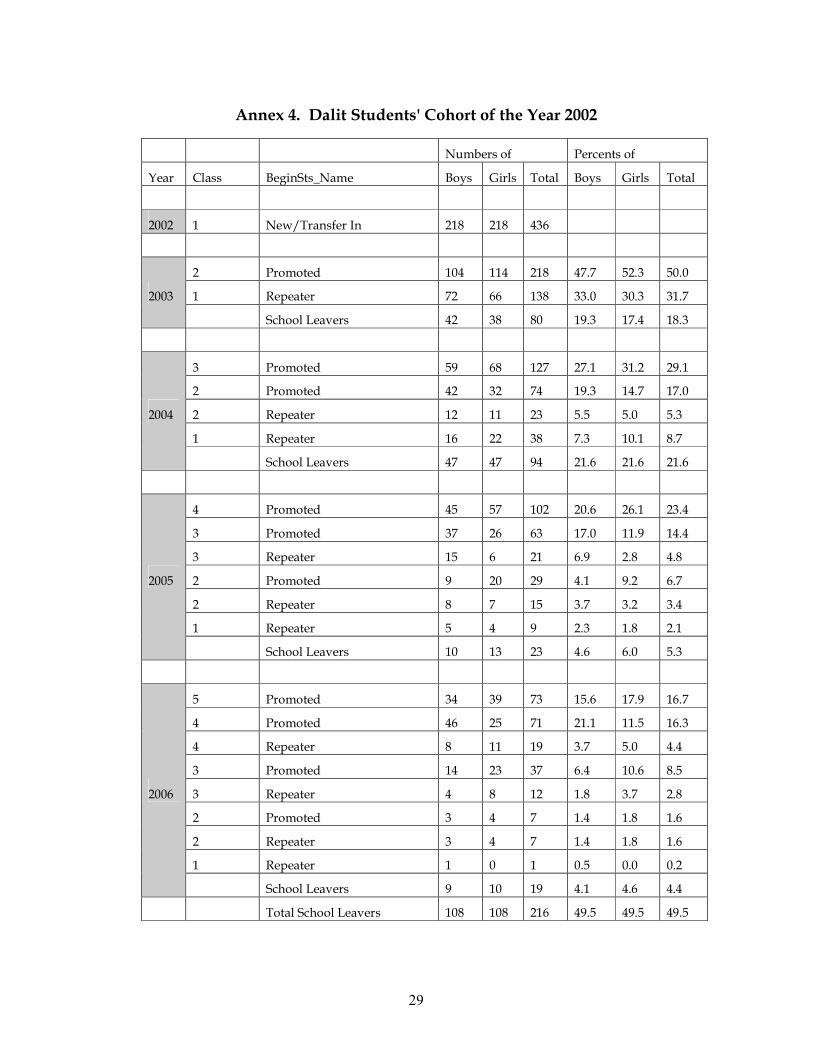
29
Annex 4. Dalit Students' Cohort of the Year 2002
Numbers of Percents of
Year Class BeginSts_Name Boys Girls Total Boys Girls Total
2002 1 New/Transfer In 218 218 436
2003
2 Promoted 104 114 218 47.7 52.3 50.0
1 Repeater 72 66 138 33.0 30.3 31.7
School Leavers 42 38 80 19.3 17.4 18.3
2004
3 Promoted 59 68 127 27.1 31.2 29.1
2 Promoted 42 32 74 19.3 14.7 17.0
2 Repeater 12 11 23 5.5 5.0 5.3
1 Repeater 16 22 38 7.3 10.1 8.7
School Leavers 47 47 94 21.6 21.6 21.6
2005
4 Promoted 45 57 102 20.6 26.1 23.4
3 Promoted 37 26 63 17.0 11.9 14.4
3 Repeater 15 6 21 6.9 2.8 4.8
2 Promoted 9 20 29 4.1 9.2 6.7
2 Repeater 8 7 15 3.7 3.2 3.4
1 Repeater 5 4 9 2.3 1.8 2.1
School Leavers 10 13 23 4.6 6.0 5.3
2006
5 Promoted 34 39 73 15.6 17.9 16.7
4 Promoted 46 25 71 21.1 11.5 16.3
4 Repeater 8 11 19 3.7 5.0 4.4
3 Promoted 14 23 37 6.4 10.6 8.5
3 Repeater 4 8 12 1.8 3.7 2.8
2 Promoted 3 4 7 1.4 1.8 1.6
2 Repeater 3 4 7 1.4 1.8 1.6
1 Repeater 1 0 1 0.5 0.0 0.2
School Leavers 9 10 19 4.1 4.6 4.4
Total School Leavers 108 108 216 49.5 49.5 49.5

30
Annex 5. Cohort of Students belonging to Chamar, Harijan and Ram
Caste Group
Numbers of Percents of
Year Class BeginSts_Name Boys Girls Total Boys Girls Total
2002 1 New/Transfer In 6 4 10
2003
2 Promoted 4 2 6 66.7 50.0 60.0
1 Repeater 1 2 3 16.7 50.0 30.0
School Leavers 1 0 1 16.7 0.0 10.0
2004
3 Promoted 3 2 5 50.0 50.0 50.0
1 Repeater 1 1 2 16.7 25.0 20.0
School Leavers 1 1 2 16.7 25.0 20.0
2005
4 Promoted 1 2 3 16.7 50.0 30.0
3 Repeater 2 0 2 33.3 0.0 20.0
2 Promoted 1 1 2 16.7 25.0 20.0
School Leavers 0 0 0 0.0 0.0 0.0
2006
5 Promoted 1 1 2 16.7 25.0 20.0
4 Promoted 2 0 2 33.3 0.0 20.0
4 Repeater 0 1 1 0.0 25.0 10.0
3 Promoted 1 1 2 16.7 25.0 20.0
School Leavers 0 0 0 0.0 0.0 0.0
Total School Leavers 2 1 3 33.3 25.0 30.0
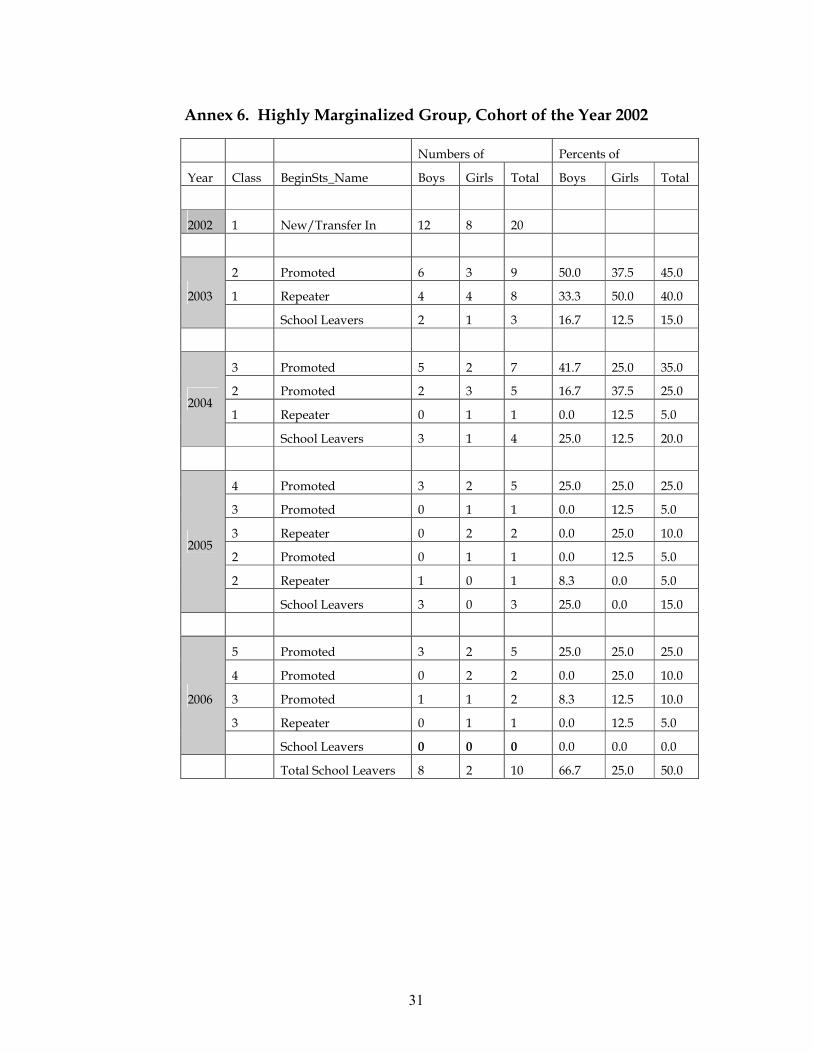
31
Annex 6. Highly Marginalized Group, Cohort of the Year 2002
Numbers of Percents of
Year Class BeginSts_Name Boys Girls Total Boys Girls Total
2002 1 New/Transfer In 12 8 20
2003
2 Promoted 6 3 9 50.0 37.5 45.0
1 Repeater 4 4 8 33.3 50.0 40.0
School Leavers 2 1 3 16.7 12.5 15.0
2004
3 Promoted 5 2 7 41.7 25.0 35.0
2 Promoted 2 3 5 16.7 37.5 25.0
1 Repeater 0 1 1 0.0 12.5 5.0
School Leavers 3 1 4 25.0 12.5 20.0
2005
4 Promoted 3 2 5 25.0 25.0 25.0
3 Promoted 0 1 1 0.0 12.5 5.0
3 Repeater 0 2 2 0.0 25.0 10.0
2 Promoted 0 1 1 0.0 12.5 5.0
2 Repeater 1 0 1 8.3 0.0 5.0
School Leavers 3 0 3 25.0 0.0 15.0
2006
5 Promoted 3 2 5 25.0 25.0 25.0
4 Promoted 0 2 2 0.0 25.0 10.0
3 Promoted 1 1 2 8.3 12.5 10.0
3 Repeater 0 1 1 0.0 12.5 5.0
School Leavers 0 0 0 0.0 0.0 0.0
Total School Leavers 8 2 10 66.7 25.0 50.0

32
Annex 7. Muslim Students, Cohort of the Year 2002
Numbers of Percents of
Year Class BeginSts_Name Boys Girls Total Boys Girls Total
2002 1 New/Transfer In 64 55 119
2003
2 Promoted 28 20 48 43.8 36.4 40.3
1 Repeater 10 20 30 15.6 36.4 25.2
School Leavers 26 15 41 40.6 27.3 34.5
2004
3 Promoted 13 10 23 20.3 18.2 19.3
2 Promoted 2 8 10 3.1 14.5 8.4
2 Repeater 2 1 3 3.1 1.8 2.5
1 Repeater 1 6 7 1.6 10.9 5.9
School Leavers 20 15 35 31.3 27.3 29.4
2005
4 Promoted 9 8 17 14.1 14.5 14.3
3 Promoted 2 3 5 3.1 5.5 4.2
3 Repeater 1 5 6 1.6 9.1 5.0
2 Promoted 0 5 5 0.0 9.1 4.2
2 Repeater 1 1 2 1.6 1.8 1.7
School Leavers 5 3 8 7.8 5.5 6.7
2006
5 Promoted 8 7 15 12.5 12.7 12.6
4 Promoted 3 7 10 4.7 12.7 8.4
4 Repeater 0 1 1 0.0 1.8 0.8
3 Promoted 1 4 5 1.6 7.3 4.2
2 Repeater 0 1 1 0.0 1.8 0.8
School Leavers 1 2 3 1.6 3.6 2.5
Total School Leavers 52 35 87 81.3 63.6 73.1

33
Annex 8. Results of Regression Analysis
score score score score score score score score score
Ecd 16.214 13.879 14.758 14.523 12.875 10.216 10.065 6.292 -0.405
[1.050]** [1.115]** [1.111]** [1.103]** [1.080]** [1.412]** [1.409]** [1.285]** [1.648]
Female -0.877 -0.645 -0.740 -1.008 -0.542 -1.542 -1.679 -1.416 -0.436
[0.746] [0.731] [0.719] [0.714] [0.696] [0.833] [0.832]* [0.753] [0.698]
Mountain -24.944 -26.152 -24.227 -26.046 -16.403 -15.369 -14.159 0.000
[2.321]** [2.441]** [2.435]** [2.401]** [3.403]** [3.493]** [3.160]** [0.000]
hill -21.725 -20.667 -18.559 -19.778 -11.066 -10.375 -8.230 0.000
[1.836]** [2.120]** [2.121]** [2.124]** [2.891]** [2.989]** [2.705]** [0.000]
terai -17.697 -17.149 -16.029 -15.173 -3.276 -2.738 -0.034 0.000
[1.848]** [2.136]** [2.124]** [2.181]** [2.931] [3.024] [2.738] [0.000]
east -1.957 -3.461 -1.484 -5.407 -6.103 -2.666 0.000
[1.305] [1.309]** [1.338] [1.723]** [1.816]** [1.649] [0.000]
west -3.659 -4.180 -1.821 -4.071 -4.344 -4.322 0.000
[1.392]** [1.383]** [1.414] [1.788]* [1.793]* [1.622]** [0.000]
midwest 1.288 0.567 2.593 -1.890 -2.112 -3.205 0.000
[1.481] [1.472] [1.482] [1.846] [1.855] [1.679] [0.000]
farwest 10.423 9.884 9.475 2.729 1.777 -4.314 0.000
[1.572]** [1.561]** [1.581]** [1.937] [1.952] [1.785]* [0.000]
overage 5.937 7.103 7.078 7.116 7.981 7.029
[0.771]** [0.754]** [0.949]** [0.947]** [0.857]** [0.816]**
cast_code= 1 -5.478 -5.978 -5.971 -5.127 -3.903
[1.299]** [1.670]** [1.666]** [1.508]** [1.463]**
cast_code= 3 -4.661 -3.829 -4.124 -2.930 -1.854
[1.492]** [2.040] [2.041]* [1.847] [1.867]
cast_code= 4 -1.795 -0.154 -0.191 -0.784 -0.225
[1.514] [1.857] [1.853] [1.677] [1.694]
cast_code= 5 -1.372 -2.304 -2.442 -2.740 -1.359
[2.062] [2.623] [2.619] [2.369] [2.315]
cast_code= 6 -2.324 -3.541 -3.712 -4.374 -1.407
[2.229] [2.910] [2.905] [2.628] [2.538]
cast_code= 7 -20.059 -21.917 -22.127 -19.670 -8.227
[1.487]** [1.750]** [1.772]** [1.606]** [1.882]**
cast_code= 8 -9.500 -11.520 -11.731 -10.641 -2.688
[2.098]** [2.793]** [2.787]** [2.522]** [2.531]
cast_code= 10 1.482 -3.647 -3.751 -6.325 -7.192
[2.603] [3.473] [3.480] [3.150]* [3.130]*
cast_code= 12 -7.616 -4.256 -4.070 -4.075 -1.243
[3.301]* [4.434] [4.427] [4.006] [3.756]
cast_code=
102 -9.355 -9.888 -9.935 -9.131 -4.986
[1.831]** [2.182]** [2.183]** [1.975]** [1.959]*
cast_code=
103 -7.209 -9.945 -10.092 -8.557 -2.769
[2.385]** [2.675]** [2.684]** [2.429]** [2.385]
cast_code= 104 -5.425 -7.650 -7.642 -7.653 -1.793
[1.212]** [1.528]** [1.528]** [1.382]** [1.491]
notwfather -4.845 -4.882 -4.050 -0.974
[2.224]* [2.221]* [2.009]* [1.971]
notwmother -1.617 -1.550 -1.634 -0.032
[5.431] [5.419] [4.903] [4.560]
notweither 11.676 11.767 9.067 6.055
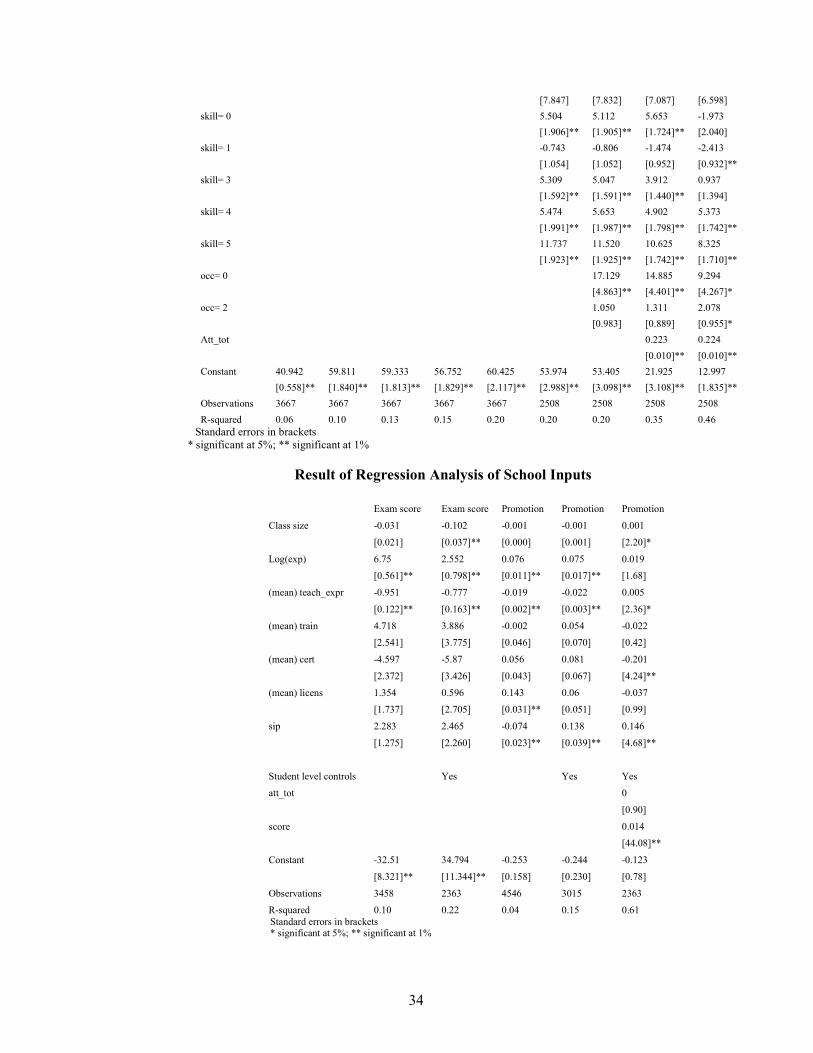
34
[7.847] [7.832] [7.087] [6.598]
skill= 0 5.504 5.112 5.653 -1.973
[1.906]** [1.905]** [1.724]** [2.040]
skill= 1 -0.743 -0.806 -1.474 -2.413
[1.054] [1.052] [0.952] [0.932]**
skill= 3 5.309 5.047 3.912 0.937
[1.592]** [1.591]** [1.440]** [1.394]
skill= 4 5.474 5.653 4.902 5.373
[1.991]** [1.987]** [1.798]** [1.742]**
skill= 5 11.737 11.520 10.625 8.325
[1.923]** [1.925]** [1.742]** [1.710]**
occ= 0 17.129 14.885 9.294
[4.863]** [4.401]** [4.267]*
occ= 2 1.050 1.311 2.078
[0.983] [0.889] [0.955]*
Att_tot 0.223 0.224
[0.010]** [0.010]**
Constant 40.942 59.811 59.333 56.752 60.425 53.974 53.405 21.925 12.997
[0.558]** [1.840]** [1.813]** [1.829]** [2.117]** [2.988]** [3.098]** [3.108]** [1.835]**
Observations 3667 3667 3667 3667 3667 2508 2508 2508 2508
R-squared 0.06 0.10 0.13 0.15 0.20 0.20 0.20 0.35 0.46
Standard errors in brackets
* significant at 5%; ** significant at 1%
Result of Regression Analysis of School Inputs
Exam score Exam score Promotion Promotion Promotion
Class size -0.031 -0.102 -0.001 -0.001 0.001
[0.021] [0.037]** [0.000] [0.001] [2.20]*
Log(exp) 6.75 2.552 0.076 0.075 0.019
[0.561]** [0.798]** [0.011]** [0.017]** [1.68]
(mean) teach_expr -0.951 -0.777 -0.019 -0.022 0.005
[0.122]** [0.163]** [0.002]** [0.003]** [2.36]*
(mean) train 4.718 3.886 -0.002 0.054 -0.022
[2.541] [3.775] [0.046] [0.070] [0.42]
(mean) cert -4.597 -5.87 0.056 0.081 -0.201
[2.372] [3.426] [0.043] [0.067] [4.24]**
(mean) licens 1.354 0.596 0.143 0.06 -0.037
[1.737] [2.705] [0.031]** [0.051] [0.99]
sip 2.283 2.465 -0.074 0.138 0.146
[1.275] [2.260] [0.023]** [0.039]** [4.68]**
Student level controls Yes Yes Yes
att_tot 0
[0.90]
score 0.014
[44.08]**
Constant -32.51 34.794 -0.253 -0.244 -0.123
[8.321]** [11.344]** [0.158] [0.230] [0.78]
Observations 3458 2363 4546 3015 2363
R-squared 0.10 0.22 0.04 0.15 0.61
Standard errors in brackets * significant at 5%; ** significant at 1%

35
Complete Result of Regression Analysis for School Inputs
Exam score Exam score Promotion Promotion Promotion
Class size -0.031 -0.102 -0.001 -0.001 0.001
[0.021] [0.037]** [0.000] [0.001] [2.20]*
Log(exp) 6.75 2.552 0.076 0.075 0.019
[0.561]** [0.798]** [0.011]** [0.017]** [1.68]
(mean) teach_expr -0.951 -0.777 -0.019 -0.022 0.005
[0.122]** [0.163]** [0.002]** [0.003]** [2.36]*
(mean) train 4.718 3.886 -0.002 0.054 -0.022
[2.541] [3.775] [0.046] [0.070] [0.42]
(mean) cert -4.597 -5.87 0.056 0.081 -0.201
[2.372] [3.426] [0.043] [0.067] [4.24]**
(mean) licens 1.354 0.596 0.143 0.06 -0.037
[1.737] [2.705] [0.031]** [0.051] [0.99]
sip 2.283 2.465 -0.074 0.138 0.146
[1.275] [2.260] [0.023]** [0.039]** [4.68]**
female -1.261 -0.001 0.004
[0.862] [0.017] [0.36]
mountain -14.503 0.092 0.211
[3.854]** [0.072] [3.94]**
hill -12.023 0.072 0.087
[3.075]** [0.058] [2.05]*
terai -3.22 0.38 0.205
[3.195] [0.059]** [4.65]**
east -1.222 -0.258 -0.236
[2.654] [0.051]** [6.43]**
west -3.887 -0.068 0.047
[2.004] [0.038] [1.70]
midwest 4.636 -0.097 -0.074
[2.397] [0.044]* [2.24]*
farwest -2.379 -0.368 -0.204
[2.978] [0.053]** [4.94]**
overage 7.84 0.107 -0.001
[0.999]** [0.020]** [0.08]
cast_code== 1.0000 -5.504 -0.061 -0.03
[1.711]** [0.033] [1.25]
cast_code== 3.0000 -7.726 -0.112 -0.02
[2.081]** [0.040]** [0.69]
cast_code== 4.0000 -0.783 -0.128 -0.098
[1.876] [0.036]** [3.79]**
cast_code== 5.0000 -2.203 -0.137 -0.082
[2.654] [0.050]** [2.23]*
cast_code== 6.0000 -1.935 -0.005 -0.048
[2.954] [0.057] [1.17]
cast_code== 7.0000 -16.26 -0.241 -0.09
[2.023]** [0.041]** [3.16]**
cast_code== 8.0000 -11.075 -0.178 -0.116
[2.813]** [0.056]** [2.97]**
cast_code== 10.0000 -3.888 -0.019 -0.112
[3.685] [0.073] [2.20]*
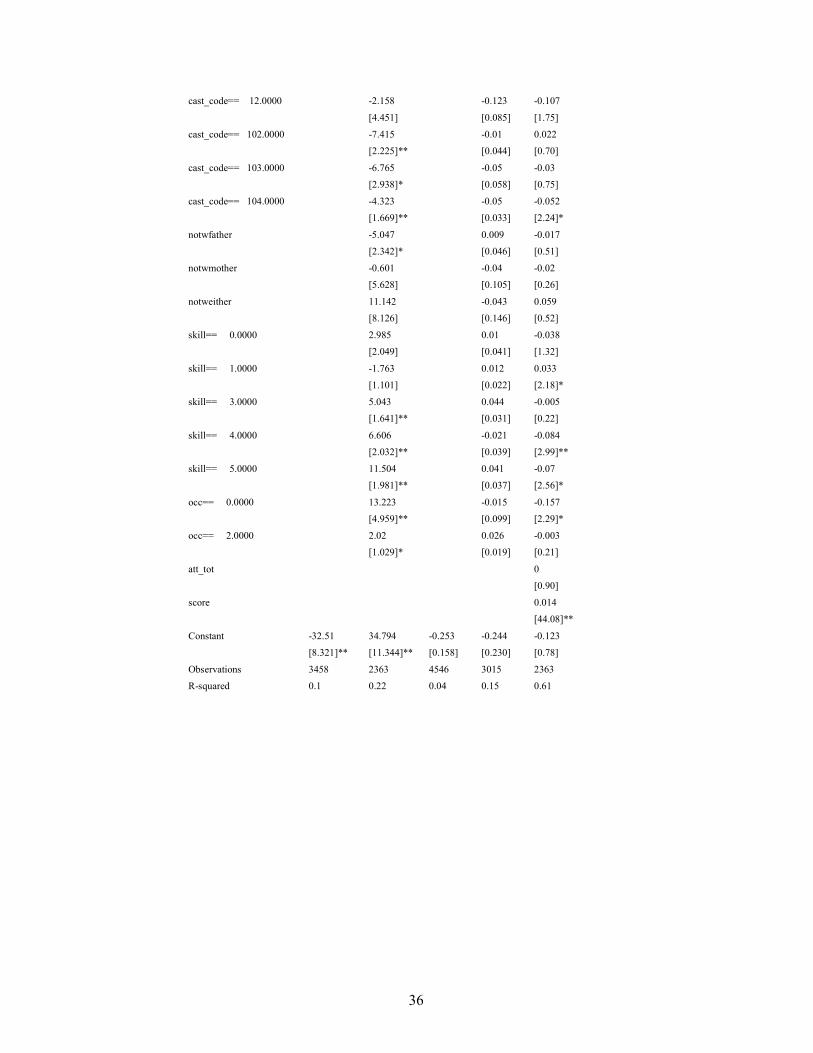
36
cast_code== 12.0000 -2.158 -0.123 -0.107
[4.451] [0.085] [1.75]
cast_code== 102.0000 -7.415 -0.01 0.022
[2.225]** [0.044] [0.70]
cast_code== 103.0000 -6.765 -0.05 -0.03
[2.938]* [0.058] [0.75]
cast_code== 104.0000 -4.323 -0.05 -0.052
[1.669]** [0.033] [2.24]*
notwfather -5.047 0.009 -0.017
[2.342]* [0.046] [0.51]
notwmother -0.601 -0.04 -0.02
[5.628] [0.105] [0.26]
notweither 11.142 -0.043 0.059
[8.126] [0.146] [0.52]
skill== 0.0000 2.985 0.01 -0.038
[2.049] [0.041] [1.32]
skill== 1.0000 -1.763 0.012 0.033
[1.101] [0.022] [2.18]*
skill== 3.0000 5.043 0.044 -0.005
[1.641]** [0.031] [0.22]
skill== 4.0000 6.606 -0.021 -0.084
[2.032]** [0.039] [2.99]**
skill== 5.0000 11.504 0.041 -0.07
[1.981]** [0.037] [2.56]*
occ== 0.0000 13.223 -0.015 -0.157
[4.959]** [0.099] [2.29]*
occ== 2.0000 2.02 0.026 -0.003
[1.029]* [0.019] [0.21]
att_tot 0
[0.90]
score 0.014
[44.08]**
Constant -32.51 34.794 -0.253 -0.244 -0.123
[8.321]** [11.344]** [0.158] [0.230] [0.78]
Observations 3458 2363 4546 3015 2363
R-squared 0.1 0.22 0.04 0.15 0.61