Cognos Audit Data Expert Guide 0216 - Cognos BI - Cognos ...

Cognos Analytics 11.1.7For Report Viewers
Center for Data, Analytics and Reporting (CeDAR)Authored by: Leah TargonUpdated 4-2021

2
1) Accessing the University Environment
from an Off Campus Location:
VPN and Browsers
2) Accessing the Information Warehouse
3) University Financials Prime Portal to
Team Content Area
4) Welcome Page and Report Tiles
5) Navigating to Your Reports:
Team Contents, HR Reports and
Student Record Reports

3
6) The Search Feature:
Search for a Report, Save a Search,
Filter a Search
7) Running a Report, Saving a Report:
Run from Report Title, “Run As” button,
selecting Report Formats
8) Reports and Report Views
(saved to My Content area)
9) Scheduling a Report View to run on a
recurring basis
10)QRC for Scheduling a Report

4
When working remotely you must VPN into
the Princeton University environment to
access the Cognos environment.

Your VPN Options
5
Global Protect and SonicWall are preferred VPN tools.
We recommend that you have Global Protect installed
onto your laptop, vs. using the browser application.
Contact the SOC ([email protected]) to install
these tools onto your computer.

• Chrome
• Firefox ESR
• Internet Explorer
• Safari
• Microsoft Edge
6

How Do You Enter the IW?
External Links
PeopleSoft
STRIPES
PRIME Financials Reporting Tile
CeDAR Website
7

You may also enter the IW Production environment via the
CeDAR Website: https://cedar.princeton.edu
We recommend that you bookmark this url in your browser.
There is a link at the top in the middle of the page to
Enter the Warehouse.
8

Report consumers who work
with financial reports may
access the Information
Warehouse via the
Reporting tile at:
https://prime.princeton.edu
9
The Reporting tile can
be found in the bottom
half of the Prime Portal
window.
We recommend that
you bookmark this url in
your browser.

When you click on a link to enter
the IW you will be directed to the Princeton Central Authentication
Service portal.
Enter your NetID and Password.
Login
You will be prompted to
receive a Duo request, via
mobile, phone or email.
When you approve the request
you will be sent into the IW.
10

When you enter the IW via the Prime Financial portal
there are links to Labor Accounting reports.
11
The left gray
navigation bar
contains buttons
for the IW.
The House icon
takes you to the
IW Welcome
Page.
12
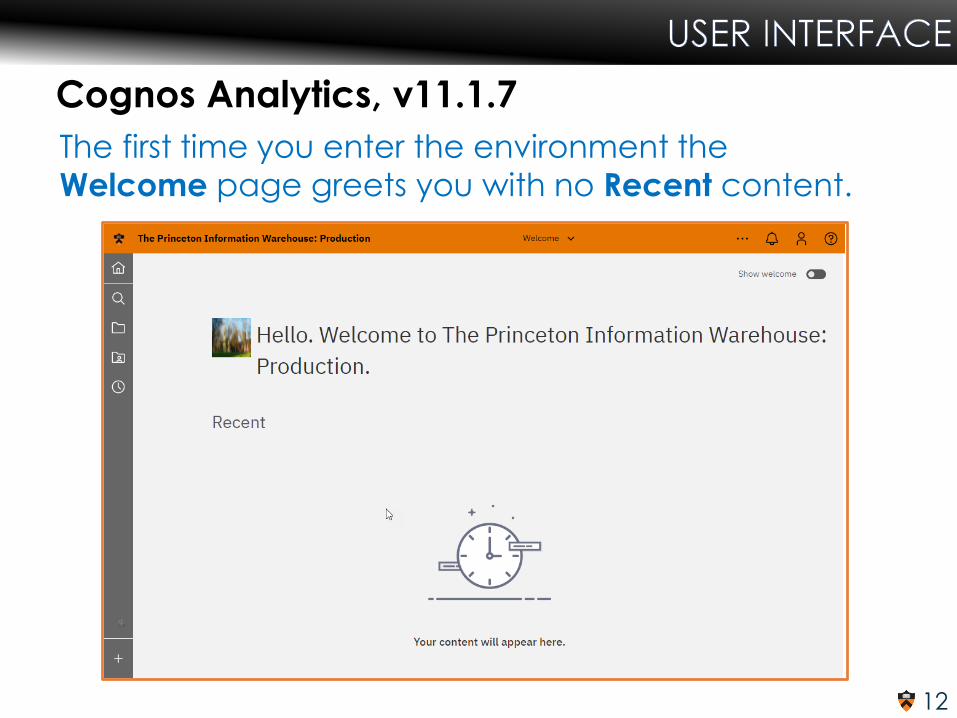
Cognos Analytics, v11.1.7
The first time you enter the environment the
Welcome page greets you with no Recent content.

13
Objects will populate the Welcome page as you open them,
appearing under the Recent heading.
The object icons and pills indicate if the object is a report, report view,
visualization, or dashboard.
The last modified date and time is also indicated at the bottom of each tile.

14
The gray navigation toolbar buttons contain fly-out panels.
The Home icon and the pull-down menu in the center of the Orange toolbar take you to your Welcome page.

15
The Search feature allows you to search for packages,
folders, reports, and visualizations.

16
The Search button opens the Search field window.
As you begin typing any objects that meet the criteria will begin to
populate the window.

17
You can select an object from the pull-down menu or hit
the Enter key to return all related objects.
Note: Icons next to objects indicate if they are packages/
data sets, folders, reports/report views, or other objects.
Report icon.
Report view icon

18
The Save and Filter buttons are in the top right of the Search window.
The Save button allows you to Save searches that you may use often.
When you Save a search the next time you return to the Search
window your Saved searches will appear under the Search field.

19
Best Practice: Search Feature for Reports Run Occasionally
You can use the Saved searches feature to quickly find those reports that you
need to access/run occasionally, i.e. monthly, quarterly, yearly. Using the
Report Name as a saved search is an easy way to find and retrieve reports
used less often.
Note: Of course, you have to
remember that you have
created a saved search for
these reports which you may
run less often.
Note: If the report writer has
renamed or movd the report,
your saved search will not
work. Reach out to your
package custodian if you
cannot access your report.

22
Cognos Analytics 11.1.7
Enhanced Run as window
You can run your report
immediately or schedule to run it at
some future time.
You may email the report output to
yourself or others who have access
to the data.

23
Running a Report
Navigate to a report via the Team content or My content
button. A fly-out window appears showing reports that you may access.
When you click on the More (…) button next to the report
name a pull-down menu opens. When you select the Run as
button next to a report name, the Run as window opens.

24
You can:
1) Choose when to run the report: now or later.
The default setting is run now.
Select your report Format, including HTML, PDF, Excel,
Excel Data, CSV, XML.
2) Click the Run button to accept your choices and run
the report.

25
1) When you run the report to PDF or Excel formats you may
save the report output to your desktop.
2) A Save as window opens. You may use the default name
or modify it.
3) You can also select where to store your report output on
your desktop.

26
Run in background: Later
When you select run Later, a calendar and time window
appear. You can select the Run date and time for the
report, at some date and time in the future.

27
Run in background: Prompt me
If there is a prompt(s) in your report you will be prompted
to select prompt value(s) prior to running the report.

28
Run in background: Prompt me
After you select your Run as option and run the report you
will be directed to your prompt(s) before the report runs.
Below is a sample prompt.

29
Run in background: Later
Delivery method: scroll down to view this window.
1) You may Save report or Save as a report view.
2) Send report by email.
3) Disabled: Send report to mobile device and Print.

30
Delivery: Send report by email
1) Click on Send report by email.
2) Click on Edit details to open the Edit details window.

31
Delivery: Send report by email
1) Your user ID will auto load into the To field. Delete this netID.
Enter the entire email address(‘) you want to receive this
report.
2) A default subject with the report name auto-fills the field.
You can modify this.
Note: Only those users
who have access to
view the data will see
the data within the
report.

32
Delivery: Send report by email
1) Below the message body window are additional report options.
You may include a link to the report.
You may attach the report output.
2) Select Run when
ready. Your report will
be delivered to your
“Inbox.”
Note: Only those
consumers who have
access to view the data
will see the data within the report.

33
After running your report you may return to the
Welcome window via the orange toolbar
pull-down menu.

34
After running your report it will now appear in the
Recent area as the first tile listing the report name,
and last modified date and time.

35
Cognos Analytics 11.1.7
1) Subscriptions – report emailed to
you only- can schedule only only
one or more days per week.
2) Scheduling Report Views – Create
and schedule a report view
3) Frequency: When you need it, daily,
weekly, monthly, yearly, etc.
36
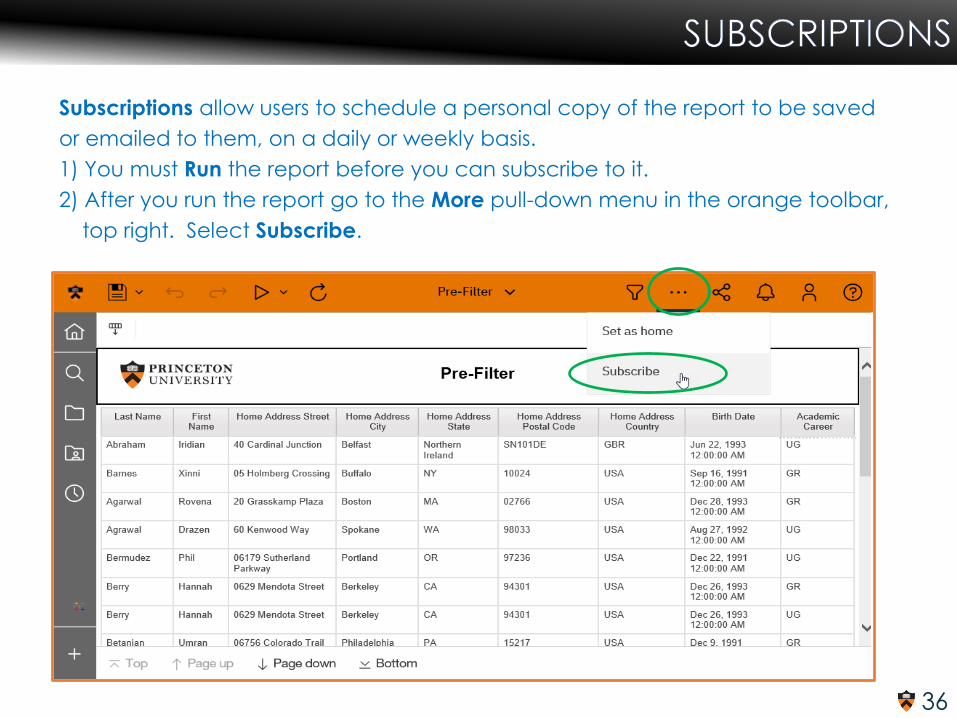
Subscriptions allow users to schedule a personal copy of the report to be saved
or emailed to them, on a daily or weekly basis.
1) You must Run the report before you can subscribe to it.
2) After you run the report go to the More pull-down menu in the orange toolbar,
top right. Select Subscribe.

37
The Subscribe window opens.
Here you can select the run day(s), time, format and delivery
mode for your report. Click Create when done.

38
Frequency: You can select one or more days of the week to run your report.
Time: When you click on the time a window opens allowing you to set the report run time.

39
Format: When you click on the
format button a new window
opens.
Here you can select one or more formats for your report
output.
Select Done when ready, to
accept your selections.

40
Delivery Options
Select the Save icon next to
Delivery to open the Delivery
options window.

41
Email Delivery Options
You may Send report by
email and Save report.
When you select Send
report by email you are given the option to
Attach the report to the
email, or Include a link to
the report.
After you have made
your selections select
Done to accept your
choices.
Disabled: Print report and
Save to cloud

43
To verify that your Subscriptionhas been created go to the Person icon pull-down menu in the orange toolbar, top right.
Select My schedules and subscriptions.
Note: The Subscription has to run at least once to create report output that will show your subscription.

44
The Schedule window opens. Enabled
and Disabled objects are listed in the bar chart. Other objects are listed below:
1) Name: Object name
2) Modified: Last modified date & time
3) Type: Icon indicating a schedule (calendar) or subscription (report
page with person icon)
3) Scheduled by: NetID indicating who scheduled the object
5) Status (Enabled, Disabled)
6) Priority: Numeric level, 3 is the default.(Only report writers can change the
priority setting.

45
The Schedule window opens.
Enabled and Disabled objects
are listed in the bar chart. Other
objects are listed below:
1) Name: Object name
3) Modified: Last modified date &
time
4) Scheduled by: NetID indicating
who scheduled the object
5) Status (Enabled, Disabled)

46
If you click on the More (…) button, rightmost on the object line, a
drop-down function window opens.
From here you can:
3) View versions: The Versions tab allows you to view the reports that
have run.
The Archives tab is disabled.
4) Disable this subscription: This is a
toggle button, so you can Disable
and Enable the subscription here.
5) Remove this subscription: If you no longer need or want this subscription
it can be removed here.
1) Run once: Run your report, report view, visualization once.
2) Modify this subscription: The Subscribewindow opens and you can modify
the Days run, Time run, Format and
Delivery of the Subscription.

47
1) Under the More pull-down menu select View versions.
2) The Versions tab opens showing the most recent run of the
report.
3) To view earlier runs of the report select the Show all history box.
View Versions of Your Scheduled Report

48
1) By default the last 5 versions
of report output are saved,
with only the last successful report output run being
viewable. Report authors may
modify this setting.
2) When you click on the report
date and time the detail
window will open.
Note: Earlier versions by
default setting are not
accessible. The report writer
can modify this default setting.
View Versions of Your Scheduled Report

49
1) The report format is shown on the right (HTM).
If you click the format icon you will be taken to the
report output of this version.
2) You can also Delete this version here.
Report Version Detail Window

50
1) The report output appears in the same browser tab.
2) To return to the Schedule window use the blue
return button.
View Version of Report Output

51
1) A red circle with an
exclamation point
indicates that the report
did not run successfully.
2) When you click on the
blue details button a
new window will open.
Report Run Issues

52
1) In the top right of the window
it indicates that the report run
has failed.
2) The Messages window below
gives you details regarding
the cause of the run failure.
3) The Run time window gives
details about the report run
Request time, Start time, and
End time.
View Run History Details
Note: If a report run fails on a regular
basis please contact the Help Desk to
create a SN@P ticket. Include a
screen shot of this message details
window with your ticket.

53
After a schedule runs you
will notice a new
notification in the top
orange toolbar.
When you click on the
bell button the
Notifications window
opens indicating that a
new version of a report is
now available.

54
Cognos Analytics 11.1.7
1) Subscriptions: Report output emailed to
only you.
Frequency: One or more days per week.
2) Scheduling Report Views: The report
output may be emailed to you and
others.
Frequency: When you need it, daily,
weekly, monthly, yearly, etc.

55
Best Practice:
The original report can be modified and moved by the report author.
When you save the Report as a Report View to your My Content area you are
creating a version of the Report that is yours alone. If any changes are made
to the original report, your report view will automatically incorporate the
changes.
Note: The Report View icon includes an eye.
The Report icon looks like a bar chart.
Report
Report view

56
Navigate to the report via the gray navigation bar and
the fly-out windows. To the right of the report name
click on the More (…) button to open the pull-down
menu. Select Create Report View.
Create and Schedule a Report View

57
Navigate to the My Content area where you would like to save
your report view.
Note: You may create a new folder by clicking on the folder icon
in the top right of the window. Name the new folder. Click the
Enter button on your keyboard to create the new folder.

58
Navigate to the report view in your My Content area
via the gray Nav bar. Open the More (…) button pull-
down menu and select the Properties button.

59
When the new window opens select the Schedule tab.
A new windows opens. Click on the Create schedule
button.

60
The window opens to the Schedule tab.
Here you can select the Frequency of running the report.
Frequency Type
Daily
Weekly
Monthly
Yearly
Based upon the Type
selected you can select
how often the report run
repeats, and on what
days you repeat running
the report.

61
The Options tab includes Format and Delivery options.
You may select one or more Format options.
HTML
Excel
Excel Data
CSV
XML

62
Delivery options include Save report and
Send report by email.
Note: The Send report to mobile device and Print
options are disabled.

63
When you select Send report by email the Edit details
button appears. Click it to define your email options.

64
In this window you select your email recipients and
create the subject and message for your report.
The To line auto-loads the
netID you are using.
Remove this netID. All
netIDs need the suffix
@Princeton.edu .
Subject: You may use the
default Subject or write
your own.
Message: You may write
your own message.

65
Below the message window are 2 radio buttons. You may
include a link to the report in your email, or attach the
report output. Include link is the default selection.
Note: Any recipients you
select must have access
to the report data or the
link will not take them to
the report output, nor will
report output attached to
the email contain any
content.
Remember to select Save
when you have finished
making your choices.

66
If your report contains one or more prompts you
need to set your Prompt values to run the report on
a recurring basis.
When you select the
Prompt tab click on the
Set values button.
You will be taken to the
prompts where you
select your values.
Select Run after
selecting your value(s).

67
After running you will return to the Prompt window.
Here you can check that the Parameter name and
Parameter values you have selected are correct.
Remember to select
Save when ready.

68
You are taken back to the Schedule tab.
Note that under the Summary there is a description of
the report scheduling options you have selected.
If you want to modify your selection use the Edit button
to return to the Schedule, Options and Prompts tabs.

69

HELPFUL LINKS & RESOURCES

We in CeDAR are here to answer any questions you may have. In
addition, we have provided a few links that should prove to be useful.
Resource Link/email
CeDAR Website https://cedar.princeton.edu
OIT Support and Operations (SOC) [email protected]
Prime Portal https://prime.princeton.edu
Financial Service Center (FSC) [email protected]
Employee Learning Center www.princeton.edu/training
Information Warehouse (Production) Will be updated on 12/4/2020
IBM Knowledge Center https://www.ibm.com/support/knowledgecenter/
71

72


![IBM Cognos Disclosure Management V1025npublic.dhe.ibm.com/software/data/cognos/documentation/...Cognos Business Intelligence "B g{_P|, Cognos Business Intelligence Z]D Excel Ts,G4VZITZ](https://static.fdocuments.us/doc/165x107/60ea0564b8409037c3492735/ibm-cognos-disclosure-management-cognos-business-intelligence-b-gp.jpg)