Cognitive and Noncognitive Changes From Participation in ... · Cognitive and Noncognitive Changes...
44
Cognitive and Noncognitive Changes From Participation in National Guard Youth ChalleNGe Jennie W. Wenger • Jennifer R. Atkin DRM-2013-U-005201-Final October 2013
Transcript of Cognitive and Noncognitive Changes From Participation in ... · Cognitive and Noncognitive Changes...

Cognitive and Noncognitive ChangesFrom Participation in National Guard
Youth ChalleNGe
Jennie W. Wenger • Jennifer R. Atkin
DRM-2013-U-005201-FinalOctober 2013

This document represents the best opinion of CNA at the time of issue.It does not necessarily represent the opinion of the Department of the Navy.
Approved for Public Release; Distribution Unlimited. Specific authority: N00014-11-D-0323 .Copies of this document can be obtained through the Defense Technical Information Center at www.dtic.milor contact CNA Document Control and Distribution Section at 703-824-2123.
Copyright 2013 CNAThis work was created in the performance of Federal Government Contract Number N00014-11-D-0323. Any copyright in this work is subject to the Government's Unlimited Rights license as defined in DFARS 252.227-7013 and/or DFARS 252.227-7014. The reproduction of this work for commercial purposes is strictly prohibited. Nongovernmental users may copy and distribute this document in any medium, either commercially or noncommercially, provided that this copyright notice is reproduced in all copies. Nongovernmental users may not use technical measures to obstruct or control the reading or further copying of the copies they make or distribute. Nongovernmental users may not accept compensation of any manner in exchange for copies. All other rights reserved.
Members of Freestate ChalleNGe Academy class #34 march to their commencement at Aberdeen Proving Ground, Md., June 12. The academy, part of the National Guard Youth ChalleNGe Program, is a 22-week military orientated program that takes “at risk” youth and provides them with education, life-coping skills and other tools to become successful members of society. (U.S. Air Force photo by Tech. Sgt. Gareth Buckland/Released)
Approved for distribution: October 2013
David Rodney, DirectorFleet and Operational Manpower TeamResource Analysis Division

Contents
Executive summary . . . . . . . . . . . . . . . . . . . . . . . . 1
Introduction and background. . . . . . . . . . . . . . . . . . . 3National Guard Youth Challenge . . . . . . . . . . . . . . 3Noncognitive skills . . . . . . . . . . . . . . . . . . . . . . 4The Washington Youth Academy . . . . . . . . . . . . . . 5
Data sources and methodology . . . . . . . . . . . . . . . . . . 7Cognitive skills: TABE scores . . . . . . . . . . . . . . . . 7Noncognitive skills: cadet survey . . . . . . . . . . . . . . 9
Results . . . . . . . . . . . . . . . . . . . . . . . . . . . . . . . 13Noncognitive skills . . . . . . . . . . . . . . . . . . . . . . 13Predictive power of noncognitive measures . . . . . . . . 17Adoption of the Khan Academy curriculum . . . . . . . . 19
Implications and recommendations . . . . . . . . . . . . . . . 25
Appendix: Supplemental information . . . . . . . . . . . . . . 27
References . . . . . . . . . . . . . . . . . . . . . . . . . . . . . 33
List of figures . . . . . . . . . . . . . . . . . . . . . . . . . . . 35
List of tables . . . . . . . . . . . . . . . . . . . . . . . . . . . . 37
i

This page intentionally left blank.
ii
Executive summary1
In this research, we document our analysis of one National GuardYouth Challenge (ChalleNGe) program’s data on participants’ cogni-tive and noncognitive skills. We find that participants’ (cadets’) non-cognitive skills increase substantially over the course of the five-month program. We also find that the program’s recent adoption ofan online math curriculum, presented through a facilitated instruc-tion model, is associated with higher gains in math scores.
The ChalleNGe program serves 16- to 18-year-old high school drop-outs and students at risk of dropping out. The program modelincludes substantial classroom instruction as well as a strong emphasison noncognitive skills, such as leadership, planning, and determina-tion. The Washington Youth ChalleNGe Academy (WYA) is part ofthe ChalleNGe program. WYA focuses on credit recovery—classroominstruction aimed at completing certified courses so that cadets canreenter their home high schools after ChalleNGe on track forgraduation.
During the most recent program cycle (spring 2013), the WYA col-lected data on cadets’ noncognitive skills by surveying cadets at thebeginning and the end of the program. The survey included severalpotential measures of noncognitive skills, such as determination, con-fidence, and ability/willingness to follow directions. The programalso collected data on cognitive skills from the Test of Adult BasicEducation (TABE).
Our analyses indicate that cadets’ noncognitive skills increased sub-stantially during the program. At the beginning of the program, maleand female cadets recorded different levels of various noncognitive
1. We are very grateful to Lauren Malone for providing a helpful review ofthe document, and to Molly McIntosh for her assistance during earlierphases of this project.
1

skills; female cadets showed higher levels of determination and agreater ability to follow directions, while male cadets showed higherlevels of math confidence and locus of control (belief that one’sactions influence eventual outcomes). By the end of the program, themeasured noncognitive skills of both male and female cadets hadimproved on average, and the gender differences were no longerevident.
Particularly in the case of female cadets, we found that initial mathconfidence was a strong predictor of math success (measured byincreases in math test scores). This suggests that focusing on mathconfidence at the beginning of the program could pay dividends,especially for female cadets.
The program’s recent decision to adopt the Khan Academy math cur-riculum also is associated with increased gains on math test scores. Inparticular, applied math skills (measured by the test-taker’s ability tosolve math-based word problems) increased by an additional half agrade level compared with what we would have expected had the cur-riculum remained unchanged. Gains were larger for female cadetsthan for male cadets, and gains were larger for cadets who began theprogram with relatively low scores. Moreover, given the other cogni-tive outcomes, we believe that these results may understate the trueeffects somewhat. We suspect that these results are driven by the largevariation in initial math skills across cadets who enter the program(standardized test scores suggest that cadets’ initial math perfor-mance ranges from 1st- to 12th-grade level; providing cogent instruc-tion to a group with such a range of backgrounds is extremelychallenging, but the online curriculum allows each cadet to work atan appropriate level).
Of course, we would like to expand the dataset by adding data fromupcoming classes. We also strongly recommend that the program col-lect more, and more detailed, information about the eventual successof cadets who return to their home high schools. At this point, how-ever, we feel confident in stating that the program has a positiveimpact on noncognitive skills and in recommending that the pro-gram continue to use the online math curriculum.
2

Introduction and background
In this section, we provide some background information on theentire National Guard Youth Challenge (ChalleNGe) program. Wealso discuss some aspects of noncognitive skills. Finally, we provideinformation on the ChalleNGe site that is the focus of this analysis—the Washington Youth ChalleNGe Academy (WYA).
National Guard Youth Challenge
ChalleNGe is a quasi-military, 22-week residential program designedto serve 16- to 18-year-old high school dropouts and those at risk ofdropping out.2 (Students who have earned far fewer high schoolcredits than expected are considered to be at risk.) A mentoring com-ponent follows the residential phase; participants (known as“cadets”) work with their mentors for at least another year.
The ChalleNGe program is funded jointly by DOD, the states, and thestate National Guard units. Currently, there are 34 locations in 29states, the District of Columbia, and the territory of Puerto Rico. MostChalleNGe programs consider passing the General EducationalDevelopment (GED) tests to be the primary academic goal. However,some programs award alternate credentials, such as state high schooldiplomas to cadets who complete the program. Other programs focuson credit recovery so the cadet can reenroll in and graduate from hisor her previous high school after completing ChalleNGe. In thismodel, programs provide coursework certified by state or localauthorities; cadets who complete the program transfer these creditsback to their home high schools. Finally, some programs are consid-ered schools and award regular high school diplomas.
2. The program is quasi-military in the sense that participants live in bar-racks, wear uniforms, and take part in drills, marching, and regularphysical training, but they are not military enlistees.
3

The ChalleNGe model is quite detailed; it includes eight core compo-nents: leadership/followership, responsible citizenship, service tocommunity, life-coping skills, physical fitness, health and hygiene, jobskills, and academic excellence. Academic progress can be followedthrough changes in standardized test scores, course completions, andcredits/credentials awarded, but the other components are more dif-ficult to measure. Indeed, many of these components depend heavilyon the development of noncognitive skills. An emphasis on develop-ing such noncognitive skills as long-term planning is a commonaspect of many programs designed for preteens and teens.3 Given theChalleNGe program’s emphasis on noncognitive skills, it would bepreferable to have a measure of such skills and, optimally, a measureof how they change during the course of the program.
Noncognitive skills
Noncognitive skills, sometimes referred to as “soft skills,” includemany aspects of personality and attitude, such as communicationskills, determination, leadership, ability to make and carry out plans,and timeliness. These skills generally are acknowledged to be impor-tant in the job market and in life but often have taken a back seat tocognitive skills (skills that are academic in nature, such as reading andmathematics proficiency) in the education and the economics litera-tures. In recent years, however, research emphasis has shifted toinclude and sometimes even focus on noncognitive skills (e.g., see[1]). While the literature is fairly wide ranging, it is clear that noncog-nitive skills are strongly associated with a wide variety of highly rele-vant outcomes, such as dropping out of, versus completing, highschool, attending college, participating in the labor market, and theprobability of arrest/incarceration (see [2], [3], and [4]).
A key aspect of noncognitive skills is that they can be developedthroughout childhood and the young adult years [5, 6]. Indeed, an
3. For example, the Job Corps model includes academic and vocationalskills as well as “employability skills and social competencies.” For moredetails, see www.jobcorps.gov/AboutJobCorps/program_design.aspx(last accessed June 24, 2013).
4
increase in noncognitive skills is the most likely explanation for thelong-term success of participants of early childhood interventions,such as the Perry Preschool Project [4]. While cognitive and noncog-nitive skills are not completely unrelated, correlations are far fromperfect, suggesting that they measure different attributes [2].
The Washington Youth Academy
In this work, we focus on one program, the WYA in Bremerton, Wash-ington. This program uses a credit recovery model; cadets who com-plete the program are awarded high school credits for courseworkcompleted at the academy and then return to their home highschools having made substantial progress toward graduation. Duringthe most recent cycle of the program (January through June 2013),WYA used a survey to measure cadets’ noncognitive skills. Cadetscompleted the survey at the beginning and the end of the program.At the same time, WYA moved to a new math curriculum based on afacilitated online model; cadets work independently using computersto access modules developed by the Khan Academy, but a mathteacher is in the room at all times and provides input, guidance, andassistance as needed.4 Although the research on online learning inthe K–12 arena is still fairly limited, findings suggest that such a cur-riculum is likely to be more effective than unstructured online learn-ing and could provide better opportunities than more traditionalclassroom approaches (see [7]).
We analyze data provided by WYA to determine the extent to whichcadets’ noncognitive skills changed over the course of the program,to explore the relationships between noncognitive skills and otheroutcomes of interest, and to test the correlation between the new cur-riculum and cadets’ gains in math. In the next section, we providedetailed information on our data, including the noncognitive mea-sures on the survey that WYA used. Later sections of the paper presentour results and our recommendations.
4. The Khan Academy is a nonprofit website with several thousand shortvideos and practice problems on a wide range of topics. For more infor-mation, see www.khanacademy.org (last accessed June 13, 2013).
5

This page intentionally left blank.
6
Data sources and methodology
In this analysis, we use several sources of data provided by WYA. First,the program collected cadets’ scores on the Test of Adult Basic Edu-cation (TABE) at the beginning and the end of the program. (Theprogram also collected and provided us with TABE scores on cadetswho attended past sessions; we use this information to analyze theeffects of the shift to the online math curriculum as discussed below).In addition, the program collected data indicating which cadets com-pleted ChalleNGe. Finally, all cadets completed a survey that wasdesigned to measure noncognitive skills; they completed the surveytwice—once in early February (at the end of pre-ChalleNGe, rightbefore classroom instruction began) and again during the last weekof classes. In this section, we provide more information on each datasource.
Cognitive skills: TABE scores
Our measure of cognitive skills is formed from the TABE, whichcadets take at the beginning and the end of ChalleNGe. The TABEwas designed for placement of adult learners and is often used as anassessment tool in adult education programs with a focus on complet-ing the GED tests. Each subsection of the TABE is scored to indicategrade level (for example, a score of 9.3 indicates performance at the3rd month of 9th grade).
We focus on the four subsections of the TABE, as well as on the totalscore (formed from averaging scores on the subtests). The subtestsinclude Math, Applied Math, Reading, and Language. The Math sec-tion is made up of computational problems requiring test-takers toperform addition, subtraction, multiplication, and division, to workwith percentiles, fractions, and exponents, and to solve basic algebraproblems. The Applied Math section is made up of word problems,which require the following abilities: chart and table comprehension,
7

basic equation setup, coordinate graphing, an understanding ofsome limited geometry, and application of the concepts of fractions,percentiles, and algebra in the context of word problems. The Lan-guage section includes questions on grammar and punctuation, com-bining sentences to preserve their meanings, and some basics ofparagraph composition. The Reading section involves reading pas-sages or detailed charts/tables and answering questions about thecontent.
ChalleNGe cadets attending the WYA usually enter the programaround the 6th-grade level in Math and near the 9th-grade level inApplied Math.5 They tend to come into the program scoring near the7th-grade level in Language and about halfway through 8th-grade inReading. However, these scores are averages, and the variation acrosscadets is substantial. The average cadet gains over 2 years on theTABE during the course of the program (suggesting their achieve-ment levels increase by more than 2 school years in 5.5 months).Based on all TABE data from 2009 through 2013, the average cadetgains 2.2 years in Math, 1.7 years in Applied Math, 1.7 years in Read-ing, and 2.5 years in Language.6 Thus, average scores are lowest andaverage gains are highest in (computational) Math and (grammar/compositional) Language. Some of this difference may be driven byceiling effects (cadets who score at least 10.5 on the TABE are limitedto lower-than-average gains because the maximum score is 12.9).7
5. While it seems counterintuitive that cadets tend to score higher onApplied Math than on (computational) Math, we believe this differenceoccurs because most 9th graders will have fairly strong computationalskills, but many will lag in math applications; thus, cadets may be moretypical in terms of Applied Math than computational Math.
6. Gain scores can be calculated only for cadets who complete the pro-gram; the completion rate at WYA from 2009 to 2013 was about 78 per-cent. This is a relatively high completion rate; across all programs, thecompletion rate was about 67 percent between 2006 and 2012.
7. In past classes, about 20 percent of cadets entered WYA with TABEscores of 10.5 or higher.
8

Noncognitive skills: cadet survey
Our data include several measures of noncognitive skills based on thesurvey completed by cadets. The cadets completed the survey at thebeginning of the program (right after the initial two weeks known as“pre-ChalleNGe” but before beginning classroom work); they com-pleted an identical survey during the last week of the program.8 Thesurvey included the following measures:
• Grit scale9
• Locus-of-control scale10
• Efficacy measures to determine cadets’ confidence in theirmath and science abilities11
• Time preference—would cadets prefer to be paid $50 today or$100 in 6 months?
• Following directions—cadets were asked to read and followinstructions on a question about why they left their previoushigh school
First, the survey included the 8-item grit scale, designed to measurethe respondent’s determination/tenacity. The answers range from
8. We wish to thank the WYA program staff, especially Mike Mittleider,Larry Pierce, Lynn Caddell, and Chris Acuna, for providing the dataused in our analyses and for cheerfully answering our queries. Theappendix includes additional details on the survey and the measuresused, as well as the distributions of initial and final grit and locus-of-control scores (figures 3 and 4).
9. The grit scale was developed by and used with the permission of Dr.Angela Duckworth, Department of Psychology, University of Pennsylva-nia.
10. The locus-of-control scale was developed by and used with the permis-sion of Dr. Julian Rotter, Emeritus Professor, Department of Psychol-ogy, University of Connecticut.
11. Efficacy scales were adapted from Middle and High School STEM-StudentSurvey, 2012, Raleigh, North Carolina, and used by permission of theFriday Institute for Educational Innovation, NC State University.
9

“Very much like me” to “Not like me at all” in the form of a 5-pointLikert (rating) scale. The grit score is calculated by awarding pointsfor stated determination; for example, one statement is, “I am a hardworker,” and another is “I often set 1 goal but later choose to pursuea different goal.” For the first statement, cadets received 5 points forselecting “Very much like me” and decreasing numbers of pointsdown to 1 point for “Not at all like me.” For the second statement,cadets received 1 point for choosing “Very much like me” and increas-ing numbers of points to 5 points for “Not at all like me.” Scores rangefrom 8 to 40 with higher scores indicating higher levels of determina-tion, or grit. Figure 3 (in the appendix) shows initial and final distri-butions of measured grit among cadets and indicates a shift towardhigher levels of grit over the course of the program.
Locus of control measures the extent to which a person believes that hisor her own actions (versus random factors or other powers) deter-mine outcomes. Essentially, the scale measures the extent to whichrespondents believe that they can control their lives. Those whobelieve that their own actions have consequences are designated“internal”; those who believe that other factors determine outcomesare termed “external.” Each question is a forced-choice format; therespondent chooses which of two statements best describes his or herbeliefs/feelings. Respondents receive 1 point each time they choosea statement indicating they have control over situations; the scoreranges from 0 (completely “external,” failing to see a relationshipbetween actions and consequences/reactions) to 13 (completely“internal,” giving no explanatory power to luck). Figure 4 (in theappendix) shows the initial and final distributions of locus of controlamong cadets and indicates a shift toward more internal scores.
Efficacy is measured using a 5-point Likert scale of responses to a seriesof statements about the cadet’s attitude toward and confidence inmath and science. We calculate math and science efficacy as separatevariables; in each case, the efficacy score is determined by awardingpoints for responses that exhibit positive attitude and confidence inthe subject. Thus, cadets who select “Strongly agree” for such state-ments as “I know I can do well in science” receive 5 points, as docadets who select “Strongly disagree” for such statements as “I canhandle most subjects well, but I cannot do a good job in science.”
10
Total efficacy scores are determined by adding the total number ofpoints for the eight math and nine science questions and taking theaverage; thus, each efficacy score indicates the average response onthe Likert scale with higher scores indicating higher efficacy. Scoresrange from 1 to 5. Figures 5 and 6 (in the appendix) show initial andfinal efficacy distributions among cadets. As is the case for grit andlocus of control, these figures indicate a shift toward higher levels ofefficacy over the course of the program.
Time preference is the fourth measure of noncognitive skills. A simplequestion asks whether the cadet would prefer to be paid $50 today or$100 in 6 months. Indicating a preference for $100 in 6 months sug-gests a level of determination, planning, and self control.
Following directions is the final measure. At one point in the survey,cadets are asked why they left their previous high school. The surveypresents a variety of reasons; cadets are instructed to mark all thatapply and to circle the most important reason. All cadets marked atleast one reason. We considered those who also circled a reason tohave followed the directions and those who did not circle a reason tohave not followed the directions.
Of the 152 cadets who entered the classroom portion of WYA in Janu-ary 2013, 151 filled out the initial survey. During the classroom phase,19 cadets left the program; thus, 133 cadets completed the programand the final survey. We have no post-ChalleNGe information oncadets who left during the classroom phase. Also, due to missing infor-mation, it was not possible to match 13 of the initial surveys to finalsurveys. We do know, based on program information, that 8 of the 13cadets completed the program. Therefore, we have 125 complete,matched surveys (including pre- and post-ChalleNGe information).
In a few cases, cadets skipped questions or sections of the survey, but,overall, cadets answered the vast majority of the questions on the pre-and post-ChalleNGe surveys. In each case, we present the most com-plete information possible.
11

This page intentionally left blank.
12

Results
In this section, we present our results based on the WYA data sources.First, we focus on survey results and analyze how cadets’ noncognitiveskills changed over the course of the program. We also examine therelationship between noncognitive skills and program outcomes.Then, we use the TABE results from multiple WYA sessions to exam-ine how cadets’ math achievement changed after the adoption of thenew online math curriculum.
Noncognitive skills
As discussed earlier, the WYA survey included several measures ofnoncognitive skills. Table 1 presents average scores on each measure.We list initial scores for all cadets who took the survey, as well as initialand final scores for the cadets who completed ChalleNGe.
Table 1. Noncognitive measures, before and after ChalleNGea
a. Data are from surveys collected by WYA. Initial data are collected at the end of pre-ChalleNGe (2 weeks into the program, at the beginning of classroom instruction); final data are collected during the last week of classes. See the previous section as well as the appendix for explanations of each noncognitive measure.
^ Differences between initial and final score among graduates are statistically significant at the 1-percent level (likelihood of occurring by chance less than 1 in 100).
* Differences between initial and final score among graduates are statistically significant at the 5-percent level (likelihood of occurring by chance less than 1 in 20).
Initial score Final score, graduatesNoncognitive measure All cadets Graduates
Grit score 24.7 25.0 28.7^Math efficacy 2.71 2.73 3.23^Science efficacy 2.90 2.89 3.03*Locus of control (internal) 6.57 6.55 8.46^Chose $100 in 6 months (%) 53.4 53.9 80.0^Followed directions (%) 17.2 21.1 30.9*Number of observations 151 125 125
13

Table 1 demonstrates two main ideas. First, among cadets who com-pleted the program, noncognitive skills improved over the course ofChalleNGe; this can be seen by comparing the final two columns ofthe table. On average, cadets who completed the program scoredhigher than they had at the beginning of the program on each mea-sure. Cadets’ grit (determination) improved, they reported beingmore internal (were more likely to believe their actions influencedoutcomes), and they had higher levels of efficacy (confidence) inboth math and science. In addition, at the end of the program, cadetswere more likely to choose $100 in 6 months over $50 today, suggest-ing an increase in self-control. Finally, based on one portion of thesurvey, cadets who completed ChalleNGe were more likely to readand follow directions than they had been at the beginning of the pro-gram. In each case, the differences were statistically significant, imply-ing that the differences are unlikely to have occurred by chance.
Some of the measures on the WYA survey were adopted from existinginstruments; exceptions are the questions about self-control and fol-lowing directions. Data on the efficacy scores are limited, but someresearch on the grit scale and decades of research on the locus-of-control scale exist. Cadets’ initial grit scales are lower than those ofany other population reported, but many of the groups tested couldbe expected to have high levels of determination (e.g., Ivy Leagueundergraduates, West Point cadets, and National Spelling Bee final-ists). By the end of WYA, graduates’ scales increased into the rangefound among all adults, as well as National Spelling Bee finalists; thissuggests that the grit of cadets at the end of the program is likely tocompare favorably with that of many of their peers (see [8]). Cadets’locus-of-control levels are considerably lower than levels reported formost groups; however, this may reflect the reality that the ability ofmost teens to control their lives is, in fact, quite limited (see [9]).
While noncognitive skills improve during the program, table 1 alsosuggests that most initial measures of noncognitive skills are unlikelyto predict which cadets will complete ChalleNGe. This can be seen bycomparing the initial scores for all cadets with the initial scores forthose cadets who completed ChalleNGe (the first two columns oftable 1). In the cases of grit, efficacy, locus of control (internality),and choice between $50 today versus $100 in 6 months, the average
14

initial scores for all cadets are very similar to the average initial scoresfor cadets who complete the program. This suggests that these mea-sures are not predictive of success (if having higher levels of thesemeasures were predictive of success, we would expect graduates tohave significantly higher initial scores than others). In the case ofreading directions, however, only 17 percent of all cadets initiallyread directions, but nearly 21 percent of those cadets who would goon to complete the program initially read the directions. While 21percent is still quite low, the difference between these figures suggeststhat those who did not complete ChalleNGe were very likely not tohave followed directions.12 Finally, differences between initial scoresof all cadets and initial scores of eventual graduates are insignificantat the 5-percent level, suggesting the differences are due to chance.
These results suggest that ChalleNGe has a substantial impact oncadets’ noncognitive skills but that initial noncognitive skills in mostcases do not predict program success. Thus, while the survey providespotential measures of ChalleNGe’s influence on cadets, there is littlereason to believe that cadets who initially have strong noncognitiveskills (at least by most survey measures) will be more successful thanothers in the program. Ability to follow directions is an exception,perhaps because of the highly structured nature of the ChalleNGeprogram—that is, noncognitive skills may be much more likely toaffect outcomes after completion of ChalleNGe.13 For example,cadets at ChalleNGe follow the program schedule and attend class asa group; after completing ChalleNGe, cadets return home and musttake much more responsibility for attaining their educational goals.For this reason, the program’s impact on cadets’ noncognitive skillsis likely to be a key outcome and is likely to be predictive over a rangeof longer term outcomes, such as completing high school, obtainingpostsecondary education, and participating in the labor force. This
12. Many cadets who did complete ChalleNGe failed to follow directions onthis section of the survey. But every single cadet who did not completeChalleNGe failed to follow directions on this portion of the survey.
13. Consistent with this, differences in noncognitive skills are thought to bean explanation for differences in performance among graduates andnongraduates who enlist in the armed forces (e.g., see [10]).
15

would be consistent with the literature on noncognitive skills; see theforegoing discussion.
Next, we examine these measures by gender. Table 2 demonstratesthat female cadets began the program with lower measures of efficacy(in science and in math) and were less internal than male cadets.However, female cadets began the program with higher levels of grit,and were more likely to read and follow directions on the first survey.
Female cadets experienced large gains in terms of locus of control;male cadets had very large gains in terms of grit. By the end of the pro-gram, average measures of these two skills were very similar betweenmen and women. Male cadets had very large gains in terms of follow-ing directions (recall that this is the only noncognitive skill that is obvi-ously related to program success; refer to table 1).
Our findings indicate that cadets’ noncognitive skills increased sub-stantially over the course of WYA. However, initial skills generally arenot related to program success as defined by graduation. Next, wetake a closer look at success and the potential relationships betweentest scores, test score gains, noncognitive skills, and noncognitive skillgains.
Table 2. Initial and final scores on noncognitive measures, by gendera
a. Data are from surveys collected by WYA. Initial data are collected at the end of pre-ChalleNGe (2 weeks into the program, at the beginning of classroom instruction); final data are collected during the last week of classes. See the previous section as well as the appendix for explanations of each noncognitive measure.
^ Differences between men and women are statistically significant at the 1-percent level (likelihood of occurring by chance is less than 1 in 100).
* Differences between men and women are statistically significant at the 5-percent level (likelihood of occurring by chance is less than 1 in 20).
Initial score of cadets Final score of cadetsNoncognitive measure Female Male Female Male
Grit score 26.6 23.8^ 28.3 28.8Math efficacy 2.49 2.81* 3.00 3.35Science efficacy 2.86 2.92 3.13 2.99Locus of control (internal) 5.89 7.07^ 8.44 8.48Chose $100 in 6 months (%) 50.0 55.5 74.4 82.9Followed directions (%) 27.1 12.6^ 35.0 28.9
16

Predictive power of noncognitive measures
While it is interesting and instructive to examine the differencesamong our noncognitive measures, an exploration of how these mea-sures are related to program success is likely to yield the most action-able set of recommendations for the ChalleNGe program. Therefore,we next model program success as a function of individual character-istics, including TABE scores and noncognitive measures. Our firstoutcome variable is completion of the ChalleNGe program.14
Because we have a small dataset, we estimate a number of very parsi-monious equations, including only a few variables. Also, recall fromtable 1 that initial noncognitive measures are very similar between allcadets and those cadets who go on to complete the program. Thissuggests that most noncognitive measures are likely to have relativelysmall impacts on program completion.
We experimented with numerous specifications. As suggested by thedescriptive statistics above, noncognitive measures have little impacton program completion, together or separately. We could not test theeffect of “reads directions” on program completion since every cadetwho did not complete the program also failed to follow directions onthe initial survey.15 (Missing information meant that some of the pre-and post-ChalleNGe surveys could not be matched; for this reason, weurge caution in interpreting our results on program completion).
We were, however, able to test specifications including both noncog-nitive measures and cognitive (various TABE) measures. We found
14. Our outcome of interest (“dependent variable”) is a dichotomous vari-able: cadets complete ChalleNGe or they do not. Therefore, we use alogistic (logit) regression. Because logit regressions yield coefficientsthat are related to marginal effects in a nonlinear manner, interpretingthe regression results is not straightforward. Thus, we calculate andpresent marginal effects holding all other variables constant; the appen-dix contains regression results.
15. This creates a situation of perfect collinearity; the correlation betweennot reading directions and not completing the program is 1.0. There-fore, we cannot estimate an effect size. This does suggest, however, thatreading directions is likely to be an important explanatory variable.
17

that one TABE score—the score on Reading—had explanatory powerover program completion; cadets with lower Reading scores were lesslikely to complete the program. Language scores had similar effectsbut did not achieve statistical significance; neither Math nor AppliedMath scores predicted program completion. Specification tests sug-gest that the effect is linear—that cadets who enter the program read-ing one grade level higher are about 2 percentage points more likelyto complete the program.16 While this may not sound like a largeeffect, the results suggest that a cadet who enters the program at the6th-grade reading level is more than twice as likely not to complete theprogram as a cadet who enters at the 10th-grade reading level.Between those entering at the 7th-grade versus the 9th-grade level, thechance of leaving the program varies from 10 percent to 6.5 percent.Thus, initial reading level is highly correlated with success. This sug-gests that WYA could place more emphasis on initial reading skills inmaking program acceptance decisions. Of course, cadets who enterwith relatively low reading levels could have other characteristics thatdecrease the chance of success; we recommend that the programcarefully track the relationship between initial reading levels and suc-cess in future classes.
Finally, we analyzed the relationships between noncognitive and cog-nitive skills. Specifically, we wondered whether cadets with higherlevels of noncognitive skills would make more cognitive progress. Themost obvious measure of this is provided by increases in TABE scores.Again, we tested many specifications, keeping each as parsimoniousas possible because of the limited sample size.
We found that, in the case of Math scores, one noncognitive measureis especially important: initial math efficacy offers substantial explan-atory power over the gains that cadets made in Math while at WYA.(The effect holds for the Math test, but not for the Applied Math test.Therefore, the effects occur in basic computation, rather than inapplied word problems.)
Our results indicate that this effect is driven largely by female cadets.In addition, our results suggest that the initial efficacy score has a
16. Complete regression results appear in table 3 of the appendix.
18

larger effect on the final Math score than the initial Math score.17 Notethat the cadets, especially the female cadets, in this class entered withvery low Math scores, and with quite low math efficacy scores (refer totable 2). We found that the change in efficacy over the course of theprogram had little impact.18 This suggests that, especially for femalecadets, working to educate and convince them of their ability toachieve in mathematics before beginning classroom work could pay off.
Of course, we measured this effect while WYA was using the KhanAcademy online math curriculum; it is not clear how results wouldhave differed under another curriculum. Next, we discuss the adop-tion of the Khan curriculum and how test scores have changed withthis adoption.
Adoption of the Khan Academy curriculum
WYA has moved toward an online curriculum; in particular, mathclasses now use online materials. Because cadets who enter ChalleNGeinitially test at a wide variety of grade levels, especially in math, present-ing material of appropriate difficulty for an entire class can be difficultto impossible. The Khan Academy provides math modules at a varietyof levels; cadets work through the modules at their own pace, but doso in a classroom with a teacher available for guidance and to workwith individuals.
The ideal manner in which to measure the effect of a new curriculumwould be to randomly divide the cadets in a given class into two groupsand expose one group to the new curriculum while instructing theother group via the old curriculum. This is impractical for a small
17. The two scores are measured in different units, but this still suggests thatinitial efficacy is an important determinant of Math improvement. Seetable 4, appendix, for regression results.
18. We also found that this is not an effect of general confidence; science effi-cacy had no explanatory power in this regression. Other noncognitivemeasures do not add explanatory power either. Finally, although theeffect of initial math efficacy on Applied Math is positive, the result is notstatistically significant (and, therefore, is somewhat likely to haveoccurred by chance).
19

program. Therefore, we measure the effect of the Khan curriculumby comparing the math outcomes of cadets in the current class (whoused the Khan curriculum) with those in prior classes (who did not).Our “control group” is made up of cadets at the WYA program in thecycles commencing in 2009. (We compare current gains with those inthe seven classes commencing from January 2009 to January 2012; weconsider the cadets in the fall cycle of 2012 to have been in transitionbecause adoption of the Khan program was taking place during thatcycle.)
Figures 1 and 2 present initial and final test scores in Math/AppliedMath and Language/Reading, respectively. The figures demonstratethat, over time, both initial and final test scores have been fairly con-stant, with a slight downward trend. In particular, figure 1 suggeststhat math gains were higher for the most recent class than for manyof the earlier classes, but figure 2 suggests that gains in Reading andLanguage were perhaps lower, and surely no higher, than for earlierclasses.
Figure 1. Initial and final scores in Math and Applied Math, by WYA class
20

To test our results more formally, we pool the data and run regres-sions explaining final scores as a function of initial scores, gender, fallversus spring class, and having the Khan Academy mathematics cur-riculum in place (we ran models with each subscore but include onlythe most relevant here).19
Our results indicate that Applied Math gains were higher in the classthat used the Khan Academy curriculum. Our results also suggest thatMath gains may have been higher, but the results do not achieve sta-tistical significance. In contrast, gains in Reading and Languageappear lower in the class using the Khan curriculum than in other
Figure 2. Initial and final Reading/Language scores, by WYA class
19. See table 5 in the appendix for complete regression results. To allow fornonlinearities, we model initial scores using several categories. Weinclude the “fall” indicator variable because program staff report thatcadets in fall versus spring sessions differ somewhat in terms of prepara-tion and attitude.
21

classes. (The result achieves significance at the 10-percent level forReading, but not for Language.) These results suggest that the KhanAcademy curriculum has increased Math achievement as measuredby TABE scores; Applied Math scores increased about 0.5 year morethan they would have under the previous curriculum. The unusuallylow gains in Reading/Language suggest that cadets in this class mighthave had lower-than-expected gains in Math had it not been for theintroduction of the new curriculum. Therefore, our results may be anunderstatement of the true effect of the Khan curriculum, whichcould be as large as 0.6 to 0.8 year. This suggests that the cadetsgained at least half a year in terms of Applied Math after the new cur-riculum was put into place.
When we split the sample by gender, we found that the effects werebigger for female cadets than for male cadets. Specifically, femalecadets instructed using the Khan curriculum experienced a 0.8-yearadvantage over other female cadets, versus a 0.3-year advantage formale cadets. In other words, female cadets in the current class gainedan additional 0.8 year in Applied Math compared with the gains offemale cadets in earlier classes. Recall that entering Math scores, andmath efficacy scores, were lower among female cadets than amongmale cadets. Therefore, this effect of utilizing the Khan Academy cur-riculum is particularly relevant for raising overall test scores and cog-nitive skills.
When we split the sample by initial TABE scores, we found that cadetswho entered with the lowest TABE scores had the largest gains interms of mathematics. Specifically, those whose initial TABE scoreswere below 6.0 (indicating they were performing below the 6th-gradelevel) gained an additional full year in terms of Applied Math com-pared with similar cadets in earlier classes. Our models suggest thatthe effect of the Khan Academy curriculum on the cadets who initiallyperform at or above the 9th-grade level is zero. This does not implythat these cadets’ test scores are unchanged throughout the program.Rather, it implies that the highest performing cadets achieve aboutwhat they would have under the earlier curriculum. This could repre-sent a ceiling effect; it is quite likely that these cadets work on materialthat is more advanced than that on the TABE. In this case, we wouldexpect that these cadets’ future performance will be higher than it
22

would have been under the previous curriculum, but the TABE maynot reflect this.
We would like to examine data from future classes to make sure thatfactors particular to this class are not driving our results. However,our results at this point strongly suggest that the Khan Academy mathcurriculum should be kept in place.
23

This page intentionally left blank.
24

Implications and recommendations
Our findings suggest that the WYA ChalleNGe program has a substan-tive impact on cadets’ noncognitive skills. Over the course of the pro-gram, cadets’ stated grit (determination), locus of control, academicefficacy (confidence), willingness to wait for long-term payoffs, andability to follow directions all increased significantly. Given thecommon aspects of the ChalleNGe model across the 34 programs, wewould expect that cadets in other programs would experience similargains. However, our data include only information on the WYAprogram.
At the same time, we find only limited evidence that initial measuresof noncognitive skills predict successful completion of ChalleNGe.We urge caution in interpreting these findings because our informa-tion indicating which cadets completed the program was incompletedue to an inability to match some pre- and post-ChalleNGe surveydata. However, our findings at this time suggest that selecting poten-tial cadets based on noncognitive skills is not likely to be beneficial tothe program or the cadets.
We suspect that the increases in noncognitive skills that occur duringChalleNGe will have large and substantial impacts on the cadets afterthey have left the program. At this point, however, we do not have anydata to test this hypothesis. Partly for this reason, we strongly recom-mend that WYA (and other programs that focus on credit recovery)begin to keep detailed records on the progress of cadets after theyleave the program and return to their home high schools. Indeed, wesuspect that several of the noncognitive measures on the survey willhave predictive power over cadets’ likelihood of completing highschool and attending postsecondary institutions, but testing thiswould require detailed data on cadets throughout the mentoringphase of the program and beyond.
25

While the noncognitive measures do not affect program success, wedid find that the initial reading level was an important predictor ofsuccess. In particular, cadets who enter the program at less than a 6th-grade level struggle to complete WYA. This finding suggests eitherthe need for an additional intervention to raise reading levels of somecadets before entering the classroom or additional work with thesecadets early in the classroom phase. Supplementing classroom workwith an online curriculum may be helpful; it is also possible that thesecadets have specific learning disabilities that would require differentinterventions. (Our data included no information on prior individu-alized education programs (IEPs), etc.)
We found that math efficacy is a strong predictor of gains in Mathscores. (Recall that the Math subtest on the TABE focuses on simplecomputational problems.) Especially among female cadets, math effi-cacy seems to be an important indicator of math gains during the pro-gram. However, female cadets have quite low levels of math efficacy atthe beginning of the program (see table 2). This suggests the needfor a specific intervention to increase math confidence, before begin-ning classroom work in math. A short instruction unit on the variousways in which people gain math skills might be helpful; informationon noncognitive skills and the relationship between confidence andperformance could be helpful as well.
Finally, our results suggest that adoption of the online Khan Academymath curriculum has had positive effects on test score gains, espe-cially in Applied Math. Recall that the Applied Math subtest requirescadets to use math concepts to solve word problems, sometimesinvolving charts and tables. These problems are designed to mimicuses of math in the real world versus the classroom. It is particularlyinteresting to note that the gains in Math were concentrated amongfemale cadets, and among cadets whose initial TABE scores indicatedthat they performed below the 6th-grade level on entering WYA. Inaddition, the Khan curriculum is not harmful to the highest achiev-ing cadets; their progress on the TABE tests is similar to that shownby earlier classes, and they may be gaining math skills not included onthe TABE. Although adopting an online curriculum implies technicalchallenges, the results so far suggest that cadets benefited from thischange.
26

Appendix
Appendix: Supplemental information
Figures 3, 4, 5, and 6 present more detailed information on non-cognitive measures included in the pre- and post-ChalleNGe WYAsurveys.
Figure 3 demonstrates that cadets who complete the program hadhigher measured levels of grit than they did at the beginning of theprogram. This can be seen by comparing the distribution of the redand green bars in the figure—the green bars (representing the finalgrit scores for graduates) are shifted farther right than the red bars(representing the initial grit scores for those who go on to graduate),
Figure 3. Grit (i.e., determination) scores among cadets in pre- and post-ChalleNGe surveys
27
Appendix
indicating a greater prevalence of higher grit scores among cadets atthe end of the program than the beginning.
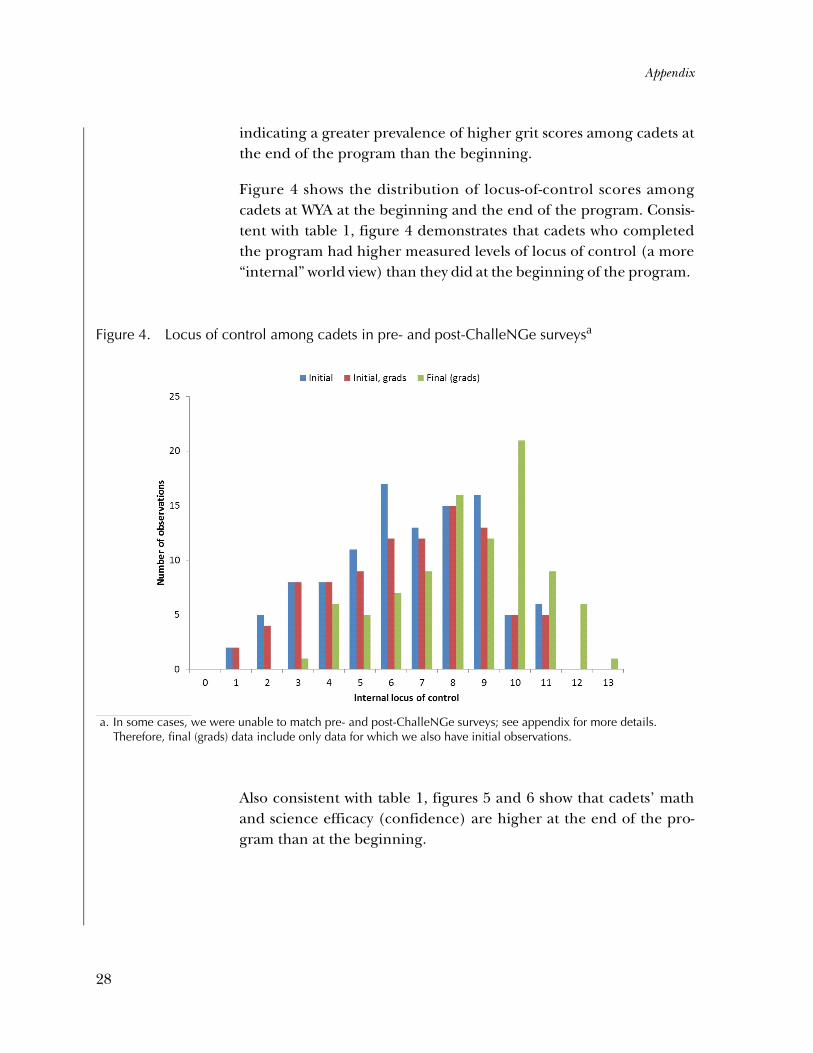
Figure 4 shows the distribution of locus-of-control scores amongcadets at WYA at the beginning and the end of the program. Consis-tent with table 1, figure 4 demonstrates that cadets who completedthe program had higher measured levels of locus of control (a more“internal” world view) than they did at the beginning of the program.
Also consistent with table 1, figures 5 and 6 show that cadets’ mathand science efficacy (confidence) are higher at the end of the pro-gram than at the beginning.
Figure 4. Locus of control among cadets in pre- and post-ChalleNGe surveysa
a. In some cases, we were unable to match pre- and post-ChalleNGe surveys; see appendix for more details. Therefore, final (grads) data include only data for which we also have initial observations.
28

Appendix
Figure 5. Math efficacy scores among cadets in pre- and post-ChalleNGe surveys
Figure 6. Science efficacy scores among cadets in pre- and post-ChalleNGe surveys
29

Appendix
Tables 3, 4, and 5 include regression results discussed in the maintext. Table 3 demonstrates that initial reading (as measured by theReading TABE score) is negatively associated with dismissal and, thus,positively associated with completion of the program. In contrast,there is no relationship between program dismissal and initial math(measured by TABE Math test). We tested alternate specifications,including indication of gender, but we consider the results in table 3to be our preferred specification because male cadets were dispropor-tionately likely to leave the program before the classroom phase (andthe pre-ChalleNGe survey) and because some of the male cadets’survey information could not be matched to test scores and otheroutcomes.
Table 4 includes results of a simple model of final math scores as afunction of initial scores and initial math efficacy. We ran this modelseparately for male and female cadets. We do not include marginaleffect columns because in a linear model such as this one marginaleffects are equal to the estimated coefficients. Thus, for every 1-yearincrease in the initial Math TABE score, female cadets are expectedto gain an additional 0.4 year in the final Math TABE score and malecadets are expected to gain 0.7 year. Initial math efficacy is positivelyassociated with final Math TABE scores, but only for female cadets.
Table 3. Regression results: Outcome—ChalleNGe dismissal (noncompletion)a
a. Regression includes 138 observations (all cadets with complete matched test score and survey data). Pseudo R-squared = 0.14. Initial grit measured by grit scale, developed by Dr. Angela Duckworth. Initial reading mea-sured by TABE Reading test, initial math measured by TABE Math test.
* Indicates coefficient is significant at the 5-percent level or better and, thus, is likely to occur by chance fewer than 1 time in 20.
Variable CoefficientStandard
errorMarginal
effectInitial grit -0.0059 0.081 -.04%Initial math 0.077 0.15 0.5%Initial reading -0.26* 0.12 -1.7%Constant -0.67 1.93 ~
30

Appendix
Table 5 presents regression results explaining final Applied Math(TABE subtest) score as a function of initial Applied Math score,gender (in the initial specification), fall versus spring session, and useof the Khan Academy online curriculum.
Table 4. Regression results: Outcome—Final Math TABE scorea
Female cadets Male cadets
Variable CoefficientStandard
error CoefficientStandard
errorInitial math score 0.417** 0.131 0.697** 0.075Initial math efficacy 0.747** 0.304 0.318 0.210Constant 3.79** 0.88 3.78** 0.72
a. Regression includes 79 observations on male cadets and 39 on female cadets (all cadets with complete matched test score and survey data). Pseudo R-squared = 0.53 for men and 0.31 for women. Math efficacy measured by scale developed by Friday Institute, NC State University. Initial math measured by TABE Math test.
** Indicates coefficient is significant at the 2-percent level or better and, thus, is likely to occur by chance fewer than 1 time in 50.
Table 5. Regression results: Outcome—Final Applied Math scorea
a. Regressions include 1,077 observations: 763 males, 314 females, 353 with initial TABE scores below 6.0, 384 with initial TABE scores above 9.0 Coef. = coefficient; SE = standard error.
^ Indicates coefficients is significant at the 10 percent level.* Indicates coefficient is significant at the 5 percent level. ** Indicates coefficient is significant at the 1 percent level.
Cadets Initial TABE < 6.0
Initial TABE > 9.0All Female Male
Variable Coef. SE Coef. SE Coef. SE Coef. SE Coef. SEInitial < 4 2.12 1.80 -3.24** 0.64 2.10 1.80 1.89 2.39 ~ ~Initial 4–5 1.37 1.80 -3.59** 0.73 1.28 1.79 1.10 2.40 ~ ~Initial 5–6 3.02^ 1.80 -2.30** 0.60 3.03^ 1.78 2.73 2.39 ~ ~Initial 6–7 3.28^ 1.79 -2.14** 0.55 3.35* 1.77 2.77 2.39 -1.37** 0.46Initial 7–8 3.87* 1.79 -1.86** 0.65 4.04* 1.78 3.17 2.42 ~ ~Initial 8–9 4.47** 1.80 -1.00^ 0.61 4.58** 1.78 4.20^ 2.43 -0.25 0.44Initial 9–10 5.09** 1.80 ~ ~ 5.04** 1.78 4.88* 2.45 0.21 0.40Initial 10–11 5.46** 1.79 -0.09 0.60 5.57** 1.77 5.31* 2.52 0.017 0.36Initial > 11 6.53** 1.79 1.29** 0.54 6.52** 1.76 5.54* 2.49 0.78** 0.34Male 0.20^ 0.12 ~ ~ ~ ~ ~ ~ ~ ~Fall -0.034 0.12 0.012 0.23 -0.046 0.136 -0.011 0.27 -0.039 0.081Khan 0.45** 0.18 0.76** 0.35 0.35^ 0.21 0.93* 0.41 -0.045 0.14Constant 5.90** 1.79 11.2** 0.51 6.10** 1.76 6.10** 2.37 12.0** 0.34
31

Appendix
We find that using the Khan curriculum was associated with higherfinal Applied Math scores and, thus, with higher gains in AppliedMath. This effect is larger for female cadets, and for cadets whose ini-tial average TABE scores were less than 6.0, indicating that theyentered the program below the 6th grade level. The use of the KhanAcademy has a very small, negative, and insignificant effect on thefinal Applied Math score of cadets who begin the program with TABEscores of at least 9.0. This indicates that such cadets gain almost thesame amount from using Khan as they would in other circumstances;given the wide scope of material contained in the Khan Academy, it isalso likely that these cadets make gains in math that are not measuredon the TABE.
32

References
[1] Flavio Cunha and James J. Heckman. Investing in Our YoungPeople. National Bureau of Economic Research (NBER) Work-ing Paper No. 16201. Jul. 2010.
[2] Margo Coleman and Thomas DeLeire. “An Economic Modelof Locus of Control and the Human Capital Investment Deci-sion.” The Journal of Human Resources 38, no. 3, 2003: 701–721.
[3] Samuel Bowles, Herbert Gintis, and Melissa Osborne. “TheDeterminants of Earnings: A Behavioral Approach.” Journal ofEconomic Literature 39, no. 4, 2001: 1137–1176.
[4] James Heckman et al. “The Rate of Return to the HighScopePerry Preschool Program.” Journal of Public Economics 94, no.1-2, 2010:114–128.
[5] Flavio Cunha et al. “Interpreting the Evidence on Life CycleSkill Formation.” In Eric Hanushek and Finis Welch, eds.Handbook of the Economics of Education. Amsterdam: North-Holland, 2006. 697–812.
[6] Paul Tough. How Children Succeed: Grit, Curiosity, and the HiddenPower of Character. New York, New York: Houghton Mifflin Har-court, 2012.
[7] Angela Duckworth et al. “Grit: Perseverance and Passion forLong-Term Goals.” Journal of Personality and Social Psychology92, no. 6, 2007: 1087–1101.
[8] Julian Rotter. “Generalized Expectancies for Internal VersusExternal Control of Reinforcement.” Psychological Monograph80, no. 1, 1966.
[9] Barbara Means et al. Evaluation of Evidence-Based Practices inOnline Learning: A Meta-Analysis and Review of Online LearningStudies. U.S. Department of Education, Office of Planning,Evaluation, and Policy Development. 2010.
33

[10] Janice H. Laurence, Peter F. Ramsberger, and Jane Arabian.Education Credential Tier Evaluation. Human ResourcesResearch Organization Final Report FR-PRD-84-4. Sep 1996.
34

List of figures
Figure 1. Initial and final scores in Math and Applied Math,by WYA class . . . . . . . . . . . . . . . . . . . . . . 20
Figure 2. Initial and final Reading/Language scores,by WYA class . . . . . . . . . . . . . . . . . . . . . . 21
Figure 3. Grit (i.e., determination) scores among cadetsin pre- and post-ChalleNGe surveys . . . . . . . . . 27
Figure 4. Locus of control among cadets in pre- andpost-ChalleNGe surveys . . . . . . . . . . . . . . . . 28
Figure 5. Math efficacy scores among cadets in pre- andpost-ChalleNGe surveys . . . . . . . . . . . . . . . . 29
Figure 6. Science efficacy scores among cadets in pre- andpost-ChalleNGe surveys . . . . . . . . . . . . . . . . 29
35

This page intentionally left blank.
36

List of tables
Table 1. Noncognitive measures, before and afterChalleNGe . . . . . . . . . . . . . . . . . . . . . . . 13
Table 2. Initial and final scores on noncognitive measures,by gender . . . . . . . . . . . . . . . . . . . . . . . 16
Table 3. Regression results: Outcome—ChalleNGedismissal (noncompletion) . . . . . . . . . . . . . . 30
Table 5. Regression results: Outcome—Final AppliedMath score . . . . . . . . . . . . . . . . . . . . . . . 31
Table 4. Regression results: Outcome—Final MathTABE score . . . . . . . . . . . . . . . . . . . . . . 31
37

This page intentionally left blank.
38


4825 Mark Center Drive, Alexandria, VA 22311-1850 703-824-2000 www.cna.org
DRM-2013-U-005201-Final