Code Red: The Critical Condition of Health in Texas
335
CODE RED The Critical Condition of Health in Texas Part II _ The Appendices
Transcript of Code Red: The Critical Condition of Health in Texas

COD E R E DThe Critical Condition of Health in Texas
Part II _ The Appendices

Table of Contents Appendix A Task Force Members and Staff Biosketches Appendix B Medicaid and the State Children’s Health Insurance Program in Texas: History, Current Arrangements, and Options David C. Warner, Lauren R. Jahnke, and Kristie Kimbell Appendix C An Analysis of Reform Options Developed by Other States David C. Warner, Lauren R. Jahnke, and Kristie Kimbell Appendix D Local Initiatives to Expand Care and Coverage of the Uninsured Charles Begley, Alpna Agrawal, and Heather Draper Appendix E Education and Health: A Review and Assessment Nancy Murray, Luisa Franzini, Dritana Marko, Philip Lupo, Jr., Julie Garza, and Stephen Linder Appendix F State Regulation of Health Insurance: Implications for Health Care Access Sara Rosenbaum Appendix G Emergency and Trauma Care in Texas: Assessment, Challenges, and Options Charles Begley, Sharron Cox, Arlo Weltge, Cindy Gunn, and Munseok Seo Appendix H Brief: Consulate Clinic Denise Sanchez Appendix I Common Abbreviations Appendix J Presenters Appendix K Provider Taxes: A Different Perspective Richard Johnson, Jr. and Donna Kinney

Appendix A
Task Force Members and Staff Biosketches

Appendix A
Task Force Members and Staff Biosketches Neal F. Lane, Ph.D., Chair Malcolm Gillis University Professor of Department of Physics and Astronomy Senior Fellow of the James A. Baker III Institute for Public Policy Rice University Neal Lane is the Malcom Gillis University Professor at Rice University. He also holds appointments as Senior Fellow of the James A. Baker III Institute for Public Policy, where he is engaged in matters of science and technology policy, and in the Department of Physics and Astronomy. Prior to returning to Rice University, Dr. Lane served in the Federal government as Assistant to the President for Science and Technology and Director of the White House Office of Science and Technology Policy, from August 1998 to January 2001. In addition he was the Director of the National Science Foundation (NSF) and member (ex officio) of the National Science Board, from October 1993 to August 1998. Before becoming the NSF Director, Dr. Lane was Provost and Professor of Physics at Rice University in Houston, Texas, a position he had held since 1986. He first came to Rice in 1966, when he joined the Department of Physics as an assistant professor. In 1972, he became Professor of Physics and Space Physics and Astronomy. He left Rice from mid-1984 to 1986 to serve as Chancellor of the University of Colorado at Colorado Springs. From 1979 to 1980, while on leave from Rice, he worked at the NSF as Director of the Division of Physics. Dr. Lane received his Ph.D., M.S. and B.S. in physics from Oklahoma University. John Stobo, M.D., Vice Chair President The University of Texas Medical Branch at Galveston John Stobo began his medical career at the University of Vermont School of Medicine. There, he became interested in the science of medicine and spent a year in immunology research between his sophomore and junior year. After graduating from medical school, he completed his residency training in internal medicine on the Osler Medical Service at Johns Hopkins Hospital where he was chief medical resident. He continued his research in immunology as a research associate at the National Institutes of Health. From 1973 to 1976 he was in the department of immunology at the Mayo Clinic and served as head of the section of rheumatology and clinical immunology at the University of California, San Francisco from 1976 to 1985. There he was an investigator of the Howard Hughes Medical Institute. In 1985, he returned to Johns Hopkins as the William Osler professor of medicine and director of the department of medicine. In 1994, Dr. Stobo became chairman and CEO of Johns Hopkins Health Care, L.L.C., an organization created to address challenges in managed care on behalf of Johns Hopkins Medicine. In 1997, Dr. Stobo became president of The University of Texas Medical Branch at Galveston. As the only full service, state owned hospitals in Texas, UTMB address the health needs of medically underserved individuals throughout the state of Texas.
A-2
Hector Balcazar, Ph.D. Regional Dean of Public Health at El Paso Professor of Health Promotion and Behavioral Science The University of Texas at Houston School of Public Health El Paso Regional Campus Hector Balcazar is the Regional Dean of Public Health at the University of Texas Health Science Center at Houston, School of Public Health, El Paso Regional Campus. He is also a professor of health promotion and behavioral sciences. Prior to joining The University of Texas, he was a professor and Chair of the Department of Social and Behavioral Science, School of Public Health at University of North Texas Health Science Center at Fort Worth, Texas. He holds a Ph.D. and M.S. degree in International Nutrition from Cornell University, Ithaca, NY, and a B.S. degree in Nutrition and Food Science from Iberoamericana University, Mexico City. Dr. Balcazar serves as the Co-Director of the Hispanic Health Disparities Research Center, an NIH funded initiative in collaboration with the College of Health Sciences of the University of Texas at El Paso. Dr. Balcazar specializes in the study of public health problems of Latinos/Mexican Americans. Dr. Balcazar is a bilingual, bicultural family and public health scientist who has conducted numerous studies of Latino birth outcomes, acculturation and health related behaviors, cardiovascular disease prevention programs in Latinos, and border health issues. His most recent funded work includes: An NIH initiative to test the effects of promotoras de salud in changing clinical outcomes for chronic diseases in El Paso, Texas; a CDC/ASPH project on promotoras de salud and hypertension control; the North Texas Salud Para Su Corazon (Health For Your Heart) Community Health Initiative; a Hispanic diabetes clinical study; a Latino family caregiver educational program for individuals with Alzheimer’s disease; the development of a strategic plan for a national Latino public health leadership collaborative, and a two-year study on the use of perinatal, infant, and childhood health services among high-risk Mexican American subgroups. As a Latino health specialist Dr. Balcazar provides consultation and leadership to local and national health organizations. Dr. Balcazar currently serves as a member of the Editorial Board of APHA (American Public Health Association) and as a member of the Board of Trustees of SOPHE (Society for Public Health Education). Kirk Calhoun, M.D. President The University of Texas Health Center at Tyler Kirk Calhoun has been president of The University of Texas Health Center at Tyler since November 2002. The University of Texas System has utilized his services on two search committees. He also serves on the Texas Council on Cardiovascular Disease and Stroke Prevention and is a member of the National Association of Public Hospitals Executive Committee. From 2000-2002, Dr. Calhoun was at Parkland as the Senior Vice President and Medical Director and on the faculty of The University of Texas Southwestern Medical Center at Dallas as Associate Dean for Clinical Affairs. While at The University of Texas Medical Branch at Galveston, Dr. Calhoun served as Corporate Medical Director of UTMB HealthCare Systems, Chief Medical Officer and Senior Medical Director, Director of Internal Medicine Clinics and in

A-3
other capacities. From 1983-93, he was a faculty member at the University of Missouri in Kansas City and a staff member at several Kansas City hospitals. Dr. Calhoun, a native of Chicago, earned his bachelor’s degree in biology from the University of Illinois at Chicago Circle and an M.D. from the University of Kansas School of Medicine. He served an internship and residency in internal medicine at Northwestern University and Medical Center in Evanston, Illinois, as well as a fellowship in clinical nephrology, hypertension, and metabolism at the University of Chicago. David F. Chappell, Esq. President Chappell Hill, L.L.P. David F. Chappell is the president of Chappell Hill, L.L.P. in Fort Worth, Texas and Board Certified in Civil Trial Law. He is also the Vice Chairman of the Board of Trustees for the HCA Medical Plaza Hospital and the Chair of the Day Resource Center Board. His previous activities have included being a member of the Mayor’s Task Force on Homeless and the Chair for the Area Medical Ambulance Authority. Mr. Chappell also served as a City Councilman for the City of Fort Worth from 1989 through 1993. Mr. Chappell’s professional activities include serving as Chair of the Board of Directors for the State Bar of Texas (1984-85), serving as Chair of the Board of Trustees for the Texas Bar Foundation (1987-88), and serving as a member of the House of Delegates for the American Bar Association (1978-91). His major concentrations of practice include business litigation, employment, public law, banking law, governmental relations, and land use planning. Mr. Chappell received his B.A. in Government from the University of Texas in 1964 and his J.D. from the University of Texas School of Law in 1968. Patrick J. Crocker, M.S., D.O. Chief, Brackenridge-Children’s Emergency Services Chief of Staff, Brackenridge Hospital Patrick Crocker is the Chief of the Department of Emergency Medicine at Brackenridge & Children’s Hospital in Austin, Texas and the Chief of Staff at Brackenridge Hospital. Dr. Crocker also serves as a lead panelist expert reviewer for Emergency Medicine on the Texas State Board of Medical Examiners as well as member of the Austin Travis County EMS Advisory Board and the Chairman of the Travis County Medical Society EMS Committee. He is the co-editor of Continuous Quality Improvement for Emergency Departments, widely recognized as the manual for successful application of the QI process in the emergency department. Dr. Crocker earned a bachelor’s degree in Nutrition and Food Science and a master’s degree in Human Nutrition at the University of California, Berkley. He earned his D.O. at the University of Health Sciences, College of Osteopathic Medicine and Surgery in Des Moines, Iowa and served an internship and residency in Emergency Medicine at Darnall Army Hospital, Fort Hood, Texas.

A-4
Charles Haley, M.D., M.S. Medical Director TrailBlazer Health Enterprise Charles Haley is the Medicare Medical Director and the Medicare Fiscal Intermediary Medical Director for TrailBlazer Health Enterprises, LLC, a subsidiary of Blue Cross Blue Shield of South Carolina. He is also a clinical associate professor of medicine at The University of Texas Southwestern Medical Center at Dallas. Prior to his work at TrailBlazer, Dr. Haley was a Dallas County Epidemiologist, the Medical Director of the HIV Impact Program, and the Medical Director of the Preventive Health Services Program. From 1977-81, he joined the U.S. Public Health Service for four years and was an Epidemic Intelligence Service Officer and an Assistant Chief for Water-Related Diseases, Enteric Diseases Division at the Centers for Disease Control. Dr. Haley received a B.S. in biology at Southern Methodist University in 1971 and his M.D. at U.T. Southwestern Medical School in 1975. He served an internship and residency in Internal Medicine at Baylor Hospital in Dallas. In 1982, he earned a master’s in Hospital Epidemiology and Infection Control at the University of Virginia. From 1982-84, he did a fellowship in Infectious Diseases at U.T. Southwestern Medical School. George B. Hernández, Jr., Esq. President-Chief Executive Officer University Health System George Hernández joined University Health System, Bexar County’s publicly supported hospital district, in 1990, serving initially as Vice President of Legal Services. He was named Executive Vice President/Assistant Administrator in 2000 and has been President/CEO since 2005. Prior to joining the Health System, Mr. Hernández was the Chief of the Civil Section in the Bexar County District Attorney’s Office. He began his career as an Assistant City Attorney for the City of San Antonio. Mr. Hernández earned a B.A. in political science from St. Mary’s University in San Antonio, Texas and a law degree from George Washington University in Washington D.C. Among his numerous professional and service affiliations, he serves as vice chair for the Daughters of Charity Services of San Antonio, a board member for the United Way of San Antonio & Bexar County, a member of the Texas Hospital Association Council on Policy Development, and a board trustee for The Center for Health Care Services, the mental health and mental retardation authority for Bexar County. Winell Herron, M.B.A. Group Vice President, Public Affairs and Diversity H-E-B Winell Herron began her career with H-E-B Grocery Company in 1988 in store operations. In January 1996, Ms. Herron was promoted to Service Team Leader where she provided leadership in the achievement of the organization’s customer service goals. In August 1997, Ms. Herron joined the Diversity Management Department as the Director of Workforce Diversity. In February 1999, Ms. Herron was promoted to Vice President of Customer Service, responsible for providing vision, strategy, training and motivation to 285 retail grocery stores in the delivery of superior customer service. She held this position until her promotion in June 2000 to Group

A-5
Vice President of Public Affairs and Diversity. She is responsible for leading the organization’s initiatives in these critical areas. Ms. Herron earned a bachelor’s degree in business administration from the University of Texas at Austin in 1988. She successfully completed the Food Industry Management Program at the University of Southern California in 1992, and she completed her Executive M.B.A. form the University of Texas at San Antonio in May 2000. Richard W. Johnson, Jr., M.A. Director, Division of Medical Economics Texas Medical Association Richard Johnson has been with Texas Medical Association since May 1997. As a member of senior management, Mr. Johnson is responsible for leading the TMA Division of Medical Economics’ 12 employees and three departments, and the policy development, member service, research and advocacy efforts of TMA on medical and socioeconomic issues. Mr. Johnson also serves as staff director for the TMA Council on Socioeconomics. Before coming to TMA, Mr. Johnson was the Chief Executive Officer for the Wyoming Medical Society and the Wyoming Medical Political Action Committee from 1984-97. He was Senior Vice President and Chief Lobbyist for the Wyoming Hospital Association, Inc. from 1982-84, and Deputy Chief Executive Officer of the Wyoming Health Systems Agency, Inc. from 1976-82. Mr. Johnson was also Chief Executive Officer of the American Heart Association, Wyoming Affiliate from 1973-76 and Health Policy Analyst for the Office of the Governor/Division of Health and Medical Services for the State of Wyoming from 1972-73. Mr. Johnson received a B.A. in Political Science from the University of Wyoming in Laramie and an M.A. in Public Administration with an emphasis in Policy and Finance from the University of Northern Colorado in Greeley. Wm. Fred Lucas, M.D. Cypress Creek Hospital Fred Lucas has worked in Admission Review Assessment at Cypress Creek Psychiatric Hospital since February of 2004. Prior to his work there, he was an Associate/Medical Director of NHIC. From 1985 to 2002 he was the Chief Executive Officer of Lucas Medical Associates, Inc. There he consulted with health care providers while developing and participating in ambulatory healthcare centers and in vitro fertilization labs. Throughout his distinguished career, Dr. Lucas has been involved in medical payments including stints at Blue Cross – Blue Shield in Texas and Indiana and Electronic Data Systems and its subsidiary National Heritage Insurance Company. Dr. Lucas received his M.D. from The University of Texas Southwestern Medical Center at Dallas. He served his internship and residency at Baylor Medical Center in Dallas, Texas with a brief stretch in the U.S. Air Force in between.

A-6
Michael McKinney, M.D. Senior Executive Vice President and Chief Operating Officer The University of Texas Health Science Center at Houston Michael McKinney is the Senior Executive Vice President and Chief Operating Officer at The University of Texas Health Science Center at Houston. Prior to his appointment in Houston, Dr. McKinney was Vice Chancellor for Health Affairs at The University of Texas System in Austin. Dr. McKinney joined The University of Texas System in 2002 after serving as chief of staff to Governor Rick Perry. As vice chancellor, he concentrated on business management and financial issues related to the six health science institutions in The University of Texas System. Before joining the Governor’s Office, Dr. McKinney served for three years in a variety of executive positions with Centene Corp., a managed care company. As Texas Commissioner of Health and Human Services, Dr. McKinney oversaw 11 state agencies, a staff of 64,000, and a budget of $24 billion. He was appointed to that position by Governor George W. Bush. Dr. McKinney's other career experience includes serving as medical director of an insurance company and a health care plan; a consultant to the Texas health commissioner; a member of the Physician Payment Review Commission in the Federal Office of Technology; and a family practitioner in Pasadena and Centerville, Texas. In the Texas House of Representatives, he represented District 15 (Leon, Madison, Grimes, Houston, and Montgomery Counties). He was speaker pro-tempore of the House from 1989 to 1990. Dr. McKinney earned a bachelor's degree from the University of Houston and his M.D. from The University of Texas Medical Branch at Galveston. Kathy Mechler, MS, RN, CPHQ Director of Medical Services Texas A&M University System Health Science Center Rural and Community Health Institute Kathy Mechler serves as the Director of Medical Services for the Rural and Community Health Initiative (RCHI) program. She has over 20 years of health care experience, with over 10 years in senior leadership. Ms. Mechler’s experience includes acute care, behavioral health and managed care operations. Not only does she bring health care leadership experience to RCHI, Ms. Mechler has a very strong background and experience in quality improvement and utilization management. She also brings a history of successful experience with regulatory and accreditation body surveys. Ms. Mechler is licensed to practice nursing in Texas, Colorado, and Wyoming. She holds a bachelor’s and master’s degree from Southwest Texas State University. She is a member of the National Association of Healthcare Quality and American College of Healthcare Executives. Ms. Mechler is also a Certified Professional in Health Quality. Elaine Mendoza President and Chief Executive Officer Conceptual MindWorks, Inc. Elaine Mendoza is the founder and President and CEO of Conceptual MindWorks, Inc. (CMI) in San Antonio, Texas, established in 1990. CMI serves the U.S. Department of Defense by delivering healthcare-related, specialized, scientific and technical support services. In the private-sector healthcare industry, CMI markets SevocityTM, an electronic health record product.

A-7
Ms. Mendoza earned her bachelor’s degree in Aerospace Engineering at Texas A&M University. Born and raised in San Antonio, Texas, Ms. Mendoza has been fortunate to be involved in community initiatives revolving around the expansion of educational opportunities, health care and economic growth. She serves on the CHRISTUS Santa Rosa Health Care Board of Directors and was the 2004 and 2005 Chair of the San Antonio Hispanic Chamber of Commerce. Ms. Mendoza has also taken a lead role nationally, being appointed by Senator Trent Lott to the Commission on the Advancement of Women and Minorities in Science, Engineering, and Technology (1999-2000), and statewide, by serving on Texas Governor Rick Perry’s Special Commission on 21st Century Colleges and Universities (2000-2001). Rob Mosbacher, Esq. President Mosbacher Energy Company Rob Mosbacher is the President of Mosbacher Energy Company. His other business activities include being a Board member for Chase Bank, Houston and the Director of Devin Energy Company. In his early career, he worked as a staff member for U. S. Senator Howard Baker in 1971-74 and 1977-80. His more recent government activities have been positions as a member of the Texas State Job Training Coordinating Council (1987-91) and as the Chairman of the Governor’s Welfare Reform Task Force (1988) and the Chairman of the Board for the Texas Department of Human Services (1989-91). Currently, Mr. Mosbacher has found time to take a leadership position on several civic organizations including the Chairman of the Health Care Advisory committee for the Greater Houston Partnership, Director of the Methodist Hospital Board, and Founder and Co-Chairman of the Rebuilding Together Houston. Mr. Mosbacher received his bachelor’s degree from Georgetown University in 1973 and his J.D. from Southern Methodist University Law School in 1977. Steve Murdock, Ph.D. State Demographer of Texas Director of the Institute for Demographic and Socioeconomic Research The University of Texas at San Antonio Steve H. Murdock is the Lutcher Brown Distinguished Chair at the University of Texas at San Antonio College of Business. As part of his appointment, he is also the director for the Institute for Demographic and Socioeconomic Research. Prior to his appointment at UTSA, Dr. Murdock was the Regents Professor and Head of the Department of Rural Sociology at Texas A&M University. He is also the official State Demographer of Texas. He was appointed to this position by Governor Rick Perry and is the first person to occupy this position. As state demographer, Dr. Murdock heads the State Data Center, a network of 45 university, state, regional and municipal agencies that provide access to demographic information on the socioeconomic characteristics of Texas. Dr. Murdock earned his Ph.D. in demography and sociology from the University of Kentucky and is the author of 12 books and more than 150 articles and technical reports on the implications of current and future demographic and socioeconomic change. He is the recipient of numerous honors and awards. These include the Faculty Distinguished Achievement Award in Research from Texas A&M University, the Excellence in Research Award from the Rural Sociological Society, and the Distinguished Alumni Award from the

A-8
Department of Sociology at the University of Kentucky. He was named one of the fifty most influential Texans by Texas Business in 1997 and one of the 25 most influential Texans by Texas Monthly in 2005. He is a member of the Phi Beta Kappa, Phi Kappa Phi, and Phi Eta Epsilon national honor societies. Betsy Schwartz, M.S.W. Executive Director Mental Health Association of Greater Houston Betsy Schwartz completed her undergraduate studies from the University of Denver and a Masters Degree in Social Work Administration from the University of Houston. She has over twenty years of leadership of nonprofit organizations having served as Executive Director of the Mental Health Association of Greater Houston since 1980. She has served as the President of the Board of Directors of the Coalition for the Homeless, Vice Chairman of the Mental Health Needs Council, and Chairman of the Children's Oversight Team. She is a consultant to the National Mental Health Association and trains MHA's throughout the nation on consensus building strategies to develop community problem solving of mental health problems. In 2000 Betsy was named one of Houston’s Women on the Move. Ms. Schwartz is a Senior Fellow of American Leadership Forum and the W.K. Kellogg Foundation. David C. Warner, Ph.D. Wilbur J. Cohen Professor of Public Affairs Lyndon B. Johnson School of Public Affairs The University of Texas at Austin David Warner is Wilbur Cohen Professor of Public Affairs at the University of Texas at Austin and a Visiting Professor at the University of Texas Health Science Center at Houston School of Public Health. His major teaching and research interests are in health policy, health economics and health finance. A graduate of Princeton University and Syracuse University (MPA and Ph.D. in economics), he formerly taught at Wayne State University and Yale University and was Deputy Director of the Office of Program Analysis of the New York City Health and Hospitals Corporation. Professor Warner has served as a consultant to a number of organizations in the health sector, and for six years was a member of the Board of Directors of Austin’s Brackenridge Municipal Hospital. In addition, he was Chairman of the Texas Diabetes Council from January 1985 to December 1989. He has served on several editorial and advisory boards and has been appointed to other state level advisory committees. He has published widely and during the last five years has directed two studies on addressing problems of the uninsured in Texas and several studies relating to medical care and cross border insurance between the U.S. and Mexico.

A-9
M. Roy Wilson, M.D. President Texas Tech University Health Science Center Roy Wilson was named President of the Texas Tech University Health Sciences Center in 2003. Dr. Wilson is an elected member of the Institute of Medicine of the National Academy of Sciences, the American Ophthalmological Society, and the Glaucoma Society of the International Congress of Ophthalmology. Dr. Wilson’s major scientific contributions have been in bridging the fields of epidemiology and ophthalmology. He actively participates on numerous national boards and committees, with particular focus on ophthalmology and on minority health and health disparities. Among these are the Academy of Medicine, Engineering and Science of Texas, EyeCare America (the Glaucoma Project of the American Academy of Ophthalmology), and the Association of International Glaucoma Society’s Committee on Global Research and Screening for which he is the co-chair. Additionally, Dr. Wilson was an initial Advisory Council member of the National Center on Minority Health and Health Disparities of the National Institutes of Health and served four years as chair of its Strategic Plan subcommittee. Dr. Wilson received his medical degree from Harvard Medical School and his Master of Science in epidemiology at the UCLA School of Public Health. He performed both his ophthalmology residency and glaucoma fellowship at the Massachusetts Eye and Ear Infirmary, Harvard Medical School. In 1998, Dr. Wilson was appointed Dean of the School of Medicine at Creighton University, and then served as both Dean and Vice President for Health Sciences from 1999-2003. Prior to that time, he was Professor of Ophthalmology both at the Jules Stein Eye Institute of UCLA and Charles R. Drew University of Medicine & Science. Dr. Wilson has delivered more than 200 invited lectures, many of these internationally, and has published more than 200 articles, book chapters and abstracts.
Senior Advisor Kenneth I. Shine, M.D. Executive Vice Chancellor for Health Affairs The University of Texas System Kenneth I. Shine is the Executive Vice Chancellor for Health Affairs at the University of Texas System and is responsible for the six University of Texas System health institutions and their aggregate operating budget. A cardiologist and physiologist, Dr. Shine is the former President of the Institute of Medicine, where he addressed important issues in medicine and healthcare, such as quality of care and patient safety, nutrition, food safety, and child development. Dr. Shine is also Professor of Medicine Emeritus at the University of California, Los Angeles School of Medicine, former Dean and Provost for Medical Sciences at UCLA, and a member of many honorary and academic societies. Dr. Shine received his bachelor’s degree from Harvard University and his M.D. from Harvard Medical School.

A-10
Task Force Staff Kirstin Matthews, Ph.D., Project Officer Postdoctoral Research Associate James A. Baker III Institute for Public Policy Rice University Kirstin Matthews is a postdoctoral research associate in the Science and Technology Policy Program at the James A. Baker III Institute for Public Policy at Rice University. Dr. Matthews’ current research focuses are biomedical research and health policy issues. At the Baker Institute, her responsibilities include coordinating science and technology policy events and programs, researching policy issues and advocating the participation of scientists in science policy. Dr. Matthews holds a B.A. in Biochemistry from The University of Texas at Austin and a Ph.D. in Molecular Biology from The University of Texas Health Science Center at Houston, where she characterized the protein and gene for carboxypeptidase N in mice. During her graduate career she published several scientific journal articles and a review. Maggie Floores, Project Staff Administrative Associate Office of Health Affairs The University of Texas System Maggie Floores began her career with The University of Texas System in 1980. Before coming to the Office of Health Affairs in 1988 she worked in numerous offices throughout U.T. System including the Office of Human Resources, Lands Accounting, and the Office of General Counsel. Currently, Ms. Floores assists two Assistant Vice Chancellors in the Office of Health Affairs. Amy Shaw Thomas, Esq., Project Staff Associate Vice Chancellor and Counsel for Health Affairs Office of Health Affairs The University of Texas System Amy Shaw Thomas is Associate Vice Chancellor and Counsel for Health Affairs with The University of Texas System. She provides advice and counsel on complex business, operational, regulatory, legal, public policy and legislative issues affecting the six health institutions of The University of Texas System. She joined The University of Texas System Office of Governmental Relations in January 1997 and the Office of Health Affairs in September 2002. Ms. Thomas previously worked as Legislative Counsel and Director of Debt Management and Public Policy for Senator Kay Bailey Hutchison when she was Texas State Treasurer. She also served on the staff of a U.S. Senator in Washington, D. C., and two members of the Texas Senate. She practiced public finance and general governmental law with the firms Hutchison, Price, Boyle & Brooks and Wickliff & Hall. Ms. Thomas is a Phi Beta Kappa graduate of The University of Texas at Austin, with a Bachelor of Arts degree in Government and a doctorate of law from The U.T. School of Law in 1984.

Appendix B
Medicaid and the State Children’s Health Insurance Program in Texas:
History, Current Arrangements, and Options
David C. Warner, Lauren R. Jahnke, and Kristie Kimbell

Appendix B Medicaid and the State Children’s Health Insurance Program
in Texas: History, Current Arrangements, and Options
Prepared by David C. Warner, Lauren R. Jahnke, and Kristie Kimbell
Center for Health and Social Policy LBJ School of Public Affairs
The University of Texas at Austin
April 2005
Executive Summary Medicaid and the State Children’s Health Insurance Program (SCHIP) are key programs for providing health insurance and health care to low-income people in the United States. This report reviews the history and current state of Medicaid and SCHIP in the U.S. and Texas in terms of mandatory and optional beneficiaries, mandatory and optional benefits, and options for program expansions or modifications. The report focuses on medical services and not long-term care under Medicaid. Major changes may occur soon to Medicaid on the federal level, but details are not yet available. Medicaid was established in 1965 to pay the medical bills of low-income people and increase access to health care. Medicaid is overseen by the Centers for Medicare and Medicaid Services (CMS), part of the U.S. Department of Health and Human Services, and is a federal-state partnership, so the program varies from state to state depending on how the state has chosen to implement it, within certain basic guidelines. Federal law says that states must cover what are called mandatory populations and offer mandatory benefits, and coverage beyond these levels are called optional populations and benefits. The federal government matches each state’s Medicaid spending by covering from 50 percent to 83 percent of Medicaid expenses, depending on a formula that takes into account the average income in each state each year. A few services are matched at higher percentages, such as family planning at 90 percent. The Disproportionate Share Hospital Program (DSH) is a Medicaid program established in 1981 that reimburses hospitals that serve a disproportionately large number of Medicaid patients or other low-income people to help compensate them for lost revenues. The State Children’s Health Insurance Program (SCHIP) was created in 1997 to offer health insurance to uninsured children with family incomes or assets too high to qualify for Medicaid, but who cannot afford private insurance. It is also administered by CMS. It is not an entitlement program, unlike Medicaid, so it does not have to serve everyone who qualifies — it can turn down recipients if the state depletes its SCHIP budget. The federal government matches a higher percentage of state spending in SCHIP than in Medicaid. The formula for SCHIP federal matching funds is based on each state’s Medicaid matching rate; in 2004 the SCHIP matching rates varied from 65 to 84 percent. States can get permission to waive certain Medicaid and SCHIP laws and regulations to give the states more flexibility and to allow experimentation with new approaches to delivering

B-2
services. There are two broad types of these “waivers” which refer to different sections of the Social Security Act. Section 1115 waivers are called “research and demonstration waivers” and usually involve comprehensive reform projects, while Section 1915 waivers are called “program waivers” and involve waiving specific requirements to allow more innovative programs such as managed care and community-based care. Section 1115 waivers apply to both Medicaid and SCHIP, and one type of 1115 waiver is the Health Insurance Flexibility and Accountability (HIFA) initiative implemented by the Bush Administration in 2001. Section 1915 waivers apply to Medicaid only and include 1915(b) waivers (freedom of choice) and 1915(c) waivers (home and community-based services). Section 1931 is another section of the Social Security Act that allows changes in a state’s Medicaid program, but it does not require a waiver application to filed; it can be implemented through amending a state’s Medicaid State Plan. This initiative gives states more flexibility to cover low-income people in families with dependent children by increasing income and assets disregards and limits. Texas has the highest rate of uninsured people in the nation, at about 26 percent. Texas implemented Medicaid in 1967, and the federal government paid 62.67 percent of Medicaid expenses in Texas in federal fiscal year (FFY) 2004. Combined federal and state spending for Medicaid in Texas was $15.5 billion in state FY 2004, not including DSH payments, which add another $1.5 billion. SCHIP began in May 2000 in Texas, and the federal share for SCHIP was 72.15 percent in Texas for FFY 2004. Texas spent almost $330 million on SCHIP in FY 2004, including both federal and state funds. Changes in Medicaid and SCHIP in Texas include major cuts in 2003 to save money and the possible restoration of some of the cut benefits in 2005. Texas currently has five 1915(b) and seven 1915(c) waivers, and no approved 1115 waiver. An 1115 HIFA waiver was submitted in December 2004 for a SCHIP premium assistance program, and there are other 1115 waivers under consideration in the state. Other options for Texas to consider for expanding Medicaid and SCHIP to cover more low-income people, which for the most part do not require a waiver, include implementing Section 1931, eliminating assets tests and disregards for SCHIP, and implementing the Ticket to Work program. Promising alternatives to consider include a HIFA waiver using a hypothetical 1931 expansion as the basis for cost savings, offering prenatal care under SCHIP (including to undocumented women), a broader women’s health waiver, and public-private models for small businesses.
Medicaid Background Medicaid is a federal-state matching program established by Congress under Title XIX of the Social Security Act of 1965 and administered by the Centers for Medicare and Medicaid Services (CMS) within the U.S. Department of Health and Human Services. It was created to pay the medical bills of low-income people and increase access to health care. It is an entitlement program, meaning all people who meet the eligibility requirements are entitled to services. Every state (plus Washington, D.C., and five U.S. territories) has a Medicaid program, but since implementation is left to each state, there are variations in the eligibility, benefits, reimbursements, and other details of the program among states. Title XIX of the Social Security Act establishes some basic principles for the Medicaid program. States must follow these four principles as well as all laws related to mandated eligibility and benefits unless the Centers for Medicare and Medicaid Services approves a state’s waiver requesting an exemption from certain requirements of the program. 1) Statewideness: Medicaid services must be offered on a statewide basis and not in certain locations only. 2) Comparability: the same level of services must be available to all Medicaid beneficiaries (with

B-3
some exceptions specified in federal law such as providing medically necessary care for Medicaid-eligible children and services for medically needy people whose income would otherwise disqualify them). 3) Freedom of choice: beneficiaries must be allowed to have an informed choice of Medicaid health care providers who meet program standards. 4) Amount, duration, and scope: services must be offered in an amount, duration, and scope that is reasonably sufficient to achieve the purpose of the benefits. States may impose some limits on services for beneficiaries over 21 (such as limiting the number of hospital days covered), as long as the limits follow this guideline and do not discriminate among beneficiaries based on medical diagnosis or condition.1 Federal law also specifies that each state designate a single state agency to administer that state’s Medicaid program. Medicaid pays for basic health services such as inpatient and outpatient hospital care, physician visits, pharmacy, laboratory, X-ray services, and long-term care for elderly and disabled beneficiaries. The people eligible for these services are mainly low-income families, children, related caretakers, pregnant women, the elderly and people with disabilities. Medicaid was originally available only to people receiving cash assistance from the government (TANF — Temporary Aid to Needy Families, or SSI — Supplemental Security Income), but during the late 1980s and early 1990s, Congress expanded the program to include more people such as the aged, disabled, children and pregnant women. People receiving cash assistance are still automatically eligible for Medicaid, but as a result of federal changes, Medicaid was de-linked from cash assistance and there are many people who are on Medicaid but not on cash assistance programs.2 Congress passed the Ticket to Work and Work Incentives Improvement Act in 1999 to expand Medicaid to certain disabled people whose incomes make them ineligible for SSI. Many disabled people can work but by doing so will earn too much income to qualify for Medicaid, and if they cannot obtain insurance through their employers or if the coverage is inadequate for their needs, they may still be able to get Medicaid through this provision. Simplification of enrollment procedures since 1998 has also helped to enroll more people in Medicaid. However, due to historical rules, Medicaid cannot cover low-income adults who do not have children in the home and are not disabled or elderly, except under a Medicaid waiver.3 Medicaid had just 4 million enrollees in 1966.4 The total number of people on Medicaid went from 33.2 million in June 1996 to 42.7 million in June 2003 (with slight dips in 1997-1999 when the economy was better and as a result of welfare reform).5 Medicaid now covers one-fifth of the children in the U.S. and pays for one-third of all childbirths, two-fifths of all long-term care costs, one-sixth of all pharmacy costs, and half of states’ mental health services. Though the disabled and elderly make up less than one-third of the Medicaid population (compared to children and nonelderly adults), two-thirds of Medicaid expenditures is spent on these groups.6 The portion of the Medicaid population enrolled in managed care programs climbed steadily from 40.1 percent in June 1996 to 59.1 percent in June 2003.7 State interest in applying managed care methods to Medicaid began in the 1980s when rising costs and a recession put pressure on states to control spending, and managed care greatly increased in the 1990s. Less than 10 percent of Medicaid beneficiaries were enrolled in managed care in 1991.8 Though Medicaid managed care has not been without its problems, it has stabilized in the last few years and is generally working better than managed care in Medicare and the private sector. Managed care penetration and types of managed care models vary among states, but most states agree that managed care has generally helped with cost control and providing a medical home to clients, and they do not want to get rid of it and go back to an all fee-for-service model, though they continue to refine their managed care programs.9

B-4
Mandatory and Optional Covered Populations Federal guidelines specify mandatory populations to cover and services to offer at a minimum to receive funds for the Medicaid program, and states can cover more people and/or offer additional services if they wish. The mandatory population is most people who receive federal assistance payments, as well as some related groups that do not receive cash payments. These groups are called “categorically needy” and include the following:
• Low-income families with children (described in Section 1931 of the Social Security Act, who meet certain eligibility requirements of the state’s AFDC plan in effect on July 16, 1996, now called TANF, or Temporary Aid to Needy Families). Since 1996, Section 1931 has allowed states to define “low-income” by giving them flexibility to increase income disregards and assets limits by amending the state’s Medicaid State Plan (instead of applying for a federal waiver).
• Supplemental Security Income (SSI) recipients.
• Infants born to Medicaid-eligible pregnant women (up to one year old as long as the infant remains in the mother’s household and she remains eligible, or would be eligible if she were still pregnant).
• Children under age 6 and pregnant women whose family income is at or below 133 percent of the federal poverty level (FPL). Once eligibility is established, pregnant women remain eligible for Medicaid through the end of the calendar month in which the 60th day after the end of the pregnancy falls, regardless of any change in family income.
• Children ages 6 to 19 with family incomes up to 100 percent FPL.
• Recipients of adoption assistance and foster care under Title IV-E of the Social Security Act.
• Certain low-income Medicare beneficiaries with limited resources (Medicare pays first, and Medicaid supplements the out-of-pocket medical expenses of these “dual eligibles”).
• Special protected groups who may keep Medicaid for a period of time. (For example, people who lose SSI payments due to earnings from work or increased Social Security benefits; and families who are provided from 4 to 12 months of Medicaid coverage following loss of eligibility under Section 1931 due to increases in various types of income).10
States have the option to extend Medicaid to other categorically needy groups who are similar to the mandatory groups using somewhat more liberal eligibility criteria. States will receive the federal matching funds for covering these groups if they choose to do so. Following are examples of these optional groups:
• Infants up to age 1 and pregnant women not covered under the mandatory rules whose family income is below 185 percent of FPL (or other percentage set by each state).
• Optional targeted low-income children.
• Certain aged, blind or disabled adults who have incomes above the mandatory coverage but below the FPL.
• Children under age 21 who meet income and resources requirements for AFDC, but who otherwise are not eligible (AFDC now called TANF).

B-5
• Institutionalized individuals with income and resources below specified limits.
• People who would be eligible if institutionalized but who are receiving care under home and community-based services waivers.
• Recipients of state supplementary payments
• People with tuberculosis (TB) who would be financially eligible for Medicaid at the SSI level (only for TB-related ambulatory services and TB drugs).
• Low-income, uninsured women screened and diagnosed through a Centers for Disease Control and Prevention Breast and Cervical Cancer Early Detection Program and determined to be in need of treatment for breast or cervical cancer.11
States may also receive matching funds for an optional “medically needy” program to extend Medicaid coverage to additional people who have too much income or resources to qualify under the mandatory or optional categorically needy groups. This program allows people to spend down to Medicaid eligibility by having their medical expenses offset their excess income, and may also allow them to pay monthly premiums to the state for Medicaid. If a state chooses to have a medically needy program, it must include certain children under age 18, pregnant women through a 60-day postpartum period, certain newborns for one year, and certain blind people. The state may choose to provide coverage for additional medically needy people such as the aged, blind, disabled (including disabled people who work), people 21 and under who are full-time students, and relatives who live with and are caretakers of children without parental support. As of 2003, 37 states had medically needy programs within Medicaid.12 Some states also expand their eligibility requirements through Medicaid waivers (discussed in more detail below). As of 2003, there were 19 states with statewide 1115 waivers to expand eligibility, and these usually require that the beneficiaries enroll in a Medicaid managed care program in order to receive services.13 These extra “waiver populations” may include people such as childless adults, low-income women needing family planning services, or HIV-positive people who are not yet disabled enough to qualify for regular Medicaid.14
Mandatory and Optional Medicaid Benefits In order to receive matching funds, a state’s Medicaid program must follow federal guidelines requiring that certain basic services be offered to the covered groups. The mandatory benefits include the following:
• Inpatient and outpatient hospital services;
• Prenatal care;
• Vaccines for children;
• Physician services;
• Nursing facility services for people aged 21 or older;
• Family planning services and supplies;
• Rural health clinic services;
• Home health care for people eligible for skilled-nursing services;
• Laboratory and x-ray services;
• Pediatric and family nurse practitioner services;

B-6
• Nurse-midwife services;
• Federally qualified health center (FQHC) services, and ambulatory services of an FQHC that would be available in other settings;
• Early and periodic screening, diagnostic, and treatment (EPSDT) services for children under age 21.15
There are also optional services for which states may receive federal funding. Of the 34 approved optional services, these are the most common:
• Diagnostic services;
• Clinic services;
• Intermediate care facilities for the mentally retarded (ICFs/MR);
• Prescribed drugs and prosthetic devices;
• Optometrist services and eyeglasses;
• Nursing facility services for children under age 21;
• Transportation services;
• Rehabilitation and physical therapy services;
• Home and community-based care to certain people with chronic impairments.16
States determine the amount and duration of their Medicaid services within guidelines. For example, states may limit the number of hospital days or doctor visits covered, but two restrictions apply. Limits must not interfere with producing a sufficient level of services to achieve the purpose of the benefits, and limits may not discriminate among beneficiaries based on medical diagnosis or condition. States are generally required to provide comparable amounts, duration, and scope of services to all categorically needy and categorically related eligible groups. There are two exceptions to this: 1) medically necessary services under EPSDT that are included in the federal mandatory or optional benefits must be covered even if those services are not included in the state’s plan, and 2) states may request Medicaid waivers to pay for otherwise uncovered home and community-based services to people who might otherwise be institutionalized. States have few limitations on the services that can be offered under waivers, as long as the services are cost-effective. Each Medicaid program generally must allow beneficiaries to have informed choices between providers and to receive appropriate and timely care.17
Medicaid Finances
Federal Matching The federal share of the match for each state’s medical services under Medicaid is called the FMAP (Federal Medical Assistance Percentage) and is calculated from the average per capita income of the state compared to the U.S. average. A state with its per capita income at the national average will have a FMAP of 55 percent; states with higher incomes will have a lower FMAP and state with lower incomes will have a higher FMAP. The exact formula used is the following:18

B-7
( )( ) ⎥
⎥⎦
⎤
⎢⎢⎣
⎡⎟⎟⎠
⎞⎜⎜⎝
⎛− 45.0*1 2
2
incomecapitaperNationalincomecapitaperState
The state matching percentages are updated every fiscal year for each state based on income data from the most recent three-year period, and cannot go below 50 percent or above 83 percent for the federal share. Program costs are matched at different rates: program administration is generally matched at 50 percent, administration services that must be performed by skilled professional medical staff are matched at 75 percent, and family planning services and certain information systems costs are matched at 90 percent. Each state must fund the remaining portion of its program from state funds (e.g., if a state’s FMAP is 60 percent, the other 40 percent of each dollar spent on Medicaid must come from the state, or to put it another way, the federal government gives the state $1.50 for every dollar of state funds used). States may use local government funding for no more than 60 percent and taxes on health care providers for no more than 25 percent of the state match.19 Because there is a floor of 50 percent on the federal match, states that are wealthier than the national per capita income receive what amounts to a higher match than their relative income entitles them to. As stated above, one of the exceptions to a state’s regular FMAP is the federal matching rate for family planning services under Medicaid, which are matched at 90 percent. “Family planning” is not defined in federal law, so states can create their own definitions, as long as they follow federal, state, and Medicaid policies.20 CMS’s State Medicaid Manual states that family planning services eligible for the 90 percent matching rate are counseling; patient education; examination and treatment; lab tests; contraceptive methods, procedures, pharmaceuticals, and devices; and infertility services, including sterilization reversals.21 Services not eligible for 90 percent matching are hysterectomy, other medically needed procedures not performed for family planning purposes such as removal of an intrauterine device due to infection, abortion, and transportation for family planning services.22 Some abortions would also not qualify for the regular Medicaid state matching rate—federal funds cannot pay for abortions except in instances of rape or incest, or where the life or long-term health of the mother would be endangered if she carried the fetus to term. States can create their own policies and use state funds for abortion services.23 In federal fiscal year (FFY) 1997, total spending on Medicaid (medical and administration for all programs) was $166 billion, of which $94 billion was the federal share. This increased each year to FFY 2001, when total spending was $228 billion and the federal share was $130 billion.24 Medicaid spending grew at its slowest rate in history in the mid to late 1990s, at an average of 3.6 percent a year from 1995 to 1999. However, in 2000 and 2001 Medicaid spending increased by double-digit rates, and in 2002 was projected to grow by an average of 9 percent a year for the next decade.25 The federal share of Medicaid spending was $147.5 billion in FFY 2002 and $160.7 in FFY 2003. Federal Medicaid expenditures are projected to increase to $177.3 billion in FFY 2004, $182.1 billion in FFY 2005, and $192.2 billion in FFY 2006.26 In 1995, Congress passed legislation to replace the current Medicaid program with block grants that would provide the states with a fixed amount of money and much more flexibility regarding eligibility and benefits, but President Clinton vetoed the bill.27 The Bush Administration’s FY 2004 and 2005 budgets reintroduced Medicaid block grants, as discussed later in this paper.

B-8
Disproportionate Share Hospital Program States also get federal Medicaid money for the Disproportionate Share Hospital Program. The disproportionate share program (DSH or “dispro”) provides reimbursement to hospitals that serve a disproportionately large number of Medicaid patients or other low-income people to help compensate them for lost revenues.28 The program was established with the Boren Amendment in 1981 (in OBRA 1980 and 1981), which repealed a Medicaid law that made states pay for inpatient hospital services at the Medicare rate, and instead allowed them to use a rate that was “reasonable and adequate.” Congress recognized that this change would result in lower Medicaid payments for many hospitals, especially those serving a large number of Medicaid and uninsured patients, so it specified that the new payment rates take into account hospitals that serve a “disproportionate share” of low-income people. DSH funds are subject to the same federal matching rate as other Medicaid funding, though there is a ceiling on the total amount for each state, unlike regular Medicaid funds, which are open-ended. The amount of DSH payments received and their percentage of states’ total Medicaid budgets varies widely from state to state.29 States were initially slow to start using DSH payments in the 1980s, but as more states got involved and federal funding for DSH significantly increased in the late 1980s and early 1990s, Congress began passing legislation to limit DSH funding increases. Significant changes to DSH were passed in 1991, 1993, 1997, 2000, and 2003. Several of the latest acts restore some of the cuts in DSH payments to states. The Medicaid Voluntary Contribution and Provider-Specific Tax Amendments of 1991 were passed to ban provider donations and cap provider taxes to 25 percent of a state’s Medicaid match. Provider donations and taxes were methods that some states had started using to draw down more federal matching funds without using any state funds, only money they collected from providers and used for the state match to get more DSH funds for hospitals. The law also capped state DSH payments at approximately their 1992 levels, and capped national DSH payments to 12 percent of total Medicaid expenditures. States whose DSH payments were less than 12 percent of their Medicaid costs could increase them at the same rate as their overall Medicaid programs, but states whose DSH payments were already 12 percent or more in 1992 could not increase their current spending in the future. This law had the intended effect of slowing DSH payment growth, and many states had to alter the financing structure of DSH and find other revenue sources besides provider donations and taxes. Many states starting using intergovernmental transfer programs (IGT), where funds were transferred from local and state hospitals to the state Medicaid program, and returned to the institutions along with the extra federal matching funds.30 Congress included several provisions related to DSH in the Omnibus Budget Reconciliation Act (OBRA) in 1993 amid concerns that some hospitals who did not treat many Medicaid patients were receiving DSH payments that exceeded their costs, and that some states were keeping part of their DSH payments in the state budgets instead of directly helping safety-net providers. OBRA 1993 included laws stating that only hospitals with a Medicaid use rate of at least one percent could receive DSH payments, and that total DSH payments to a single hospital could not be more than the unreimbursed costs of providing inpatient services to Medicaid patients and uninsured patients. These laws went into effect in 1994 for most public hospitals and 1995 for private hospitals.31 The Balanced Budget Act (BBA) of 1997 targeted DSH payments, among other federal expenditures, for reduction. Some key changes in this legislation were to establish new DSH amounts for each state for 1998 to 2002 (decreasing each year), thus eliminating the limits

B-9
established in 1991, and after 2002, allowing federal DSH spending to increase by the percent changes in the Consumer Price Index (with a cap of 12 percent of each state’s total annual Medicaid spending). The law also limited the amount of DSH payments that mental hospitals could receive to no more than 33 percent of a state’s DSH allotment (by 2002), and stated that DSH payments for managed care patients had to be paid directly to hospitals and not to managed care organizations. BBA 1997 again required many states to alter their DSH programs and to make cutbacks in DSH payments.32 The Medicare, Medicaid, and SCHIP Benefits Improvement and Protection Act (BIPA) of 2000 enacted a variety of changes related to these programs. It gave temporary relief to states dependent on DSH by making the DSH limits not decrease in 2001 and 2002 as planned, but instead to equal the year before it for each year plus inflation (as long as the increases did not make DSH over 12 percent of the state’s Medicaid spending). It also temporarily increased the DSH reimbursement rate for uncompensated care at public hospitals from 100 percent (established by OBRA 1993) to 175 percent for state fiscal years 2003 and 2004. It directed states to count Medicaid managed care patients when calculating their formulas for which hospitals are eligible for DSH, and it increased states’ DSH allotments to one percent for those currently under one percent. It also called for regulations to be finalized and issued to gradually phase out excess payments in the upper payment limit program, as explained below (enacted in 2001).33,34,35
The Medicare Prescription Drug, Improvement, and Modernization Act of 2003 had several provisions in it relating to Medicaid DSH payments. The act modified the planned limits on DSH growth by giving states a one-year increase of 16 percent for state FY 2004 over the states’ 2003 allotment, not subject to the 12 percent cap, and subsequent years stay at the 2004 level until they match what would have been the allotment under the previous law (BIPA), then they increase annually at the previous year’s level plus the consumer price index for urban consumers (CPI-U). The law also raised the DSH allotments for extremely low DSH states, and mandated more details in the annual DSH report that states must give to the federal government, including an independent audit.36,37
Upper Payment Limits The Upper Payment Limit (UPL) is a program that reimburses hospitals for the difference between what Medicaid pays for a service and what Medicare would have paid for it. Medicaid cannot pay more than Medicare would have paid for a service, and Medicare rates are generally higher, so this difference is called the “Medicaid upper payment limit.” Medicaid’s UPL rules, prior to March 2001, allowed states to maximize federal matching funds by paying certain public hospitals and nursing homes inflated amounts for treating Medicaid patients, which the federal government then matched according to the state’s FMAP, as long as the payments to a particular facility did not result in a violation of an aggregate UPL applicable to all facilities (these limits apply to regular Medicaid payments and not DSH, which has its own set of limits). The UPL was based on an estimate of what would have been paid under Medicare to an entire class of providers, which usually resulted in an upper limit well above what states pay the same type of providers under Medicaid. The state would pay the providers and then keep the rest of the federal matching funds for its own uses; these were often transferred back into state general revenue funds for non-Medicaid and even non-health costs. These payments effectively increased participating states’ federal matching rates over what they were supposed to be.38 UPL arrangements became more common in 2000 as more states learned about them, and states taking advantage of this began to receive criticism from the Governmental Accounting Office and the HHS Office of Inspector General for exploiting the rules. New rules took effect on

B-10
March 13, 2001, that limited the amount of federal Medicaid funds that states could get through these methods. The Congressional Budget office estimated that without the new rules, federal Medicaid UPL spending would have been $160 billion from 2001-2010, and even though payments will be significantly less after the regulations, $36.6 billion is still expected to be spent from fiscal years 2001-2005. Medicaid DSH payments to states are projected to be $42.3 billion over this same five-year period.39 Two aspects of Medicaid allowed UPL arrangements to propagate before March 2001. One was intergovernmental transfers between localities to states, which was and is a legitimate source for a state’s matching funds for Medicaid. The other was allowing the amount of Medicaid payments to public hospitals or nursing homes to exceed the costs of treating Medicaid patients at these facilities, as long as the UPL to all such providers in the state was not exceeded. After the repeal of the Boren Amendment as part of BBA 1997, the federal government no longer required that Medicaid payments to hospitals and nursing homes be “reasonable.” The problem is that before the 2001 law, UPLs were imposed on all hospitals as a group, all nursing homes, all state-operated hospitals, and all state-operated nursing homes, but no limits were applied to aggregate payments to county-operated hospitals and nursing homes.40 The March 2001 regulations established more UPL groups that include county-operated hospitals and nursing homes, but there are transition periods up to eight years (with reductions each year) for states that already had UPL plans in place.41 The law that took effect in March 2001 also established two tiers of UPL payment limits, a reasonable estimate of 100 percent of what costs would have been under the Medicare program for the same services for the same people applicable to nursing facilities and state and private hospitals, and a limit of 150 percent reimbursement of this estimate for local public hospitals. The 150 percent tier only lasted one year—it was changed to 100 percent in rules that took effect in March 2002.42
State Children’s Health Insurance Program Background The State Children’s Health Insurance Program (SCHIP) was created as part of the Balanced Budget Act of 1997 and codified into Title XXI of the Social Security Act. It is administered by the Centers for Medicare and Medicaid Services. It was established to offer health insurance to the large number of uninsured children with family incomes too high to qualify for Medicaid, but who cannot afford private insurance. Every state (plus Washington, D.C., and the five U.S. territories) has implemented SCHIP plans. SCHIP is a grant program with limited funds and not an entitlement program like Medicaid, so states can place caps on the number of children enrolled or enact other restrictions that are not legal in Medicaid.
Eligibility and Benefits To qualify for SCHIP, children must be younger than 19, a U.S. citizen or legal resident, not eligible for Medicaid or state employee coverage, not have private insurance, and have a family income below 200 percent of the federal poverty level or below 50 percentage points above the state’s Medicaid eligibility, whichever is greater (some states have expanded coverage above 200 percent FPL).43 Families pay premiums, deductibles, and co-payments that vary according to their income levels. The BBA gave states three options for designing their SCHIP programs: they could expand coverage for children under Medicaid (43 percent chose this option), establish a separate child health program (27 percent), or do a combination of these two strategies (30 percent).44 If a state implements SCHIP by choosing to expand Medicaid, it must offer the new beneficiaries the same benefits package that current Medicaid enrollees get. If a state establishes a separate

B-11
children’s health insurance program, it can choose from among five options for benefits packages. It can offer SCHIP enrollees 1) the Blue Cross/Blue Shield PPO option offered to federal employees; 2) the state employees health plan; 3) the HMO plan with the largest commercial, non-Medicaid enrollment in the state; 4) coverage that is the actuarial equivalent to one of the three previous options; or 5) another health plan approved by the U.S. Secretary of Health and Human Services.45
If a state wants to expand its SCHIP eligibility to optional populations, it can apply for an 1115 waiver (explained below in the section on waivers), as long as the state is already covering the target population of children under 19 with incomes under 200 FPL. Covering additional populations under a SCHIP waiver, instead of using a Medicaid waiver, is an attractive option for states since the federal match is higher for SCHIP. To obtain a waiver, the state must show that it is promoting enrollment and retention of eligible children. Under a policy instituted in 2000, if the waiver does not focus on enrolling children or if it proposes to cover populations other than low-income children (such as their parents), then the state had to show that it had adopted at least three of the following five enrollment and retention procedures in its Medicaid and SCHIP programs:
• A joint mail-in application and a common application procedure for Medicaid and SCHIP;
• Elimination of assets tests;
• Twelve-month continuous eligibility;
• Simplification of the renewal process by allowing parents to establish their children’s continuing eligibility by mail, and by having effective procedures for transferring children between Medicaid and SCHIP if their eligibility changes without a new application or a gap in coverage;
• Presumptive eligibility for children (meaning they can get immediate temporary coverage under Medicaid or SCHIP if they appear to meet eligibility requirements of the program they are applying for, before their application is officially processed and approved).46
These requirements may have been relaxed since then, but we have been unable to find a reference for this.
SCHIP Finances SCHIP is a federal-state matching program with a higher federal share than Medicaid. The federal match is calculated by taking 70 percent of the state’s FMAP for Medicaid and adding 30 percentage points (with a maximum of 85 percent).47 The federal match in 2004 varied from 65 percent (in 13 states) to 84 percent (in Mississippi).48 The remaining balance is funded by the states, and there are restrictions on the sources of these funds. States cannot use federal funds, provider taxes, or beneficiaries’ cost-sharing to make up these funds, and states also cannot use SCHIP funds to finance the state match for Medicaid. States also have to show a maintenance of effort to receive federal funds: they cannot lower their Medicaid eligibility levels from what they had in place on June 1, 1997, and they must maintain at least the same level of spending on children’s health programs that they had in 1996.49 These provisions seek to ensure that SCHIP funds cover the intended target population of uninsured children without states trying to transfer additional children to the program in order to reap the higher federal matching funds. SCHIP was appropriated approximately $40 billion over 10 years. The amounts are $4.295 billion for FFY 1998, $4.275 billion for each year from FFY 1999-2001, $3.15 billion for each

B-12
year from FFY 2002-2004, $4.05 billion for FFY 2005 and 2006, and $5 billion for FFY 2007.50 The minimum allocation to each state from these funds is $2 million per fiscal year. The actual annual allocation to each state (and the District of Columbia) is determined by a formula that takes two variables into account: the “number of children factor” (based on the number of low-income and uninsured children in the state) and the “state cost factor” (based on wages in the health care industry in each state). The two factors are multiplied to get a product for each state, then these are added together to get a total for all states. A ratio is then made of each state’s product over the total to determine what percentage of the available funds will go to each state.51 The number of children factor is calculated by adding 50 percent of the number of low-income children in the state to 50 percent of the number of low-income children without health insurance in the state. These two numbers are calculated each year using the average of low-income children and low-income uninsured children as reported and defined in the three most recent March supplements to the Current Population Survey published by the Census Bureau each year. The state cost factor is determined by adding 0.15 to 0.85 multiplied by the ratio of the annual average health care wages per employee for the state over the annual average health care wages per employee for all states totaled. In other words, if a state’s per capita health care wages were at the national average, this ratio would equal 1, so adding 0.85 to 0.15 would make the whole state cost factor equal to 1. If health care wages were lower than average, then this factor would be less than 1. The average annual wages per employee for each state is calculated from the wages in the health services industry (SIC code 8000) averaged from each of the most recent three years as reported by the Bureau of Labor Statistics in the Department of Labor.52 SCHIP funds to a state remain available for the state to spend for three years (the fiscal year of the award and the next two fiscal years). Any funds that have not been spent during this period are subject to reallocation by the federal government and possible redistribution to other states that have exhausted their funds.53 The CHIP Allotment Extension (Public Law 108-74) allowed states to keep unspent 1998-1999 federal allocations through 2004, and gave states additional time to spend 50 percent of unused FY 2000-2001 funds (through FY 2004 and 2005, respectively).54 The federal government took back almost $1.1 billion in state SCHIP funds on September 30, 2004, the end of the federal fiscal year, that had not been spent by the deadline (these funds were allocated to states from 1998-2000). In November 2004, 72 organizations, including health systems, associations, and non-profits, signed a letter by the Children’s Defense Fund to all members of Congress asking them to change the law and to restore these funds to states this year so states will have the resources to continue their SCHIP programs at current levels over the next few years.55 There was bipartisan legislation introduced in July 2004 in both the Senate and the House, and endorsed by the National Governors Association, that would have sent a majority of the unused funds to states projecting SCHIP shortfalls in the next three years, and that would have extended the expiration of the funds, but the Bush Administration opposed the legislation.56 The Bush Administration wants to use the current unused funds for SCHIP outreach, and says that unspent funds from 2002 will be available in 2005 to be reallocated to the states with budget shortfalls (six states are projected to have SCHIP shortfalls by 2005 and 18 states by 2007 under current laws). The amount available in fiscal year 2005 is estimated to be $623 million, and 30 states that will have spent all their funds will be eligible for these funds to be reallocated to them.57 However, if most of those funds are spent on the six states with the largest shortfalls, not much will be available for the remaining states, causing problems in the

B-13
future for their SCHIP programs. The administration says that in 2005 states are projected to have much more in SCHIP allocations ($10.7 billion) than they will spend ($5.2 billion), however, that is for the nation as a whole, and shortages will still exist in some states.58 The $10.7 billion is not the annual allotment, but takes into account states’ unused funds from previous years, because from 1998-2001 while SCHIP programs were still ramping up, there were unused funds, but since 2002 annual SCHIP expenditures have exceeded annual funding. The difference has been funded from states’ unspent money, but as time goes on these reserves are being used up or expiring and reverting back to the U.S. Treasury.59 The $1.1 billion that reverted to the federal government was the unspent funds from nine states that were not able to spent it by the deadline.60 As more and more states have fully functioning SCHIP programs and spend all of their SCHIP funds, unused funds are projected to be less and less, so states that use all of their funding will not be able to rely on receiving more funds reallocated from other states in the future. Texas is not one of the 18 states projected to be unable to maintain current SCHIP enrollment levels with current funding.61
Medicaid and SCHIP Waivers and Other Options for Change
Waivers Waivers allow the U.S. Department of Health and Human Services (HHS) to waive certain Medicaid and SCHIP laws and regulations to give states more flexibility in these programs and to encourage experimentation with new approaches to delivering services. There are two broad waiver types, which refer to different sections of the Social Security Act. Section 1115 waivers are called “research and demonstration waivers” and usually involve comprehensive reform projects, while Section 1915 waivers are called “program waivers” and involve waiving specific requirements to allow more innovative programs such as managed care and community-based care. Every state and territory has applied for and implemented at least one Medicaid waiver.62 Section 1115 of the Social Security Act allows HHS to authorize pilot projects in states that want to test new ways to promote the objectives of Medicaid and SCHIP. States can obtain federal matching funds for demonstration projects to pay for more services or extend coverage to more people. Applications must show how projects will help further the goals of Medicaid or SCHIP, and include an evaluation component. Projects are usually approved for five years and may be renewed, and they must be budget-neutral, meaning they don’t cost the federal government any additional money.63 Although called “demonstration” projects these arrangements often become permanent. The Arizona Medicaid program (called Arizona Health Care Cost Containment System, or AHCCCS) was introduced under an 1115 waiver in 1982 and through repeated renewals and amendments continues to operate today.64 A new type of 1115 waiver is the Health Insurance Flexibility and Accountability demonstration initiative, or HIFA waiver, announced by the Bush Administration in August 2001. This waiver, applicable to both Medicaid and SCHIP, is mainly intended to encourage new statewide approaches to increasing health insurance coverage, and proposals that meet HIFA guidelines will receive expedited review. Programs should be budget-neutral and maximize private insurance options using Medicaid and SCHIP funds to people below 200 percent FPL.65 There are two types of waivers allowed under Section 1915 of the Social Security Act, 1915(b) and 1915(c) waivers. Section 1915(b) waivers are generally granted for two years at a time and permit states to waive Medicaid’s freedom-of-choice requirement regarding providers, thus letting states require enrollment in managed care plans or create local programs not available statewide. The savings from managed care often allows states to provide additional services to

B-14
Medicaid beneficiaries. Section 1915(c) waivers let states develop innovative alternatives to institutionalization, and are approved initially for three years, with five-year renewal periods. The waivers allow states to provide home- and community-based services that help keep Medicaid beneficiaries out of nursing homes, hospitals, and other institutions in order to maintain their independence and family ties as well as save money. The waivers cover elderly people or people with physical or mental problems who would qualify for Medicaid if they were institutionalized, and the programs must be budget-neutral.66
Table 1. Main Types of Waivers
Type of Waiver Purpose Requirements 1115 — Research and Demonstration (Medicaid and SCHIP)
Waives a variety of requirements to let states have flexibility to test new ideas for operating their programs. Can implement new services or delivery methods, maximize coverage for people below 200% FPL (HIFA waiver), or extend drug coverage to certain people (Pharmacy Plus waiver).
Must be budget neutral. Five-year timeframe, subject to renewals. CMS evaluates for impact on utilization, coverage, spending, quality, access, and satisfaction.
1915(b) — Freedom of Choice (Medicaid only)
Waives statewideness, comparability and freedom of choice. States can require enrollment into managed care, limit the number of providers and provide additional services for some people.
Must be cost effective. Two-year timeframe, subject to renewal. Independent evaluation required to show that cost, quality,and access have not been harmed.
1915(c) — Home and Community-Based Services (Medicaid only)
Waives statewideness, comparability, and resource and income rules. Allows community-based services to be provided to people who are eligible for care in a nursing home, intermediate care facility for persons with mental retardation (ICF/MR), or hospital. Can serve elderly or disabled in general, or can target specific chronic conditions and diseases. Can offer extra services such as case management, home health aide services, and respite care.
Must be budget neutral. Must have safeguards in place to protect enrollees. Three-year timeframe, subject to five-year renewals.
Sources: Texas Health and Human Services Commission, Texas Medicaid in Perspective, 5th ed., 2004, pp. 3-12, 3-13, available at http://www.hhsc.state.tx.us/medicaid/reports/PB5/PinkBookTOC.html, accessed January 6, 2005; and Social Security Act, Title XIX, Sec. 1915, available at http://www.ssa.gov/OP_Home/ssact/ title19/1915.htm, accessed January 5, 2005.
Section 1931 The Personal Responsibility and Work Opportunity Reconciliation Act of 1996 (PRWORA) added Section 1931 to the Social Security Act, which lets states extend Medicaid eligibility to low-income parents who are not receiving cash assistance. States must cover at a minimum those parents with incomes below those required in 1996 for welfare, whether or not they receive welfare now, ensuring that those eligible before PRWORA was passed remain eligible. States may also cover those with higher incomes, which a majority of states do. Section 1931 gives states more flexibility to cover low-income people by increasing income and assets disregards and limits, which is made easier because it can be done through amending the state’s Medicaid State Plan instead of applying for a federal waiver. Enrollments can be capped

B-15
and certain benefits and eligibility criteria can be changed for new recipients, so expansion through Section 1931 does not create an entitlement program. Section 1931 expansions also do not have to be budget-neutral like waivers do.67 See Appendix A for a table showing the eligibility levels for public programs in all 50 states as of 2002 and what expansion mechanisms they have used.
The Future of Medicaid and SCHIP on the Federal Level The Bush Administration is looking for ways to save money in Medicaid and other programs, and implementing more block grants is one possibility. President Bush’s FY 2005 budget proposed converting various federal programs into block grants, which are fixed amounts of funds that give the recipients (state and local governments) more flexibility in carrying out the programs that are funded. These proposals were not completely new, as a Medicaid block grant, among others, was proposed in President Bush’s FY 2004 budget as well.68 In these proposals for Medicaid and SCHIP block grants, states would have the option of consolidating Medicaid and SCHIP funds into acute care and long-term care allotments. The amounts would be based on historical Medicaid and SCHIP spending. The amounts would increase annually over current funding by a certain rate in the first years of the block grant but would decrease in later years to make the block grant budget-neutral over 10 years. The proposal contained certain requirements, such as that not more than 15 percent of funds could be used for program administration, up to 10 percent of funds could be transferred between allotments, and states would still have to provide benefits to currently mandated beneficiaries.69 Critics of the block grants proposals say that they overestimate the amount that can be saved with increased flexibility, and do not address the underlying reasons that Medicaid costs are growing, which are mainly increasing enrollment along with rising health care costs. The proposed increase in flexibility includes letting states tailor benefits packages to different populations, increase cost-sharing, and cap enrollments. However, the most-used benefits are unlikely to be eliminated, and more cost-sharing and caps on enrollment create inequities for low-income people who may delay getting care if they cannot afford the co-pays. Capping enrollment and getting rid of the entitlement aspect means that people who would otherwise qualify and may be worse off financially or health-wise than people already in the program could be denied benefits or put on waiting lists just because they register later. Critics also say that block grants give states an incentive to reduce coverage because they can keep any savings, take away the monetary incentive to be innovative due to no federal matching funds for expansions, and set in stone the spending inequalities of high-income and low-income states.70,71 Also, states with a low base in expenditures that may be faster-growing are particularly disadvantaged. President Bush’s FY 2006 budget does not directly mention Medicaid block grants but still proposes changes and cutbacks to control growing Medicaid costs. The Administration proposes to modernize Medicaid, create more flexibility in the program, and coordinate it better with SCHIP to increase efficiency. The budget proposes to enhance Medicaid and SCHIP coverage by reauthorizing SCHIP before it ends in 2007 and extending transitional Medicaid coverage for one year for former welfare recipients who get jobs. It also proposes $1 billion in grants over two years for a new program called Cover the Kids to enroll more Medicaid and SCHIP-eligible children in these programs.72 The Administration also wants to save money and promote program integrity by curbing financial arrangements that let states in effect increase their federal matching rates and draw down extra federal funds (through mechanisms such as intergovernmental transfers and upper payment limits). The 2005 budget also mentioned enacting more controls and continuing efforts
B-16
started in 2001 and 2002 to curb inappropriate payments.73 The 2006 budget proposes some specific measures such as recovering federal funds not used for their intended purposes, limiting payments to providers to their actual costs, decreasing the percentage of provider taxes that can be used for the state Medicaid match, and elevating the importance of the oversight of Medicaid and SCHIP financial management (including more state audits and evaluations).74
Poverty and the Uninsured in Texas Texas has the highest rate of uninsured people in the nation, at about 26 percent. In 2002, 25 percent of the uninsured were aged 17 or under, 1 percent was 65 or over, and 74 percent were in between these ages.75 Almost two-thirds of the uninsured adults in Texas have jobs, but Texas has a lower percentage of employers who offer health insurance than the national average. Even if an employer does offer insurance, lower-wage workers often cannot afford to buy it.76 Medicaid and SCHIP provide health insurance for people who meet the eligibility criteria, which include having a low income. The federal poverty level (FPL) is used as a standard for determining program eligibility. The maximum annual income allowed for eligibility may be a certain percentage higher or lower than this level, depending on the program and the service. The FPL is set by the federal government each year and updated for inflation, and it varies by family size. In 2004, the FPL was $9,310 for one person, $12,490 for two people, $15,670 for three people, and $18,850 for four people (for each additional person add $3,180). In 2002, about 25 percent of the Hispanic population in Texas lived at or below the poverty level, along with 19 percent of African-Americans and 7 percent of non-Hispanic whites.77 In addition, counties are responsible for providing care to the “medically indigent.” Appendix B delineates current requirements and experience in local participation in health coverage. When talking about assisting low-income people in obtaining health insurance, an income less than 200 percent of the FPL is often used to define “low income.” In 2003, 3,267,020 people or 61 percent of the uninsured in Texas had incomes at 199 percent FPL or less. Put another way, 38 percent of all people under 200 percent FPL in Texas do not have health insurance. Of these uninsured people under 200 percent FPL, 29 percent are children 18 or under.78 Some programs target uninsured parents so that they will understand the value of health insurance and might be more likely to insure their children or take them for medical care; fewer programs include childless adults. Of the 3.3 million uninsured people under 200 percent FPL, 37 percent are parents (defined as people 19 to 64 with children under 18 living with them), and 33 percent are childless adults (ages 19 to 64 without children or with children who do not live with them).79
Medicaid and SCHIP in Texas In 2003 the Texas Legislature passed House Bill 2292 to consolidate the state’s 12 health and human services agencies into five agencies, with the Texas Health and Human Services Commission continuing to oversee the other agencies. HHSC is the single state agency in charge of Medicaid, but it is allowed to delegate many functions to other agencies. HHSC also administers SCHIP. SCHIP and the children’s Medicaid program in Texas together are called TexCare. (SCHIP is usually called “CHIP” in Texas but we use the full acronym here for consistency.)
History and Financing of Medicaid Texas joined the Medicaid program in September 1967. The federal government pays about two-thirds of the cost of the Medicaid program in Texas (the exact percentage varies from year to year). For federal fiscal year 2004, the federal share in Texas was effectively 62.67 percent, which is figured from a basic matching rate of 60.22 percent, an additional one-time increase of

B-17
2.95 percent for several months during the fiscal year due to federal legislation, and a factor to take into account the one-month difference between the federal fiscal year and Texas’ state fiscal year.80 (The basic rate, not the enhanced rate, applies to the DSH program.) Combined federal and state spending for Medicaid in Texas was projected to be $15.5 billion in SFY 2004, not including DSH payments (which add another $1.5 billion, as detailed below). This has almost doubled from a budget of $8.2 billion in 1996. The Medicaid budget (excluding DSH) has gone from being 20.5 percent of the state budget in 1996 to 26.1 percent of the budget in 2004. Of the total state Medicaid budget of $17 billion estimated for SFY 2004, 87 percent is for payment of health services, 9 percent is for DSH payments, and 4 percent is for administration.81
Table 2. Medicaid Fiscal Trends in Texas, Selected Years
Fiscal Year
Total Medicaid Budget (state plus federal, in billions), Excluding
Disproportionate Share Payments
Percent of Total State Budget (All Funds)
1996 $8.178 20.5% 1998 $8.943 20.8% 2000 $10.363 21.0% 2002 $13.128 23.1% 2004 $15.543 26.1%
Sources: Texas Health and Human Services Commission, Texas Medicaid in Perspective, 5th ed., 2004, Chapter 5, Table 5.1, available at http://www.hhsc.state.tx.us/medicaid/reports/PB5/PinkBookTOC.html, accessed December 28, 2004.
Disproportionate Share Hospital Program in Texas Disproportionate share hospital payments are an important source of revenue for many hospitals, helping them to defray costs of uncompensated care to indigent and uninsured patients. The DSH program is the only Medicaid program where reimbursement does not have to be solely for the treatment of Medicaid patients; it can help reimburse the uncompensated costs of treating uninsured patients as well. In state fiscal year 2003, 181 hospitals in Texas received $1.294 billion in DSH payments (federal and state dollars combined). Of these hospitals, 14 were state hospitals, 80 were public, 50 were non-profit, and 37 were private for-profit hospitals.82,83 All children’s hospitals and three University of Texas teaching hospitals are eligible to receive DSH funds as long as they meet certain federal and state qualifications.84 Federal standards say that DSH-eligible hospitals must have a Medicaid utilization rate of at least 1 percent, and must have at least two doctors with admitting privileges who accept Medicaid and provide non-emergency obstetrical services (except at children’s hospitals).85 All other hospitals must qualify for DSH payments by meeting one of three criteria: they must have a 1) disproportionate number of inpatient days for Medicaid patients, 2) disproportionate percentage of inpatient days for Medicaid patients, or 3) disproportionate percentage of inpatient days for low-income patients.86 For a hospital in Texas to qualify for DSH using Medicaid inpatient days, its number of inpatient days of Medicaid patients must be above the mean number of Medicaid inpatient days of all Medicaid hospitals, plus one standard deviation. Medicaid hospitals in counties defined as

B-18
urban and with fewer than 250,000 people can qualify if their Medicaid inpatients days are above the mean number of Medicaid inpatient days for that group of hospitals, plus 75 percent of one standard deviation. To qualify by the Medicaid inpatient utilization percentage (number of inpatient days under Medicaid divided by total number of inpatient days at the hospital), a hospital’s Medicaid inpatient percentage must be above the average for all Medicaid hospitals, plus one standard deviation. Rural Medicaid hospitals can qualify if their inpatient percentages are above the average (without adding a standard deviation), making it easier to qualify for DSH. For hospitals to qualify by their low-income utilization rate, this rate must be 25 percent or more. The low-income utilization rate is determined by adding two ratios together: 1) Medicaid, state, and local funding divided by total costs, and 2) total charity charges minus total state and local revenue, divided by all inpatient charges.87 The state has to put up its share in order to receive the federal matching funds like in the rest of Medicaid. Texas’ share for DSH is funded through intergovernmental transfers to the state from eight hospital districts and one municipal hospital, and state funds from the state-owned hospitals. The current nine local transferring hospitals/districts are the University Health System (Bexar County Hospital District, San Antonio area), Parkland Health and Hospital System (Dallas County Hospital District, Dallas area), Medical Center Hospital (Ector County Hospital District, Odessa area), R. E. Thomason General Hospital (El Paso Hospital District, El Paso area), Harris County Hospital District (Houston area), University Medical Center (Lubbock County Hospital District, Lubbock area), Spohn Memorial Hospital (Nueces County Hospital District, Corpus Christi area), John Peter Smith Hospital (Tarrant County Hospital District, Fort Forth area), and Brackenridge Hospital (Austin, now part of the Travis County Hospital District). These nine hospitals or districts transfer money to the state for the state Medicaid match, then receive DSH payments back that equal what they transferred plus a portion of the federal matching funds received by the state. The remaining federal matching funds are used for the DSH payments to the other DSH-eligible non-state hospitals. The 14 state hospitals that transfer money for matching funds are the University of Texas Medical Branch at Galveston, the University of Texas M.D. Anderson Cancer Center, the University of Texas Health Center at Tyler, the Texas Center for Infectious Disease in San Antonio, and 10 mental health facilities. These state hospitals transfer to HHSC an amount equal to their unreimbursed costs for Medicaid and uninsured patients, and the federal matching funds obtained with these funds are withheld by HHSC and transferred to the state general revenue fund. The state hospitals are reimbursed at 100 percent of their federal cap amounts (discussed later in this section).88 The disproportionate share program in Texas was created in 1986 from funds appropriated by the Indigent Health Care and Treatment Act of 1985. This act appropriated $2 million for FY 1986 and $4 million for FY 1987 to help hospitals that served indigent patients, but did not specifically mention Medicaid. At the same time, the federal government had directed Texas to create a Medicaid disproportionate share program, so the state decided to use this $6 million as the state match for Medicaid to receive additional federal funds for hospitals, and continued to appropriate money each year for that purpose. Texas expanded the DSH program in 1989 by requiring qualifying hospital districts (with their number of beds at least in the 84th percentile of all Medicaid hospitals) and state teaching hospitals to transfer money to the state to be used as state matching funds for DSH, as well as appropriating more state funds for this purpose, so more federal matching funds were received. Hospitals that transferred funds to the state were guaranteed to receive more in DSH payments than they had donated.89 There were some changes made to Texas’ DSH program in the early 1990s amid concerns that public hospitals were not adequately reimbursed for their amount of DSH days relative to non-profit and private hospitals. The original DSH financing system, called DISPRO I, used formulas to distribute DSH payments to approximately 100 qualifying hospitals that were financed

B-19
through intergovernmental transfers, state appropriations, and federal matching funds. A performance review report from the Texas Comptroller’s Office in 1991 stated that large public hospitals were not getting their fair share of DSH payments considering their assessments and large amount of uncompensated care, and that other states used more local funds plus voluntary donations and provider taxes to draw down more federal funds. The hospital districts and state hospitals agreed to an increase in their assessments in 1991 (state hospitals paid larger fixed amounts and the amount from hospital districts increased from 1 percent to 5 percent of local ad valorem tax collections), which resulted in $52 million more in federal matching funds that year.90 Texas created several additional DSH programs in the early 1990s. A second DSH program called the Special Supplemental Payment Program was created to help three state-owned teaching hospitals (University of Texas hospitals in Galveston, Houston, and Tyler) with high amounts of uncompensated care. The DISPRO II program allowed the hospitals to transfer the amount of their annual charity care into a specific fund to be used as state matching funds to draw down more federal Medicaid dollars. A similar program called DISPRO III was created to help other hospitals with high amounts of Medicaid and indigent care. This program used monthly provider assessments of high-volume Medicaid providers, mandatory hospital assessments, intergovernmental transfers, and voluntary donations from qualifying hospitals, and additional DSH payments were made to qualifying hospitals (public hospitals paid assessments for both DISPRO I and III). A fourth program, DISPRO IV, used 5 percent of the hospital assessments from DISPRO III as a state match for funds to make additional DSH payments to about 90 rural hospitals.91 As stated in the previous section on Medicaid financing at the federal level, spending on the DSH program greatly expanded in the late 1980s, and in the 1990s Congress passed several acts aimed at curbing these expenditures. The Medicaid Voluntary Contribution and Provider-Specific Tax Amendments of 1991 capped the DSH program in Texas at $1.513 billion (state plus federal funds), and made the provider assessments in DISPRO III and IV no longer eligible for federal matching funds.92 OBRA 1993 established caps on the DSH amounts that individual hospitals could receive, which was the sum of the hospital’s unreimbursed costs for Medicaid patients and uninsured patients, and directed that at least one percent of the total patient-days in a hospital must be from Medicaid patients in order for the hospital to be eligible to receive DSH payments. 93 The state teaching hospitals in Texas lost significant funds when the hospital-specific caps were added to existing formulas.94 Due to federal changes and state recommendations, Texas modified the DSH program in 1994 and merged the four previous DSH programs into one program. A new formula was established where all hospitals must qualify each year based on several variables. There are special provisions to enhance the funds given to the large public hospitals who transfer money for the state match, and for qualifying children’s and rural hospitals.95 The Texas Health and Human Services Commission implemented several changes to DSH in FY 2001 and 2002. In FY 2001, the formula was weighted so transferring hospitals would receive more funds back and reimbursement for treating low-income patients would increase, and a minimum of 5.5 percent of DSH was set aside for rural hospitals. In FY 2002, DSH eligibility was expanded to include hospitals in small urban areas, so more hospitals can receive DSH payments in Abilene, Bryan, Longview, Lubbock, Midland, San Angelo, and Tyler.96 Due to these changes, DSH payments to state-owned hospitals decreased from $729 million to $480 million from SFY 1995 to 2003, but this was offset by more funds going to local hospitals. BBA 1997 set annual limits on the federal funds going to the Texas DSH program, but those limits were increased by the Medicare, Medicaid, and SCHIP Benefits Improvement and

B-20
Protection Act of 2000 and the Medicare Prescription Drug, Improvement, and Modernization Act of 2003. These changes have resulted in fluctuations in the amount of federal DSH matching funds that Texas receives each year, and thus the total program amount, as shown in Table 3.97
Table 3. Funding for the Disproportionate Share Hospital Program in Texas, 1999-2004
Fiscal Year
Federal Matching Funds for DSH
Total DSH Program (Federal and State Funds)
Total DSH as a Percent of Total Texas Medicaid Budget
1999 $950 million $1.52 billion 13.7% 2000 $806 million $1.31 billion 11.2% 2001 $834 million $1.38 billion 11.0% 2002 $856 million $1.43 billion 9.8% 2003 $776 million $1.29 billion 8.3% 2004 $901 million $1.50 billion 8.8%
Adapted from: Texas Health and Human Services Commission, Texas Medicaid in Perspective, 5th ed., 2004, Chapter 5, Tables 5.1, 5.2, Figures 5.5, 5.6, available at http://www.hhsc.state.tx.us/medicaid/reports/ PB5/PinkBookTOC.html, accessed December 12, 2004.
Notes: Federal funding amounts are for federal fiscal years, as is the percent of budget for federal fiscal 1999; total DSH funds as well as the percent of budget for 2000-2004 are for state fiscal years (the federal fiscal year and Texas’ state fiscal year differ by one month). Total DSH column was calculated using percentages from last column (from source Figure 5.5) and annual Medicaid budgets excluding DSH from Table 5.1.
The DSH program in Texas operates within two parameters, an overall state cap on federal funds and a cap on individual hospitals. These caps are set by the federal government, with the overall cap decreasing and increasing as discussed in the previous section on DSH and relevant federal legislation. The hospital-specific cap is determined annually with a formula that takes into account the unreimbursed costs of uninsured patients and Medicaid patients. The cap amount equals the sum of a hospital’s cost of services to uninsured patients (updated for inflation) and its Medicaid shortfall (determined each year by its two-year prior cost report).98 The 14 state-owned hospitals receive DSH reimbursement equal to their cap amounts, and the DSH payments to the remaining hospitals change each year due to the number of qualifying hospitals, how much uncompensated care each hospital has, and the amount of DSH funds available.99 There are no federal or state rules regarding how hospitals can use their DSH funds. After consulting with various hospitals and associations, HHSC recommended that DSH funds received by a hospital be used to maintain or expand existing programs for the indigent, and to create new programs to care for the indigent. The funds can be used for needs such as recruiting physicians, obtaining equipment, and renovating health care facilities. DSH providers must submit community health care needs assessments yearly to show how they are using DSH funds to meet needs in their communities.100 The state has somewhat more flexibility on how to spend DSH matching funds that go to state hospitals.
Upper Payment Limit Program in Texas As described earlier, the Medicaid Upper Payment Limit (UPL) program allows states to reimburse hospitals and some other facilities for eligible uncompensated care provided in Medicaid at a rate that the services would have been reimbursed under Medicare, which usually

B-21
pays more, thus that is the “upper payment limit” in Medicaid. The program is separate from DSH and is financed with both state and local funds like the rest of Medicaid. Texas has a limited UPL plan that makes payments to public hospitals in rural counties under 100,000 population, as well as to the nine large urban public hospital districts.101 The state gets the state portion of the matching funds through intergovernmental transfers from the nine largest hospital districts that are in the UPL plan. These districts received $24.9 million in additional federal funds in FY 2001 and $105 million in FY 2002. Texas’ UPL plan complies with recent federal regulations intended to stop perceived abuses in the program (like federal matching funds being retained by states for non-health purposes), and has gone one step further by requiring that all UPL funds received by the state to be used only for higher payments to hospitals or to support medical teaching facilities.102
History and Financing of SCHIP The current Texas Children’s Health Insurance Program began in May 2000. There was a previous program in place from 1998-2002 that was phased out as Medicaid took over coverage of the enrollees, who were aged 15-18 under 100 percent FPL.103 SCHIP covers children whose families cannot afford health insurance but who have too much income or too many assets to qualify for Medicaid. The federal share for SCHIP is 72.15 percent in Texas for FFY 2004 and the state share is 27.85 percent, meaning the federal government gives Texas $2.59 for every state dollar spent.104 Texas spent almost $330 million on SCHIP in FY 2004, including both federal and state funds. See the following table for SCHIP finances since implementation.
Table 4. Texas Children’s Health Insurance Program Fiscal Trends, 1998-2005
Federal Fiscal Year
Annual Federal
Allotment Total Available Expenditures Balance Returned for
Redistribution
1998 $561,331,521 $561,331,521 $1,308,702 $560,022,819 $0 1999 558,680,510 1,118,703,329 38,533,875 1,080,169,454 0 2000 502,812,459 1,582,981,913 40,981,633 1,542,000,280 170,026,270 2001 452,531,213 1,824,505,223 263,438,317 1,561,066,906 324,454,756 2002 301,839,575 1,538,451,725 535,735,403 1,002,716,323 123,664,391 2003 311,503,988 1,190,555,920 405,630,959 784,924,961 86,297,915 2004 330,851,514 1,029,478,560 329,654,580 699,823,980 57,468,477 2005
(projected) 449,972,119 1,092,327,622 307,371,548 784,956,074 4,132,440
Source: Texas Health and Human Services Commission, “FY 05 Federal Alloc LAR” (Excel spreadsheet, January 2005).
This data indicate that there has been unspent money left over each year since the SCHIP program started, and that money has been returned or is projected to be returned to the federal government for redistribution each year since 2000.
Texas Medicaid Program Information As of October 2004, there were 2,626,469 people enrolled in Medicaid in Texas.105 Children and adults that fit into one of the eligible categories and income groups for coverage can apply for Medicaid in person (required for most adults) or by mail. Eligibility lasts for six months, at which time adults must renew in person and most children can renew by mail (unless they are not up-to-date on their Texas Health Steps check-ups or have not received a Medicaid

B-22
orientation). Recipients of Supplemental Security Income (SSI) automatically receive Medicaid and do not have to apply.106 There are no monthly premiums or copays in Medicaid. See Figure 1 for a chart showing various eligibility groups and the monthly income cut-offs to qualify for Medicaid in 2004.
Figure 1. Medicaid Eligibility in Texas, 2004 Maximum Monthly Countable Income Limit (Family of Three)
Source: Texas Health and Human Services Commission, Texas Medicaid in Perspective, 5th ed. (2004, p. 4-5), available at http://www.hhsc.state.tx.us/medicaid/reports/PB5/PinkBookTOC.html, accessed March 22, 2005.
Notes: “Countable income” is gross income adjusted for allowable deductions, typically work-related. SSI does not certify families of three, SSI certifies only individuals and couples. SSI is not tied to the Federal Poverty Level, but is based on the FBR, as indicated above.
Texas Medicaid provides all of the mandatory services listed previously per federal law, and also provides 36 optional services, 21 of these to all enrollees, and the rest to only children or the elderly.107 See Table 5 for more details on the number of people and average costs of each eligibility group.

B-23
Table 5. Texas Medicaid Recipient Months and Costs per Month by Strategy
Strategy Description 2003 Experienced
2004 Estimates
2005 Budgeted
Aged and Disabled Risk Groups Average aged and Medicare recipient months per month 316,143 320,882 325,375 Average disabled and blind recipient months per month 208,957 221,711 235,235 Average aged and Medicare related cost per recipient months $105.07 $136.17 $160.20 Average disabled and blind cost per recipient months $573.33 $573.13 $542.07 TANF Adults and Children Risk Groups Average TANF adult recipient months per month 116,710 89,927 83,632 Average TANF child recipient months per month 374,821 341,435 326,070 Average TANF adult cost per recipient months $204.50 $215.57 $218.07 Average TANF child cost per recipient months $101.60 $99.99 $95.41 Pregnant Women Risk Group Average pregnant woman recipient months per month 102,736 112,234 128,350 Average pregnant woman cost per recipient months $526.81 $548.09 $564.43 Children and Medically Needy Risk Groups Average child recipient months per month 1,300,952 1,531,141 1,774,322 Average medically needy recipient months per month 45,657 43,731 52,464 Average child cost per recipient months $139.73 $129.23 $127.61 Average medically needy cost per recipient months $626.43 $406.77 $390.24 Health Steps (EPSDT) Medical Average THSteps (EPSDT) medical recipient months per month
605,072 655,417 723,183
Number of newborns receiving hearing screens 381,705 391,298 401,504 Average cost per THSteps (EPSDT) medical recipient months per month
$117.45 $116.76 $122.75
Source: Texas Health and Human Services Commission, HHSC Legislative Appropriations Request (LAR) FY 2006-2007, available at http://www.hhsc.state.tx.us/about_hhsc/finance/FY06-07_LAR/LAR_TOC.html, accessed January 13, 2005.
Note: Table does not include the following Medicaid strategies: STAR+PLUS, Medicare payments, cost reimbursed services, Medicaid vendor drug program, medical transportation, Medicaid family planning; health steps dental and health steps comprehensive care program, and State Medicaid Office.
Medicaid beneficiaries in Texas are enrolled in either traditional fee-for-service (FFS) Medicaid or a Medicaid managed care program, depending on their location and other factors. Managed care is an arrangement where specific health care providers agree to provide coordination and health services to a defined group of people for a specified payment per person. It has four main features that differ from FFS. 1) Managed care has primary care providers (PCPs) that provide a medical home and coordinate care for patients, 2) managed care uses a defined network of providers that the company has contracted with, so patients’ choice of providers is limited, 3) managed care uses utilization review and utilization management to monitor and control services and costs, and 4) capitation is used under managed care to buy health care services at a fixed per person price, therefore the managed care organization is assuming risk if treatment costs rise above the fixed payments.108 Texas uses two different models for managed care delivery, health maintenance organizations (HMO) and primary care case management (PCCM). HMOs are licensed by the Texas Department of Insurance and receive a monthly capitation payment for each enrollee based on an estimate of average medical expenses. PCCM is a non-capitated model where each

B-24
enrollee is assigned a primary care provider (PCP), who must authorize most other services for the person before they will be paid by Medicaid. The state sets up the provider networks and contracts directly with them, and reimbursement is fee-for service, plus a small monthly case management fee for PCPs. Over one-third of Texas Medicaid clients are enrolled in managed care, and nationally, over half of enrollees are in managed care—only three states do not have managed care programs.109 House Bill 7 was passed by the Texas Legislature in 1991 to authorize Medicaid managed care pilot programs to try to control rising health care costs. The first two managed care pilots were implemented in 1993 in Travis County and in the tri-county area of Jefferson, Chambers, and Galveston Counties (three more counties were added to the tri-county pilot in 1995). In 1995, Senate Bill 10 and related legislation was passed to restructure Medicaid statewide and incorporate managed care, and the state accomplished the managed care expansion through 1915(b) waivers. The managed care program, or STAR (State of Texas Access Reform) was expanded again in 1996 to add additional counties and populations.110 In 1997, the STAR program was expanded in Harris County to include acute care and long-term care services for SSI clients, and this pilot is called STAR+PLUS. In 1999, Senate Bill 2896 put a moratorium on further expansion of managed care, after the Dallas and El Paso implementations were finished, and directed HHSC to evaluate Medicaid managed care in Texas (the moratorium was lifted after the evaluation was finished in 2001 and expansion was allowed where cost-effective). Part of the Dallas area project includes a unique behavioral health managed care pilot called NorthSTAR, which provides behavioral health and substance abuse services to Medicaid enrollees and certain other people below 200 percent FPL.111
Texas SCHIP Program Information As of November 1, 2004, there were 340,101 children enrolled in SCHIP in Texas.112 Parents can mail in an application for SCHIP for their children or apply over the phone, and most children must wait 90 days before their benefits can begin.113 If approved, parents must choose a health plan (if there is more than one to choose from in their location) and a primary care doctor for their enrolled children. SCHIP benefits last for six months, at which time parents need to send in a renewal form for their children if they remain eligible. Renewal can be done through the mail—parents either sign a form saying there have been no changes to their income or expenses in the last six months, or note any changes and send in proof with the renewal form.114 If approved, families pay from $15-$25 a month total in premiums for all their children who qualify, depending on income levels, and some people may qualify to pay no premiums. Beneficiaries pay from $3-$10 per office visit and $3-$20 per prescription, though some may be eligible to pay no copayments.115 As of November 1, 2004, monthly premiums for SCHIP are temporarily suspended. A Governor’s Directive was issued on August 11, 2004, to HHSC to request that it delay the implementation of a plan to disenroll families who had missed three or more premium payments, and to study effective alternatives for cost-sharing. Since it would not be fair for some families to not pay their premiums and still be eligible for services, while others with the same income levels continued to pay, HHSC suspended premium payments (not copayments for services) for all enrollees.116 See the following table for the number of children in SCHIP each year since the current program started and their total costs.
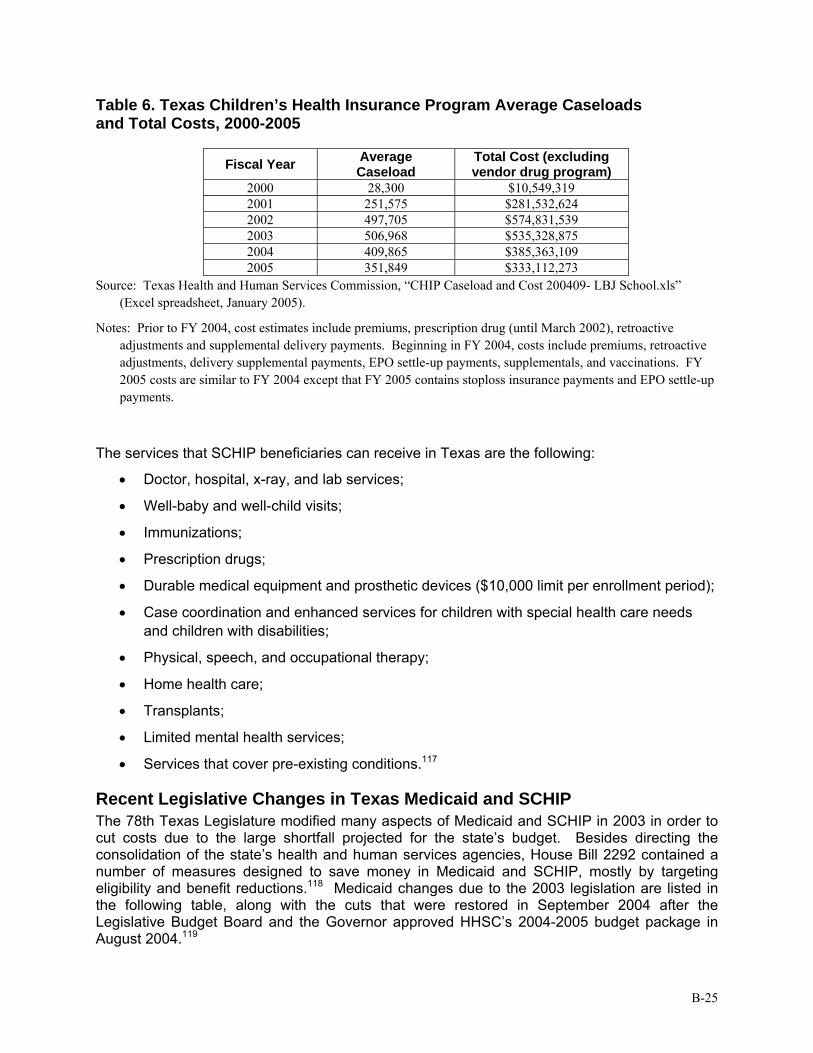
B-25
Table 6. Texas Children’s Health Insurance Program Average Caseloads and Total Costs, 2000-2005
Fiscal Year Average Caseload
Total Cost (excluding vendor drug program)
2000 28,300 $10,549,319 2001 251,575 $281,532,624 2002 497,705 $574,831,539 2003 506,968 $535,328,875 2004 409,865 $385,363,109 2005 351,849 $333,112,273
Source: Texas Health and Human Services Commission, “CHIP Caseload and Cost 200409- LBJ School.xls” (Excel spreadsheet, January 2005).
Notes: Prior to FY 2004, cost estimates include premiums, prescription drug (until March 2002), retroactive adjustments and supplemental delivery payments. Beginning in FY 2004, costs include premiums, retroactive adjustments, delivery supplemental payments, EPO settle-up payments, supplementals, and vaccinations. FY 2005 costs are similar to FY 2004 except that FY 2005 contains stoploss insurance payments and EPO settle-up payments.
The services that SCHIP beneficiaries can receive in Texas are the following:
• Doctor, hospital, x-ray, and lab services;
• Well-baby and well-child visits;
• Immunizations;
• Prescription drugs;
• Durable medical equipment and prosthetic devices ($10,000 limit per enrollment period);
• Case coordination and enhanced services for children with special health care needs and children with disabilities;
• Physical, speech, and occupational therapy;
• Home health care;
• Transplants;
• Limited mental health services;
• Services that cover pre-existing conditions.117
Recent Legislative Changes in Texas Medicaid and SCHIP The 78th Texas Legislature modified many aspects of Medicaid and SCHIP in 2003 in order to cut costs due to the large shortfall projected for the state’s budget. Besides directing the consolidation of the state’s health and human services agencies, House Bill 2292 contained a number of measures designed to save money in Medicaid and SCHIP, mostly by targeting eligibility and benefit reductions.118 Medicaid changes due to the 2003 legislation are listed in the following table, along with the cuts that were restored in September 2004 after the Legislative Budget Board and the Governor approved HHSC’s 2004-2005 budget package in August 2004.119

B-26
Table 7. Texas Medicaid Policy Changes, 2003-2004
Legislation in 2003 Changes in 2004 Continued coverage for all children currently eligible for Medicaid Maintained the continuous eligibility period for children at six months Allowed more thorough procedures to verify assets to be implemented (e.g., information from consumer reporting agencies, appraisal districts, or vehicle registration records)
Required a personal interview for initial eligibility determination if requested by the applicant; otherwise allowed a personal interview for initial eligibility determination only if eligibility cannot be determined through mail correspondence
Required a personal interview for recertification of eligibility if requested by the recipient; otherwise allowed a personal interview to renew coverage if eligibility cannot be determined through a telephone interview or mail correspondence
Allowed establishment of cost-sharing (i.e., co-pays and monthly premiums) based on federal maximum levels
Required that adult cash assistance recipients comply with the personal responsibility agreement to continue to receive Medicaid coverage
Discontinued coverage for adult pregnant women above 158% of the federal poverty level
Coverage up to 185% FPL was restored
Discontinued coverage for non-pregnant adult clients with incomes above 17% of the federal poverty level (medically needy spend-down)
Allowed establishment of prior authorization requirements for high-cost medical services
Directed the implementation of “disease management” efforts Required that medical assistance be delivered through the most cost-effective method of managed care throughout the state and that guidelines for appropriate usage of out-of-network providers be established
HHSC determined that the HMO model should be used in urban areas and PCCMs in all remaining areas not served by HMOs, and dual-model arrangements be eliminated.
Directed that a Preferred Drug List (PDL) be implemented, with prior authorization required for prescribed drugs not on PDL
Allowed establishment of four brand-name and 34-day brand-name supply limits for clients previously eligible for unlimited prescriptions (does not affect current three-prescription limits for certain clients)
Discontinued coverage for certain optional Medicaid services for adults over age 21: eyeglasses, hearing aids, podiatric, chiropractic, psychological services (from psychologists, therapists, counselors, and social workers)
Established a statutory basis for estate recovery of Medicaid expenditures pursuant to federal requirements
Discontinued reimbursement of Graduate Medical Education (GME) GME Medicaid funds were restored to teaching hospitals
Decreased reimbursement rates by 5% for Medicaid acute care providers such as physicians, hospitals, and HMOs; Decreases reimbursement rates by 2.2% to 3.5% for non-acute care providers such as nursing homes, community care providers and ICF-MR providers
Did not reverse cuts but prevented deeper cuts from taking place: doctor’s rates were cut by 2.5%, nursing homes by 1.75%, and community care providers by 1.1% in 2004, and these were set to double in 2005 (hospital cuts remain at 5%)
Sources: Texas Health and Human Services Commission, Medicaid Policy Changes, 78th Legislature, Regular Session, 2003 (August 2003), available at http://www.hhsc.state.tx.us/news/post78/Medicaid_Policy_ Changes.html, accessed January 2, 2004; Center for Public Policy Priorities, Update on Medicaid and CHIP Cuts: What Was Restored in Recent Actions? (September 2004), available at http://www.cppp.org/ products/PP217.html, accessed January 2, 2005; and Texas Senate Health and Human Services Committee, Interim Report to the 79th Legislature (December 2004, p. 17), available at http://www.senate.state.tx.us/75r/ senate/commit/c610/downloads/rpt_c610_dec2004.pdf, accessed January 12, 2005.

B-27
As mentioned in the table above, funding for the Medically Needy spend-down program for parents with dependent children was discontinued in House Bill 2292. (It is inactive with the option of continuing it if sufficient funds are available.) The non-spend-down portion of the Medically Needy program is still in place (people entitled to Medicaid due to low income) as well as spend-down for pregnant women and children. The spend-down part of the program allows temporary Medicaid coverage for pregnant women and children (and before 2003 also included non-aged, non-disabled parents or caregivers with dependent children) with high medical bills who make too much to qualify for Medicaid but whose earnings after medical bills are subtracted would be reduced to qualifying levels. The qualifying level for a family of three is currently $275 in income per month or less, as shown in Figure 1, as well as $2000 or less in assets.120 A bill has been introduced in the 79th Texas Legislature (2005) to restore the Medically Needy program to pre-2003 levels. The fiscal note by the Texas Legislative Budget Board states the following regarding the impact of restoring this program: “HHSC projects that reestablishing the Medically Needy program would cost $241.3 million in All Funds ($94.9 million GR) in 2006 and $276.4 million in All Funds ($109.2 million GR) in 2007, with costs increasing in subsequent years. HHSC projects that the increase in average monthly recipient months (clients) would be 10,118 in 2006, 10,918 in 2007, 11,796 in 2008, 12,745 in 2009, and 13,769 in 2010.”121 Many cuts were also made in the SCHIP program by the 78th Legislature in order to reduce the state budget. These changes as well as some of the cuts that were subsequently reversed are listed in the following table. These changes resulted in a dramatic drop in SCHIP enrollees in Texas after they were implemented, from 507,259 children enrolled as of September 2003 to 358,230 enrolled as of June 2004.122 The number of enrollees had grown after the 77th Legislature in 2001 passed changes to simplify the program and align it closer with Medicaid enrollment, and make it easier to enroll and renew.123

B-28
Table 8. Texas SCHIP Policy Changes, 2003-2004
Legislation in 2003 Changes in 2004 Continued coverage for all currently covered populations, including state-funded populations
Maintained income eligibility at 200% of Federal Poverty Level ($36,800 for a family of four)
Eliminated deductions to income so that eligibility is based on gross income
Restricted eligibility for families at or above 150% of Federal Poverty Level to those with assets within allowable levels (no assets test previously)
Allowed establishment of cost-sharing (i.e., co-pays and monthly premiums) at federal maximum levels
Changed term of coverage (continuous eligibility period) from 12 months to 6 months
Established a 90-day waiting period between eligibility determination and coverage (no waiting period previously)
Reduced provider payment rates by 5% Some rate cuts have been changed from 5% to 2.5%
Directed that a Preferred Drug List (PDL) be implemented, with prior authorization required for prescribed drugs not on the PDL
Limited the benefit package to coverage of basic health care services
Notes: HHSC has limited authority to expand the benefit package if it remains budget-neutral; HHSC is also authorized to develop alternate financing and service delivery methods for behavioral health services.
Most behavioral health services were discontinued, except for one outpatient diagnostic visit per enrollment period, six medication management visits per enrollment period, and consultation in an inpatient or emergency setting after stabilization of an emergency condition
Some substance abuse and mental health services were restored in 2004 (effective retroactively to Sept. 1, 2003) due to concerns from the federal government.*
These services were discontinued: dental, hospice care, skilled nursing facilities, tobacco cessation programs, vision benefits (including eyeglasses and exams), chiropractic
Sources: Texas Health and Human Services Commission, CHIP Policy Changes, 78th Legislature, Regular Session, 2003 (September 2003), available at http://www.hhsc.state.tx.us/news/post78/CHIP_Policy_Changes.html, accessed January 2, 2004; and Center for Public Policy Priorities, Update on Medicaid and CHIP Cuts: What Was Restored in Recent Actions? (September 2004), available at http://www.cppp.org/products/PP217.html, accessed January 2, 2005.
* For more on substance abuse and mental health cuts in SCHIP, see Kaiser Family Foundation, Daily Health Policy Report, State Watch: Texas To Partially Restore CHIP Program Coverage of Mental Health, Substance Use Treatment (October 22, 2003), available at http://www.kaisernetwork.org/daily_reports/rep_index.cfm?hint= 3&DR_ID=20489, accessed January 5, 2005.
A number of groups have been working to restore the cuts made to SCHIP, such as Texas Impact and the Community Action Network.124,125 Recommendations have been made and bills have been filed for the 79th Texas Legislature in 2005 that aim to restore previous cuts, change other aspects of the program, or to maintain some of the previous changes. For example, the

B-29
Transition Legislative Oversight Committee made these five SCHIP recommendations in a report to the legislature in December 2004: 1) maintain six-month continuous eligibility, 2) maintain the assets test that took effect in 2004, 3) restore dental and vision benefits, 4) increase co-payments and link them directly to service benefits, and 5) require a single enrollment fee instead of monthly premiums.126 Other bills have been filed to help with SCHIP funding, such as a cigarette tax with part of the proceeds going to restore SCHIP cuts.127 Several other measures were mandated by the 78th Texas Legislature to control Medicaid costs as well as enhance the effectiveness and quality of the program. These included the study and implementation of a Preferred Drug List within the Medicaid Vendor Drug Program and Disease Management guidelines for people with certain chronic diseases.128
Waivers and Other Expansion Initiatives in Texas
Current Situation Texas currently has five 1915(b) waivers for Medicaid managed care and hospital contracting and seven 1915(c) waivers for home and community-based services.129 Texas does not have an 1115 waiver. The state applied for an 1115 waiver in August 1995 after studying the options for controlling the state’s rapidly escalating Medicaid costs. This waiver would have expanded Medicaid coverage, eligibility, and managed care. The waiver was not approved by the U.S. Health and Human Services Department for a variety of reasons, and a subsequent smaller 1115 waiver submitted in October 1996 addressing children’s health care was later abandoned due to the coming of SCHIP.130 Texas Senate Bill 1156 was passed in 2001 authorizing the Texas Health and Human Services Commission (HHSC) to pursue a variety of changes and improvements in Medicaid, but it was vetoed by Governor Perry. Had it become law, it would have allowed HHSC to apply for an 1115 waiver to expand access to family planning and preventive services for women up to 185 percent FPL. Even though it would expand coverage, it was projected to save the state funds due to the enhanced 90 percent matching rate for family planning services and the fact that this population is eligible for Medicaid when pregnant.131 Work on a family planning waiver had been done before this bill, and a similar bill was introduced in 2003 but did not make it out of committee. A women’s health and family planning waiver is currently being considered in the 79th Texas Legislature (2005).
New Waivers Submitted or under Consideration The state has a number of expansion initiatives currently under consideration. HHSC submitted an 1115 HIFA waiver to CMS for a SCHIP premium assistance program in December 2004, and if approved, the program would begin on October 1, 2005.132 This SCHIP buy-in program, authorized by House Bill 3038 of the 77th Texas Legislature and Senate Bill 240 of the 78th Legislature, would allow state and federal SCHIP funds to be used to pay part of the premiums to enroll eligible individuals into private health insurance plans. (Texas already has a premium assistance program in place for Medicaid, called HIPP, or the Health Insurance Premium Payment program.133) The HIFA waiver would create a premium assistance option for SCHIP-eligible children and family members, if cost-effective. A flat subsidy amount would be available to all eligible children and families up to 200 percent FPL. The subsidy amount would be set at 5 percent less than the average cost per child, minus a per-child administrative cost; this is how the program will achieve budget neutrality.134 The premium assistance option is expected to cover about 9,504 people.135 Because this expansion could actually require higher cost-sharing for

B-30
families (through the employer’s plan), it may only appeal to individuals who are eager to keep their families in the same plan.136 (Note: a similar waiver done as an 1115 research and demonstration project would have to among other things maintain cost-sharing at SCHIP levels.) There are three 1115 waivers for city-level demonstration projects authorized by House Bill 3122 of the 78th Legislature that have not been formally submitted to CMS yet, though there are plans to do so. The HB 3122 Task Force was created through this bill to explore the feasibility of the development of local expansion waivers that would seek to use local funds for the state Medicaid match to draw additional federal Medicaid matching funds to their areas.137 General outlines of these waivers were submitted for preliminary review, and CMS responded that more discussion would be needed on the proposals, especially on the subject of limited enrollment options.138 Currently the El Paso County Hospital District, Austin/Travis County, and Bexar County Hospital District local waivers are under review by this task force. These waivers propose to use the additional federal dollars that the local match would obtain to fund local programs to cover uninsured low-income parents not currently eligible for other programs. The proposed Austin/Travis County waiver intends to expand designated Medicaid services to optional adults — TANF (non-disabled, 18-64) adults with dependent children. This waiver would include coverage of permanent, legal U.S. residents living in Travis County with incomes between 17 and 100 percent FPL. Budget neutrality is to be achieved through savings from implementing a reduced benefit package, and by providing a medical home, pharmaceutical management, and reduced ER visits. Savings are expected to be approximately $565,000 in year one to over $1,400,000 in year five.139 The Bexar County Hospital District waiver would involve a Medicaid expansion for adult health care services to needy parents (aged 21 to 64) of children on Medicaid to promote independence from welfare by providing a health care safety net for working poor between 14.4 and 100 percent FPL (optional population). The waiver proposes the use of an existing Medicaid HMO. Reenrollment would be required at 12 months. The waiver would seek to waive statewideness, freedom of choice, and cost-sharing. Budget neutrality is expected to be met through savings achieved by providing services through a medical home and using continuous eligibility versus the existing Medicaid program. Savings are expected to be $272,000 in year one and projected to be $4,418,000 over the five-year waiver period. Planners project enrollment of 2,500 participants in year one with annual increases to an enrollment of 5,000 in year five.140 The El Paso County Hospital District Waiver would expand Medicaid coverage to TANF and SCHIP adults (21 to 64 years) in the El Paso service delivery area between 14.4 and 200 percent FPL. The waiver would also restore the medically needy program for this area, and may try to expand coverage to a “select number of childless adults” (ages 21-64).141 This waiver program would utilize an existing managed care model in the service delivery area for the TANF/SCHIP adults and would use a fee-for-service model for the medically needy program. The waiver would use health risk assessments, preventive services, simplified and continuous enrollment, and promotores to help achieve budget neutrality. Matching funds would come from funds currently earmarked for the hospital district’s public hospital.142 Other waiver initiatives in the state over the past few years included an HIV waiver and a disability waiver. Both of these waivers would have extended Medicaid coverage to persons within these targeted populations. However, waiver focus at the federal level has shifted away from disease-specific waivers and instead has concentrated efforts on HIFA-type waivers. Neither the disability or HIV waiver proposals are currently “alive.”

B-31
As noted previously, a women’s health waiver (which would receive the 90 percent match for qualified family planning services) has been developed and considered at various times over the past several years. Legislation is not necessarily needed for HHSC to pursue such a waiver, provided HHSC, the Governor, and the Legislative Budget Board agree to the program. In the 79th Texas Legislature (2005), legislation has been introduced to educate decision-makers and to build support for the concept. Waiver proponents suggest that had the 2001 legislation been implemented, Texas would have saved $122 million in fiscal year 2005.143 See Appendix C for a fiscal analysis of the current women’s health bill. This analysis by the Legislative Budget Board concludes that the demonstration project as introduced in Senate Bill 747 would have “a positive impact of $135,207,202 through the biennium ending August 31, 2007.” Women’s health proposals seek to take advantage of the 90 percent federal Medicaid match as well as the “cost-beneficial nature of family planning services” to expand women’s health and family planning services to millions of low-income and uninsured women at or below 185 percent FPL.144 Waiver proponents point out that less than 25 percent of the over 4 million eligible women in Texas (at or below 185 percent FPL) receive care because of the lack of affordable care and/or affordable insurance, because the Medicaid income eligibility level for non-pregnant women is currently much lower. The waiver is expected to meet budget-neutrality requirements, and to produce significant cost savings, as the costs for services would be offset by savings from otherwise Medicaid-paid prenatal care, deliveries, and newborn care. Additional cost savings are expected due to early detection and treatment of breast and cervical cancers.
Impact of Initiatives and Strategies for Texas
Possible Federal Changes The Bush Administration and Mike Leavitt, Secretary of the Department of Health and Human Services, want to make major changes to Medicaid in the next year. A conversion to block grants has been one of the proposals in the past. As discussed in a previous section, critics argue that block grants create inequities for low-income people who are no longer guaranteed coverage even if they qualify due to imposed caps, and they discriminate against fast-growing states because federal funding would be locked in to certain fixed amounts. Planned periodic increases in the grants may not correspond to the growth in population or be responsive to higher costs, spending levels, or economic downturns in a state. And for states with a relatively low level of expenditure using historic allocations for the future base can be particularly unfair. If on the other hand federal funds were allocated based on the number of low-income persons in the state or some similar method there might be a circumstance under which block grants would make short-term sense in a state like Texas. In addition to the FMAP floor issue discussed in the federal section (the 50 percent minimum for matching being an indirect subsidy to richer states), people have argued that a state’s number of people in poverty should be a factor in the formula for a state’s matching rate instead of the state’s average income.145
Leveraging Local Funds There are thousands of local governmental units in Texas and many spend money on health care services for the uninsured. One idea that keeps coming up is to find a way to use these local dollars as part of the state match for Medicaid or SCHIP in order to draw down additional matching federal funds. There are several federal restrictions on using local money for the state match, but it can be done if it meets the following criteria: 1) at least 40 percent of the state

B-32
share of the match must come from the state (so 60 percent can be local), 2) federal dollars such as grant money cannot be used for the state match, and 3) limitations on voluntary contributions and provider-specific taxes (no contributions allowed and provider taxes can comprise no more than 25 percent of the state match).146 The Centers for Medicare and Medicaid Services (CMS) has indicated that it will give states flexibility with waiver design, but any proposed geographic variability in services, such as might happen with matching local funds, must meet certain criteria and will be handled on a case-by-case basis. No currently approved HIFA waivers leverage local funding, but six states require local governments to help finance Medicaid service costs, four require them to help with administrative costs, and 12 require both (Texas does not require any local participation). Government officials interested in leveraging local funds should do the following: 1) quantify the amount spent by local governments on health care for the uninsured, 2) develop a conceptual model for the expansion and present it for comments, 3) solicit public input, and 4) obtain formal approval from CMS.147 The following table provides financial information for the hospital districts in the five largest urban areas in Texas (not counting the new the Austin/Travis County hospital district). Though these entities represent a majority of the local funding collected for health care, not included here are over 100 smaller hospital districts and public hospitals, and over 100 county indigent health care programs, which counties are required to have if they are not part of a hospital district.
Table 9. Funding Information for Five Large Hospital Districts, FY 2002
Hospital/Hospital District Total Revenue Revenue from Local Property
Taxes Transferred to State for DSH
Net Revenue from DSH
Harris County Hospital District (Harris County)
$588,100,000 $315,600,000 $116,093,329 $25,367,343
JPS Health Network (Tarrant County)
$309,668,000 $170,557,000 $22,759,514 $26,749,572
Parkland Health and Hospital System (Dallas County)
$743,528,000 $310,236,000 $100,442,003 $51,438,695
Thomason General Hospital (El Paso County)
$176,229,032 $36,346,435 $26,936,630 $14,037,343
University Health System (Bexar County)
$371,749,000 $124,078,000 $56,842,156 $19,341,187
Sources: first two columns: Morningside Research and Consulting, Inc., Comparison of Texas Hospital District Costs, Report to the Technical Advisory Committee (August 2002, p. 6), available at http://www.morningsideresearch.com/HDComparisonAug29.pdf, accessed January 5, 2005. Second two columns: Texas Health and Human Services Commission, “Final Non-State DSH Hospitals, 2002” (Excel spreadsheet).
Local entities in addition to the three local 1115 waivers described previously are considering how to draw down more Medicaid funding. Dallas County Hospital District, for example, hired Health Management Associates, who reported that if the State Medicaid Plan could be reworked, the $110 million the hospital district spent on low-income health services in unmatched local funds could be matched by an additional $225 million in federal money. Strategies they believe could draw down additional funds include the following:

B-33
1) Increasing Parkland Hospital’s charge structure could draw down up to $16 million in additional federal funds through the Upper Payment Limit program.
2) Using SCHIP funds to provide prenatal care to undocumented immigrants to pay for prenatal care (currently being paid entirely from local funds)—seven other states currently have such plan amendments approved by CMS. Health Management Associates estimates this could yield an additional $7 to $9 million.
3) Increasing Medicaid payments to physicians affiliated with Parkland Hospital would bring in an unspecified amount (this would require an agreement with the University of Texas Southwestern Medical Center that this would reduce its need for funding from the hospital district).
4) Increasing rates for Parkland Health and Hospital System’s HMO is estimated to bring in $5.6 million with a 5 percent increase in premiums.
5) Dallas County could pay the state share of Medicaid UPL payments to private DSH hospitals in Dallas County. Health Management Associates estimates that the available UPL capacity of these private DSH hospitals is about $412 million.148
Medicaid and SCHIP Expansion Options for Texas
Sections 1931 and 1902(r)(2) One of the easiest mechanisms Texas could use to expand coverage is to take advantage of Section 1931 and/or Section 1902(r)(2) of the Social Security Act. As described previously, Section 1931 of the SSA allows states to extend Medicaid coverage to low-income families with children (above the TANF limits) by income and asset disregards. To expand coverage to these parents, all that is needed is an amendment to the State Medicaid Plan, and this method allows the state to cap enrollment and to alter the benefits. Similarly, Section 1902(r)(2) allows a state to use less restrictive income and resource methodologies when determining eligibility for Medicaid. This can also be done through a state plan amendment. Both of these options require additional state general revenue (GR) match dollars.
Women’s Health Waiver As mentioned previously, a women’s health waiver has been proposed and is being considered in the 2005 Texas Legislature. This would expand women’s health and family planning services to millions of women at or below 185 percent FPL, and would receive a 90 percent federal Medicaid match for qualified family planning services. Appendix C contains a fiscal analysis of the current women’s health bill by the Legislative Budget Board that concludes that the demonstration project as introduced in Senate Bill 747 would save the state over $135 million through the biennium ending August 31, 2007.
Elimination of Income Disregards/Assets Tests for SCHIP The 78th Texas Legislature implemented a number of policy changes that led to a decline in the number of SCHIP-covered children in Texas. Among these changes were the elimination of income disregards and the implementation of asset testing. In order to expand coverage Texas could eliminate these recent changes.

B-34
Reinstating the Medically Needy Spend-Down Eligibility for Parents As noted previously, funding for the Medically Needy spend-down program for parents with dependent children was discontinued in 2003, leaving a spend-down option only for pregnant women and children. The spend-down part of the Medically needy program allows temporary Medicaid coverage for pregnant women and children (and before 2003 also included non-aged, non-disabled parents or caregivers with dependent children) with high medical bills who make too much to qualify for Medicaid but whose earnings after medical bills are subtracted would be reduced to qualifying levels. A bill has been introduced in the 2005 Texas Legislature to restore the Medically Needy program to pre-2003 levels in order to offer coverage to families with serious medical problems who need it most. The fiscal note to House Bill 710 states the restoring these benefits is estimated to cost $241.3 million in All Funds ($94.9 million GR) in 2006 and $276.4 million in All Funds ($109.2 million GR) in 2007, with increases in subsequent years, and that the people served (in average monthly recipient months) would be 10,118 in 2006, 10,918 in 2007, 11,796 in 2008, 12,745 in 2009, and 13,769 in 2010.149
Hypothetical 1931/HIFA Another expansion option for Texas takes advantage of the flexibility afforded in HIFA waivers to expand to both the 1931 (optional) population and to an additional (expansion) population of non-disabled, childless adults. Basing the HIFA cost savings on a hypothetical 1931 expansion to the full Medicaid package of benefits (that would be more costly to the federal government for less coverage), the state could offer a reduced benefit package to the 1931 population and with the “savings” cover additional childless adults.150 See Appendix D for more details and estimated costs and impacts of possible alternatives. Also, note that if this waiver option were implemented, the Medically Needy spend-down eligibility could be extended to adults not living with dependent children, which could help reduce uncompensated care in hospital emergency rooms and help fund trauma care.
Ticket to Work The Ticket to Work Program, established in 1999 through the Ticket to Work and Work Incentives Improvement Act, was designed to support individuals with disabilities in their employment and help with employment retention efforts using infrastructure and demonstration grants to provide Medicaid and other services to eligible individuals. Texas was approved by CMS in 2001 for a demonstration grant to initiate a Ticket to Work project in two urban areas, Harris and Tarrant counties. The project would have provided Medicaid services (a somewhat reduced benefit package) to working individuals with schizophrenia, bipolar disorder or major depression, ages 18 to 64, who were not yet able to meet the SSI disability test.151 However, the 78th Legislature did not appropriate the state matching funds for the expansion project.
Covering Legal Permanent Residents The Personal Responsibility and Work Opportunity Reconciliation Act of 1996 (PRWORA) required states to implement a five-year wait period for legal permanent residents arriving after August 1996 to receive Medicaid or SCHIP. The act left it to the states’ discretion to allow coverage after the five years. To date, Texas has not taken advantage of this coverage expansion option. This option requires only a state plan amendment.
Prenatal Care under SCHIP Texas could submit an amendment to the SCHIP State Plan that would allow the state to expand SCHIP eligibility to unborn children who meet certain criteria, regardless of the eligibility status of the mother, including unborn children of low-income undocumented pregnant women. These women and unborn children could receive prenatal care and other related services.

B-35
Safety-net hospitals throughout the state already provide prenatal care to some of this population using local dollars, so having SCHIP cover them would allow federal matching funds to be obtained to cover a majority of these expenses. The definition of “child” for SCHIP purposes was revised by CMS effective November 1, 2002, to include children from conception (instead of birth) to age 19, allowing for this opportunity to extend prenatal care to more women.152,153 Seven states already cover this population for prenatal care.154
Other SCHIP/Medicaid Premium Assistance Programs Texas could develop a new public-private partnership model in which a health plan is developed specifically for small businesses. Such plans use either a state-designated board or a private insurer to administer the plan, and the state subsidizes premiums for low-income workers. This model is similar to Maine’s Dirigo Health. These plans can, using a waiver, reduce the benefit package, and take advantage of Medicaid or SCHIP funds.155
Other Options Several states, such as Florida, are proposing a fundamental restructuring of their Medicaid programs to control growing costs. Florida Governor Jeb Bush recently outlined a program where the state would pay the premiums for Medicaid beneficiaries to enroll in private health plans offered by insurance companies and HMOs, including an employer’s plan if a beneficiary has access to employer-sponsored insurance. Gov. Bush said the state can predict and control costs better by calculating a premium for each Medicaid patient and allowing for an appropriate rate of growth. Since the state would pay the health plans instead of the providers directly, this new government-funded insurance program would have to be approved by the state and the federal government, and the governor hopes to get these approvals by the end of 2005. He said it is not clear yet whether federal approval will include a cap on federal funds and if so, if the state or patients would be required to pay more if costs increase more than expected.156 In the Florida proposal, the private plans would set limits on care and coverage, and savings is expected to come from competition between plans for patients. Basic services covered currently (mandatory and optional Medicaid services) would still be covered, and health plans could offer additional services to attract patients, giving them a choice on the best plans for their health situations. Beneficiaries who take responsible health measures, like participating in disease management programs or immunizing their children, could earn credit for enhanced Medicaid services like over-the-counter drugs. There would be a cap on Medicaid benefits to decrease some of the financial risk for insurers, and patients who reached the cap would be covered by a catastrophic care fund created from a percentage of premiums.157 A concept paper was published in March 2005 outlining the proposed reforms,158 and legislation is being considered by a committee of the Florida House of Representatives to allow the state to apply for an 1115 waiver to implement some of the changes.159 More ideas for dramatic changes to Medicaid are likely to be developed by states as many struggle with rapidly growing costs.
Acknowledgments
The authors wish to thank the following people for their help with this project: the members of the Task Force on Access to Health Care in Texas, Kristine Niemeyer (LBJ School of Public Affairs), Anne Dunkelberg (Center for Public Policy Priorities), Olga Garcia (HHSC), Tracy Henderson (HHSC), Mike Hudson (The Health Policy Group), and Charles Begley (School of Public Health, University of Texas Health Science Center – Houston).

B-36
Endnotes 1 Texas Health and Human Services Commission, Texas Medicaid in Perspective, 5th ed., 2004 (p. 3-6), available at http://www.hhsc.state.tx.us/medicaid/reports/PB5/PinkBookTOC.html, accessed November 11, 2004; and Centers for Medicare and Medicaid Services, Medicaid: A Brief Summary, available at http://www.cms.hhs.gov/ publications/overview-medicare-medicaid/default4.asp, accessed November 11, 2004.
2 Texas Health and Human Services Commission, Texas Medicaid in Perspective, 5th ed., 2004 (p. 1-1), available at http://www.hhsc.state.tx.us/medicaid/reports/PB5/PinkBookTOC.html, accessed November 11, 2004.
3 Alan Weil, “There’s Something about Medicaid,” Health Affairs, vol. 22, no. 1 (January/February 2003, pp. 13-30), available at http://content.healthaffairs.org/cgi/reprint/22/1/13, accessed November 14, 2004.
4 Ibid.
5 Centers for Medicare and Medicaid Services, Managed Care Trends, available at http://www.cms.hhs.gov/ medicaid/managedcare/trends03.pdf, accessed November 14, 2004.
6 Alan Weil, “There’s Something about Medicaid,” Health Affairs, vol. 22, no. 1 (January/February 2003, pp. 13-30), available at http://content.healthaffairs.org/cgi/reprint/22/1/13, accessed November 14, 2004.
7 Centers for Medicare and Medicaid Services, Managed Care Trends, available at http://www.cms.hhs.gov/ medicaid/managedcare/trends03.pdf, accessed November 14, 2004.
8 Centers for Medicare and Medicaid Services, A Profile of Medicaid: Chartbook 2000 (p. 52), available at http://www.cms.hhs.gov/charts/medicaid/2Tchartbk.pdf, accessed November 14, 2004.
9 Robert E. Hurley and Stephen A. Somers, “Medicaid and Managed Care: A Lasting Relationship?” Health Affairs, vol. 22, no. 1 (January/February 2003, pp. 77-88), available at http://content.healthaffairs.org/cgi/reprint/22/1/77, accessed November 14, 2004.
10 Centers for Medicare and Medicaid Services, Medicaid Eligibility, available at http://www.cms.hhs.gov/medicaid/ eligibility/criteria.asp, accessed November 11, 2004; and Centers for Medicare and Medicaid Services, Medicaid At-a-Glance 2003, available at http://www.cms.hhs.gov/states/maag2003.pdf, accessed November 11, 2004.
11 Ibid.
12 Centers for Medicare and Medicaid Services, Medicaid Eligibility, available at http://www.cms.hhs.gov/medicaid/ eligibility/criteria.asp, accessed November 11, 2004; and Centers for Medicare and Medicaid Services, Medicaid At-a-Glance 2003, available at http://www.cms.hhs.gov/states/maag2003.pdf, accessed November 11, 2004.
13 Centers for Medicare and Medicaid Services, Medicaid At-a-Glance 2003, available at http://www.cms.hhs.gov/ states/maag2003.pdf, accessed November 11, 2004.
14 Kaiser Commission on Medicaid and the Uninsured, “Chapter 3, Medicaid Financing,” in The Medicaid Resource Book, available at http://www.kff.org/medicaid/2236-index.cfm, accessed November 28, 2004.
15 Centers for Medicare and Medicaid Services, Medicaid: A Brief Summary, available at http://www.cms.hhs.gov/ publications/overview-medicare-medicaid/default4.asp, accessed November 11, 2004.
16 Ibid.
17 Ibid.

B-37
18 Kaiser Commission on Medicaid and the Uninsured, “Chapter 3, Medicaid Financing,” in The Medicaid Resource Book, available at http://www.kff.org/medicaid/2236-index.cfm, accessed November 29, 2004.
19 Texas Health and Human Services Commission, Texas Medicaid in Perspective, 5th ed., 2004 (p. 3-7), available at http://www.hhsc.state.tx.us/medicaid/reports/PB5/PinkBookTOC.html, accessed November 12, 2004.
20 Centers for Medicare and Medicaid Services, State Medicaid Manual, Chapter 4, Services (sec. 4270.B), available at http://www.cms.hhs.gov/manuals/45_smm/sm_04_4_4270_to_4390.1.asp, accessed December 7, 2004.
21 Centers for Medicare and Medicaid Services, State Medicaid Manual, Chapter 4, Services (sec. 4270.B.1), available at http://www.cms.hhs.gov/manuals/45_smm/sm_04_4_4270_to_4390.1.asp, accessed December 7, 2004.
22 Centers for Medicare and Medicaid Services, State Medicaid Manual, Chapter 4, Services (sec. 4270.B.2), available at http://www.cms.hhs.gov/manuals/45_smm/sm_04_4_4270_to_4390.1.asp, accessed December 7, 2004.
23 Centers for Medicare and Medicaid Services, State Medicaid Manual, Chapter 4, Services (sec. 4430), available at http://www.cms.hhs.gov/manuals/45_smm/sm_04_4_4395_to_4435.4.asp#_toc490379579, accessed December 7, 2004.
24 Centers for Medicare and Medicaid Services, Net Reported Medicaid and SCHIP Expenditures, FFY 1997-2001, available at http://www.cms.hhs.gov/medicaid/mbes/sttotal.pdf, accessed November 14, 2004.
25 Alan Weil, “There’s Something about Medicaid,” Health Affairs, vol. 22, no. 1 (January/February 2003, pp. 13-30), available at http://content.healthaffairs.org/cgi/reprint/22/1/13, accessed November 14, 2004.
26 Office of Management and Budget, Historical Tables, Budget of the United States Government, Fiscal Year 2005 (Table 16.1), available at http://www.whitehouse.gov/omb/budget/fy2005/pdf/hist.pdf, accessed December 8, 2004.
27 Alan Weil, “There’s Something about Medicaid,” Health Affairs, vol. 22, no. 1 (January/February 2003, pp. 13-30), available at http://content.healthaffairs.org/cgi/reprint/22/1/13, accessed November 14, 2004.
28 U.S. General Accounting Office, Medicaid: The Texas Disproportionate Share Program Favors Public Hospitals, Report to the Honorable Ronald D. Coleman, House of Representatives, GAO/HRD-93-86 (Washington, D.C., March 1993), pp. 1, 3.
29 Kaiser Commission on Medicaid and the Uninsured, “Chapter 3, Medicaid Financing,” in The Medicaid Resource Book, available at http://www.kff.org/medicaid/2236-index.cfm, accessed November 28, 2004.
30 Teresa A. Coughlin and David Liska, The Medicaid Disproportionate Share Hospital Payment Program: Background and Issues (Urban Institute, October 1, 1997), available at http://www.urban.org/url.cfm?ID=307025, accessed December 9, 2004.
31 Ibid.
32 Teresa A. Coughlin and David Liska, The Medicaid Disproportionate Share Hospital Payment Program: Background and Issues (Urban Institute, October 1, 1997), available at http://www.urban.org/url.cfm?ID=307025, accessed December 9, 2004.
33 Hansen, Hunter, and Company, P.C., Medicare, Medicaid, and SCHIP Benefits Improvement and Protection Act of 2000: Highlights, available at http://www.hhc-cpa.com/downloads/bipa.pdf#search='Medicare,%20Medicaid, %20and%20SCHIP%20Benefits%20Improvement%20and%20Protection%20Act%202000, accessed December 9, 2004.
34 Association of American Medical Colleges, Teaching Hospital and Physician Provisions in the Medicare, Medicaid, and SCHIP Benefits Improvement and Protection Act of 2000, available at http://www.aamc.org/ advocacy/library/teachhosp/hosp0036.htm, accessed December 9, 2004.

B-38
35 Powers, Pyles, Sutter, and Verville, P.C., Summary of Medicare, Medicaid, and SCHIP Benefits Improvement and Protection Act of 2000, available at http://www.ppsv.com/issues/giveback.pdf, accessed December 9, 2004.
36 U.S. Congress, Medicare Prescription Drug, Improvement, and Modernization Act of 2003, P.L. 108-173, sec. 1001, available at http://frwebgate.access.gpo.gov/cgi-bin/getdoc.cgi?dbname=108_cong_public_laws&docid= f:publ173.108.pdf, accessed December 10, 2004.
37 American Society of Consultant Pharmacists, Summary of H.R. 1, Medicare Prescription Drug, Improvement, and Modernization Act of 2003, P.L. 108-173, available at http://www.ascp.com/medicarerx/docs/CMS_MMA.pdf# search='Medicare%20Prescription%20Drug%20Improvement%20and%20Modernization%20Act%20of%202003%20Medicaid%20DSH, accessed December 10, 2004.
38 Andy Schneider and David Rousseau, “Upper Payment Limits: Reality and Illusion in Medicaid Financing,” Issue Paper, Kaiser Commission on Medicaid and the Uninsured (Washington, D.C.: Kaiser Family Foundation, February 2002), p. 3.
39 Ibid., p. 4.
40 Ibid.
41 Andy Schneider and David Rousseau, “Upper Payment Limits: Reality and Illusion in Medicaid Financing,” Issue Paper, Kaiser Commission on Medicaid and the Uninsured (Washington, D.C.: Kaiser Family Foundation, February 2002), pp. 10-11
42 Kaiser Commission on Medicaid and the Uninsured, “Chapter 3, Medicaid Financing” (p. 115), in The Medicaid Resource Book, available at http://www.kff.org/medicaid/2236-index.cfm, accessed December 10, 2004
43 Centers for Medicare and Medicaid Services, A Profile of Medicaid: Chartbook 2000 (p. 72), available at http://www.cms.hhs.gov/charts/medicaid/2Tchartbk.pdf, accessed November 14, 2004.
44 Ibid., p. 75.
45 American Academy of Pediatrics, State Children’s Health Insurance Program, available at http://www.aap.org/ advocacy/schipsum.htm, accessed November 15, 2004.
46 Letter from Timothy M. Westmoreland, Health Care Financing Administration, to State Health Officials, July 31, 2000, available at http://www.cms.hhs.gov/schip/sho-letters/ch73100.asp, accessed November 30, 2004.
47 Centers for Medicare and Medicaid Services, Welcome to the State Children’s Health Insurance Program, available at http://www.cms.hhs.gov/schip/about-SCHIP.asp, accessed November 15, 2004.
48 FamiliesUSA, How Much Does My State Get from the Federal Government When it Spends a Dollar on Medicaid and SCHIP?, available at http://www.familiesusa.org/site/DocServer/FMAP_update_Mar_2004.pdf?docID=3021, accessed November 15, 2004.
49 American Academy of Pediatrics, State Children’s Health Insurance Program, available at http://www.aap.org/ advocacy/schipsum.htm, accessed November 15, 2004.
50 Social Security Act, Title XXI, sec. 2104(a), available at http://www.ssa.gov/OP_Home/ssact/title21/2104.htm, accessed January 14, 2005.
51 Social Security Act, Title XXI, sec. 2104(b), available at http://www.ssa.gov/OP_Home/ssact/title21/2104.htm, accessed January 14, 2005.
52 Ibid.
53 Centers for Medicare and Medicaid Services, Welcome to the State Children’s Health Insurance Program, available at http://www.cms.hhs.gov/schip/about-SCHIP.asp, accessed November 15, 2004.

B-39
54 Texas Health and Human Services Commission, Texas Medicaid in Perspective, 5th ed., 2004, p. 3-27, available at http://www.hhsc.state.tx.us/medicaid/reports/PB5/PinkBookTOC.html, accessed January 2, 2005
55 Children’s Defense Fund, Children’s Defense Fund and 72 Organizations Petition Congress to Restore $1.1 Billion in Insurance Funds for Children (Press Release), available at http://www.childrensdefense.org/ pressreleases/041115.asp, accessed November 28, 2004.
56 Edwin Park and Matthew Broadus, Assessing the Administrations Claims that Extending $1.1 Billion in Expiring SCHIP Funds is not Necessary to Sustain Existing Children’s Enrollment (Center on Budget and Policy Priorities, September 30, 2004), available at http://www.cbpp.org/9-30-04health.htm, accessed December 30, 2004.
57 Center on Budget and Policy Priorities, Administration Plan for Expiring SCHIP Funds Would Weaken Program (October 6, 2004), available at http://www.cbpp.org/10-6-04health-fact.htm, accessed December 30, 2004.
58 Ibid.
59 Edwin Park and Matthew Broadus, Congress Can Preserve $1.1 Billion in Expiring Children’s Health Insurance Funds and Help Avert SCHIP Cutbacks (Center on Budget and Policy Priorities, revised September 28, 2004), available http://www.cbpp.org/8-31-04health.htm, accessed December 30, 2004.
60 Ibid.
61 Ibid.
62 U.S. Department of Health and Human Services, Medicaid and SCHIP Waivers: Promoting Flexibility and Innovation, available at http://www.os.dhhs.gov/news/press/2001pres/01fsmedicaid.html, accessed November 20, 2004.
63 Ibid.
64 Centers for Medicare and Medicaid Services, Arizona Statewide Health Reform Demonstration, available at http://www.cms.hhs.gov/medicaid/1115/azfact.asp, accessed December 28, 2004.
65 Centers for Medicare and Medicaid Services, Health Insurance Flexibility and Accountability (HIFA) Demonstration Initiative, available at http://www.cms.hhs.gov/hifa/default.asp, accessed November 21, 2004.
66 U.S. Department of Health and Human Services, Medicaid and SCHIP Waivers: Promoting Flexibility and Innovation, available at http://www.os.dhhs.gov/news/press/2001pres/01fsmedicaid.html, accessed November 20, 2004.
67 Michael Birnbaum, Expanding Coverage to Parents through Medicaid Section 1931 (State Coverage Initiatives Issue Brief, May 2000), available at http://www.statecoverage.net/pdf/issuebrief500.pdf, accessed November 27, 2004.
68 Kenneth Finegold, Laura Wherry, and Stephani Schardin, Block Grants: Details of the Bush Proposals (Washington, D.C.: The Urban Institute, April 2004), p. 1.
69 Ibid., pp. 4-5.
70 John Holahan and Alan Weil, Medicaid Moving in the Wrong Direction? (The Urban Institute, June 2003), available at http://www.urban.org/url.cfm?ID=900638, accessed December 16, 2005.
71 FamiliesUSA, Capping Medicaid Funding: The Problem with Block Grants (June 2003), available at http://www.familiesusa.org/site/DocServer/capping_funding.pdf?docID=1205, accessed December 30, 2004.
72 Office of Management and Budget, 2006 Budget, Department of Health and Human Services, available at http://www.whitehouse.gov/omb/budget/fy2006/hhs.html, accessed February 7, 2005.

B-40
73 Office of Management and Budget, Department of Health and Human Services, HHS Priorities, available at http://www.whitehouse.gov/omb/budget/fy2005/hhs.html, accessed January 6, 2005.
74 Office of Management and Budget, 2006 Budget, Department of Health and Human Services, available at http://www.whitehouse.gov/omb/budget/fy2006/hhs.html, accessed February 7, 2005.
75 Texas Health and Human Services Commission, Texas Medicaid in Perspective, 5th ed. (2004, p. 2-4), available at http://www.hhsc.state.tx.us/medicaid/reports/PB5/PinkBookTOC.html, accessed January 9, 2005.
76 Ibid., p. 2-5.
77 Ibid., p. 2-3.
78 Texas Health and Human Services Commission, Research and Evaluation Department, “Health Insurance Coverage of Texans in 2003” (Excel spreadsheet, October 2004), sections 4 and 13.
79 Texas Health and Human Services Commission, Research and Evaluation Department, “Health Insurance Coverage Status as of 2003” (Excel spreadsheet, February 2005), sections 3 and 4.
80 Texas Health and Human Services Commission, Texas Medicaid in Perspective, 5th ed. (2004, p. 3-7), available at http://www.hhsc.state.tx.us/medicaid/reports/PB5/PinkBookTOC.html, accessed November 12, 2004.
81 Ibid., pp. 5-2, 5-3.
82 Ibid., p. 5-8.
83 House Select Committee on State Health Care Expenditures, Interim Report 2004: A Report to the House of Representatives, 79th Texas Legislature (Austin, Tex., November 2004, p. 27), available at http://www.house.state.tx.us/committees/reports/78interim/healthcareexpenditures.pdf, accessed January 1, 2005
84 Texas Health and Human Services Commission, Texas Medicaid in Perspective, 5th ed. (2004, pp. 5-8, 5-9), available at http://www.hhsc.state.tx.us/medicaid/reports/PB5/PinkBookTOC.html, accessed November 15, 2004.
85 House Select Committee on State Health Care Expenditures, Interim Report 2004: A Report to the House of Representatives, 79th Texas Legislature (Austin, Tex., November 2004, p. 31), available at http://www.house.state.tx.us/committees/reports/78interim/healthcareexpenditures.pdf, accessed January 1, 2005.
86 Texas Health and Human Services Commission, Texas Medicaid in Perspective, 5th ed. (2004, pp. 5-8, 5-9), available at http://www.hhsc.state.tx.us/medicaid/reports/PB5/PinkBookTOC.html, accessed November 15, 2004.
87 House Select Committee on State Health Care Expenditures, Interim Report 2004: A Report to the House of Representatives, 79th Texas Legislature (Austin, Tex., November 2004, p. 35), available at http://www.house.state.tx.us/committees/reports/78interim/healthcareexpenditures.pdf, accessed January 1, 2005.
88 Ibid., pp. 32-34.
89 Senate Finance Interim Subcommittee on Graduate Medical Education, Final Report on Medicaid Disproportionate Share Hospital Funding (Austin, Tex., May 2000, pp. 7-8), available at http://www.lrl.state.tx.us/ scanned/interim/76/f49meh.pdf, accessed January 1, 2005.
90 Ibid., p. 8.
91 Senate Finance Interim Subcommittee on Graduate Medical Education, Final Report on Medicaid Disproportionate Share Hospital Funding (Austin, Tex., May 2000, p. 9), available at http://www.lrl.state.tx.us/ scanned/interim/76/f49meh.pdf, accessed January 1, 2005.
92 Ibid.

B-41
93 Texas Health and Human Services Commission, Texas Medicaid in Perspective, 5th ed. (2004, pp. 5-9, 5-10), available at http://www.hhsc.state.tx.us/medicaid/reports/PB5/PinkBookTOC.html, accessed December 12, 2004.
94 Senate Finance Interim Subcommittee on Graduate Medical Education, Final Report on Medicaid Disproportionate Share Hospital Funding (Austin, Tex., May 2000, p. 10), available at http://www.lrl.state.tx.us/ scanned/interim/76/f49meh.pdf, accessed January 1, 2005.
95 Ibid.
96 House Select Committee on State Health Care Expenditures, Interim Report 2004: A Report to the House of Representatives, 79th Texas Legislature (Austin, Tex., November 2004, p. 30), available at http://www.house.state.tx.us/committees/reports/78interim/healthcareexpenditures.pdf, accessed January 1, 2005.
97 Texas Health and Human Services Commission, Texas Medicaid in Perspective, 5th ed. (2004, pp. 5-9, 5-10), available at http://www.hhsc.state.tx.us/medicaid/reports/PB5/PinkBookTOC.html, accessed December 12, 2004.
98 House Select Committee on State Health Care Expenditures, Interim Report 2004: A Report to the House of Representatives, 79th Texas Legislature (Austin, Tex., November 2004, p. 36), available at http://www.house.state.tx.us/committees/reports/78interim/healthcareexpenditures.pdf, accessed January 1, 2005.
99 Senate Finance Interim Subcommittee on Graduate Medical Education, Final Report on Medicaid Disproportionate Share Hospital Funding (Austin, Tex., May 2000, pp. 10-11), available at http://www.lrl.state.tx.us/scanned/interim/76/f49meh.pdf, accessed January 1, 2005.
100 Texas Health and Human Services Commission, Texas Medicaid in Perspective, 5th ed. (2004, p. 5-9), available at http://www.hhsc.state.tx.us/medicaid/reports/PB5/PinkBookTOC.html, accessed January 6, 2005.
101 Texas Legislative Council, Research Division, Disproportionate Share Hospital Program: Your Questions Answered (March 2003), available at http://www.tlc.state.tx.us/pubspol/dshprogram.pdf, accessed January 6, 2005.
102 Ibid.
103 Texas Health and Human Services Commission, Texas Medicaid in Perspective, 5th ed. (2004, p. 3-19), available at http://www.hhsc.state.tx.us/medicaid/reports/PB5/PinkBookTOC.html, accessed December 14, 2004.
104 Ibid., p. 2-8.
105 Texas Health and Human Services Commission, Texas Medicaid Enrollment by Sex and Race/Ethnicity as of September 2004, Updated October 2004, available at http://www.hhsc.state.tx.us/research/dssi/ LatestEnrollmentbyRaceSex.html, accessed November 15, 2004.
106 Texas Health and Human Services Commission, A Consumer Guide to Better Healthcare: Your 2004 Road Map to Understanding the Health Care System in Texas, pp. 7-39, available at http://www.hhsc.state.tx.us/chip/ reports/ConsumerGuideEnglish.pdf, accessed November 30, 2004.
107 Texas Health and Human Services Commission, Texas Medicaid in Perspective, 5th ed. (2004, p. 4-13), available at http://www.hhsc.state.tx.us/medicaid/reports/PB5/PinkBookTOC.html, accessed December 7, 2004.
108 Ibid., p. 6-1.
109 Ibid., p. 6-2.
110 Ibid.
111 Ibid., p. 6-3.
112 Texas Health and Human Services Commission, Children’s Health Insurance Program, available at http://www.hhsc.state.tx.us/chip/index.html, accessed November 15, 2004.

B-42
113 TexCare, Children’s Health Insurance Program, available at http://www.texcarepartnership.com/CHIP-CHIP-Page.htm, accessed November 30, 2004.
114 Texas Health and Human Services Commission, A Consumer Guide to Better Healthcare: Your 2004 Road Map to Understanding the Health Care System in Texas, pp. 47-50, available at http://www.hhsc.state.tx.us/chip/ reports/ConsumerGuideEnglish.pdf, accessed November 30, 2004.
115 Ibid.
116 Texas Health and Human Services Commission, CHIP Monthly Premiums Temporarily Suspended, October 1, 2004, available at http://www.hhsc.state.tx.us/news/post78/CHIP_CostSharingSuspended.html, accessed November 30, 2004.
117 Texas Health and Human Services Commission, A Consumer Guide to Better Healthcare: Your 2004 Road Map to Understanding the Health Care System in Texas, pp. 47-50, available at http://www.hhsc.state.tx.us/chip/ reports/ConsumerGuideEnglish.pdf, accessed November 30, 2004.
118 Texas Health and Human Services Commission, Texas Medicaid in Perspective, 5th ed. (2004, pp. 3-20, 3-21), available at http://www.hhsc.state.tx.us/medicaid/reports/PB5/PinkBookTOC.html, accessed January 2, 2005.
119 Center for Public Policy Priorities, Update on Medicaid and CHIP Cuts: What Was Restored in Recent Actions? (September 2004), available at http://www.cppp.org/products/PP217.html, accessed January 2, 2005.
120 Texas Health and Human Services Commission, Texas Medicaid in Perspective, 5th ed. (2004, p. 4-2), available at http://www.hhsc.state.tx.us/medicaid/reports/PB5/PinkBookTOC.html, accessed April 18, 2005.
121 Texas Legislative Budget Board, Fiscal Note for HB710, 79th Legislative Regular Session (Austin, Texas, April 20, 2005), available at http://www.capitol.state.tx.us/cgi-bin/tlo/textframe.cmd?LEG=79&SESS=R&CHAMBER =H&BILLTYPE=B&BILLSUFFIX=00710&VERSION=1&TYPE=F, accessed April 21, 2005.
122 Anne Dunkelberg and Molly O’Malley, Children’s Medicaid and SCHIP in Texas: Tracking the Impact of Budget Cuts (Kaiser Commission on Medicaid and the Uninsured, July 2004, p. 2), available at http://www.kff.org/ medicaid/7132.cfm, accessed January 2, 2005.
123 Ibid.
124 Texas Impact, Dear Texas Budget Leaders: What are You Waiting For? Restore CHIP Now!, available at http://www.texasimpact.com/Pages/chip_home.htm, accessed January 5, 2005.
125 Community Action Network, Campaign to Restore CHIP: Legislative Alert!, available at http://www.caction.org/ leg_agenda/CHIPCutsFactSheet.pdf#search='restore%20CHIP%20cuts%20Texas', accessed January 5, 2005.
126 Transition Legislative Oversight Committee, Biennial Report December 2004 (draft December 10, 2004, pp. 21-23), available at http://www.hhs.state.tx.us/consolidation/post78/1204_TLOC_report.pdf, accessed January 5, 2005
127 “Changing Course on Insurance for Kids? Restoring Benefits, Boosting Enrollment are Lawmakers’ Goals,” Austin American-Statesman (December 20, 2004), pp. A1, A11.
128 Texas Health and Human Services Commission, Texas Medicaid in Perspective, 5th ed. (2004, p. 4-25), available at http://www.hhsc.state.tx.us/medicaid/reports/PB5/PinkBookTOC.html, accessed December 7, 2004.
129 Ibid., p. 3-14.
130 Elizabeth Raye Kegler, “Utilizing Federal Waiver Flexibility to Expand Medicaid to Adults in Texas,” Professional Report, Lyndon B. Johnson School of Public Affairs, The University of Texas at Austin, May 2002, pp. 15-18.

B-43
131 Offices of State Senator Judith Zaffirini and State Representative Garnet Coleman, Governor Perry Vetoes Omnibus Medicaid Bill (Press Release, June 18, 2001), available at http://www.senate.state.tx.us/75r/ senate/members/dist21/pr01/p061801a.htm, accessed December 7, 2004.
132 Texas Health and Human Services Commission, Application Template for Health Insurance Flexibility and Accountability (HIFA) Section 1115 Demonstration Proposal (Austin, Tex., December 9, 2004), p. 1.
133 Texas Health and Human Services Commission, Concept Paper: Health Insurance Flexibility and Accountability (HIFA) Waiver to Implement the CHIP Premium Assistance Provisions of HB 3038, 77th Legislature and SB 240, 78th Legislature (November 10, 2003), available at http://www.hhsc.state.tx.us/chip/cnews/111003_ HIFAWaiverCP.html, accessed December 30, 2004.
134 Texas Health and Human Services Commission, Application Template for Health Insurance Flexibility and Accountability (HIFA) Section 1115 Demonstration Proposal (Austin, Tex., December 9, 2004), p. 15.
135 Ibid., p. 1.
136 Texas Health and Human Services Commission, Application Template for Health Insurance Flexibility and Accountability (HIFA) Section 1115 Demonstration Proposal (Austin, Tex., December 9, 2004), pp. 28-29.
137 Texas House Bill 3122, 78th Legislature, Regular Session (2003).
138 Caton Fenz, Leverage Local Funds to Expand Coverage in Lean Times (State Coverage Initiatives Issue Brief, February 2003, p. 3), available at http://www.statecoverage.net/pdf/issuebrief203.pdf, accessed December 30, 2004.
139 City of Austin/Travis County, “City of Austin/Travis County 1115 Medicaid Waiver Concept Paper” (Austin, Tex., October 2003), draft, p. 4.
140 Bexar County Hospital District, University Health System, “1115(A) Medicaid Research and Demonstration Waiver Concept Paper” (San Antonio, Tex., August 2002), draft, pp. 4-6.
141 El Paso County Hospital District, “1115 Research and Demonstration Waiver Concept Paper” (El Paso, Tex., November 2003), draft, pp. 5-6.
142 Ibid., p. 8.
143 E-mail interview by Kristie Kimbell with Peggy Romberg, Chief Executive Officer, Women’s Health and Family Planning Association of Texas, Austin, Texas, January 13, 2005.
144 Peggy Romberg, A Case for a Medicaid Women’s Health Care Waiver for Texas (Austin, Tex.: Women’s Health and Family Planning Association of Texas, updated December 2004), p. 1.
145 Texas Senate Health and Human Services Committee, Interim Report to the 79th Legislature (December 2004, p. 10), available at http://www.senate.state.tx.us/75r/senate/commit/c610/downloads/rpt_c610_dec2004.pdf, accessed January 12, 2005.
146 Caton Fenz, Leverage Local Funds to Expand Coverage in Lean Times (State Coverage Initiatives Issue Brief, February 2003, p. 1), available at http://www.statecoverage.net/pdf/issuebrief203.pdf, accessed January 5, 2005.
147 Ibid., pp. 2-4.
148 Health Management Associates, Long Range Planning Issues for the Dallas County Hospital District (November 2004, pp. 73-75), available at http://www.healthmanagement.com/files/Dallas.pdf, accessed January 11, 2005.
149 Texas Legislative Budget Board, Fiscal Note for HB710, 79th Legislative Regular Session (Austin, Texas, April 20, 2005), available at http://www.capitol.state.tx.us/cgi-bin/tlo/textframe.cmd?LEG=79&SESS=R&CHAMBER =H&BILLTYPE=B&BILLSUFFIX=00710&VERSION=1&TYPE=F, accessed April 21, 2005.

B-44
150 Lyndon B. Johnson School of Public Affairs, Investing in Texas: Financing Health Coverage Expansion, Conference Background Papers, Center for Health and Social Policy, Policy Paper no. 2 (Austin, Tex., 2003), pp. 70-75.
151 Centers for Medicare and Medicaid Services, Demonstration and Infrastructure Grant Activities, Texas, available at http://www.cms.hhs.gov/twwiia/txinf.asp, accessed January 10, 2005.
152 Centers for Medicare and Medicaid Services, “Information Regarding the Provision of Prenatal Care to Unborn Children Under SCHIP” (Letter to State Health Officials, SHO #02-004, November 12, 2002), available at http://www.cms.hhs.gov/states/letters/sho111202.pdf, accessed March 22, 2005.
153 U.S. Department of Health and Human Services, “State Children’s Health Insurance Program, Eligibility for Prenatal Care and Other Health Services for Unborn Children, Final Rule,” Federal Register, vol. 67, no. 191 (October 2, 2002, p. 61956), available at http://frwebgate.access.gpo.gov/cgi-bin/getdoc.cgi?dbname=2002_register&docid=02-24856-filed.pdf, accessed March 22, 2005.
154 Health Management Associates, Long Range Planning Issues for the Dallas County Hospital District (November 2004, p. 74), available at http://www.healthmanagement.com/files/Dallas.pdf, accessed January 14, 2005.
155 Sharon Silow-Carroll and Tanya Alteras, Stretching State Health Care Dollars: Building on Employer-based Coverage (The Commonwealth Fund, October 2004), available at http://www.cmwf.org/publications/ publications_show.htm?doc_id=243629, accessed January 6, 2005.
156 “Gov. Bush Proposes Medicaid Revamp,” St. Petersburg Times (January 12, 2005), available at http://www.sptimes.com/2005/01/12/State/Gov_Bush_proposes_Med.shtml, accessed January 12, 2005.
157 Ibid.
158 Florida Agency for Health Care Administration, Empowered Care: A Proposed Concept for Florida Medicaid (draft, March 14, 2005), available at http://www.empoweredcare.com/docs/empoweredcare_proposed_concept.pdf, accessed March 23, 2005.
159 Florida House of Representatives, Health Care General Committee, “Committee Meeting Packet for March 16, 2005” (including draft legislation of “Medicaid Reform Act of 2005,” March 14, 2005).
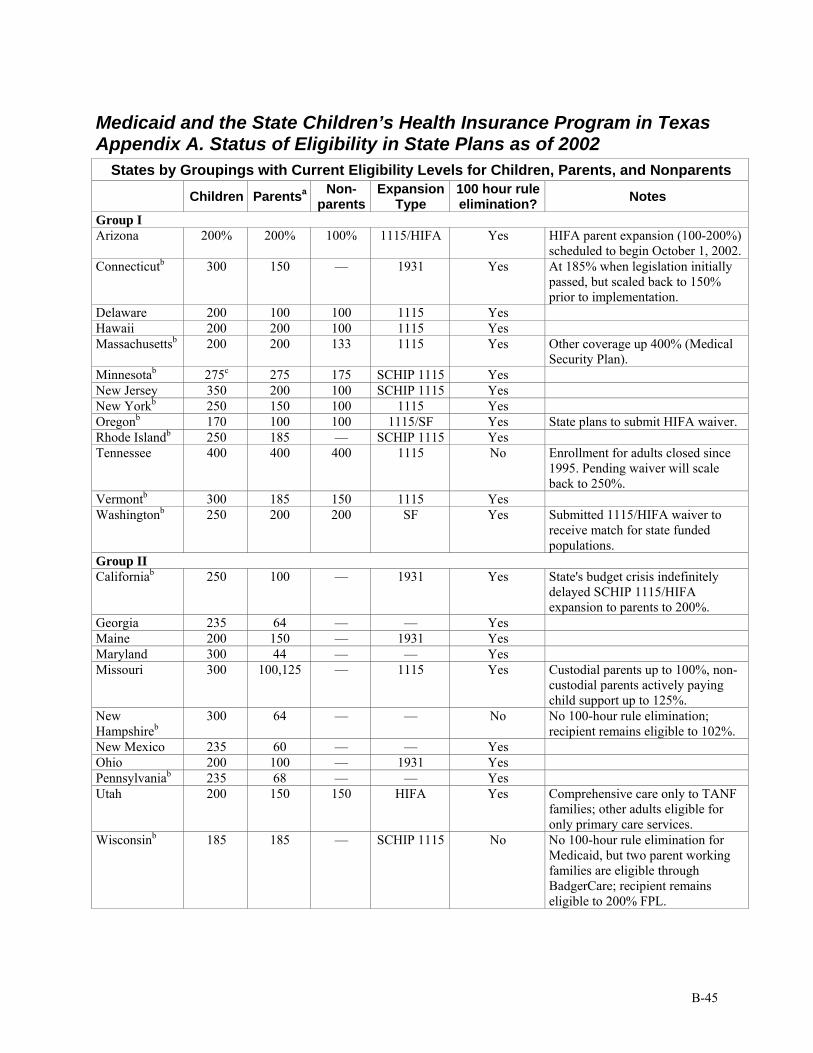
B-45
Medicaid and the State Children’s Health Insurance Program in Texas Appendix A. Status of Eligibility in State Plans as of 2002
States by Groupings with Current Eligibility Levels for Children, Parents, and Nonparents
Children Parentsa Non-parents
Expansion Type
100 hour rule elimination? Notes
Group I Arizona 200% 200% 100% 1115/HIFA Yes HIFA parent expansion (100-200%)
scheduled to begin October 1, 2002. Connecticutb 300 150 — 1931 Yes At 185% when legislation initially
passed, but scaled back to 150% prior to implementation.
Delaware 200 100 100 1115 Yes Hawaii 200 200 100 1115 Yes Massachusettsb 200 200 133 1115 Yes Other coverage up 400% (Medical
Security Plan). Minnesotab 275c 275 175 SCHIP 1115 Yes New Jersey 350 200 100 SCHIP 1115 Yes New Yorkb 250 150 100 1115 Yes Oregonb 170 100 100 1115/SF Yes State plans to submit HIFA waiver. Rhode Islandb 250 185 — SCHIP 1115 Yes Tennessee 400 400 400 1115 No Enrollment for adults closed since
1995. Pending waiver will scale back to 250%.
Vermontb 300 185 150 1115 Yes Washingtonb 250 200 200 SF Yes Submitted 1115/HIFA waiver to
receive match for state funded populations.
Group II Californiab 250 100 — 1931 Yes State's budget crisis indefinitely
delayed SCHIP 1115/HIFA expansion to parents to 200%.
Georgia 235 64 — — Yes Maine 200 150 — 1931 Yes Maryland 300 44 — — Yes Missouri 300 100,125 — 1115 Yes Custodial parents up to 100%, non-
custodial parents actively paying child support up to 125%.
New Hampshireb
300 64 — — No No 100-hour rule elimination; recipient remains eligible to 102%.
New Mexico 235 60 — — Yes Ohio 200 100 — 1931 Yes Pennsylvaniab 235 68 — — Yes Utah 200 150 150 HIFA Yes Comprehensive care only to TANF
families; other adults eligible for only primary care services.
Wisconsinb 185 185 — SCHIP 1115 No No 100-hour rule elimination for Medicaid, but two parent working families are eligible through BadgerCare; recipient remains eligible to 200% FPL.

B-46
States by Groupings with Current Eligibility Levels for Children, Parents, and Nonparents
Children Parentsa Non-parents
Expansion Type
100 hour rule elimination? Notes
Group III Alabama 200 31 — — Yes Alaska 200 82 — — Yes Recipient remains eligible to 124%. Arkansas 200 22 — — Yes No 100-hour rule elimination for
Medicaid; recipient remains eligible to 54%.
Florida 200 33 — — Yes Recipient remains eligible to 68%. Indiana 200 32 — — Yes Eligibility threshold at 100% for
TANF families. Iowab 200 90 — — Yes Kansasb 200 42 — — Yes Recipient remains eligible to 65%. Michiganb 200 66 — — Yes State plans to submit HIFA waiver. Mississippi 200 39 — — Yes Recipient remains eligible to 57%. Nevada 200 59 — — Yes Allows 134% for the first three
months of coverage and then eligibility drops to 59%.
North Carolina 200 64 — — Yes South Dakota 200 68 — — Yes Texas 200 34* — — Yes Allows 45% for the first four months
of coverage and then eligibility drops to 34%.
Virginia 200 32 — — Yes Recipient remains eligible to 47%. Group IV Colorado 185 43 — — Yes Idaho 150 35 — — Yes Illinois 185c 58 — — Yes Recipient remains eligible to 96%.
Pending HIFA waiver. Kentucky 200 52 — — No 100-hour rule applied to applicants
only; recipient remains eligible to 77%.
Louisiana 200 22 — — No No 100-hour rule elimination for Medicaid.
Montanab 150 71 — — Yes Nebraska 185 45 — — No No 100-hour rule elimination for
Medicaid. North Dakota 140 89 — — Yes Allows 151% for the first six months
of coverage and then eligibility drops to 89%.
Oklahoma 185 50 — — No No 100-hour rule elimination for Medicaid.
South Carolina 150c 56 — — Yes West Virginia 150 46 — — No No 100-hour rule elimination for
Medicaid. Wyoming 133 67 — — Yes a. FPL levels for parent coverage estimated by the dollar amount for a family of three. Kathleen A. Maloy, Kyle Anne Kenney, Julie Darnell, and Soeurette Cyprien, Can Medicaid Work for Low-Income Working Families? (Washington, D.C.: The Kaiser Commission on Medicaid and the Uninsured, 2002). b. State has a medically need program with an eligibility level at 60% FPL or higher. c. State offers coverage at a higher level for infants. Minnesota, 280% FPL. Illinois, 200% FPL. South Carolina, 185% FPL.

B-47
Source: John Holahan and Mary Beth Pohl, States as Innovators in Low-Income Health Coverage (The Urban Institute, June 2002, Table 1), available at http://www.urban.org/url.cfm?ID=310519, accessed February 10, 2005.
* In Texas, the Medicaid eligibility level for parents with dependent children is $188 per month for a family of three ($308 per month if one parent is working). This is a fixed dollar cap that does not increase with inflation or change in the federal poverty level. It was last increased by the Texas Legislature in 1985. In 2005, this income cap equals a cut-off level of 14 percent FPL for a family of three (23 percent if one parent works). [Source: Anne Dunkelberg, e-mail to Kristie Kimbell, March 24, 2005.]
Notes on table: “SF” means state-funded (all state funds, no federal funds used like in Medicaid and SCHIP). The four groups above are designations by the authors dividing the states into groups from most innovative (group I—highest eligibility levels) to least innovative (group IV—have not expanded coverage beyond minimum requirements for public programs or have not eliminated the 100-hour rule). The mandatory “100-hour rule” was eliminated by the U.S. Department of Health and Human Services in 1998, allowing states to change family composition rules to expand coverage regardless of the employment status of the parents; previously, two-parent families could be eligible for Medicaid only if the primary wage earner worked fewer than 100 hours per month or was incapacitated.

B-48
Medicaid and the State Children’s Health Insurance Program in Texas: Appendix B. Local Participation in Health Coverage The Texas Constitution requires counties to participate in the provision and financing of public health care for the indigent. Prior to 1985, however, Texas law contained no specific provisions regarding the definition of indigency or the extent of the health care services to be provided.1 By 1983, ambiguous state statutes regarding county responsibility had led to disparate tax burdens and service provisions. This prompted the governor, lieutenant governor, and house speaker to convene the Task Force on Indigent Health Care to study medical indigency in Texas. The task force was charged with examining a potential indigent program in terms of scope of services, eligibility criteria, administrative structure and method of finance. The task force’s findings were presented in the Task Force on Indigent Health Care Final Report in December 1984. The general findings that the lack of uniformity in the definition of indigency across counties, the disproportionate provision of services statewide, and the subsequent lack of equitable financial burden, among others, led the task force to recommend expanded coverage and enhanced service provision, a uniform definition of eligibility, and greater equity of burden.2 The task force findings and recommendations led to the Indigent Health Care and Treatment Act of 1985 (Chapter 61 of the Texas Health and Safety Code), which specifies that a county would meet its health care responsibility for indigent residents in one of three ways: 1) by creating a hospital district, 2) by running a public hospital, or 3) by operating a county indigent health care program (CIHCP). Hospital districts are special taxing districts created for the sole purpose of providing health care to people who reside within their boundaries. They are created through state legislative amendment or through county voter approval. The maximum state allowed tax rate is 75 cents per $100 of property valuation. Public hospitals are hospitals owned, operated, or leased by a county or municipality, other than a hospital district, with geographical service districts for which they have a legal obligation to provide health care services. Unlike hospital districts, local tax support for hospitals is not always dedicated. A CIHCP is the third mechanism for a county to meet its indigent care obligation; it includes the provision of health care for some or all (dependent on presence of public hospital/hospital district) of the county’s indigent residents. Hospital districts and public hospitals are legally responsible for care to indigent individuals in a set service area. The service area may cover the entire county or cover only part of a county. A county not fully served by a hospital district or a public hospital, or served by neither, must establish a CIHCP. The act created a list of required basic health care services for counties with CIHCPs.3 There are 142 counties with CIHCPs, 131 hospital districts, and 23 public hospitals. These numbers do not total to the exact number of Texas counties as some counties are covered by more than one type of indigent care entity and some types cover more than one county.4 For CICHPs, the Indigent Care Act defined “indigent” in terms of income and assets, originally 17 percent of the FPL; however, hospital districts and public hospitals were originally given complete freedom to self-determine eligibility standards and services provided. This led some to provide expansive services and others to provide very limited or no services. This “freedom” was restricted in 1999 with HB 1398 (described below) which required both hospital districts and public hospitals, at a minimum, to provide care to individuals with incomes below 17 percent of

B-49
the FPL. In 2001, the minimum requirement was raised to 21 percent (21 percent of the FPL for a family of one is $167 as of April 1, 2005).5 The CIHCP counties were also allowed to provide additional services or to provide services to individuals at higher income levels, however, initially they had no requirement to do so.6 Application processes and procedures are now consistent with the procedures used to determine eligibility in the TANF program.7 Hospital districts and public hospitals get their money from several sources: 1) local taxes (ad valorem, sales and use); 2) the state Tertiary Care Fund; 3) private paying individuals; 4) third party payers; 5) a portion of tobacco settlement resources; and 6) two federal programs — DSH and GME. Counties served wholly or in part by a CIHCP are eligible for state matching funds. To be eligible for the matching funds, these counties must first spend a set percentage of their general revenue tax levy (GRTL), originally 10 percent, on health care for indigent persons.8
House Bill 1398 In 1999, the Indigent Health Care Act was amended by HB 1398. HB 1398 reduced the amount a county must spend on their CIHCP from 10 percent to 8 percent of GRTL before being eligible for state assistance funds to pick up much of their subsequent costs. The state reimbursement rate is 90 cents for each dollar spent. Additionally, HB 1398 removed the disincentive to provide care to individuals at higher income levels by allowing counties to receive “credit” for these expenditures in order to draw down the state match funds. Counties can now also receive credit for services deemed to be cost effective, but not necessarily on the list of required basic health care services. These provisions gave counties more flexibility, added an accountability mechanism and afforded financial incentives to provide health care to the medically indigent.9 In 2003, state legislators approved a $1.6 million per year (2004-2005 biennium) reduction in state matching funds available to counties who spend over the required 8 percent of GTRL. The appropriation for each year of the biennium was $5.6 million, whereas, in 2002, the 25 counties receiving the state matching funds received a combined total of $7.2 million. Such reductions were expected to have a negative impact on counties who might face the decision to raise taxes or limit services. Paradoxically, counties are both legally required to provide indigent care services and legally constrained regarding taxing amounts. Compounding the dilemma is the growing number of uninsured in the state, particularly given the most recent cuts to Medicaid and SCHIP.10 However, the county is not liable for payments for health care services provided to its eligible residents once the county reaches the 8 percent expenditure level if the state fails to provide assistance funds.11 According to state department of health figures, the state had a total of approximately $6.4 million available for the SFY 2004, including a $1.3 million fund transfer in June 2004. The 20 counties requesting state matching funds had a combined request total of over $5.5 million, apparently leaving a little over $0.8 million in unused funds. The combined expenditures of all counties reporting for SFY 2004 was over $63.9 million. That amount, less the state reimbursed amount, leaves over $59.5 million in indigent care provided by counties. Twenty-one counties had expenditures exceeding 8 percent of their GRTL for 2004. Another 18 counties spent between 6 and 8 percent of their GRTL.12 Until recently, the bulk of the state assistance funds went to two counties in south Texas, Hildalgo and Cameron. In the 2004-2005 appropriation bill for TDHS, Rider 53 imposed a cap on the distribution of assistance funds to one county. The cap was set at 35 percent of the total funds appropriated.13

B-50
Graduate Medical Education Program Another, albeit indirect, mechanism for the provision of indigent health care in Texas is the Graduate Medical Education (GME) program. GME funds are provided to teaching hospitals by the federal government to help offset the costs associated with the training of medical students (the payments are provided as a supplement to regular Medicaid and Medicare payments). The GME payments have effectively enabled teaching hospitals, many of them public hospitals or hospital district hospitals, to provide medical care to the medically indigent, by allowing them to increase their staff using medical and surgical residents. Changes to this program in recent years may have limited this provision of services.
Disproportionate Share Hospital Program It should also be briefly noted that hospitals providing a disproportionate share of health care to indigent individuals may also receive Disproportionate Share Hospital (DSH) funds to partially compensate them for their services. The disproportionate share program is discussed in detail in the main text of this paper.
Tobacco Settlement Trust Fund Counties also receive some funds from the state’s settlement in 1998 with tobacco companies, which established the Tobacco Settlement Trust Fund. Counties, cities, and hospital districts signed an agreement reserving some funds for entities responsible for the provision of indigent health care — hospital districts, other local political subdivisions owning and maintaining public hospitals, and counties in Texas. The total settlement amount of $2.8 billion was to be received over a five-year period. The funds were split into two payment methods, a series of lump-sum payments and a trust fund. The lump sum payments paid a total of $450 million over 1999-2001.14 Another $1.8 billion was deposited in a permanent trust fund. The return on trust fund investments is to be paid to counties in perpetuity, depending on how much unreimbursed care each provides. In 2001, the first year of interest payments, a total of $13 million was paid.
County tobacco money has no spending requirements, except within hospital districts, which must use it for health care.15 As a whole, in 1999, counties (those who reported) spent at least $940 million of tobacco money on indigent health care. SFY 2002 was to be the first year in which tobacco payments to counties were solely from the permanent trust fund created with the initial amount of $1.8 billion. However, due to the poor economic circumstances of 2001 and heavy investment of the fund in stocks, the fund not only failed to gain interest, it lost a net $30 million in principal.16
Other Indigent Health Care Providers Other providers of indigent health care services in the state include non-profit and for-profit private hospitals (322 in 1997) and clinics, state facilities (hospitals run by state agencies and clinics — MHMR, TDH, prisons), hospitals and clinics run by public universities (e.g., UTMB), specialty services (HIV/AIDS), federally qualified health centers (FQHCs), rural health clinics, free clinics, private physicians, and local health departments. Together these entities provided roughly $4.3 billion in uncompensated health care in 1997. While this figure is dated, it is a good indication of the extent to which these other resources are contributing to indigent care in Texas. Funding for these entities comes from a variety of sources. For private hospitals, revenue comes primarily from payers — out-of-pocket payers, insurance companies, DSH, Medicare and Medicaid. The state facilities are funded through these same means but also through state

B-51
general revenue funds and some federal programs. Special facilities and community and rural health centers/clinics are largely funded through federal money (Title V, Title X, Ryan White, block grants, Medicare and Medicaid) along with the state matching dollars. Local health departments rely on federal, state, and local funding sources for their programs. Free clinics on the other hand rely on fundraising and volunteers, while private physicians’ contributions to the indigent are from their own earnings.17
Immigrant Health Care According to the U.S. Census Bureau, 24.6 percent of Texas residents are uninsured.18 In 2003, over half of the uninsured in Texas were Hispanic, many of whom were immigrants from Mexico. In 2002, there was an estimated 1.4 million immigrants of Hispanic origin living in Texas.19 It is very difficult to know how many of the immigrants living in Texas are undocumented, however some have estimated the number at over 1 million.20 These figures are notable because Hispanics, and particularly Mexican immigrants, are overrepresented in jobs with limited or no health insurance. This is important because Medicaid in Texas does not cover recent documented immigrants or undocumented immigrants. The Personal Responsibility and Work Opportunity Reconciliation Act of 1996 (PRWORA), made legal immigrants who entered the United States after 1996 ineligible for Medicaid for five years. PRWORA gave states the option to continue Medicaid coverage for qualified immigrant adults who entered the U.S. before the law was enacted in August 1996, which Texas did. Qualified immigrant adults entering the U.S. after August 1996 were barred from Medicaid coverage for five years from date of entry (although at that time emergency Medicaid was still available).21 In the 2003 legislative session, the state’s emergency Medicaid program was discontinued. States do have the option to cover post-1996 qualified adult immigrants after the five-year bar, but Texas is not yet exercising this option. Senate Bill 1156 of the 77th Texas Legislature, which Governor Rick Perry vetoed, would have, among other things, exercised Texas’ option to cover post-1996 qualified immigrant adults following the five-year bar period. Because most undocumented immigrants are low-wage earners and have very limited access to formal health care coverage (public or private), they depend largely on local or county-funded programs, community health centers (FQHCs or FQHC look-alikes), and charitable organizations. County-funded programs, which are responsible for providing health care for uninsured indigent individuals, provide services regardless of immigration status. Community health centers also play a crucial role in providing health care services to Texas’ poor Hispanic and immigrant populations. Patients are only required to live within the service area, and are not asked to provide documentation regarding immigration status. In 2003, there were 35 CHCs operating 195 service delivery sites across the state, serving a total of 547,816 people, 71 percent of whom were Hispanic. Of these people, 94 percent earned less than 200 percent FPL and 76 percent earned less than 100 percent FPL.22 Charitable organizations also provide services similar to those of FQHCs, however they receive little or no public funding. Examples are El Buen Samaritano and People’s Community Clinic in Austin. Health care coverage for immigrant children is also somewhat limited. States have the option to use state funds to cover immigrant children on Medicaid during the five-year bar period but Texas covers these children with SCHIP funds.23 All qualified immigrant children may receive state-funded care following the five-year bar. No bar is placed on qualified immigrant children arriving before 1996. Undocumented children face greater difficulty accessing acute care, preventive, and primary care services. These children often rely on FQHCs for their health care

B-52
needs, however, there is a shortage of such facilities. While federal law excludes undocumented children from Medicaid and SCHIP enrollment, states may use SCHIP funds to provide “health services initiatives” that do not screen for immigration status, including programs aimed at migrant farm worker communities, low-income immigrant communities, newborn screening, lead testing, health education, and school health programs.24 Additionally, the Maternal and Child Health Block Grant (Title V), which provides health care funds for pregnant women, mothers, infants, and children who do not have access to adequate health care, is a significant source of health care for undocumented women in Texas. The program only requires beneficiaries to be Texas residents, not necessarily citizens, to receive prenatal care.25
Undocumented “Responsibility?” Due to the limited access to primary and preventive care for over a quarter of all Texans, growing numbers of individuals, including large numbers of immigrants, must rely on hospital emergency departments for all of their care. A recent estimate put the national figure for emergency room admissions which did not involve an actual emergency at 50 percent.26 In recent years, emergency departments have consequently been increasingly unable to meet care demands. In July 2001, then-Texas Attorney General John Cornyn ruled on an inquiry from Harris County regarding the legality of using local public funds to provide nonemergency health care for undocumented immigrants. Cornyn ruled that it was illegal.* The attorney general’s opinion was not legally binding, and the majority of Texas hospital districts continued their policy of serving residents without regard to immigration status. In the 2003 legislative session, state and local entities were granted permission to provide services to undocumented immigrants. In January 2004, the Tarrant County District Attorney ruled that this legislation “required” its county hospital district to provide nonemergency care to undocumented immigrants, which it had not done since 1997. In February 2004, the Montgomery County Hospital District, also considering discontinuing nonemergency services to undocumented immigrants, sought a new opinion from Attorney General Greg Abbott. Abbott ruled that while undocumented workers are eligible for public health services, they are not entitled to receive services from state funds, but may be entitled to receive services from local funds if the given hospital district permits it.27 Tarrant County hospital district again discontinued preventive care services to undocumented immigrants following the attorney general’s ruling.28
Medicare Prescription Drug, Improvement, and Modernization Act The Emergency Medical Treatment and Labor Act (EMTALA) of 1985 requires hospitals participating in Medicare to medically screen all persons seeking care in hospital emergency departments, and to provide the treatment necessary to stabilize those determined to have an emergency condition, regardless of income, insurance, or immigration status.29 Currently, hospitals and other providers must absorb the costs associated with this care. Section 1011 (Federal Reimbursement of Emergency Health Services Furnished to
* The opinion stems from a provision in the PRWORA that required state legislatures to actively affirm their intention to provide public benefits to undocumented and other “not qualified” immigrants. Those who took issue with the Cornyn opinion claimed that the Texas Legislature had complied with PRWORA in 1997 by amending a statute requiring hospital districts to provide medical care for all indigent residents.

B-53
Undocumented Aliens) of the Medicare Prescription Drug Act is intended to help offset some of the cost to these providers for caring for undocumented immigrants and other specified aliens. The amount allotted for this relief is $1 billion, or $250 million per year for fiscal years 2005-2008, to be allocated to hospitals and other health care providers of emergency health services for emergency care.30 Two-thirds of the funds will be divided among all 50 states and the District of Columbia based on their relative percentages of undocumented aliens. One-third will be divided among the six states with the largest number of undocumented alien apprehensions.31
Appendix Endnotes 1 State of Texas, Task Force on Indigent Care Final Report, December 1984.
2 Ibid.
3 Caton Fenz, Providing Health Care to the Uninsured in Texas: A Guide for County Officials (Boston, Mass.: The Access Project, August 9, 2000).
4 Email interview by Kristie Kimbell with Jan Maberry, Program Manager, County Indigent Health Care Program, Texas Department of Health, November 18, 2004.
5 Department of State Health Services, County Indigent Health Care Program, available at http://www.tdh.state.tx.us/cihcp/default.htm, accessed March 24, 2005.
6 Caton Fenz, Providing Health Care to the Uninsured in Texas: A Guide for County Officials (Boston, Mass.: The Access Project, August 9, 2000).
7 Department of State Health Services, County Indigent Health Care Program, available at http://www.tdh.state.tx.us/cihcp/default.htm, accessed March 24, 2005.
8 Caton Fenz, Providing Health Care to the Uninsured in Texas: A Guide for County Officials (Boston, Mass.: The Access Project, August 9, 2000).
9 Ibid.
10 Texas Association of Counties, “State Budget Reductions Will Impact Counties that Receive Indigent Health Care Assistance,” County Issues, vol. 13, issue 9, June 6, 2003, available at http://www.county.org/resources/library/ cissue/v13_09/12.html, accessed March 24, 2005.
11 House Research Organization, Interim News (78-7), July 22, 2004, available at http://www.capitol.state.tx.us/ hrofr/interim/int78-7.pdf, accessed March 24, 2005.
12 Texas Department of Health, County Indigent Health Care Program Summary for FY 2004, available at http://www.tdh.state.tx.us/cihcp/Spending_Data/Summary%20FY04.doc, accessed March 24, 2005.
13 House Research Organization, Interim News (78-7), July 22, 2004, available at http://www.capitol.state.tx.us/ hrofr/interim/int78-7.pdf, accessed March 24, 2005.
14 Texas Department of Health, Office of Policy and Planning, Agreement Regarding the Disposition of Tobacco Settlement Proceeds (June 8, 1999), available at http://www.tdh.state.tx.us/dpa/tobsett.htm, accessed January 31, 2002.

B-54
15 Texas Association of Counties, “Tobacco Reimbursement Funds will be Distributed Later this Month,” TACNews, vol. 9, no. 54 (April 6, 2001), available at http://www.county.org/resources/TACnews/ news04061.html, accessed: January 31, 2002.
16 Charlotte Huff and Kelly Melhart, “Tobacco Fund Loss Troubles Hospitals,” Fort Worth Star Telegram (February 21, 2002), available at http://www.dfw.com/mld/startelegram, accessed February 30,2002.
17 Caton Fenz, Providing Health Care to the Uninsured in Texas: A Guide for County Officials (Boston, Mass.: The Access Project, August 9, 2000).
18 Kaiser Family Foundation, Statehealthfacts.org, Texas: Distribution of Nonelderly Uninsured by Race/Ethnicity, State Data 2002-2003, U.S. 2003, available at http://www.statehealthfacts.kff.org/cgi-bin/healthfacts.cgi?action= profile&area=Texas&category=Health+Coverage+%26+Uninsured&subcategory=Nonelderly+Uninsured&topic=Distribution+by+Race%2FEthnicity, accessed March 24, 2005.
19 U.S. Department of Labor, Bureau of Labor Statistics, 2001 March Current Population Survey, available at http://www.bls.census.gov/cps/cpsmain.htm, accessed April 8, 2002.
20 Jeffrey S. Passel, Randolph Capps, and Michael E. Fix, Undocumented Immigrants: Facts and Figures, Urban Institute Fact Sheet (January 12, 2004), available at http://www.urban.org/url.cfm?ID=1000587, accessed March 24, 2005.
21 Center for Medicare and Medicaid Services, State Medicaid Manual, available at http://www.cms.hhs.gov/states/ letters/wrtoc.asp, accessed March 24, 2005.
22 National Association of Community Health Centers, Access to Community Health Databook Texas (2004), available at http://www.nachc.com/research/files/tx.pdf, accessed March 25, 2005.
23 A. Morse, National Conference of State Legislatures, SCHIP and Access for Children in Immigrant Families (2004), available at http://www.ncsl.org/programs.health/Forum/pub6682.htm#schipandaccess, accessed March 24, 2005.
24 The Center for Public Policy Priorities, CHIP and Children who are not U.S. Citizens, available at http://www.cppp.org/products/policyanalysis/briefingpapers/brpchip3.pdf, accessed March 25, 2005.
25 Maternal and Child Health Bureau, MCHB Mission, available at http://mchb.hrsa.gov, accessed March 25, 2005.
26 Guy Clifton, M.D., Herman Hospital, “Addressing Houston’s Emergency Room Crisis,” Houston, Tex., October 30, 2000, p.1 (draft).
27 Bill Murphy and Terry Kliewer, “Harris County to Serve Immigrants’ Health Needs; Preventive Care Will Continue, Despite Ruling it Doesn’t Have To,” Houston Chronicle, July 27, 2004 (Lexis Nexis).
28 Star-Telegram.com, Impact of Immigrants Evaluated (January 27, 2005), available at http://www.dfw.com/ mld/dfw/entertainmetn/television/10747343.htm?template=contentModules/printstory.jsp, accessed March 25, 2004.
29 Centers for Medicare and Medicaid Services, Emergency Medical Treatment and Labor Act (EMTALA) Resource, available at http://www.cms.hhs.gov/providers/emtala/default.asp, accessed March 25, 2004.
30 Centers for Medicare and Medicaid Services, CMS Legislative Summary, available at http://www.cms.hhs.gov/ mmu/HR1/PL108-173summary.asp#sec1011, accessed March 25, 2004.
31 Ibid.

B-55
Medicaid and the State Children’s Health Insurance Program in Texas: Appendix C. Fiscal Note for Women’s Health Care Waiver
LEGISLATIVE BUDGET BOARD Austin, Texas
FISCAL NOTE, 79TH LEGISLATIVE REGULAR SESSION March 22, 2005
TO: Honorable Jane Nelson, Chair, Senate Committee on Health & Human Services FROM: John S. O’Brien, Deputy Director, Legislative Budget Board IN RE: SB747 by Carona (Relating to establishing a demonstration project for women’s health care services), As Introduced Estimated Two-year Net Impact to General Revenue Related Funds for SB747, As Introduced: a positive impact of $135,207,202 through the biennium ending August 31, 2007. The bill would make no appropriation but could provide the legal basis for an appropriation of funds to implement the provisions of the bill. General Revenue-Related Funds, Five-Year Impact:
Fiscal Year Probable Net Positive/(Negative) Impact to General Revenue Related Funds
2006 $44,403,928 2007 $90,803,274 2008 $92,490,636 2009 $94,173,184 2010 $95,954,705
All Funds, Five-Year Impact:
Fiscal Year
Probable (Cost) from GR MATCH FOR
MEDICAID 758
Probable Savings fromGR MATCH FOR
MEDICAID 758
Probable (Cost) fromFEDERAL FUNDS
555
Probable Savings fromFEDERAL FUNDS
555
2006 ($8,131,500) $52,535,428 ($73,183,500) $81,074,511 2007 ($16,524,000) $107,327,274 ($148,716,000) $164,181,134 2008 ($16,821,000) $109,311,636 ($151,389,000) $167,076,825 2009 ($17,127,000) $111,300,184 ($154,143,000) $170,116,211 2010 ($17,451,000) $113,405,705 ($157,059,000) $173,334,384
Fiscal Analysis The bill would require the Health and Human Services Commission (HHSC) to develop a five-year demonstration project in the state Medical Assistance (Medicaid) program relating to preventive health and family planning. The bill would require HHSC to establish a five-year demonstration project through the medical assistance program to expand access to preventive health and family planning services for women. Women eligible under Subsection (b) to participate in the demonstration project may receive appropriate preventive health and family planning services, including: medical history

B-56
recording and evaluation; physical exams; health screenings, including diabetes and certain cancers; counseling and education on contraceptive methods; provision of contraceptives; risk assessment; and referral of medical problems. The bill would state that a woman is eligible to participate in the project if she is at least 18 years old; has a net family income at or below 185% FPL; participates in or receives benefits under HHS programs, i.e, Medicaid, Food Stamps, TANF, and WIC; is presumed eligible for one of the above programs; or is a member of a family that contains at least one person who participates in or receives benefits under one of these programs. The bill would require the department to submit a report to the legislature regarding the progress in establishing and operating the project, no later than December 1 of each even-numbered year. The bill would require that the department ensure that money spent under the project is not used for abortions. The effective date is September 1, 2005. Methodology HHSC states the waiver application process would take roughly six months, so the project would begin February 1, 2006. Cost for family planning services: The cost estimate assumes that over 1.8 million women per year would be eligible for the waiver, with roughly 500,000 women enrolled and participating during each year. The number of eligible women is adjusted by the number of women estimated to receive family planning services at the Department of State Health Services (DSHS). The cost per client is estimated to be $360 per year. The FY 2006 cost is phased in, for a cost of $81.3 million in All Funds. Family Planning services receive a 90% federal match. Savings from averted Medicaid costs: The above cost is offset by the savings that result from the averted cost of Medicaid-funded births, which are estimated to be 15,814 in fiscal year 2006. This figure results from the 1.8 million estimated caseload, times a 7.61 fertility rate, times 50% for the number of potential eligibles who will enroll in the waiver, times 50% for the number of these women who participate in family planning services, times 92%, which is the assumed average effective rate of contraception. The cost of delivery and newborn care is estimated to be $8,448 in each year. The FY 2006 savings are phased in, for a savings of $133.6 million in All Funds. Medicaid services receive a 60% federal match. Technology There is no significant impact to the agency’s information technology. Local Government Impact The expansion of Medicaid-funded services could benefit local health districts and hospitals.

B-57
Source Agencies: 529 Health and Human Services Commission, 537 Department of State Health Services LBB Staff: JOB, CL, PP, MB, KF Appendix Source: Texas Legislative Budget Board, Fiscal Note for SB747 (March 22, 2005), available at http://www.capitol.state.tx.us/cgi-bin/tlo/textframe.cmd?LEG=79&SESS=R&CHAMBER=S& BILLTYPE=B&BILLSUFFIX=00747&VERSION=1&TYPE=F, accessed March 22, 2005.

B-58
Medicaid and the State Children’s Health Insurance Program in Texas: Appendix D. Alternative HIFA Proposals This proposal for expansion of coverage to parents and childless adults is a three-step approach:
1) Consider a hypothetical section 1931 expansion to parents. The 1931 expansion would require a state plan amendment (not a waiver) and would expand Medicaid to all parents of children under 19 up to a certain agreed-upon income. It is called “hypothetical” because the state would not actually implement the 1931 expansion in this plan unless the next two steps were going to be implemented, but by saying that the state is considering it, the state can use this expenditure projection as the “without the waiver” projection in a test for budget neutrality for the 1115 HIFA waiver (1115 waivers have to be budget-neutral but 1931 expansions do not, so 1931 would raise the expenditure level that the HIFA waiver would have to keep within).
2) Propose a HIFA waiver reducing benefits and applying cost-sharing to this new population. The HIFA waiver could propose to waive the requirement that optional populations must receive the same benefits as mandatory populations. HIFA guidelines also say that states can require a higher level of cost-sharing on optional and expansion populations.
3) Propose that the HIFA waiver expand a reduced benefits package and cost-sharing to uninsured childless adults. This would use the savings from the reduced benefits package and cost-sharing implemented to extend Medicaid to childless adults under a certain income. These benefits would be the reduced package offered to the 1931 expansion population, and enrollment could be capped if needed to control costs.
This model does not provide as many benefits as the traditional Medicaid benefits package to the new enrollees, however, it does not take away any benefits from current Medicaid eligibility groups, and it extends coverage to additional adults without health insurance. The cost estimates in the following table were created in 2002 and used the following assumptions: 1) Texas Medicaid matching rate of $.5999 for 2002, 2) used March Current Population Survey number of uninsured parents and childless adults averaged over last three years, 3) decreasing participation rates as premiums increase as reported in an article in Inquiry, 4) a specific phase-in period, 5) specified average costs per participant, and 6) a 6 percent inflation factor. (See Kegler pp. 100-112 for more details.) Note that costs, number of potentially eligible people, and other factors may have changed in the past three years and these numbers are for illustration only

B-59
Estimates for Selected HIFA Expansion Models in Texas, 2002 FPL of
Parents/FPL of Childless
Adults: Cost-sharing
Percent Benefits Package of
Mandated TANF Adults
Premium per Member per
Month
Amount of State Revenue Needed over Five Years
Amount of State Revenue Needed
for the Next Biennium
Number of Uninsured
Texans Covered
100/50: 0% 54.04% $136.75 $985,482,000 $360,197,000 290,419 150/50: 0% 65.87% $166.64 $1,572,433,000 $590,920,000 390,966 200/50: 0% 71.90% $181.90 $2,084,811,000 $783,472,000 474,879 200/100: 0% 60.83% $153.89 $$2,084,811,000 $783,472,000 561,325 100/50: 2% 54.05% $136.75 $643,756,000 $241,924,000 195,058 150/50: 2% 65.87% $166.64 $1,056,112,000 $369,887,000 262,589 200/50: 2% 71.90% $181.90 $1,400,246,000 $526,212,000 318,948 200/100: 2% 60.83% $153.89 $1,400,246,000 $526,212,000 377,010 100/50: 5% 54.05% $136.75 $243,197,000 $91,393,000 73,688 150/50: 5% 65.87% $166.64 $398,976,000 $149,935,000 99,200 200/50: 5% 71.90% $181.90 $528,982,000 $198,792,000 120,492 200/100: 5% 60.83% $153.89 $528,982,000 $198,792,000 142,426
Source: Elizabeth Raye Kegler, “Utilizing Federal Waiver Flexibility to Expand Medicaid to Adults in Texas” (Professional Report, Lyndon B. Johnson School of Public Affairs, The University of Texas at Austin, May 2002), p. 117.
Sources for Appendix: Elizabeth Raye Kegler, “Utilizing Federal Waiver Flexibility to Expand Medicaid to Adults in Texas” (Professional Report, Lyndon B. Johnson School of Public Affairs, The University of Texas at Austin, May 2002), pp. 100-119; and Charles Milligan, Section 1115 Waivers and Budget Neutrality: Using Medicaid Funds to Expand Coverage (State Coverage Initiatives Issue Brief, May 2001, p. 4), available at http://statecoverage.net/pdf/issuebrief501.pdf, accessed February 28, 2005.

B-60
References American Academy of Pediatrics. State Children’s Health Insurance Program. Available at
http://www.aap.org/advocacy/schipsum.htm.
American Society of Consultant Pharmacists. Summary of H.R. 1, Medicare Prescription Drug, Improvement, and Modernization Act of 2003, P.L. 108-173. Available at http://www. ascp.com/medicarerx/docs/CMS_MMA.pdf#search='Medicare%20Prescription%20Drug%20Improvement%20and%20Modernization%20Act%20of%202003%20Medicaid%20DSH.
Association of American Medical Colleges. Teaching Hospital and Physician Provisions in the Medicare, Medicaid, and SCHIP Benefits Improvement and Protection Act of 2000. Available at http://www.aamc.org/advocacy/library/teachhosp/hosp0036.htm.
Bexar County Hospital District, University Health System. “1115(A) Medicaid Research and Demonstration Waiver Concept Paper.” San Antonio, Tex. Draft, August 2002.
Birnbaum, Michael. Expanding Coverage to Parents through Medicaid Section 1931 (State Coverage Initiatives Issue Brief, May 2000). Available at http://www.statecoverage.net/ pdf/issuebrief500.pdf.
Children’s Defense Fund. Children’s Defense Fund and 72 Organizations Petition Congress to Restore $1.1 Billion in Insurance Funds for Children. Press Release. Available at http://www.childrensdefense.org/pressreleases/041115.asp.
Center for Public Policy Priorities. Update on Medicaid and CHIP Cuts: What Was Restored in Recent Actions? September 2004. Available at http://www.cppp.org/products/ PP217.html.
Center on Budget and Policy Priorities. Administration Plan for Expiring SCHIP Funds Would Weaken Program. October 6, 2004. Available at http://www.cbpp.org/10-6-04health-fact.htm.
Centers for Medicare and Medicaid Services. “Information Regarding the Provision of Prenatal Care to Unborn Children Under SCHIP.” Letter to State Health Officials, SHO #02-004, November 12, 2002. Available at http://www.cms.hhs.gov/states/letters/sho111202.pdf.
Centers for Medicare and Medicaid Services. State Children’s Health Insurance Program (SCHIP). Various webpages linked to http://www.cms.hhs.gov/schip.
Centers for Medicare and Medicaid Services. Welcome to Medicaid. Various webpages linked to http://www.cms.hhs.gov/Medicaid.

B-61
“Changing Course on Insurance for Kids? Restoring Benefits, Boosting Enrollment are Lawmakers’ Goals.” Austin American-Statesman (December 20, 2004), pp. A1, A11.
City of Austin/Travis County. “City of Austin/Travis County 1115 Medicaid Waiver Concept Paper.” Austin, Tex. Draft, October 2003.
Community Action Network. Campaign to Restore CHIP: Legislative Alert! Available at http://www.caction.org/leg_agenda/CHIPCutsFactSheet.pdf#search='restore%20CHIP %20cuts%20Texas'.
Coughlin, Teresa A., and David Liska. The Medicaid Disproportionate Share Hospital Payment Program: Background and Issues. Urban Institute, October 1, 1997. Available at http://www.urban.org/url.cfm?ID=307025.
Dunkelberg, Anne. “Public Programs to Improve Health Coverage.” Presentation to the Task Force on Access to Health Care in Texas, December 14, 2004. Available at http://www.utsystem.edu/hea/taskforce/Media/Dunkelberg121404.pdf.
Dunkelberg, Anne, and Molly O’Malley. Children’s Medicaid and SCHIP in Texas: Tracking the Impact of Budget Cuts. Kaiser Commission on Medicaid and the Uninsured, July 2004. Available at http://www.kff.org/medicaid/7132.cfm.
El Paso County Hospital District. “1115 Research and Demonstration Waiver Concept Paper.” El Paso, Tex. Draft, November 2003.
FamiliesUSA. Medicaid and Children’s Health. Various webpages linked to http://www.familiesusa.org.
Fenz, Caton. Leverage Local Funds to Expand Coverage in Lean Times. State Coverage Initiatives Issue Brief, February 2003. Available at http://www.statecoverage.net/ pdf/issuebrief203.pdf.
Finegold, Kenneth, Laura Wherry, and Stephani Schardin. Block Grants: Details of the Bush Proposals. Washington, D.C.: The Urban Institute, April 2004.
Florida Agency for Health Care Administration. Empowered Care: A Proposed Concept for Florida Medicaid. Draft, March 14, 2005. Available at http://www.empoweredcare. com/docs/empoweredcare_proposed_concept.pdf.
Florida House of Representatives, Health Care General Committee. “Committee Meeting Packet for March 16, 2005.” (Including draft legislation of “Medicaid Reform Act of 2005,” March 14, 2005).
“Gov. Bush Proposes Medicaid Revamp.” St. Petersburg Times (January 12, 2005). Available at http://www.sptimes.com/2005/01/12/State/Gov_Bush_proposes_Med.shtml.
Hansen, Hunter, and Company, P.C. Medicare, Medicaid, and SCHIP Benefits Improvement and Protection Act of 2000: Highlights. Available at http://www.hhc-cpa.com/

B-62
downloads/bipa.pdf#search='Medicare,%20Medicaid,%20and%20SCHIP%20Benefits%20Improvement%20and%20Protection%20Act%202000.
Health Management Associates. Long Range Planning Issues for the Dallas County Hospital District. November 2004. Available at http://www.healthmanagement.com/files/ Dallas.pdf.
Holahan, John, and Alan Weil. Medicaid Moving in the Wrong Direction? The Urban Institute, June 2003. Available at http://www.urban.org/url.cfm?ID=900638.
Holahan, John, and Mary Beth Pohl. States as Innovators in Low-Income Health Coverage. The Urban Institute, June 2002. Available at http://www.urban.org/url.cfm?ID=310519.
House Select Committee on State Health Care Expenditures. Interim Report 2004: A Report to the House of Representatives, 79th Texas Legislature. Austin, Tex., November 2004. Available at http://www.house.state.tx.us/committees/reports/78interim/ healthcareexpenditures.pdf.
Hurley, Robert E., and Stephen A. Somers. “Medicaid and Managed Care: A Lasting Relationship?” Health Affairs, vol. 22, no. 1 (January/February 2003), pp. 77-88. Available at http://content.healthaffairs.org/cgi/reprint/22/1/77.
Kaiser Commission on Medicaid and the Uninsured. The Medicaid Resource Book. Available at http://www.kff.org/medicaid/2236-index.cfm.
Kaiser Family Foundation. Daily Health Policy Report, State Watch: Texas To Partially Restore CHIP Program Coverage of Mental Health, Substance Use Treatment (October 22, 2003). Available at http://www.kaisernetwork.org/daily_reports/rep_index.cfm?hint= 3&DR_ID=20489.
Kegler, Elizabeth Raye. “Utilizing Federal Waiver Flexibility to Expand Medicaid to Adults in Texas.” Professional Report, Lyndon B. Johnson School of Public Affairs. The University of Texas at Austin. May 2002.
Lyndon B. Johnson School of Public Affairs. Investing in Texas: Financing Health Coverage Expansion, Conference Background Papers. Center for Health and Social Policy, Policy Paper no. 2. Austin, Tex., 2003.
Milligan, Charles. Section 1115 Waivers and Budget Neutrality: Using Medicaid Funds to Expand Coverage. State Coverage Initiatives Issue Brief, May 2001, p. 4. Available at http://statecoverage.net/pdf/issuebrief501.pdf.
Office of Management and Budget. 2006 Budget, Department of Health and Human Services. Available at http://www.whitehouse.gov/omb/budget/fy2006/hhs.html.
Office of Management and Budget. Department of Health and Human Services, HHS Priorities. Available at http://www.whitehouse.gov/omb/budget/fy2005/hhs.html.

B-63
Office of Management and Budget. Historical Tables, Budget of the United States Government, Fiscal Year 2005, Table 16.1. Available at http://www.whitehouse.gov/omb/budget/ fy2005/pdf/hist.pdf.
Offices of State Senator Judith Zaffirini and State Representative Garnet Coleman. Governor Perry Vetoes Omnibus Medicaid Bill. Press Release, June 18, 2001. Available at http://www.senate.state.tx.us/75r/senate/members/dist21/pr01/p061801a.htm.
Park, Edwin, and Matthew Broadus. Assessing the Administrations Claims that Extending $1.1 Billion in Expiring SCHIP Funds is not Necessary to Sustain Existing Children’s Enrollment. Center on Budget and Policy Priorities, September 30, 2004. Available at http://www.cbpp.org/9-30-04health.htm.
Park, Edwin, and Matthew Broadus. Congress Can Preserve $1.1 Billion in Expiring Children’s Health Insurance Funds and Help Avert SCHIP Cutbacks. Center on Budget and Policy Priorities, revised September 28, 2004. Available http://www.cbpp.org/8-31-04health.htm.
Powers, Pyles, Sutter, and Verville, P.C. Summary of Medicare, Medicaid, and SCHIP Benefits Improvement and Protection Act of 2000. Available at http://www.ppsv.com/issues/ giveback.pdf.
Romberg, Peggy. A Case for a Medicaid Women’s Health Care Waiver for Texas. Austin, Tex.: Women’s Health and Family Planning Association of Texas, updated December 2004.
Romberg, Peggy. Chief Executive Officer, Women’s Health and Family Planning Association of Texas, Austin, Texas. E-mail interview by Kristie Kimbell, January 13, 2005.
Schneider, Andy, and David Rousseau. “Upper Payment Limits: Reality and Illusion in Medicaid Financing.” Issue Paper, Kaiser Commission on Medicaid and the Uninsured. Washington, D.C.: Kaiser Family Foundation, February 2002.
Senate Finance Interim Subcommittee on Graduate Medical Education, Final Report on Medicaid Disproportionate Share Hospital Funding. Austin, Tex., May 2000. Available at http://www.lrl.state.tx.us/scanned/interim/76/f49meh.pdf.
Silow-Carroll, Sharon, and Tanya Alteras. Stretching State Health Care Dollars: Building on Employer-based Coverage. The Commonwealth Fund, October 2004. Available at http://www.cmwf.org/publications/publications_show.htm?doc_id=243629.
Social Security Act, Title XIX, sec. 1915. Available at http://www.ssa.gov/OP_Home/ssact/ title19/1915.htm.
Social Security Act, Title XXI, sec. 2104. Available at http://www.ssa.gov/OP_Home/ssact/ title21/2104.htm.

B-64
Texas Health and Human Services Commission. Application Template for Health Insurance Flexibility and Accountability (HIFA) Section 1115 Demonstration Proposal. Austin, Tex., December 9, 2004.
Texas Health and Human Services Commission. “CHIP Caseload and Cost 200409- LBJ School.xls.” Excel spreadsheet, January 2005.
Texas Health and Human Services Commission. “Final Non-State DSH Hospitals, 2002.” Excel spreadsheet.
Texas Health and Human Services Commission. “FY 05 Federal Alloc LAR.” Excel spreadsheet, January 2005.
Texas Health and Human Services Commission, Research and Evaluation Department. “Health Insurance Coverage of Texans in 2003.” Excel spreadsheet, October 2004.
Texas Health and Human Services Commission, Research and Evaluation Department. “Health Insurance Coverage Status as of 2003.” Excel spreadsheet, February 2005.
Texas Health and Human Services Commission. Texas Health and Human Services Commission. Various webpages linked to http://www.hhsc.state.tx.us.
Texas Health and Human Services Commission. Texas Medicaid in Perspective, 5th ed. June 2004. Available at http://www.hhsc.state.tx.us/medicaid/reports/PB5/ PinkBookTOC.html.
Texas House Bill 3122, 78th Legislature, Regular Session (2003).
Texas Impact. Dear Texas Budget Leaders: What are You Waiting For? Restore CHIP Now! Available at http://www.texasimpact.com/Pages/chip_home.htm.
Texas Legislative Budget Board. Fiscal Note for HB710, 79th Legislative Regular Session. April 20, 2005. Available at http://www.capitol.state.tx.us/cgi-bin/tlo/textframe.cmd?LEG=79&SESS=R&CHAMBER=H&BILLTYPE=B&BILLSUFFIX=00710&VERSION=1&TYPE=F.
Texas Legislative Budget Board. Fiscal Note for SB747. March 22, 2005. Available at http://www.capitol.state.tx.us/cgi-bin/tlo/textframe.cmd?LEG=79&SESS=R& CHAMBER=S&BILLTYPE=B&BILLSUFFIX=00747&VERSION=1&TYPE=F.
Texas Legislative Council, Research Division. Disproportionate Share Hospital Program: Your Questions Answered. March 2003. Available at http://www.tlc.state.tx.us/pubspol/ dshprogram.pdf.
Texas Senate Health and Human Services Committee. Interim Report to the 79th Legislature. December 2004. Available at http://www.senate.state.tx.us/75r/senate/commit/c610/ downloads/rpt_c610_dec2004.pdf.

B-65
TexCare. TexCare. Various webpages linked to http://www.texcarepartnership.com.
Transition Legislative Oversight Committee. Biennial Report December 2004. Draft December 10, 2004. Available at http://www.hhs.state.tx.us/consolidation/post78/1204_TLOC_ report.pdf.
U.S. Congress. Medicare Prescription Drug, Improvement, and Modernization Act of 2003, P.L. 108-173. Sec. 1001. Available at http://frwebgate.access.gpo.gov/cgi-bin/getdoc.cgi? dbname=108_cong_public_laws&docid=f:publ173.108.pdf.
U.S. Department of Health and Human Services. Medicaid and SCHIP Waivers: Promoting Flexibility and Innovation. Available at http://www.os.dhhs.gov/news/press/ 2001pres/01fsmedicaid.html.
U.S. Department of Health and Human Services. “State Children’s Health Insurance Program, Eligibility for Prenatal Care and Other Health Services for Unborn Children, Final Rule.” Federal Register, vol. 67, no. 191. October 2, 2002, p. 61956. Available at http://frwebgate.access.gpo.gov/cgi-bin/getdoc.cgi?dbname=2002_register&docid=02-24856-filed.pdf.
U.S. General Accounting Office. Medicaid: The Texas Disproportionate Share Program Favors Public Hospitals. Report to the Honorable Ronald D. Coleman, House of Representatives, GAO/HRD-93-86. Washington, D.C., March 1993.
Weil, Alan. “There’s Something about Medicaid.” Health Affairs, vol. 22, no. 1 (January/February 2003), pp. 13-30. Available at http://content.healthaffairs.org/ cgi/reprint/22/1/13.

Appendix C
An Analysis of Reform Options Developed by Other States
David C. Warner, Lauren R. Jahnke, and Kristie Kimbell

Appendix C
An Analysis of Reform Options Developed by Other States
Prepared by David C. Warner, Lauren R. Jahnke, and Kristie Kimbell Center for Health and Social Policy
LBJ School of Public Affairs The University of Texas at Austin
June 2005
Executive Summary This paper summarizes some of the issues and options in health insurance coverage, and lists some innovations adopted by several states in recent years to extend health insurance coverage to more people. Various aspects of health insurance coverage in Texas are studied, including demographics, Medicaid, SCHIP, small group incentives and private insurance regulation. Various initiatives are identified and examined with examples given for particular states. Case studies of five states are presented to examine the methods they have used to extend coverage. The states examined are Maine, Florida, Arkansas, Colorado and Minnesota. These states all have different programs and varying rates of uninsurance, with Minnesota the lowest rate in the nation. We conclude with some options that may work in Texas. Since Texas has the highest uninsurance rate in the nation, multiple initiatives will likely be needed to address the problem. These could include reforms to public programs like Medicaid and SCHIP, changes to insurance regulation (such as rate-setting and allowing the self-employed to buy into group plans), and more revenue for the Texas high-risk pool to subsidize a larger percentage of the premiums so more people can afford this option.
Introduction Various states in the U.S. have significantly different levels of health insurance coverage due to differences in incomes, structure of employment (some states have more high-wage manufacturing and are more highly unionized), generosity of Medicaid and State Children’s Health Insurance Program (SCHIP) eligibility levels, and even age structure (some states have significantly more elderly persons who are eligible for Medicare). De-linking Medicaid from welfare in the 1980s opened up the possibility for some states to be expansive about coverage. Washington and Minnesota were two states that greatly expanded coverage to poor children and their parents, while Massachusetts sought to follow Hawaii’s lead and to mandate that virtually all employers provide coverage (although in the Massachusetts’ case it was “pay or play”). The Massachusetts mandate did not survive nor did an ambitious plan in Vermont. Nonetheless, with the relative prosperity of the 1990s and some of the impact of HIPAA (the Health Insurance Portability and Accountability Act of 1996) that required the development of either high risk pools or guaranteed issue and the incentives afforded to states to expand children’s coverage through SCHIP, a number of states were able to push their uninsured rates near or less than 10 percent.

C-2
Encouraged by these low rates, Congress funded a number of states to study how they might drive the uninsured population even lower. Although the initial focus was on states with high coverage rates, State Planning Grants were also given to some of the states with high numbers of uninsured, such as Texas. At the same time the economic slow-down since 2000 has had an impact on a number of states and led to cutbacks in SCHIP and Medicaid, as well as in some of the more innovative partnerships developed with private insurers and providers.
Issues and Options for Extending Coverage States have adopted a number of strategies in recent years to attempt to extend or guarantee health insurance coverage to those who cannot otherwise obtain it for various reasons. These include the following options. Note that HIPAA requires guaranteed issue of group coverage and guaranteed renewal of individual coverage, but does not address insurer’s rating practices or the cost of insurance.191 It is difficult to determine to what extent each of these strategies might reduce the number of uninsured, since more than one initiative is usually in place and working in tandem where these have been implemented, and they are also subject to outside factors in the larger political and economic climate that affect industries, employment, and insurance . Developing premium assistance programs for employees or dependents through SCHIP and Medicaid that reimburse eligible employees for premiums paid for private coverage that substitutes in part for SCHIP or Medicaid coverage. Six states currently have a SCHIP employer buy-in program (including one inactive), which lets SCHIP funds be used to help pay for employer-sponsored plans for eligible people when they have access to one and the private plan would be more cost-effective than enrolling them in SCHIP.192 Ten states, including Texas, have Medicaid HIPP (Health Insurance Premium Payment) programs. These programs are employer buy-in programs for Medicaid-eligible people with access to employer-sponsored insurance and pay for premiums, coinsurance and deductibles when proven cost-effective for the state.193 Allowing families who do not qualify to buy SCHIP coverage at full price for their children. Four states have a full-cost SCHIP buy-in program, including Florida, which lets higher-income families buy SCHIP coverage for their children by paying the full premiums with no state subsidy.194 Establishing reinsurance pools to partially subsidize small group insurance coverage or improve individual access to coverage. Reinsurance pools assume a portion of insurers’ high-cost claims for individuals and/or groups, as well as help to stabilize the market, sometimes by subsidizing health insurance for small groups or low-income workers. At least 21 states have reinsurance pools, though many have very low enrollments or are inactive. Florida and Texas have active reinsurance pools, and Colorado and Minnesota have inactive ones.195 The Texas Department of Insurance recently recommended that Texas’ reinsurance pool be phased out, as mentioned in the section on Texas below. Passing legislation that permits the sale of limited-benefits policies that exclude a number of state-mandated benefits. This lets insurers and thus employers offer lower-cost insurance, though it does not cover all care that might be needed. The plans exclude some benefits and have high deductibles, limits on the number of doctor visits, and/or annual caps, so enrollees could develop serious medical conditions that exceed the coverage limits. At least 11 states have enacted or are considering legislation to allow insurance companies to sell limited-benefits policies, also called consumer-choice plans, to small groups, including Colorado, Florida,

C-3
Minnesota, and Texas.196 Texas law requires that all insurers that offer small-group coverage also offer limited-benefits policies — 41 in Texas. As of December 31, 2004, these plans had 14,000 enrollees in Texas, including 4,000 who were previously uninsured.197 Implementing pared-down benefit packages for Medicaid or SCHIP expansion populations under HIFA (Health Insurance Flexibility and Accountability) waivers. This approach is being further refined by the U.S. Department of Health and Human Services and HHS Secretary Mike Leavitt. See the section on Utah in the next part for more information on how that state increased coverage while decreasing benefits for some beneficiaries. Allowing group insurance purchasing arrangements or “pools” for small employers. These pools seek to combine purchasing power and negotiate lower rates from insurance companies or health maintenance organizations (HMOs) than each group member could get individually. There are several different types of group purchasing arrangements, including association health plans (AHPs), employer alliances or health insurance purchasing coalitions (HIPCs), and multiple employer welfare arrangements (MEWAs). The pools can be run by a state agency or established by individuals or employers, and may be for-profit or not-for-profit.198 It is difficult to determine the exact numbers of these pools since there are different types and they do not all have to register with any one authority. Texas used to have a state purchasing pool, and currently has several private pools. One example of a private pool is the Austin Chamber of Commerce, which announced in June 2005 that it was developing a pool for its small-business members in the Austin area. Small employers generally express interest in purchasing pools, but insurers are often not interested in working with them.199 Such pools generally become unaffordable over time due to adverse selection. Establishing state-operated high-risk pools for people whose pre-existing conditions and medical costs make it impossible or too expensive for them to obtain coverage in the private market. Funding to subsidize high-risk pools comes from government revenue or assessments on insurers. Premiums are generally higher than similar coverage would be in the individual market. Thirty-two states operate high-risk pools, including Texas, Arkansas, Colorado, Florida, and Minnesota.200 More information on some of these pools is contained in the profiles of individual states below. Establishing mandates for employers to provide health insurance. Hawaii is the only state with an employer mandate currently in force. It was enacted in 1974, and although somewhat similar mandates were passed in Massachusetts, Oregon, and Washington in the 1980s and early 1990s, none was implemented for various reasons.201 An employer mandate was also part of President Clinton’s health care reform plan in the mid-1990s. This model called for all employers to pay into regional pools from which employees could choose health plans.202 More recently, California passed the Health Insurance Act of 2003 in October 2003, but this example of a “pay or play” mandate was defeated by voters in a referendum in November 2004. This act would have required employers with 50 or more employees to either offer insurance coverage and pay at least 80 percent towards its cost, or to pay into a state purchasing pool which would have provided benefits for uninsured workers.203 Requiring employers to offer insurance could be found to be in violation of ERISA (the U.S. Employee Retirement Income Security Act of 1974), but by offering the option of “play or pay,” and carefully designing other features of a plan, it is thought that a state initiative of this type could withstand ERISA challenges.204 However, these plans are still often controversial.

C-4
Establishing state-only tax incentives that provide a tax deduction or credit to employers and individuals who purchase health insurance. A tax credit is subtracted directly from the amount of income tax owed, while a tax deduction is subtracted from taxable income, thus indirectly reducing the amount of tax owed. Most tax credits are non-refundable, meaning if the credit is more than the tax owed, the individual or company does not receive a refund for the difference. Fifteen states including Maine and Colorado provide tax relief in one of these ways, though the target populations vary. Many of these states offer credits or deductions to the self-employed or individuals (and their spouses and dependents), while several offer one of these to small groups or other employers. Beneficiaries do not have to have low incomes to qualify for most tax incentive programs as long as they meet eligibility criteria.205 Regulating insurance rates for small groups. Larger groups (often defined as 50 or more employees) are often not subject to the individual underwriting that smaller groups face from insurers. Therefore, rates for small groups can vary widely depending on the characteristics of individual employees in the group. While their exact formulas are proprietary, most insurance carriers calculate rates for small groups based on each applicant’s age, sex, occupation, and geographic location. Although HIPAA restricts the extent to which they can use individual health status, by using these other “manual rating methods” insurers can still have quite a wide rate band for small employers. Rates are calculated on the anticipated risks of each individual, and thus insurance rates for small groups can vary significantly based on the factors of one or a few individuals in the group with higher risk.206 Many states limit the amount of manual rating that is permitted for these small groups. The most extreme example of regulation is community rating, where no adjustments for risk are allowed between different types of people, so everyone in a community pays the same rates — see the information on New York in the next section for more details. Besides rate bands and community rating, the third type of small-group regulation is modified community rating, where insurers cannot vary premiums based on health status but can still use other factors like age and sex. In 2003, 47 states had regulations following one of these types of requirements, though the specifics of the regulations can vary widely. These included 35 states with different types of rate bands (including Texas), 10 states with modified community rating, and two states with pure community rating.207 Implementing guaranteed issue for individual policies. Only four states (Massachusetts, Maine, New Jersey, and New York) have guaranteed issue for all individual insurance policies, though a number of other states have more limited forms. These include guaranteed issue for certain types of policies, by certain carriers, or for certain people such as HIPAA-eligible people.208 (States must have a high-risk pool if they do not have guaranteed issue for the HIPAA-eligible.) To be considered HIPAA-eligible, people must meet all the criteria set forth in the HIPAA legislation, such as not having other insurance, not being eligible for Medicaid or Medicare, and using up all COBRA benefits if offered.209 Some feel that guaranteed issue without price controls or mandating coverage for everyone can be harmful in that it encourages people to seek insurance only when they think they will need it, creating adverse selection and forcing prices up, which causes more people to drop insurance, resulting in only the sick having insurance.210 Not all of these initiatives will work well in every state. Factors such as income levels, age distribution, number of immigrants, level of unionization, availability of public programs, and availability of employer-sponsored insurance influence the unique problems of each state’s uninsured population and which solutions might be more appropriate and effective. Appendix A shows all 50 states and some of the initiatives they have enacted to increase the number of people with access to health insurance.
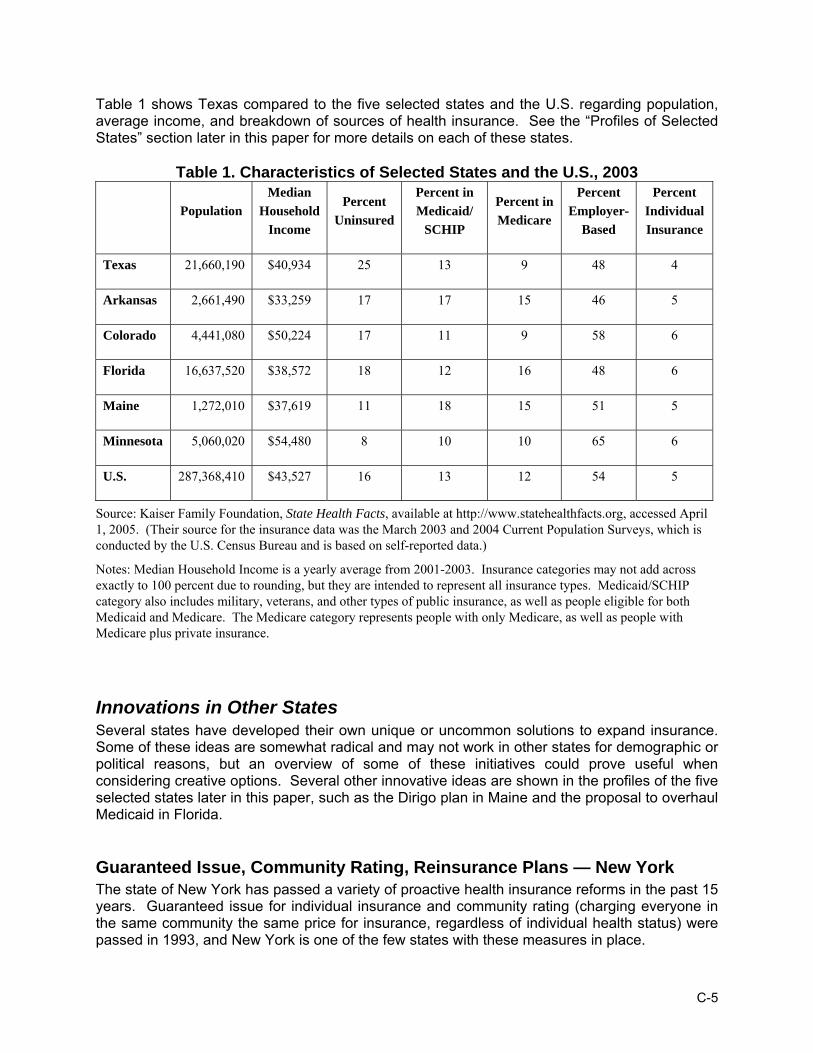
C-5
Table 1 shows Texas compared to the five selected states and the U.S. regarding population, average income, and breakdown of sources of health insurance. See the “Profiles of Selected States” section later in this paper for more details on each of these states.
Table 1. Characteristics of Selected States and the U.S., 2003
Population Median
Household Income
Percent Uninsured
Percent in Medicaid/
SCHIP
Percent in Medicare
Percent Employer-
Based
Percent Individual Insurance
Texas 21,660,190 $40,934 25 13 9 48 4
Arkansas 2,661,490 $33,259 17 17 15 46 5
Colorado 4,441,080 $50,224 17 11 9 58 6
Florida 16,637,520 $38,572 18 12 16 48 6
Maine 1,272,010 $37,619 11 18 15 51 5
Minnesota 5,060,020 $54,480 8 10 10 65 6
U.S. 287,368,410 $43,527 16 13 12 54 5
Source: Kaiser Family Foundation, State Health Facts, available at http://www.statehealthfacts.org, accessed April 1, 2005. (Their source for the insurance data was the March 2003 and 2004 Current Population Surveys, which is conducted by the U.S. Census Bureau and is based on self-reported data.)
Notes: Median Household Income is a yearly average from 2001-2003. Insurance categories may not add across exactly to 100 percent due to rounding, but they are intended to represent all insurance types. Medicaid/SCHIP category also includes military, veterans, and other types of public insurance, as well as people eligible for both Medicaid and Medicare. The Medicare category represents people with only Medicare, as well as people with Medicare plus private insurance.
Innovations in Other States Several states have developed their own unique or uncommon solutions to expand insurance. Some of these ideas are somewhat radical and may not work in other states for demographic or political reasons, but an overview of some of these initiatives could prove useful when considering creative options. Several other innovative ideas are shown in the profiles of the five selected states later in this paper, such as the Dirigo plan in Maine and the proposal to overhaul Medicaid in Florida.
Guaranteed Issue, Community Rating, Reinsurance Plans — New York The state of New York has passed a variety of proactive health insurance reforms in the past 15 years. Guaranteed issue for individual insurance and community rating (charging everyone in the same community the same price for insurance, regardless of individual health status) were passed in 1993, and New York is one of the few states with these measures in place.

C-6
New York passed the Health Care Reform Act of 2000, which included significant coverage expansions and market reforms to increase the availability of health insurance for uninsured individuals and small businesses (less than 50 employees) in the state. One of these new coverage options is Healthy New York. The Healthy New York plan has a streamlined benefits package and must be offered by all HMOs in the state to people who qualify (other types of insurers have the option of whether to participate). The only choice in the benefit plan is whether to pay extra for prescription drug coverage or not. The program is a state-subsidized reinsurance program that reimburses health plans for 90 percent of claims that they pay between $5,000 and $75,000 in a calendar year for each member.211 Small employers, sole proprietors, and individuals have a list of criteria to meet in order to qualify to buy Healthy New York, including such things as having not been insured in the last 12 months (with exceptions), a family member being employed in the last 12 months, and a household income below 250 percent FPL. Small employers have income limits on a percentage of their employees, and must contribute at least half of the premiums for employees (they do not have to contribute to the premiums for employees’ families). Premiums are community-rated and do not vary by eligibility category but can vary by county and HMO.212 As of December 2004, Healthy New York had 76,700 enrollees: 60 percent of these were working individuals, 20 percent were sole proprietors, and 20 percent were small-group employees. The state budgeted $49.2 million for Healthy New York for 2004, some of which is funded by tobacco taxes.213
Covering Parents under SCHIP—New Jersey and Others The Centers for Medicare and Medicaid Services issued guidelines in 2000 on how states could apply for 1115 waivers to allow their SCHIP programs to cover uninsured parents of SCHIP-eligible children. New Jersey, Rhode Island, Minnesota, and Wisconsin were the first states to obtain waivers for SCHIP parents (in 2001), and six more states had done so by 2002. The first four states had already been covering low-income parents through Medicaid waivers, Section 1931 expansions, and state-only funds, but obtaining the SCHIP 1115 waivers allowed them to receive the higher SCHIP matching rate for this population. It was easier for these first four states to apply for the waiver than it might be for other states because they were already covering a substantial number of low-income parents through other programs, thus they were not adding a large new population to the public insurance rolls. They also had not spent all of their SCHIP allotments at the time they applied for waivers, so they likely would have lost SCHIP money, unlike other states who already spend most or all of their SCHIP funds on children and thus do not have any left to cover parents.214 It is important to note that since funding for each state is capped under SCHIP, it is not necessary to show that the expansion will be revenue-neutral. The New Jersey SCHIP parent program (part of the New Jersey FamilyCare program, which also includes Medicaid recipients), was closed to new parent enrollment in June 2002 as enrollment exceeded expectations, causing funding problems. The state’s waiver application stated they would cap enrollment at 125,000, and in 2002 enrollment was 180,000. In order to be able to keep these additional parents enrolled, as well as enroll the 12,000 people who applied after the enrollment freeze, the state applied for and received an 1115 HIFA waiver in 2003 in order to standardize the benefit packages of parents with incomes under 133 percent FPL who are covered by a Medicaid 1931 to be the same as the benefits package for the parents from 133 percent to 200 percent FPL, which is equivalent to the most widely sold

C-7
commercial health insurance in the state. Allowing the Medicaid group to not receive the full Medicaid benefits package was expected to save money to cover more parents in the program. Permission was given for Medicaid funds to be used to cover these parents if SCHIP funds run out.215
Expanding Coverage through Reduced Medicaid Benefits — Utah Utah received an 1115 waiver in February 2002 to extend a limited Medicaid benefits package to low-income people that were not previously eligible, including childless adults. The state cut services and raised co-pays for some enrollees to fund the expansion, which was the first time this was done with an 1115 waiver. This is the prototypical HIFA option, though the waiver is not technically considered a HIFA waiver. The HIFA initiative, introduced in 2001, allows financing of a waiver by methods that were already allowed under 1115 waivers, but also provides several new ways of financing waivers (since waivers must be budget-neutral), such as reducing coverage, increasing cost-sharing requirements, and capping enrollment for the newly eligible expansion groups.216 One way that the Utah 1115 waiver differs from a HIFA waiver is that the state was allowed to cut some benefits for mandatory populations as well as for optional and expansion groups.217 Several other states have received HIFA-type waivers as well, but Utah is a good example of the major changes that can be implemented by increasing flexibility with benefits and cost-sharing, as most of the other states have not reduced Medicaid benefits for existing enrollees or increased cost-sharing.218 Utah’s waiver, called the Primary Care Network (PCN), expands Medicaid to uninsured adults aged 19 and older with incomes up to 150 percent FPL (originally estimated to be 25,000 people). In 2003, an amendment to the waiver was approved to provide a premium assistance option called Covered at Work (CAW), which subsidizes the employee’s portion of employer health insurance for up to five years. The waiver made changes such as reducing benefits, instituting an enrollment fee of $15 to $50 for people in the expansion populations and increasing hospital admission co-payments from $100 to $220.219 Benefits that were reduced for the mandatory population include eliminating non-emergency transportation and reducing mental health benefits. Benefits that were reduced for the optional population include cuts in dental, vision and speech services, and in the number of visits to physical therapists, chiropractors and psychiatrists. The PCN benefit package focuses on preventive care and does not include prescription drugs or inpatient hospitalization, however, the state negotiated a certain amount of donated care from hospitals and specialists to help those who need these services.220 No benefits are reduced for children, pregnant women, the disabled, or the elderly.221 The regular state plan Medicaid population has a maximum out-of-pocket expense cap of $500 per year; this cap is $1,000 for the PCN waiver population. As of December 31, 2004, 17,643 people were considered “State Plan Eligibles” and were enrolled in Utah’s reduced benefit plan. These are people who are eligible for Medicaid through Transitional Medical Assistance, Temporary Assistance to Needy Families or Medically Needy (who are not elderly, blind, or disabled). This does not include pregnant women, children, the disabled or the elderly, since benefits were not cut for these groups and thus they remain in what Utah terms “traditional Medicaid.” An additional 18,910 were enrolled in the Primary Care Network (the expansion population who were previously uninsured and who receive primary care benefits only), 67 people were enrolled in Covered at Work, and 82 people were enrolled in another demonstration population consisting of high-risk pregnant women with assets over $5,000 (the maximum allowed in the state’s traditional Medicaid program).222

C-8
Hospital Cost Containment — Maryland Maryland established a hospital cost containment system in 1974, when the state had some of the highest hospital costs in the nation. The Health Services Cost Review Commission (HSCRC) sets rates for hospitals, resulting in Maryland hospital rates changing from among the mostly costly to one of the most cost-effective in the U.S. One unique feature of this system is that all payers pay the same rates, and all must participate, so the costs of the uninsured are not spread just to a small group of commercial payors, but to all payors.223 When HSCRC was first implemented, it had authority only over the rates that hospitals charged to nonfederal purchasers, as Medicaid and Medicare laws did not allow state regulation. However, in 1977, Maryland received a waiver to test alternative payment approaches, which included Medicaid and Medicare, and in 1980 this arrangement became permanent, provided the program continued to meet federal standards. The HSCRC states that the waiver for this program “made it possible to achieve equitable pricing of hospital services for purchasers of care, creating consistent incentives for hospitals in dealing with the various types of payors.”224 HSCRC established base rates for each hospital in 1977 as a requirement for Medicare and Medicaid participation, and now hospitals are given an annual guide that shows how much they can charge for that fiscal year. In order to keep the waiver permanent, the state must show that the federal government’s payments per case in Medicare have not increased more rapidly in Maryland than in the rest of the nation over time. The rate system evolved for several decades and was successful at keeping cost increases below the national average for most years. Performance of the system began to slip in the 1990s and the system was redesigned in 2000. HSCRC states that “The goals of the redesign were to provide predictability and stability; be prospective in nature; recognize input cost inflation; be streamlined; and, be reflective of the national experience. Four major components of the Maryland payment system were established: 1) an annual update formula; 2) revamped full rate review process; 3) unit rates for each revenue center; and 4) an overall charge-per-case target.”225 There are many other significant components to the system, but these are the foundation of Maryland’s equitable payment system. Unlike other states, in Maryland, uncompensated care is covered by all payers including Medicaid and Medicare, so there are no charity hospitals in the state. Maryland is the only state that guarantees care for its citizens at any of its hospitals regardless of their ability to pay.226
Situation in Texas
State Demographics As of July 2004, Texas’ estimated population was 22,490,022.227 About 22 percent of the population had incomes under 100 percent of the federal poverty level (FPL) , and an additional 22 percent had incomes that were 100 to 199 percent FPL in 2003.228 Texas has a lower percentage of residents with employer-sponsored insurance than the national average and a much higher percentage of uninsured people. In 2003, 48 percent of the Texas population had employer-sponsored insurance; 4 percent had individual insurance; 13 percent had Medicaid, SCHIP, or other public insurance (including dual eligibles with Medicaid and Medicare); 9 percent had Medicare; and 25 percent were uninsured.229
Medicaid Eligibility Pregnant women become eligible for Medicaid at an income at 185 percent FPL or less. Medicaid eligibility for non-working parents is 14 percent FPL ($188 monthly income for a family

C-9
of three), and for working parents is 23 percent FPL for a family of three. The eligibility level for people on Supplemental Security Income (SSI) is 74 percent FPL. Texas has not implemented the option offered by the Omnibus Reconciliation Act of 1986 (OBRA ’86), which allows states to extend Medicaid benefits to aged, blind and disabled people with incomes up to 100 percent FPL, including using more flexibility with income and assets tests.230 Medicaid eligibility for children ages 0-1 is 185 percent FPL, ages 1-5 is 133 percent, and ages 6-19 is 100 percent FPL.231 There are additional limitations on family assets and a requirement that the person be a legal resident of the U.S. for at least five years before obtaining services.
Medicaid Financing Method Texas’ federal matching rate for Medicaid is 63.17 percent for fiscal year 2004, 60.87 percent for FY2005, and 60.66 percent for FY2006.232 The state portion of Medicaid funding comes mostly from general revenue, with a small part from tobacco settlement funds, hospitals and Federally Qualified Health Centers.233 Funding also comes from quality assurance fees paid by ICF/MRs (intermediate care facilities for the mentally retarded).234 Total Medicaid spending in Texas in FY 2003 was $15,280,859,187. The average Medicaid spending per enrollee in FY 2000 was $3,284. This varied from an average of $1,666 spent on each child to an average of $9,803 spent per enrollee in the blind and disabled group.235
Medicaid Benefits Medicaid in Texas offers inpatient and outpatient hospital services, skilled and intermediate care facilities, religious non-medical health care institution and practitioner services, and services at freestanding ambulatory surgery centers, federally qualified health centers, and rural health clinics. The following are types of benefits offered:
• Dental services, eyeglasses, hearing aids, and services for speech, hearing and language disorders (not dentures).
• Laboratory and X-ray services. • Medical equipment and supplies (not prosthetic and orthotic devices). • Early and periodical screening, diagnosis and treatment services; family planning
services; rehabilitation services (not substance abuse for adults). • Services by these health care providers: physicians, certified registered nurse
anesthetists, chiropractors, other medical and remedial care practitioners, dentists providing medical surgical services, nurse midwives, nurse practitioners, optometrists, podiatrists and psychologists.
• Prescription drugs. • Physical and occupational therapy services. • Ambulance services, non-emergency medical transportation services. • Home health services, hospice services and targeted case management (no personal
care services or private duty nursing services). • Intermediate care facilities for the mentally retarded, nursing facility services (no
inpatient institutional services).236
SCHIP Characteristics SCHIP is funded by both the federal and state governments like Medicaid. The federal share for SCHIP is 72.15 percent in Texas for FFY 2004 and the state share is 27.85 percent of each

C-10
dollar spent.237 Texas spent almost $330 million on SCHIP in FY 2004, including both federal and state funds.238 As of March 1, 2005, there were 328,350 children enrolled in SCHIP.239 This represents a steep decline from September 2003, right before cost-saving changes were implemented, when enrollment stood at 507,259.240 To qualify for SCHIP, children must be younger than 19, U.S. citizens or legal residents, not eligible for Medicaid or state employee coverage, not have private insurance, and have a family income below 200 percent of the federal poverty level.241 Families must also have assets within allowable limits (liquid assets such as cash and bank accounts, as well as some vehicle values, count toward the assets test, while real estate, retirement accounts, and certain other types of accounts are exempt).242 Families pay premiums, deductibles and co-payments that vary according to their income levels. The services that SCHIP beneficiaries can receive in Texas are the following:
• Doctor, hospital, X-ray and lab services; • Well-baby and well-child visits; • Immunizations; • Prescription drugs; • Durable medical equipment and prosthetic devices ($10,000 limit per enrollment period); • Case coordination and enhanced services for children with special health care needs
and children with disabilities; • Physical, speech and occupational therapy; • Home health care; • Transplants; • Limited mental health services; • Services that cover pre-existing conditions.243
Private Insurance Regulation and High-Risk Pool Texas has an 11.3 percent HMO penetration rate. Regarding small-group market reforms (applies to groups of 2 to 50), Texas does not apply community rating, limits pre-existing condition exclusions (to 12 months exclusion and 6 months look-back time), and mandates guaranteed issue and guaranteed renewability. Regarding individual insurance market reforms, Texas does not apply community rating, does not limit pre-existing condition exclusions, does not mandate guaranteed issue, and does mandate guaranteed renewability. The state mandates that patients have access to an external review board for filing complaints against their health plans, and mandates mental health parity of benefits (for “biologically-based mental illness”). Texas has a state COBRA expansion program of six months for small firms that are not covered by the federal COBRA law.244 For people who have been denied health coverage or could not afford the coverage they were offered, Texas has a high-risk pool started in 1997 and funded by enrollee premiums and assessments on insurers. The pool is led by a nine-member board of directors and selects a third-party administrator to run the program. The number of people who can afford the high-risk pool, however, is limited since the premiums are higher than average. The premiums in the pool cannot exceed 200 percent of the standard rate for commercial individual health insurance for the person’s gender, age and geographic area, and although rates were initially set lower, premiums are now at their legal maximum. Premiums do not cover all claims costs since the enrollees are high-risk and often need costly medical care, so losses beyond what are covered by premiums are paid though annual and interim assessments on HMOs and other health

C-11
insurers based on their amount of business in Texas. Premiums for Medicaid, Medicare and small group coverage are excluded from the assessment pool, as are ERISA plans. In 2003, the average monthly premium was $437, total claims paid were $171 million, and assessments on 210 insurers brought in $62.6 million. Texas’ high-risk pool has more than 25,000 enrollees, making it one of the largest pools in the country.245 Benefits in the high-risk pool are similar to the benefits of an average individual insurance plan, covering inpatient and outpatient care, prescription drugs and other services. Participants select an annual deductible from $500 to $5,000, then monthly premiums are determined by age group, sex, residence in one of six areas of the state and whether the person uses tobacco or not. Participants using the network pay 20 percent co-insurance up to an annual maximum of $3,000, and all enrollees have a lifetime maximum benefit of $1.5 million.246 To be eligible to enroll in the high-risk pool, a person must be a legal resident of Texas for at least 30 days, and a U.S. citizen or a permanent U.S. resident for at least three continuous years. Potential enrollees must show one of the following to qualify: 1) proof of refusal by an insurer to issue health insurance to the person based on health reasons, 2) certification from an insurance agent showing that the agent could not obtain coverage similar to the pool coverage due to health status, 3) offer of coverage or a current policy that excludes one or more medical conditions, 4) offer or current policy with substantially similar coverage to the pool but with higher premiums, or 5) diagnosis of a qualifying medical condition such as cancer, cardiovascular disease or cerebral palsy. A person can also qualify if he/she is a legal Texas resident who has had health insurance for the previous 18 months (with no break more than 63 days) if the coverage was through an employer-sponsored, church or government plan; who had health insurance under another state’s qualified HIPAA program but lost coverage due to moving to Texas, if the person applies for coverage in Texas within 63 days of losing previous coverage; or if the person is eligible under the Health Coverage Tax Credit Program. (This program is part of the Trade Act of 2002 and helps workers displaced through foreign trade obtain health insurance through a federal income tax credit; states have several options on how to implement this program and Texas chose its high-risk pool as the vehicle.) Spouses and children of people who qualify and enroll in the high-risk pool are also eligible.247
Incentives for Small Groups The Texas Legislature enacted group health insurance reforms in 1993, 1995 and 2003. Standard benefit plans and mandated benefits have changed over the years, as well as certain benefits for small groups. In the 1990s, the legislature authorized the formation of public and private small employer purchasing alliances, as well as directing the state to establish a statewide purchasing pool. The Texas Insurance Purchasing Alliance was successful at first but ended after five years due to various problems. New legislation would be needed to create another statewide purchasing pool, but the law already allows privately sponsored pools to form. As of September 2004 there was currently only one active fully insured alliance in Texas, with about 2,700 participants. Surveys carried out for Texas’ State Planning Grant activities showed that 95 percent of small employers surveyed wanted some form of purchasing pool, and that 72 percent did not know that Texas law already allows private pools. However, insurers interviewed expressed little interest in participating and did not think that purchasing pools would lower rates as much as expected.248 In 2003 the legislature authorized a new kind of purchasing pool called a health group cooperative, which can be made up of both small and large employers, and for which insurers can be exempted from having to provide all the state-mandated benefits.249 As of March 2005, there was one health group cooperative registered with the Texas Department of Insurance, based in Dallas.250

C-12
Another option for small businesses is reinsurance. The Texas Health Reinsurance System was established in the Texas Insurance Code (Chapter 26, subchapter F) for small-employer insurance carriers to reinsure risks covered under small employer health plans by spreading losses among members. Every insurance carrier who covers small groups must either join the system or request approval to become a “risk assuming carrier.” The system has a board of directors that determines the premiums to be charged to insurers for participating. The number of carriers participating in the system has been declining while claims have been decreasing, so the Texas Department of Insurance recently recommended to the Texas Legislature that the system be phased out. A report to the legislature claims that its smaller size does not allow enough spreading of risk, the small insurance market is strong, and small carriers can obtain reinsurance in the private market, so the state system has served its purpose and should be phased out in a nondisruptive way. Only about one-third of small carriers in the state (21) are considered “participating insurers” (the rest assume their own risk or obtain reinsurance elsewhere), and only 11 of those have ceded lives to the system, so only 342 lives are covered in the system.251 As mentioned previously, though HIPAA limits the use of individual health status in calculating group rates, insurers may still use this in a limited way, plus other variables such as age, sex, location, and type of industry. The rates in most states that have implemented rating reforms vary less than the rates in Texas. In Texas, the cost of insurance for small groups can vary widely based on the characteristics of individuals in the group. Texas law allows insurers of small groups to adjust premiums based on age, sex, location, industry and group size, plus an adjustment of 25 percent up or down for health status. When all variables are calculated according to each insurer’s formulas, the highest rate for a group cannot be more than 67 percent higher than the lowest rate for a group in the same class (with the same non-health-related characteristics).252 Although some information on rates and underwriting results for small groups and individuals policies may be reported to the Texas Department of Insurance, it has not to our knowledge been systematically assembled and examined to determine the condition of these markets. Medicaid and SCHIP Initiatives In Texas, 41.5 percent of Medicaid beneficiaries are enrolled in managed care, as compared to 60.2 percent for the U.S. as a whole.253 Texas does not have an 1115 waiver and has not used Section 1931 to expand Medicaid coverage. The state has five 1915(b) Freedom of Choice Waivers and seven 1915(c) Home and Community-Based Services Waivers.254 A bill for an 1115 women’s health waiver was passed by the 2005 Texas Legislature. Texas is one of 10 states with a Health Insurance Premium Payment (HIPP) program. HIPP is a Medicaid program that pays for private health insurance premiums (like employer-sponsored insurance), coinsurance, and deductibles for Medicaid-eligible people and their families, when it is shown to be cost-effective. Texas’ program was implemented in 1996.255 Texas is one of six states that offers extended eligibility for Transitional Medicaid Assistance (TMA) past the required 12 months. Texas and Tennessee offer it for 18 months and four other states offer it for 24 months. Transitional Medicaid was created in 1988 by the Family Support Act and the program has been extended several times.256 See the paper “Medicaid and the State Children’s Health Insurance Program in Texas: History, Current Arrangements, and Options” by David C. Warner, Lauren R. Jahnke, and Kristie Kimbell (April 2005) for more information on Medicaid and SCHIP in Texas.257

C-13
Profiles of Selected States It is useful to compare and contrast Texas to a few other states that differ in terms of income, percent uninsured, eligibility levels for public program, population and other factors. Florida, Arkansas, Colorado, Maine and Minnesota were all chosen for different characteristics of their health insurance landscapes. These may not be similar to Texas but a study of them can be helpful in terms of what might or might now work here and why, and in considering such questions as why poorer states like Arkansas and Maine have higher insured rates than Texas. By looking at a complete state package it is easier to see the broader state policy options.
Florida
State Demographics Florida had a population of 16.6 million in 2003. Seventeen percent of the population had incomes under 100 percent of the federal poverty level, and an additional 20 percent had incomes that were 100 to 199 percent FPL.258 Florida has a lower percentage of residents with employer-sponsored insurance than the national average, and a higher percentage of people on Medicare due to the older population. In Florida, 48 percent of the population had employer-sponsored insurance; 6 percent had individual insurance; 12 percent had Medicaid, SCHIP, or other public insurance (including dual eligibles with Medicaid and Medicare); 16 percent had Medicare; and 18 percent were uninsured in 2003.259
Medicaid Eligibility Medicaid eligibility for pregnant women in Florida is set at an income at 185 percent FPL or less. Medicaid eligibility for non-working parents is 23 percent FPL and for working parents is 62 percent FPL. There are different eligibility criteria for two other Medicaid groups: 74 percent FPL for people on Supplemental Security Income (SSI) and 90 percent FPL for the Aged, Blind and Disabled group.260 Medicaid eligibility for children ages 0 to 1 is 200 percent FPL, and ages 1-5 is 133 percent FPL. Eligibility for children ages 6 to 19 is 100 percent FPL.261
Medicaid Financing Method Florida’s federal matching rate for Medicaid is 61.88 percent for fiscal year 2004, 58.90 for FY 2005, and 50.89 for FY 2006.262 The state portion of Medicaid funding comes from general revenue, provider assessments, cigarette taxes, tobacco settlements funds, tobacco non-general funds, other non-general funds, state fraud recoupments and local county funds.263 Total Medicaid spending in Florida in FY 2003 was $10,989,070,010. The average Medicaid spending per enrollee in FY 2000 was $3,131. This varied from an average of $975 spent on each child to an average of $7,827 spent per enrollee in the blind and disabled group.264
Medicaid Benefits Medicaid in Florida offers outpatient hospital services and services at freestanding ambulatory surgery centers, public and mental health clinics, federally qualified health centers, religious non-medical health care institutions and rural health clinics. It also offers inpatient hospital services. The following are types of benefits offered:
• Dental services, eyeglasses, hearing aids (dentures and services for speech, hearing, and language disorders are not covered).
• Laboratory and X-ray services.

C-14
• Medical equipment and supplies, prosthetic and orthotic devices (no physical therapy or occupational therapy covered).
• Early and periodical screening, diagnosis and treatment services; family planning services; rehabilitation services (mental health and substance abuse).
• Services by these health care providers: chiropractors, dentists providing medical surgical services, nurse midwives, nurse practitioners, optometrists, physicians and podiatrists (not psychologists).
• Prescription drugs. • Ambulance services, non-emergency medical transportation services. • Home health services, hospice services, targeted case management (no personal care
services or private duty nursing services). • Institutional services: institutions for mental disease, intermediate care facilities for the
mentally retarded, nursing facility services (no inpatient psychiatric services under age 21 or inpatient hospital nursing facility and intermediate care facility services for mental disease age 65 and older).265
SCHIP Characteristics Florida has a combination Medicaid-SCHIP program. There are two SCHIP-funded programs in Florida, MediKids for ages 1-4 and Healthy Kids for ages 5-19 (and their younger siblings in some locations).266 These programs, plus two others – Children’s Medical Services Network (CMS, for children with special health care needs) and Children’s Medicaid – make up Florida’s KidCare program. There is one enrollment point where applicants are screened to see which program they qualify for. Medicaid enrollees are accepted at any time, however, there are specific enrollment periods for the other three programs, and they are not entitlement programs, so there may be waiting lists.267 The federal share for SCHIP in Florida is 71 percent for FFY2005 and the state share is 29 percent of each dollar spent. Florida spent $388.5 million on SCHIP in FY 2004, including both federal and state funds. As of December 2003, there were 319,477 children enrolled in SCHIP in Florida.268 To qualify for SCHIP, children must be younger than 19, a U.S. citizen or legal resident, not eligible for Medicaid or state employee coverage, not have private insurance, and have a family income below 200 percent of the federal poverty level.269 MediKids and CMS Network offer the same benefits as Medicaid, except for waiver services.270 Healthy Kids includes the medical services that the state was already providing before SCHIP, since Florida was one of three states with existing programs grandfathered in to the SCHIP legislation, and also includes enhanced mental health and dental services.271 Florida implemented an enrollment freeze for SCHIP in July 2003 due to insufficient funds, and maintained waiting lists of potential enrollees. In June 2004, Florida allocated funds to enroll the children who were on the list as of March 2004, and then disbanded the waiting list, telling families who applied after March 11, 2004, that they would have to reapply during future open enrollment periods. This only applies to SCHIP-funded programs — Medicaid enrollment cannot be limited and applications are screened for Medicaid eligibility.272
Private Insurance Regulation Florida has a 25.2 percent HMO penetration rate. Regarding small-group market reforms (applies to groups of 1-50), Florida applies community rating, limits pre-existing condition

C-15
exclusions (to 12 months exclusion and 6 months look-back time), and mandates guaranteed issue (through a high-risk pool) and guaranteed renewability. Regarding individual insurance market reforms, Florida does not apply community rating, limits pre-existing condition exclusions, and mandates guaranteed issue (through a high-risk pool) and guaranteed renewability. Florida has a state-sponsored high-risk pool with 638 enrollees as of December 2002. Florida has a state COBRA expansion program to 18 months for small firms.273
Incentives for Small Groups The Governor’s Task Force on Access to Affordable Health Insurance, created in 2003, recommended that Florida establish purchasing pools for small groups (2-25), and this was implemented by the Florida legislature in 2004. The Small Employers Access Program was appropriated $250,000 and is authorized to solicit bids for standard and alternative benefit packages, but one provision recommended by the task force was not in the final bill, which was allowing the winning bidder in each geographic region the exclusive opportunity to provide coverage to small groups in that region. Not having this could weaken the market for potential bidders. The Office of Insurance Regulation is talking to small group carriers about interest in the program and implementation. Just as in Texas, some group carriers have expressed skepticism about purchasing pools and reluctance to participate.274 Florida’s Health Care and Insurance Reform Act of 1993 created 11 Community Health Purchasing Alliances (CHPAs) and implemented other significant insurance reforms on the small group market.275 The CHPAs developed from a pilot project funded by the Robert Wood Johnson foundation, and the program went statewide in 1993 with the legislation. Other reforms were adopted at the same time including guaranteed availability to small employers and modified community rating, requiring carriers to pool their small groups for rating purposes, so these made the CHPAs not as important. They had a costly infrastructure and carriers began to drop out by 1997, so they were repealed in 2003 and replaced with Health Care Alliances, which were also not embraced by insurers.276
Medicaid and SCHIP Initiatives In Florida, 64.3 percent of Medicaid beneficiaries are enrolled in managed care.277 Florida has a family planning waiver that extends family planning services for up to two years for women who were pregnant and on Medicaid and who would have lost these services 60 days postpartum.278 Florida has used Section 1931 to expand Medicaid coverage by increasing income disregards. After a beneficiary has been enrolled for 12 months or more, the state may disregard a family’s first $200 in monthly earnings and 50 percent of the remaining monthly earnings before calculating if families’ incomes are below the eligibility level to qualify for Medicaid.279 Florida has a full-cost buy-in program for parents to buy SCHIP insurance at full cost for children ages 5 to 9 with family incomes over 200 percent FPL.280 Not counting waivers that are pending or have expired, Florida has three 1915(b) Freedom of Choice Waivers (for managed care, children’s inpatient psychiatric services, and non-emergency transportation). Florida has three current 1915(c) Home and Community-Based Services Waivers, for disability services, brain and spinal injuries, and cystic fibrosis. The state has three 1115 waivers: the family planning waiver, a waiver for a pharmacy program for Medicare recipients, and a cash and counseling program.281
Other Health Insurance Reforms/Initiatives Florida Governor Jeb Bush recently proposed a fundamental restructuring of Florida’s Medicaid program to control growing costs. He and his staff outlined a program where the state would

C-16
pay the premiums for Medicaid beneficiaries to enroll in private health plans offered by insurance companies and HMOs, including an employer’s plan if a beneficiary has access to employer-sponsored insurance. Gov. Bush said the state can predict and control costs better by calculating a premium for each Medicaid patient and allowing for an appropriate rate of growth. Since the state would pay the health plans instead of the providers directly, this new government-funded insurance program would have to be approved by the state and the federal government, and the governor hopes to get these approvals by the end of 2005. He said it is not clear yet whether federal approval will include a cap on federal funds and if so, if the state or patients would be required to pay more if costs increase more than expected.282 In this proposal, the private plans would set limits on care and coverage, and savings is expected to come from competition between plans for patients. Basic services covered currently (mandatory and optional Medicaid services) would still be covered, and health plans could offer additional services to attract patients, giving them a choice on the best plans for their health situations. Beneficiaries who take responsible health measures, like participating in disease management programs or immunizing their children, could earn credit for enhanced Medicaid services like over-the-counter drugs. There would be a cap on Medicaid benefits to decrease some of the financial risk for insurers, and patients who reached the cap would be covered by a catastrophic care fund created from a percentage of premiums.283 A concept paper was published in March 2005 outlining the proposed reforms,284 and several bills were considered by the Florida Legislature in April and May 2005 to allow the state to apply for an 1115 HIFA waiver to implement some of the changes.285 In May 2005, the legislature passed Senate Bill 838,286 which allows pilot projects in five Florida counties to test Governor Bush’s managed-care-only Medicaid model, after a federal waiver is obtained. The Florida Agency for Health Care Administration can still request a waiver to implement the governor’s full program, but the bill requires that the legislature approve the implementation in the state of any waiver that CMS approves for the pilot project.287
Arkansas
State Demographics Arkansas had a population of 2.6 million in 2003. Twenty-two percent of the population had incomes below 100 percent FPL, and an additional 22 percent had incomes between 100 and 199 percent FPL.288 Arkansas has a lower than national average percentage of residents with employer sponsored insurance and higher than national average percentages on Medicaid and Medicare and who are uninsured. In Arkansas in 2003, 46 percent of the residents had employer sponsored insurance; 5 percent had individual insurance; 17 percent had Medicaid, SCHIP or other public insurance (including dual eligibles with Medicaid and Medicare); 15 percent had Medicare; and 17 percent were uninsured.289

C-17
Medicaid Eligibility For pregnant women in Medicaid the eligibility level is 200 percent of FPL. For working parents the eligibility level is 20 percent of FPL and for non-working parents, 16 percent of FPL. Eligibility for individuals on SSI is 74 percent; there is not eligibility extension for aged, blind, and disabled (through OBRA ’86). Arkansas has no state supplemental program. For children ages 0-19 years, eligibility has been extended to 200 percent of FPL with an 1115 waiver.290 The Medically Needy program is limited to parents with incomes below 22 percent of FPL.291
Medicaid Financing Method Arkansas’ federal matching rate for Medicaid is 77.62 percent for fiscal year 2004, 74.75 percent for 2005, and 73.77 for 2006.292 Total Medicaid spending in 2003 was $2,465,444,536. Per enrollee spending (in FY2000) was $2,966 (national average $3,762). Per enrollee spending ranged from $1,222 (children) to $7,414 (elderly) in FY 2000. In 1992, the state instituted a soft drink tax, the proceeds of which are paid directly to the Arkansas Medicaid Trust Fund.293 In May 2003, the state legislature approved new taxes on cigarettes, other tobacco products, and individual incomes to help cover growing Medicaid expenditures.294
Medicaid Benefits Medicaid in Arkansas offers outpatient hospital services and services at freestanding ambulatory surgery centers, public and mental health clinics, federally qualified health centers, and rural health clinics. It also offers inpatient hospital services. The following are types of benefits offered:
• Dental; dentures; eyeglasses; hearing aids; and services for speech, hearing and language disorders.
• Lab and X-ray. • Medical equipment and supplies; and prosthetic and orthotic devices. • EPSDT; family planning; and rehab services (mental health and substance abuse). • Services by these health care providers: certified registered nurse anesthetist,
chiropractor, dentists providing medical surgical services, nurse midwife, nurse practitioner, optometrist, physician, podiatrist, psychologist.
• Prescription drugs. • Physical and occupational therapy services. • Ambulance services, non-emergency medical transportation services. • Home health services, hospice services, personal care services, private duty nursing
services, targeted case management. • Institutional services: inpatient psychiatric services under age 21, inpatient hospital
nursing facility and intermediate care facility services for mental disease age 65 and older, institutions for mental disease, intermediate care facilities for the mentally retarded, nursing facility services.295
SCHIP Characteristics The federal share for SCHIP in Arkansas is 82 percent for FFY 2005 and the state share is 18 percent of each dollar spent.296 Arkansas spent $1.9 million on SCHIP in FY 2002, including both federal and state funds.297 In 1998, phase one of the Arkansas SCHIP plan expanded

C-18
Medicaid to children born after September 30, 1982, and prior to October 1, 1983, whose family income was at or below 100 percent of FPL. In 2001, an amendment to the program was approved allowing Arkansas to establish a separate child health program, which essentially covered the children from 150 to 200 percent of FPL already served under the ARkids B Medicaid waiver expansion program. The application form, ID card, and benefit package remained the same for the ARkids B expansion program.
Private Insurance Regulation Arkansas has a.7.0 percent HMO penetration rate. Regarding small-group market reforms (applies to groups of 2-50), Arkansas does not apply community rating, limits pre-existing condition exclusions (to 12 months exclusion and 6 months look-back time), and mandates guaranteed issue and guaranteed renewability. Regarding individual insurance market reforms, Arkansas does not apply community rating, does not limit pre-existing condition exclusions, and mandates guaranteed issue and guaranteed renewability. Arkansas has a high risk pool funded by premiums and assessments on insurers. High risk pool rates are capped at 200 percent of the rate that would be charged in the private insurance market for a healthy individual of the same age. There is no annual limit, but a life-time maximum of $1 million. There is no enrollment cap, but a waiting period of six months. The state mandates that patients have access to an external review board for filing complaints against their health plans, and mandates mental health parity of benefits. Arkansas has a state COBRA expansion program, up to 120 days, for small firms.298
Incentives for Small Groups In 2001, the Arkansas General Assembly passed several health reforms targeting access for individuals. The reforms included scaled-down insurance policies (exemption from state-mandated coverage benefits), small-employer purchasing groups, and a demonstration project allowing communities to self-insure to provide coverage.299
Medicaid and SCHIP Initiatives In Arkansas, 69.4 percent of Medicaid beneficiaries are enrolled in managed care, as compared to 60.2 for the U.S. as a whole. Arkansas has a family planning waiver that extends family planning services to women up to 200 percent FPL.300 Arkansas has used Section 1931 to expand Medicaid coverage by increasing income disregards; the state may disregard a family’s first $120 in monthly earnings and one-third of the remaining monthly earnings before calculating if families’ incomes are below the eligibility level to qualify for Medicaid.301 Other current comprehensive state health reform 1915 and 1115 waivers:
• ConnectCare: 1915(b) — managed care through a PCCM model for children’s Medicaid.
• ARkids B: an 1115 Waiver originally approved in 1997, which expands Medicaid coverage for kids through age 18 up to 200 percent FPL.
• Tefra: an 1115 waiver which provides Medicaid coverage for disabled children (SSI definition) whose parental income is less than the long-term care income limit; child’s asset limit must be below $2000.
• Family Planning Waiver: (since 1995) providing Medicaid coverage to women ages 14 to 44 years, now up to 200 percent FPL.
• Ticket to Work Medicaid Buy-In: for low-income (up to 250 percent FPL) disabled adults intending to remain in the workforce.302

C-19
Pending Waivers:
• Arkansas Senior Rx 1115 Waiver: to establish prescription drug coverage, up to two prescriptions per month, for non-institutionalized elderly at up to 90 percent FPL. This waiver is currently on hold.
• Arkansas Employer Sponsored Insurance Initiative: a HIFA waiver, which was scheduled to begin on July 1 2003, to provide health insurance coverage to an additional 55,000 residents of the state of Arkansas with incomes at or below 200 percent of the federal poverty level, using SCHIP funds, state general revenue (employer taxes calculated based on the size of the business) and cost-sharing. The waiver is pending.303
Other Health Insurance Reforms/Initiatives Despite its history as a state with a high percentage of low-income individuals, low levels of employer-sponsored insurance, low Medicaid coverage for adults, and relatively poor health status, Arkansas has more recently been noted for its pursuit of coverage expansion. Arkansas’ Medicaid expansion, ARkids B, which expanded eligibility to currently uninsured children through age 18 with family income at or below 200 percent FPL, has been considered a considerably progressive initiative. There is no presumptive eligibility although retroactive eligibility extends three months back. The application process mirrors that of Medicaid, may be done by mail, and is only renewed every 12 months. There is no asset testing for Medicaid or ARkids B. The eligible child must not have had insurance other than Medicaid in the prior six months (unless it was lost through no fault of the applicant). ARkids B includes a reduced benefit package and operates as a fee-for-service primary care case management model. Since the establishment of ARkids B, the state has sought several additional expansion waivers, described above: the Senior Rx waiver, the Medicaid Employer Buy-In waiver, and the Employer-Sponsored SCHIP buy-in waiver. A component in the success of Arkansas’ expansion efforts appears to be the Arkansas Center for Health Improvement, a joint project of the Arkansas Department of Health and the University of Arkansas for Medical Services created to provide support for state and local policy development and implementation.304
Colorado
State Demographics Colorado had an estimated population of 4,550,688 in 2003.305 This is a 35 percent increase in population since 1990. Thirty percent of Coloradans have incomes below 200 percent of the federal poverty line (FPL), with 13 percent below 100 percent FPL.306 More Coloradans have private insurance than the national average. Fifty-eight percent have employer-based insurance coverage, and 6 percent have individual coverage. Regarding public assistance, Colorado’s percent coverage is slightly lower than the national average with 11 percent covered by Medicaid, SCHIP or other public insurance (including dual eligibles with Medicaid and Medicare) and 9 percent covered by Medicare. Seventeen percent of Coloradans are uninsured.307
State Fiscal Environment Colorado has a unique fiscal environment because of two tax and expenditure limitations (TELs) that have been written into the state constitution: 1) Article X, Section 20, called the Taxpayer’s

C-20
Bill of Rights or “TABOR”; and 2) Article IX, Section 17, called the Colorado Public School Finance Act of 1994 or “Amendment 23.” Passed by voters in 1992, TABOR impacts almost all areas of state government and is widely considered the most restrictive TEL in the nation. TABOR limits Colorado government in four ways:308
1. Revenue increases: Voter approval is required for any revenue increases.
2. Revenue collections: TABOR prescribes a formula for growth in spending and requires that all revenue collected in excess of that amount must be returned to the taxpayers unless voters approve of government keeping it and spending it. At the state level, the formula is the Consumer Price Index (CPI) plus percent change in state population.309
3. “Weakening Provision”: The government cannot spend more than six percent over the prior year’s General Fund appropriations. This can only be weakened or changed by a popular vote.
4. Limitations on form of taxation: Specifically prohibits new real estate transfer taxes, local income taxes and state property taxes. Additionally, the state income tax must be a flat tax. At the state-level, TABOR limitations apply to the General Fund and to the Cash Funds.
TABOR does not let government account for revenue swings and does not allow government to benefit from real economic growth. TABOR’s limits on revenue collection and on spending causes a “ratcheting down” effect on the government budgets for fiscal years that experience economic down-turns. Amendment 23 requires an increase in public K-12 school funding. The amendment requires the legislature to increase educational funding by the number of new students plus inflation increased by one percent every year for 10 years (from 2001-2011), and by inflation after that.310 It did not raise taxes or levy any new ones. State legislators cannot modify or undo it without a vote of the people.311 There is a growing consensus that the restrictions of TABOR coupled with the spending requirements of Amendment 23 is slowly having a “crowding out” effect on all the other programs that are funded out of the General Fund, including public healthcare safety net programs. Since the pie that is the General Fund isn’t growing fast enough even to meet population plus inflation, but the slice of pie destined for K-12 Education must slowly increase each year, the other pieces of the pie have no choice but to absorb a disproportionate amount of the ratcheting effect.312 Because Medicaid and CHP+ are safety net programs, they are most utilized when the state experiences economic downturns. Colorado does not have a Rainy Day Fund to be used to mitigate severe revenue swings. Currently the tobacco settlement dollars have been treated by the legislature as the state’s rainy day fund, securitizing portions of the settlement and redirecting funding to fill budget holes, including financing healthcare. However, as a result of this extremely constrained financial situation, Colorado’s Medicaid and CHP+ programs are bare bones, offering only the minimal amount of benefits and covering only the mandated populations.
Medicaid Eligibility Medicaid eligibility for pregnant women is set at an income at 185 percent FPL or less. Medicaid eligibility for working parents is 39 percent FPL and non-working parents is 32 percent FPL. There are different eligibility criteria for several other Medicaid groups: 74 percent FPL for people on Supplemental Security Income (SSI), and 79 percent FPL for people on State Supplementary Payments (SSP an expansion group). Colorado does not cover the Aged, Blind,

C-21
and Disabled group.313 Medicaid eligibility for children ages 0 to 5 is 133 percent FPL. Eligibility for children ages 6 to 19 is 100 percent FPL.314
Medicaid Financing Method Colorado’s federal matching rate for Medicaid is 52.95 percent for fiscal year 2004, and 50 percent for fiscal years 2005 and 2006.315 The state portion of Medicaid funding comes from general revenue, sliding-scale premiums and copayments, a 2 percent provider tax, and a 1 percent premium tax on health maintenance organizations, nonprofit health service plan corporations, and community integrated service networks.316 Total Medicaid spending in Colorado in FY 2003 was $2,567,544,672.317 The average Medicaid spending per enrollee in FY 2000 was $4,624. This varied from an average of $1,662 spent on each child to an average of $11,501 spent per enrollee in the blind and disabled group.318
Medicaid Benefits Medicaid in Colorado offers outpatient hospital services and services at freestanding ambulatory surgery centers, public and mental health clinics, federally qualified health centers, and rural health clinics. It also offers inpatient hospital services. The following are types of benefits offered:
• Eyeglasses and services for speech, hearing and language disorders. • Laboratory and X-ray services. • Medical equipment and supplies, prosthetic and orthotic devices. • Early and periodic screening, diagnosis, and treatment services; family planning
services; rehabilitation services (mental health and substance abuse). • Services by these health care providers: certified registered nurse anesthetist, dentists
providing medical surgical services, nurse midwife, nurse practitioner, optometrist, physician, podiatrist.
• Prescription drugs. • Ambulance services, non-emergency medical transportation services. • Home health services, hospice services, private duty nursing services, targeted case
management. • Institutional services: inpatient psychiatric services under age 21, inpatient hospital
nursing facility and intermediate care facility services for mental disease age 65 and older, institutions for mental disease, intermediate care facilities for the mentally retarded, nursing facility services.319
SCHIP Characteristics Colorado has a separate SCHIP program. Statutorily, the program is called the Children’s Basic Health Plan (CBHP) program, but publicly it is called Children’s Health Plan Plus or CHP+. CHP+ covers children ages 0-5 between 133 to 185 percent FPL and children ages 6-19 between 100 to 185 percent FPL.320 CHP+ also covered, for a short time, pregnant women 19 years of age and older who were income-eligible, for medical care during their pregnancy plus two months after birth. The prenatal program operated from October 2002 to May 2003 when additional enrollment was suspended for budgetary reasons.321

C-22
The federal share for CHP+ is 65 percent for FFY2005 and the state share is 35 percent of each dollar spent. Colorado spent $62.5 million on SCHIP in FY 2003, including both federal and state funds. As of December 2003, there were 49,978 children enrolled in CHP+.322 To qualify for CHP+, a child must be younger than 19, a U.S. citizen or legal resident, not eligible for Medicaid or state employee coverage, not have private insurance, and have a family income below 185 percent of the federal poverty level. Colorado instituted an enrollment freeze from November 1, 2003 to June 30, 2004 due to insufficient funds. This only applied to CHP+ — Medicaid enrollment cannot be limited and applications are screened for Medicaid eligibility.323 CHP+ is a public-private partnership, in which many of the services are provided by private contractors. Services are provided primarily through managed care. Four HMOs have full-risk contracts with the state to provide services to 39 counties, representing 84 percent of the CHP+ caseload.324
Private Insurance Regulation Colorado has a 27.2 percent HMO penetration rate. Regarding small-group market reforms (applies to groups of 1-50), Colorado does apply community rating, limits pre-existing condition exclusions (to 6 months exclusion and 6 months look-back time), and mandates guaranteed issue and guaranteed renewability. Regarding individual insurance market reforms, Colorado does not apply community rating, does not limit pre-existing condition exclusions, and mandates guaranteed issue and guaranteed renewability. Colorado has a high risk pool called CoverColorado and funded by the unclaimed property trust fund, premiums, the CoverColorado cash fund and assessments on insurers. The state mandates that patients have access to an external review board for filing complaints against their health plans, and mandates mental health parity of benefits. Colorado has a state COBRA expansion program to 18 months for small firms.325
Incentives for Small Groups Colorado’s small group reforms began in 1995. Currently, all small groups with 2 through 50 employees can purchase one of two plans (Basic and Standard) that have to be offered by all small group carriers, regardless of employee health status. Self-employed persons, referred to as a “Business Group of One” (BG1), also fall into the definition of small group. To qualify as a BG1, an individual must provide detailed documentation of sole proprietorship status.326 Rates for all small group plans can vary by age, region, family size, and factors like smoking status, health status, claims experience, and standard industrial classification (workplace and job characteristics). Rates are allowed to range from a discount of 25 percent to an increase of 10 percent dependent on the health status of group members. Guarantee issue is required of all small group plans offered in the state, not just the Basic and Standard plans.327
SCHIP and Medicaid Initiatives
1915(b) Managed Care In 2003, 95.3 percent of Colorado’s Medicaid beneficiaries were enrolled in managed care, as compared to 60.2 for the U.S. as a whole.328 This rate has dropped significantly recently for reasons that will be explained below. In the mid-1990s Colorado made a dramatic shift to managed care with the hope that this would be a money-saving strategy for the state. In 1995 the state was granted a 1915(b) waiver

C-23
(which expired in 2003) and in 1997 the state legislature mandated that 75 percent of all Medicaid clients be enrolled in managed care by 2000 (SB97-05).329 Enrollment into the waiver program was mandatory for eligible TANF, TANF-related, SSI, and SSI-related recipients. The Managed Care Program was administered in 59 of 63 counties statewide and included the Primary Care Physician Program (PCPP) and the managed care organization (MCO) capitated program.330 Approximately three to four years ago, the state began having problems negotiating rates with the managed care organizations (MCOs). Several MCOs filed lawsuits against the state citing inappropriate rate-setting.331 These lawsuits were settled out of court, however, after that, state officials became disenchanted with MCOs and moved dramatically toward fee-for-service.332 Currently, the state is contracting with one managed care plan as a health maintenance organization and is contracting with three health plans to provide services to clients as Administrative Service Organizations, or ASOs. An ASO receives a monthly administrative fee per client and bills the state for only the services provided to each client, at negotiated rates.333
Other Waivers Colorado has received five 1915(c) Home and Community-Based Services Waivers: Children’s Home and Community Based Waiver (2004), Brain Injury Waiver (2004), Persons Living with AIDS (2004), and Elderly, Blind and Disabled Waiver (2004). The state has also received two 1115 waivers: the Consumer Directed Attendant Support Project and the Alternatives in Medicaid Home Care Project.334 The Consumer Directed Attendant Support Project enables beneficiaries in this program to purchase home health services from attendants they choose, including family members.335 The Alternatives in Medicaid Home Care Project permits greater flexibility in defining where Medicaid home health visits can occur. Instead of limiting visits to a beneficiary’s place of residence, the demonstration permits the same types of services to be provided in a variety of other settings (e.g., schools, work sites, or day treatment centers). This proposal also allows certain skilled nursing functions to be delegated to nurse aides, thus allowing individuals greater flexibility in selecting home health aides of their choice.336 Additionally, after receiving legislative approval last session, the state is seeking a Children with Autism waiver and a Substance Abuse Treatment for Native Americans waiver.337
Tobacco Tax Revenue to Fund Expansions In November 2004, Colorado voters approved Constitutional Amendment 35, a $0.64 tax increase on all tobacco products. This raised the overall tax on cigarettes to $0.84 per pack. The additional revenue, estimated at $169.2 million in FY05-06 (fiscal year July 1, 2005 to June 30, 2006) and exempt from TABOR restrictions, must be spent on healthcare and public health programs. Specifically the additional revenue must be divided as follows: 46 percent Medicaid and SCHIP expansions, 19 percent community health centers, 16 percent tobacco prevention and cessation, and 16 percent pulmonary, cardiovascular and cancer prevention, detection and treatment. The remaining 3 percent is reserved for the state’s general fund and programs funded under the original $0.20 tax to compensate for tax revenue reductions attributable to lower tobacco sales resulting from the higher tax.338 Currently, several bills are being considered by the legislature related to the 46 percent designated for Medicaid/SCHIP expansions ($77.8 million in FY05-06). The debate is about exactly how those programs should be expanded. To date, the proposal most likely to pass is outlined in HB05-1262, authored by the Citizens for a Healthier Colorado Coalition and sponsored by the committee chairs of the Health and Human Service Committees of both Houses.339 Among other things, HB1262 calls for the following expansions to Medicaid and

C-24
SCHIP: increased eligibility in CHP+ for children and pregnant women to 200 percent FPL, removal of the Medicaid asset test, increased children enrolled in the HCBS Waiver Program and the Children’s Extensive Support (CES) Waiver Program, increased Medicaid eligibility for parents up to 75 percent FPL, restoration of Medicaid for legal immigrants, $430,000 for cost-effective marketing of CHP+, and presumptive eligibility to pregnant women under Medicaid.340 Additionally, it calls for the creation of a reserve fund specifically for the health care expansion fund. The reserve fund will start with FY04-05 revenues ($23 million) and subsequently capture 10 percent of the expansion fund revenues every year (10 percent of 46 percent of the total revenue) until the total balance in the reserve fund equals half of the annual amount transferred to the health care expansion fund.341 This money can be accessed only if the appropriations necessary to sustain the populations specified in the health care program expansions exceed the annual transfer of moneys to the health care expansion fund.342 The sustainability of these expansions is a topic of hot debate. Forecasts show that these expansions are sustainable for the next five years.343 The question is if all this can be done for approximately $80 million.
HIFA Waiver Proposal In 2003 the state began considering applying for a HIFA waiver to streamline Medicaid, CHP+ and the Colorado Indigent Care Program (CICP), with the goal of improving access and coverage for Colorado’s low-income children and families. The concept of streamlining consists of merging benefit packages, delivery systems, risk arrangements for vendors and providers, and administrative management of these programs while maintaining budget neutrality and without reducing eligibility or benefits. The state obtained a HRSA grant as well as funding from several state foundations to conduct studies and analyses. The comparative analysis of Medicaid and CHIP service utilization among children: The principal finding was that there is comparable utilization. As a result a proposal has been created to develop a uniform benefit package. The recommendation is for a “Core” benefit package and a “Core Plus” wrap-around benefit package (referred to as the “Core-Core Plus” structure). Based on the finding in the comparative analysis that the current CHIP benefit package is comprehensive enough to cover the majority of enrolled children’s health care needs, the “Core” benefit package for all children on both Medicaid and CHIP would be the current CHIP plan. For children with special health care needs who require expanded services, the “Core Plus” wrap-around benefit package would be added. However, the proposal does not currently include several populations of children who require more intensive services than other Medicaid clients and therefore are much less likely to bounce between Medicaid and CHIP (foster care, adoption, SSI, etc.). The state is hoping the Core-Core Plus structure will allow for multiple purchasing strategies, and will ensure greater efficiency and cost-effectiveness of care. Where possible, the same provider networks will be used regardless of whether their reimbursement is from Medicaid or CHIP, in order to create a seamless system from the perspective of the client. It is important to note that, under this proposal, CHIP and Medicaid would remain separate programs with respect to federal funding, maintaining their separate matching fund streams. However, from the perspective of the client, services would not change with a move from Medicaid to CHIP or visa versa. It is also important to note that it appears that the HIFA waiver would swing the state back towards a managed care system. Currently the proposal is waiting to be introduced officially to the legislature in the current session and therefore has not yet been submitted to CMS.

C-25
Other Health Insurance Reforms/Initiatives in the State Colorado Benefits Management System (CBMS) — Colorado is the first state in the nation to develop and implement a fully integrated eligibility system for cash assistance and benefits.344 The system became operational in Fall 2004, however, it has been plagued with problems and the legislature has had to appropriate additional funds to address the problems that have resulted.
Maine
State Demographics The population of Maine in 2003 was 1,272,010.345 The percent uninsured was 11 percent.346 Fifteen percent of the population had incomes below the federal poverty level.347
Medicaid (MaineCare) Eligibility • Pregnant women: 200 percent FPL. • Infants: 200 percent FPL. • Children ages 1-19: 150 percent FPL. • SCHIP Children (CubCare): 200 percent FPL. • Parents: 150 percent FPL. • Single adults (non-categoricals): 100 percent FPL, scheduled to be expanded to 125
percent FPL three months after Dirigo Health begins enrollment (see below). • Parents of MaineCare eligible children: 150 percent FPL, scheduled to be expanded to
200 percent FPL three months after DirigoHealth begins enrollment (see below). 348
MaineCare Financing Method Total Medicaid spending in Maine in FY 2003 was $1.8 billion.349 Maine’s federal matching rate for Medicaid was 69 percent for fiscal year 2004, and will be 65 percent and 63 percent for FY 2005 and 2006, respectively.350 Maine’s state Medicaid expenditures accounted for 20 percent of state general fund expenditures in 2003.351 The average Medicaid spending per enrollee in FY 2000 was $6,240. This varied from an average of $2,817 spent on each child to an average of $14,645 spent per enrollee in the blind and disabled group.352 The estimate of Maine’s payments per enrollee for children is much higher than expected. This is largely due to much higher than average amounts of payments reported under “other services” for this group. It is unlikely that all of the payments attributed to children actually should be attributed to children, or at least to those children currently enrolled in the program.
MaineCare Benefits MaineCare offers inpatient and outpatient hospital services, public and mental health clinics, federally qualified health centers, religious non-medical health care institution and practitioner services, and rural health clinics. The following are types of benefits offered:
• Dental services, dentures, eyeglasses and services for speech, hearing and language disorders.
• Laboratory and X-ray services.

C-26
• Medical equipment and supplies and prosthetic and orthotic devices. • Inpatient hospital services. • Diagnostic, screening and preventive services. • Early and periodical screening, diagnosis, and treatment services; family planning
services; rehabilitation services, including mental health and substance abuse. • Services by these health care providers: physicians, chiropractors, dentists providing
medical surgical services, nurse midwives, nurse practitioners, optometrists, podiatrists, and psychologisst.
• Prescription drugs. • Physical and occupational therapy services. • Ambulance services and non-emergency medical transportation services. • Home health services, hospice services, personal care services, private duty nursing
services, and targeted case management. • Institutional services: inpatient psychiatric services for individuals under age 21, inpatient
hospital, nursing facility, and intermediate care facility services in institutions for mental disease for individuals age 65 and older; intermediate care facilities for the mentally retarded, institutions for mental disease, and nursing facility services.353
SCHIP Characteristics
The federal share for SCHIP is 75 percent in Maine for FFY 2005 and the state share is 25 percent of each dollar spent.354 Maine spent $23 million on SCHIP in FY 2002, including both federal and state funds.355 As of December 2003, there were 13,085 children enrolled in SCHIP.356 To qualify for SCHIP, a child must be younger than 19, a U.S. citizen or legal resident, not eligible for Medicaid or state employee coverage, not have private insurance, and have a family income below 200 percent of the federal poverty level. Families pay premiums, deductibles, and co-payments that vary according to their income levels. Children eligible for SCHIP are eligible for services provided under MaineCare (see above).
SCHIP and Medicaid Initiatives • HIFA Section 1115 waiver to expand MaineCare (Medicaid/SCHIP) coverage to
childless adults up 100 percent poverty, approved October 1, 2002.357 This expansion financed by redirecting a portion of its disproportionate share hospital (DSH) allocation to cover this population.358
• Section 1115 waiver to provide a limited set of Medicaid benefits to individuals with HIV/AIDS who would not otherwise be eligible for Medicaid. The expansion population includes individuals with HIV/AIDS with a gross family income at or below 250 percent of FPL.359

C-27
State Initiatives: Dirigo Health In June 2003, Maine passed the Dirigo Health Reform Act “to make quality, affordable health care available to every Maine citizen within five years and to initiate new processes for containing costs and improving health care quality.”360 The program aims to ensure access to coverage to as many as 180,000 state residents by 2009, specifically targeting small-business employees, the self-employed and individuals.361 The cornerstone of the act is the Dirigo Health Plan (DHP), a statewide voluntary health insurance program aimed at offering comprehensive health care through MaineCare (the state’s Medicaid program) and private insurance carriers. The program largely depends on the success of several cost savings measures being implemented by the state. One such measure is a “savings offset payment,” whereby the savings resulting from reducing the amount of uncompensated care will be redirected, through a tax of up to 4 percent on insurers, to help finance the plan.362 The success of the program is also dependent on the willingness of small businesses to participate in the plan.
Dirigo Health Program Eligibility The DHP will be rolled out in two phases: Those eligible under Phase One (first year of implementation):
• Three months after Dirigo Health begins enrollment, Medicaid (i.e., MaineCare) eligibles expanded to single adults (non-categoricals) from 100 to 125 percent FPL, parents of MaineCare eligible children from 150 to 200 percent FPL, and SCHIP children from 200 percent FPL.
• Businesses with fewer than 50 employees. • Self-employed individuals. • Individuals.
In Phase Two (second year on), eligibility will be expanded to businesses with more than 50 employees.363
Dirigo Health Financing Method The plan is projected to cost about $90 million in the first year and is projected to be self-funded after that. The plan hopes to save $80 million per year by eliminating unreimbursed medical costs.364 The program is financed through a variety of mechanisms:
1. For the first year of operations, $53 million in state general revenue.365
2. Medicaid dollars for those who are eligible for MaineCare.366
3. Coverage expansion to noncategorical adults financed by redirecting a portion of its disproportionate share hospital (DSH) allocation.
4. Employer contributions: Employers pay a minimum of 60 percent of the employee cost of the premium, even for those who are eligible for MaineCare. Although employers must offer family coverage, they are not responsible for covering any portion of this coverage.367
5. Individual contributions: Individuals who are eligible for MaineCare pay nothing,368 and those with incomes above MaineCare but below 300 percent FPL pay discounted monthly premiums and deductibles and limited total out-of-pocket expenditures.369 The amount individuals are required to pay is determined on a sliding scale based on income.

C-28
6. Funds obtained through the recovery of bad debt and charity care.370 This idea is based on the premise that bad debt and charity care is shifted to higher provider rates and premiums. By providing affordable access to health insurance, Maine is anticipating that savings in the health care system will be obtained though reducing the amount of charity care. If health system savings can be documented, the state will recoup some of the costs of bad debt and charity care through levying up to 4 percent of insurers’ revenue to help fund the Dirigo Health Plan (though this is not mandatory).371
7. Maine is also relying on the successful implementation of several other cost containment strategies to keep the program affordable. These efforts include:
a) Certificate of Need (CON) changes:372
• Expanded to include ambulatory surgery centers and doctors’ offices. • Requirement for review predicated on function and cost as opposed to site of
care. • Capital Investment Fund to establish a statewide budget for capital
expenditures and “to ensure a wise and appropriate allocation of resources” (expenditures must not exceed the limitations of the fund).
• Reviews investments in new technologies costing more than $1.2 million and capital expenditures over $2.4 million.
b) Insurance Overview: expands individual coverage rate review to small group products. Carriers will also be required to report administrative costs and underwriting gain.373
c) Voluntary Limits on Growth of Insurance Premiums and Health Care Costs: Hospitals and other providers are asked to voluntarily limit their cost growth to 3 percent and their operating margins to 3.5 percent. Insurers are also being asked to limit their operating margin to 3.5 percent.374
d) Hospital Planning: The Commission to Study Maine’s Hospitals will conduct analysis of Maine’s hospitals, including an analysis of hospital finances, structures, roles, reimbursement, capital, technology, staffing needs, other pertinent areas of study.375
Dirigo Health Benefits The benefits offered by Dirigo Health are:
• Traditional services including inpatient and outpatient hospital care,376 physician and specialist visits, emergency services and prescription drugs.
• Disease management, and health promotion and wellness initiatives. • Preventive services such as routine physicals, blood tests, Pap test, flu shots,
mammograms and well-baby care. • Routine diagnostic tests, X-rays and surgery. • Occupational, speech and physical therapy. • Chiropractic services. • Skilled nursing care facility. • Ambulance services. • Cardiac rehabilitation. • Durable Medical Equipment.

C-29
• Prosthesis. • Smoking cessation programs and medications. • Hospice and home health services.377
Private Insurance Regulation There is no separate high risk pool. After Dirigo Choice has been in operation for three years, the Dirigo Health Agency must compare the impact of Dirigo on premium and uninsured rates in Maine with states that have established High Risk Pools. If trends in the other states are more favorable than Maine, the Dirigo Health Board of Directors will submit legislation to create a high risk pool in Maine.378,379 Maine has a modified community rating system. Insurance companies are permitted to vary premiums for coverage based on certain characteristics (e.g., age, location, and type of employment), but they cannot vary premiums based on the health status or claims history of a policy.380 There is a state rate review of individual and small group plans. Limited premium increases are allowed among Maine’s small group market. At least 78 cents of every premium dollar increase must be spent on medical claims.381 Insurers are required to report administrative costs and underwriting gain. Insurers are asked to voluntarily limit operating margins to 3.5 percent. Insurance companies will pay up to 4 percent of annual gross revenues.
Incentives for Small Groups Small group employers will be able to offer insurance at a reasonable price.
Quality of Care Initiatives The Maine Quality Forum will provide the public with information on costs and quality of health care. It will disseminate research and adopt quality and performance measures, including comparisons of provider performance. It will be funded in part by the savings offset payment (SOP) assessed on insurers. More Effective Use of Data is an effort to consolidate and streamline disparate data sources into one cohesive database. It will include clinical and administrative data.382

C-30
Status Report
MaineCare Program Expansions Maine is scheduled to implement its MaineCare (i.e., Medicaid) program expansions in April 2005.383 However, these expansions will be made amid a possible $80 million reduction in federal funds due to a decrease in the state’s federal matching rate.384 Additionally, in February 2005, Maine’s Governor announced a MaineCare enrollment freeze for “noncategorical” childless adults.385 Maine obtained an 1115 waiver to expand eligibility to noncategorical adults. However, with 24,000 noncategorical individuals enrolled, Maine is reaching the limit of total federal dollars that can be spent under the waiver.386 This current freeze will affect plans to expand eligibility for noncategorical individuals to 125 percent of FPL on April 1. According to one news report, Republican leaders in Maine also want to eliminate April’s scheduled expansion from 150 to 200 percent for parents.387
Dirigo Choice Enrollment During the first year of operations, the state’s plan was to enroll up to 31,000 Maine residents through their employers and 4,500 self-employed or unemployed individuals.388 Anthem Blue Cross & Blue Shield of Maine was named the insurance carrier for the Dirigo Choice plan in October 2004. Marketing begin on October 1, 2004, and enrollment of small businesses and self-employed individuals began on January 1, 2005.389 Coverage for other individuals will begin April 1, 2005. The category of “other individuals” includes the unemployed, individuals who do not work more than 20 hours a week for any single employer, and individuals employed in an eligible business of two to 50 employees where the employer has not offered health insurance in the last 12 months.390 As of January 1, 2005, Dirigo Choice has enrolled and is providing benefits for 133 small businesses and 612 sole proprietors for a total of 1,800 members. The Dirigo Health Agency anticipated a similar enrollment rate for the February 1, 2005, coverage effective date.391
Minnesota
State Demographics Minnesota had a population of slightly over 5 million in 2003. Nine percent of the population had incomes under 100 percent of the federal poverty level, and an additional 15 percent had incomes that were 100 to 199 percent FPL.392 Minnesota has a higher percentage of residents with employer-sponsored insurance than the national average, and lower percentages of uninsured people and people on Medicaid and Medicare. In Minnesota, 65 percent of the population had employer-sponsored insurance; 6 percent had individual insurance; 10 percent had Medicaid, SCHIP, or other public insurance (including dual eligibles with Medicaid and Medicare); 10 percent had Medicare; and 8 percent were uninsured in 2003.393
Medicaid Eligibility Medicaid eligibility for pregnant women is at an income at 275 percent FPL or less. Medicaid eligibility for working and non-working parents is also 275 percent FPL. There are different eligibility criteria for several other Medicaid groups: 70 percent FPL for people on Supplemental Security Income (SSI), 85 percent FPL for people on State Supplementary Payments (SSP; an expansion group), and 95 percent FPL for the Aged, Blind, and Disabled group.394 Medicaid eligibility for children ages 0 to 1 is 280 percent FPL. Eligibility for children ages 1 to 19 is 275 percent FPL.395

C-31
Medicaid Financing Method Minnesota’s federal matching rate for Medicaid is 52.95 percent for fiscal year 2004, and 50 percent for fiscal years 2005 and 2006.396 The state portion of Medicaid funding comes from sliding-scale premiums and copayments, with the rest (the majority) coming from the Health Care Access Fund, a special revenue state fund that is funded through a 2 percent provider tax; a 1 percent premium tax on health maintenance organizations, nonprofit health service plan corporations, and community integrated service networks; and other funds to a lesser extent, including general revenue.397,398 Total Medicaid spending in Minnesota in FY 2003 was $4,921,224,346. The average Medicaid spending per enrollee in FY 2000 was $5,418. This varied from an average of $1,667 spent on each child to an average of $16,754 spent per enrollee in the blind and disabled group.399
Medicaid Benefits Medicaid in Minnesota offers outpatient hospital services and services at freestanding ambulatory surgery centers, public and mental health clinics, federally qualified health centers, and rural health clinics. It also offers inpatient hospital services. The following are types of benefits offered:
• Dental services, dentures, eyeglasses, hearing aids and services for speech, hearing and language disorders.
• Laboratory and X-ray services. • Medical equipment and supplies, prosthetic and orthotic devices. • Early and periodical screening, diagnosis and treatment services; family planning
services; rehabilitation services (mental health and substance abuse). • Services by these health care providers: certified registered nurse anesthetist,
chiropractor, other medical and remedial care practitioners, dentists providing medical surgical services, nurse midwife, nurse practitioner, optometrist, physician, podiatrist, psychologist.
• Prescription drugs. • Physical and occupational therapy services. • Ambulance services, non-emergency medical transportation services. • Home health services, hospice services, personal care services, private duty nursing
services, targeted case management. • Institutional services: inpatient psychiatric services under age 21, inpatient hospital
nursing facility and intermediate care facility services for mental disease age 65 and older, institutions for mental disease, intermediate care facilities for the mentally retarded, nursing facility services.400
SCHIP Characteristics Minnesota has a combined Medicaid and SCHIP program. The federal share for SCHIP is 65 percent for FFY2005 and the state share is 35 percent of each dollar spent.401 Minnesota spent $99.5 million on SCHIP in FY 2004, including both federal and state funds.402 As of December 2003, there were 2,731 children enrolled in SCHIP in Minnesota.403 To qualify for SCHIP, a child must be younger than 19, a U.S. citizen or legal resident, not eligible for Medicaid or state employee coverage, not have private insurance, and have a family income below 200 percent of

C-32
the federal poverty level.404 Since Minnesota’s SCHIP is a Medicaid expansion, the benefits are the same as the Medicaid benefits listed above, and SCHIP funds are used to raise the eligibility levels for children above that of the Medicaid program.405
Private Insurance Regulation Minnesota has a 26.7 percent HMO penetration rate. Regarding small-group market reforms (applies to groups of 2-50), Minnesota does not apply community rating, limits pre-existing condition exclusions (to 12 months exclusion and 6 months look-back time), and mandates guaranteed issue and guaranteed renewability. Regarding individual insurance market reforms, Minnesota does not apply community rating, limits pre-existing condition exclusions, and mandates guaranteed issue and guaranteed renewability. Minnesota has a high-risk pool funded by premiums, assessments on insurers, and state appropriations. 406 It currently has about 30,000 enrollees.407 The state mandates that patients have access to an external review board for filing complaints against their health plans, and mandates mental health parity of benefits. Minnesota has a state COBRA expansion program to 18 months for small firms.408
Incentives for Small Groups In 2001 the Minnesota legislature passed an initiative to form a reinsurance fund for businesses with 10 for fewer employees that would cover 90 percent of claims from $30,000 to $100,000.409 As of October 2004 it was considered inactive.410
Medicaid and SCHIP Initiatives In Minnesota, 63.9 percent of Medicaid beneficiaries are enrolled in managed care, as compared to 60.2 for the U.S. as a whole. Minnesota has a family planning waiver that extends family planning services to men and women up to 200 percent FPL.411 Minnesota has used Section 1931 to expand Medicaid coverage by increasing income disregards; the state may disregard a family’s first $120 in monthly earnings and one-third of the remaining monthly earnings before calculating if families’ incomes are below the eligibility level to qualify for Medicaid.412 Minnesota has received one 1915(b) Freedom of Choice Waiver (for chemical dependency treatment) and five 1915(c) Home and Community-Based Services Waivers. The state has received three 1115 waivers: the family planning waiver, a waiver for managed care (called Minnesota Prepaid Medical Assistance Project Plus), and a waiver for MinnesotaCare.413 MinnesotaCare is a managed care program administered by the Minnesota Department of Human Services that expands eligibility for parents and relative caretakers of Medicaid and SCHIP-eligible children, and other selected groups of people. It includes a Medicaid 1115 Waiver to extend eligibility to parents and children under age 19 up to 275 percent FPL, and a SCHIP 1115 Waiver covering parents with incomes 100-200 percent FPL.414 Childless adults can qualify if their gross household incomes are less than 175 percent FPL and they meet other guidelines, as can children and pregnant women up to 275 percent FPL without access to other insurance.415 There are three levels of benefits in MinnesotaCare. Pregnant women and children have the most benefits and do not pay copayments, and parents and childless adults with incomes less than 75 percent FPL can receive most services but have limits and copayments. Childless adults with incomes 75-175 percent FPL receive fewer benefits, must pay copayments, and have a $10,000 annual limit on inpatient services and a $5,000 annual limit on all other services.416 MinnesotaCare is funded through federal funds, sliding-scale premiums and copayments, a 2 percent provider tax, and a 1 percent premium tax on health maintenance

C-33
organizations, nonprofit health service plan corporations, and community integrated service networks.417
Other Health Insurance Reforms/Initiatives Minnesota is a national leader in efforts to cover low-income uninsured people. Besides Medicaid (called Medical Assistance) and SCHIP, the state has MinnesotaCare, which extends insurance to low-income working individuals without access to affordable employer-sponsored insurance and their families, and General Assistance Medical Care (GAMC), a free program for very low-income adults between the ages of 21 and 64 with no children under age 19 who are not eligible for any other state or federal programs and meet other criteria. The program is administered by counties and is totally funded with state funds; $245.6 million was spent on GAMC in FY 2004.418 There are two program options: full coverage GAMC for adults with incomes under 75 percent FPL, and catastrophic GAMC for adults at 75 to 175 percent FPL. Full coverage GAMC offers similar benefits to Medicaid, while catastrophic GAMC covers only inpatient hospitalizations, with a $1,000 deductible per stay and no monthly premiums.419
Conclusions and Recommendations for Texas Many models and strategies used to increase the number of people with health insurance in other states are unlikely to work in Texas due to the political climate, economy, types of industries, and large population in Texas. Since Texas has the highest percentage of uninsured residents in the nation, it will take more than one strategy to solve the problem, and there are a variety of steps that Texas could take to better address the issue. Regarding covering more people through Medicaid and SCHIP, see our list of expansion options for Texas on pages 36-38 of “Medicaid and the State Children’s Health Insurance Program in Texas: History, Current Arrangements, and Options” by Warner, Jahnke, and Kimbell (April 2005). One of these recommendations is using Section 1931 to cover more low-income people under Medicaid, like a majority of other states do. This option is relatively straightforward and does not require a federal waiver to implement.
Lessening Hardship and Bankruptcy from Medical Bills An issue related to the unaffordability of health insurance is the rate of personal bankruptcies stemming from unpaid medical bills. Mitigating these bankruptcies should be a related goal of any reform effort. Reasons for bankruptcies are not tracked, but the only in-depth study of bankruptcies from medical reasons, published by Harvard researchers in 2005 from 2001 data, estimated that half of the almost 1.5 million personal bankruptcies filed in the U.S. in 2001 were due to illness and unpaid medical bills. About 75 percent of filers were found to have health insurance when filing (though some coverage was inadequate, and some people subsequently lost coverage), but as the sample was taken in federal judicial districts in states other than Texas (which has the highest rate of uninsurance), and Texas no longer has the Medically Needy spend-down program in Medicaid, we can assume that the proportion of bankruptcy filers in Texas without insurance would be greater than the national estimate of 25 percent. Also, as this study points out, most people filing for bankruptcy owned homes and were considered middle class by occupation and education levels. Medical bills cause hardship or financial ruin to many other people besides those who formally file for bankruptcy, since poorer people do not need to file if they have no assets to protect from creditors.420 Providing health insurance alone will not stop the bankruptcy problem, if the insurance is not adequate for some medical conditions or has higher deductibles and out-of-pocket costs than people can afford. Many people lose income and even their jobs when they or a family member have a serious illness, when this is precisely the time that they need more money for bills and

C-34
need their jobs as a source of employer-based insurance. A system of insurance that is not tied to employment would be the ideal solution to ameliorate this problem.421 One immediate step that could be taken in Texas would be to restore the Medicaid Medically Needy spend-down program for non-pregnant people (now the only group covered), so anyone with a major medical condition facing large medical bills could get emergency coverage if needed.
Changing and Regulating Small Groups Another option for the state to consider is letting sole proprietors (self-employed small business owners who may not have any employees) buy into small group plans, such as some other states do. In this case, “small groups” would be considered to be 1 to 50 people, or whatever the states’ upper limit is, instead of 2 to 50 people, for example. Most states also regulate small group rates more than Texas does by limiting the range of manual rating. Texas could regulate rate-setting for small groups, though this can sometimes have unintended consequences. If rates cannot vary as much, and rates are lowered for the high-risk people, then rates must be raised for the lower-risk people, which may cause them to drop out of the group and seek lower-cost insurance, leaving the insurer with only higher-risk people and the need to raise rates.
Subsidizing the High-Risk Pool The Texas high-risk pool is an option open to anyone who cannot obtain coverage elsewhere for medical reasons, but since many if not most uninsured people cannot afford the premiums, another way to insure more people would be to increase funding for the high-risk pool for premium subsidies. If the pool had more revenue from the state and from provider assessments, it could lower its premiums, which have gradually increased to 200 percent of the standard rate for the person being insured. Assessments are made on most regulated private health insurance, but this does not include small group policies or ERISA plans in the assessment base. Including small group policies would only change the assessments if small group policies are written proportionately differently by insurance companies or if there are some firms that just write such policies. Rather than tax employers it might be possible to tax third-party administrators, reinsurers or other entities that make ERISA plans viable. It would probably be reasonable to try to find a way to subsidize the high-risk pool so that the premiums could be lowered to 150 percent of the standard premium or perhaps be made to vary depending on the beneficiary’s income or wealth. One potential source of income could either be a provider tax (proposed by some insurance companies as an alternative and an indirect way to get at ERISA plans) or a tax on all employers that do not offer some minimum level of health insurance coverage — perhaps $100 per employee per month to fund both the high-risk pool and possibly some of the match for either SCHIP or a 1931 expansion.
Using SCHIP Funds Texas could also implement an employer buy-in and a full-cost buy-in for SCHIP insurance, as several other states have done. Texas already has an employer buy-in program for Medicaid (premium assistance, where the state pays part or all of an employer-sponsored plan for a person eligible for Medicaid, if it is more cost-effective for the state to do so). Not many people are enrolled in this Medicaid option since it is rare to have a person who is both financially eligible for Medicaid and has a job offering employer-sponsored insurance. These SCHIP options may help more people, since the eligibility levels for SCHIP are higher and there could be more enrollees with working parents who could potentially qualify for premium assistance with SCHIP funds, as well as parents who could afford to buy SCHIP for their uninsured children at full cost. Also, if SCHIP funds are not going to be entirely drawn down by SCHIP in Texas it would seem rational to find a way to cover parents of Medicaid children at some level with

C-35
SCHIP funds or at least cover Medically Needy spend-down to a certain extent since the match rate in SCHIP is much higher than in Medicaid.
Lessening the Cost of EMTALA The legal obligation imposed by federal legislation requiring Medicare-participating hospitals to provide care to individuals with “reasonable emergencies” regardless of their ability to pay results in significant fiscal losses to most hospitals. The Emergency Medical Treatment and Labor Act (EMTALA) of 1985 requires hospitals participating in Medicare to medically screen all persons seeking care in hospital emergency departments, and to provide the treatment necessary to stabilize those determined to have an emergency condition, regardless of income, insurance, or immigration status.422 Currently, hospitals and other providers must absorb the costs associated with this care for the uninsured or underinsured. Hospitals serving a “disproportionate share” of medically indigent people receive Disproportionate Share Hospital (DSH) funds to help offset lost revenues. The Medically Needy Medicaid program also offers participating states some relief to this financial burden. The program allows additional individuals, including adults with children under the age of 18 years, to receive Medicaid coverage to assist with high medical bills after “spending down” to Medicaid eligibility by having their medical expenses offset their excess income. In 2003, the 78th Texas Legislature elected to discontinue participation in the spend-down program. Reinstating the Medicaid Medically Needy program could offer help to reduce the cost of EMTALA to hospitals. Reinstating the program for the “1931” population (parents of children under 18 years of age) could be done with little difficulty. Including non-parent adults might require additional review to establish revenue neutrality. Revenue neutrality could potentially be compromised if the inclusion of the non-parents limited the amount of DSH funds available.
Future Study One area for future study is the possibility of modifying the asset test in Medicaid — especially for Medically Needy spend-down, if reinstated, but also more broadly. Another area needing more study is the nature of both the small group and individual health insurance markets. There is little information about the individual market in Texas in terms of rates, margins, characteristics of those insured and other factors. Study of this market may well be warranted. Similarly, in the small group market the potential impact on rates and availability of insurance or reducing the extent to which rates can vary with manual adjustments needs to be investigated. Texas has many opportunities to cover more uninsured people and remedy its place as the worst state in the nation for the percentage of people with health insurance, but there are many complex issues involved and doing so will take compromise and perseverance.
Acknowledgments
The authors wish to thank the following people for their help with this project: Kristine Niemeyer (Senior Program Coordinator, LBJ School of Public Affairs) for contributing the profile of Maine, Kelly Shanahan (LBJ School graduate student) for contributing the profile of Colorado, and the members of the Task Force on Access to Health Care in Texas for their feedback.
C-36
Endnotes
191 Deborah Chollet, Issue Brief: The Role of Reinsurance in State Efforts to Expand Coverage (State Coverage Initiatives, October 2004, p. 1), available at http://www.statecoverage.net/pdf/issuebrief1004.pdf, accessed March 14, 2005. 192 State Coverage Initiatives, SCHIP Employer Buy-In, available at http://www.statecoverage.net/employer.htm, accessed March 14, 2005. 193 State Coverage Initiatives, Medicaid HIPP, available at http://www.statecoverage.net/hipp.htm, accessed March 14, 2005. 194 State Coverage Initiatives, SCHIP Full Cost Buy-In, available at http://www.statecoverage.net/fullcost.htm, accessed March 14, 2005. 195 Deborah Chollet, Issue Brief: The Role of Reinsurance in State Efforts to Expand Coverage (State Coverage Initiatives, October 2004, p. 2, p. 5, endnote 1), available at http://www.statecoverage.net/pdf/issuebrief1004.pdf, accessed March 14, 2005. 196 Isabel Friedenzohn, Issue Brief: Limited-Benefit Policies: Public and Private-Sector Experiences (State Coverage Initiatives, July 2004, p. 4), available at http://www.statecoverage.net/pdf/issuebrief704.pdf, accessed March 30, 2005. 197 AISHealth.com, Insurers, Enrollees Show Little Interest in State ‘Mandate-Light’ Laws (Business News of the Week, May 18, 2005), available at http://www.aishealth.com/bnow/051805a.html, accessed May 18, 2005. 198 Mila Kofman, Issue Brief: Group Purchasing Arrangements: Issues for States (State Coverage Initiatives, April 2003, p. 1), available at http://www.statecoverage.net/pdf/issuebrief403.pdf, accessed March 30, 2005. 199 Texas Department of Insurance, Working Together for a Healthy Texas, Interim Report, State Planning Grant Project (September 2004, pp. 53-54), available at http://www.tdi.state.tx.us/general/PDF/spgint04.pdf, accessed April 2, 2005. 200 State Coverage Initiatives, State-Only High Risk Pool, available at http://www.statecoverage.net/highrisk.htm, accessed March 29, 2005. 201 Claudia L. Schur, Marc L. Berk, and Jill M. Yegian, “Workers’ Perspectives on Mandated Employer Health Insurance,” Health Affairs (Web Exclusive, March 17, 2004, p. 128), available at http://content.healthaffairs.org/ cgi/reprint/hlthaff.w4.128v1.pdf, accessed April 3, 2005. 202 Employee Benefit Research Institute, An Employer Mandate: What’s Known and What Isn’t (November 1993, p. 1), available at http://www.ebri.org/srpdfs/sr19.pdf, accessed April 3, 2005. 203 The Commonwealth Fund, California: Health Insurance Act of 2003, available at http://www.cmwf.org/tools/ tools_show.htm?doc_id=235062, accessed April 3, 2005. 204 Patricia A. Butler, Revisiting Pay or Play: How States Could Expand Employer-Based Coverage within ERISA Constraints (National Academy for State Health Policy, May 2002), available at http://www.nashp.org/Files/ ERISA_pay_or_play.PDF, accessed April 3, 2005; and Patricia A. Butler, ERISA Implications for Employer Pay or Play Coverage Laws (California HealthCare Foundation, March 2005), available at http://www.chcf.org/ documents/insurance/ERISAPayPlayImplications.pdf, accessed April 3, 2005. 205 State Coverage Initiatives, State-Only Tax Incentives, available at http://www.statecoverage.net/tax.htm, accessed March 29, 2005. 206 Texas Department of Insurance, Working Together for a Healthy Texas, Interim Report, State Planning Grant Project (September 2004, pp. 51-52), available at http://www.tdi.state.tx.us/general/PDF/spgint04.pdf, accessed April 2, 2005. 207 U.S. General Accounting Office, Private Health Insurance: Federal and State Requirements Affecting Coverage Offered by Small Businesses (Washington, D.C., September 2003), Appendix III, pp. 41-43.

C-37
208 Georgetown University Health Policy Institute, Summary of Key Consumer Protections in Individual Health Insurance Markets (April 2004), available at http://www.healthinsuranceinfo.net/newsyoucanuse/ discrimination_limits.pdf, accessed April 3, 2005. 209 Advantage Insurance and Financial Services, Inc., Guaranteed Issue HIPAA Coverage, available at http://www.aifsi.com/hipaa_plans.htm, accessed April 3, 2005. 210 The Council for Affordable Health Insurance, What Were these States Thinking? The Pitfalls of Guaranteed Issue (May 2002), available at http://www.cagionline.org/cahidoc.pdf, accessed April 3, 2005; and Scott Garrett and Jeb Bradley, Been There, Done That, Let’s Steer Clear of Guaranteed Issue (Letter to Republican Congress, March 3, 2003), available at http://www.cagionline.org/garrettltr.pdf, accessed April 3, 2005. 211 State Coverage Initiatives, Profiles in Coverage: Healthy New York (January 2005), available at http://www.statecoverage.net/newyorkprofile.htm, accessed April 20, 2005. 212 Ibid. 213 Ibid. 214 Embry Howell, Ruth Almeida, Lisa Dubay, and Genevieve Kenney, Early Experience with Covering Uninsured Parents Under SCHIP (The Urban Institute, No. A-51, May 2002), available at http://www.urban.org/url.cfm? ID=310498, accessed April 20, 2005. 215 Gwendolyn L. Harris, Commissioner, New Jersey Department of Human Services, Letter to Dennis Smith, Centers for Medicare and Medicaid Services (July 15th, 2002), available at http://www.cms.hhs.gov/hifa/ njhifacvrltr.pdf, accessed April 20, 2005; and Thomas A. Scully, Centers for Medicare and Medicaid Services, Letter to Gwendolyn L. Harris, New Jersey Department of Human Services (January 31, 2003), available at http://www.cms.hhs.gov/hifa/njstandardapprovlet.pdf, accessed April 20, 2005. 216 Cindy Mann, Samantha Artiga, and Jocelyn Guyer, Assessing the Role of Recent Waivers in Providing New Coverage (Kaiser Commission on Medicaid and the Uninsured, Issue Paper, December 2003, p. 2), available at http://www.kff.org/medicaid/loader.cfm?url=/commonspot/security/getfile.cfm&PageID=28336, accessed April 26, 2005. 217 Isabel Friedenzohn, Issue Brief: States’ Experience with Benefit Design (State Coverage Initiatives, April 2003, p. 4), available at http://www.statecoverage.net/pdf/issuebrief403benefits.pdf#search='utah%20medicaid%20 benefit%20reduced, accessed April 26, 2005. 218 Cindy Mann, Samantha Artiga, and Jocelyn Guyer, Assessing the Role of Recent Waivers in Providing New Coverage (Kaiser Commission on Medicaid and the Uninsured, Issue Paper, December 2003, p. 7), available at http://www.kff.org/medicaid/loader.cfm?url=/commonspot/security/getfile.cfm&PageID=28336, accessed April 26, 2005. 219 Centers for Medicare and Medicaid Services, Utah Primary Care Network Demonstration Fact Sheet (updated April 4, 2005), available at http://www.cms.hhs.gov/medicaid/1115/utpcnfs.pdf, accessed April 26, 2005. 220 Isabel Friedenzohn, Issue Brief: States’ Experience with Benefit Design (State Coverage Initiatives, April 2003, p. 4), available at http://www.statecoverage.net/pdf/issuebrief403benefits.pdf#search='utah%20medicaid%20 benefit%20reduced, accessed April 26, 2005. 221 Kaisernetwork.org, HHS Approves Utah’s First-in-Kind Medicaid Waiver Proposal To Extend Coverage to 25,000 While Reducing Other Benefits (Daily Health Policy Report, Feb 11, 2002), available at http://www.kaisernetwork.org/daily_reports/rep_index.cfm?hint=3&DR_ID=9405, accessed April 25, 2005. 222 Centers for Medicare and Medicaid Services, Utah Primary Care Network Demonstration Fact Sheet (updated April 4, 2005), available at http://www.cms.hhs.gov/medicaid/1115/utpcnfs.pdf, accessed April 26, 2005. 223 William R. Brody, “A New Vision for Maryland Hospitals” (originally published in the Baltimore Sun, December 10, 2002), available at http://www.jhu.edu/~president/news/sundec10.html, accessed April 21, 2005. 224 Maryland Health Services Cost Review Commission, About HSCRC, available at http://www.hscrc.state.md.us/ about_us/about_us.html, accessed April 21, 2005.

C-38
225 Ibid. 226 Maryland Health Care Commission, News Release (April 4, 2001), available at http://www.dhmh.state.md.us/ publ-rel/html/disclo~1.htm, accessed May 19, 2005. 227 U.S. Census Bureau, Table 1: Annual Estimates of the Population for Counties of Texas: April 1, 2000 to July 1, 2004, available at http://www.census.gov/popest/counties/tables/CO-EST2004-01-48.xls, accessed June 8, 2005. 228 Kaiser Family Foundation, State Health Facts, Texas: Distribution of Total Population by Federal Poverty Level, State Data 2002-2003, U.S. 2003, available at http://www.statehealthfacts.org/cgi-bin/healthfacts.cgi?action= profile&area=Texas&category=Demographics+and+the+Economy&subcategory=People+in+Poverty&topic= Distribution+by+FPL, accessed March 11, 2005. 229 Kaiser Family Foundation, State Health Facts, Texas: Population Distribution by Insurance Status, State Data 2002-2003, U.S. 2003, available at http://www.statehealthfacts.org/cgi-bin/healthfacts.cgi?action=profile&area= Texas&category=Health+Coverage+%26+Uninsured&subcategory=Insurance+Status&topic=Distribution+by+Insurance+Status, accessed March 11, 2005. 230 Kaiser Family Foundation, State Health Facts, Texas: Medicaid Eligibility, 2004, available at http://www.statehealthfacts.org/cgi-bin/healthfacts.cgi?action=profile&area=Texas&category=Medicaid+% 6+SCHIP&subcategory=Medicaid+Eligibility, accessed March 11, 2005; and E-mail from Anne Dunkelberg to Kristie Kimbell, “Re: FPL Question,” March 24, 2005. 231 Kaiser Family Foundation, State Health Facts, Texas: Income Eligibility Levels for Children under Medicaid, as a Percent of Federal Poverty Level, 2004, available at http://www.statehealthfacts.org/cgi-bin/healthfacts.cgi?action= profile&area=Texas&category=Medicaid+%26+SCHIP&subcategory=Children%27s+Medicaid+and+SCHIP+Eligibility&topic=Income+Eligibility%2d%2d+Medicaid, accessed March 11, 2005. 232 Kaiser Family Foundation, State Health Facts, Texas: Federal Matching Rate (FMAP) for Medicaid, available at http://www.statehealthfacts.org/cgi-bin/healthfacts.cgi?action=profile&area=Texas&category=Medicaid+%26+ SCHIP&subcategory=Medicaid+Spending&topic=Federal+Matching+Rate+%28FMAP%29, accessed March 11, 2005. 233 Anne Dunkelberg, Center for Public Policy Priorities, Medicaid and State Budgets: A Case Study of Texas (Kaiser Commission on Medicaid and the Uninsured, March 2002, p. 18), available at http://www.cppp.org/files/6/ getfile.pdf, accessed April 25, 2005. 234 Texas Legislative Budget Board, Fiscal Note for SB1839, Enrolled Version, 77th Legislative Session (May 26, 2001), available at http://www.capitol.state.tx.us/cgi-bin/tlo/textframe.cmd?LEG=77&SESS=R&CHAMBER =S&BILLTYPE=B&BILLSUFFIX=01839&VERSION=5&TYPE=F, accessed April 27, 2005. 235 Kaiser Family Foundation, State Health Facts, Texas: Medicaid Spending, available at http://www.statehealthfacts.org/cgi-bin/healthfacts.cgi?action=profile&area=Texas&category=Medicaid+%26+ SCHIP&subcategory=Medicaid+Spending, accessed March 11, 2005. 236 Kaiser Commission on Medicaid and the Uninsured, Medicaid Benefits, as of January 2003, available at http://www.kff.org/medicaidbenefits/state-TX.cfm, accessed March 11, 2005. 237 Texas Health and Human Services Commission, Texas Medicaid in Perspective, 5th ed. (2004, p. 2-8), available at http://www.hhsc.state.tx.us/medicaid/reports/PB5/PinkBookTOC.html, accessed April 4, 2005. 238 Texas Health and Human Services Commission, “FY 05 Federal Alloc LAR” (Excel spreadsheet, January 2005). 239 Texas Health and Human Services Commission, Children’s Health Insurance Program, available at http://www.hhsc.state.tx.us/chip/index.html, accessed April 4, 2005. 240 Anne Dunkelberg and Molly O’Malley, Children’s Medicaid and SCHIP in Texas: Tracking the Impact of Budget Cuts (Kaiser Commission on Medicaid and the Uninsured, July 2004, p. 2), available at http://www.kff.org/ medicaid/7132.cfm, accessed April 18, 2005.

C-39
241 Centers for Medicare and Medicaid Services, A Profile of Medicaid: Chartbook 2000 (p. 72), available at http://www.cms.hhs.gov/charts/medicaid/2Tchartbk.pdf, accessed November 14, 2004. 242 Texas Health and Human Services Commission, CHIP Assets Test Policy: Summary of Final Rules, available at http://www.hhsc.state.tx.us/chip/reports/042304_AssetTestPolicySum.html, accessed June 8, 2005. 243 Texas Health and Human Services Commission, A Consumer Guide to Better Healthcare: Your 2004 Road Map to Understanding the Health Care System in Texas, pp. 47-50, available at http://www.hhsc.state.tx.us/chip/ reports/ConsumerGuideEnglish.pdf, accessed November 30, 2004. 244 Kaiser Family Foundation, State Health Facts, Texas: Managed Care & Health Insurance, available at http://www.statehealthfacts.org/cgi-bin/healthfacts.cgi?action=profile&category=Managed+Care+%26+Health+ Insurance&subcategory=&topic=&link_category=&link_subcategory=&link_topic=&welcome=0&area=Texas¬es=show&printerfriendly=0#pagetopic8, accessed March 11, 2005. 245 Texas Department of Insurance, Texas Health Insurance Risk Pool Expansion Options (January 2005, pp. 3, 4), available at http://www.tdi.state.tx.us/general/pdf/lhlRiskPoolRept.pdf, accessed May 20, 2005. 246 Ibid., p. 4, appendices. 247 Ibid., pp. 4, 5, 16. 248 Texas Department of Insurance, Working Together for a Healthy Texas, Interim Report, State Planning Grant Project (September 2004, pp. 43, 49, 53-54), available at http://www.tdi.state.tx.us/general/PDF/spgint04.pdf, accessed April 4, 2005. 249 Texas Department of Insurance, Rules, Subchapter D, Health Group Cooperatives, available at http://www.tdi.state.tx.us/commish/rules/0811AA-059.html, accessed April 4, 2005. 250 Texas Department of Insurance, Listing of Coalition and Purchasing Cooperatives (March 23, 2005), available at http://www.tdi.state.tx.us/company/lhcoop_lst_incl.html, accessed April 26, 2005. 251 Texas Department of Insurance, Biennial Report of the Texas Department of Insurance to the 79th Texas Legislature (December 2004, Section D, Issue 9), available at http://www.tdi.state.tx.us/commish/reports/ finalbie05.html#thrs, accessed April 4, 2005. 252 Texas Department of Insurance, Working Together for a Healthy Texas, Interim Report, State Planning Grant Project (September 2004, pp. 51-52), available at http://www.tdi.state.tx.us/general/PDF/spgint04.pdf, accessed April 26, 2005. 253 Kaiser Family Foundation, State Health Facts, Texas: Medicaid Managed Care Enrollees as a Percent of State Medicaid Enrollees, 2003, available at http://www.statehealthfacts.org/cgi-bin/healthfacts.cgi?action=profile& area=Texas&category=Medicaid+%26+SCHIP&subcategory=Medicaid+Managed+Care&topic=MC+Enrollment+as+a+%25+of+Total+Enrollment, accessed March 11, 2005. 254 Texas Health and Human Services Commission, Texas Medicaid in Perspective, 5th ed. (2004, p. 3-13), available at http://www.hhsc.state.tx.us/medicaid/reports/PB5/PinkBookTOC.html, accessed March 13, 2005. 255 State Coverage Initiatives, Medicaid HIPP, available at http://www.statecoverage.net/hipp.htm, accessed March 14, 2005. 256 State Coverage Initiatives, Medicaid TMA, available at http://www.statecoverage.net/tma.htm, accessed March 14, 2005. 257 Paper commissioned by the Task Force on Access to Health Care in Texas, website available at http://www.utsystem.edu/hea/taskforce/homepage.htm. 258 Kaiser Family Foundation, State Health Facts, Florida: Distribution of Total Population by Federal Poverty Level, State Data 2002-2003, U.S. 2003, available at http://www.statehealthfacts.org/cgi-bin/healthfacts.cgi? action=profile&area=Florida&category=Demographics+and+the+Economy&subcategory=People+in+Poverty&topic=Distribution+by+FPL, accessed April 17, 2005.

C-40
259 Kaiser Family Foundation, State Health Facts, Florida: Population Distribution by Insurance Status, State Data 2002-2003, U.S. 2003, available at http://www.statehealthfacts.org/cgi-bin/healthfacts.cgi?action=profile&area= Florida&category=Health+Coverage+%26+Uninsured&subcategory=Insurance+Status&topic=Distribution+by+Insurance+Status, accessed April 17, 2005. 260 Kaiser Family Foundation, State Health Facts, Florida: Medicaid Eligibility, 2004, available at http://www.statehealthfacts.org/cgi-bin/healthfacts.cgi?action=profile&category=Medicaid+%26+SCHIP& subcategory=Medicaid+Eligibility&topic=&link_category=&link_subcategory=&link_topic=&welcome=0&area= Florida¬es=show&printerfriendly=0#pagetopic1, accessed April 17, 2005. 261 Kaiser Family Foundation, State Health Facts, Florida: Income Eligibility Levels for Children under Medicaid, as a Percent of Federal Poverty Level, 2004, available at http://www.statehealthfacts.org/cgi-bin/healthfacts.cgi? action=profile&area=Florida&category=Medicaid+%26+SCHIP&subcategory=Children%27s+Medicaid+and+SCHIP+Eligibility&topic=Income+Eligibility%2d%2d+Medicaid, accessed April 17, 2005. 262 Kaiser Family Foundation, State Health Facts, Florida: Federal Matching Rate (FMAP) for Medicaid, available at http://www.statehealthfacts.org/cgi-bin/healthfacts.cgi?action=profile&area=Florida&category=Medicaid+% 26+SCHIP&subcategory=Medicaid+Spending&topic=Federal+Matching+Rate+%28FMAP%29, accessed April 17, 2005. 263 Kaiser Family Foundation, State Health Facts, Florida: State Medicaid Expenditures (in millions), SFY 2003, available at http://www.statehealthfacts.org/cgi-bin/healthfacts.cgi?action=profile&category=Medicaid+%26+ SCHIP&subcategory=State+Medicaid+Spending&topic=State+Medicaid+Spending%2c+SFY2003&link_category=&link_subcategory=&link_topic=&welcome=0&area=Florida, accessed April 17, 2005. 264 Kaiser Family Foundation, State Health Facts, Florida: Medicaid Spending, available at http://www.statehealthfacts.org/cgi-bin/healthfacts.cgi?action=profile&area=Florida&category=Medicaid+%26+ SCHIP&subcategory=Medicaid+Spending, accessed April 17, 2005. 265 Kaiser Commission on Medicaid and the Uninsured, Medicaid Benefits, as of January 2003, available at http://www.kff.org/medicaidbenefits/state-FL.cfm, accessed April 17, 2005. 266 Kaiser Family Foundation, State Health Facts, Florida: Income Eligibility Levels for Children Under SCHIP, as a Percent of Federal Poverty Level, 2004, available at http://www.statehealthfacts.org/cgi-bin/healthfacts.cgi?action= profile&area=Florida&category=Medicaid+%26+SCHIP&subcategory=Children%27s+Medicaid+and+SCHIP+Eligibility&topic=Income+Eligibility%2d%2d+Separate+SCHIP, accessed April 17, 2005. 267 Florida KidCare, Florida KidCare, available at http://www.floridakidcare.org, accessed April 17, 2005. 268 Kaiser Family Foundation, State Health Facts, Florida: SCHIP, available at http://www.statehealthfacts.org/cgi-bin/healthfacts.cgi?action=profile&category=Medicaid+%26+SCHIP&subcategory=SCHIP&topic=&link_category=&link_subcategory=&link_topic=&welcome=0&area=Florida¬es=show&printerfriendly=0#pagetopic1, accessed April 17, 2005. 269 Centers for Medicare and Medicaid Services, A Profile of Medicaid: Chartbook 2000 (p. 72), available at http://www.cms.hhs.gov/charts/medicaid/2Tchartbk.pdf, accessed November 14, 2004. 270 National Governor’s Association, Florida: NGA Summary, State Children’s Health Insurance Program, available at http://www.nga.org/cda/files/FLSCHIP.pdf, accessed April 17, 2005. 271 Florida Agency for Health Care Administration, Florida KidCare, A Briefing for Governor Jeb Bush on September 12, 2003 (Powerpoint Presentation, September 12, 2003), available at http://www.fdhc.state.fl.us/ Medicaid/MediKids/kidcare_governor_9_03.ppt, accessed April 17, 2005. 272 Kaiser Commission on Medicaid and the Uninsured, Update on the Florida SCHIP Enrollment Freeze (July 23, 2004), available at http://www.statecoverage.net/statereports/fl41.pdf, accessed April 18, 2005. 273 Kaiser Family Foundation, State Health Facts, Florida: Managed Care & Health Insurance, available at http://www.statehealthfacts.org/cgi-bin/healthfacts.cgi?action=profile&area=Florida&welcome=1&category= Managed+Care+%26+Health+Insurance, accessed April 17, 2005.

C-41
274 Florida Agency for Health Care Administration, Florida Health Insurance Study 2004, The HRSA State Planning Grant Program Interim Report (September 30, 2004, pp. 9-10), available at http://ahca.myflorida.com/Medicaid/ Research/Projects/fhis2004/PDF/HRSA-SPG_INTERIM_Report_FINAL_.pdf, accessed April 18, 2005. 275 Florida Agency for Health Care Administration, HRSA State Planning Grant: Project Abstract (2003, p. 1), available at http://ahca.myflorida.com/affordable_health_insurance/PDFs/hrsa_state_planning_grant.pdf, accessed April 18, 2005. 276 Health Management Associates, Final Report of the Governor’s Task Force on Access to Affordable Health Insurance (February 15, 2004, p. 64), available at http://www.statecoverage.net/statereports/fl38.pdf, accessed April 18, 2005. 277 Kaiser Family Foundation, State Health Facts, Florida: Medicaid Managed Care, available at http://www.statehealthfacts.org/cgi-bin/healthfacts.cgi?action=profile&area=Florida&category=Medicaid+% 26+SCHIP&subcategory=Medicaid+Managed+Care, accessed April 17, 2005. 278 Kaiser Family Foundation, State Health Facts, Medicaid Waiver to Cover Family Planning, 2005, available at http://www.statehealthfacts.org/cgi-bin/healthfacts.cgi?action=profile&area=Florida&category=Medicaid+%26+ SCHIP&link_category=Women%27s+Health&link_subcategory=Medicaid+Policy&link_topic=Family+Planning+Waiver, accessed April 17, 2005. 279 State Coverage Initiatives, Medicaid Section 1931 Waiver, available at http://www.statecoverage.net/medicaid-1931.htm, accessed April 17, 2005. 280 State Coverage Initiatives, SCHIP Full Cost Buy-In, available at http://www.statecoverage.net/fullcost.htm, accessed April 17, 2005. 281 Centers for Medicare and Medicaid Services, Florida, available at http://www.cms.hhs.gov/medicaid/waivers/ flwaiver.asp, accessed April 17, 2005. 282 “Gov. Bush Proposes Medicaid Revamp,” St. Petersburg Times (January 12, 2005), available at http://www.sptimes.com/2005/01/12/State/Gov_Bush_proposes_Med.shtml, accessed January 12, 2005. 283 Ibid. 284 Florida Agency for Health Care Administration, Empowered Care: A Proposed Concept for Florida Medicaid (draft, March 14, 2005), available at http://www.empoweredcare.com/docs/empoweredcare_proposed_concept.pdf, accessed March 23, 2005. 285 Florida House of Representatives, Health Care General Committee, “Committee Meeting Packet for March 16, 2005” (including draft legislation of “Medicaid Reform Act of 2005,” March 14, 2005). 286 Florida Senate, Senate Bill 0838ER (Enrolled, 3rd Engrossed, 2005 Legislature), available at http://www.flsenate. gov/cgi-bin/view_page.pl?Tab=session&Submenu=1&FT=D&File=sb0838er.html&Directory=session/2005/ Senate/bills/billtext/html, accessed May 23, 2005. 287 Diane Hirth, “Medicaid Measure Passes: Compromise Comes Through,” The Mercury News (May 7, 2005), available at http://www.mercurynews.com/mld/tallahassee/news/politics/11586417.htm?template=contentModules/ printstory.jsp, accessed May 23, 2005. 288 Kaiser Family Foundation, State Health Facts, Arkansas: Distribution of Total Population by Federal Poverty Level, State Data 2002-2003, U.S. 2003, available at http://www.statehealthfacts.org/cgi-bin/healthfacts.cgi?action= profile&area=Arkansass&category=Demographics+and+the+Economy&subcategory=People+in+Poverty&topic= Distribution+by+FPL, accessed March 11, 2005 289 Kaiser Family Foundation, State Health Facts, Arkansas: Population Distribution by Insurance Status, State Data 2002-2003, U.S. 2003, available at http://www.statehealthfacts.org/cgi-bin/healthfacts.cgi?action=profile&area= Arkansas&category=Health+Coverage+%26+Uninsured&subcategory=Insurance+Status&topic=Distribution+by+Insurance+Status, accessed April 17, 2005 290 Kaiser Family Foundation, State Health Facts, Arkansas: Total Medicaid Spending, FY2003, available at http://www.statehealthfacts.org/cgi-bin/healthfacts.cgi?action=profile&area=Arkansas&category=Medicaid+%26+

C-42
SCHIP&subcategory=Medicaid+Spending&topic=Total+Medicaid+Spending%2c+FY2003, accessed March 10, 2005. 291 State Coverage Initiatives, Health Cost Concerns Intensify in Little Rock (Summer 2003), available at http://www.statecoverage.net/statereports/ar4.pdf, accessed April 22, 2005. 292 Kaiser Family Foundation, State Health Facts, Arkansas: Total Medicaid Spending, FY2003, available at http://www.statehealthfacts.org/cgi-bin/healthfacts.cgi?action=profile&area=Arkansas&category=Medicaid+%26+ SCHIP&subcategory=Medicaid+Spending&topic=Total+Medicaid+Spending%2c+FY2003, accessed March 10, 2005. 293 Heather Sacks, Todd Kutyla, and Sharon Silow-Carroll, Economic and Social Research Institute, Toward Comprehensive Health Coverage for All: Summaries of 20 State Planning Grants from the U.S. Health Resources and Services Administration (Commonwealth Fund, November 2002, p. 61), available at http://www.statecoverage.net/statereports/ar3.pdf, accessed on March 10, 2005. 294 State Coverage Initiatives, Health Cost Concerns Intensify in Little Rock (Summer 2003), available at http://www.statecoverage.net/statereports/ar4.pdf, accessed April 22, 2005. 295 Kaiser Commission on Medicaid and the Uninsured, Medicaid Benefits, as of January 2003, available at http://www.kff.org/medicaidbenefits/state-MN.cfm, accessed March 10, 2005. 296 Kaiser Family Foundation, State Health Facts, Arkansas: SCHIP Federal Matching Rate (FMAP), FFY2005, available at http://www.statehealthfacts.org/cgi-bin/healthfacts.cgi?action=profile&area=Arkansas&category= Medicaid+%26+SCHIP&subcategory=SCHIP&topic=Federal+Matching+Rate, accessed April 12, 2005. 297Kaiser Family Foundation, State Health Facts, Arkansas: SCHIP Expenditures, FFY 2002, available at http://www.statehealthfacts.org/cgi-bin/healthfacts.cgi?action=profile&area=Arkansas&category= Medicaid+%26+SCHIP&subcategory=SCHIP&topic=SCHIP+Expenditures, accessed April 12, 2005. 298 Kaiser Family Foundation, State Health Facts, Arkansas: Managed Care & Health Insurance, available at http://www.statehealthfacts.org/cgi-bin/healthfacts.cgi?action=profile&area=Arkansas&category=Managed+ Care+%26+Health+Insurance&subcategory=State+Continuation+Coverage&topic=State+COBRA+Expansions, accessed March 10, 2005. 299 State Coverage Initiatives, Assessing State Strategies for Health Coverage Expansion: Profiles of Arkansas, Michigan, New Mexico, New York, Utah, and Vermont (February 2003), available at http://www.statecoverage.net/statereports/multi3.pdf, accessed April 22, 2005. 300 Kaiser Family Foundation, State Health Facts, Arkansas: Women’s Health, available at http://www.statehealthfacts.org/cgi-bin/healthfacts.cgi?action=profile&area=Arkansas&category=Women%27s+ Health&subcategory=Medicaid+Policy&topic=Family+Planning+Waiver, accessed March 10, 2005. 301 State Coverage Initiatives, Medicaid Section 1931 Waiver, available at http://www.statecoverage.net/medicaid-1931.htm, accessed March 8, 2005. 302 Centers for Medicare and Medicaid Services, Arkansas Waiver and Demonstration Programs, Fact Sheet, available at http://www.cms.hhs.gov/medicaid/1115/ar1115tefra.asp, accessed April 23, 2005. 303 Ibid. 304 State Coverage Initiatives, Assessing State Strategies for Health Coverage Expansion: Profiles of Arkansas, Michigan, New Mexico, New York, Utah, and Vermont , available at http://www.statecoverage.net/ statereports/multi3.pdf, accessed April 22, 2005. 305 U.S. Census Bureau, U.S. Census 2000, Colorado QuickFacts, available at http://quickfacts.census.gov/ qfd/states/08000.html, accessed November 30, 2004. 306 Kaiser Family Foundation, State Health Facts, Colorado: Distribution of Total Population by Federal Poverty Level, State Data 2002-2003, U.S. 2003, available at: www.statehealthfacts.org/cgi-bin/healthfacts.cgi?action=profile&area=Colorado&category=Demographics+and+the+Economy&subcategory=People+in+Poverty&topic=Distribution+by+FPL, accessed March 25, 2005.

C-43
307 Kaiser Family Foundation, State Health Facts, Colorado: Population Distribution by Insurance Status, state data 2002-03, U.S. 2003, available at www.statehealthfacts.org/cgi-bin/healthfacts.cgi?action=profile&area=Colorado& category=Health+Coverage+%26+Uninsured&subcategory=Insurance+Status&topic=Distribution+by+Insurance+Status, accessed March 25, 2005. 308 The Bell Policy Center, “Ten Years of TABOR: A Study of Colorado’s Taxpayer’s Bill of Rights,” (2003), pp. 12-14. 309 Ibid. The index used is the Denver-Boulder-Greeley Consumer Price Index. 310 Donnell-Kay Foundation, “Amendment 23 and Public School Financing in Colorado” (March 2003), p. 5, available at http://www.headfirstcolorado.org/A23FINAL.pdf, accessed November 28, 2004. 311 Head First Colorado, “Amendment 23 Background,” available at http://www.headfirstcolorado.org/factsheets/Amendment_23.php, accessed November 28, 2004. 312 The Bell Policy Center, “Ten Years of TABOR: A Study of Colorado’s Taxpayer’s Bill of Rights.” 313 Kaiser Family Foundation, State Health Facts, Colorado: Medicaid Eligibility, 2004, available at www.statehealthfacts.org/cgi-bin/healthfacts.cgi?action=profile&area=Colorado&category=Medicaid+%26+ SCHIP&subcategory=Medicaid+Eligibility&topic=Income+Eligibility%2d%2d+Pregnant+in+Medicaid, accessed March 27, 2005. 314 Kaiser Family Foundation, State Health Facts, Colorado: Income Eligibility Levels for Children Under Medicaid, as a Percent of the Federal Poverty Level (FPL), 2004, available at www.statehealthfacts.org/cgi-bin/healthfacts. cgi?action=profile&area=Colorado&category=Medicaid+%26+SCHIP&subcategory=Children%27s+Medicaid+and+SCHIP+Eligibility&topic=Income+Eligibility%2d%2d+Medicaid, accessed March 27, 2005. 315 Kaiser Family Foundation, State Health Facts, Colorado: Federal Matching Rate (FMAP) for Medicaid, available at www.statehealthfacts.org/cgi-bin/healthfacts.cgi?action=profile&area=Colorado&category=Medicaid +%26+SCHIP&subcategory=Medicaid+Spending&topic=Federal+Matching+Rate+%28FMAP%29, accessed March 27, 2005. 316 Colorado Department of Health Care Policy and Financing (HCPF), “Strategic Plan, FY 05-06 Budget Request,” p. L-4; and HCPF, “Part II: Summary Tables—FY 2004-05 Appropriations by Department and Fund Source,” p. 15. 317 Kaiser Family Foundation, State Health Facts, Colorado: Total Medicaid Spending, FY2003, available at www.statehealthfacts.org/cgi-bin/healthfacts.cgi?action=profile&area=Colorado&category=Medicaid+%26+SCHIP &subcategory=Medicaid+Spending&topic=Total+Medicaid+Spending%2c+FY2003, accessed March 27, 2005. 318 Kaiser Family Foundation, State Health Facts, Colorado: Distribution of Medicaid Spending per Enrollee by Enrollment Group, FY2000, available at www.statehealthfacts.org/cgi-bin/healthfacts.cgi?action=profile&area= Colorado&category=Medicaid+%26+SCHIP&subcategory=Medicaid+Spending&topic=Spending+per+Enrollee+ by+Group%2c+FY2000, accessed March 27, 2005. 319 Kaiser Commission on Medicaid and the Uninsured, Medicaid Benefits, as of January 2003, available at www.kff.org/medicaidbenefits/state-CO.cfm, accessed March 27, 2005. 320 Kaiser Family Foundation, State Health Facts, Colorado: Children's Medicaid and SCHIP Eligibility, available at www.statehealthfacts.org/cgi-bin/healthfacts.cgi?action=profile&area=Colorado&category=Medicaid+%26+SCHIP &subcategory=Children%27s+Medicaid+and+SCHIP+Eligibility, accessed April 22, 2005. 321 Colorado Medical Services Board, Children’s Basic Health Plan Annual Report State Fiscal Year 2004, p. 8. 322 Kaiser Family Foundation, State Health Facts, Colorado: SCHIP, available at www.statehealthfacts.org/cgi-bin/healthfacts.cgi?action=profile&category=Medicaid+%26+SCHIP&subcategory=SCHIP&topic=&link_category=&link_subcategory=&link_topic=&welcome=0&area=Colorado, accessed April 22, 2005. 323 National Academy for State Health Policy, State Experience with Enrollment Caps in Separate SCHIP Programs (February 2004, p. 5), available at www.statecoverage.net/statereports/multi30.pdf, accessed April 22, 2005; and Colorado Medical Services Board, Children’s Basic Health Plan Annual Report State Fiscal Year 2004, p. 8. 324 Colorado Medical Services Board, Children’s Basic Health Plan Annual Report State Fiscal Year 2004, p. 6.

C-44
325 Kaiser Family Foundation, State Health Facts, Colorado: Managed Care & Health Insurance, available at www.statehealthfacts.org/cgi-bin/healthfacts.cgi?action=profile&area=Colorado&category=Managed+Care+% 26+Health+Insurance, accessed March 27, 2005. 326 Colorado Health Institute (CHI) “The Small Group Health Insurance Market in Colorado” (White Paper, pp. 25-26), available at http://coloradohealthinstitute.org/publications/Sm_grp_mkt.pdf, accessed April 26, 2005. 327 CHI, “The Small Group Health Insurance Market in Colorado,” pp. 25-26. 328 Kaiser Family Foundation, State Health Facts, Colorado: Medicaid Managed Care Enrollees as a Percent of State Medicaid Enrollees, 2003, available at www.statehealthfacts.org/cgi-bin/healthfacts.cgi?action=profile&area =Colorado&category=Medicaid+%26+SCHIP&subcategory=Medicaid+Managed+Care&topic=MC+Enrollment+as+a+%25+of+Total+Enrollment, accessed March 28, 2005. 329 Centers for Medicare and Medicaid Services, Colorado 1915(b) Fact Sheet—Primary Care Physicians Program, available at www.cms.hhs.gov/medicaid/1915b/copcppfs.pdf, accessed March 28, 2005; and HCPF, “Assumptions and Calculations FY 05-06 Budget Request,” November 1, 2004, p. M-69. 330 Centers for Medicare and Medicaid Services, Colorado 1915(b) Fact Sheet—Primary Care Physicians Program, available at www.cms.hhs.gov/medicaid/1915b/copcppfs.pdf, accessed March 28, 2005. 331 HCPF, “Assumptions and Calculations FY 05-06 Budget Request,” November 1, 2004, p. M-24. Telephone interview with Elizabeth Arenales, Esq., Health Care Program Director, Colorado Center on Law and Policy, by Kelly Shanahan, March 6, 2005. 332 Arenales interview. 333 HCPF, “Assumptions and Calculations FY 05-06 Budget Request,” November 1, 2004, p. M-79. 334 Centers for Medicare and Medicaid Services, Colorado, available at http://www.cms.hhs.gov/ medicaid/waivers/cowaiver.asp, accessed March 28, 2005. 335 Centers for Medicare and Medicaid Services, Colorado §1115 Demonstration Fact Sheet—Consumer Directed Attendant Support, available at http://www.cms.hhs.gov/medicaid/1115/cocdasfct.pdf, accessed March 28, 2005. 336 Centers for Medicare and Medicaid Services, Colorado §1115 Demonstration Fact Sheet—Alternatives in Medicaid Home Care, available at http://www.cms.hhs.gov/medicaid/1115/coamhcsfct.pdf, accessed on March 28, 2005. 337 HCPF, “Assumptions and Calculations FY 05-06 Budget Request,” November 1, 2004, pp. M85-86. 338 Colorado State Constitution, Article X, Section 21 “Tobacco Taxes for Health Related Purposes.” 339 As of April 22, 2005, HB05-1262 has passed the House of Representatives, the Senate Health and Human Services Committee, and as of this writing awaits debate in the Senate Appropriations Committee. 340 Colorado Legislative Council Staff, “HB05-1262 State and Local Revised Fiscal Impact,” Drafting Number LLS 05-0339, Prime Sponsors Rep. Boyd and Sen. Hagedorn; Bill Status: House Third Reading, April 5, 2005, pg. 3. 341 Colorado General Assembly, House of Representatives, Second Reading of HB05-1262, testimony of House bill sponsor, Representative Betty Boyd, D-Jefferson County, April 5, 2005. 342 Colorado General Assembly, First Regular Session, Sixty-fifth General Assembly, HB05-1262 Engrossed (this version includes all amendments adopted on Second Reading in the House of Introduction), House Sponsorship: Boyd and Buescher, Senate Sponsorship: Hagedorn, Sandoval, Tochtrop, Williams, and Windels. 343 Colorado Legislative Council Staff, “HB05-1262 State and Local Revised Fiscal Impact,” Drafting Number LLS 05-0339, Prime Sponsors Rep. Boyd and Sen. Hagedorn; Bill Status: House Third Reading, April 5, 2005; Colorado General Assembly, House of Representatives, Second Reading of HB05-1262, testimony of House bill sponsor, Representative Betty Boyd, D-Jefferson County, April 5, 2005. 344 HCPF, “Assumptions and Calculations FY 05-06 Budget Request,” November 1, 2004, p. M-86.

C-45
345 Kaiser Family Foundation, Maine: Population Distribution by Insurance Status, state data 2002-03, U.S. 2003, available at http://www.statehealthfacts.org/cgi-bin/healthfacts.cgi?action=profile&area=Maine& category=Health+Coverage+%26+Uninsured&subcategory=Insurance+Status&topic=Distribution+by+Insurance+Status, accessed March 2, 2005. 346 Kaiser Family Foundation, Maine: Population Distribution by Insurance Status, state data 2002-03, U.S. 2003, available at http://www.statehealthfacts.org/cgi-bin/healthfacts.cgi?action=profile&area=Maine& category=Health+Coverage+%26+Uninsured&subcategory=Insurance+Status&topic=Distribution+by+Insurance+Status, accessed March 2, 2005. 347 Kaiser Family Foundation, Maine: Distribution of Total Population by Federal Poverty Level, state data 2002-03, U.S. 2003, available at http://www.statehealthfacts.org/cgi-bin/healthfacts.cgi?action=profile&area= Maine&category=Demographics+and+the+Economy&subcategory=People+in+Poverty&topic=Distribution+by+FPL, accessed March 2, 2005. 348 Rachel Garfield, Understanding MaineCare: A Chartbook about Maine’s Medicaid Program (Governor’s Office of Health Policy and Finance, Augusta, Maine, January 2005, p. 11), available at http://www.dirigohealth.maine. gov/MaineCare%20Chartbook%201-6-05.pdf, accessed April 6, 2005. 349 Kaiser Family Foundation, Maine: Medicaid Spending, available at http://www.statehealthfacts.kff.org/cgi-bin/healthfacts.cgi?action=profile&category=Medicaid+%26+SCHIP&subcategory=Medicaid+Spending&topic=&link_category=&link_subcategory=&link_topic=&welcome=0&area=Maine, accessed April 6, 2005. 350 Kaiser Family Foundation, Maine: Medicaid Spending, available at http://www.statehealthfacts.kff.org/cgi-bin/healthfacts.cgi?action=profile&category=Medicaid+%26+SCHIP&subcategory=Medicaid+Spending&topic=&link_category=&link_subcategory=&link_topic=&welcome=0&area=Maine, accessed April 6, 2005. 351 Rachel Garfield, Understanding MaineCare: A Chartbook about Maine’s Medicaid Program (Governor’s Office of Health Policy and Finance, Augusta, Maine, January 2005, p. 11), available at http://www.dirigohealth.maine. gov/MaineCare%20Chartbook%201-6-05.pdf, accessed April 6, 2005. 352 Kaiser Family Foundation, Maine: Medicaid Spending, available at http://www.statehealthfacts.kff.org/cgi-bin/healthfacts.cgi?action=profile&category=Medicaid+%26+SCHIP&subcategory=Medicaid+Spending&topic=&link_category=&link_subcategory=&link_topic=&welcome=0&area=Maine, accessed April 6, 2005. 353 Kaiser Commission on Medicaid and the Uninsured, Medicaid Benefits, as of January 2003, available at http://www.kff.org/medicaidbenefits/state-ME.cfm, accessed April 6, 2005. 354 Kaiser Family Foundation, SCHIP Matching Rate, available at http://www.statehealthfacts.kff.org/cgi-bin/healthfacts.cgi?action=profile&area=Maine&category=Medicaid+%26+SCHIP&subcategory=SCHIP&topic= Federal+Matching+Rate, accessed April 6, 2005. 355 Kaiser Family Foundation, SCHIP Expenditures, FFY2002, available at http://www.statehealthfacts.kff.org/cgi-bin/healthfacts.cgi?action=profile&area=Maine&category=Medicaid+%26+SCHIP&subcategory=SCHIP&topic= SCHIP+Expenditures, accessed April 6, 2005. 356 Kaiser Family Foundation, Current Monthly SCHIP Enrollment, January 2003, available at http://www.statehealthfacts.kff.org/cgi-bin/healthfacts.cgi?action=profile&area=Maine&category= Medicaid+%26+SCHIP&subcategory=SCHIP&topic=Enrollment, accessed April 6, 2005. 357 State Coverage Initiatives, State of the States: Finding Alternate Routes (Academy Health, January 2005, p. 17), available at http://www.statecoverage.net/pdf/stateofstates2005.pdf, accessed March 30, 2005. 358 Centers for Medicare and Medicaid Services, Health Insurance Flexibility and Accountability (HIFA) Initiative Fact Sheet, November 12, 2002, available at http://www.cms.hhs.gov/hifa/mecarefs.pdf, accessed April 26, 2005. 359 Centers for Medicare and Medicaid Services, Maine HIV/AIDS Demonstration Fact Sheet, November 24, 2003, available at http://www.cms.hhs.gov/medicaid/1115/mehivfct.pdf, accessed April 26, 2005. 360 Jill Rosenthal and Cynthia Pernice, Dirigo Health Reform Act: Addressing Health Care Costs, Quality, and Access in Maine (Portland, ME: National Academy for State Health Policy, June 2004), p. 1.

C-46
361 State Coverage Initiatives, State of the States: Finding Alternate Routes (Academy Health, January 2005, p. 15), available at http://www.statecoverage.net/pdf/stateofstates2005.pdf, accessed March 30, 2005. 362 Rosenthal and Pernice, p. 10. 363 Ibid., pp. 10-11. 364 Ibid., p. 10. 365 State Coverage Initiatives, State of the States: Finding Alternate Routes (Academy Health, January 2005, p. 15), available at http://www.statecoverage.net/pdf/stateofstates2005.pdf, accessed March 30, 2005. 366 Rosenthal and Pernice, p. 10. 367 Ibid., p. 11. 368 Ibid. 369 Ibid., p. 13. 370 Ibid., p. 10. 371 Ibid. 372 Ibid., p. 5. 373 Ibid., p. 7. 374 Ibid. 375 Ibid., p. 6. 376 State of Maine statute requires that benefits be provided at the same benefit level provided for medical treatment for the following listed mental illnesses: psychotic disorders, including schizophrenia, dissociative disorders, mood disorders, anxiety disorders, personality disorders, paraphilias, attention deficit and disruptive behavior disorders, pervasive developmental disorders, tic disorders, eating disorders, including bulimia and anorexia, and substance abuse-related disorders. 377 Anthem, Dirigo Choice Health Plan 2—Group [B, C, D, E, or F], available at http://www.dirigohealth.maine.gov/DHA%20Agreement%20-Sch%20B-4%20FINAL%209-12-04.pdf, accessed April 6, 2005. 378 Rosenthal and Pernice, p. 7. 379 Maine Office of the Governor, Office of Health Policy and Finance, Proposals to “Reform” Insurance: Less Coverage at Higher Cost for Most Mainers (March 15, 2005), available at http://www.maine.gov/governor/ baldacci/healthpolicy/news/3_15_05.htm, accessed March 30, 2005. 380 Ibid. 381 Maine Office of the Governor, Office of Health Policy and Finance, Dirigo Health has Successful First Year, available at http://www.maine.gov/governor/baldacci/healthpolicy/news/9_13_04.htm, accessed March 30, 2005. 382 Rosenthal and Pernice, p. 9. 383 “MaineCare and the Federal Budget,” Maine Health News and Views (Portland, Maine, January 2005, pp. 1-2), available at http://www.mainehealth.org/mh_about/newsviewsjan.pdf, accessed March 3, 2005. 384 Ibid. 385 “Health Care for All Tough in the Early Going: A New MaineCare Program Has Reached its Limits, Highlighting the Challenge of Universal Coverage” (www.IthicaTimes.com, February 20, 2005) available at http://www.zwire.com/site/news.cfm?newsid=14000131&BRD=1395&PAG=740&dept_id=226958&rfi=6, accessed March 3, 2005; and “Brief on MaineCare Cuts for ‘Noncategorical’ Adults,” Maine Equal Justice (Augusta, Maine, February 17, 2005), available at http://www.mejp.org/PDF/mainecare_cuts.pdf, accessed March 3, 2005.

C-47
386 “Brief on MaineCare Cuts for ‘Noncategorical’ Adults,” Maine Equal Justice (Augusta, Maine, February 17, 2005), available at http://www.mejp.org/PDF/mainecare_cuts.pdf, accessed March 3, 2005. 387 Josie Huang, “Baldacci Halts Expansion of Health Program,” Portland Press Herald (February 18, 2005), available at http://pressherald.mainetoday.com/news/statehouse/050218mainecare.shtml, accessed March 3, 2005. 388 State Coverage Initiatives, State of the States: Finding Alternate Routes (Academy Health, January 2005, p. 16), available at http://www.statecoverage.net/pdf/stateofstates2005.pdf, accessed March 30, 2005. 389 Maine Office of the Governor, Office of Health Policy and Finance, Dirigo Health has Successful First Year, available at http://www.maine.gov/governor/baldacci/healthpolicy/news/9_13_04.htm, accessed March 2, 2005 390 “Residents Can Enroll in State Health Plan,” York Weekly (February 9, 2005), available at http://www.seacoastonline.com/news/yorkweekly/02092005/business/63728.htm, accessed March 2, 2005. 391 State Coverage Initiatives, State of the States: Finding Alternate Routes (Academy Health, January 2005, p. 16), available at http://www.statecoverage.net/pdf/stateofstates2005.pdf, accessed March 30, 2005. 392 Kaiser Family Foundation, State Health Facts, Minnesota: Distribution of Total Population by Federal Poverty Level, State Data 2002-2003, U.S. 2003, available at http://www.statehealthfacts.org/cgi-bin/healthfacts.cgi? action=profile&area=Minnesota&category=Demographics+and+the+Economy&subcategory=People+in+Poverty&topic=Distribution+by+FPL, accessed March 8, 2005. 393 Kaiser Family Foundation, State Health Facts, Minnesota: Population Distribution by Insurance Status, State Data 2002-2003, U.S. 2003, available at http://www.statehealthfacts.org/cgi-bin/healthfacts.cgi?action=profile &area=Minnesota&category=Health+Coverage+%26+Uninsured&subcategory=Insurance+Status&topic=Distribution+by+Insurance+Status, accessed March 8, 2005. 394 Kaiser Family Foundation, State Health Facts, Minnesota: Medicaid Eligibility, 2004, available at http://www.statehealthfacts.org/cgi-bin/healthfacts.cgi?action=profile&category=Medicaid+%26+SCHIP& subcategory=Medicaid+Eligibility&topic=&link_category=&link_subcategory=&link_topic=&welcome=0&area=Minnesota¬es=show&printerfriendly=0#pagetopic1, accessed March 8, 2005. 395 Kaiser Family Foundation, State Health Facts, Minnesota: Income Eligibility Levels for Children under Medicaid, as a Percent of Federal Poverty Level, 2004, available at http://www.statehealthfacts.org/cgi-bin/healthfacts.cgi? action=profile&area=Minnesota&category=Medicaid+%26+SCHIP&subcategory=Children%27s+Medicaid+and+SCHIP+Eligibility&topic=Income+Eligibility%2d%2d+Medicaid, accessed March 8, 2005. 396 Kaiser Family Foundation, State Health Facts, Minnesota: Federal Matching Rate (FMAP) for Medicaid, available at http://www.statehealthfacts.org/cgi-bin/healthfacts.cgi?action=profile&area=Minnesota&category=Medicaid+% 26+SCHIP&subcategory=Medicaid+Spending&topic=Federal+Matching+Rate+%28FMAP%29, accessed March 8, 2005. 397 Randall Chun, MinnesotaCare (Information Brief, Minnesota House of Representatives, November 2003, p. 12), available at http://www.house.leg.state.mn.us/hrd/pubs/mncare.pdf, accessed March 8, 2005. 398 Minnesota House of Representatives, Fiscal Analysis Department, Health Care Access (HCAF) Transfer Issues (Issue Brief, revised June 9, 2004), available at http://www.house.leg.state.mn.us/fiscal/files/ibhctxfr.PDF, accessed April 14, 2005. 399 Kaiser Family Foundation, State Health Facts, Minnesota: Medicaid Spending, available at http://www.statehealthfacts.org/cgi-bin/healthfacts.cgi?action=profile&area=Minnesota&category=Medicaid+%26+ SCHIP&subcategory=Medicaid+Spending, accessed March 8, 2005. 400 Kaiser Commission on Medicaid and the Uninsured, Medicaid Benefits, as of January 2003, available at http://www.kff.org/medicaidbenefits/state-MN.cfm, accessed March 8, 2005. 401 Kaiser Family Foundation, State Health Facts, Minnesota: SCHIP Federal Matching Rate (FMAP), FFY 2005, available at http://www.statehealthfacts.kff.org/cgi-bin/healthfacts.cgi?action=profile&category=Medicaid+%26+

C-48
SCHIP&subcategory=SCHIP&topic=Federal+Matching+Rate&link_category=&link_subcategory=&link_topic=&welcome=0&area=Minnesota, accessed April 11, 2005. 402 Kaiser Family Foundation, State Health Facts, Minnesota: SCHIP Expenditures, FFY 2002, available at http://www.statehealthfacts.org/cgi-bin/healthfacts.cgi?action=profile&area=Minnesota&category=Medicaid+%26+ SCHIP&subcategory=SCHIP&topic=SCHIP+Expenditures, accessed April 11, 2005. 403 Kaiser Family Foundation, State Health Facts, Minnesota: Current Monthly SCHIP Enrollment, December 2003, available at http://www.statehealthfacts.kff.org/cgi-bin/healthfacts.cgi?action=profile&area=Minnesota& category=Medicaid+%26+SCHIP&subcategory=SCHIP&topic=Enrollment, accessed April 11, 2005. 404 Centers for Medicare and Medicaid Services, A Profile of Medicaid: Chartbook 2000 (p. 72), available at http://www.cms.hhs.gov/charts/medicaid/2Tchartbk.pdf, accessed November 14, 2004. 405 National Governor’s Association, Minnesota, NGA Summary, State Children’s Health Insurance Program, available at http://www.nga.org/cda/files/MNSCHIP.pdf, accessed April 11, 2005. 406 Kaiser Family Foundation, State Health Facts, Minnesota: Managed Care & Health Insurance, available at http://www.statehealthfacts.org/cgi-bin/healthfacts.cgi?action=profile&area=Minnesota&welcome=1&category= Managed+Care+%26+Health+Insurance, accessed March 8, 2005. 407 Minnesota Comprehensive Health Association, Minnesota Comprehensive Health Association, available at http://www.mchamn.com, accessed April 17, 2005. 408 Kaiser Family Foundation, State Health Facts, Minnesota: Managed Care & Health Insurance, available at http://www.statehealthfacts.org/cgi-bin/healthfacts.cgi?action=profile&area=Minnesota&welcome=1&category= Managed+Care+%26+Health+Insurance, accessed March 8, 2005. 409 Heather Sacks, Todd Kutyla, and Sharon Silow-Carroll, Economic and Social Research Institute, Toward Comprehensive Health Coverage for All: Summaries of 20 State Planning Grants from the U.S. Health Resources and Services Administration (Commonwealth Fund, November 2002, p. 61), available at http://www.statecoverage.net/statereports/mn30.pdf, accessed March 8, 2005. 410 Deborah Chollet, The Role of Reinsurance in State Efforts to Expand Coverage (State Coverage Initiatives, Issue Brief, October 2004, p. 5, endnote 1), available at http://www.statecoverage.net/pdf/issuebrief1004.pdf, accessed March 11, 2005. 411 Kaiser Family Foundation, State Health Facts, Minnesota: Medicaid & SCHIP, available at http://www.statehealthfacts.org/cgi-bin/healthfacts.cgi?action=profile&area=Minnesota&welcome=1&category= Medicaid+%26+SCHIP, accessed March 8, 2005. 412 State Coverage Initiatives, Medicaid Section 1931 Waiver, available at http://www.statecoverage.net/medicaid-1931.htm, accessed March 8, 2005. 413 Centers for Medicare and Medicaid Services, Minnesota, available at http://www.cms.hhs.gov/medicaid/ waivers/MNwaiver.asp?state=MN, accessed March 8, 2005. 414 State Coverage Initiatives, Medicaid Section 1115 Waiver, available at http://www.statecoverage.net/medicaid-1115.htm, and SCHIP Section 1115 Waiver, available at http://www.statecoverage.net/schip-1115.htm, accessed March 8, 2005. 415 Randall Chun, MinnesotaCare (Information Brief, Minnesota House of Representatives, November 2003, p. 3), available at http://www.house.leg.state.mn.us/hrd/pubs/mncare.pdf, accessed March 8, 2005. 416 Ibid. 417 Ibid. 418 Minnesota Department of Human Services, Minnesota Health Care Programs (March 2005), available at http://www.dhs.state.mn.us/main/groups/publications/documents/pub/DHS_id_048802.pdf, accessed April 11, 2005.

C-49
419 Children, Youth and Family Consortium and the Children's Defense Fund Minnesota, Covering All Families (February 20, 2004), available at http://www.cyfc.umn.edu/coveringallfamilies/programsfaq.html, accessed April 11, 2005. 420 David U. Himmelstein, Elizabeth Warren, Deborah Thorne, and Steffie Woolhandler, “Illness and Injury As Contributors to Bankruptcy” (Health Affairs, Web Exclusive, February 2, 2005), available at http://content.healthaffairs.org/cgi/reprint/hlthaff.w5.63v1, accessed May 27, 2005. 421 Ibid. 422 Centers for Medicare and Medicaid Services, Emergency Medical Treatment and Labor Act (EMTALA) Resource, available at http://www.cms.hhs.gov/providers/emtala/default.asp, accessed March, 25, 2004.

C-50
An Analysis of Reform Options Developed by Other States Appendix A. State Coverage Matrix: Strategies for Health Insurance Expansion
State Medicaid SCHIP State-Only
1115 1931 HIPP TMA* HIFA EmployerBuy-In 1115
Full-Cost
Buy-InCoverage Program
High-Risk Pool
Tax Incent-
ives Alabama Alaska Arizona Arkansas California Colorado Connecticut Delaware District of Florida Georgia Hawaii Idaho Illinois Indiana Iowa Kansas Kentucky Louisiana Maine Maryland Massachusetts Michigan Minnesota Mississippi Missouri Montana Nebraska Nevada New Hampshire New Jersey New Mexico New York North Carolina North Dakota Ohio Oklahoma Oregon

C-51
State Medicaid SCHIP State-Only
1115 1931 HIPP TMA* HIFA EmployerBuy-In 1115
Full-Cost
Buy-InCoverage Program
High-Risk Pool
Tax Incent-
ives Pennsylvania Rhode Island South Carolina South Dakota Tennessee . Texas Utah Vermont Virginia Washington West Virginia Wisconsin Wyoming ALL STATES 16 27 11 6 9 7 4 4 13 32 15 Source: State Coverage Initiatives, State Coverage Matrix: Strategies Used to Expand Health Insurance Coverage
Across the U.S. (updated March 2004), available at http://www.statecoverage.net/matrix.htm, accessed March 14, 2005.
*TMA is Transitional Medicaid Assistance, and a check in this column means that the state has extended eligibility for TMA beyond the 12 months required after a family loses eligibility for welfare due to increased earnings.

C-52
References Advantage Insurance and Financial Services, Inc., Guaranteed Issue HIPAA Coverage.
Available at http://www.aifsi.com/hipaa_plans.htm.
AISHealth.com, Insurers, Enrollees Show Little Interest in State ‘Mandate-Light’ Laws. Business News of the Week, May 18, 2005. Available at http://www.aishealth.com/ bnow/051805a.html.
Anthem. Dirigo Choice Health Plan 2—Group [B, C, D, E, or F]. Available at http://www. dirigohealth.maine.gov/DHA%20Agreement%20-Sch%20B-4%20FINAL%209-12-04.pdf.
Arenales, Elizabeth, Esq., Health Care Program Director, Colorado Center on Law and Policy, Telephone interview by Kelly Shanahan, March 6, 2005.
“Brief on MaineCare Cuts for ‘Noncategorical’ Adults.” Maine Equal Justice. Augusta, Maine, February 17, 2005. Available at http://www.mejp.org/PDF/mainecare_cuts.pdf.
Brody, William R. “A New Vision for Maryland Hospitals.” Originally published in the Baltimore Sun, December 10, 2002. Available at http://www.jhu.edu/~president/ news/sundec10.html.
Butler, Patricia A. ERISA Implications for Employer Pay or Play Coverage Laws. California HealthCare Foundation, March 2005. Available at http://www.chcf.org/documents/ insurance/ERISAPayPlayImplications.pdf.
Butler, Patricia A. Revisiting Pay or Play: How States Could Expand Employer-Based Coverage within ERISA Constraints. National Academy for State Health Policy, May 2002. Available at http://www.nashp.org/Files/ERISA_pay_or_play.PDF.
Centers for Medicare and Medicaid Services. A Profile of Medicaid: Chartbook 2000. Available at http://www.cms.hhs.gov/charts/medicaid/2Tchartbk.pdf.
Centers for Medicare and Medicaid Services. Arkansas Waiver and Demonstration Programs, Fact Sheet. Available at http://www.cms.hhs.gov/medicaid/1115/ar1115tefra.asp.
Centers for Medicare and Medicaid Services. Colorado 1915(b) Fact Sheet—Primary Care Physicians Program. Available at www.cms.hhs.gov/medicaid/1915b/copcppfs.pdf.
Centers for Medicare and Medicaid Services. Colorado §1115 Demonstration Fact Sheet—Alternatives in Medicaid Home Care. Available at http://www.cms.hhs.gov/medicaid/1115/coamhcsfct.pdf.
Centers for Medicare and Medicaid Services. Colorado. Available at http://www.cms.hhs.gov/ medicaid/waivers/cowaiver.asp.
Centers for Medicare and Medicaid Services. Emergency Medical Treatment and Labor Act (EMTALA) Resource. Available at http://www.cms.hhs.gov/providers/emtala/default.asp.
Centers for Medicare and Medicaid Services. Florida. Available at http://www.cms.hhs.gov/ medicaid/waivers/flwaiver.asp.

C-53
Centers for Medicare and Medicaid Services. Health Insurance Flexibility and Accountability (HIFA) Initiative Fact Sheet. November 12, 2002. Available at http://www.cms.hhs.gov/ hifa/mecarefs.pdf.
Centers for Medicare and Medicaid Services. Maine HIV/AIDS Demonstration Fact Sheet. November 24, 2003. Available at http://www.cms.hhs.gov/medicaid/1115/mehivfct.pdf.
Centers for Medicare and Medicaid Services. Minnesota. Available at http://www.cms.hhs.gov/ medicaid/waivers/MNwaiver.asp?state=MN.
Centers for Medicare and Medicaid Services. Utah Primary Care Network Demonstration Fact Sheet. Updated April 4, 2005. Available at http://www.cms.hhs.gov/medicaid/1115/ utpcnfs.pdf.
Children, Youth and Family Consortium and the Children’s Defense Fund Minnesota. Covering All Families. February 20, 2004. Available at http://www.cyfc.umn.edu/ coveringallfamilies/programsfaq.html.
Chollet, Deborah. Issue Brief: The Role of Reinsurance in State Efforts to Expand Coverage. State Coverage Initiatives, October 2004. Available at http://www.statecoverage.net/ pdf/issuebrief1004.pdf.
Chun, Randall. MinnesotaCare. Information Brief, Minnesota House of Representatives, November 2003. Available at http://www.house.leg.state.mn.us/hrd/pubs/mncare.pdf.
Colorado Department of Health Care Policy and Financing. “Assumptions and Calculations FY 05-06 Budget Request.” November 1, 2004.
Colorado Department of Health Care Policy and Financing. “Strategic Plan, FY 05-06 Budget Request,” “Part II: Summary Tables—FY 2004-05 Appropriations by Department and Fund Source.”
Colorado General Assembly. First Regular Session, Sixty-fifth General Assembly, HB05-1262 Engrossed. Includes all amendments adopted on Second Reading in the House of Introduction.
Colorado General Assembly, House of Representatives. Second Reading of HB05-1262, testimony of House bill sponsor, Representative Betty Boyd, D-Jefferson County, April 5, 2005.
Colorado Health Institute. “The Small Group Health Insurance Market in Colorado.” White Paper. Available at http://coloradohealthinstitute.org/publications/Sm_grp_mkt.pdf.
Colorado Legislative Council Staff. “HB05-1262 State and Local Revised Fiscal Impact.” Drafting Number LLS 05-0339. Prime Sponsors Rep. Boyd and Sen. Hagedorn. Bill Status: House Third Reading, April 5, 2005.
Colorado Medical Services Board. Children’s Basic Health Plan Annual Report State Fiscal Year 2004. 2004.
Colorado State Constitution. Article X, Section 21. “Tobacco Taxes for Health Related Purposes.”

C-54
Donnell-Kay Foundation. “Amendment 23 and Public School Financing in Colorado.” March 2003. Available at http://www.headfirstcolorado.org/A23FINAL.pdf.
Dunkelberg, Anne, and Molly O’Malley. Children’s Medicaid and SCHIP in Texas: Tracking the Impact of Budget Cuts. Kaiser Commission on Medicaid and the Uninsured, July 2004. Available at http://www.kff.org/medicaid/7132.cfm.
Dunkelberg, Anne. Center for Public Policy Priorities. Medicaid and State Budgets: A Case Study of Texas. Kaiser Commission on Medicaid and the Uninsured, March 2002. Available at http://www.cppp.org/files/6/getfile.pdf.
Employee Benefit Research Institute. An Employer Mandate: What’s Known and What Isn’t. November 1993. Available at http://www.ebri.org/srpdfs/sr19.pdf.
Florida Agency for Health Care Administration. Empowered Care: A Proposed Concept for Florida Medicaid. Draft, March 14, 2005. Available at http://www.empoweredcare. com/docs/empoweredcare_proposed_concept.pdf.
Florida Agency for Health Care Administration. Florida Health Insurance Study 2004, The HRSA State Planning Grant Program Interim Report. September 30, 2004. Available at http://ahca.myflorida.com/Medicaid/Research/Projects/fhis2004/PDF/HRSA-SPG_ INTERIM_Report_FINAL_.pdf.
Florida Agency for Health Care Administration. Florida KidCare, A Briefing for Governor Jeb Bush on September 12, 2003. Powerpoint Presentation, September 12, 2003. Available at http://www.fdhc.state.fl.us/Medicaid/MediKids/kidcare_governor_9_03.ppt.
Florida Agency for Health Care Administration. HRSA State Planning Grant: Project Abstract. 2003. Available at http://ahca.myflorida.com/affordable_health_insurance/PDFs/hrsa_ state_planning_grant.pdf.
Florida House of Representatives, Health Care General Committee. “Committee Meeting Packet for March 16, 2005. ” Including draft legislation of “Medicaid Reform Act of 2005” March 14, 2005.
Florida KidCare. Florida KidCare. Available at http://www.floridakidcare.org.
Florida Senate. Senate Bill 0838ER (Enrolled, 3rd Engrossed, 2005 Legislature). Available at http://www.flsenate.gov/cgi-bin/view_page.pl?Tab=session&Submenu=1&FT=D&File =sb0838er.html&Directory=session/2005/Senate/bills/billtext/html.
Friedenzohn, Isabel. Issue Brief: Limited-Benefit Policies: Public and Private-Sector Experiences. State Coverage Initiatives, July 2004. Available at http://www. statecoverage.net/pdf/issuebrief704.pdf.
Friedenzohn, Isabel. Issue Brief: States’ Experience with Benefit Design. State Coverage Initiatives, April 2003. Available at http://www.statecoverage.net/pdf/issuebrief403 benefits.pdf#search='utah%20medicaid%20benefit%20reduced..
Garfield, Rachel. Understanding MaineCare: A Chartbook about Maine’s Medicaid Program. Governor’s Office of Health Policy and Finance, Augusta, Maine, January 2005. Available at http://www.dirigohealth.maine.gov/MaineCare%20Chartbook%201-6-05.pdf.

C-55
Garrett, Scott, and Jeb Bradley, Been There, Done That, Let’s Steer Clear of Guaranteed Issue. Letter to Republican Congress, March 3, 2003. Available at http://www.cagionline.org/ garrettltr.pdf.
Georgetown University Health Policy Institute. Summary of Key Consumer Protections in Individual Health Insurance Markets. April 2004. Available at http://www. healthinsuranceinfo.net/newsyoucanuse/discrimination_limits.pdf.
“Gov. Bush Proposes Medicaid Revamp.” St. Petersburg Times. January 12, 2005. Available at http://www.sptimes.com/2005/01/12/State/Gov_Bush_proposes_Med.shtml.
Harris, Gwendolyn L. Commissioner, New Jersey Department of Human Services, Letter to Dennis Smith, Centers for Medicare and Medicaid Services. July 15th, 2002. Available at http://www.cms.hhs.gov/hifa/njhifacvrltr.pdf.
Head First Colorado. “Amendment 23 Background.” Available at http://www.headfirst colorado.org/factsheets/Amendment_23.php.
“Health Care for All Tough in the Early Going: A New MaineCare Program Has Reached its Limits, Highlighting the Challenge of Universal Coverage.” www.IthicaTimes.com, February 20, 2005. Available at http://www.zwire.com/site/news.cfm?newsid=1400 0131&BRD=1395&PAG=740&dept_id=226958&rfi=6.
Health Management Associates. Final Report of the Governor’s Task Force on Access to Affordable Health Insurance. February 15, 2004. Available at http://www. statecoverage.net/statereports/fl38.pdf.
Himmelstein, David U., Elizabeth Warren, Deborah Thorne, and Steffie Woolhandler. “Illness and Injury As Contributors to Bankruptcy.” Health Affairs, Web Exclusive, February 2, 2005. Available at http://content.healthaffairs.org/cgi/reprint/hlthaff.w5.63v1.
Hirth, Diane. “Medicaid Measure Passes: Compromise Comes Through.” The Mercury News (May 7, 2005). Available at http://www.mercurynews.com/mld/tallahassee/news/ politics/11586417.htm?template=contentModules/printstory.jsp.
Howell, Embry, Ruth Almeida, Lisa Dubay, and Genevieve Kenney. Early Experience with Covering Uninsured Parents Under SCHIP. The Urban Institute, No. A-51, May 2002. Available at http://www.urban.org/url.cfm?ID=310498.
Huang, Josie. “Baldacci Halts Expansion of Health Program.” Portland Press Herald. February 18, 2005. Available at http://pressherald.mainetoday.com/news/statehouse/ 050218mainecare.shtml.
Kaiser Commission on Medicaid and the Uninsured. Medicaid Benefits, as of January 2003. Available at http://www.kff.org/medicaidbenefits.
Kaiser Commission on Medicaid and the Uninsured. Update on the Florida SCHIP Enrollment Freeze. July 23, 2004. Available at http://www.statecoverage.net/statereports/fl41.pdf.
Kaiser Family Foundation. Arkansas: Women’s Health. Available at http://www. statehealthfacts.org/cgi-bin/healthfacts.cgi?action=profile&area=Arkansas&category= Women%27s+Health&subcategory=Medicaid+Policy&topic=Family+Planning+Waiver.

C-56
Kaiser Family Foundation. Demographics and the Economy. Available at http://www. statehealthfacts.org/cgi-bin/healthfacts.cgi?action=compare&welcome=1& category=Demographics+and+the+Economy.
Kaiser Family Foundation. Health Coverage and Uninsured. Available at http://www. statehealthfacts.org/cgi-bin/healthfacts.cgi?action=compare&welcome=1& category=Health+Coverage+%26+Uninsured.
Kaiser Family Foundation. Managed Care and Health Insurance. Available at http://www. statehealthfacts.org/cgi-bin/healthfacts.cgi?action=compare&welcome=1& category=Managed+Care+%26+Health+Insurance.
Kaiser Family Foundation. Medicaid and SCHIP. Available at http://www.statehealthfacts.org/ cgi-bin/healthfacts.cgi?action=compare&welcome=1&category=Medicaid+%26+SCHIP.
Kaisernetwork.org. HHS Approves Utah’s First-in-Kind Medicaid Waiver Proposal To Extend Coverage to 25,000 While Reducing Other Benefits. Daily Health Policy Report, Feb 11, 2002. Available at http://www.kaisernetwork.org/daily_reports/rep_index.cfm?hint= 3&DR_ID=9405.
Kofman, Mila. Issue Brief: Group Purchasing Arrangements: Issues for States. State Coverage Initiatives, April 2003. Available at http://www.statecoverage.net/pdf/issuebrief403.pdf.
Maine Office of the Governor. Office of Health Policy and Finance. Proposals to “Reform” Insurance: Less Coverage at Higher Cost for Most Mainers. March 15, 2005. Available at http://www.maine.gov/governor/baldacci/healthpolicy/news/3_15_05.htm.
Maine Office of the Governor. Office of Health Policy and Finance. Dirigo Health has Successful First Year. Available at http://www.maine.gov/governor/baldacci/ healthpolicy/news/9_13_04.htm.
“MaineCare and the Federal Budget.” Maine Health News and Views. Portland, Maine, January 2005. Available at http://www.mainehealth.org/mh_about/newsviewsjan.pdf.
Mann, Cindy, Samantha Artiga, and Jocelyn Guyer. Assessing the Role of Recent Waivers in Providing New Coverage. Kaiser Commission on Medicaid and the Uninsured, Issue Paper, December 2003. Available at http://www.kff.org/medicaid/loader.cfm?url=/ commonspot/security/getfile.cfm&PageID=28336.
Maryland Health Care Commission. News Release. April 4, 2001. Available at http://www. dhmh.state.md.us/publ-rel/html/disclo~1.htm.
Maryland Health Services Cost Review Commission. About HSCRC. Available at http://www. hscrc.state.md.us/about_us/about_us.html.
Minnesota Comprehensive Health Association. Minnesota Comprehensive Health Association. Available at http://www.mchamn.com.
Minnesota Department of Human Services. Minnesota Health Care Programs. March 2005. Available at http://www.dhs.state.mn.us/main/groups/publications/documents/pub/ DHS_id_048802.pdf.

C-57
Minnesota House of Representatives. Fiscal Analysis Department, Health Care Access (HCAF) Transfer Issues. Issue Brief, revised June 9, 2004. Available at http://www.house.leg. state.mn.us/fiscal/files/ibhctxfr.PDF.
National Academy for State Health Policy. State Experience with Enrollment Caps in Separate SCHIP Programs. February 2004. Available at www.statecoverage.net/statereports/ multi30.pdf.
National Governor’s Association. Florida: NGA Summary, State Children’s Health Insurance Program. Available at http://www.nga.org/cda/files/FLSCHIP.pdf.
National Governor’s Association. Minnesota, NGA Summary, State Children’s Health Insurance Program. Available at http://www.nga.org/cda/files/MNSCHIP.pdf.
“Residents Can Enroll in State Health Plan.” York Weekly. February 9, 2005. Available at http://www.seacoastonline.com/news/yorkweekly/02092005/business/63728.htm.
Rosenthal, Jill, and Cynthia Pernice. Dirigo Health Reform Act: Addressing Health Care Costs, Quality, and Access in Maine. Portland, ME: National Academy for State Health Policy, June 2004.
Sacks, Heather, Todd Kutyla, and Sharon Silow-Carroll. Economic and Social Research Institute. Toward Comprehensive Health Coverage for All: Summaries of 20 State Planning Grants from the U.S. Health Resources and Services Administration. Commonwealth Fund, November 2002. Available at http://www.statecoverage.net/ statereports/ar3.pdf.
Schur, Claudia L., Marc L. Berk, and Jill M. Yegian. “Workers’ Perspectives on Mandated Employer Health Insurance.” Health Affairs. Web Exclusive, March 17, 2004. Available at http://content.healthaffairs.org/cgi/reprint/hlthaff.w4.128v1.pdf.
Scully, Thomas A. Centers for Medicare and Medicaid Services, Letter to Gwendolyn L. Harris, New Jersey Department of Human Services. January 31, 2003. Available at http://www.cms.hhs.gov/hifa/njstandardapprovlet.pdf.
State Coverage Initiatives. Assessing State Strategies for Health Coverage Expansion: Profiles of Arkansas, Michigan, New Mexico, New York, Utah, and Vermont. February 2003. Available at http://www.statecoverage.net/statereports/multi3.pdf.
State Coverage Initiatives. Health Cost Concerns Intensify in Little Rock. Summer 2003. Available at http://www.statecoverage.net/statereports/ar4.pdf.
State Coverage Initiatives. Medicaid HIPP. Available at http://www.statecoverage.net/ hipp.htm.
State Coverage Initiatives. Medicaid Section 1115 Waiver. Available at http://www. statecoverage.net/medicaid-1115.htm.
State Coverage Initiatives. Medicaid Section 1931 Waiver. Available at http://www. statecoverage.net/medicaid-1931.htm. April 17, 2005.
State Coverage Initiatives. Medicaid TMA. Available at http://www.statecoverage.net/tma.htm.

C-58
State Coverage Initiatives. Profiles in Coverage: Healthy New York. January 2005. Available at http://www.statecoverage.net/newyorkprofile.htm.
State Coverage Initiatives. SCHIP Employer Buy-In. Available at http://www.statecoverage. net/employer.htm.
State Coverage Initiatives. SCHIP Section 1115 Waiver. Available at http://www.statecoverage. net/schip-1115.htm.
State Coverage Initiatives. State of the States: Finding Alternate Routes. Academy Health, January 2005. Available at http://www.statecoverage.net/pdf/stateofstates2005.pdf.
State Coverage Initiatives. State-Only High Risk Pool. Available at http://www.statecoverage. net/highrisk.htm.
State Coverage Initiatives. State-Only Tax Incentives. Available at http://www.statecoverage. net/tax.htm.
Texas Department of Insurance. Biennial Report of the Texas Department of Insurance to the 79th Texas Legislature. December 2004, Section D, Issue 9. Available at http://www.tdi.state.tx.us/commish/reports/finalbie05.html#thrs.
Texas Department of Insurance. Listing of Coalition and Purchasing Cooperatives. March 23, 2005. Available at http://www.tdi.state.tx.us/company/lhcoop_lst_incl.html.
Texas Department of Insurance. Rules, Subchapter D, Health Group Cooperatives. Available at http://www.tdi.state.tx.us/commish/rules/0811AA-059.html.
Texas Department of Insurance. Texas Health Insurance Risk Pool Expansion Options. January 2005. Available at http://www.tdi.state.tx.us/general/pdf/lhlRiskPoolRept.pdf.
Texas Department of Insurance. Working Together for a Healthy Texas, Interim Report, State Planning Grant Project. September 2004. Available at http://www.tdi.state.tx.us/ general/PDF/spgint04.pdf.
Texas Health and Human Services Commission. A Consumer Guide to Better Healthcare: Your 2004 Road Map to Understanding the Health Care System in Texas. Available at http://www.hhsc.state.tx.us/chip/reports/ConsumerGuideEnglish.pdf.
Texas Health and Human Services Commission. Children’s Health Insurance Program. Available at http://www.hhsc.state.tx.us/chip/index.html.
Texas Health and Human Services Commission. CHIP Assets Test Policy: Summary of Final Rules. Available at http://www.hhsc.state.tx.us/chip/reports/042304_AssetTestPolicy Sum.html.
Texas Health and Human Services Commission. Texas Medicaid in Perspective, 5th ed. 2004. Available at http://www.hhsc.state.tx.us/medicaid/reports/PB5/PinkBookTOC.html.
Texas Legislative Budget Board. Fiscal Note for SB1839, Enrolled Version, 77th Legislative Session. May 26, 2001). Available at http://www.capitol.state.tx.us/cgi-bin/tlo/text frame.cmd?LEG=77&SESS=R&CHAMBER=S&BILLTYPE=B&BILLSUFFIX=01839&VERSION=5&TYPE=F.

C-59
Texas Health and Human Services Commission. “FY 05 Federal Alloc LAR.” Excel spreadsheet, January 2005.
The Bell Policy Center. “Ten Years of TABOR: A Study of Colorado’s Taxpayer’s Bill of Rights.” 2003.
The Commonwealth Fund. California: Health Insurance Act of 2003. Available at http://www.cmwf.org/tools/tools_show.htm?doc_id=235062.
The Council for Affordable Health Insurance. What Were these States Thinking? The Pitfalls of Guaranteed Issue. May 2002. Available at http://www.cagionline.org/cahidoc.pdf.
U.S. Census Bureau. Table 1: Annual Estimates of the Population for Counties of Texas: April 1, 2000 to July 1, 2004. Available at http://www.census.gov/popest/counties/tables/CO-EST2004-01-48.xls.
U.S. Census Bureau. U.S. Census 2000, Colorado QuickFacts. Available at http://quickfacts. census.gov/qfd/states/08000.html.
U.S. General Accounting Office. Private Health Insurance: Federal and State Requirements Affecting Coverage Offered by Small Businesses. Washington, D.C., September 2003.

Appendix D
Local Initiatives to Expand Care and Coverage of the Uninsured
Charles Begley, Alpna Agrawal, and Heather Draper

Appendix D
Local Initiatives to Expand Care and Coverage of the Uninsured
Prepared by Charles Begley, Alpna Agrawal and Heather Draper
Center for Health Services Research School of Public Health
The University of Texas Health Science Center – Houston
July 2005 I. Introduction Local health care safety nets help meet the health care needs of the large number of uninsured people that Medicaid, Medicare and other federal and state safety net programs do not reach. These populations primarily include lower-income working families, adults with and without children, and undocumented immigrants but they also include large numbers of low-income children and parents, pregnant women, and the disabled who are targeted by federal and state programs but for various reasons are not covered. Local governments, private providers and other partners have taken on the responsibility of creating local health safety nets by directly providing services or indirectly purchasing services or coverage in the private sector. With rising numbers of uninsured and no significant expansions in federal and state coverage programs, demand for local health care safety nets is growing, increasing the burden on local governments and communities.
Meeting the health care needs of the uninsured is an important public policy issue in Texas, both for public health reasons because of the consequences for individuals and communities of untreated diseases and for fiscal reasons, as health care providers are asked to absorb unpaid costs. Public responsibility to care for the low-income uninsured is delegated to Texas counties and minimal requirements for eligibility, service coverage, and public financing, were established by the Indigent Health Care and Treatment Act (IHCTA) passed in 1985 and amended in 1999.i To meet their obligation, counties choose to either create a hospital district, operate a public hospital or form a County Indigent Health Care Program (CIHCP).
The legal requirements for safety net care are not well-monitored or enforced and are
set well below the need.ii Many counties do more than their legal requirement and rely heavily on partnerships with hospitals fulfilling mandatory benefit obligations, to more adequately address the need. Other counties provide the minimum leading to uneven access for the uninsured and unevenness in the burden on local taxpayers. Local safety net systems differ by the extent to which they rely on publicly provided services to meet their obligations to the uninsured or to public financing of privately provided services. They also differ in the reliability and sources of funding available to support safety net services and the strength of their commitment to provide a high standard of care.
To cope with the increasing burden to provide or pay for expensive health services for
the uninsured, local governments and communities around the country and in Texas are pursuing a variety of resourceful and innovative strategies. Many communities are finding ways to expand access by enrolling uninsured individuals and families into organized health plans

D-2
with more coordinated services that promote preventive care and reduce inappropriate utilization of emergency and inpatient services. Others are concentrating more on extending coverage to gap populations by working with various partners to expand the availability of and/or directly provide low-cost insurance products for the uninsured. The purpose of this paper is to review local initiatives to determine what approaches are being used to effectively expand the safety net and/or reduce the number of uninsured, with the goal of identifying successful models for replication in other communities and to inform state and local policymakers. II. Profiles of Local Models for Expanding Access
One major strategy being followed involves expanding safety net care by developing better-organized and coordinated systems of comprehensive care. This strategy has important features designed to provide enrollees with a medical home, offer some form of case management that enhances early detection of problems and promotes appropriate treatment, produce patient information that can be shared among providers working within the system, give providers some incentives to serve low-income patients, and promote the dignity of enrollees. Selected models illustrating this strategy are profiled in Section IIa below. Their features are summarized in Table 1 at the end of the paper.
A second common strategy is to develop low-cost insurance products that extend public and private coverage to larger portions of the population. This can be accomplished by developing and offering private plans to small businesses and individuals; mandating small business coverage; or developing cooperatives that allow small employers to join larger employers. With this strategy, some of the issues that must be addressed include financing, marketing, benefit design, target population, provider choice, program duration and transition populations of individuals between jobs. Models of this strategy are profiled below in Section IIb, and summarized in Table 2 at the end of the paper.
IIa. Models for Expanding Care General Assistance Medical Program Milwaukee County (Milwaukee, Wisconsin) Start Date: 1998 Overview
Milwaukee County created a program to shift care from a primary public hospital to private primary care clinics. The program formed a provider network, such that each primary clinic is affiliated with a hospital, specialty provider and pharmacy. The county shifted from being a provider to purchasing care from private providers, and developed an integrated patient record system with primary care assignment. As a result the county was able to provide a more continuous care system over a larger area.

D-3
The GAMP program was created after the 1995 closure of Doyne Hospita -- the county’s public hospital -l- in an effort to redirect the indigent and uninsured population2. Froedert Memorial Lutheran Hospital agreed to provide care to uninsured and indigent patients for $60 million a year for two years.iii During these two years, Froedert developed a pilot program with five community-based primary care clinics that would bill for services provided to a limited number of GAMP clients. By April 1997 a total of 2,100 GAMP patients were in the pilot program and at this time the county voted to expand enrollment in the program and to include Medical College of Wisconsin clinics in the purchasing model. The program went county-wide in July 1997 adding other hospitals besides Froedert as preferred providers and several FQHCs and other local clinics began serving as gate-keepers and primary care providers.iv
Currently, Milwaukee County purchases health care services for all of its uninsured low-
income population through the GAMP. The program places the uninsured into a provider network that includes 15 community clinics, 10 local hospitals, 240 specialty providers and approximately 25 pharmacies. In total there are about 30 sites which include an array of federally qualified health centers (FQHCs), FQHC look-alikes, private practices, community health agencies and community hospitals. GAMP covers primary care, specialty care, inpatient hospitalization, pharmaceuticals, diagnostics and laboratory services. Mental health, routine dental services and substance abuse treatment are not covered. Emergency dental extractions are covered.
Each clinic must have an affiliation with at least one hospital, specialty provider and pharmacy. The program includes integrated patient record-sharing among all network providers and standardized eligibility screening for the GAMP and other public assistance programs.
GAMP participants enroll when a medical need arises. They select a participating clinic in which to receive services. The chosen clinic is then required to meet the participant’s primary medical needs and coordinate all specialty services. When specialty care is needed that is not offered by the clinic, it is up to the clinic to obtain a provider in the GAMP network to provide the needed service. Eligibility
GAMP serves adult county residents who are not eligible for other public programs (Medicaid, BadgerCare, W-2), have incomes up to 125% FPL, depending on family size, and have a medical need. The majority of the participants are adults aged 22 to 65 years. Residency is established after 60 days of living in Milwaukee County.
In 2003 a total of 24,000 participants were enrolled in the program with 10,000-12,000 enrolled at one time. There is an estimated population of 80,000 indigents who may need GAMP services.
2 Doyne hospital was closed and was privatized for several reasons only after state legislative approval to do so. A nearby non-profit hospital, Froedert Memorial Lutheran Hospital, was opened in 1980 and consequentially the two hospitals shared medical school staff and services which compromised Doyne’s revenue. In 1995 state funding towards the General Assistance funds was capped and reduced thus creating a significant financial deficit. Finally, some of the Doyne facilities were considered obsolete and the hospital generally provided higher cost specialty services which created one of the highest cost per person in the state. These were all factors surrounding the closing of Milwaukee county’s public hospital in 1995.(Norton & Lipson, Portraits of the safety net: The market, policy environment, and safety net response. Assessing the New Federalism: Occasional Paper Number 19; Nov 1998 (pp. 31-32)).

D-4
Financing
Sources of revenue include a county property tax levy and state funding from the Relief Block Grant Program (RBGP) and intergovernmental transfer (IGT). The RBGP funding originated from legislation enacted in 1996 to convert the state’s mandatory general relief program into a block grant program to counties.v The legislation allowed Milwaukee County to shift from being a provider of health care to becoming a purchaser of health care. The block grant program is capped at $16.6 million and consists of federal Medicaid DSH funds and general revenue funds allocated to the county. Each year the county applies for the block grant which the county matches with at least $20 million, $13 million in county tax revenues and $7 million from the IGT. The GAMP budget was $38.4 million in 2003. Cost Sharingvi
There is a $20 copayment for emergency room visits, $1 copayment for generic prescriptions, and $3 copayment for brand name drugs on the formulary. Also, there is a $35 application fee for each six- month enrollment period which is waived for homeless individuals.
GAMP reimburses clinics on a fee for service basis at Medicaid rates. Hospitals are reimbursed at 80 percent of their costs. If the total cost of the program exceeds the program budget, providers are responsible for the additional costs. Administration
The Milwaukee County Division of County Health Programs, Office of Related Health Programs administers the GAMP. Health Advantagevii,viii Marion County (Indianapolis, Indiana) Start Date: 1997 Overview
Faced with the loss of a contracted private safety net provider, Marion County chose to restructure their care system by acquiring community clinics, and securing a contract with a physicians group for staff. A managed care program was created, with a designated set of benefits, a network of providers, and each primary care provider responsible for referrals. Providers are reimbursed through capitation and other performance-based methods.
Historically, Wishard Memorial Hospital was the primary safety net provider for Marion County through a contract with the Health and Hospital Corporation of Marion County (HHC). In 1990s, The University Hospital, which also had a role in providing indigent health care, merged with Methodist Hospital of Indiana and reduced its commitment to indigent care. The task force responsible for the merger also created the Indiana University Medical Group (IUMG), a physician group sponsored by the Indianapolis medical school. Concerned about meeting its indigent care obligations, the HHC worked with Wishard Hospital to expand its health care safety net by taking over several community clinics of the Marion County Health Department.

D-5
HHC also developed a contract with the IUMG to staff Wishard Hospital and its primary care clinics.
Wishard Advantage was created in the late 1990s to increase coordination between primary and specialty care in the Wishard Hospital system. It is a managed care medical assistance program for low-income, uninsured residents operated by the HHC. The provider network is comprised of the IUMG, the Wishard Hospital, and its seven primary care clinics. The medical assistance program offers a comprehensive benefits package including primary and preventative care, inpatient and specialty care, prescription drugs, laboratory services and mental health services. Vision and dental services are limited but dental check ups, vision screening and discounted eyeglasses are included.
At enrollment, patients select their primary care physician from a list of providers in the network. Although there is no official gate keeper, the chosen physician is responsible for offering primary and preventive care, and for specialist referral and hospital admission. The health clinics contain pharmacies and other social services, and are available during daytime hours. There is one after-hours clinic next to the hospital and a 24-hour consultation hotline.
The primary care physicians receive capitated payments per member per month covering primary care, specialty and inpatient referrals. Specialty care funding is pooled through the dean of the medical school, who distributes these funds to specialists based on a relative value unit (RVU) payment schedule. The HHC provides payments for inpatient services on a fee-for-service basis and also provides prescriptions free of charge to patients via the clinic pharmacies. Eligibility
All uninsured Marion County residents with incomes at or below 200% FPL are eligible. Participants must not be eligible for other public programs including Medicaid or SCHIP. Financing
Wishard Advantage is financed through city and county property tax levies as well as federal DSH matching funds at amounts of $56 million and $20 million, respectively. The HHC has the authority to levy taxes at its own rate but has to seek state legislative authority. The HHC tax levy generates a total of $70 million with $56 million going towards Wishard Advantage and the rest for Marion County Health Department and the HHC staff. The property tax levy rate of 79.1 cents per $100 property valuation has remained the same since 1992. Medicaid DSH payments also contribute a significant percentage of the hospital budget. Cost Sharing
There is no charge for services to enrollees with incomes less than 150% FPL. Participants with incomes between 150%-200% FPL are required to pay a $5 copayment on office visits and 20-60% of the cost of other care based on income. Providers bill patients for services and there is no cap on out-of-pocket payments.

D-6
Administration
The Health and Hospital Corporation (HHC) of Marion County is a municipal (non-profit) corporation that operates Wishard Advantage and the Marion County Health Department. The HHC is governed by a seven-member board consisting of members appointed to four-year terms. Three of the members are appointed by the Mayor of Indianapolis, two are appointed by the County-City Council, and another two are appointed by the County Commissioners. Funding for the HHC comes from local property tax dollars and HHC has legal responsibility to provide health care to all who become ill or injured within Marion County. Carelinkix,x Bexar County (San Antonio, Texas) Start Date: 1997 Overview
Carelink utilizes the maximum family liability concept (MLC), or the amount a family can be expected to contribute based on their income, to help offset the costs of a designated set of benefits that it offers to the uninsured in Bexar County. The program uses a provider network that includes medical school and private practice physicians, pays providers on a fee-for-service basis, and collects payments from the family over an extended period of time. An integrated patient record system has also been developed allowing for a system-wide quality assurance program.
Carelink is the Bexar County Hospital District’s (now called University Health Service) indigent care program, and can best be described as a financial assistance plan with managed care features. Carelink began in 1993 as CostShare when UHS officials introduced the concept of maximum family liability (MFL)3, which was an amount used to determine a monthly repayment schedule for services received. The plan is administered by the UHS with a provider network that consists of one hospital, six ambulatory centers, five Federally Qualified Health Centers (FQHCs), and one private physician. The plan purchases health care for enrolled participants who use the UHS network. The hospital and physicians are reimbursed on a fee-for-service basis. Families with incomes below 200% of the FPL who reside in Bexar County are eligible and make monthly membership payments and service co-payments based on their income level. Benefits include primary and specialty physician services, hospital care, prescription drugs and mental health services. Another potentially valuable service is a 24-hour nurse-staffed hotline that serves to help refer patients appropriately, help make doctor appointments and deter misuse of the emergency room.
All low-income uninsured families in the county are encouraged to enroll. At enrollment, families select a primary care provider and clinic site as their usual source of care and must seek all their care through that provider. Non-Carelink patients receive services but may be asked to pay, in advance, for primary and preventive care.
3 Maximum Family Liability (MFL) = (11%) * (annual family income) * (FPL index).

D-7
Eligibility
The target population equals about 300,000 uninsured in the county at or below 200% of the FPL. In addition to the income requirement, eligible families must be current residents with the intent to live in Bexar County. Families apply for enrollment at the main CareLink office or at one of the seven ambulatory centers or FQHC sites.
If a family member is determined to be potentially eligible for Medicaid or CHIP, a 60-day enrollment period into CareLink is allowed during which the individual must apply to the Medicaid and/or CHIP program. If the family member is eligible for the other public assistance program and fails to apply, the entire family may be disenrolled from Carelink. Family members will be billed full charges and regular collection methods will be utilized.
Financing
A county hospital district tax levy, equaling 25 cents per $100 valuation, is the primary funding source. Medicaid DSH funds are also used to help fill the funding gap in health care delivery. The annual budget/revenue is currently about $95 million. Annual collections from enrollees is around $11 million. Co-payment
There is no cost for those with incomes at or below 75% of the FPL while those with income above 75% of the FPL make monthly payments and service co-payments based on family size and income. A formula was developed to determine the patient’s Maximum Family Liability (MFL). This value is used then to determine monthly payments over a 48-month period for services rendered. A family’s MFL for the four years is calculated at the time of enrollment and is re-evaluated annually. Members of CareLink only pay after health care services are rendered and a charge incurred. Administration
CareLink is governed by the UHS. University Hospital System has a contract with the University of Texas Medical School in San Antonio to provide physicians to UHS’s facilities. It also has contracts with Community Medical Associates for hospital staff as well as the FQHCs. Denver Healthxi,xii Denver County Denver, Colorado Start Date: 1997 Overview
Denver County created a hospital authority that is independent from other city government and links public hospitals, FQHCs, schools, clinics and the health department into a unified safety net system. The program also offers insurance products for public employees and small businesses, and utilizes a patient payment plan based on an income and assets rating system.

D-8
Until 1993, Denver Health (DH) was a component of city government. At that time, a mayor-appointed panel consisting of community and business leaders met to determine new organizational structures for DH: a not-for-profit corporation, a public benefit corporation, a hospital district, or a hospital authority. The hospital authority structure was recommended in order to enable DH to exist as a more independent public entity. In 1994, Denver Health officially became a hospital authority with the intent to ensure the delivery of health care to the indigent and uninsured. In 1997, the Denver Health and Hospital Authority became an independent entity governed by a nine-member board appointed by the mayor and confirmed by the council. Another board that exists to govern the Neighborhood Health Program has 13-members board, of which 51% are DH patients in order to maintain federal funding.
DH is a vertically and horizontally integrated health care system for indigent and
uninsured populations in Denver. The system is centrally organized and consists of an acute care hospital, an ambulatory center, 11 FQHCs, 13 school-based clinics and the local public health department. There is an integrated system-wide eligibility and referral system to help guide patients to the appropriate health care services including public health, primary, specialty and inpatient services. The system offers several different health care products. Colorado Access is a managed care product in which DH partners with several private providers in an effort to maintain revenue from Medicaid patients. The Denver Health Medical Plan (DHMP) is marketed to public employees and employees of small businesses. The DHMP also serves the CHIP population. DH also offers a program of inpatient and outpatient services to the prisoners located in federal and state correctional facilities in the Denver area. It provides a 911 emergency response service, a locked forensics unit, a women’s care clinic, a 100-bed nonmedical detoxification unit with nonambulance transport service, and the regional poison control center. Eligibility
Potential enrollees must meet residency, income and asset standards. Income must not exceed 185% of the FPL. After eligibility is determined, the participant is assigned to a payment rate category based on their income and assets. Financing DH relies on a variety of funding sources for its programs but the primary source is the County Indigent Care Program (CICP). The CICP is a state program that reimburses participating providers for a portion of the costs of treating eligible individuals. The participating providers must follow state-established limits for acceptable amounts to charge the eligible individuals. Thus the program aims to help reduce provider costs when administering care without compensation while also limiting the amount the low-income patient is required to pay for their care.
For the fiscal year 2003-2004, the Colorado State General Assembly set aside $255,976,646 to reimburse the CICP providers. Three sources of funding for the program are federal funds ($128,000,000), cash funds exempt ($115,400,000), and the General fund ($12,576,646). Cash funds exempt refers to the DSH and Medicare Upper Payment Limit funding. The CICP reimbursement to providers is based on previous year’s write-off costs which are inflated for the upcoming year. For the fiscal year 2003-2004, the DH reimbursement from CICP was $64,704,089 and $38,037,301, respectively.

D-9
Cost Sharing
Patients are required to make co-payments for inpatient facility and physician services, outpatient physician services and prescription drugs. The co-payments vary by income category and there is an annual cap on co-payments of $120 per year for the lowest income category (families below 37% of FPL). Administration
Denver Health is governed by a nine-member board that is appointed by the mayor and is also city/county council approved. To help protect the board from political pressures, members can only be removed by a confirming vote of the council. A chief executive officer is appointed by the nine-member governing board. DH has the authority to issue debt. Hillsborough County HealthCare Planxiii,xiv,xv,xvi Hillsborough County, Florida Start Date: 1992
Hillsborough County pursued legislation to create funding to purchase a managed care plan for the uninsured. The managed care plan offers four benefit packages to different types of eligible individuals. Participating providers are reimbursed on a fee-for-service basis at a percentage of Medicare payments.
In the late 1980s, volunteer professionals met to discuss the problems of the main public hospital, Tampa General, and the safety net in Hillsborough County. They concluded that a health advisory board should be created to give recommendations to the County Commissioners of Hillsborough County. Around the same time, a group of health care experts envisioned a managed care plan to deliver health care to the uninsured and indigent. The intent was to save money by decreasing inappropriate emergency room care and increasing primary and preventative health care services through the managed care model. An attempt was made by the County Commissioners, the local medical society, the recently created health advisory board, and several business and community leaders to lobby the state legislature to allow the adoption of a sales tax for the purpose of financing the managed care plan. The new tax legislation did not receive enough support and the proposal was rejected. In 1991, the County forces united again and the state approved legislation which permitted counties with a population of 800,000 or more to tax up to one half of one percent of its infrastructure sales tax towards uninsured and indigent health care.4 With the revenues from this tax the Hillborough County HealthCare Plan (HCHCP) was created.
The HCHCP offers staff model managed care provider networks to uninsured and
indigent residents with incomes up to 100% of the FPL. The plan divides the county into four zones and contracts with one preferred provider network in each zone using a competitive bidding process. In 1999, the Board of County Commissioners gave permission to the HCHCP to negotiate with current providers rather than undergo a competitive bidding process. Four
4 Section 212.055, Florida Statutes. From the state approval, the Hillsborough Board of County Commissioners enacted Ordinance 91-19, allowing a half-cent sales tax. The $26.8 million per year on property taxation mandated by the State legislature would continue in addition to the new taxing scheme.

D-10
different benefit plans are offered.5 Plan A covers all services that the plan offers to individuals while Plan B is for Medicare recipients and covers medical services and supplies not covered by Medicare. Plan C is also designed for Medicare recipients and covers deductible and co-payments for inpatient facility costs and home health care costs not covered by Medicare. Finally, Plan D offers benefits that are defined to meet the special health care needs of individual members. Several limitations and exclusions exist in the services provided by each plan.6 Also, certain outpatient and inpatient services require patients to obtain authorization from their primary care provider.
Physicians are paid on a FFS scale. Specialty care physicians receive between 80-85%
of Medicare reimbursement depending on the network zone. Outpatient hospital surgery physicians are either paid 20% of the bill up to a cap ranging from $700 to $1,250 depending on the surgery and the network zone. Physicians providing inpatient care are reimbursed at the Medicare DRG rate.
Eligibility
To be eligible for HCHCP, an individual must be a Hillsborough County resident, have no other form of health insurance coverage, and have an annual income at or below 100% FPL. One can be eligible for the program if medical expenses would result in an income equating to the poverty level.7 Enrollment usually occurs via a medical provider or social worker when medical care is sought. The county social workers are located at each hospital and the primary care sites of each network and play a significant role in assisting in the enrollment process and in providing case management services. Financing
A .5 cents local sales tax and property tax are used to finance HCHCP. In 2004, the HCHCP received about $94 million in revenue from the sales tax, general fund and other revenues, respectively. The projected sales tax revenue in 2005 is estimated to total $94.7 million. Cost Sharing
Participants in Plan A are required to make co-payments for pharmaceuticals ($1 for generic and $5 for brand name) regardless of income threshold. Those in the Medical Crisis Intervention program also make co-payments of $5 for services. 5 Participants had eleven insurance health care plans to choose from before October, 1999. After this date only five plans were available. Currently only four plans are administered by the HCHCP plus the Medical Crisis Intervention plan. Services like eyeglass coverage, hearing, and dental services are being cut due to financial contraints. 6 For further information about the exclusions and limitations, Adrulis and Gusmano give a clear list of exclusions and limitations under the HCHCP. 7 Previously individuals could enroll in the HCHCP or the Medical Crisis Intervention procedure with an income threshold of up to 400% FPL. Cost share existed for those individuals higher than the 100% FPL. Financial constraints have led the HCHCP to only include individuals at the 150% FPL or 100% FPL for the Medical Crisis Intervention and HCHCP, respectively.

D-11
Administration
The County’s Department of Health and Social Services is responsible for operating the HCHCP. The Board of County Commissioners determines the policy of the HCHCP while the 15-member Health Care Advisory Board makes recommendations to the commissioners regarding issues of fund allocation, coordination, planning and monitoring of the health care delivery system. PlusCarexvii Wayne County Detroit, Michigan Start Date: 1992 Overview
Wayne County purchases health care services for the uninsured from local managed
care plans and uses several federal/state/local match arrangements for funding. Enrollment in PlusCare may occur through an outreach worker placed in hospitals, the public health department and in other community health agencies. Potential participants may also enroll upon receiving health care services at emergency rooms, safety net providers or the public health department. Once enrolled, each patient is enrolled in one of four health plans and one dental care plan. The services covered include primary and preventative care, inpatient care, outpatient care, dental services, pharmacy services, emergency care, ambulance services, immunizations, family planning, laboratory services, radiology services and physical therapy. There are coverage limits on these services due to budget restrictions. Patients needing mental health and substance abuse treatment are referred to the Detroit-Wayne County area Substance Abuse Treatment Programs that are administered by the Detroit-Wayne County Community Mental Health Agency. Eligibility
Adults residing in Wayne County between the ages of 19 and 64, not eligible for any other type of medical coverage are eligible for PlusCare. The income threshold is $250 per month but family size is taken into consideration as PlusCare eligibility is determined on an individual basis. A $90 standard work expense is omitted from the monthly net income and neither child support nor Social Security payments are considered as income. Enrollment lasts for one year.
Financing
The primary source of funding is federal/state/local match funds generated through an upper payment limit (UPL) and other arrangements. Wayne County and the state contribute to an indigent health care fund. An intergovernmental transfer from Wayne County is used to designate the indigent health pool for federal matching funds. These funds are distributed to qualified hospitals in the county based on each of their estimated Medicaid outpatient payments. A total of seven hospitals qualify to receive these funds. Providers in the health care networks are reimbursed on a capitated per member per month basis. The dental provider is also reimbursed in this manner, however the payments are based on the total number of patients served each month.

D-12
Cost Sharing
Patient cost-sharing is limited to pharmacy co-payments. Administration
PlusCare is managed by the PCMS. Project Accessxviii,xix,8 Buncombe County, North Carolina Start Date: 1995 Overview
Project Access is a collaborative initiative administered by the Buncombe County Medical Society (BCMS), connecting existing public and philanthropic primary care centers with private practice physician volunteers. Providers volunteer specialty and chronic health care services to patients below 200% of FPL. The flow of patients from primary to specialty care services is additionally supported by pharmacists providing pharmaceuticals at cost, hospitals providing free inpatient and outpatient services, and allocation of county indigent care funds to provide medications for patients and ongoing operating support to sustain the initiative.
Project Access began with the support of a Robert Wood Johnson Foundation planning
grant provided from 1994 to 1998. Community partners in Project Access include BCMS, Buncombe County Health Department, local volunteer clinics, area hospitals, the area health education center, local pharmacists and the county human/social services. Physicians donate their services to Project Access by pledging to see 10 enrolled patients per year (20 patients if they are medical specialists). Most physicians (80%) in private practice in the area have committed to the program. Physicians see Project Access patients at their practices or volunteer at a clinic. Physicians can limit their participation and/or withdraw at any time. Area hospitals provide all needed ancillary services free of charge, and the county contributes to the cost of prescribed drugs.
Project Access operates in six safety net clinics in the community including the county’s
health department clinic, a federally qualified health center and an urgent care center. Eligibility services are provided at all sites and enrollees are centrally managed at BCMS’ office. BCMS is "headquarters" for the program and does provider recruitment, promotion and communication. Since Project Access’ inception, primary care sites have been able to serve more primary care patients without increasing costs because patient care has been coordinated and continuous. For example since patients are able to readily access needed specialty care, appointments previously consumed seeing patients repeatedly for unresolved specialty care needs are now available for new patients and for proper management of existing patients' chronic primary care conditions.
8 Personal Communications with Alan McKenzie and Kristen Neel, Buncombe County Medical Society, May 2005

D-13
Eligibility
Patient eligibility and enrollment is performed within the primary care clinics where the County Department of Social Services has out-posted its Medicaid and CHIP eligibility and enrollment staff. Eligible patients are residents of Buncombe County, ineligible for federal programs, and below 200% of FPL. The program staff matches qualifying patients needing specialty physician care or chronic primary care with volunteer physicians through an online database linking county care clinics to a central server at the Buncombe County Medical Society. For its recordkeeping, the Buncombe County Medical Society keeps online clinical and demographic records gathered via patient enrollments, physicians' no-charge invoicing and hospital service reports. Patients sign responsibility agreements and use "Access" cards for visiting physician offices and for prescriptions obtained through pharmacies at cost.
In 2004, 27,000 Buncombe County residents were eligible for Project Access. Project
Access served 26,000 of these residents and 3,000 of the 26,000 were provided with advanced primary care services and/or specialty care services. Financing
Pharmacists provide pharmaceuticals at cost; patients pay a $4 co-pay, and county
funds managed by the Medical Society are used to pay the difference. All lab tests, inpatient and outpatient services are donated by the hospitals. Referrals and appointments for specialists are made through "on-line, real time" connections with the CARES system at each primary care site based upon availability of physician appointment slots. The community clinics pay the local match (5%) to pull-down state and federal funds which then pay for out-stationed eligibility and enrollment workers. Each year, over $3.5 million in services are donated by private practicing physicians and other healthcare providers at no charge to low-income, uninsured patients. Cost-Sharing
Health care services are provided free to enrollees. Indigent Care Collaborationxx,xxi,xxii,xxiii,9 Austin, Texas Start Date: 1992 Overview
Safety net providers in three counties came together to form the Indigent Care Collaboration (ICC) in Austin, Texas in order to promote coordinated implementation of local initiatives to better serve the indigent population of Central Texas. ICC’s members include the local public health department, ambulatory medical center, FQHCs, and major hospitals. ICC functions to help providers in developing tools and initiatives that make service delivery among providers more efficient and cost effective including its integrated patient record system (I-Care) and eligibility system (Medcaider). The I-Care system creates an electronic medical record for a patient that is then accessible at any ICC member facility, but it tracks patient utilization of health care services across the ICC system and facilitates the development of disease 9 Personal Communications with Sandy Coe Simmons, Indigent Care Collaboration, April 2005

D-14
management programs. I-Care promotes continuity of care, provides better management of pharmaceuticals, provides access to a wider range of therapeutic ancillaries and increases physician efficiency. The Medicaider online eligibility tool is used to determine uninsured patients’ eligibility for a variety of assistance programs available at the federal, state and local levels. Medicaider helps providers identify third party reimbursement sources and thereby obtain previously uncaptured revenue.
In addition to I-Care and Medicaider, a number of other initiatives have taken place within ICC to improve health care delivery to the uninsured. ICC formed a purchasing group to negotiate pharmacy discounts for all its members, while maximizing participation in the 340B discount program. ICC replicated Project Access in Buncombe County, North Carolina by working with the local medical society to recruit physicians to volunteer primary and specialty care services to the uninsured. ICC developed a disease management online tool in conjunction with agreed-upon protocols to manage chronic disease and to improve patient outcomes. Finally, ICC has carried out two studies related to the safety net health care system in the region – a Primary Care Use and Capacity Study for Travis County and a Regional ED Use Study. The studies provide an overall picture of the demands placed on the safety net care system in the region.
Eligibility There are no eligibility criteria for the ICC system as there is no ICC program. Rather there are a variety of financial assistance programs that patients may be eligible for when they visit one of ICC’s members. Patients may be eligible for federal programs, state programs or local charitable programs. Some of the state and local charitable programs include the City/County Medical Assistance Program (MAP), Seton Care Plus and Project Access. To determine patients’ eligibility for a given program, ICC has developed an automated, on-line screening tool known as Medicaider. With Medicaider, members are able to find potential payment sources for uninsured patients. First, Medicaider determines whether patients are eligible for federal programs such as Medicaid and CHIP. In addition, Medicaider screens for Title V, Title X, and Title XX programs, the state Primary Health Care Program, the City/County MAP program, Seton Care Plus and Project Access. If a patient is not eligible for any of these programs, ICC members will see any patient on a sliding fee scale basis. The sliding fee scale and fee schedule varies from member to member.
For the City/County MAP program, patients at or below 150% of FPL, not eligible for other programs, and residents of Travis County are eligible. Similarly, Project Access serves uninsured residents in Travis County with incomes at or below 150% of FPL. The Seton Care Plus program at the Seton Community Clinics serves patients up to 250% of FPL who are not eligible for other programs.
Financing ICC cites the following four grants and awards as significantly contributing to the development of its collaborative:
1. A Robert Wood Johnson Foundation Communities in Charge grant of $700,000 that supported general system development from 2000-2003.

D-15
2. A HRSA CAP/HCAP grant of nearly $2 million that supported the development of I-Care and Medicaider programs from 2000-2003.
3. A grant from Ascension Health of $900,000 that matched the first HRSA HCAP grant. 4. A second HRSA HCAP grant of $2 million to support pharmacy initiatives from 2003-
2006.
Travis County and the City of Austin primarily finance indigent health care in Central Texas. In FY 2002, the City of Austin budgeted $45 million and Travis County budgeted $6.3 million for indigent health care. The following diagram shows the flow of funds from the City of Austin and Travis County to support indigent health care in Travis County. Cost Sharing There are no cost sharing arrangements for the ICC system as it varies by program. Administration
At its inception, ICC was organized as a Texas Uniform Unincorporated Nonprofit Association (TUUNA) and created a regional Health Financing District. These two formal structures facilitated ICC’s ability to coordinate activities among its member groups and draw long-term funding for its initiatives. The TUUNA structure enabled ICC to create a more formal structure for itself in order to implement and monitor its efforts. In addition, the TUUNA permitted ICC to participate in the Robert Wood Johnson Foundation (RWJ) Communities in Charge grant project. The creation of the health financing district permitted ICC to attract funds and finance initiatives it planned to develop in the areas of primary care, mental health, ER/trauma, specialty services and general infrastructure. At present, ICC has an executive director, research and administrative staffs, a board consisting of its members, and an advisory board. Healthcare Options (formerly known as Primary Care Plan) xxiv,10 El Paso, Texas Start Date: 1999 Overview
Healthcare Options (HCO) is a managed care program that links primary and specialty care services for low-income, uninsured residents of El Paso County and was modeled after the Hillsborough program. HCO was originally known as the Primary Care Plan (PCP) and was developed by a collaborative of safety net organizations in El Paso. The program is administered by the El Paso First Health Network (EPFHN) which also serves the Medicaid and SCHIP populations and is owned by the El Paso County Hospital District.
Initially, coverage in HCO included outpatient primary and preventive care, laboratories,
X-rays and limited in-network specialty care services. Pharmaceutical coverage was provided through the indigent pharmacy plan for Thomason Hospital. Hospital care was not officially covered by HCO, but enrollees qualified for charity care at Thomason Hospital. Once HCO was integrated into the Hospital District in 2003, covered services were extended (particularly for specialty care, inpatient hospital and other ancillary services) to match those provided through 10 Personal Communications with Bill Schlesinger, Project Vida, April 2005

D-16
the county indigent care plan. Benefits extended to HCO enrollees included: case management services, more diagnostic tests, emergency room services, gynecological services, immunizations, prenatal care and well patient annual exams. Dental care and mental health services are not covered benefits. The provider network includes two federally qualified health centers, Thomason hospital outpatient clinics and some private physicians. Eligibility
HCO enrollment no longer takes place at community health centers since it reached 7,000 enrollees in 2004. Additional patients are only referred to HCO by Thomason Hospital’s ER department. Eligible enrollees are adults over the age of 19 with incomes below 100% of FPL, residents of El Paso County, and ineligible for other publicly supported programs.
HCO enrollees select a primary care provider, nurse practitioner or primary care clinic
from the EPFHN to serve as their medical home. Case management services are offered to enrollees with special health care needs. Financing
Through its initial grant from the W.K. Kellogg Foundation, HCO was able to develop its infrastructure, staffing and daily office operations. At present, the program is administered by the hospital district which assumes full responsibility of its financing. The Hospital District’s annual budget for primary care reimbursement is $850,000. Reimbursement rates to providers under HCO equal Medicaid fee-for-service reimbursement rates plus 5 percent. Cost Sharing For HCO enrollees there is a $10 co-pay for physician office visits. The remaining cost of care is subsidized by the hospital district. IIb. Models for Expanding Coverage Chamber Choicexxv,11 Kansas City, MO Overview In 1994, the Greater Kansas City Chamber of Commerce began marketing Chamber Choice for small and low-wage businesses in the area. Chamber Choice is a non-subsidized plan that offers a rate cap of two years to enrollees. Chamber Choice was a revised version of an existent small group plan already offered by BCBS of Kansas City. Chamber Choice and BCBS of Kansas City’s existing small group plan only differed in that the small group plan at the time was not open to businesses with 50 employees or less, did not offer any kind of rate stability, and was not marketed aggressively. However upon receiving the Chamber’s endorsement of Chamber Choice, BCBS of Kansas City simply expanded administration and staffing of its existent small group plan to Chamber Choice. 11 Personal communications with Jeff Nelson, BCBS of Kansas City, November 2004

D-17
Since Chamber Choice’s launch, 11 additional local chambers of commerce have joined the Greater Kansas City Chamber of Commerce to endorse Chamber Choice. And Chamber Choice has expanded its eligibility criteria to small businesses with up to 50 employees. The actual enrollment in Chamber Choice is 80,000 members as of 2004. Eligibility Small businesses with up to 50 employees located in Kansas City, which includes Jackson, Clay, Platte, and Cass counties in Missouri and Johnson and Wyandottte in Kansas are eligible for Chamber Choice. Rather than establishing a target enrollment for the program, BCBS of Kansas City set a target growth rate of 15% per year. The actual enrollment in Chamber Choice is 80,000 members as of 2004. Approximately 30% to 35% of businesses were not offering health insurance prior to joining Chamber Choice (2001). Four out of ten employees were uninsured prior to enrollment (2001). The retention rate is 82% to 86% per year. Staffing of Chamber Choice is the same as the staff for other BCBS of Kansas City products. Benefits and Services Chamber Choice offers comprehensive services and a flexible benefit design. Employers choose among five different plan arrays that range from limited to comprehensive benefits. Each array consists of a PPO, a traditional HMO and an open network HMO product. Employees then choose one of the three products within the array. The basic plan benefits include: physician visits at $15 to $25 per visit; inpatient and outpatient hospital procedures; hospital stay at $100 to $500; a $5/$20/$40 to $10/$30/$50 three-tiered prescription drug plan; life insurance; dental benefits; and accidental death and dismemberment benefits. Chamber Choice also provides rate stability for two years to enrollees. Financing Chamber Choice is financed by member cost-sharing and premiums identical to conventional commercial insurance products. Co-payments range from $15 to $500 depending on the plan. Monthly premiums are group and member specific with average premiums of $125 for healthier, lower-risk groups and $208 for extremely high-risk groups. The average premium per member per month is $166.56. The average price of Chamber Choice is generally lower than other commercial products offered by competitors (except for those in the high-risk groups). Approximately 87% to 88% of the total overall cost of the product is used for health benefits, 12% to 13% for administration, and 0.5% for profit. The profit margins for other BCBS of Kansas City products are four to six times greater than for Chamber Choice. (2001 numbers cited) Marketing BCBS of Kansas City’s multifaceted marketing approach includes print, radio and television ads as well as direct mail to very small employers. All materials illustrate the local Chamber of Commerce’s endorsement. A broker community of around 1,000 brokers recruits 96% of the members through direct contact with Chamber businesses. Marketing is integrated with the Chamber of Commerce’s resources as well. Chamber Choice is marketed on the Internet through the BCBS of Kansas City and Chamber websites. Employers may obtain information by calling the Chamber’s or BCBS of Kansas City’s toll-free numbers.

D-18
Firstplanxxvi,12 Moore County, Michigan Overview
FirstPlan is a private, partially subsidized, small group coverage product with choice of
open or closed network. Premiums are based on a shared contribution among employers, employees and health care providers. Unlike the “3-share model” seen in Muskegon County and other communities, FirstPlan is sponsored by a local safety net health system. It provides subsidies when necessary, and uses an actual insurance vehicle that is obligated to meet all state insurance requirements. The plan emphasizes disease management for high-risk enrollees, and has an educational component that teaches new enrollees how to access the system. Eligibility
In 2005, over 1,375 workers in 132 businesses weree enrolled in FirstPlan products; including dependents, there were over 2,000 members, nearly 380 of whom were previously uninsured. Members receiving premium subsidies numbered 218 and 63 businesses received premium discounts in the form of “CareCredits” through First Plan. “Care Credits” was developed by FirstCarolinaCare.
FirstPlan does not specifically target the uninsured. Rather all small businesses with 50 employees or fewer are eligible to purchase FirstPlan products. Premiums may be subsidized for workers earning $9/hour or less, if the business has 100% employee participation and the employer contributes at least 50% of the premium. The amount of the subsidy is based on the employer’s perception of the employee’s ability to pay. The employee contributes around $50 per month for employee only coverage and the subsidy amount makes up the difference of the full premium.
FirstPlan premiums for a business may be reduced up to 20% as permitted by North
Carolina Department of Insurance. FirstPlan utilizes CareCredits based on criteria related to: employer contribution rate for employees and dependents; participation level among workers; and coverage history. Using these criteria, FirstCarolinaCare is able to look at the final rates more favorably. A firm that had not offered coverage before, for example, could get a 5% premium reduction. So far, reduced group premiums average 7% to 10%.
FirstCarolinaCare has given 40 businesses CareCredits to date. All insurers in NC have
a flexibility of 20% higher or lower with their filed rates. FirstCarolinaCare plans to enroll 500 previously uninsured members annually, and can subsidize up to 1,000 low-wage workers. Benefits and Services
When designing FirstPlan, FirstCarolinaCare considered an HMO product with limited choice, but analysis indicated it would bring only minor price savings compared with more flexible plans. As a result, FirstCarolinaCare offers health plans similar to those offered to other businesses. The health plans have the choice of open or closed network. Benefits include preventive care, physician care, inpatient and outpatient care, lab/X-ray, OT/PT/chiropractic
12 Personal Communications with Rebecca Ballard, Community Voices Project, May 2005

D-19
care, behavioral health, and other services. A variety of co-pay and deductible options are available. Prescription drug coverage is available at a co-pay for three tier levels.
New enrollees are assessed through health risk appraisals and health screenings and those deemed high-risk for certain conditions are referred to the FirstCarolinaCare disease management program. The case manager develops care plans and arranges for additional services not available within the network. Further, FirstCarolinaCare nurses and case managers visit the businesses to discuss potential health problems and how to address them, and a telephone nurse helpline is available. Financing
The subsidies are financed through FirstHealth and outside grants, including a one-year federal appropriation of $490,000. In addition, community physicians have agreed to accept reduced reimbursement (tied to Medicare 2001 rates) for subsidized patients. The planning and development for FirstPlan was supported by a Community Voices grant from the W. K. Kellogg Foundation. Marketing
After the initial phase of FirstPlan, local advertising began in September 2003. Developing partnerships with the community were a key strategy for communications and marketing. A FirstCarolinaCare salesperson contacts businesses that, according to a previous survey, have not provided coverage and employ low-wage workers. The salesperson meets with the employer and workers, describes the product, and addresses the workers’ questions and possible concerns. While the subsidy program does not exclude previously insured groups, FirstCarolinaCare targets uninsured businesses. HealthChoicexxvii Wayne County, Michigan Overview
HealthChoice was created in 1994 and is a private, three-share health insurance program for businesses with up to 99 employees in Wayne County, Michigan. The program is administered by the Patient Care Management System, a management corporation created by the Wayne County Executive and Wayne County Board of Commissioners. HealthChoice originates from the "One Third Share" project originally funded by the Robert Wood Johnson "Health Care for the Uninsured Project.” Eligibility In 2000, the program served 1,977 businesses or 19,019 employees. Employers were eligible if 90% of the business was in Wayne County; if at least 3 employees qualified for coverage; if 50% or more of all employees qualifying for coverage had an average wage of $10 an hour or less; and if the employer had not offered health benefits in the last 12 months. Employees were eligible if they were anticipated to work in the future for at least 5 months; if they worked at least an average of 20 hours per week; if they had been without health insurance and were not eligible for other programs.

D-20
Benefits and Services
Enrollees can choose from five health plans that cover a full range of inpatient, outpatient, emergency, diagnostic and prescription drug services. The provider network consists of private physicians. Enrollees are assigned a PCP/gatekeeper who authorizes access to specialty care. The co-payment for physician visits and prescription drugs is $5. Supplemental riders are available for an additional premium charge. For example, vision and exam coverage is available for an additional 6 cents, dental for $3.29, and unlimited hospitalization for $1.86. Premium costs are divided equally (one-third each) among the employee, the employer, and the HealthChoice program. The employee’s share of the cost of coverage for single coverage is $42; for employee and spouse is $90; for employee and one minor dependent is $70; for employee and two minor dependents is $78; and for employee, spouse, and one to three minor dependents is $120. Financing
The program is financed through enrollee premiums, employer contributions and the HealthChoice program. HealthChoice’s share of the cost of coverage is funded through a hospital indigent care pool, which is financed by state Medicaid funds, federal Medicaid matching funds and county general funds. The annual budget, based on premiums for basic health coverage for a projected 20,000 enrollees, is $16.8 million. Marketing
Radio and television advertisements and some direct marketing are funded by the program. Each participating plan employs a sales staff that targets the plan to small and midsize businesses.
Access Healthxxviii,xxix,xxx Muskegon, Michigan Overview
Access Health is a private, subsidized, small to medium-sized group coverage program with a closed network. The program is financed through a three-way shared buy-in where employers, employees and the community each cover a portion of the cost. Eligibility
Businesses with up to 150 employees are eligible to participate in Access Health if they have not offered health insurance to their employees for the past year and the median wage of eligible employees is $10 per hour or less. Access Health encourages Medicaid-eligible adults to enroll in Medicaid, but allows them to participate in Access Health if they do not want Medicaid coverage. In addition, employers must offer dependent coverage, although families are encouraged to enroll Medicaid- or CHIP-eligible children in Medicaid or MIChild (Michigan’s CHIP program).

D-21
The program targets up to 3,000 full- or part-time working uninsured individuals and up
to 500 small to medium-size businesses in Muskegon County. By 2004, the program was serving more than 420 employers and 1,150 employees and dependants. Benefits and Services
Access Health covers physician services, inpatient hospital services, outpatient services, emergency services, ambulance services, prescription drugs (formulary), diagnostic lab and X-ray, home health, and hospice care. Individuals are not excluded or rated according to pre-existing conditions. The program does not cover any care received outside of Muskegon County. Co-payments are required for most services. For example, PCP office visits require a $5 co-payment and specialist visits require a $20 co-payment. The co-payment rates were designed to encourage primary and preventative care. Access Health members are required to select a PCP and have an office visit within a year.
The cost of coverage is shared among the employee (30%), the employer (30%), and
the community (40%). In 2004, the employee’s share of adult coverage was $46 per month. The employee’s share of dependent coverage was $29 per month.
Almost all Muskegon physicians participate in Access Health. Access Health services
are paid for on a negotiated fee-for-service basis. Financing
The program is financed according to a three-way “shared buy-in” among the
employer, employee and community. The employer pays 30% of the cost of coverage, the employee pays 30% and a community match pays the remainder. The community match is unique in that it is comprised of federal DSH funds as well as local government, community and foundation funds. In addition, 10% of provider fees are donated back to the program for ongoing administrative costs. Marketing In 1999, Access Health began a public relations marketing campaign (including billboards, and TV, radio and newsprint ads) that was designed to establish the program’s identity. Aggressive enrollment began in 2000 and a full-time sales person was hired to sell the product to eligible businesses.
Alliance Group Carexxxi,13 Alameda County, California Overview
The Alliance Group Care was created to provide coverage to the county’s home care workforce, who generally do not have access to employment-based insurance. It is a subsidized product with funding from public and private sources. 13 Personal Communications with Luella Penserga, Community Voices Project, May 2005

D-22
Eligibility
As of 2005, enrollment in Alliance Group Care was approximately 4,400 individuals. Outreach activities are conducted via the IHSS union in collaboration with the Alliance and the Public Authority, the employer of record. There is no income eligibility requirement, but enrollees must work in Alameda County as an IHSS home care worker for the prior two months, be authorized to work a total of 70 hours or more during those two months, and continue to be authorized to work at least 35 hours per month thereafter. Alliance Group Care does not provide dependent coverage. Benefits and Services
The Alliance Group Care benefit package includes preventive care, physician services, hospital inpatient and outpatient care, laboratory and X-ray services, emergency room care, pharmaceuticals, and limited mental health, substance abuse, acupuncture, chiropractic care and other services. Dental care was added as a benefit and negotiations for vision care are underway. Enrollees are responsible for an $8 per month premium. Physician services, preventive care visits and some pharmaceuticals do not require a co-payment, while hospital, ER, brand name and generic drugs, and some other services require a $5 point-of-service co-payment.
As with Alliance Family Care, Alliance Group Care enrollees choose a primary care provider located at one of the participating care sites. The provider network consisted of local safety net providers. Financing
For its Group Care program, the Alliance secured a combined total of $1.5 million annually from the tobacco settlement funds as well as county-based social service agency dollars. This money was then used to draw down $5.5 million in state and federal matching dollars through a variety of programs and intergovernmental transfers. The Alliance used funding from the W.K. Kellogg Foundation’s Community Voices Initiative to support a Group Care evaluation. Alliance Family Carexxxii,14 Alameda County, California Overview
In 2000, The Alameda Alliance for Health (the Alliance), and its local community partners created a coverage program to help the working uninsured with income below 300% of the FPL. Alliance Family Care utilizes the local health care safety net system as the provider network to offer an affordable, family-centered, comprehensive health plan. Enrollment in Family Care is combined with publicly funded programs provided in the county and thereby provided families with a seamless system of enrollment.
Initial expectations were that the Alliance would enroll 2,000 members over five years. Instead, they reached their current membership after only 3 years. Alliance Family Care 14 Personal Communications with Luella Penserga, Community Voices Project, May 2005

D-23
provider sites, Asian Health Services and La Clínica, have gained the trust of the community and are the health care sites of choice of many program enrollees. Concerns do still exist among undocumented immigrants that they may face public charge penalties, but the Alliance and their local partners are working with outreach workers and health care staff to educate these individuals that they can obtain coverage without public charge concerns.
An evaluation of Alliance Family Care conducted by the University of Michigan found that Alliance Family Care enrollees used a higher number of preventive services once they were enrolled than prior to enrollment. In addition, 2003 HEDIS results showed high child immunization rates for Family Care enrollees and high screening rates for diabetics. Eligibility
Alliance Family Care targets uninsured family members with children who are enrolled through the Alliance in either Medi-Cal, Healthy Families or Alliance Family Care, and who do not qualify for other public health programs. To be eligible, a family must have an annual income no greater than 300% of the FPL, live within Alameda County, and enroll all children in their household in whichever of the three above-mentioned programs for which they are eligible. When designing the program, the Alliance found that over half of the uninsured immigrants in the county have at least one family member who is an undocumented immigrant. This understanding of the mixed immigration status that is common among immigrant families led to the decision to not make immigration status a qualifying factor for coverage.
As of July 1, 2003, just over 7,300 individuals were enrolled in Alliance Family Care and 2,500 family members were on a waiting list. As noted above, early enrollment was higher than estimated, which justified the Alliance’s decision not to implement a formal outreach strategy. Rather, as part of a long-standing, county-wide enrollment program, community clinics and community-based organizations conducted most of the enrollment. Asian Health Services and La Clínica, in particular, coordinated outreach efforts. At Asian Health Services, four community health workers who speak Cantonese, Mandarin, Vietnamese and Korean conducted outreach in the Asian community. They made presentations on health care coverage options and public charge issues at nail salons, sewing factories, churches, etc. La Clínica hired a Spanish-speaking enrollment specialist to enroll individuals. The county also included Alliance Family Care in several successful enrollment events and initiatives.
In terms of retention, there has been a consistent re-enrollment rate of over 97 percent annually. Enrollment is currently capped and will remain so until the Alliance can tap into an increased and sustainable funding stream. Benefits and Services
Alliance Family Care offers coverage for a comprehensive set of health care services that specifically were designed to mirror the Medi-Cal and Healthy Families benefit packages provided in Alameda County. This enables enrolled families to have a “seamless” health care experience whereby all family members can access similar benefits (including vision and dental), use the same providers, and get care in the same locations. In addition, if a family member becomes ineligible for Medi-Cal, there is an easy transition to Alliance Family Care. Such seamless coverage is particularly important since the Alliance currently has the highest Medi-Cal enrollment in the county (Blue Cross is the only other provider). Families are responsible for a monthly premium, which varies according to age. Children age 18 or younger (or up to age 23 if a full-time student) pay $10 per month, while adults between 19 and 64 pay

D-24
between $23 and $120 per month. There are no co-payments for primary and preventive care services, nor for hospital-based services. Physician visits, pharmaceuticals and emergency department visits require nominal co-payments.
In addition, Alliance Family Care enrollees choose a primary care provider located at one of the participating care sites. Specialty care is covered but, as is typical in the safety net system, is often difficult to access. Financing
Through a combination of private and public funds, the Alliance is able to subsidize care for Alliance Family Care enrollees, thereby keeping cost-sharing at a more affordable level. The bulk of the funding comes from the Alliance itself, which provides almost $15 million out of its reserve funds. Grants from the California Healthcare Foundation ($1 million), The California Endowment ($400,000) and the county tobacco settlement fund ($2 million) provide the balance of funding. Another $950,000 is pending. The Alliance used funding from the W.K. Kellogg Foundation’s Community Voices Initiative to support a Family Care evaluation. Finally, a county-wide enrollee satisfaction survey was conducted, for which the Community Voices grant provided $50,000 and in-kind staff time for management and oversight. HealthPassxxxiii,xxxiv,xxxv New York, New York Overview
In 1999, New York City Mayor’s Office and the New York Business Group on Health (NYBGH) developed HealthPass, a health insurance cooperative for small businesses. HealthPass is administered by the New York Health Purchasing Alliance, a subsidiary of NYBGH, and provides access to a range of health plans and prescription drug and dental options. The cooperative does not provide premium subsidies, but does offer small businesses a rare combination of choice and administrative simplicity. It utilizes the “defined contribution” approach, in which employers pay a set amount of each employee’s premium and employees can choose more expensive plans and pay the balance themselves. Hence while there is no substantial price advantage relative to the regular market as a consequence of joining HealthPass, the cooperative makes shopping for health insurance relatively simple and provides many health benefit choices to employees.
HealthPass is considered to be a relatively successful cooperative not only because of the administrative simplicity it provides and the flexible benefit plans it offers, but also because of the initial support it received from local government and its close ties to the broker community. The New York City Mayor’s Office contributed money to HealthPass during its start-up phase and lent personnel to assist in managing the cooperative. The cooperative’s close interaction with the broker community has also benefited HealthPass as brokers have been the main source of enrollment. HealthPass’ major drawback has been its inability to achieve financial self-sufficiency as of 2004.

D-25
Eligibility
In 2004, 1,000 small businesses were a part of Health Pass and 9,111 persons were covered through the cooperative. In Health Pass, there is no minimum payment requirement for employers, and the employer may also provide commercial coverage. Adverse selection is addressed by a 75% participation requirement for employers with at least two employees in Health Pass. Benefits and Services
The cooperative offers a variety of plans that range from limited to comprehensive coverage. The plans are operated by four insurers: Group Health Incorporated, Health Insurance Plan of New York, Horizon Healthcare and HealthNet. Initially, each of these four carriers offered five identical benefit packages, for a total of 20 plans that differed from carrier to carrier according to the size and perceived quality of the participating physician networks. As HealthPass evolved, the plans offered by the four carriers have diverged somewhat. In addition, six new plans have been added by the four original insurers.
Ultimately, there is no price advantage over the regular market as a consequence of joining Health Pass. Though the cooperative has worked with the participating insurers to develop leaner benefit packages, the benefit packages are constrained by state mandated benefit requirements. However, small businesses have been attracted by the choice of health plans afforded through the program and simplicity of shopping for health insurance.
In 2004, the average employer contribution for individual coverage was $197 per month,
and for family coverage, $383 per month. The percent of the premium that these amounts represent varies based on family size and choice of benefit plan. The average contributions in HealthPass are considerably lower than the average New York employer contributions reported in a 2001 statewide Commonwealth Fund survey of small employers ($242 for individual coverage and $467 for family coverage). Financing
During the program’s planning phase and first two years of operation, $2.7 million in start-up funding was provided from the New York City Department of Health and the Economic Development Corporation. In addition, participating insurers and general agents contributed $129,000 plus significant in-kind contribution. By 2004, the program had not yet achieved financial self-sufficiency. Marketing
HealthPass leadership devoted extensive efforts and resources to the development of an active network of brokers and general agents. HealthPass maintains strong person-to-person relationships with brokers, provides brokers with support services, and allocates increasing proportions of their marketing budget to outreach to the broker community. The broker community has been the main source of enrollment for HealthPass. The cooperative does not exceed the market commission but provides sales promotion support to the brokers and agents. Overall, marketing costs have been high.

D-26
Healthcare Accountability Actxxxvi,xxxvii,xxxviii,15 San Francisco, California Overview
In 2001, San Francisco’s mayor introduced the Healthcare Accountability Act (HCAO) requiring contractors that provide services to the City and County to either (option 1) offer health plan benefits to all employees or (option 2) make payments to the City and County for use by the Department of Public Health to help partially offset the cost of services for uninsured workers. Impact
An estimated 16,050 uninsured workers were projected to benefit from HCAO. This included 1,900 for-profit contractors, 2,650 non-profit contractors, 5,750 Airport tenants, and 5,750 tenants of City property. Mandate
A city/county contractor has one of two options in order to abide by HCAO.
Option 1: The employer must offer the covered employee a plan that is as good or better than what is outlined in the Minimum Standards. HCAO’s Minimum Standards require employers to offer at least one health plan that is a Health Maintenance Organization (HMO). Employers may not require employees to pay a monthly premium contribution toward the HMO plan. This HMO must not charge employees a deductible of any amount for any services or benefits covered in the package. Co-payments for office visits (including PCP, perinatal and maternity, preventive care, and family planning) shall not exceed $15 per visit for a Closed Panel HMO; and $20 per visit for all other HMO models. The employee’s annual out-of-pocket maximum shall not exceed $2,500.
Each plan must be comprehensive and provide coverage for the following services: • Office visits (including PCP, perinatal and maternity, preventive care and family
planning) • Hospital inpatient • Prescription drugs • Outpatient services and procedures • Diagnostic services (X-ray, labs, etc.) • Perinatal and maternity care • Emergency room and ambulance • Mental health services, outpatient and inpatient • Alcohol and substance abuse care, outpatient and inpatient detox • Rehabilitative therapies • Home health • Durable medical equipment • Hospice care • Skilled nursing services
15 Personal Communications with Anne Kronenberg, San Francisco Department of Public Health, May 2005

D-27
Option 2: Employers must pay a fee of $2 per employee/per hour, with a weekly maximum of $80 or $320 per month. The fee is higher than the current HMO average premium for 2003 ($222/month). It also compares favorably to the premiums for Kaiser, Blue Shield and the PacAdvantage plans. A fee of this level ensures that both providing insurance and paying the fee remain viable alternatives for employers. Exemptions/Waivers
Businesses may be exempt from HCAO for a number of reasons. Some reasons include the following: (1) if the business employees too few employees (20 or fewer employees for for-profits, and 50 or fewer employees for non-profits; (2) if the contract is with a public entity, (3) if the contract was entered before 2001, (4) if the contract duration is less than a year. Financing
The City/County estimated that HCAO would cost approximately $4 million annually. This is based on the assumption that one-third of all contracts would be renewed or modified. These additional costs were to be funded through the City’s General Fund. III. Lessons Learned Innovative Strategies for Expanding Care
Our review suggests that there are design features that can be used to expand systems of local safety net care including: new organizational forms that allow for community-wide planning and coordination, standardized eligibility processes to identify and limit patient populations and assign them to a medical home, integrated data systems to make patient eligibility and medical information readily available to providers, provider networks that offer access to comprehensive services, case management services to encourage care coordination, and provider payment methods that create incentives to serve low-income uninsured patients.
Existing governance structures often present difficulties when trying to operate a
coordinated health care safety net system involving multiple agencies, public and private providers, and different sources of financing. One of the ways that safety nets have extended care is to make organizational changes that establish relationships among community-based safety net organizations and ensure commitments to work toward common goals, such as community-wide planning and service coordination. The actual form taken to achieve these organizational improvements may include:
Consolidation - When health care agencies merge for policy, administration and delivery of services. The main intent is to centralize authority and provide a more efficient and accountable system.
Collaboration - When health care agencies develop arrangements to take joint responsibility for policy, administration and delivery of services.

D-28
Coordination - When health care agencies develop arrangements for joint responsibility of the delivery of services.
Safety nets are extending care by developing integrated eligibility systems. These
systems include a defined screening, eligibility and enrollment process that limits eligibility, defines the eligibility period and service restrictions, and encourages stable participation. Outside funding is maximized by ensuring that persons meeting eligibility criteria for local, state and federal programs become enrolled in those programs.
Innovative safety nets are also using primary care assignment to expand capacity, improve continuity of care and reduce costs. In these systems patients are assigned to a specific medical home where they have expanded access to primary care and through which they go for referrals to specialty care. Reimbursement methods for providers often include risk arrangements and incentives for performance but do not normally utilize “aggressive” payment methods.
Specialty care is an important component of delivering an effective local health care
initiative. Meeting the costs involved in maintaining an adequate supply of specialty care providers can be challenging. Local health care initiatives have involved specialty care providers during the design and beginning phases of developing a local initiative and work towards the development of adequate reimbursement rates and performance-based payment methods.
Another common feature is the development of a structured referral network with a
defined network of providers and procedures for coordinating care between ambulatory and hospital settings. It may involve structured protocols in clinics, hospitals and ERs for patient referrals to the most appropriate and least expensive settings for care. Additional features may include after-hours hot lines and navigators to assist patients in accessing services.
Safety net initiatives also focus on the development of integrated patient record systems.
Integrated eligibility and patient record systems (IPRS) link ambulatory, hospital and specialty care sites in the system. An IPRS tracks eligibility, health history and movement of patients as they obtain services. These systems are used for enrolling patients in third-party programs, improving access to and better coordination of services, and saving costs through reduced duplication.
Innovative safety net models have invested resources in the development of quality
assurance programs with patient care guidelines and case management programs. Such programs require integrated eligibility and patient record systems that allow monitoring of patterns of care and outcomes. Resources from the community for quality assurance activities, measurement strategies and performance targets should be determined early in the development of new programs. Periodic evaluations that permit public accountability are important for the overall success of a program.
Safety net programs rely completely on local funds or on a combination of local, state and federal funds. They rarely have sufficient funds to adequately serve the target population. Those without a substantial portion of funds from a regular source such as Medicaid or commercial insurance often have the most difficulty. A diversified funding stream enables local safety nets to stabilize their budgets and protect themselves from unanticipated changes.

D-29
Finally, several of the safety net models are taking a broad view of health-related services that are necessary to meet the array of medical, social, behavioral and financial needs of the uninsured. Explicit linkages to social services, transportation and local public health services allow coordination between treatment and prevention programs. The linkages range from consolidation, to sharing of facilities, to referral arrangements. Innovative Coverage Initiatives
The issues that must be addressed by local initiatives to extend public and private coverage include benefit design, cost, target population, financing, marketing, provider choice, program duration, enrollment and operations, and transition.
Benefit Design: The level of benefits and services offered by the health plans varied significantly, reflecting different approaches to creating affordable products. Some of the health plans offered comprehensive services with limited cost-sharing, patterned after products available to other commercial members. In an effort to reduce the cost of coverage, others provided more limited benefit packages and greater cost-sharing. Several health plans conducted extensive market research to develop the optimal benefit package. Regardless of which strategy was followed, plans that were stable and reasonably adequate to meet most basic needs of the patient population seemed to attract more enrollees. The reason a particular product attracted its intended audience was more attributable to a combination of the benefit package with product price, marketing approach, and/ or target population. Cost and Financing: Lack of affordable products is the reason many are uninsured and innovative health plans attempt to find methods to lower product premiums. Several products have been made available at 50% of commercial rates. Some have premiums of less than $100 (for individuals), with most offering some variation of the product at less than $50. These ranges reflect the results of market research, which have consistently shown that $50-$100 per month is the maximum price low-wage workers are willing to pay for health coverage. The health plans used numerous methods to reduce premiums, through negotiated discounts with providers, rate stability, limited benefit packages, plan subsidies, enhanced cost sharing, lower profit and administrative fees, and premium alternatives. Despite lower premiums, some plans found that their products did not attract the anticipated number of customers, because (a) the premium remained out of reach; (b) the product’s benefits were viewed as insufficient for its price; or (c) the product seemed less desirable in comparison with the company’s other offerings. Low-priced products do not necessarily attract the anticipated number of customers. All of the products charged co-payments to lower premiums, ranging from a low of $2 for primary care office visits to a high of $500 per day for a hospital stay. Products that used increased cost sharing mechanisms experienced good enrollment, but no data exists to determine if cost sharing has deterred members from seeking necessary health care. Some small business and individual products have become break-even or profit-making. Others must be financed in part by moderate to heavy subsidies. The presence or absence of plan subsidies does not appear to be a defining factor in attracting the uninsured. But health plans may find some advantages in subsidizing products such as enhancing the provider-plan relationship through partial reimbursement for services which would otherwise be uncompensated. Also, some health plans recognized the uninsured as a potential future market for individual or group coverage, since most people do not remain uninsured permanently. Plan-

D-30
subsidized initiatives offer exposure to the plan and may build loyalty when the individual or family is in a position to obtain commercial health insurance. Products with varied financing mechanisms provided employers and individuals with greater choice and may have enhanced value. Nevertheless, giving the uninsured such choices did not have consistent appeal in every market. The initial offering of some new products had higher than normal administrative costs. Outside sources may scrutinize the percentage allocated to administration, but must also realize that plans usually need enhanced infrastructure to support new initiatives. Target Population: Many uninsured initiatives restricted program eligibility due to limited funds to support the product or in order to avoid duplication with other coverage for the uninsured. Most of the individual products that were reviewed established income eligibility limits. Some of the private sector products with more restrictive eligibility criteria than others experienced mixed results on enrollment. Two health plans which did not reach desired membership in their products had conducted preliminary assessments before initiating their programs, but attracted many applicants who were not eligible. Regardless of the target population, most new health insurance products took time to attract members. Some successful initiatives did not achieve enrollment goals until one to two years after product launch. Marketing: This is a critical feature to the success of private initiatives. The mere existence of a quality product at a low cost does not guarantee that the target population will purchase it. For small group products, a multifaceted approach to marketing is generally associated with higher enrollment. Successful small group initiatives that attracted more than 10,000 members used direct mail, brokers, the Internet, toll-free telephone numbers, and television, print, and radio advertisements. Among these different strategies, health plan representatives indicated that brokers were essential in securing new members. Indeed, programs that had difficulty with enrollment either did not use brokers or worked with a limited number to recruit customers. Brokers are not only a bridge between health plans and consumers, but also educate employers about the value of health insurance and the different options available for purchase. Among individual products, a greater number of marketing strategies did not necessarily translate into a higher number of enrollees. Health plans offering individual products were more likely than those selling small group products to use direct approaches such as distributing flyers and holding community events as part of a marketing campaign. The three health care organizations that managed to enroll more than 10,000 relied on a variety of marketing techniques, but few were common among the three. The use of the Internet and toll-free numbers is common among the three individual products, but it is also shared among nearly all programs examined in this study. All three individual products did, however, conduct extensive market research to determine which channels would most effectively reach their target population. Providers: Provider choice affected program marketability and price, as networks were a factor for some applicants in assessing the product’s value. Nearly all the health care organizations that developed insurance products used the same network as used for their other products, concluding that product success depended in part on having a network identical to that of other commercial coverage. While a broad network did not guarantee that consumers would purchase a product, a restricted panel did have negative consequences on enrollment.

D-31
Four health plans negotiated discounts with providers as a means to keep premiums low. Products that utilized provider discounts coupled with restricted panels experienced more difficulty attracting enrollees than products that used discounts and the usual provider network. One health plan reimbursed primary care services in full while specialty care services were partially reimbursed to provide incentives for preventive care for the uninsured. Program Duration: Several of the initiatives were either time-limited pilot programs or intended to serve as short-term insurance. Among the new, shorter-term programs, enrollment has been lower than anticipated, as some pilots with limited availability due to service area, income, or number of potential members experienced marketing difficulties. Long-established programs were better able to meet membership targets. One health plan indicated that pilots not supported by senior management may have problems achieving their goals. A pilot launched in competition with another commercial product could garner less investment and less aggressive marketing. Short-term pilots provide only temporary coverage for the uninsured since the closing of a program marks the end of health benefits. Also, some employers who have made the commitment to join a short-term pilot may face a predicament: once the program terminates, they must maintain coverage without plan subsidies, find another affordable product, or discontinue health benefits. Nonetheless, under certain circumstances, a pilot may be desirable. Pilot programs allow plans to try new, unproven or otherwise risky approaches to coverage. Plans are able to make changes on a small scale and refine their products over time, before investing significant resources in major program modifications. To overcome the barriers inherent in pilot programs, one health plan created a product intended for those currently covered as well as the uninsured to replace its existing programs. By rolling over its current members into new individual and small group products, the plan mitigated the risk that initial enrollment projections would not be met. Over time, however, a health plan has no guarantee that every member will prefer the new product over the old or that all members will choose to renew. Moreover, the replacement products still face obstacles similar to pilots or other new programs in attracting the uninsured. Transitions: Recognizing that many people become uninsured as a result of transition issues, some health plans designed products for those who (a) lose status as a dependent on another’s policy but are unable to secure one’s own coverage; (b) change jobs or become unemployed; and (c) lose eligibility for public programs but are unable to secure private coverage. Five products addressed these age, income and public/private transitions by: allowing over-aged dependents to remain on their parents’ policies; guaranteeing rate stability for the near-elderly; providing subsidies to pay for a percentage of one’s premiums for a fixed amount of time; and bridging the divide between the public and private sectors through cross-referrals. Some of the transition efforts conflict with other plan strategies; for example, seeking relief from community rating to pursue age banding versus directing products to the uninsured who are near-elderly. In general, products attempting to address transition issues have generated higher enrollment than those that have not. Enrollment and Operations: Innovative health plans acknowledged enrollment and operational problems as major barriers to obtaining health coverage since applicants must go through a multi-step process prior to obtaining coverage. A failure in any step of this process can result in lack of coverage. Several products examined in this study addressed enrollment issues by streamlining applications, allowing self-declaration of income, and providing multilingual application materials. These products attracted a greater percentage of the uninsured than others. Those health plans with less success had problems upstream in the enrollment sequence such as in marketing. Because some people are unable to obtain care due to language or cultural

D-32
barriers, two health plans attempted to increase access by using multilingual case managers to help new members navigate their way through the health care system. Members received case managers as long as the focus was on health, rather than social or career issues. IV. Conclusions and Recommendations Texas is faced with significant challenges in providing access to health care for the state’s uninsured. To help develop local initiatives that address these issues, we have reviewed a number of features of local programs that have expanded care and coverage for the uninsured. The state should consider creating a program to provide support of local effort for producing more coordinated and collaborative health care systems, including direct financial support and/or other financial-related incentives for innovations, such as Medicaid payment for navigator services, technology grants for electronic record systems, or tax credits for private insurance plans that integrate coverage with Medicaid. State level support is also needed as seed money to support the development of community-based health insurance plans and to expand existing successful plans to broader populations and geographic areas. To address the fragmentation and inequity in the existing system will call for broader solutions such as raising and making more uniform the eligibility and service standards of local safety nets across the state. Given the regional nature of health care markets and the desire for local control, basic services, funding, and eligibility levels could be standardized at the regional level.xxxix Under the regionalization approach, urban counties with more sophisticated medical centers would be grouped with smaller surrounding counties to build a more coordinated health care infrastructure dispersing primary and secondary care more broadly. One of the easiest things the state could do to begin to improve the performance of safety net systems is require standardized reporting from all county safety net programs so that state and local officials could more accurately understand the features of existing programs, monitor performance, assess unmet needs, and identify the potential impact of innovative strategies. Texas has limited underwriting requirements for small businesses, which is a major reason for the gap in coverage of small employers compared to the rest of the country. Until these regulations are changed, including movement towards community rating and making cooperatives a realistic alternative, the number of commercial products available to small groups and individuals will not be adequate, even with community-based efforts to expand their availability. Current law is skewed against small employers, who comprise the majority of Texas employers and are also the majority of employers not offering health insurance. Some of the best safety nets in the country that are also featured in this report do not have programs to assist individuals in families with incomes above 200% of the FPL. Hence, local initiatives that target services or coverage to this fastest growing segment of the uninsured population should be emphasized. This is also an opportunity to offer programs to people who have money to make a significant contribution to the cost of their own care. It is clear from our review that innovative models of community-based care and coverage have the potential to significantly expand access to care. Since Texas has maintained a broad statutory obligation for counties to provide medical care to low-income uninsured persons in the state, it seems that a comprehensive approach to expanding these models in Texas is warranted.

D-33
Acknowledgments The authors wish to thank Elena Marks and Adele Sweetnam (City of Houston) for editing the paper, and the members of the Task Force on Access to Health Care in Texas for their feedback.
Endnotes i Texas Senate Health and Human Services Committee, Interim Report to the 79th Legislature, December 2004. ii Ibid. pg. 64-68. iii White SA, The medically uninsured in Milwaukee: Current problem and future crisis. Wisconsin Policy Research Institute. Vol. 12(2): March 1999 (pp.5). iv Norton SA & Lipson DJ, Portraits of the Safety Net: The market, policy environment, and safety net response. Assessing the New Federalism. Occasional Paper Number 19: Nov 1998 (pp. 32). v Ibid. vi Ibid, pg 6-7. vii Communities in Action: Best practices on expanding access to health care. National Association of Counties, 2003. viii Coughlin T, Lutsky A, Bruen B & Guterman S, The Medicaid DSH program and providing health care services to the uninsured: A look at five programs. Bruen B & Guterman S, Chapter 3: Wishard Advantage: Indianapolis, Indiana. The Health Policy Center: The Urban Institute. Nov 2001: pp. 20-28 ix Ibid, Lutsky A & Coughlin T, Chapter 5: Carelink (San Antonio, Texas). pp. 38-47. x Wilson M, Shin P, Regenstein M, & Jones K, An assessment of the safety net in San Antonio, Texas. Urgent Matters (The George Washington University Medical Center, School of Public Health and Health Services). March 2004. xi Coughling T, Lutsky A, Breun B, & Guterman S, Chapter 2: Denver Health (Denver, CO) by Lutsky A & Coughlin T. Nov 2001 (pp. 12-19). xii Galbow P, Eisert S & Wright R. Denver Health: A model for the integration of a public hospital and community health centers. Medicine and Public Issues, 138(2) 2003 pp 143-149. xiii Andrulis D & Gusmano M. Community initiatives for the uninsured: How far can innovative partnerships take us? The New York Academy of Medicine: Division of Health and Science Policy; Office of Urban Populations, pp. 2-52 to 2-63, August 2000. xiv Robert Wood Johnson Foundation, Lessons Learned from Community-Based Models of Care for the Indigent/Uninsured: Financing Mechanisms and Stategies for Integrating Healthcare Services. (Dec 2001). xv Norton SA & Lipson DJ. Portraits of the safety net: The market, policy environment, and safety net response. Assessing the New Federalism, Occass paper No 19, 9-19, Nov 1998. xvi Bovbjerg RR, Marstellar JA & Ullman FC. Health care for the poor xvii Coughlin T, Lutsky A, Bruen B & Guterman S, The Medicaid DSH program and providing health care services to the uninsured: A look at five programs. Bruen B & Guterman S, Chapter 6: PlusCare and HealthChoice (Wayne County, MI). The Health Policy Center: The Urban Institute. Nov 2001: pp. 20-28. xviii West, K. Buncombe County Medical Society Project Access. Projects Access Web site. 1999. Available at: http://www.projectaccessonline.org/project_assessment.html. Accessed May 2005. xix Wood, J. Project Access: National Program Project Report. The Robert Wood Johnson Foundation website. 2004. Available at: http://www.rwjf.org/portfolios/resources/grantsreport.jsp?filename=027437.htm&iaid=133. Accessed May 2005. xx Simmons, Sandy Coe, Gionfriddo, Paul. 2002 Use/Capacity Report. Indigent Care Collaboration. October 2003
D-34
xxi Simmons, Sandy Coe, Gionfriddo, Paul. The Future of Healthcare in Austin. Indigent Care Collaboration. 2004. xxii Simmons, Sandy Coe, Gionfriddo, Paul. Summaries of ICC Major Initiatives/Programs. Indigent Care Collaboration. 2004. xxiii Morningside Research and Consulting, Inc. Report to the Technical Advisory Committee. July 2002. xxiv Silow-Carroll, Sharon, Alteras, Tanya, Sacks, Heather. Community-Based Health Coverage Programs: Models and Lessons. Economic and Social Research Institute. February 2004. xxv National Institute for Health Care Management. The Uninsured: A Study of Health Plan Initiatives and the Lessons Learned. March 2003. xxvi Silow-Carroll, Sharon, Alteras, Tanya, Sacks, Heather. Community-Based Health Coverage Programs: Models and Lessons. Economic and Social Research Institute. February 2004. xxvii Silow-Carroll, Sharon, Anthony, Stephanie E., Meyer, Jack A. State and Local Initiatives to Enhance Health Coverage for the Working Uninsured. Economic and Social Research Institute. November 2000. xxviii Silow-Carroll, Sharon, Anthony, Stephanie E., Meyer, Jack A. State and Local Initiatives to Enhance Health Coverage for the Working Uninsured. Economic and Social Research Institute. November 2000. xxix Silow-Carroll, Sharon, Waldman, Emily K., Meyer, Jack A. Expanding Employment-Based Health Coverage: Lessons from Six State and Local Programs. Economic and Social Research Institute. February 2001. xxx Fronstin, P., Lee, J. (2005). A Community Expands Access to Health Care: The Case of Access Health in Michigan. Health Affairs 24;3:858 – 863. xxxi Silow-Carroll, Sharon, Alteras, Tanya, Sacks, Heather. Community-Based Health Coverage Programs: Models and Lessons. Economic and Social Research Institute. February 2004. xxxii Silow-Carroll, Sharon, Alteras, Tanya, Sacks, Heather. Community-Based Health Coverage Programs: Models and Lessons. Economic and Social Research Institute. February 2004. xxxiii Meyer, Jack A, Rybowski, Lise S. Business Initiatives to Expand Health Coverage for Workers in Small Firms, Volume 1: Overview and Lessons Learned. October 2001. xxxiv Meyer, Jack A, Rybowski, Lise S, Schield, Jill, Legnini, Mark W., Stepnick, Larry. Business Initiatives to Expand Health Coverage for Workers in Small Firms, Volume 2: Case Studies of Four Initiatives. Economic and Social Research Institute. November 2001. xxxv Rosenburg, S. N. New York’s HealthPass Purchasing Alliance: Making Coverage Easier for Small Businesses. Mailman School of Public Health – Columbia University. September 2003. xxxvi Kronenberg, Anne. Healthcare Accountability Ordinance Update. San Francisco Department of Public Health. July 2004. xxxvii Kronenberg, Anne. Healthcare Accountability Ordinance Update. San Francisco Department of Public Health. November 2003. Katz, Mitchell xxxviii Katz, Mitchell. Healthcare Accountability Ordinance – Minimum Health Benefits Standards. San Francisco Department of Public Health. May 2001. xxxix Amarasingham, Rubin, Pickens, Sue, Anderson, Ron J. County Hospitals and Regional Medical Care in Texas: Analysis of Out-of-County Costs, Texas Medicine, June 2004.

D-35
Table 1. Local Care Initiatives
Location El Paso, TX San Antonio, TX Denver, CO Detroit, MI
Local Care Initiative Health Care Options CareLink Denver Health PlusCare
Start Date 1999 1997 1994 1992
Overview Health Care
Purchasing with Managed Care
Health Care Purchasing with Managed Care
Consolidated Safety Net Plan with Managed
Care Features and Vertical Integration
Managed Care Plan
Organizational Form Consolidated No No Yes No
Coordinated No Yes Yes Yes
Collaborative Yes No No Yes
Administrative Authority Community Voices
Collaborative and FirstHealth Network
Bexar County Hospital District
Denver Health and Hospital Authority
Patient Care Management System
Delivery System
Coordinated Features* IES, PCA, SR,
CM IES, IPRS, PCA, CM,
QA, SR IES, IPRS, QA,
CM, PHDL IES, PCA, QA, SR
Services Provided** A,C A - E A - F A-F
Community Partners CHCs, FQHC, Hosp Dist, Other
UTSA Med School, Comm Medical Assoc,
FQHCs,
All Public Safety Net Providers
FQHCs and other Safety Net Providers
Patient Cost Share (y/n) Yes Yes Yes Yes
Provider Payment FFS FFS – Physicians % Charges, DRG- Other Varies by Program Capitation PMPM
Eligibility
Children No Yes Yes County, State, Medicaid Matching
Adults Yes Yes Yes $44 million (2004)
Income Threshold 100% FPL 200% FPL Varies by program $250/month/person
Other Residents not eligible for other programs
Residents not eligible for other programs
$90 work expense deducted from income
Total Enrolled/Served 7,000 (2004) 53,000 (2004) 155,000 (2002) 25,000 (2004)
*Features IES Integrated Eligibility System(w/ local safety net) PCA Primary Care Assignment RPR Reduced Provider Reimbursment CM Case Management QA Quality Assurance SR Structured Referral network BC Broker Collaboration MC Marketing Campaign RC Rate Cap
**Services Provided A Primary and Preventative Care B Inpatient care C Specialty Care D Pharmacy Access E Behavioral Health Care F Dental G Vision

D-36
Table 1 (Continued). Local Care Initiatives
Location Indianapolis, IN Tampa, FL Milwaukee, WI Austin, TX Buncombe Cty, NC
Local Care Initiative Health Advantage Hillsborough County HealthCare Plan
General Assistance Medical Program ICare System Project Access
Start Date 1997 1992 1998 1997 1999
Overview Health Care
Purchasing with Managed Care
Health Care Purchasing with Managed Care
Health Care Purchasing with Managed Care
Integrated Eligibility And Patient
Records with Pub/Priv Provided Service
System
Providers volunteer health care services
Organizational Form Consolidated Yes No No No No
Coordinated Yes Yes Yes No Yes
Collaborative Yes Yes Yes Yes Yes
Administrative Authority Health and Hospital Corporation
County Dept of Health and SS
Milwaukee Cnty Div of Health Programs
Indigent Care Collaboration
Buncombe County Medical Society
Delivery System
Coordinated Features* IES, CM, QA, SR,
PHDL IES, PCA, QA IES, PCA, IPRS, CM, QA, SR IPRS, IES, PHDL IES, CM, QA, SR
Services Provided** A – F A - E A - D NA A, B, C, D, E
Community Partners Med School, FQHCs, Other Safety Net
Med School, FQHCs, Other Safety Net
Med School, FQHCs, Other Safety Net
All Safety Net Providers
CHCs, FQHC, Hosp Dist, Private
Physicians
Patient Cost Share (y/n) Yes if Income > 150%FPL Yes Yes NA No
Provider Payment Capitation-PC Physicians FFS- Other FFS
FFS- Physicians 80% Charges-
Hospitals NA NA
Eligibility
Children Yes Yes Yes NA Yes
Adults Yes Yes Yes NA Yes
Income Threshold 200% FPL 100% FPL 115%-125% FPL based on family size
250% FPL depending on program 200% of FPL
Other Not eligible for other programs
Not eligibile for other programs Medical need required Residents not eligible
for other programs
Total Enrolled/Served 47,000 (2004) 29,000 (2004) 25,000 (2004) 83,000∞
(2002) 26,000 (2005)
*Features IES Integrated Eligibility System(w/ local safety net) PCA Primary Care Assignment RPR Reduced Provider Reimbursment CM Case Management QA Quality Assurance SR Structured Referral network BC Broker Collaboration MC Marketing Campaign RC Rate Cap
**Services Provided A Primary and Preventative Care B Inpatient care C Specialty Care D Pharmacy Access E Behavioral Health Care F Dental G Vision

D-37
Table 2. Local Coverage Initiatives Location Kansas City, MO Moore County, NC Wayne County, MI Muskegon, MI Alameda County, CA Alameda County, CA
Local Coverage Initiative Chamber Choice First Plan HealthChoice Access Health Alliance Group Care Alliance Family Care
Start Date 1994 2002 1994 1999 2000 2000 – 2004
Overview Private, unsubsidized, small group coverage with choice of open or
closed network
Private, partially subsidized, small
group coverage with choice of open or closed network
Private, subsidized, small to medium sized group coverage with
choice of open or closed network
Private, subsidized, small to medium-sized group coverage with closed
network
Private, subsidized, workgroup specific
coverage with closed network
Private, subsidized, family coverage with closed
network
Organizational Form
Administrator Blue Cross Blue Shield of Kansas City
FirstHealth of the Carolinas
Patient Care Management System Access Health Alameda Alliance for
Health Alameda Alliance for
Health
Public/Private Private Private Private Private Private Private
Delivery System
Features* RPR, BC, MC, RC RPR, MC, CM, QA PCA, SR, CM, QA RPR, CM, BC, MC, QA RPR, CM, QA IES, RPR, CM, QA
Basic Services Provided** A – D A - E A - D A – D A - E A - G
Provider(s) Private physicians FirstHealth of the Carolinas, private
physicians Private physicians Private physicians Local safety net Local safety net
Patient Cost Share Yes Yes Yes Yes Yes Yes
Financial
Funding Sources Private, Cost Share Federal, Cost Share County, Cost Share Grants, County, Federal, Cost Share
Private, Grants, County, State, Federal, Cost Share
Private, Grants, County, Cost Share
Funding Model Private insurance plan Private insurance plan Three way shared buy-in Three way shared buy-in Heavily Subsidized Heavily Subsidized
Eligibility/Enrollment Children Yes Yes Yes Yes No Yes
Adults Yes Yes Yes Yes Yes Yes
Income threshold 250% of FPL N/A N/A N/A N/A 300% of FPL
Other Businesses with up to 50 employees
Businesses with up to 50 employees
Businesses with at least 3 employees
Business with up to 50 employees
In-home supportive services workers
Total enrolled 80,000 (dependants not inc, 2004) 2,000 (2005) 19,019 (dependants not
inc, 2000) 1,150 (2004) 4,400 (2005) 7,400 (2004)
% previously uninsured 40% 19% 100% 100% 100% 100%
*Features IES Integrated Eligibility System(w/ local safety net) PCA Primary Care Assignment RPR Reduced Provider Reimbursment CM Case Management QA Quality Assurance SR Structured Referral network BC Broker Collaboration MC Marketing Campaign RC Rate Cap
**Services Provided A Primary and Preventative Care B Inpatient care C Specialty Care D Pharmacy Access E Behavioral Health Care F Dental G Vision

D-38
Table 2 (Continued). Local Coverage Initiatives
Location New York, NY San Francisco, CA
Local Coverage Initiative Health Pass Healthcare Accountability Ordinance
Start Date 1999 2001
Overview Private purchasing
cooperative for small businesses
Public, health insurance mandate for government
contractors
Organizational Form
Administrator New York Business Group on Health
San Francisco Department of Public
Health
Public/Private Private Public
Delivery System
Features* MC, BC N/A
Basic Services Provided** A – D A - E
Provider(s) Private physicians Private Physicians
Patient Cost Share Yes No
Financial
Funding Sources Grants, Cost Share Public
Funding Model Cooperative Government
Eligibility/Enrollment Children Yes Yes
Adults Yes Yes
Income threshold N/A N/A
Other Businesses with up to 50 employees City/County contractor
Total enrolled 9,111 (2004) N/A
% previously uninsured 56% 100%
*Features
IES Integrated Eligibility System(w/ local safety net) PCA Primary Care Assignment RPR Reduced Provider Reimbursment CM Case Management QA Quality Assurance SR Structured Referral network BC Broker Collaboration MC Marketing Campaign RC Rate Cap
**Services Provided A Primary and Preventative Care B Inpatient care C Specialty Care D Pharmacy Access E Behavioral Health Care F Dental G Vision

Appendix E
Education and Health: A Review and Assessment
Nancy Murray, Luisa Franzini, Dritana Marko, Philip Lupo, Jr., Julie Garza, and Stephen Linder

Appendix E
Education and Health: A Review and Assessment
Prepared by Nancy Murray, Ph.D., Luisa Franzini, Ph.D.,, Dritana Marko, M.D.,
Philip Lupo, Jr., M.P.H., Julie Garza, M.P.H., and Stephen Linder, Ph.D. Institute for Health Policy
The University of Texas Health Science Center – Houston
August 2005
EXECUTIVE SUMMARY The interaction between education and health is both complex and cyclical. Health in childhood affects academic performance; while in adulthood, level of education has a lasting effect on health prospects. A number of studies have attempted to elucidate parts of this interaction. Here, we consider the evidence on how educational attainment affects health status in adults, but concentrate on the linkages between chronic health conditions in children and their academic performance. Children of parents with lower educational attainment tend to model the poorer health prospects of their parents. As these children become adults and have offspring of their own, a pattern or cycle develops. If we intervene upon the health of children through certain school-based programs, the negative cycle can be broken. In other words, we improve not only children’s health, but also academic performance, and subsequently educational attainment. This influences a life course that positively shapes the lives of future generations.
Our purpose is to scrutinize the scientific evidence behind these linkages as a basis for
recommending ways to make improvements in both health and education. Again, we focus on interventions in childhood, specifically on those that are school-based. While there has been substantial attention to recommended ways to intervene during the school day – we list more than 100 from recent reports – surprisingly few have any documented impact on academic performance. The few that are supported by scientific research will be highlighted.
The report is divided into three parts. The first part addresses how health is linked to academic performance. To assess this link adequately, we examine the most prevalent, chronic, health conditions that are thought to impair academic performance in children. Conditions assessed include overweight and obesity, asthma, diabetes, depression, epilepsy, sleep disorders and sickle cell anemia. Because of our interest in non-medical, school-based interventions, much of our attention focuses on overweight, asthma and diabetes.
School-Based Interventions
Child Health Status
Adult Health Status
Educational Attainment
Academic Performance

E-ii
Overweight and obesity, with prevalence data ranging from 14.2% to 32.6% among Hispanic boys
in Texas, has clear implications for public health, given its ties to both adult obesity and diabetes. Recent studies also indicate that children who are overweight have both lower reading and math scores. Other studies indicate that obese children consider themselves to be poor students and are more likely to be held back a grade. The evidence suggests that obesity not only poses serious health risks but also jeopardizes academic achievement.
Asthma studies in Texas indicate a prevalence of 15%, although many researchers fear that this
condition is under-diagnosed and underreported. The impact of asthma on academic performance is complex; however, there is substantial evidence that children with asthma are more likely to be absent from school. This absenteeism translates into lower academic performance, principally among those from poorer households. Unfortunately, absenteeism also has implications for school funding. Each absent child costs the average school district about $18 per day in lost state revenue. On average, children with asthma are absent about 5 extra days per year.
The prevalence of diabetes is much lower than either obesity or asthma. It is estimated that in
children, 2.6 per 1000 have diabetes. What is alarming is the sudden increase in type 2 diabetes (formerly referred to as adult-onset) among children. Prior to twenty years ago, only 1% to 2% of diabetes cases in children were attributed to type 2. More recent estimates indicate 8% to 45% of all new cases of diabetes in children are due to type 2. It is important to note there is a strong correlation between type 2 diabetes and obesity. Because of the recent increase in the occurrence of type 2 diabetes in children, most studies assessing the impact of diabetes on academic outcomes have been limited to children with type 1 diabetes. Nonetheless, children with diabetes are more likely to have a reduction in neuropsychological functioning, to be absent from school and to perform at lower levels on academic measures over time, particularly in reading.
When examining school-based interventions, we assessed those that improved health conditions
as well as academic performance. This is because the majority of school programs intervening upon health conditions measure health outcomes as opposed to academic ones. We found that few school health program evaluations have directly measured factors related to academic performance. Prevention researchers have mostly had to assume that since chronic health conditions adversely affect school performance, addressing these conditions to improve health then would naturally improve academic outcomes. This may be true; however, we limit our endorsement to those programs whose consequences for improving school performance have been documented in the scientific literature.
The second part of the report turns to the adult portion of the cycle. As noted, the childhood
portion of the cycle is related to education and academic performance. The research regarding health and education in adults explores educational attainment as opposed to academic performance. There is an extensive body of evidence suggesting that academic performance is predictive of overall educational attainment. This link is well established, and because of time and space constraints, was not reviewed. Education as an indicator of socioeconomic status (SES) is an important determinant of health. Current research has documented a health gradient based on SES. In other words, the more education one has, the healthier that person will be. It is a dose-response relationship rather than a threshold effect. As level of education increases, so does a variety of measures of health status; the relationship is not limited to those with the worst education having the poorest health while everyone else is fine. Studies have shown that better educated people are healthier, report better health, and have lower mortality, morbidity and disability. It has also been shown that those who are less educated have lower health literacy (or more difficulty understanding and acting upon health information), a higher risk of infant mortality, and are more likely to develop risk factors related to poor health. There are several possible explanations as to why education levels affect adult health. As part of the report, we review the evidence for a range of pathways based on: human capital, personal control, resources associated with education, use of medical care, occupation and social resources.

E-iii
The human capital approach suggests that education improves the individual’s ability to produce health. Education enables people to integrate health producing behaviors into a lifestyle, and this lifestyle leads to control, augmenting the ability to use education as “capital” to produce health. The second pathway examined is personal control. As this perspective implies, education promotes a belief that the individual can alter his or her environment, which ultimately leads to adoption of a healthy lifestyle. Education also provides material resources, primarily a higher income. Several studies have indicated the positive effect of income on health. Use of medical care is not a sufficient explanation as to why more educated people are healthier. In fact, several studies indicate that low-income individuals use more medical services. Occupation is another possible link between education and health. Better educated people tend to work in jobs that are more rewarding financially and personally. Lower educated individuals, particularly men, tend to be employed in more hazardous occupations. Finally, social resources such as supportive relationships are more common in those with higher education. This may impart a protective effect against certain risk factors related to poor health. The third and concluding part of the report examines the multitude of recommendations that exist in the scientific literature and policy reports we reviewed. Many of the recommendations are vague, and few are supported by evidence of success. Fewer still are based on evidence of improved academic outcomes. We propose our own recommendations based on this evidentiary approach, also paying attention to the state of policy in Texas. Another concluding consideration is how chronic health conditions affect attendance and ultimately school funding. If chronic conditions increase absenteeism, they also result in a cost burden for schools, given that student attendance rates influence school funding. We sought to determine the formula that the Texas Education Agency uses to allocate funds for Texas school districts. Based on that formula we estimate the daily cost for one student’s absence is between $17 and $18. Table 1 compares estimates of per-pupil/per-day costs from several independent resources. Also, if average daily attendance is increased by 1%, Texas school districts could receive an additional $130 million from the state. Table 1, reproduced here from Part Three, shows the range of estimates available. To be sure, interventions that reduce absenteeism for less than about $18 per student will pay for themselves, over and above the benefits brought to the children they serve.
OrganizationPer Pupil State Expenditure ($)
Per Pupil State Expenditure per Day ($) Source of Information
Humble Independent School District 57141 32.29a http://www.humble.k12.tx.us/legislativ
eInfo_attendance.htm
Fort Worth Independent School District 47202 26.22b http://www.fortworthisd.org/comm/me
dia/05_13_05.pdf
Action for Healthy Kids 9.00-20.00c http://www.actionforhealthykids.org/devel/pdf/LC_Color_120204_final.pdf
Average District 31153 17.31d Action for Healthy Kids estimates
Houston ISD 16523 9.18d Action for Healthy Kids estimates
Institute for Health Policy 31454 17.50e
a Information from website; b Information from website (per student expenditure/days of instruction = 4,720/180); c Report information; d Information provided by Action for Healthy Kids; e Proper estimation
Table 1. Comparison of per student per day costs
1Information retrieved 2005/07/27; 22003-2004; 3 Per pupil revenue from state,Texas,1999-2000; 4 2002-03;

E-iv
Recommendations In determining our recommendations, we applied a “funnel” approach to pare down the hundreds of recommendations found in current policy reports. Of the recommendations for child health interventions, we selected those that were school-based programs and then narrowed this set to those that had evidence of some effect on academic performance. Finally, we reviewed Texas policy and practices to identify areas where improvement was possible. School-Based Nutrition Interventions Failure to eat breakfast and undernutrition have been shown to adversely affect children’s ability to problem solve in school and potentially have long-lasting effects on a child’s cognitive development and performance in school. One recent study indicated that children in a School Breakfast Program (SBP) had increased language, math and reading scores, as well as reduced tardiness. Another study demonstrated that participation in an SBP reduced absenteeism and improved math scores, although no difference was found in reading, social studies or science. Similar, well-designed studies replicate these results: children who participate in an SBP have higher math grades and lower absence and tardiness rates. Unlike many other areas of school health, the affects of this intervention on academic performance are consistent and significant.
• Based on compelling evidence of impact on academic performance, we recommend an expansion of the School Breakfast Program (SBP) in Texas schools.
The Texas Department of Agriculture established the Texas Public School Nutrition Policy which addresses the issue of SBP, along with other nutrition and food service policies in public schools. For the fiscal year 2003 – 2004, 6,903 Texas schools participated in the SBP. This is impressive when one considers there are 7,009 public schools in Texas. However, according to the Texas Joint Interim Committee on Nutrition and Health in Public Schools, Interim Report to the 79th Legislature, only 26% of students are actually getting a school breakfast. We recommend extending the school breakfast program to a larger number of students as a reliable means of improving academic performance while, at the same time, addressing chronic under-nourishment. School-Based Physical Activity Interventions The benefits of physical activity on health are well accepted; however, there is evidence that increasing its presence in school curricula does not impair academic achievement and may also improve school performance. Based on these findings, we recommend increasing the requirement of physical activity in Texas schools. The Texas Administrative Code (TAC §74.32) requires enrolled K-6 students to participate in a minimum of 30 minutes per day or 135 minutes per week of physical activity. The U.S. Department of Human Services and U.S. Department of Agriculture recommends 60 minutes or more of moderate to vigorous physical activity based on the most current research.
• Given the strength of the evidence, we recommend that Texas schools increase their physical activity requirements to 60 minutes per day.
Project SPARK, an elementary school physical education program, demonstrated significant gains for reading, losses for language, and no differences for math scores on a standardized test, suggesting that, even with time taken away from the academic program for physical education, overall academic functioning was not impaired. Another physical education program incorporating fitness or skill training for 75 minutes a day, compared to usual physical education offered three times a week for 30 minutes, demonstrated increased math scores, better classroom behavior as rated by teachers and no significant reduction in reading test scores compared with controls. Regarding level of fitness and academic performance, the California Department of Education has demonstrated a significant linear association

E-v
between standardized test scores (Stanford Achievement Test Ninth Edition [SAT-9]) and their fitness scores. A dose-response effect was noted for all grades studied where the highest SAT-9 scores were reported by students who met three or more standard levels among the six physical fitness measures, particularly among females, and particularly for mathematics rather than for reading scores. While physical activity may be very important for preventing obesity and diabetes in children, it most likely will also improve academic performance. School-Based Asthma Management Interventions The effectiveness of programs for asthma management has been well documented in a series of well-designed studies. Not only was absenteeism reduced but test scores improved in a number of areas. While Texas has policies that address environmental triggers of asthmatic episodes, there is no written policy on asthma education programs for children or staff or recommendations for schools to consider them.
• Based on compelling evidence, we recommend that Texas schools adopt asthma management education for affected children and support staff.
Table 2 is drawn from the text in Part Three and summarizes the research findings linking school-
based interventions and academic performance.

E-vi
Table 2. The effect of school programs on academic performance
Conditions School Health Programs Level of intervention Study Design Academic Performance
Indicator Type of effect Program and Intervention Components
Overweight/ Obesity
Diabetes
Asthma (Tinkelman et al., 2004) DSCM asthma school program.
Elementary and middle schools
Reduction in absenteeism (+) DSCM asthma school program incorporated a respiratory nurse care manager, web-based interactive educational tools, and an interactive asthma diary for students.
Evans, D., Clark, N.M., Feldman, C.H., Rips, J., Kaplan, D., Levison, M.J., Wasilewski, Y., Levin, B., & Mellins, R.B. (1987). A school health education program for children with asthma aged 8-11 years. Health Education Quarterly; 14(3):267-279.
Elementary (grades 3-5)
Experimental Longitudinal Intervention. Random assignment of schools within matched pairs. Pretest-posttest analysis of change in achievement.
Academic grades / Mathematics / Science / Oral expression / Standardized test scores for reading/ Standardized test scores for math / Teacher-rated classroom behavior / Attendance
(+/+/+/+/NE/NE/NE/NE)
Asthma self-management program consisting of six 60-minute sessions on asthma management skills; parents received written information about curriculum and activities.
Christiansen et al., 1997. Absenteeism (NE) Five-session bilingual, interactive curriculum teaching about asthma in a school setting.
Clark et al., 2004. Randomized controlled trial.
Science grades / reading / math / physical education / absences
(+/NE/NE/NE/D)
Mild emotional disorders
Gall at al., 2000. High school (13-18 yrs old)
Reduction in absenteeism / Reduction in tardiness
(+/+) Students received school-based mental health and counseling services for two months.
Physical Inactivity
SPARK Sallis JF, McKenzie TL, Kolody B, Lewis M, Marshall S, Rosengard P (1999). Effects of health-related physical education on academic achievement: Project SPARK. Research Quarterly for Exercise and Sport; 70(2):127-34.
Elementary Experimental Longitudinal Intervention. Random control study of a 2-year intervention.
Metropolitan Achievement Test: Reading / Language / Math / Composite basic battery scores
(+/-/NE/NE) Project SPARK: implemented in 7 public elementary schools in California that incorporated moderate to 30 minute classes: 15 minutes of health-fitness activity (high intensity aerobic) and 15 minutes of a skill-fitness activity for a minimum of 3 days per week through the school year (36 weeks).
Dwyer T, Coonan WE, Worsley LA, Leitch DR (1979). An assessment of the effects of two physical activity programs on coronary heart disease risk factors in primary school children. Community Health Studies; 3:196-202 and Dwyer T, Coonan WE, Leitch DR, Hetzel BS, Baghurst RA (1983). An Investigation of the effects of daily physical activity on the health of primary school students in South Australia. International Journal of Epidemiology; 12:308-313.
Elementary Experimental Longitudinal Intervention. Random assignment of students to control or to a 14-week intervention: three group comparison (Fitness; Skill; and Control).
Two Australian education standardized tests: ACER arithmetic test/GAP reading test; and teachers’ ratings of classroom behavior.
(+/NE/+) The Fitness and Skill groups engaged in organized activity daily for 15 minutes in a morning class and 60 minutes in an afternoon class period—the Fitness group engaged in aerobic activity; the Skill group engaged in non-strenuous motor skills ; the control group received three 30-minute periods of usual physical education per week.
Under-nourished
Murphy MJ, Pagano ME, Nachmani J, Sperling P, Kane S, Kleinman RE (1998). The relationship of school breakfast to psychosocial and academic functioning: Cross-sectional and longitudinal observations in an inner-city school sample. Archives of Pediatrics & Adolescent Medicine; 152(9):899-907.
Elementary and middle schools
Quasi-experimental NRNC study. Measures taken at baseline and 4 months after exposed to intervention, assessed change in breakfast program participation and outcomes among students whose participation was often, sometimes, rare, or never.
Math grades / attendance / tardiness
(+/+/+) Universally Free school breakfast program (UFSBP). Participated Often (ate 80% or more meals when present at school); Sometimes (ate 20% to 79%); or Rarely (ate less than 20% of meals when present at school).
Meyers AF, Sampson AE, Weitzman M, Rogers BL, Kayne H (1989). School breakfast program and school performance. American Journal of Diseases of Children; 143:1234-1239.
Elementary schools
Quasi-experimental (NRC) conducted for one school year: pre-test measured in 2nd semester of 1986-7 school year; post-test measured in 2nd semester of 1987-88.
CTBS total score / language subscore / math / reading / tardiness reduction
(+/+/+/+/+) School Breakfast Program (SBP) offered to low-income students enrolled in public elementary schools.
Kleinman et al., 2002. Reduction of Absenteeism / math scores / reading / social sciences / science
(+/+/NE/NE/NE)
School Breakfast Program implemented.
CTBS, Comprehensive Tests of Basic Skills battery; NE, no effect; D, disputable - parents of treatment children reported fewer absences attributable to asthma in the past three months, but no differences in school absences were noted in school records.
After an extensive search of the literature, no evidence-based interventions specifically for overweight/obesity were found that directly improved academic performance.
After an extensive search of the literature, no evidence-based interventions specifically for diabetes were found that directly improved academic performance.

INTRODUCTION Education plays a wide range of roles in our society. In addition to imparting certain cognitive and
interpersonal skills necessary for productive functioning, it also exerts a formative influence on the identities, norms and sentiments that work to integrate individuals into the larger society. Further, education is widely believed to be the key to social and economic advancement, with higher educational attainment thought to bring higher status, greater rewards and more valued accomplishments. These beliefs are firmly rooted in our cultural norms of individual achievement and upward mobility; they also help people make sense of their experiences with social stratification and resource disparities. Unfortunately, our system of mass, public education does not work equally well for everyone. And those whose academic performance is compromised by institutional or personal problems will sacrifice educational attainment and the promise of upward mobility. More importantly, as we will see, they are likely to sacrifice their health, as well.
Current research supports the notion that level of education matters not only for social and economic advancement but also for health status. In short, higher education yields better health. The gap in health status, however, is not limited to the contrast between those at the lowest educational levels and those at the highest. Each increase in level of education appears to make a positive difference for health status. When we consider this relationship across the adult population, it suggests that improvements in health might be made through indirect investment in educational opportunities. Most of this investment, however, is currently directed at children and young adults. Paradoxically, the offspring of parents of lower educational attainment, who are most in need of these opportunities, are also likely to have taken on the poorer health prospects of their parents. These children, in turn, are less likely to perform well academically or to attain a level of education that will enhance their own health status -- or the health status of their offspring. Children’s health, then, is important not only for its own sake, but also for its impact on academic performance and subsequently, through educational attainment, on children’s health prospects as adults. In effect, the relation between education and health across the life course assumes the form of a vicious cycle, where limited achievement and chronic health conditions become mutually reinforcing and reproduced in the next generation. The question is, can this cycle be broken? And if so, where do we best intervene in the cycle to prevent it from recurring?
There have been systematic efforts to prevent chronic health conditions in adults through literacy
campaigns and other kinds of educational interventions, especially for conditions linked to risky behavior. But these do little to mitigate the effects of poor educational attainment on social and economic advancement, a critical part of the cycle. While they can improve an adult’s health prospects, they may not be as effective at breaking the cycle as interventions attempted earlier in the life course. If we focus, instead, on the beginning of the cycle, with children whose chronic health conditions impair their academic performance, logically at least, chances should be better that we can improve both their health and economic prospects as adults. Because of the cost and complexity of fielding research that spans the full, education-and-health cycle, however, we are left with evidence on these kinds of prevention efforts that typically considers only one link in the cycle at a time. Accordingly, we will first identify the most prevalent chronic health conditions in school-age children, and then examine the available evidence documenting the impact these conditions have on academic performance. Next, we turn to an assessment of interventions intended to prevent or improve these health conditions. The interventions of greatest interest, for our purposes, are those purported to have direct implications for academic performance, as well as health. Since academic performance is largely confined to the school setting, we will concentrate on school-based interventions, perhaps, the largest class of prevention measures devoted to childhood after immunization.

E-2
The illustration above highlights the main linkages that make up the cycle. The childhood portion appears on the left of the cycle and the adult portion on the right. As noted earlier, our review of the evidence for these linkages concentrates on the relationships between health and education for children and adults and on school-based interventions on the childhood portion of the cycle. The table numbers appearing near the arrows in the figure correspond to our summary tables of findings from the scientific literature that will appear in subsequent sections of this report.
Our overall strategy in the first of three parts is to review all of the published, scientific literature relevant to each of the childhood links, paying special attention to the evidence that identifies interventions proven to work. Certainly, the weight of the evidence will vary with the number and quality of the published studies; in some instances, where much has been made of certain links, we will find that supporting evidence simply does not exist. Such interventions, supported largely by inference and reputation, seem to take on a life of their own. In other instances, simple, relatively inexpensive interventions will be shown to yield large dividends in academic performance. Our assessment will be ordered according to the prevalence of chronic, childhood health conditions. The link between these chronic conditions and academic performance will be considered first. The second link of interest is between school-based interventions and these chronic conditions; that is, we consider whether anything can be done during the school day to alleviate these conditions. Finally, we consider whether these health-oriented interventions are proven to make any difference for academic performance. Breaking the cycle depends upon it.
Part Two turns attention to the adult portion of the cycle, reviewing the extensive evidence relevant
to the link between educational attainment and health status in adulthood. This represents one of the most thoroughly documented of the links, at least in the health literature. To the extent that compromised academic performance in childhood impinges on overall educational attainment, affecting, say, high school completion or the pursuit of an advanced degree, then we are led to expect compromised health status in adulthood. Because of time and space constraints, however, we have not reviewed the extensive evidence linking academic performance to overall educational attainment. Similarly, the evidence linking parental educational attainment and health status to the health status of their offspring will have to await assessment on another occasion.
Part Three shifts away from an examination of the evidence behind the various links between
education and health to consider the issue of policy recommendations. Literally, hundreds of recommendations have been generated in more than 50 reports just in the last five years. The impetus for these has come from widespread perception of relatively dramatic increases in the prevalence of certain childhood conditions, most notably, obesity, Type II diabetes and asthma. Fortunately, for analytical purposes, the recommendations can be quickly pared down since few are supported by substantial evidence of success, and fewer still have been shown to make a difference for the academic achievement
Table 4
Table 5
School-Based Interventions
Child Health Status
Adult Health Status
Educational Attainment
Academic Performance
Table 2
Table 3

E-3
of children with chronic health conditions. In this context, we will inventory the recommendations and pay special attention to the current status of state policy in Texas.
Health researchers, agencies and advocates have not been alone in advancing recommendations
for school-based interventions; the K-12 educational community has also played a large role. One of their key concerns relates to the impact that chronic health conditions have on attendance, since attendance has implications not only for academic performance but also for a particular school district’s revenue from state education funds. In effect, absenteeism translates into a cost borne by districts in terms of lost state revenue. To the extent that chronic conditions increase absenteeism, they also represent a measurable cost burden for schools. The same argument can then be turned to justify expenditures on school-based health interventions to reduce absenteeism. We present two tables on this issue: one illustrating the basis of the calculation and the other comparing estimates of per-pupil/per-day costs from several independent sources, including our own.
Since much of the narrative is dense with citations, we condense the relevant findings into a series
of summary, stand-alone tables. Some are accompanied by extensive notes to clarify sources and terms. In addition to the three parts of our discussion, we have added several appendices for readers wanting greater detail. The first appendix provides more extensive detail on the studies reviewed in Part One. Appendix II summarizes the state statutes relevant to school health. Appendix III offers summaries of state policies on asthma and nutrition. Appendix IV offers an update on recent school-health initiatives from the 79th Regular Legislative Session that ended in May, 2005.
PART ONE: Childhood Health Conditions, Academic Performance and School-Based Interventions This first section reviews the prevalence data for chronic conditions and examines the evidence for a link between each of these conditions and academic performance. The discussion is organized by chronic condition and includes an assessment of limitations and a discussion of implications for each.
Section 1. Prevalence of Chronic Conditions and Their Links to Academic Performance
In the short term, chronic health conditions among children may affect school attendance, cognition and behavior in the classroom, test-taking abilities, and social relationships. In the long term, chronic health conditions in childhood may affect academic achievement, grade advancement, and school
Recommendations for Child Health Interventions
School-Based Recommendations
Report Recommendations
Policy-Based Recommendations
Evidence-Based Recommendations
A simple illustration for this paring-down process is provided by the funnel on the left. We begin with recommendations over the past five years that address chronic health conditions in children. These are then narrowed to include only those recommendations that propose school-based health interventions. At the next lower level, we screen out all of those recommendations that have not been shown by adequate research to affect academic achievement. The evidence-based recommendations that remain are chiefly a product of the research assessment completed in Part One. Finally, we screen the evidence-based recommendations relative to state policies that are already in place. Our final set includes only those few that are expected to be effective and to alter current practices.

E-4
completion. For our purposes, chronic health conditions in childhood include those amenable to some kind of school-based intervention, such as obesity, asthma, and diabetes, and those conditions that respond chiefly to medical management, such as epilepsy. How prevalent are these conditions in Texas? What is the effect of these health conditions on academic performance? Can academic achievement be enhanced with more effective school-based health interventions? In each instance, we look first to the peer-reviewed, scientific literature for an answer. At times, the results we cite will be accompanied by some technical detail in parentheses; these figures refer to either statistical estimates of particular measures or to their likelihood. Overweight and Obesity Prevalence. Overweight and obesity in children are widely perceived to be reaching alarming proportions. In Texas, a 2003 surveillance of children at the state level (Hoelscher et al., 2004) found the prevalence of overweight (body mass index greater than 95% of same-age and gender) to be 22.4% in fourth grade, 19.2% in eighth grade, and 15.5% in eleventh grade and to be highest among Hispanic boys (29.5% - 32.6%), fourth grade Hispanic girls (26.7%) and fourth and eighth-grade African-American girls (30.8% and 23.1%). For a more complete view of the range of estimates from a variety of sources, see Table 1. Among children found to be overweight, are there consequences for their academic performance? Overweight and Academic Performance. Two recent studies examined the effect of overweight on academic achievement and factors related to academic performance. Datar, Sturm, and Magnabosco (Datar et al., 2004) examined data from 11,192 kindergartners participating in the Early Childhood Longitudinal Study, a nationally representative sample of kindergarteners in the U.S. in 1998. This longitudinal study measured height and weight of the children in the fall of kindergarten, spring of kindergarten, and spring of first grade. Overweight was significantly associated with lower scores in reading for boys (1.42 points, p < .05) and girls (1.66 points, p<.05). Overweight boys (1.99 points, p < .05) and girls (1.21 points, p < .05) also scored lower in math. After controlling for additional factors related to academic performance (socio-economic status, parent-child interaction, birth weight, physical activity and TV-watching), overweight boys’ math test scores were still significantly lower than normal-weight boys. From a longitudinal perspective, there was no significant difference in test score gains during the first two years between overweight and non-overweight children after controlling for baseline scores. This finding suggests that the effect of overweight on academic achievement may derive from weight status at entry into kindergarten.
Falkner, et al., (Falkner et al., 2001) examined data from a statewide survey of adolescent health conducted in Connecticut in 1995/1996 among 9,943 seventh, ninth, and eleventh graders. This cross sectional study is limited as it relies on self-report of height and weight. However, after controlling for grade level, race, and parental socio-economic status, analysis suggests that obese (>95th percentile) girls were 1.51 times more likely to report being held back a grade (95% CI: 1.09, 2.10) and 2.09 times more likely to consider themselves poor students (95% CI: 1.35, 3.24). Obese boys were 1.46 times more likely to consider themselves poor students (95% CI: 1.05, 2.03) and 2.18 times more likely to report that they expect to quit school (95% CI: 1.45, 3.30) than average. Overweight (85th to 95th percentile) boys were 1.36 times more likely to consider themselves poor students (95% CI: 1.05, 1.76) and 1.54 times more likely to report that they expect to quit school (95% CI: 1.07, 2.22) than average weight boys. Study Limitations. In children and adolescents who are growing at different rates related to age and gender, establishing a criterion for overweight or obese, or for at-risk of overweight, has been challenging. Current guidelines are derived from the Centers for Disease Control and Prevention’s (CDC) Growth Charts (Kuczmarski, 2000). Charts are presented separately for age and gender groups but not for racial/ethnic groups, since factors related to differential growth by race/ethnicity are as yet unclear. The research on the relationship between overweight and academic performance is limited by the small number of studies, self-report measures of overweight, and controversy over the CDC Growth Charts.

E-5
Implications. Given the current prevalence of overweight conditions among children and the finding that as children age their later weight depends primarily on their earlier weight (Kelder et al., 2002), by the time they reach high school, we can expect that between a quarter and a third of them will be more likely to be held back a grade, consider themselves poor students and expect to quit school based on their overweight status. These inferences project current trends forward in time, assuming nothing interferes with them. The only way to be sure of them is to track children’s weight status carefully as they progress from grade school into high school. Asthma Prevalence. Asthma is another chronic health condition in childhood that has grown in prevalence over time, with research documenting an increasing impact on child health, academic performance and family functioning. The National Health Interview Survey conducted in 2002 revealed that 9 million U.S. children under the age of 18 have been diagnosed with asthma during their lifetime; that is 12% of U.S. children. More than 4 million children experienced an attack in the last 12 months (National Health Interview Survey, 2002). A recent telephone survey of 1,500 households in the South Plains/Panhandle region of Texas indicated that 15% of children had been diagnosed with asthma by a physician (Arif et al., 2004). Also in Texas, 10,500 children were admitted to a hospital for treatment of asthma in 2001; that is 170.1 admissions per 100,000 population (Texas Health Care Information Council, 2003). The 10,500 figure may underestimate the number of children living in Texas with the consequences of asthma, especially poorly managed asthma. Asthma surveillance in children is limited by issues of diagnostic criteria and access to health care, resulting in limited data on the prevalence of asthma. These difficulties contribute to unreliability in the estimates. For a clearer indication of these limitations, see Table 1. Asthma and Academic Performance. Studies of the impact of childhood asthma on school functioning have examined academic achievement, school absences, sleep disturbances, and restriction of physical activity and have made an effort to include physician-diagnosed and undiagnosed asthmatics. A recent study in North Carolina, in which 2,059 students from 25 of 30 middle schools in one district were surveyed about symptoms of asthma with the aid of a video depicting symptoms of asthma, found that 9% of the adolescents reported physician-diagnosed asthma with current symptoms and 27% reported wheezing but no diagnosis of asthma (Yeatts & Shy, 2001). Furthermore, physician-diagnosed asthmatics and “wheezers” were significantly more likely (2.6 and 1.8 times) to have missed school days than asymptomatic students and were substantially more likely (7.8 and 4.7 times) to report sleep disturbances. More than one-third of these students (36%) experienced functional consequences of asthma that are likely to negatively impact academic performance. The majority of these (27%) were efforts to cope with asthmatic symptoms without treatment. Joseph, Foxman, Leickly, Peterson, and Ownby (Joseph et al., 1996) conducted a study in Detroit in 1993, similar to the Yeatts and Shy study mentioned above, but undiagnosed asthmatics were identified through pulmonary function testing. Of the 230 third- through fifth-graders participating, 17.4% reported physician-diagnosed asthma and 14.3% were identified as undiagnosed asthmatics. Children who met symptom criteria were 7.1 times more likely to report sleep disturbances and 15 times more likely to miss physical education classes, than children without asthma. Children with physician-diagnosed asthma missed significantly more days of school than children without asthma. Undiagnosed asthmatics in this study typically missed 6 or more days of school. Maier, Arrighi, Morray, Llewllyn, and Redding’s 1995 study in Seattle (Maier et al., 1998) of 4,995 parents of first and second grade students found 11.5% of their sample to have physician-diagnosed asthma, and another 7.3% with current wheezing but no diagnosis. Compared to the asymptomatic population, both diagnosed and undiagnosed children reporting symptoms of asthma were 6 times more likely to miss school and 2 times more likely to experience sleep loss due to respiratory-related problems. An analysis of data from the 1988 National Health Interview Survey on Child Health gathered information from parents on 10,362 children in grades 1 through 12 (Fowler et al., 1985). Of these

E-6
children, 4.9% were reported to have had asthmatic symptoms in the past 12 months, a prevalence higher in males than females (5.8% vs. 4%), but varying little by race/ethnicity (although slightly higher among Black children), maternal education, or income. Compared with asymptomatic children, children with asthma missed more days of schools (7.6 mean days in previous 12 months vs. 2.5), had slightly higher rates of grade failure (17.5% vs. 14.6%), and higher rates of learning disabilities (9.1% vs. 5.2%). Three times as many asthmatic children from families with incomes less than $20,000 were described as in poor or fair health when compared to asthmatic children from families with incomes equal to or greater than $20,000. Asthmatic children described as in poor or fair health were absent substantially more days in the past year (17.4 days) than those in good or excellent health (6.7 days). Asthmatic children of poor families also had twice the odds of grade failure compared to well children. In contrast, for asthmatic children from higher income households (>$20,000) there was little increased risk of grade failure or learning disabilities. There is substantial evidence that children with asthma are more likely to be absent from school (Fowler et al., 1992) (Freudenberg et al., 1980; Joseph et al., 1996) (Maier et al., 1998) (O'Neil et al., 1985) (Parcel et al., 1979) (Silverstein et al., 2001) (Yeatts & Shy, 2001). However, the relationship between school absence and academic achievement for children with asthma has not been clarified in these studies. Gutstadt (Gutstadt et al., 1989) and ONeill (O'Neil et al., 1985) reported that, while children with asthma missed more days of school, academic performance was not necessarily related to school absences. These two studies relied on cross sectional designs, compromising the reliability of their conclusions. A longitudinal, case-control study of predominantly white, middle-class children from Rochester, Minnesota, relied on school records to document that asthmatic children missed an additional 2 days of school as compared to non-asthmatic children, but that school achievement was not significantly different between the two groups, as assessed by standardized test scores (Silverstein et al., 2001). Fowler’s (Fowler et al., 1992) analysis of national data from the National Health Interview Study found, however, that asthmatic children of poor families may be at increased risk of grade failure, suggesting that poor asthmatic children may be at greater risk for academic failure than their wealthier counterparts who appear able to compensate for missed days of school. Several studies have raised concerns about the effect of medications used in the management of chronic asthma on academic achievement. Gutstadt et al. (Gutstadt et al., 1989) conducted a study among 99 asthmatic children in grades 2-12 and found that a history of oral steroid use in the preceding year was significantly associated with lower mathematics and reading scores on standardized tests, even when controlling for socioeconomic status, age, and scores on the child behavior checklist. In contrast, Lindgren et al. (Lindgren & Lokshin, 1992) found that treatment with theophylline was not related to differences in standardized achievement test scores between 101 asthmatic children aged 6 to 18 and their sibling controls. This limited research on medication for management of asthma raises concern about treatment with oral steroids. Limitations. Research on asthmatic children in school settings is challenged by the reliable identification of children with asthma, as shown in a Detroit study by Joseph et al. (Joseph et al., 1996) where there were almost as many undiagnosed asthmatics as physician-diagnosed asthmatics. Disparities in access to health care may impede the proper diagnosis of asthma and affect the conduct of research with asthmatic children. Children of very poor families with access to health care, for example, may be more likely to be diagnosed than children of the lower middle class who lack insurance and access to health care. Implications. The evidence for the impact of asthma on academic achievement is complex but does suggest that asthma is related to school absences and may adversely affect academic performance for children from poor households. In addition, obesity has been found to be a risk factor for asthma in children (Bibi et al., 2004).

E-7
Diabetes
Prevalence. Diabetes in children, categorized as type 1 (Insulin Dependent Diabetes Mellitus or juvenile onset) and type 2 (formerly adult-onset), is a relatively less common chronic disease in children and adolescents; about 151,000 people in the U.S. below the age of 20 years have diabetes (National Center for Chronic Disease Prevention and Health Promotion, 2005). Behavioral Risk Factor Surveillance data from 2003 reports that 8.1% of Texas adults report that a doctor has told them that they have diabetes, an increase over the nationwide rate (7.2%) (Centers for Disease Control and Prevention, 2005). In children, the prevalence of type 1 diabetes for U.S. residents aged 0-19 years is 1.7 per 1000. The prevalence of type 2 diabetes is likely to be underestimated, since it is hard to detect type 2 diabetes in children given the mildness or lack of symptoms, the need for blood tests for diagnosis, and issues around criteria for differentiating between types. Despite this, case reports suggest that type 2 diabetes now accounts for between 8% and 45% of all new cases of diabetes referred to pediatric centers. If these numbers find corroboration in other studies, they represent an important public health problem, since as recently as 1985, only 1% to 2% of diabetes cases in children were attributable to type 2 diabetes (Aye & Levitsky, 2003).
The question is: what is causing this marked increase of type 2 diabetes in children? One important risk factor is obesity. The correlation between obesity and type 2 diabetes in adults has been documented previously (Bray, 1992) (Westlund & Nicolaysen, 1972). However, the relationship between these two chronic conditions in children is a more recently observed phenomenon. The tremendous increase in the incidence of type 2 diabetes in children was noted in 1996 by Pinhas-Hamiel et al. In 1994, among cases who were diagnosed with childhood diabetes in Cincinnati, 16% were classified as type 2. This was a sharp increase from 1982 data that showed only 4% of diabetes cases classified as type 2. Most importantly, the study found that in addition to family history and ethnicity, obesity is a major risk factor for type 2 diabetes. Ninety-two percent of the study population with type 2 diabetes had a body mass index that surpassed the normal range. In addition, African-American girls had not only the greatest increase in obesity among groups, but also the highest prevalence of type 2 diabetes (Pinhas-Hamiel et al., 1996). In fact, the clearest factor contributing to the increased risk of type 2 diabetes is increased body fat. Gutin et al found a strong correlation (Spearman rank r = 0.78) between percentage body fat and fasting insulin (Gutin et al., 1994).
The temporal connection between the increase in childhood obesity and rising prevalence of type 2 diabetes in children offers some preliminary evidence of an underlying relationship. Although African-American, Mexican-American and Native-American children in North America are more likely to be affected than Anglos, this is most likely due to higher rates of obesity in these groups as opposed to genetic differences (Miller J. et al., 2004). There is an important genetic contribution to the etiology of type 2 diabetes in children as in adults, but another study identifies an alternative source of these differences based in disparities and differences in socioeconomic status (Botero & Wolfsdorf, 2005). Diabetes and Academic Performance. Since the 1960s, numerous studies have examined the impact of Type I diabetes in children on their academic performance. Researchers have suspected that Type I diabetes may exert an important effect on childhood intelligence functioning, neuropsychological and neurobehavioral functioning and abilities, school attendance, and academic achievement. Unlike other aspects of diabetes, the mentioned literature is highly heterogeneous and contradictory.
Investigated outcomes have included neuropsychological/neurobehavioral functioning and school attendance as a way to measure academic performance. These factors have been measured by a wide collection of neurocognitive and achievement tests. Additionally, in some cases parent-self reporting measures of school attendance (Ryan et al., 1985a), academic performance (Hagen et al., 1990; Holmes et al., 1992; Yu et al., 2000) and social functioning (Yu et al., 2000) have been collected. These self-reported measures, however, are subject to recall bias and were not compared with the child’s perceptions or school records.

E-8
Compared to non-diabetic children, diabetic children present significantly lower scores on school achievement scores such as arithmetic, reading and spelling (Gath et al., 1980; Ryan et al., 1985a), increased learning difficulties, lower grades in English and language arts, more grades repeated and special instruction received (Hagen et al., 1990; Holmes et al., 1992; Yu et al., 2000). They were absent more frequently from school (Holmes et al., 1992; McCarthy et al., 2002; Ryan et al., 1985a; Yu et al., 2000), and their absence rate was associated negatively with GPA (Grade Point Average) and academic achievement (Kovacs et al., 1992; Ryan et al., 1985a). Diabetic children perform within normal range regarding overall intelligence and cognitive functions (Ack et al., 1961; Kaufman et al., 1999; Ryan et al., 1985a; Ryan et al., 1984; Weil & Ack, 1964) and particularly on associative learning ability, verbal/visual memory and visual-spatial tests (Ryan et al., 1984). Nevertheless, a pattern of mild deficit and slower performance in specific neurocognitive tests such as verbal intelligence (Hagen et al., 1990; Kovacs et al., 1992; Ryan et al., 1984), memory (Hagen et al., 1990; Holmes et al., 1992), visual-motor tasks and coordination (Ryan et al., 1985a; Ryan et al., 1984), and visual-spatial ability (Rovet, 1987), was found. On behavioral aspects, Ryan, et al., concluded that children with diabetes do not have poor self-image or excess anxiety (Ryan et al., 1984), but McCarthy, on the other hand, found diabetic children to have more behavioral problems such as mood variability, compliance and fatigue (McCarthy et al., 2003).
Further, several factors have been shown to be associated with the functional impact of diabetes: age of diabetes onset, hypoglycemic episodes or seizures, and metabolic control. Age-at-onset seems to determine the impact of diabetes on neurocognitive development and learning ability. Children with early onset diabetes, diagnosed before 4-5 years of age, achieved lower intelligence test scores than their respective siblings (Ack et al., 1961). They performed slower in processing information than both controls and children with late onset diabetes (Hagen et al., 1990). And, compared to controls, early onset diabetic children performed slower in verbal intelligence (Hagen et al., 1990; Ryan et al., 1985b), visual-spatial ability, learning and memory, mental and motor speed (Golden et al., 1989; Holmes et al., 1992; Rovet, 1987; Ryan et al., 1985a). Age at onset was found to be negatively related to memory (Golden et al., 1989) and to visual-perception but not to verbal comprehension, academic achievement (such as reading, math, written language, knowledge) or to overall cognitive scores (Kaufman et al., 1999). A related issue is the disease duration. While length of disease seems not to affect general intellectual functioning among diabetic children (Ack et al., 1961; Golden et al., 1989; Kaufman et al., 1999; Weil & Ack, 1964), disease duration was related to lower vocabulary and block test scores, lower school grades and higher absenteeism (Kovacs et al., 1992).
Mild/severe hypoglycemic episodes or seizures are suspected to be one of the pathways for the association of age of onset and cognitive impairment by affecting the brain development and increasing the risk of later neurobehavioral deficits or delays (Ryan et al., 1985a). Presence of hypoglycemic seizures was associated with lower scores in short and word memory, (Kaufman et al., 1999) or contrarily, has not exerted any effect on cognitive function (Ryan et al., 1984). Frequency of asymptomatic hypoglycemia is found to be associated with abstract/visual reasoning (copying subscales) (Golden et al., 1989). Mild hypoglycemia is related to reduced functioning on basic motor on dominant hand, attention, memory (Puczynski M. S. et al., 1990; Reich et al., 1990) and concentration (Puczynski M. S. et al., 1990). Mild hypoglycemia modifies the temporary performance rather than the long-term cognitive deficits but a lag may exist between blood sugar restoration and total mental efficiency recovery (Puczynski M. S. et al., 1990; Puczynski S. et al., 1992; Reich et al., 1990).
Metabolic control (measured by glucosylated hemoglobin-HbA1) was found to be negatively related with reading, math and basic academic skills (Kaufman et al., 1999). McCarthy, et al., in two large sample studies, showed that children with poor metabolic control performed worse in reading and had lower GPAs compared to children with good control (McCarthy et al., 2003; McCarthy et al., 2002). However, it did not relate to school performance in a six-year follow-up study of 87 diabetic children; although school performance and grades declined over time, verbal performance improved slightly (Kovacs et al., 1992).

E-9
Limitations. The cross-sectional design (with observations made at only one point in time) of most studies limits the weight of evidence for establishing linkages. Only one longitudinal study (with multiple observations made over time) was found, where academic performance was measured on more than one occasion (Kovacs et al., 1992). Overall, sample sizes for the studies reviewed above were small, from 20 to 100 children, with two studies including 200 or more subjects (McCarthy et al., 2003; McCarthy et al., 2002). Control groups typically have been used to account for different background experiences and environments. Some studies used siblings and others selected control groups to be demographically comparable in age, gender, lack of other diseases, child’s education level and parents’ socioeconomic status (SES). Other studies, however, did not adjust for such variables, even when differences were seen between groups (Ack et al., 1961; McCarthy et al., 2002). Samples were typically restricted to children of white ethnicity, even though, as a group they tend to receive the highest grades. Any attempt to generalize from these findings to other, more diverse populations is therefore of limited value. Implications. In summary, there is evidence that diabetic children may show subtle reductions in neuropsychological functioning. The importance of this to long-term academic achievement and learning has not been thoroughly explored. Diabetic children have a tendency to be absent more often, related to disease symptoms, and to have lower academic performance over time, particularly in reading. Most of these studies, however, have design flaws that limit the weight that should be assigned to their findings. Depression Prevalence. A depressed mood affects approximately four out of ten young people during any six-month period, while prevalence of major depressive disorder ranges from 0.4 to 6.6% (Anderson J., McGee, R., 1994; Fleming & Offord, 1990; Kashani et al., 1987; Lewinsohn et al., 1994; Lewinsohn et al., 1993). An investigation of an ethnically diverse sample of Texas middle-school students found an overall prevalence of 8.4% for major depression without impairment and 4.3% with impairment (Roberts et al., 1997). Of those with impairment, students of Chinese descent had the lowest prevalence (1.9%) while those of Mexican ancestry had the highest prevalence (6.6%). When a sample of ninth grade students from the Texas Lower Rio Grande Valley were evaluated, the prevalence of major depression and anxiety were both reported as 3.1% (Roberts et al., 2002). Depression and Academic Performance. The relationship between depression and anxiety and academic functioning among school children may operate in a cyclical fashion, both as risk factors and consequences of poor academic performance (Birmaher et al., 1996). Longitudinal research suggests that self-reported depressed mood among children, as early as the first grade, has been found to be predictive of their attention and concentration in the classroom in the short term (Edelsohn et al., 1992), of their academic functioning (grade point average and grade retention) in sixth grade, and of major depressive disorder in eighth grade (Ialongo et al., 2001). In adolescence, depression has been found to be related to grade point average and time spent doing homework (Field et al., 2001), to be preceded by dissatisfaction with grades and to result in school absenteeism (Lewinsohn et al., 1994). Using a two-wave longitudinal design, Rudolph, et al., (Rudolph et al., 2001) reported that academic disengagement related to transition to middle school was linked to increased school-related stress; and that increased school-related stress was subsequently linked to increases in depressive symptoms. Their additional finding that maladaptive self-regulatory beliefs were associated with low levels of academic engagement does suggest possible intervention strategies to prevent depression involving school-related issues.
Cross-sectional data from a nationally representative sample, aged 10-18, suggests that youth with high levels of depressive symptoms missed approximately 1 day more of school per month than children and youth with lower levels of depressive symptoms (Glied & Pine, 2002). Breuner, et al., (Breuner et al., 2004) report an association, from their retrospective study of 283 adolescents recruited through a headache clinic, between poorer school grades, symptoms of depression, and school absences. Headaches, anxiety symptoms were not found to be related to attendance. A small cross-sectional study among 79 high school seniors found that the group of adolescents who scored above the clinical cutoff for depression on a self-report measure spent less time doing homework and had a lower grade point

E-10
average (Field et al., 2001). There is also evidence that co-morbidity of diabetes and depression affects approximately 20% of youth with type 1 compared to 7% of youth without diabetes; but little is known about depression in youth with diabetes (Grey et al., 2002). A 1994 meta-analysis of 60 studies of depressive symptoms among children and adolescents with chronic medical problems (Bennett D. S., 1994) suggests that children with certain disorders (e.g., asthma, recurrent abdominal pain, sickle cell anemia) may be at greater risk of depressive symptoms than children with other disorders (e.g., cancer, cystic fibrosis, diabetes mellitus). Limitations. The validity of findings on depression and academic performance are limited by measurement issues; most of the studies cited above rely on children’s responses to questionnaires rather than clinical assessments of depression. While these scales have been utilized in many studies in different populations of children and adolescents, their reliability and validity for evaluating interventions aimed at academic performance may be open to challenge. Implications. The relationship between depression and academic performance is complicated; it appears that depression is both a risk factor and a consequence of poor academic performance. However, the prevalence of depressive symptoms, the risk of suicide, and the co-morbidity of depression with chronic medical problems such as asthma, support further research on the relationship between depression and academics. Epilepsy Prevalence. Epilepsy and seizures impact approximately 2.5 million Americans. Roughly 181,000 new cases of epilepsy are diagnosed each year and the incidence is greatest among those between the ages of 2 and 65 (Epilepsy Foundation). Specifically, 45,000 children under the age of 15 are diagnosed with epilepsy annually and 315,000 have epilepsy. Among those most affected by epilepsy are poor, inner-city, and immigrant children (Epilepsy Foundation). Epilepsy and Academic Performance. Children with epilepsy consistently demonstrate poorer academic achievement than those without epilepsy and those who suffer from other chronic illnesses such as asthma (Austin et al., 1998, 1999; Fowler et al., 1985; Huberty et al., 2000; Mitchell et al., 1991; Schoenfeld et al., 1999; Seidenberg et al., 1986). Seidenberg and colleagues (Seidenberg et al., 1986) compared the academic achievement of a sample of 122 children with epilepsy with national norms. They reported that as a group, the children with epilepsy made less academic progress than expected for their IQ levels and age levels. Arithmetic and spelling deficiencies were the most pronounced for the sample; however, reading comprehension and word recognition were also deficient. Mitchell et al. (Mitchell et al., 1991) also compared the academic achievement of a sample of 78 children with epilepsy between 5 and 13 years old who visited the Children’s Hospital Los Angeles Neurology Service with national norms. When IQ was not adjusted for, the epilepsy group reported very poor academic achievement. For example, 55% of the epileptic children were below the 25th percentile and 40% were below the 10th percentile for reading comprehension. After adjusting for IQ, 16% to 50% of the subjects were underachieving for each subscale of the Peabody Individual Achievement Test (Mitchell et al., 1991).
Austin, et al., (Austin et al., 1998) examined 117 children with epilepsy and 108 with asthma who
had been treated with medication for at least one year. They concluded that children with epilepsy were more at risk for poor academic achievement than those with asthma. Epileptics scored significantly worse in reading, mathematics, language, vocabulary, and composite than asthmatics (Austin et al., 1998). Austin et al. (Austin et al., 1999) also followed a sample of epileptic children and asthmatic children for four years. Again, they report that at follow-up the epileptic children continued to score significantly worse in all five achievement areas than the children with asthma. Huberty et al (Huberty et al., 2000) followed a sample of children with asthma and epilepsy for four years. At follow-up, they reported that the asthma sample improved more than the epilepsy sample for academic performance and learning. Fowler and colleagues (Fowler et al., 1985) examined a sample of 270 children who were being treated for a large array of chronic illnesses including arthritis, blood disorders, cardiac disease, chronic bowel disease,

E-11
chronic lung disease, cystic fibrosis, diabetes, epilepsy, hemophilia, sickle cell disease, and spina bifida. Children with epilepsy, sickle cell disease, or spina bifida scored the lowest on school achievement tests. They concluded that children with epilepsy were among three groups most at risk for academic difficulties; thus, they were more likely to receive special services, repeat a grade, or score more poorly on achievement tests than children with other chronic illnesses. Studies have indicated that academic achievement among children with epilepsy may be related to the severity of the epilepsy condition. Austin and colleagues (Austin et al., 1998, 1999) have reported that condition severity is related to academic achievement. For example, in a 1998 case-control study, they found that condition severity was significantly related to composite and language scores among the 117 children with epilepsy. Additionally, total adaptive functioning was significantly associated with composite, mathematics, and language scores (Austin et al., 1998). In a 1999 cohort study, Austin and colleagues found that subjects with high severity epilepsy on average scored 2 to 3 points below national norms while those with either inactive or low-severity epilepsy had mean scores comparable to national norms. Huberty et al. (Huberty et al., 2000) followed a sample of asthmatics and epileptics over four years and concluded that change in condition severity was significantly related to change in mean academic performance among their epileptic sample. Additional variables that are hypothesized to impact the influence of epilepsy on the academic achievement abilities of children include age of seizure onset, lifetime seizure frequency, seizure type, seizure control, and type of seizure medication. Individual level factors are hypothesized to include sex, age, behavioral problems and attention problems. Limitations. It does not appear that the challenges of diagnosis for epilepsy are as great as those for diagnosis for asthma, but the population of children diagnosed with epilepsy is relatively small compared to those with asthma or those who are overweight or at risk for overweight. Implications. While it appears that the severity of the epilepsy condition is strongly related to academic achievement, epilepsy affects a relatively small number of children. However, these children may be in need of special services and management that is appropriate for targeted, indicated, health services and mental health services in the school setting rather than for a more universal program for the majority of school children. Sickle Cell Anemia Prevalence. Sickle Cell Anemia has been diagnosed in over 2,000 Texas children since 1993. While 8 in every 100,000 people develop sickle cell anemia, those most affected by the condition include African-American and Hispanic children. For example, one in every 400 African-American children and 1 in every 1,200 Hispanic-American children are diagnosed with sickle cell anemia (Huberty et al., 2000; Texas Children's Sickle Cell Center & Texas Children's Hospital, 2005). Individuals with sickle cell anemia are often prone to episodes of pain that range from mild to extremely intense. Some of the precipitating factors of the pain include fatigue, strenuous activities, dehydration, exposure to cold, and stress. The episodes of pain can be managed with fluids, rest, heat, and pain medications as they are needed. Additional complications of sickle cell anemia can include acute chest syndrome, strokes, vision changes, hearing problems, infections, kidney problems, gallstones, and leg ulcers (Huberty et al., 2000; Texas Children's Sickle Cell Center & Texas Children's Hospital, 2005). Sickle Cell Anemia and Academic Performance. Several researchers have examined whether children with sickle cell anemia are more likely to suffer cognitive processing and academic functioning difficulties than their peers. Current literature has reported mixed findings (Bonner et al., 1999) (Brown et al., 1993). Fowler et al. (Fowler et al., 1988) compared neurological test results and academic functioning among 28 children with sickle cell anemia and 28 matched controls. With one exception, results indicated that there were no significant differences between groups on the overall verbal score, performance score, or the full-scale intelligence quotient. However, children with sickle cell anemia scored significantly lower on assessments of reading, spelling, and on a group administered standardized achievement test than their matched controls. Additionally, students with sickle cell anemia were absent from school on more

E-12
occasions and were more likely to receive academic special services (Fowler et al., 1988). Swift, et al (Swift et al., 1989) evaluated 21 children with sickle cell anemia and 21 sibling controls. There were significant differences on the Full Scale IQ assessments and almost all cognitive measures between the children with sickle cell anemia and their sibling controls. However, both groups demonstrated academic achievement that was appropriate for their intellectual ability. Wasserman et al. (Wasserman et al., 1991) examined 43 children with sickle cell anemia and 30 sibling controls. They reported that the children with sickle cell anemia missed a greater number of school days and scored significantly lower Performance and Full Scale IQ scores then their sibling controls. There were no significant differences between the groups on Verbal IQ, academic performance and the proportion placed in special education.
In 1993, Brown and colleagues examined 70 youth with sickle cell anemia and 18 sibling controls
(Brown et al., 1993). Children with sickle cell anemia scored significantly poorer than the non-disease children on a reading decoding achievement test and a sustained attention task. However, no significant differences were found for measures of intellectual functioning, language functioning and visual-motor tasks. A 2004 study by Schatz (Schatz, 2004) compared 50 children with sickle cell anemia and 36 matched controls. He reported that the children with sickle cell anemia were more likely to have repeated a grade and needed academic services. Cognitive ability and days of illness were recognized as unique predictors of academic attainment problems among children with sickle cell anemia. Hematocrit, parent education, and income were not unique predictors. Only cognitive ability was a unique predictor of academic achievement. Moreover, some studies have found no differences between children with sickle cell anemia and their peers. For example, Goonan et al. (Goonan et al., 1994) reported no significant differences between children with sickle cell anemia and their controls on attention and inhibitory impulse tasks. Furthermore, Richard and Burlew (Richard & Burlew, 1997) reported no significant difference on grades in mathematics or reading, standardized tests, and grade retention among 42 African-American children with sickle cell disease and 26 African-American controls. Both groups reported rates of absenteeism and below-average scores in math and reading. Evidence suggests that those who have suffered a stroke are more inclined to score lower on neuropsychological functioning and academic functioning than those who have not had a stroke (Armstrong et al., 1996). Armstrong and colleagues (1996) examined 194 children who were originally enrolled in the Cooperative Study of Sickle Cell Disease multi-center study. Among children with the homozygous condition (HbSS type), those with a history of cerebrovascular accident performed significantly poorer than those without a cerebrovascular accident on tests that assessed verbal knowledge and language abilities and visual-motor and spatial organization and integration. Children with MRIs suggestive of infarct also scored poorer than children with no MRI abnormalities on tests assessing arithmetic, vocabulary, reading, and visual-motor speed and coordination. In the year 2000, Brown and colleagues examined a sample of 63 youths with sickle cell anemia (Brown et al., 2000). Those who had suffered a documented clinical stroke performed more poorly on sustained attention and effort tasks than their peers. Children with evidence of a silent stroke on their MRI also demonstrated similar impairments in the areas of attention (Brown et al., 2000).
Wang and colleagues (2001) (Wang et al., 2001) longitudinally evaluated 373 children with sickle cell anemia who were participating in the Cooperative Study of Sickle Cell Disease. They performed several MRIs to assess whether the child had been exposed to a cerebral vascular accident. Their results indicated that those with sickle cell anemia who had suffered a silent infarct (n = 62) scored significantly lower on math and reading assessments, Full Scale IQ, and Verbal IQ than those with normal MRI findings. Nabors and Freymuth (2002) (Nabors & Freymuth, 2002) compared 12 children with sickle cell disease with a prior history of stroke, 14 children with sickle cell disease without evidence of stroke, and 13 sibling controls. This study found significant differences for attention and achievement between those with sickle cell anemia who had suffered a stroke and their sibling controls. However, when an outlier case was deleted, a significant difference in intelligence was also found between these two groups. Further, a significant difference in attention surfaced between those with sickle cell anemia who had suffered a stroke and those with sickle cell anemia who had not suffered a stroke. There were no

E-13
significant differences between those with sickle cell anemia who had not suffered a stroke and the sibling controls. Limitations. Some of the discrepancies between findings have been attributed to inconsistencies of subject selection and measurement techniques, a lack of consideration for potential covariates, and use of unreliable measurement techniques (Brown et al., 1993). Implications. It appears that the sickle cell anemia, especially strokes resulting from the condition, jeopardize academic achievement. Sickle cell anemia affects more children than epilepsy, but the numbers are still relatively small. However, similar to children with epilepsy, children with sickle cell anemia may be in need of special services and management that is appropriate for targeted, indicated, health services and mental health services in the school setting rather than for more universal programs. Sleep Disorders Prevalence. Sleep disorders in youth are attracting attention as sleep loss may be related to school schedules. Prevalence estimates for sleep disorders in youth are complicated by diagnostic criteria ranging from the neurological disorder of narcolepsy, to sleep disordered breathing, to life style-related sleep loss. Narcolepsy has been estimated to affect between four and 10 per 10,000 individuals with rare diagnosis among youth younger than 18 (Dahl et al., 1994) Sleep disordered breathing is estimated to affect between 1% and 4% of children and youth but this estimate may also be compromised by failures in diagnosis (Kaemingk et al., 2003). Prevalence studies of lifestyle-related sleep loss among school children describe that more than 40% of Ohio eighth-graders reported sleeping seven hours or less on school nights (Drake et al., 2003), middle and high school students in Maryland reported a mean of 6.7 hours on weekdays (Eliasson et al., 2002) and students from Rhode Island reported an average of 7.7 hours for students ages 13-14, and 7.25 hours for students age 16 (Wolfson A. R. & Carskadon, 1998). Sleep Disorders and Academic Performance. Studies examining the relationship between sleep disordered breathing or obstructive sleep apnea found a negative relationship between the existence of sleep abnormalities and school performance or memory. A retrospective study of a sample of 13- to 14-year-old children who ranked in the bottom quartile of their class, found that snoring between the ages of 2 to 6 was reported more frequently by their parents compared to children in the upper quartile of the class who were matched on age, gender, race, school and area of residence (Gozal & Pope Jr, 2001). A prospective study among first-graders in the lowest 10th percentile of their class from 32 public schools screened for sleep-associated gas exchange abnormalities through a rigorous overnight protocol of pulse oximetry, pulse signal and transcutaneous carbon dioxide tension identified 54 children (8.1% of the sample) with obstructive sleep apnea (Gozal, 1998). Of these 54 children, 24 underwent surgical adeno-tonsillectomy and 30 were not treated. The 24 treated children experienced a significant increase in school-reported academic grades from first to second grade compared to the non-treated children. A similar study screening children from Tucson schools, found 77 with an apnea/hypopnea index (AHI) > 5 indicative five or more apneas or hypopneas per hour of sleep time found significant decreases in learning and memory among this group with AHI > 5 compared to 72 children with AHI < 5. Scores on verbal IQ were similar between the two groups (Kaemingk et al., 2003).
Clinical studies also illustrate a relationship between sleep disorders and cognitive functioning related to academic performance. Among children with obstructive sleep apnea syndrome aged 5 to 12 years from a pediatric sleep clinic population, small deficits in executive functioning/attention as compared to normal children were found but these deficits were not related to disease severity. However, there were some improvements in attention after adeno-tonsillectomy (Owens et al., 2000), suggesting a mechanism for improvement of school performance. A clinical study of 5 children aged 11 to 14 years in a sleep disorder clinic found amelioration of symptoms of heavy nocturnal snoring and daytime somnolence and significant improvements in number of arithmetic problems solved after tonsillectomy and/or adenoidectomy (Guilleminault et al., 1982). Children from a pediatric endocrinology clinic who were

E-14
morbidly obese and diagnosed with obstructive sleep apnea were found to have lower scores on general memory, verbal memory, learning and vocabulary than those without obstructive sleep apnea (Rhodes et al., 1995). A laboratory study of children (mean ages 11.6 (intervention) and 12.3 (control)) with no medical, learning, attentional, behavioral or psychiatric disorders found that the children randomly assigned to the sleep-restricted group (5 hours in bed compared to 11 hours in bed) found significant impairment in executive function including abstract thinking, verbal processing and creativity in the sleep-deprived group compared to the controls with no difference in tasks requiring lower cognitive loads (Randazzo et al., 1998).
Cross-sectional surveys of youth provide mixed evidence for a relationship between lifestyle-related sleep loss and academic functioning. Among 3,120 Rhode Island high school students, those who report lower grades (Cs and below) sleep for approximately 25 fewer minutes and retire 40 minutes later than those who report higher grades (Wolfson A. R. & Carskadon, 1998). Among 1,200 high school and middle school students in Maryland, however, there was no consistent correlation between sleep time and children’s self reported GPA (Eliasson et al., 2002). Among 450 Ohio middle school students, there was a significant linear effect for self-reported total sleep time and school achievement and total sleep time was related to self-report of daytime sleepiness (Drake et al., 2003). A longitudinal study following 2,259 students from 6th to 8th grade found positive correlations between self-reported hours of sleep on school nights and self-reported grades at all cross-sectional timepoints (Fredriksen et al., 2004). However, decreasing amounts of sleep from 6th to 8th grade did not predict lower grades, although it did predict increased levels of depressive symptoms. The relationship between depression and sleep loss has been reported by others (Roberts et al., 1997) and may explain some of the relationship between sleep loss and academic performance. Limitations. The research on sleep related disorders resulting from sleep apnea syndrome is strengthened by clinical diagnostic criteria and longitudinal designs with treatments but limited by issues related to recruitment to sleep clinic studies or recruitment from sleep clinic populations and case-study designs. Studies of life-style related sleep loss are limited by their cross-sectional designs and self-report measures. Implications. The clinical studies do support the relationship between obstructive sleep apnea or sleep-disordered breathing and executive function that may be related to academic performance. Further evidence is provided by the increase in attention and academic grades among children treated for obstructive sleep apnea through tonsillectomy or adenoidectomy. For life-style related sleep loss, there is mixed evidence that fewer minutes of sleep on school nights are related to grades, some evidence that fewer minutes of sleep is related to daytime sleepiness, and some suggestion of a relationship between sleep loss and depression.

E-15
Table 1. Prevalence of Selected Chronic Health Conditions among Children and Adolescents Prevalence of Select Conditions Among Children and Adolescents Condition U.S. Texas Changes Remarks
Overweight – Obese 10.5%1
16%2 14.2%1 15.5%a,3 19.2%b,3 22.4%c,3
In U.S.: 4%4 – 1963-65 4%4 – 1971-94 7%4 – 1976-80 11%4 – 1988-94
a11th grade b8th grade c4th grade
Diabetes 0.17%d,5
0.26%f,6 0.20 – 0.25%d,e,7
Prior to twenty years ago, only 1% to 2% of diabetes cases were type 2. Now current estimates range from 8% to 45%14
dType 1 only eAccording to the the Texas Diabetes Council, there is no prevalence data for type 2 diabetes in Texas children. fType 1 and type 2
Asthma 13.0%8
12.2%g,15
8.3%h,15 5.8%i,15
15.0%9 In the U.S., from 1980 to 1996, asthma prevalence among children increased by an average of 4.3% per year, from 3.6% to 6.2%11
gChildren that have been told they have asthma hChildren who currently have asthma iChildren who had an asthma attack in last 12 months
Mild Emotional Disorders
9%j,10
30%k,10 Not available jModerate/Severe depression
kReport depression symptoms
Physical Inactivity 31.2%1 34.3%1 Texas data are for 2001 only
Undernourished 3.3%13 1.86%a,12 1.35%b,12 3%c,12
a11th grade b8th grade c4th grade
1. CDC, 2001, YRBSS 2. CDC, 1999-2002, National Health and Nutrition Examination Survey (NHANES) 3. Hoelscher D, 2004, American Journal of Public Health 4. CDC, 1963-2002, NHANES 5. CDC, 2004, http://www.cdc.gov/diabetes/projects/cda2.htm 6. CDC, 2002, http://www.cdc.gov/diabetes/pubs/estimates.htm 7. TDH, 2004, http://www.tdh.state.tx.us/diabetes/media/ 8. CDC, 2003, National Health Interview Survey 9. Arif A, et al, 2004, Journal of Paediatrics & Child Health 10. National Longitudinal Study of Adolescent Health, 2002, J. Am. Acad. Child Adol. Psyc. 11. CDC, 1996, http://www.cdc.gov/asthma/children.htm 12. Hoelscher D, 2004, Unpublished SPAN data 13. Wang Y, et al. 2002, Am J Clin Nutr. 14. Aye & Levitsky, 2003, Curr Opin Pediatr 15. CDC, 2004, Division of Adolescent and School Health, Fact Sheet on Asthma

E-16
Table 2. Summary of Research Findings Linking Chronic Conditions and Academic Performance Impact of chronic conditions on school performance
Group Condition Number of Studies
Risk Modifier Strength of Evidence
Measures Impact type
Overweight-Obesity Reading (-) 1 LMath (-) 1 LSchool/grade completion (-) 1 CSConsider being good student (-) 1 CS
Diabetes School attendance (-) 4 CCGPA (-) 2 1 CP, 1 CSReading (-/0/+) 6/1/1 5 CC, 1 CS/CC/CCMathematics (-/0/+) 2/1/1 CC/CC/CCComprehension (-) 1 CCLanguages * (-) 2 CCHumanities (-) 1 CCScience (-) 1 CCKnowledge overall (-) 1 CCCore total score (-/+) 1/1 CS/CCLearning abilities (-/0) 1/1 CC/CCSuccessful grade completion (-) 2 CCRemedial/resource room inst. use (-) 2 CC
Asthma School attendance (-) 8 4 CS, 4 CCReading (-/0) 1/2 CS/CS, CCMathematics (0) 2 1 CS, 1 CCLanguage (0) 1 CCAcademic achievement score (0) 1 CCSchool marks/GPA (0) 2 CS, CCLearning abilities (-) 1 CSSuccessful grade completion (-/0) Income CS/CSSelf-evaluation (-) 1 CC
Depression School attendance (-) 3 no info, national survey-CS, RSGPA (-) 4 L, no info, R, CSSuccessful grade completion (-) 1 LHomework completion time (-) 1 no infoAcademic disengagement (-) 1 short-term two wave L
Achievement Test (SAT-9) (-) 1 State-CSGPA (-) 1 CS & small numbersMathematics (-) 1 State-CSAcademic performance (general) (-)(SE) 3 Review, CS, CS
Undernourished Academic performance (-) 2 no-info, CSProblem solving (-) 2 no info
Performance Consequences
Physical inactivity
Chronic Adverse Conditions Preventable by School-based Interventions
Note: Impact on academic performance is caused either by specific conditions, factors or their respective complications. Results do not reflect gender differentiation.* written language, English, language arts. CS, cross-sectional; CC, case-control; L, longitudinal; CP, cohort prospective; R, retrospective; SE, some effect.
Review of the prevalence data presented in Table 1 suggests that overweight is by far the chronic
health problem affecting the largest number of children, followed by asthma. Type 1 diabetes affects fewer children, but the prevalence of type 2 diabetes appears to be increasing. There is suggestive but inconclusive evidence that the increase is related to the prevalence of being overweight. Accordingly, public investment in programs for the prevention or management of overweight and asthma can be justified on the grounds that they affect the largest number of children and their families. Nevertheless, the evidence for the impact of these two conditions on academic performance is less conclusive. From the earlier discussion summarized in Table 2, we find that asthma appears to affect absenteeism, but only affects the academic performance of children from poorer households. In the case of overweight, the

E-17
findings of lower test scores are based on a single study. In contrast, diabetes has been shown to affect both absenteeism and academic performance. To the extent that overweight is a primary risk factor for type 2 diabetes, however, we find support for the argument that, at least indirectly, being overweight can affect performance. The question then is, what do we do about it?
The next section examines the research on whether school-based interventions are effective in preventing or managing certain chronic health conditions and factors related to these conditions. We pay special attention to the health conditions that appear to compromise academic performance. Later, we will consider whether such interventions also make a difference in remedying deficits in academic performance. Section 2: School-Based Interventions and Their Links to Health Conditions
There is a strong body of research evaluating the effect of school health programs incorporating physical education and/or nutrition service interventions on overweight and factors related to overweight such as physical activity, fat consumption and television-watching. At the elementary school level, the Eat Well and Keep Moving Program was effective in improving dietary intake of students and reducing television viewing (Gortmaker et al., 1999a). Another elementary school program designed to reduce media usage demonstrated decreases in indicators of overweight (BMI, triceps skinfold, waist circumference) along with decreases in television viewing reported by both child and parents (Robinson, 1999). The Bienestar program, a diabetes prevention program, demonstrated improvements in fitness scores and dietary fiber intake, had no effect on dietary saturated fat intake or percentage of body fat, but did find improvements in mean fasting capillary glucose levels and dietary fiber intake (Trevino et al., 2004). The SPARK elementary school program demonstrated increased physical activity during PE class for boys and girls and fitness for girls (Sallis et al., 1997) but had minimal effect on indicators of overweight (Sallis et al., 1993).
The Child and Adolescent Trial for Cardiovascular Health (CATCH) was a multi-component, multi-year coordinated school health project designed to decrease fat, saturated fat and sodium in children’s diets, increase physical activity and prevent tobacco use. The experimental trial of CATCH was conducted in 96 schools (56 intervention, 40 control) in 4 sites (CA, LA, MN, TX). At the completion of the trial, students exposed to the intervention consumed less fat and participated in more physical activity outside of school; school cafeterias provided meals that were lower in fat; and students were more physically active during physical education classes (Luepker et al., 1996). The CATCH cohort of students was re-measured three years after the original intervention began (in 8th grade), and positive effects were maintained: intervention students had significantly lower fat intakes and higher levels of physical activity compared to control students (Nader et al., 1999). In a quasi-experimental study of CATCH (now known as the Coordinated Approach to Child Health) implemented in 8 schools in El Paso, Texas among 896 third-graders, 93% of whom were Hispanic, the rate of increase in risk for overweight (greater than 85th percentile) and overweight (greater than 95th percentile) from third to fifth grade was significantly lower for both boys and girls in the CATCH schools compared to those in the comparison schools (Coleman et al., 2005).
At the middle school level, the Planet Health program was effective in reducing television hours among both girls and boys, and increasing fruit and vegetable consumption. Among girls, each hour of reduction in television viewing predicted reductions in obesity (Gortmaker et al., 1999b). The middle school MSPAN program improved moderate to vigorous physical activity in physical education classes, more for boys than for girls (McKenzie T. L. et al., 2004).
A review published in the Journal of Pediatrics in June of 2005 (Strong et al., 2005) of the effects of physical activity on health outcomes such as overweight and obesity, cardiovascular health, asthma, mental health, injuries, musculoskeletal health and fitness, and academic performance concludes that there is sufficient evidence to support a recommendation of 60 minutes per day of moderate to vigorous physical activity for school-age youth.

E-18
“Evidence-based data are strong for beneficial effects of physical activity on musculoskeletal health, several components of cardiovascular health, adiposity in overweight youth, and blood pressure in mildly hypertensive adolescents. Evidence is adequate to make informed judgments about the beneficial effects of physical activity on lipid and lipoprotein levels and adiposity in normal weight children and adolescents, blood pressure in normotensive youth, other cardiovascular variables, self-concept, anxiety, and depression symptoms, and academic performance.” (Strong et al., 2005, p. 736)
There is also a large body of literature examining the effect of physical activity on mood-related mental health issues such as depression and anxiety and concluding that physical activity benefits both clinical and nonclinical populations across the lifespan (Dunn et al., 2001; Landers & Petruzzello, 1994; Morgan, 1994; Office of the Surgeon General, 1996). Further, there is evidence that interventions designed to increase physical activity are effective in decreasing depressive symptoms among high-risk youth, free-living youth, and clinic populations (Hawkins et al., 1999; Norris et al., 1992; Tortolero et al., 2001). Unfortunately, the results of school-based depression prevention programs have been mixed. Possel et al (Possel et al., 2004) evaluated the LISA-T program based on cognitive-behavioral therapy among 648 8th graders and report that an increase in depressive symptoms was prevented in the non-depressed intervention group compared to the control over six months and depressive symptoms decreased in the adolescents with subsyndromal depression, concluding that the program was effective in the short term for 8th graders with minimal to mild depressive symptoms. In their report of the Problem Solving for Life program designed to promote cognitive restructuring and provide problem-solving skills training for eight graders, Spence et al. (Spence et al., 2005) conclude that the program was not demonstrated to be effective in preventing or managing depression at one- or four-year follow-up despite promising results in the short term (Spence et al., 2003, 2005). Gilham et al (Gillham et al., 1995), however, found that their program for 5th and 6th grade children demonstrated no effect at 12-month follow-up, an effect at 2 years, but no difference at 3 years. Delayed benefits have been noted by others, but a recent Cochrane review of psychological and educational interventions for the prevention of depression in children and adolescents concluded that school-based preventive interventions demonstrated weak effects on adolescent depression and, moreover, little effects remained over long-term follow-up. Perhaps the physical activity interventions would be as effective in improving depressive symptoms as the psychological or educational intervention.
School-based programs for children with persistent asthma hold promise for improving disease management, reducing disease severity and decreasing school absences. Tinkelman (Tinkelman & Schwartz, 2004) reports a case study of the DSCM asthma school program incorporating a respiratory nurse care manager, web-based interactive educational tools, and an interactive asthma diary for 41 elementary and middle school public school students and a telephonic educational disease management program for their parents. At 6 months students had 2/3 fewer unscheduled doctor visits, daytime frequency of symptoms dropped by 62% and nighttime frequency of symptoms dropped by 34%. Anderson (Anderson M. E. et al., 2004) reports a matched comparison study in which children who were enrolled in a special school for children with chronic diseases were matched with children attending regular schools but utilizing the same health care system as the children in the special school. Children were matched on age, annual hospitalizations and emergent care visits for asthma, and length of time in the health care system. Approximately 95% of the children were minority and more than 85% were on Medicaid. The daily structured routine of asthma management for the special school students improved the number of hospitalizations, emergent visits and follow-up visits for asthma compared to the comparison students. However, the school in this study is a highly specialized setting with resources beyond those in a typical school setting, limiting the generalizability of this program to regular public schools.
Clark (Clark et al., 2004) reports a study among 14 elementary schools in Detroit which included
components for children, their parents, classmates and school personnel to enable asthma management. Children in the treatment condition with persistent disease reported fewer nighttime and daytime symptoms and parents of treatment children scored higher on an asthma management index. McEwen et

E-19
al (McKewen et al., 1998) report a case study of 22 African American inner city children aged 5 to 12 years managed twice daily at their school clinic and treated with inhaled anti-inflammatory medications. The program incorporated regular inhaled anti-inflammatory medication and was found to reduce the need for inhaled bronchodilators, improve peak flow readings and reduce complaints of nocturnal asthma symptoms. Limitation in the collection and interpretation of absenteeism data precluded findings on absenteeism in this study (McKewen et al., 1998). Christiansen. et al., (Christiansen et al., 1997) report that their five-session bilingual, interactive curriculum teaching about asthma in a school setting did enhance peak flow meter technique and inhaler technique and reduce asthma symptom scores among the 27 intervention students compared to the 15 control asthmatics. While the research on school-based asthma programs is limited by issues of design and sample size, the findings suggest promise for management of asthma symptoms and savings in health care utilization.

E-20
Table 3. Summary of Research Findings Linking School-Based Interventions and Chronic Conditions The effect of school programs on health
Conditions School Health Programs Level of intervention Intermediate Health Indicator Type of
effectHealth Outcome
IndicatorType of effect
Program and Intervention Components
Overweight/ Obesity
"Eat well and keep moving"- Gortmaker et al., 1999
Elementary Dietary intake / Television viewing (+/+) 1. physical activity, 2. dietary intake, 3. television watching
Robinson, 1999 Elementary Television viewing (+) BMI / triceps skinfold / waist circumference
(+/+/+)
SPARK Sallis et al., 1993 and 1997
Elementary Physical activity for both sexes / Fitness for girls
(+/+) Indicators of overweight
(NE) Physical activity
CATCH Luepker et al., 1996 Elementary Fat intake / Physical activity out of school / Physical activity in school / Less fat containing food provided by school cafeterias
(+/+/+/+) Decrease fat, saturated fat and sodium intake. Increase physical activity
CATCH post-intervention Nadar et al. 1996 and quasi-experimental CATCH Coleman et al., 2004
Elementary Fat intake / Physical activity (+/+) Overweight risk reduction
(+) Physical activity and nutrition
Planet Health - Gortmaker et al., 1996
Middle school Fruit and vegetable intake / television viewing reduction
(+/+) Nutrition
MSPAN - McKenzie et al., 2004
Middle school Vigorous physical activity during PE classes
(+)1 Physical activity
Diabetes "Bienestar Program" Trevino et al. 2004
Fitness score / dietary fiber intake / mean fasting capillary glucose / dietary saturated fat intake
(+/+/+/NE) Percentage of body fat
(NE)
Asthma DSCM asthma control school program - Tinkelman & Schwartz, 2004
Elementary and middle school
Unscheduled doctor visits / asthma daytime symptoms frequency / nighttime symptoms frequency
(+/+/+) Program incorporated 1. a respiratory nurse care manager, 2. web-based interactive educational tools, 3. interactive asthma diary for student, and 4. telephonic educational disease management for parents.
Anderson et al., 20042 Number of hospitalizations / emergent visits / follow-up visits
(+/+/+) Comparison of special school for children with chronic conditions with regular schools
Clark et al., 2004 Elementary Daytime and nighttime symptoms / parent scoring on asthma management index
(+/+) Enable disease management through intervention on students, parents, class mates and school personnel
McKewen et al., 1998 Need to use inhaled bronchodilators / peak flow readings / nocturnal asthma symptoms
(+/+/+) Twice daily asthma management
Christiansen et al., 1997 Peak flow meter technique / inhaler technique
(+/+) Asthma symptoms (+) Five-session bilingual, interactive curriculum teaching about asthma
Mild emotional disorders
Possel et al., 2004 Middle School (8th grade)
Depressive symptoms in the short term
(+) LISA-T program based on cognitive-behavioral therapy
Spence et al., 2005 Middle School (8th grade)
Preventing or managing depression at one or four year follow-up
(NE) Problem Solving for Life program designed to promote cognitive restructuring and provide problem solving skills
Gillham et al., 1995 Middle School (5th and 6th grade)
Depression at: 12mo / 2 yr / 3 yr
(NE/+/NE) Program designed by authors for students in the 5th and 6th grade to be followed after 12 months, 2 years and 3 years
Physical Inactivity
Under-nourishedNE, no effect, 1 more for boys than for girls, 2 generalizability of this study to regular schools is limited as special schools have highly specialized setting with resources beyond those of typical school programs.
Studies included in the "overweight/obesity" section aim to reduce the condition through increased physical activity and improved nutrition.

E-21
Section 3. School-Based Interventions and Their Links to Academic Performance What is the evidence that school-based interventions designed to promote physical activity and good nutrition or to manage asthma have a positive impact on academic outcomes including grades, test scores, attendance and other factors related to academic outcomes such as attention/concentration, cognitive functioning and classroom behavior? Careful review of the literature on the impact of school programs on academic outcomes has revealed one salient fact – there are few school health programs that have measured factors related to academic performance and implemented rigorous outcome evaluations. The majority of school health programs are designed to test the effect of the program on the health issue and prevention researchers have been slow to include academic factors of interest to the education community. The paucity of evidence is most likely due to the economic and scientific challenges of implementing stringent research designs with adequate sample sizes in the school setting, and a lack of inclusion of academic measures, rather than a lack of connection between school health programs and academic outcomes. However, this paper will discuss the evidence that is available and note school health programs that have been successful in impacting health and health-related factors but that have not measured academic factors. School-Based Physical Activity Interventions
A rigorous evaluation of Project SPARK, an elementary school physical education program,
demonstrated significant gains for reading, losses for language, and no differences for math scores on a standardized test, suggesting that, even with time taken away from the academic program for physical education, overall academic functioning was not impaired (Sallis et al., 1999). Another physical education program incorporating fitness or skill training for 75 minutes a day, compared to usual physical education offered three times a week for 30 minutes, demonstrated no significant decrease in test scores compared with controls (Dwyer et al., 1979). These studies suggest that implementation of physical education will not impair academic achievement on standardized tests, and implementation of asthma management programs may enhance academic grades for low-income asthmatic children.
The association between fitness and school performance has been examined by the California
Department of Education utilizing a state-required physical fitness test reported for all 5th, 7th and 9th grade students since 2001 and the Stanford Achievement test. This cross-sectional analysis demonstrated a significant linear association between standardized test scores (Stanford Achievement Test Ninth Edition [SAT-9]) of almost one million students (grade 5 n=353,000; grade 7 n=322,000; grade 9 n=279,000) and their fitness scores on the Fitnessgram, a teacher-administered physical fitness test measuring cardiovascular endurance, body composition, abdominal strength and endurance, trunk strength and flexibility, upper body strength and endurance, and general flexibility (California Department of Education & Standards and Assessment Division, 2002; Grissom, 2005). A dose-response effect was noted for all three grades so that highest SAT-9 scores were reported by students who met three or more standard levels among the six physical fitness measures, particularly among females, and particularly for mathematics rather than for reading scores. While the Fitnessgram does not represent a school program, but rather a measurement of fitness, these data suggest a relationship between levels of physical activity sufficient to develop and maintain fitness and academic performance as measured by a standardized achievement test. A recent meta-analysis of 44 studies pertaining to physical activity and cognition in children (Sibley & Etnier, 2003) concluded that exposure to physical activity was associated with an improvement in cognition of ½ a standard deviation – a relatively strong effect. While physical activity may be very important for preventing obesity, diabetes and depression in children, it most likely will also improve academic performance.
Unfortunately, neither CATCH, nor Planet Health, nor Eat Well and Keep Moving, nor Bienestar measured factors related to academic outcomes in the evaluation of their programs. However, a study is currently in the planning stages to test the effect of CATCH plus classroom physical activities on performance on standardized tests and factors related to academic performance such as attention problems, learning problems, study skills, attitudes to schools, attitudes to teacher, and academic

E-22
competence. This study, PASS and CATCH, will go into the field in August 2005 in eight Texas schools and is funded by the Centers for Disease Control and Prevention.
School-Based Nutrition Interventions
Some students may not achieve academic superiority because they are undernourished, thus hindering their ability to learn. It has been suggested that even moderate undernutrition can potentially have long-lasting effects on a child’s cognitive development and performance in school (Center on Hunger and Poverty and Nutrition Policy, 1998). In addition, research shows that failure to eat breakfast can have adverse affects on children’s ability to problem-solve in school (Pollitt, 1995; Pollitt et al., 1981; Pollitt et al., 1982). To further reinforce the importance of breakfast and school performance, Meyers, Sampson, Weitzman, Rogers and Kayne (Meyers et al., 1989) tested the hypothesis that low-income children in Massachusetts participating in the School Breakfast Program (SBP) for the first time would show improvements in their standardized achievement test scores. These test scores would be compared with the child’s own performance when no breakfast program was presented. The SBP was implemented in 16 elementary schools in the Lawrence school district in late January 1987, prior to the start of the second school semester of the 1986-1987 school year. Thus, the Massachusetts standardized achievement test being compared was the one in 1986 when no SBP was in place and in 1987 after the SBP had been operational for three months. Results showed that students participating in the SBP had significantly increased their scores on the battery total scale and the language score. There were also marginally greater scores for reading and mathematics (Meyers et al., 1989). Further research in Boston found that children who improved their nutritional intake in a school breakfast program decreased their absences and improved their math scores, although no improvements were seen for reading, social studies or science (Kleinman et al., 2002).
More recent studies have documented similar results of higher test scores in nourished children compared to their undernourished counterparts (Murphy et al., 1998; Powell et al., 1998). These studies also found that the children participating in the SBP had lower absence and tardiness rates than those who did not participate in the SBP (Murphy et al., 1998; Powell et al., 1998). Other researchers are focusing on the child’s social and emotional well-being of being properly nourished and have found that undernourished children tend to be less active, more anxious and interact less with their classmates and peers (Barrett et al., 1982; Rampersaud et al., 2005). Schools are a place where children and adolescents socialize with others and develop friendships. An undernourished individual will not have the energy to participate in school activities with their peers (be it on the playground or in the classroom) and may become socially withdrawn (Barrett et al., 1982).
Since eating patterns and other health-related habits tend to be established in early childhood, (Munoz et al., 1997) and given that schools have the potential to shape and direct the development of the students, nutrition education programs implemented and adopted by schools may play a large role in helping improve a child’s chance for higher academic attainment along with improvements in their health status related to nutritional intake. Many elementary school children depend on school meals, deriving approximately 50% to 60% of total daily intake of energy, protein, cholesterol, carbohydrate and sodium from school meals (Nicklas & Johnson, 2004). School nutrition programs will be very important in efforts to prevent obesity in children and are also likely to have a positive impact on academic performance.
School-Based Asthma Management Interventions
Few school-based asthma management programs have been evaluated. The most rigorous evaluation was conducted by Evans et al (Evans D. et al., 1987) using random assignment of 12 New York schools within matched pairs. Participants included 239 low-income predominantly Hispanic and African-American students from 3rd to 5th grade who experienced at least three episodes of asthma in the last year. The asthma self-management program consisted of six 60-minute sessions on asthma management skills for the students and written information on curriculum and activities for the parents. Asthma program students performed significantly better than control students on classroom grades in

E-23
mathematics, science and oral expression, but no effect of the program was evident for standardized test scores for reading or math, for teacher-rated classroom behavior, or for attendance. The Tinkelman (Tinkelman & Schwartz, 2004) case study of the DSCM asthma school program incorporating a respiratory nurse care manager, web-based interactive educational tools, and an interactive asthma diary for 41 elementary and middle school public school students did report a drop in school absences by 2/3. However, the Christiansen (Christiansen et al., 1997) study of the five-session bilingual, interactive curriculum teaching about asthma in a school setting did not report an effect on school absences among the 27 intervention students compared to the 15 control asthmatics. The Clark (Clark et al., 2004) randomized controlled trial is perhaps the strongest study in terms of design and sample size and this study found higher grades for science but not for reading, math or physical education. Parents of treatment children reported fewer absences attributable to asthma in the past three months, but no differences in school absences were noted in school records. The mixed results for the effects of the programs on school attendance is disheartening given that asthma is considered to be the leading cause of school absences (Tinkelman & Schwartz, 2004). However, the studies are limited by weaknesses in design and sample size and challenges in the accurate measurement of school absences along with the cause of the absence. The paucity of research linking asthma programs with academic performance suggests that more work needs to be done in both the development and implementation of school-based asthma management programs and the evaluation of those programs. School-Based Mental Health Interventions
Gall and colleagues (Gall et al., 2000), found that among 13- to 18-year-old public high school students, two months after they received school-based mental health and counseling services, absenteeism decreased by 50% and tardiness decreased by 25% (p<.0001). Students referred for mental health services significantly decreased absence from school by 2/3 of a day while those not referred increased both absenteeism and tardiness (p<.0001). Although, as discussed in a recent review of the literature by (Geierstanger et al., 2004), the evidence for a relationship between school-based health centers and academic performance is limited by the small number of studies and their methodological shortcomings, there is sufficient evidence to support SBHC for improvement of intermediate outcomes related to academic performance and for contributions to the educational process. These studies are not specific to depression programs but do suggest that the school component most likely to be responsible for depression prevention programs may have success in impacting academic factors such as absenteeism. Unfortunately none of the depression programs evaluated and included in the Cochrane review (Merry et al., 2004) have included academic factors as outcome measures.
Coordinated School Health Programs
School health programs are currently considered within the context of the Coordinated School Health Program (CSHP) model. CSHP provides policies, activities and services in an organized manner to promote the health of school students and staff through: comprehensive school health education; family and community involvement; physical education; school counseling, psychological, and social services; school health services; school nutrition services; and school-site health promotion for staff and faculty (McKenzie F. D. & Richmond, 1998). Programs may be designed for the general population of school children, such as those that target physical activity and nutrition, or for indicated groups of children identified with health problems such as asthma. CATCH is an exemplary coordinated school health program that directly incorporates health education, physical education, food services and parental involvement and usually involves health services and staff health promotion activities (Hoelscher et al., 2001).
Impact on Academic Performance
Chronic conditions such as obesity, asthma and diabetes negatively impact school performance. Coordinated School Health Programs improve the health of students. It logically follows these school-based health programs will result in better school performance. This has not been submitted to the scrutiny of an evidence-based approach. The problem partially lies in the fact that programs designed to

E-24
intervene upon these chronic conditions measure health outcomes as opposed to academic outcomes or school performance. This is not to imply there is no connection between school health programs and academic outcomes. More research exploring this link is necessary before it can be determined. There is some evidence that increasing physical activity and providing appropriate nutrition services, such as a school breakfast program, may improve school performance and reduce the incidence of certain chronic conditions. The recommendations made in this report will be based on this evidence.
A summary of the studies reviewed appears in Table 4 below. As noted earlier, most of the studies that considered the impact of interventions focused on health as their endpoint and not on academic achievement. Part of this may have been a function of the interests of the funders; those with health missions were not accountable for improvements in academic performance. Studies of interventions that targeted obesity, for example, seldom included any academic measures. The exceptions were few, but notable. We have several excellent studies of physical inactivity that demonstrate academic improvements. To the extent that obesity is highly correlated with physical inactivity, we could posit an indirect effect from programs designed to increase physical activity. The same is true of diabetes. To the extent that physical activity is a preventative against the onset of type 2 diabetes, we can infer an indirect effect through diabetes reduction as well.
As the table indicates, we have primarily three areas of scientifically documented health interventions that yield academic dividends: physical activity, asthma and under-nourishment. We will address the consequences of this in a later section.

E-25
Table 4. Summary of Research Findings Linking School-Based Interventions and Academic Performance
The effect of school programs on academic performance
Conditions School Health Programs Level of intervention Study Design Academic Performance
Indicator Type of effect Program and Intervention Components
Overweight/ Obesity
Diabetes
Asthma (Tinkelman et al., 2004) DSCM asthma school program.
Elementary and middle schools
Reduction in absenteeism (+) DSCM asthma school program incorporated a respiratory nurse care manager, web-based interactive educational tools, and an interactive asthma diary for students.
Evans, D., Clark, N.M., Feldman, C.H., Rips, J., Kaplan, D., Levison, M.J., Wasilewski, Y., Levin, B., & Mellins, R.B. (1987). A school health education program for children with asthma aged 8-11 years. Health Education Quarterly; 14(3):267-279.
Elementary (grades 3-5)
Experimental Longitudinal Intervention. Random assignment of schools within matched pairs. Pretest-posttest analysis of change in achievement.
Academic grades / Mathematics / Science / Oral expression / Standardized test scores for reading/ Standardized test scores for math / Teacher-rated classroom behavior / Attendance
(+/+/+/+/NE/NE/NE/NE)
Asthma self-management program consisting of six 60-minute sessions on asthma management skills; parents received written information about curriculum and activities.
Christiansen et al., 1997. Absenteeism (NE) Five-session bilingual, interactive curriculum teaching about asthma in a school setting.
Clark et al., 2004. Randomized controlled trial.
Science grades / reading / math / physical education / absences
(+/NE/NE/NE/D)
Mild emotional disorders
Gall at al., 2000. High school (13-18 yrs old)
Reduction in absenteeism / Reduction in tardiness
(+/+) Students received school-based mental health and counseling services for two months.
Physical Inactivity
SPARK Sallis JF, McKenzie TL, Kolody B, Lewis M, Marshall S, Rosengard P (1999). Effects of health-related physical education on academic achievement: Project SPARK. Research Quarterly for Exercise and Sport; 70(2):127-34.
Elementary Experimental Longitudinal Intervention. Random control study of a 2-year intervention.
Metropolitan Achievement Test: Reading / Language / Math / Composite basic battery scores
(+/-/NE/NE) Project SPARK: implemented in 7 public elementary schools in California that incorporated moderate to 30 minute classes: 15 minutes of health-fitness activity (high intensity aerobic) and 15 minutes of a skill-fitness activity for a minimum of 3 days per week through the school year (36 weeks).
Dwyer T, Coonan WE, Worsley LA, Leitch DR (1979). An assessment of the effects of two physical activity programs on coronary heart disease risk factors in primary school children. Community Health Studies; 3:196-202 and Dwyer T, Coonan WE, Leitch DR, Hetzel BS, Baghurst RA (1983). An Investigation of the effects of daily physical activity on the health of primary school students in South Australia. International Journal of Epidemiology; 12:308-313.
Elementary Experimental Longitudinal Intervention. Random assignment of students to control or to a 14-week intervention: three group comparison (Fitness; Skill; and Control).
Two Australian education standardized tests: ACER arithmetic test/GAP reading test; and teachers’ ratings of classroom behavior.
(+/NE/+) The Fitness and Skill groups engaged in organized activity daily for 15 minutes in a morning class and 60 minutes in an afternoon class period—the Fitness group engaged in aerobic activity; the Skill group engaged in non-strenuous motor skills ; the control group received three 30-minute periods of usual physical education per week.
Under-nourished
Murphy MJ, Pagano ME, Nachmani J, Sperling P, Kane S, Kleinman RE (1998). The relationship of school breakfast to psychosocial and academic functioning: Cross-sectional and longitudinal observations in an inner-city school sample. Archives of Pediatrics & Adolescent Medicine; 152(9):899-907.
Elementary and middle schools
Quasi-experimental NRNC study. Measures taken at baseline and 4 months after exposed to intervention, assessed change in breakfast program participation and outcomes among students whose participation was often, sometimes, rare, or never.
Math grades / attendance / tardiness
(+/+/+) Universally Free school breakfast program (UFSBP). Participated Often (ate 80% or more meals when present at school); Sometimes (ate 20% to 79%); or Rarely (ate less than 20% of meals when present at school).
Meyers AF, Sampson AE, Weitzman M, Rogers BL, Kayne H (1989). School breakfast program and school performance. American Journal of Diseases of Children; 143:1234-1239.
Elementary schools
Quasi-experimental (NRC) conducted for one school year: pre-test measured in 2nd semester of 1986-7 school year; post-test measured in 2nd semester of 1987-88.
CTBS total score / language subscore / math / reading / tardiness reduction
(+/+/+/+/+) School Breakfast Program (SBP) offered to low-income students enrolled in public elementary schools.
Kleinman et al., 2002. Reduction of Absenteeism / math scores / reading / social sciences / science
(+/+/NE/NE/NE)
School Breakfast Program implemented.
CTBS, Comprehensive Tests of Basic Skills battery; NE, no effect; D, disputable - parents of treatment children reported fewer absences attributable to asthma in the past three months, but no differences in school absences were noted in school records.
After an extensive search of the literature, no evidence-based interventions specifically for overweight/obesity were found that directly improved academic performance.
After an extensive search of the literature, no evidence-based interventions specifically for diabetes were found that directly improved academic performance.

E-26
This report also seeks to determine the reverse relationship: that of academic performance on health. This relationship has been observed in the short-term. Studies in school aged children have indicated that poor school performance predicts health-compromising behaviors and physical, mental and emotional problems (Crum et al., 1998; Kessler et al., 1995; Miller D. S. & Miller, 1997; Young & Rogers, 1986). The long-term implications of academic performance on health status are not as clear, primarily because studies that assess health measures such as health literacy, mortality, infant mortality, morbidity, subjective health, risk factors and use of health care observe level of education as opposed to academic performance. There is a body of evidence that suggests academic performance, particularly test scores, predicts level of attainment. An obvious example is the acceptance of measures such as the Scholastic Aptitude Test (SAT) and Graduate Record Examination (GRE) as selective entrance requirements to colleges and graduate programs respectively, and as such they serve as predictors of higher education attainment. The studies that explore these relationships were not evaluated since they do not directly measure health outcomes, and they are found within a separate discipline. As stated, the relationship between academic performance and future attainment is assumed, so for this report, the question subtly shifts from how academic outcomes affect health to how education level affects health. However, focus should not merely be on the linear relationship but also the intergenerational and cyclical nature between education and health. Parents and families profoundly influence their children. Those children develop as adults and form family units of their own. The interplay of health and education is perpetuated in the family cycle. Future generations will be influenced by what is done in the present. From this point forward, the report will more fully focus on how education level affects health outcomes.
The next part reports on research that closely examines the link between educational attainment and adult health status. Here, the research has been more exploratory and has generated a range of alternative explanations. We consider a wide sample of these. In sharp contrast to Part One, however, there is little attention given to interventions designed to take advantage of this link. While there is some discussion of measures to attenuate the adverse effects of low educational attainment, say, through literacy campaigns, those in this field with an interest in educational interventions typically focus on early childhood as the most advantageous place to intervene.
PART TWO: Educational Attainment and Adult Health Status
Section 1. Background on Social Status and Educational Attainment
Many studies have identified the importance of socioeconomic status (SES) in determining individual health. SES refers to the individual’s position or status in society’s hierarchy. Income, education, occupational status and social class are all indicators of SES and have been shown to be important determinants of health (Antonovsky, 1967; Backlund et al., 1996; Evans R. G. et al., 1994; Kunst M. & Mackenbach, 1994; Marmot M. et al., 1987; Marmot M. & Shipley, 1996; Sorlie et al., 1995). Moreover, some studies report that disparities in all-cause mortality by socioeconomic class have been increasing rather than declining in recent years (Kunst A. et al., 1990; Pappas et al., 1993).
The negative effect of poverty on health has been known for centuries with references going back
to the ancient Greeks and Chinese (Krieger, 2001; Porter, 1997). Several historical records document poorer health among less advantaged populations. For example, Floud and Harris (1996) (Floud & Harris, 1996) report that, at the beginning of the 19th century, 14-year-old boys attending the Royal Military Academy at Sandhurst, the elite military school in Britain, were nearly six inches taller than their counterparts in the Marine Society, who came from the lower social classes. Similarly, Rowentree in 1901 documented an infant mortality gradient based on poverty in areas of York, England (Rowentree, 2001).
In recent years, an abundant literature has documented a health gradient based on SES,
particularly income. The evidence is overwhelming that SES and health are associated and that the association is represented by a gradient. Better-off individuals have better health than those who are less well-off, who in turn have better health than worse-off individuals. The gradient implies that the relationship

E-27
between SES and health is a dose-response relationship, and not a relationship described by a threshold effect where the worse-off have poor health while everyone else has good health.
The gradient has been found using different measures of SES and of health (Berkman & Kawachi,
2000). Health indicators consist of mortality (all-cause and disease-specific mortality, infant mortality and life expectancy), morbidity, and self-rated health, including quality of life indicators. In the U.S., the health gradient was first reported by Kitagawa and Hauser (1973) (Kitagawa & Hauser, 1973) who merged Census and death records and found a relationship between mortality and SES, whether income, education or occupation was used as the indicator of SES. The inverse association between SES and mortality was reported in several U.S. communities, for example Evans County Georgia (Tyroler et al., 1984), Washington County, Maryland (Comstock & Tonasica, 1977), Alameda County, California (Haan M. et al., 1987), and Tecumseh, Michigan (Williams D. R., 1986). More recently, Backlund, Sorlie, & Johnson (1996) (Backlund et al., 1996) and Sorlie, Backlund, & Keller (1995) (Sorlie et al., 1995) used the National Longitudinal Mortality Study surveys, which represent approximately 500,000 personal or telephone interviews and 40,000 deaths, to describe the relationship between income and mortality. An income-based gradient with declining mortality associated with increasing income exists in all age groups for both males and females, though it is steeper in working-age groups and for males. The gradient flattens but remains when controlling for household size, education, marital status and employment status, indicating that income has an independent effect on health.
An SES gradient in morbidity, impairments, and disability is also apparent (Williams D. R., 1990).
Rates of chronic illness are higher among the disadvantaged (Haan M. N. & Kaplan, 1986; Lerner, 1975; Newacheck et al., 1980). The mortality and morbidity gradient is present with other socioeconomic variables such as wealth, employment grade or social class. For example, a gradient was found in the classic Whitehall study of civil servants in the United Kingdom (Marmot M. G., 1986). The top grade administrative civil servants had a 10-year cumulative mortality rate half that of the next grade professional/executive civil servants, three times lower than the next grade clerical civil servants, and four times lower than civil servants in the lowest grade. The gradient holds for many, but not all, health outcomes, including cause-specific mortality, morbidity or self-reported health. The SES based health gradient is a fairly universal phenomenon. Differences in health by SES have been reported in Norway, Denmark, Finland, Germany, the Netherlands, Australia, New Zealand, Canada, Japan and several developing countries (Haan M. N. & Kaplan, 1986; Marmot M. et al., 1987; Williams D. R., 1990; Wolfson M. et al., 1993).
SES is usually measured by income, education, occupational status, social class or a combination of these factors. Among these measures, education stands out as the most basic SES component since it shapes future occupational opportunities and earning potential (Adler & Newman, 2002). Education is considered the primary and core status dimension that influences all other dimensions of status throughout the lifetime (Mirowsky & Ross, 2003). Education provides life skills that allow educated people to gain access to resources that promote health and to use these resources more effectively. Better educated people are more likely to be employed, to be working in well-paying jobs, to be in more prestigious occupations, and to have more control, autonomy, creativity and authority on the job (Mirowsky & Ross, 2003). Education is the antecedent to all other measures of SES as it comes early in life and influences all other measures of SES.
The association between SES and health becomes more robust when SES is measured by
education (Fuchs V. R., 1979; Kitagawa & Hauser, 1973; Lebowitz, 1977; Liberatos et al., 1988; Williams D. R., 1990). Winkleby and colleagues, in an attempt to untangle the relative effect of education, income and occupation, found that only education remained a significant predictor of cardiovascular disease when education, income and occupation were all included (Winkleby et al., 1992). These results taken together have lead researchers to conclude that education is the best SES predictor of health status (Williams D. R., 1990).

E-28
In the study of education and health, education is usually measured by years of completed formal education or by the highest degree obtained. For example high school graduates are compared to those without a high school diploma or to those with a college degree. The impact on health outcomes of college selectivity for those with a college degree and the credential of a college degree have also been investigated (Ross C. E. & Mirowsky, 1999). Section 2. The Links between Educational Attainment and Adult Health Status
This section reviews the evidence that education improves health outcomes. We rely heavily on
Low’s (Low, 2005) and Mirowsky and Ross (2003) (Mirowsky & Ross, 2003) excellent summaries in presenting this evidence. In general, better educated people are healthier, report better health, and have lower mortality, morbidity and disability (Coburn & Pope, 1974; Ross C. E. & Van Willigen, 1997). Ross and Mirowsky (Ross C. E. & Mirowsky, 1999) have shown that the quality of the education received and of the educational environment increase the positive effects of education on health. The evidence that more education is associated with better health is strong (Deaton & Paxton, 1999; Grossman & Kaestner, 1997; Kaplan & Kiel, 1993).
Health Literacy and Health Knowledge. While education improves health, lack of education, and the resulting low literacy, is associated with poor health. Literacy, one of the main products of education, is associated with several aspects of health. Health literacy allows individuals to understand and act upon health information and has been related to knowledge about health, personal health status, and the use of health service. Literacy improves health knowledge and skills in managing their disease in patients with hypertension, diabetes, and asthma (Williams M. V. et al., 1998a; Williams M. V. et al., 1998b). Literacy was a better predictor of metastases than age and race in prostate cancer patients (Bennett C. L. et al., 1998). Mortality. A strong inverse relationship between years of education and all-cause mortality is reported by Elo and Preston (Elo & Preston, 1996). Actuarial estimates show 5 to 6 years differences in life expectancy between the least and the most educated (Rogot et al., 1992). Mortality rates vary greatly with years of education, for example compared with individuals with 17 or more years of education, those with 16 years are 25% more likely to die and those with less than 9 years of education are 100% more likely to die (Rogers et al., 1999). These differences in mortality rates by educational level have been increasing over time (Elo & Preston, 1996; Feldman et al., 1989). Infant Mortality. Infant mortality is a key indicator of health and wellbeing of societies (UNICEF, 2003). One of the best predictors and contributors to fetal and infant mortality is thought to be low birth weigh (Chen et al., 1998; Newland, 1981; Shapiro et al., 1980; Shoham-Yakubovich & Barell, 1988). Research has shown that mother’s educational level is inversely related to both infant mortality (Arntzen & Nybo Andersen, 2004; Arntzen et al., 2004; Buor, 2003; Gisselmann, 2005; Olsen & Madsen, 1999; Pena et al., 2000) and low birth weight (Chen et al., 1998; Shapiro et al., 1980), that is, infant mortality risk decreases as the mother’s educational level increases (Bicego & Boerma, 1993; Burne & Walker, 1991; Caldwel, 1979; Newland, 1981; Wagstaff et al., 2004). Albeit the relationship might be well established, the explanatory mechanisms behind this relationship are still debated. One of the possible pathways is that mothers’ education increases the access and proper utilization of preventive or curative health care facilities (Buor, 2003; Gubhaju, 1991), the personal skills and abilities and, more importantly, education may change traditional familiar relationships (Caldwel, 1979). Morbidity and Chronic Disease. There is evidence of a morbidity gradient based on education. Mirowsky and Ross (2003) report that less educated persons are more likely to suffer from the common chronic conditions, with the exception of cancer. For example, arthritis and osteoporosis, hypertension, heart disease, diabetes and lung disease are more likely to be diagnosed among those with no high school degree and least likely in those with college degrees. The probability of reporting diagnosis of at least one of the above condition is 35.7% for those with college degrees, 41.6% for those who completed high school, and 64.7% for those who did not complete high school (Mirowsky & Ross, 2003).

E-29
Self-Rated Health. Evidence accumulated for more than 20 years indicates that self-rated health (SRH) is a powerful and reliable predictor of clinical outcome and mortality, even 10 years after the initial self-rating (Fayers & Sprangers, 2002; Idler & Angel, 1990). The association of SRH and mortality is particularly strong among individuals who report poor health (Burstrom & Fredlund, 2001) and this relationship is found among men and women, and among all the main ethnic groups in the U.S. (McGee et al., 1999). SRH has been proposed as a more reliable predictor of mortality even when compared to physician-rated health (Mossey & Shapiro, 1982). The measurement of SRH is captured by a single question “In general, would you say your health is …?” that is rated on a five-point Lykert scale from very good to very poor. SRH differs substantially across educational levels. About 17% of individuals with elementary education, 11% of those who did not complete high school, and 6% of those who completed high school report poor or very poor health, while only 2.5% of individuals with college degrees do so (Mirowsky & Ross, 2003).
Physical impairment, such as difficulty in climbing stairs, kneeling or stooping, lifting and carrying
bags of groceries, doing household work, shopping and getting around town, seeing even with glasses, and hearing, follows an educational gradient. Individuals who did not finish high school were more likely and those with college degrees least likely to report physical impairment (Mirowsky & Ross, 2003). Mirowsky and Ross calculated that between 70% and 50% of physical difficulty can be attributed to low education.
Education improves the likelihood of people feeling physically fit, having lots of energy, enjoying
life, being happy, and feeling hopeful about the future and decreases the likelihood of having trouble sleeping, finding everything an effort, being unable to get going, having trouble keeping their minds on things, and suffering from backaches and headaches (Mirowsky & Ross, 2003). Risk Factors. The educated tend to have healthier lifestyles than those with less education. Researchers in diverse disciplines have noted that more educated persons are more aware of health risks and more likely to initiate actions to reduce these risks (Williams D. R., 1990). According to Mirowsky and Ross (2003), education encourages people to acquire information with the intent to use it and makes individuals more effective users of information. Thus, well-educated persons pull together various healthy elements of different lifestyles. The more educated exercise more, are less likely to drink in excess, smoke less, and are less overweight than those with less education (Ross C. E. & Bird, 1994; Ross C. E. & Wu, 1995).
Individuals with more education are less likely to smoke than those with less education. They are
also more likely to have never smoked and, if they have smoked, to have quit smoking (Helmert et al., 1989; Jacobsen & Thelle, 1988; Liu et al., 1982; Matthews et al., 1989; Millar & Wigle, 1986; Mirowsky & Ross, 2003; Shea et al., 1991; Wagenknecht et al., 1990; Winkleby et al., 1992). While about 50% of individuals with some high school smoke, only approximately 15% of those with advanced degrees smoke (Mirowsky & Ross, 2003).
The well-educated are more likely to be physically active. Walking and engaging in strenuous
exercise increases with education (Ford et al., 1991; Helmert et al., 1989; Jacobsen & Thelle, 1988; Leigh, 1983; Mirowsky & Ross, 2003; Shea et al., 1991). The association between being overweight and education differs by gender. Better educated women tend to be less overweight than those with less education (Mirowsky & Ross, 2003). But body weight does not seem to be correlated with educational attainment for men (Ross C. E. & Mirowsky, 1983). This could be because lower educated men are more likely to be in jobs that require physical effort. A recent review confirms a negative relationship between education and weight gain (Ball & Crawford, 2005). Alcohol abuse is more common among people with lower education (Darrow et al., 1992; Midanik et al., 1990; Romelsjo & Diderichsen, 1989). Mirowsky and Ross (2003) report that better educated individuals are more likely to drink in moderation. Mirowsky and Ross (2003) argue that healthy behaviors associated with education are not consistently correlated with other sociodemographic characteristics. For example, men exercise more than women but smoke more and married people are more overweight than non-married people but smoke less. They state that “Only education correlates positively and consistently with health behaviors” (Mirowsky & Ross, 2003, p. 53).

E-30
Furthermore, health education campaigns are more effective in producing behavioral changes in
better educated people. For example, smoking did not show a SES based gradient in the 1940s. As information on the risks of smoking became widely available, the better educated quit at a higher rate than those with less education with the result that now smoking is concentrated among disadvantaged groups (Pierce et al., 1989). Similar patterns of change in the social distribution of risk factors have been observed for other diseases. Coronary heart disease (CHD) was a disease of the affluent with CHD risk factors positively associated with SES in the 1950s, only to become more prevalent among the less-educated groups as knowledge about risk factors increased (Morgenstern, 1980; Taylor, 1967). More recently, AIDS changed from being a disease of white middle-class homosexual to having a majority of new cases among minority groups with lower education (Peterson & Marin, 1988). Education and Health Care Costs. Low (2005) provides strong evidence that literacy predicts health care costs. In the 1990s, Medicaid recipients at the lowest literacy levels had annual health care costs of $12,974 compared to $2,969 for the overall Medicare population and were twice as likely to have been hospitalized in the previous year than patients with higher literacy (Weiss, 1999). Low literacy is responsible for about $73 billion annually in avoidable health care costs according to an estimate by a National Academy study on Aging Society. Section 3. How Educational Attainment Affects Adult Health Status
Mirowsky and Ross (2003) consider several broad pathways through which education affects
health. Education as learned effectiveness directly improves health, education increases the sense of personal control, and education enhances material, social and psychological resources. Following Mirowsky and Ross (2003), we will discuss these pathways in turn. The Human Capital View. Human capital is a concept derived from economics. In its original sense, human capital “concentrates on the agency of human beings – through skill and knowledge as well as effort -- in augmenting production possibilities” (Sen, 1997, p 1959). Human capital can thus be employed as capital in production in the way physical capital is. The human capital perspective has been broadened to cover not only economic production but to include production of other things that are valued, such as health and well-being.
The human capital approach to education and health implies that education improves individual’s ability to produce health. This is the approach that characterizes Mirowsky and Ross’ theory of education as learned effectiveness (Mirowsky & Ross, 2003). Mirowsky and Ross (2003) argue that “education enables people to coalesce health producing behaviors into a coherent lifestyle and that a sense of control over outcomes in one’s own life encourages a healthy lifestyle and conveys much of education’s effect” (Mirowsky & Ross, 2003, p. 25). In this theory, education and income are distinct in their effects on health. Education, defined by the accumulated knowledge learned in school, is an antecedent to income in that “education is the key to people’s position in the stratification system” (Mirowsky & Ross, 2003, p. 25). Those who are better educated are more likely to have better jobs and better paying jobs, which in turn improve health. But the major effect of education on health is not through economic resources.
Education is a root cause of health in that it gives individuals the capacity to control and shape
their own life in a way that promotes good health. The skills, knowledge, and resources acquired in school build abilities (the human capital) that increase effective agency and can be used to foster health. Thus “education as learned effectiveness” (Mirowsky & Ross, 2003). The resources acquired through education are inherent in the people themselves, not only external (like money). Education increases the motivation, and success at solving problems, reduces helplessness, and improves the efficiency in producing health from the material, social and psychological resources available to the individual. It teaches the ability to learn, to be persistent, to communicate effectively, and to find and use information. So, for example, well-educated people with lower income are better able to mange their reduced monetary resources to fend off
E-31
economic hardship. One of the skills learned through education is to substitute resources in solving a problem. This problem-solving ability is then successfully applied to acquiring and maintaining health. Personal Control. From this perspective the primary link between education and health is the sense of personal control that leads to the adoption of a healthy lifestyle (Mirowsky & Ross, 2003). The sense of personal control is a learned expectation that outcomes are affected by one’s own choices. Individuals with a sense of personal control feel they can control and alter the environment in which they live. It is the opposite of perceived powerlessness where individuals see no link between efforts and outcomes and feel they have no control over their life. Internal locus of control (Rotter, 1966), mastery (Pearlin et al., 1981), and self-efficacy (Bandura, 1986) and, on the opposite end, fatalism (Wheaton, 1980), helplessness (Seligman, 1975), and perceived powerlessness (Seeman M., 1983) are some of the names under which sense of control has been studied in psychology and the social sciences. The sense of personal control is learned through experience. Education increases the sense of personal control because school builds the skills, abilities and resources that allow better-educated people to have a rich experience of success at avoiding and solving problems, thus reinforcing their belief that their own behavior can favorably affect outcomes (Mirowsky & Ross, 1989; Ross C. E. & Mirowsky, 1992; Wheaton, 1980). Education teaches problem-solving skills and confidence. MR 2003 report a strong association between education and sense of control.
According to Mirowsky and Ross’s theory of personal control, the benefit of personal control lies in its effectiveness (Mirowsky & Ross, 1986, 1989). This effectiveness leads educated individuals to take control of their health by seeking out and using health related information and by adopting health promoting behaviors. This is partly why people with more education tend not to smoke, to exercise, to eat a healthy diet, to drink in moderation, to control their weight and, consequently, to have better health outcomes. Using a structural equation model, Mirowsky and Ross (2003) show that sense of control promotes a healthy lifestyle and mediates much of the effect of education on health, after controlling for socioeconomic characteristics such as age, gender, income, economic hardship, parents’ education and social support. This does not mean that income, economic hardship and social support do not affect health. As we will see in the next sections they are themselves determined by education and are important influences on health. These data mean that much of the influence of education on health is through the independent effect of sense of control and support the view of education as learned effectiveness. Education provides good jobs and high income, but also transcends them in fostering health. Education and Resources. According to this perspective, education’s main function is to provide material resources. Education is the main determinant of economic well-being since educational attainment usually translates into economic advantage. Better-educated people, those with a doctoral or professional degree, command a household income that is 5.4 times the income of those with elementary school education and 2.6 times the income of those with a high school degree (Mirowsky & Ross, 2003, ch. 4). Education influences household incomes because in the U.S., household income comes overwhelmingly from current wages and salaries and from pensions and savings based on past wages and salaries. Education increases the probability of being employed and of having higher wages and salaries during the earning years. It also increases the likelihood of being in a two-income household by increasing the probability of being married and of being married to someone with similar education and high income (Mirowsky & Ross, 2003).
The relationship between income and health is a very robust one (Low, 2005; Lynch et al., 1998;
Mirowsky & Ross, 2003; Ross N. A. et al., 2000; Wolfson M. et al., 1999). Income provides material resources that help families meet basic human needs such as food, shelter and medical care that directly affect health (Williams D. R., 1990). Though the overwhelming majority of people in developed countries have their basic needs met, differential access to material resources by income still affects health outcomes (Evans R. G. et al., 1994). For example, people with low income are more likely to live in poor housing and poor neighborhoods where they are exposed to unsafe conditions as well as to pathogens and toxins (Mayer, 1997).

E-32
Income is related to economic hardship: That is the difficulty of paying the bills and buying things the household needs. Economic hardship affects health in large part because of the stress associated with the endless struggle to get by. As Mirowsky and Ross (2003) point out “People exposed to economic hardship probably experience frequent, intense and prolonged activation of the physiological stress response, with consequences for their health” (Mirowsky & Ross, 2003, p. 86). The negative effects of chronic or prolonged stress on health have been extensively documented (Cohen et al., 1999; Fremont & Bird, 2000; Glaser et al., 1999; Sapolsky, 1997). The stress of economic hardship leads to a sense of powerlessness, helplessness, failure and shame that make individuals feel at the mercy of external factors and lowers their sense of personal control with negative influences on health behaviors and outcomes (Wilkinson, 2001).
The relationship between education and health which is mediated by income has two components
(Mirowsky & Ross, 2003). As we have seen, education reduces the risk of low income. But, if a household suffers from low-income, education can lower the risk of low income on health by aiding people to use income effectively. According to Mirowsky and Ross (2003) people can use education as an effective substitute for income. “The well-educated achieve economic well-being and physical health through higher income, but they can and do achieve the same ends just as well through other means” (Mirowsky & Ross, 2003, p. 98). Mirowsky and Ross (2003) show that, even among households with the same income and household composition, education reduces the economic hardship associated with low income and that, at any given level of income, health tends to be better at higher levels of education.
Mirowsky and Ross (2003) models indicate that the positive effect of income on health can be attributed to lower economic hardship measured by less trouble paying bills and buying household necessities (which account for 40% to 60% of income’s effect on health), lower exposure to poor neighborhoods (which accounts for about 5%), and increased sense of control that encourages healthy behaviors and reduces stress (which accounts for the remainder 35% to 55%). They also report that the differences in health by income decrease as education increases. Use of Medical Care. It is often believed that access to medical care explains the relationship between income and health. However, much research doubts the effectiveness of medical care in accounting for differences in population health. Epidemiological studies have shown that the rise in life expectancy in the 20th century cannot be explained by improvement in medical treatment of disease (Evans R. G. et al., 1994; McKeown, 1979; McKinlay & McKinlay, 1977). Furthermore, the contribution of medical resources and expenditures to differences in mortality across U.S. states and counties have been questioned (Auster et al., 1969; Miller M. K. & Stokes, 1978). Countries like the U.K. who introduced universal access to medical care saw a reversal in the social gradient in the use of service, but did not see the socioeconomic gradient in health and survival reduce (Macintyre, 1997; Marmot M. et al., 1987; Wagstaff et al., 1991).
In the U.S., low-income individuals use more medical services (Aday et al., 1980; Pincus, 1998).
This is because they have more medical problems and because they have a more favorable attitude towards the medical system (Sharp et al., 1983). Health can not be bought by buying medical services; it is produced chiefly through the benefits of education. While access to high quality medical care improves outcomes for a diseased individual, (Mirowsky & Ross, 2003, p. 90) conclude “Clearly, differential access to medical care can not explain the differences in health and survival across levels of education and income”.
Employment, Occupation, and Work. Employment, occupation and work have been posited as links between education and health. Better-educated people are more likely to be employed, to have jobs that are better paid and that are more satisfying because they allow autonomy and reward creativity. Better educated people are more likely to be in full-time employment and less likely to be in part-time employment or unemployed. Education brings people into the labor force and keeps them at the highest level of participation: full-time employment. Mirowsky and Ross (2003) estimate that, on average, each additional year of education increases the odds of full-time employment by 11%, decreases the odds of being unemployed by 10%, and decreases the odds of being unable to work because of disability by 23%.

E-33
Education also improves the stability of full-time employment by decreasing the probability of ever having been unemployed.
Health improves steadily with participation in the labor force. Persons in full-time employment have
the best health and those unable to work have the worst health (Mirowsky & Ross, 2003). Mirowsky and Ross (2003) point to three possible mechanisms that can account for differences in health across employment statuses. Traits that influence employment, such as age, gender and marital status, can affect both health and employment. However, health differences by employment remain after controlling for these factors, indicating that some other mechanism is at work. The two remaining mechanisms are causation and selection. Employment may cause better health because employed individuals have an economic advantage as well as healthier behaviors. Selection implies that good health increases the likelihood of full-time employment while bad health causes people to not be in the labor force because employers tend not to hire individuals in poor health. Mirowsky and Ross (2003) report that both processes are present, but that the link between employment and health mainly operates through a causal mechanism. They find evidence that employment and health are in symbiotic relationship: “Just as full-time employment helps individuals to stay or become healthy, health helps them stay or become employed full-time” (Mirowsky & Ross, 2003, p. 112). Selection seems to be a minor mechanism in the relationship between employment and health and to be declining over time.
Workers, particularly men, with lower levels of education tend to be in occupations where exposure to physical, chemical or biological hazards and noxious environments is more common. Better educated workers are less likely to be in harsh or dangerous occupations (Mirowsky & Ross, 2003). However, due to the remarkable safety of most of today’s workplaces, occupation has little effect on overall health and does not explain the differences in health by education (Mirowsky & Ross, 2003). Jobs that allow workers to use creativity, to have control over what they do and how to do it, and that involve autonomy and creativity favor health (Mirowsky & Ross, 2003). The classic Whitehall study of British civil service provides evidence that there is a gradient in health and mortality across job classification (Marmot M. G. et al., 1991). Marmot emphasizes that better health is associated with greater control over working conditions and job demands. More autonomous and creative jobs are usually at the top of workplace hierarchy, are well paid, and tend to go to better-educated individuals. Social Resources. Better-educated people are more likely to be married and tend to have more stable and supportive relationships (Mirowsky & Ross, 2003). Social support, and in particular marriage, are protectors of health. Married people have better health than those who are not married, probably because they face less economic hardship, have more social support, especially emotional support, and lead a more orderly and regulated life. General social support improves psychological well-being that is associated with better physical health. Married people also tend to have more contact with the health care system resulting in earlier detection and treatment of disease. The effect of marriage on health behaviors is mixed. Married people are less likely to smoke or to drink heavily, and are less prone to injuries and risky sexual behavior. However, they are less likely to exercise and more likely to be overweight (Mirowsky & Ross, 2003). Biological Risk. A possible explanation for educational inequality in health is differential exposure to chronic and acute stress. We have discussed above how persons with less education are more likely to be exposed to various types of stressors: physical, economic and social. Recent literature has attempted to elucidate the biological pathways that mediate educational-related exposures to stressors and increased morbidity and mortality (Marmot M. G. et al., 1995; Seeman T. E. & Crimmins, 2001; Seeman T. E. et al., 2004). Many studies have reported higher traditional risk factors for coronary heart disease, such as elevated blood pressure, cholesterol, weight, glucose, and fibrinogen, among lower SES individuals (Seeman T. E. et al., 2004, p. 1986). Recently, the concept of allostatic load has been used in explaining educational related differential in health. Allostatic load is defined by Seeman et al (Seeman T. E. et al., 2004, p. 1986) as reflecting “the cumulative total of physiological deregulations across multiple physiologic regulatory systems, a total that is postulated to impact significantly on health and longevity” (Seeman T. E. et al., 2004). The burden of such physiological wear and tear results, partially, from life experiences and
E-34
physiological reactions to them. Differences in life experiences are strongly conditioned by educational achievement. The concept of allostatic load, with its implication of general susceptibility, has the ability to explain the educational gradient observed in a wide range of diseases and causes of deaths. Allostatic load has been measured by levels of physiological activity across the hypothalamic-pituitary-adrenal axis, the sympathetic nervous system, cardiovascular systems, and metabolic processes, which have been linked to increased risk for disease (McEwen, 1998; Seeman T. E. et al., 2004). There is strong evidence of a negative relationship between allostatic load and educational attainment, with the better educated exhibiting lower cumulative allostatic load, and of a positive relationship between allostatic load and mortality (Seeman T. E. & Crimmins, 2001; Seeman T. E. et al., 2004; Seeman T. E. et al., 1997; Seeman T. E. et al., 2001). In a study of elderly Americans from new Haven, CT, East Boston, MA, and Durham, NC, the cumulative allostatic load explained 35% of the differences in mortality risk between those with less than high school and those with high school or greater educational achievement (Seeman T. E. et al., 2004). Education and Age. The advantages in health associated with education do not decline with age (Crimmins & Saito, 2001; Manton et al., 1997; Mirowsky & Ross, 2003; Preston & Elo, 1995). On the contrary, the positive effects of education on health accumulate during adulthood over many areas of life (socioeconomic, behavioral and biological) and grow over long periods of time (Mirowsky & Ross, 2003). The positive accumulations create feedbacks that amplify the effects of education over the lifetime. Even among the oldest old, those with less education have the greatest disability and limitations (Freedman et al., 2002). Declines in severe cognitive impairment appeared to be largest among those with less than a high school education, though there were no educational disparities in functional limitations and visual limitations (Freedman et al., 2002). The concept of cumulative biological risk discussed above can be used to explain the evidence that educational related mortality differentials grow at older ages. The cumulative burden of physiological deregulation, as reflected in the summary measure of allostatic load, increases faster over the lifetime for those with less education compared to those who are better educated (Seeman T. E. et al., 2004). Section 4. Alternative Views on the Link between Educational Attainment and Adult Health Status Reverse Causation. Low (2005) describes an alternative explanation for the correlation between education and health. Reverse causation, represented by the hypothesis that better health may lead to more and better education, could explain the relationship between education and health (Low, 2005). While this paper discusses the relationship between health and educational achievement in school age children, in adults the preponderance of evidence is that it is education that mainly promotes good health and not the other way round (Koivusilta et al., 1999; Ross C. E. & Wu, 1996; Shakotko et al., 1980). The Third Factor Hypothesis. Low (2005) describes the third factor hypothesis which posits that both education and health depend on some third factor. The factors that are proposed are “personal endowment” and “time preference” (Low, 2005). Personal endowment consists of a cluster of genetically inherited factors that predispose to both educational achievement and good health. While there is evidence of genetics component to general intelligence and of an association between IQ, educational achievement and health, it seems unlikely that inherited IQ alone can account for the observed relationship between education and health (Low, 2005). Other inherited traits such as personality and longevity may also affect both educational achievement and health, but evidence is lacking that those traits are socially distributed in the population and can explain the health of population groups (Low, 2005). The evidence provided in this paper, on the other hand, indicates that education promotes health independently of personal endowment and genetic traits. Time preference, or the ability and inclination to postpone gratification with the expectation of future benefit, is a concept taken from the economic literature (Fuchs V., 1982). Time preference can affect both educational attainment and health because those who are able and willing to postpone gratification are more likely to stay in school as well as to avoid risky behaviors such as smoking or risky

E-35
sex in the expectation of a more prosperous and healthier life in the future. A small role for time preference in both education and health has been demonstrated (Fuchs V., 1982; Kennedy, 2003). However, as Low (Low, 2005) argues, the key question is whether time preference is innate or acquired. Sociological research points to time preference being influenced by social and cultural factors, including education (Lawrence, 1991).
Other views of education include education as credential and education as a reproducer of inequality (Mirowsky & Ross, 2003). The credentialist view is that education produces an artificial effect, not a real effect, and is only a mark of status. If this was true we would only see a relationship of health to degree and not to years of schooling. But the evidence points to a strong positive relationship between years of education and health outcomes (Mirowsky & Ross, 2003). The view of education as a reproducer of inequality posits that education is solely used to perpetuate social status from one generation to the next. In this view, education does not develop productive abilities but merely provides the signs needed for students to be matched to positions so as to maintain the existing socioeconomic structure. However, research shows that persons from low status families gain the most from additional education, thus invalidating the education as reproducer of inequality view (Mirowsky & Ross, 2003).

E-36
TABLE 5. SUMMARY OF STUDIES LINKING EDUCATIONAL ATTAINMENT AND HEALTH STATUS AMONG ADULTS The relationship of education and health
Education1
Impact on health
outcomes
Health literacy and knowledge
Lack of education results in low literacy and thus in poor health. Literacy improves health knowledge and skills in managing the disease.
Mortality and life expectancy
Life expectancy increases and all-cause mortality rates decrease in higher education level.
Infant mortality Education seems to play an important role in lowering occurring rate of infant mortality predictors.
Morbidity Educated people are less likely to suffer from chronic diseases (except cancer) like arthritis and osteoporosis, heart disease and hypertension, diabetes and lung disease. Probability of reporting the above is 35.7% in those with college degree, 41.6% in those with high school and 64.7% in those who did not completed the high school.
Subjective health (self-rated, health impairment and well-being)
Self-rated health is considered a powerful predictor of clinical outcomes and mortality. Poor or very poor health is reported by 17% of people with elementary education, 11% of those who did not completed the high school, 6% of those with high school and by only 2.5% of individuals with college degree. Physical impairment as well follows an inverse educational gradient. Education improves the likelihood of people feeling physically and mentally fit.
Lifestyle risk factors
Educated individuals have a healthier lifestyle due to better use of information acquired, raised awareness and take actions to reduce such risks. They are likely to exercise more, smoke less, and less likely to drink in excess, to gain weight and suffer from cardiovascular diseases or AIDS which are influenced by lifestyle factors.
Health care Low literacy seems to predict high health care costs and it is responsible for about $73 billion avoidable health care costs in a year.
Age-related impact on health
Positive effects of education on health accumulate during life and this accumulation creates feedbacks that amplify the effect of education over the lifetime. Among the oldest, those with less education present more disability and limitations but no educational disparities for functional and visual limitations are found.
1Education, in its relation to health, is measured by years of completed formal education or by the highest degree obtained.

E-37
TABLE 6. SUMMARY OF EXPLANATIONS FOR THE LINK BETWEEN EDUCATIONAL ATTAINMENT AND HEALTH STATUS
Pathway Education HealthIndependent effect to health
Human capital approach
The human capital approach implies that education improves individual ability to produce health. The skills, the knowledge and resources acquired in school build abilities that can be used to foster health. The resources acquired through education are inherent in the people themselves. Education as learned effectiveness helps individuals gain access to resources that promote health, use effectively these resources and health-related information, and thus adopt health promoting behaviors.
Personal control Education increases a sense of personal control, a perception of control and ability to alter the environment an individual lives in, which leads to adoption of healthy lifestyle. Education teaches problem-solving skills and confidence.
Controlling for income
At households of the same income level and demographics, families with higher levels of education tend to experience less economic hardship consequences and have better health at any level of income. Differences in health by income decrease as education increases.
Dependent (indirect) effect to health
SES* Education is antecedent to all the other measures of SES as it comes early in life and shapes future occupational opportunities and earning potentials. It is the best SES predictor of health status.
SES and health are inversely associated by a gradient. All SES indicators such as income, occupation, education level, social class, and wealth have proved to be related with health outcomes.
Income Education attainment usually translates in economic well-being and advantage. It increases household income due to higher chances of finding high wage employment, having two in the household and being married to someone with similar education and income level.
Income has a strong relationship with health. It provides the access to material resources for basic needs, including health care. Differential access to these resources by income will also have an impact on health outcomes. Income seems to have an independent effect on health. Declining mortality is associated on an income-based gradient with increasing income, particularly in males and in working age groups.
Use of medical care
Differences in health across levels of education and income cannot be explained by different access to medical care, although high quality medical care improves outcomes for people suffering from diseases.
Employment, occupation, work
Education increases the likelihood for individuals to be employed at full-time jobs that are better paid, and that allow workers to use their creativity, have control over their work and have work autonomy, all together thought to favor health.
Occupation and health are involved in a dual relationship where full-time employment help individual be healthy and vice versa.
Social resources Better educated people are likely to be married and tend to have stable relationships, emotional and social support, and more contacts with health care. As such they have better psychological wellbeing and physical health. The effect of marriage in health however is mixed.
Biological risk There is strong evidence that better educated people exhibit lower allostatic load where allostatic load is positively related with mortality. Allostatic load is defined like total cumulative of physiological deregulations across multiple physiologic regulatory systems and which impacts significantly health and longevity.
* SES, Socio-economic status
Possible pathways how education affects health
Socioeconomic status (SES) has consistently been found to influence to a great extent individuals’ health. The association between SES and health presents a positive gradient for most health outcomes (that is, the greater the SES, the better the health), whether SES is measured by education, occupation,

E-38
income, wealth or social class. Education is considered as a core SES dimension as it serves as precursor to other health determinants such as income and occupational status. Extensive evidence points out that a variety of health outcomes are influenced by education. Overall, people with higher educational attainment tend to be healthier than people with lower education. The effect has been attributed to higher general and health literacy and its application in informed decisions and actions they take towards healthier lifestyle behaviors. Health condition surveys support the claim for self-rated health, physical impairment and mental and physical well-being. Additionally, it is observed that the higher the educational grade obtained, lesser are the rates of all-cause mortality, life expectancy and morbidity. This positive influence of education on health does not diminish with years; on the contrary it accumulates and amplifies during the life span.
Education affects individual health through both direct and indirect pathways. Education is
positively associated with health outcomes even after controlling for other health determinants suggesting an independent effect on health. As learned skill, knowledge and effectiveness, education directly improves health; increases the sense of personal control, and enhances social, psychological resources and provides valuable tools for their proper use.
Alternatively, education strongly correlates with other indicators of socioeconomic status and as
their precursor in occurring early in life, it is very likely to determine future occupational and economical prospects for an individual. Educated individuals are likely to have better opportunities for full-time jobs, stable employment contracts, jobs over which they have control and where creativity and autonomy are encouraged. All of these factors are seen to improve health. Furthermore, these employment opportunities are accompanied by increases in income. Income provides to individuals access to material resources, health care services among others, to fulfill the basic needs, thus improving individual health. Section 5. Interventions in Early Childhood
The period during which brain development is the most rapid and important is in the first 3 to 5 years of life. Early life conditions affect the ability to learn and are important predictors of future academic success (Low, 2005). Jimerson et al. (2000) states: “The context from which the child emerges when entering elementary school provides a critical foundation for subsequent academic success”. Several studies have reported a strong relationship between early life conditions and dropping out of high school (Jimerson et al., 2000), later performance in school, adult literacy, health status and mortality (Keating & Hertzman, 1999). Readiness to learn when entering kindergarten has been associated with mathematical achievement in eighth grade (Fuchs V. R. & Reklis, 1997).
There is evidence that readiness to learn for at-risk children in the pre-kindergarten years can be
improved through intervention. Though health effects have not been established, there is suggestive evidence that programs such as Head Start and the Perry Preschool Project may confer long-term benefits (Hertzman, 1999). Pre-school enrichment programs have been shown to improve the cognitive and social capacity of poor children at high risk. One of the first programs to be evaluated, the classic High/Scope Perry program, provided evidence that per-school enrichment program improved high school graduation, avoidance of legal and marriage problems, home ownership, and use of social services (Schweinhart, 1993). In the evaluation by the Center for Educational Research at Stanford, Right Start, a compensatory education program, was shown to increase developmental test scores at ages 7, 8, and 9 (Case & Griffin, 1991). Recent evaluations of Head Start and Early Head Start, the largest early childhood intervention programs for low SES children in the U.S., have shown mixed results, but some positive effects on learning (Mathematica Policy Research Inc, 2002; McGroder, 1990).
The evidence presented in this section corroborates the importance of education to health and provides justification of why investing in education and evaluating and improving policies related to education, have an imperative relevance.

E-39
According to the Census 2000 data, 24.3 % of adults in Texas do not have a high school diploma. That is more than the percentage of adults with a college degree (15.6%) or graduate or professional degree (7.6). These averages reflect great variation in educational attainment by racial/ethnic status as shown in the table below.
Educational attainment in Texas by racial/ethnic groups Less than high school High school diploma
but no college degree College degree or higher
Non-Hispanic Whites
12.8 57.2 30.0
Hispanics 50.7 40.4 8.9
African Americans 24.2 60.5 15.3
Asians 19.3 32.9 47.8
Source: 2000 Census obtained from Texas State Data Center Improvement in the educational attainment of Texans would result in better health status, lower morbidity and mortality, and lower health care costs in Texas. PART THREE: Inventory of Recommendations The first section inventories general recommendations and their claims about how these interventions will affect academic performance.

E-40
Section 1. General Recommendations
TABLE 7. INVENTORY OF RECOMMENDATIONS ON GENERAL INTERVENTIONS FOR CHRONIC HEALTH CONDITIONS
Policy Reports Recommendations (Total studies = 75)
Academic Performance-related Claims
Community-based
● Advocate and support policies that promote “asthma friendly" communities and homes and expand asthma control activities and interventions in high-risk populations particularly in low-income and minority populations. Establish diabetes prevention programs in high-risk communities that focus on the link between obesity and diabetes.
● Commit all schools to participate in available child nutrition programs, including breakfast, lunch, after school snacks, child care and summer food service.
● After school programs for elementary and teenage children run by local parks and recreation departments, other public agencies, and privately-funded organizations. Head Start and childcare programs for the very young should be funded to ensure that quality, evidenced- based physical activity is provided daily.
● Ensure there is staff and space for quality physical education.
● Establish zoning regulations that prohibit the sale of unhealthy food near schools as well as restrict placement and operating hours of restaurants near schools. Require hospitals and other health care facilities to sell only healthful foods.
● Hire credentialed physical education teachers for elementary schools.
● Design or provide incentives to developers that build communities that promote healthy eating and physical activity. Encourage location of grocery stores instead of liquor stores in low-income neighborhoods, and increase healthy and competitively priced food choices. Promote communities where it’s easy and safe to walk and bike. Requirements for new schools to be sited and planned should include objectives to ensure that students who live within one mile can safely walk or ride to school. School renovation funds and transportation funds should be allocated for improvements to schools and transportation infrastructure that facilitate students walking to school. Building more trails and paths to encourage walking, jogging and cycling.
● Institute a state subject matter project for physical education and health and provide funding for schools to adopt evidence-based physical education programs and provide incentive funding to teachers to prepare for the national professional board exam in secondary physical education and elementary physical education.
● Educate families on disease risk factors, prevention and management. Encourage parents and caregivers to promote healthy eating patterns by offering nutritious snacks, such as vegetables and fruits, low-fat dairy foods, and whole grains; encouraging children’s autonomy in self-regulation of food intake and setting appropriate limits on choices; and modeling healthy food choices.
● The Legislature should require schools to provide breakfast.
● Encourage community health workers to participate in diabetes prevention and treatment programs.
● Establish a pilot program to demonstrate the effectiveness of comprehensive community-based initiatives focusing on obesity and type 2 diabetes in children and adolescents. Information about successful community projects for people with asthma should be made available to local officials.
● School districts should elect to include formal curriculum on physical activity and physical education instruction in kindergarten through twelfth grades. Teachers should be given education and training on how to model physical activity behaviors.
Health care access/delivery/coverage ● Improve access to quality care and services utilization and culturally appropriate services.
● Increase the proportion of people with asthma who receive written asthma management plans from their health care provider. Provide case-management to high-risk children.
● Pediatricians should develop simple appraisal methods to enable schools/families and their health centers to identify when children are becoming obese.
● Good public policy on asthma can increase school attendance and educational attainment. Asthma-related absenteeism negatively affects children’s learning potential.
● Improve health coverage for uninsured or underinsured children with asthma/diabetes and expand insurance to preventive services. Ensure broader access to asthma/diabetes medications and supplies. Expand the insurance benefits to cover for preventive services and reimburse preventive community health professionals.
● Poor asthma control often results in time away from school, work, sports, or other activities that affect the quality of life. Even if the individual with asthma is able to attend work or school, ongoing symptoms or

E-41
Policy Reports Recommendations (Total studies = 75)
Academic Performance-related Claims
● Provide up-to-date information and linguistically and culturally competent trainings on environmental risks related to asthma/diabetes in children, prevention and disease management, and on best practices guidelines to health care providers.
medication side effects may alter concentration and performance.
● Promote a team-based approach to the delivery of care to individuals with diabetes and members of their families, and a better alignment of services to needs, at both local and state levels.
● Safety and good health are prerequisites to better academic performance.
● Develop and maintain an internet-based clearinghouse of asthma best practice models. Develop an information clearing house for diabetes referral services and continuing professional education opportunities in Texas.
● School administrators, teachers, and PTA members should be educated on the positive relationship between nutrition, physical activity, and academic performance.
● Disease and case management are strongly recommended(a) as diabetes secondary & tertiary prevention. Self-management education at home is recommended(b) for children and adolescent with Type-I diabetes but insufficient evidence(c) is provided for effectiveness in Type-II.
Public health infrastructure
● Sustain support and funding for state and local public health action in asthma/diabetes prevention and management.
● Enhance legislative and regulatory advocacy at state and at local levels.
Industry
● Industry should make obesity prevention in children and youth a priority by developing and promoting products, opportunities, and information that will encourage healthful eating behaviors and regular physical activity.
● Restrict marketing and advertising of unhealthful foods and beverages to children.
● Require chain restaurants to provide nutrition information on display boards and menus, and reduce their number in the low-income neighborhoods and work with the restaurants to add healthy options to their menus.
Coordination
● Build partnerships and dialogue between family, students, school staff, boards of education, disease specialists, health care providers, community groups and health experts and food providers to develop plans that address issues like asthma, diabetes, nutrition and physical activities.
● Local governments, public health agencies, schools, and community organizations should collaboratively develop and promote programs that encourage healthful eating behaviors and regular physical activity, particularly for populations at high risk of childhood obesity. Community coalitions should be formed to facilitate and promote cross-cutting programs and community-wide efforts.
● Enable state education and health departments to work together to help schools implement quality, daily physical education and other physical activity programs.
● Collaborate with EPA and other programs and institutions to develop, support, and implement environmental conditions/exposure policies to reduce the impact of asthma in schools, homes, and low-income communities.
Research and surveillance
● Conduct research on distributions of disease prevalence, morbidity, mortality, and disease management locally and nationally. Establish coordinated and systematic local, state and national systems for asthma/diabetes surveillance to monitor geographic, temporal, and demographic trends in asthma/diabetes/overweight, health outcomes related to interventions and their cost-effectiveness evaluation, population at risk and the underserved.

E-42
Policy Reports Recommendations (Total studies = 75)
Academic Performance-related Claims
● Conduct research studies for community disease assessment, risk factors and quality improvement studies/interventions. Conduct research studies to help clarify the relationships among environmental exposures, socio-economic factors and other risk factors, and disease incidence and exacerbations particularly in children. Encourage public and private sources to direct funding toward research into effective strategies to prevent overweight and obesity and to maximize limited family and community resources to achieve healthful outcomes for youth.
● Improve understanding of early life origins of asthma and risk factors for asthma fatalities.
● Conduct research on access, coverage, and quality of care and life in special populations.
● Develop a diabetes registry. Public Education and Awareness/ Behavior modifying education (n=11)
● Launch long-term national and state, culturally sensitive public education campaign on asthma and diabetes.
● Implement a targeted education program to policy and decision-makers that includes information on childhood asthma prevention, management, respective services and health promotion education at schools. Work with state legislators, advocacy groups, local policy makers, and businesses to enhance environmental and policy changes that support healthful eating habits and physical activity.
● Develop and disseminate linguistically and culturally appropriate programs and materials on chronic diseases, their self-management and the "best practices", services offered, and information on evaluated interventions and dissemination mechanisms.
● Increase use of buses to go to schools or work, walking and bicycling. ● Encourage adolescents with and at risk for diabetes to engage in regular physical activity, make good nutritional choices, and avoid or stop smoking.
Environmental Policies
● Develop a cohesive national tracking strategy to identify environmental hazards, measure population exposures, and track health conditions related to the environment with a tracking list to the communities and research.
● Reduce emission in new vehicles, use clean fuel, encourage the replacement of old diesel trucks and buses with trucks and buses powered by cleaner alternative fuels such as natural gas; develop zero emission vehicles. Limit the amount of time ships are permitted to idle while at port.
● Enforce housing codes and reduce exposure to asthma triggers such as cockroaches, environmental tobacco smoke, mold, and dust.
Social policies
● Ensure the availability of affordable, quality housing and free of asthma triggers.
(a) strong evidence of effectiveness was found; (b) sufficient evidence of effectiveness was found; (c) available studies provided insufficient evidence to assess the effectiveness of the intervention.

E-43
Section 2. Recommendations on School-Based Interventions Table 8. Inventory of Recommendations on School-Based Interventions for Chronic Health Conditions
Childhood Conditions School-based Programmatic Recommendations
Evidence-based Recommendations
Healthy school environment ■ Evidence-based recommendations pertaining to prevention of overweight/obesity and improved academic performance are linked to those regarding physical inactivity and nutrition.
Overweight/Obesity (n=27) Average school-based policies = 13 (range 4-47)
■ Implement CATCH in eight to ten schools in each education service center region. CATCH students eat school lunches that average no more than 30% of calories from fat and spend 50% of their time during physical education classes in moderate to vigorous physical activity.
■ Fund one full-time CATCH coordinator in each of the state’s 20 education service centers.
■ School Health Advisory Councils, required by Texas Education Code 28.004 to be established in all districts, need to be strengthened and developed.
■ Eliminate the sale of soft drinks, candy bars, and foods high in calories in school buildings.
■ Provide adequate time and space for children to eat meals in a pleasant and safe environment.
■ Provide gyms for elementary and middle schools separate from cafeterias/eating areas.
■ Assess the school’s health policies and programs and
develop a plan for improvement. Use CDC’s School Health Index: A Self-Assessment and Planning Guide (SHI) to identify strengths and weaknesses of current health policies and practices.
Healthy school environment ■ Require 60 minutes/day of moderate to vigorous physical activity.
Physical Inactivity
■ School leaders shall endeavor to ensure the cost-efficient provision of adequate spaces, facilities, equipment, supplies, and operational budgets that are necessary to achieve the objectives of the physical education program.
■ School authorities shall minimize the use of physical education facilities for non-instructional purposes, such as using the gymnasium for school assemblies during times scheduled for physical education classes.
Physical Education ■ Evaluate existing school-based physical-activity policies
and programs.
■ Develop a plan of action for physical activity in Texas schools.
■ Enforce state law mandating 200-400 minutes of physical education every 10 days in grades 1 – 12. Encourage physical activities promotion programs.
■ Mandate at least one hour per day of high-quality physical
education for grades K-12.
■ Provide daily recess periods for elementary school students, featuring time for unstructured but supervised play.

E-44
Childhood Conditions School-based Programmatic Recommendations
Evidence-based Recommendations ■ Suitably adapted physical education shall be included as
part of individual education plans for students with chronic health problems, other disabling conditions, or other special needs that preclude such students' participation in regular physical education instruction or activities.
■ Health-related physical fitness testing shall be integrated into the curriculum as an instructional tool, except in the early elementary grades. Staff will maintain the confidentiality of fitness test results, which will be made available only to students and their parents/guardians.
Pupil/student health education ■ Educate all children about the importance of physical
activity and the role of school and community environments in influencing their activity choices.
School personnel education ■ Educate school administrators, teachers, and PTA
members on the positive relationship between physical activity and academic performance.
■ All physical education teachers shall be adequately prepared and regularly participate in professional development activities to effectively deliver the physical education program. Preparation and professional development activities shall provide basic knowledge of the physical development of children and adolescents combined with skill practice in program-specific activities and other appropriate instructional techniques and strategies designed to promote lifelong habits of physical activity.
■ Develop sensitivity of staff to the problems encountered by the overweight child.
Healthy school environment ■ Develop a mandatory school breakfast program
Undernourished
■ Use only healthful foods as rewards and as fundraisers. Increase the availability and affordability of fresh produce and healthy food choices in schools.
■ Use subsidies to lower the price of healthy foods. ■ Students and staff shall have adequate space to eat
meals in pleasant surroundings and shall have adequate time to eat, relax, and socialize: at least 10 minutes after sitting down for breakfast and 20 minutes after sitting down for lunch. Safe drinking water and convenient access to facilities for hand washing and oral hygiene shall be available.
■ Each district/school shall employ a food service director,
who is properly qualified and certified according to current professional standards, to administer the school food service program and satisfy reporting requirements.
■ Develop and implement nutritional standards for foods
and beverages sold in state vending machines and cafeterias.
■ Limit access to area restaurants during school hours. Nutrition Services ■ Evaluate existing school-based nutrition policies and
programs.
■ Develop an action plan on physical activity and nutrition in Texas schools.
■ Implement SB 19 nutrition standards in grades K-12. Encourage healthy eating promotion programs.

E-45
Childhood Conditions School-based Programmatic Recommendations
Evidence-based Recommendations ■ During each school day the school food service program
shall offer breakfast and lunch as well as snacks for students in organized after-school education or enrichment programs. Each school shall encourage all students to participate in these meal opportunities. In particular, the school shall make efforts to ensure that families are aware of need-based programs for free or reduced-price meals and those eligible families are encouraged to apply. The program shall maintain the confidentiality of students and families applying for or receiving free or reduced-priced meals.
Pupil/student health education ■ Educate all children about the importance of healthy
eating and the role of school and community environments in influencing their eating.
■ Provide instruction in nutrition-related skills, including but not limited to planning a healthy meal, understanding and using food labels, and critically evaluating nutrition information, misinformation, and commercial food advertising.
■ Nutrition education should be incorporated into the
curriculum of science, math and health classes, and one semester of nutrition education should be mandatory in high school.
School personnel education ■ Educate school administrators, teachers, and PTA
members on the positive relationship between nutrition and academic performance.
■ Staff responsible for nutrition education shall be adequately prepared and regularly participate in professional development activities to effectively deliver the nutrition education program as planned. Preparation and professional development activities shall provide basic knowledge of nutrition, combined with skill practice in program-specific activities and instructional techniques and strategies designed to promote healthy eating habits.
School health services ■ Have health clinic personnel plan individualized strategies
to address nutrition.
■ Provide services to ensure that students and staff with nutrition-related health problems are referred to appropriate services for counseling or medical treatment.
Healthy school environment ■ Adopt asthma management education for affected children and support staff
■ Set and monitor standards for maintenance, ventilation, humidity and indoor air quality, mold, dust, pest and insect control in schools, pre-school and daycare facilities.
Asthma (n=15) Average school-based policies = 13 (range 4-35)
■ Enforce smoking bans in school properties at all times, in any form of school transportation, and at school-sponsored events on and off school property. Prohibit tobacco advertising in schools property or publications.
■ Keep the classrooms free of allergens, irritants and trigger substances.
■ Enable optimal functioning of children with asthma in school and child-care settings.
■ Limit vehicles near schools and separate schools from roadways.

E-46
Childhood Conditions School-based Programmatic Recommendations
Evidence-based Recommendations ■ Institute infection control and avoid overcrowding at
daycare settings and schools to reduce respiratory infections.
■ Establish management and support systems for asthma-friendly schools by: identifying school asthma needs; designating a person as asthma activities coordinator; identify all students with asthma using attendance records; developing system for communication among students, teachers, parents, nurses, and health care providers; evaluate programs and policies annually, and seek national and local funds to support asthma programs.
Pupil/student health education ■ All students should be offered with asthma awareness
programs to be peer-supportive and lung health education incorporated into health education curricula.
■ Provide and support smoking prevention and cessation programs.
■ Educate students with asthma in asthma basics, to improve their self-management and emergency response skills and adhere to a written asthma management plan.
School personnel education ■ School staff should be informed about asthma, symptoms
and triggers recognition, and its implication on health, safety, academic performance.
■ Staff should be aware of children with asthma (confidentiality must be preserved) and given a personalized action plan in case of emergencies. The plan will include information such as: personal asthma triggers, symptoms, parent's signature, contact information, list of asthma worsening factors, list of medications and a medications plan.
■ A staff member needs to be appointed for coordinating asthma management plan in school.
■ School teachers have to develop a plan for handling schoolwork missed during the absent days.
■ Physical education instructors and coaches have to be informed on asthma, have quick access on emergency medication and follow the action plan for each student affected. They should encourage the children with asthma to participate in sports.
School health services ■ Train health aids and school nurses in asthma monitoring
techniques and treatment delivery, action and emergency plans and also to train other teaching personnel. School-based asthma services be physician or nurse-directed with a full time nurse, all day and for every day at each school. Have a nurse-to-student ratio of at least 1:750.
■ Ensure the availability of prescribed asthma medications for children with asthma in the school setting and all times immediate access to the medication. Enable students to carry and administer their own medications if the parent/guardian, health care provider, and school nurse so advise.
■ Provide appropriate school-based care and mental health services for students with asthma by: obtaining a written plan for all children with asthma; providing a case management for students with frequent absences, health visits or hospitalizations.

E-47
Childhood Conditions School-based Programmatic Recommendations
Evidence-based Recommendations Counseling, psychological & social services ■ Provide and coordinate school-based counseling,
psychological and social services for students with asthma as appropriate.
■ Advise parents and teachers on behavior strategies and make sure children with asthma are not treated differently than other children. Help children cope with the disease and cultivate independence.
Physical education ■ Teachers should encourage participation of children with
asthma in safe and enjoyable sports and physical activities.
■ Insure students with asthma have access to preventive medication before physical activity and immediate access to emergency medication.
■ Adjust physical activities after an asthma attack or
symptoms and during recovery period.
■ Reduce outdoor activities and physical education when
pollution is high and/or in cold weather. Some indoor activities replacement may be beneficial.
Healthy school environment ■ Evidence-based recommendations pertaining to prevention of diabetes and improved academic performance are linked to those regarding physical inactivity and nutrition.
■ Eliminate marketing of unhealthy foods to children.
Diabetes (n=11) Average school-based policies = 5 (range 3-11)
■ Design and expand coordinated school health programs for diabetes.
Pupil/student health education
■ Establish education and awareness programs in diabetes prevention and delay for students. Conduct focus groups and other types of qualitative research to evaluate the effectiveness of programs.
■ There is insufficient evidence(c) to recommend self-management education in schools for children and adolescents with diabetes.
School personnel education ■ Provide diabetes education to school personnel and
training to administer emergency medical treatment to students with severe hypoglycemia (normative implementation). Utilize schools to promote active self-management.
School health services ■ Implement regulations that permits students with
authorization to test their blood glucose levels on school grounds.
■ Utilize nurse educators based at schools or school districts to link students to health care systems
Physical education ■ Physical education standards should be established for
after-school programs.
(c) available studies provided insufficient evidence to assess the effectiveness of the intervention. Note: Under the Individuals with Disabilities Education Act (IDEA) of 1997, schools are required to promote the health, development, and achievement of students with asthma. (The American Association of School Administrators). School health services are a related service under the Individual with Disabilities Education Act (IDEA), section 504 of the Rehabilitation Act (1973) and Title II of the American Disability Act (ADA). School health services must be provided to students if indicated by Individualized Education Program (IEP) under IDEA and section 504 or Title II of ADA. Not all the students with asthma are covered under IDEA, but they might be covered under IEP or ADA. (National Asthma Education and Prevention program & U.S DHHS & U.S Department of Education)

E-48
Recommendations In determining our recommendations, we applied a “funnel” approach to pare down the hundreds of recommendations found in current policy reports. Of the recommendations for child health interventions, we selected those that were school-based programs and then narrowed this set to those that had evidence of some effect on academic performance. Finally, we reviewed Texas policy and practices (See Appendices) to identify areas where improvement was possible. School-Based Nutrition Interventions Failure to eat breakfast and undernutrition have been shown to adversely affect children’s ability to problem solve in school and potentially have long-lasting effects on a child’s cognitive development and performance in school. One recent study indicated that children in a School Breakfast Program (SBP) had increased language, math and reading scores, as well as reduced tardiness. Another study demonstrated that participation in an SBP reduced absenteeism and improved math scores, although no difference was found in reading, social studies or science. Similar, well-designed studies replicate these results: children who participate in an SBP have higher math grades and lower absence and tardiness rates. Unlike many other areas of school health, the affects of this intervention on academic performance are consistent and significant.
• Based on compelling evidence of impact on academic performance, we recommend an expansion of the School Breakfast Program (SBP) in Texas schools.
The Texas Department of Agriculture established the Texas Public School Nutrition Policy which addresses the issue of SBP, along with other nutrition and food service policies in public schools. For the fiscal year 2003 – 2004, 6,903 Texas schools participated in the SBP. This is impressive when one considers there are 7,009 public schools in Texas (Texas Department of Agriculture, 2004). However, according to the Texas Joint Interim Committee on Nutrition and Health in Public Schools, Interim Report to the 79th Legislature, only 26% of students are actually getting a school breakfast (Joint Interim Committee on Nutrition and Health in Public Schools, 2004). We recommend extending the school breakfast program to a larger number of students as a reliable means of improving academic performance while, at the same time, addressing chronic under-nourishment. School-Based Physical Activity Interventions The benefits of physical activity on health are well accepted; however, there is evidence that increasing its presence in school curricula does not impair academic achievement and may also improve school performance. Based on these findings, we recommend increasing the requirement of physical activity in Texas schools. The Texas Administrative Code (TAC §74.32) requires enrolled K-6 students to participate in a minimum of 30 minutes per day or 135 minutes per week of physical activity (National Association of State Boards of Education). The U.S. Department of Human Services and U.S. Department of Agriculture recommends 60 minutes or more of moderate to vigorous physical activity based on the most current research (Dietz, 2005).
• Given the strength of the evidence, we recommend that Texas schools increase their physical activity requirements to 60 minutes per day.
Project SPARK, an elementary school physical education program, demonstrated significant gains for reading, losses for language, and no differences for math scores on a standardized test, suggesting that, even with time taken away from the academic program for physical education, overall academic functioning was not impaired. Another physical education program incorporating fitness or skill training for 75 minutes a day, compared to usual physical education offered three times a week for 30 minutes, demonstrated increased math scores, better classroom behavior as rated by teachers and no significant

E-49
reduction in reading test scores compared with controls. Regarding level of fitness and academic performance, the California Department of Education has demonstrated a significant linear association between standardized test scores (Stanford Achievement Test Ninth Edition [SAT-9]) and their fitness scores. A dose-response effect was noted for all grades studied where the highest SAT-9 scores were reported by students who met three or more standard levels among the six physical fitness measures, particularly among females, and particularly for mathematics rather than for reading scores. While physical activity may be very important for preventing obesity and diabetes in children, it most likely will also improve academic performance. School-Based Asthma Management Interventions The effectiveness of programs for asthma management has been well documented in a series of well-designed studies. Not only was absenteeism reduced but test scores improved in a number of areas. While Texas has policies that address environmental triggers of asthmatic episodes, there is no written policy on asthma education programs for children or staff or recommendations for schools to consider them.
• Based on compelling evidence, we recommend that Texas schools adopt asthma management education for affected children and support staff.
Section 3. The Economic Impact of Absenteeism Another concluding consideration is how chronic health conditions affect attendance and ultimately school funding. If chronic conditions increase absenteeism, they also result in a cost burden for schools, given that student attendance rates influence school funding. We sought to determine the formula that the Texas Education Agency uses to allocate funds for Texas school districts. Table 9 shows the impact of attendance on school district revenue. The results are calculated under three different assumptions about the state revenue share, since it varies by district; the 40.8% typically used is the state average across districts. Based on that formula we estimate the daily cost for one student’s absence is between $17 and $18. Table 10 compares estimates of per-pupil/per-day costs from several independent resources. Also, if average daily attendance is increased by 1%, Texas school districts could receive an additional $130 million from the state. Table 10, shows the range of estimates available. To be sure, interventions that reduce absenteeism for less than about $18 per student will pay for themselves, over and above the benefits brought to the children they serve.

E-50
Table 9. The Impact of Attendance on State Funding for School Districts in Texas Attendance impact on State funding
A B C D E FSensitivity Analysis Daily Average Attendance
(ADA) for 2003-04Average Daily
Membership (ADM) in 2003-04
Attendance Rate (AR) 2002-03
State Expenditure per pupil (2002-03) ($)
ADA variation for 1% increase in Attendance
Rate
State funding gain per 1% increase in
Attendance Rate ($)
4,017,217.323 4,202,110.2 0.956 3,144.9 42,021.1 132,150,650.0
State Revenues Share (30%) 2,312.4 97,169,595.6
State Revenues Share (50%) 3,854.0 161,949,326.0
Legend of calculations
Source of Indicators
B = ADA/AR; D = Total per Pupil Expenditure*0.408 (State share in total revenues is 40.8%. We assume that state per pupil expenditure follows the same pattern); E = (ADA when AR increases by 1%)-(ADA in 2003-04); F = ADA variation for 1% variation in AR * State Expenditure per pupil
A. Texas Education Agency, Division of State Funding 2003-2004, State Level Summary of Finances [http://www.tea.state.tx.us/school.finance/funding/sofweb3.html]; C. Texas Education Agency, Academic Excellence Indicator System, 2003-2004 State Performance Report [http://www.tea.state.tx.us/perfreport/aeis/2004/state.html]
Our methodology was based on information from TEA and Humble Independent School District. Some of our indicators were corroborated by the estimation performed by the Action for Healthy Kids study. We have estimated the gain in state funding by school districts, at the state level for an increase in 1% of the student attendance rate. It is a known fact that chronic conditions during childhood decrease the attendance rate, and the schools lose state funds which are allocated based on Average Daily Attendance. We make the case that if we were able to prevent these chronic conditions, we will see an increase in the student attendance rate and eventually an increase in state funding for the respective schools. One of estimates, the daily cost per pupil, is equal to $17.5, and thus within the range reported by Action for Healthy Kids Report “The Learning Connection - The value of improving nutrition and physical activity in our schools” which was $9-$20. Beside the usual uncertainties related to simplicity of analysis and crude estimations, we are confident that our estimations do not have a large error margin as they are based on state level data. This means that we have taken into account all the variability in factors related to state funding, like school categories, sizes, variability in types of programs offered, number of students enrolled, etc. We have assumed that when the 1% change in attendance rate takes place, all the rest of the variables important to state funding remain constant (unchanged). As our main assumption is related to application of state share percentage to the state expenditure per pupil, we performed a simple sensitivity analysis to see how the results in state funding gains for school would change when also changing the state revenue share percentage by 10% (both increase and decrease). The results are depicted in Table 9. Definitions of terms Per Pupil Expenditures: This value shows actual expenditures for groups of functions divided by the total number of 2002-03 students. Note that the number shown is not the amount actually spent on each and every student, but rather a per-pupil average of the total Attendance Rate: Attendance rates reported in AEIS (TEA) are based on student attendance for the entire school year. Attendance is calculated as follows: total number of days students were present in 2002-03 divided by total number of days students were in membership in 2002-03 Average Daily Attendance: The quotient of the sum of attendance for each day of the minimum number of days of instruction as described under Section 25.081(a) divided by the minimum number of days of instruction. (Texas Education Code) Membership: A student is in membership for half day when enrolled for at least two hours of daily instruction or in full membership when enrolled for at least four hours of daily instruction.

E-51
Table 10. Estimates of the Cost of Absenteeism for School Districts in Texas
OrganizationPer Pupil State Expenditure ($)
Per Pupil State Expenditure per Day ($) Source of Information
Humble Independent School District 57141 32.29a http://www.humble.k12.tx.us/legislativ
eInfo_attendance.htm
Fort Worth Independent School District 47202 26.22b http://www.fortworthisd.org/comm/me
dia/05_13_05.pdf
Action for Healthy Kids 9.00-20.00c http://www.actionforhealthykids.org/devel/pdf/LC_Color_120204_final.pdf
Average District 31153 17.31d Action for Healthy Kids estimates
Houston ISD 16523 9.18d Action for Healthy Kids estimates
Institute for Health Policy 31454 17.50e
a Information from website; b Information from website (per student expenditure/days of instruction = 4,720/180); c Report information; d Information provided by Action for Healthy Kids; e Proper estimation
Comparison of per student per day costs
1Information retrieved 2005/07/27; 22003-2004; 3 Per pupil revenue from state,Texas,1999-2000; 4 2002-03;
Extended Citations for Tables in Part Three American Lung Association. (2005). State of the air. Protect the air you breathe. Retrieved 2005/05/11, from www.lungusa.org California Department of Health Services. (2002). Strategic plan for asthma in California. Retrieved 2005/05/08, from
http://www.ehib.org/cma/papers/strategic_asthma.pdf California Food Policy Advocates. (2005). Policy recommendations on nutrition assistance and obesity prevention: California
Working Families Policy Summit. Available at: http://ccrwf.org/working/CFPAFederalFoodProgRecs2005.pdf. Center for Disease Control and Prevention. (1996). Guidelines for school health programs to promote lifelong healthy eating.
MMWR, 45(RR-9), 1-33. Center for Disease Control and Prevention. (1997). Guidelines for school and community programs to promote lifelong physical
activity among young people. MMWR, 46(RR-6), 1-36. Center for Disease Control and Prevention. (2001). Increasing physical activity: A report on recommendations of the Task Force
on Community Preventive Services. MMWR, 50(No. RR-18), 1-16. Centers for Disease Control and Prevention. (2004). Strategies for addressing asthma within a coordinated school health
program. With updated resources: Atlanta, Georgia: Centers for Disease Control and Prevention, National Center for Chronic Disease Prevention and Health Promotion. Available at: www.cdc.gov/HealthyYouth/asthma/pdf/strategies.pdf.
Centers for Disease Control and Prevention, National Center for Chronic Disease Prevention and Health Promotion, & Division of Adolescent and School Health. (2004). Improving the health of adolescents & young adults: A guide for states and communities: Atlanta, GA.
Committee on Prevention of Obesity in Children and Youth, Food and Nutrition Board, & Board on Health Promotion and Disease Prevention. (2005). Preventing childhood obesity: Health in the balance. Washington, D.C.: The National Academies Press.
Connecticut Department of Public Health; in collaboration with State of Connecticut Department of Education, & United Way of Connecticut/Infoline. (2002). Managing asthma in Connecticut schools. A resource manual. Retrieved 2005/05/10, from http://www.dph.state.ct.us/BCH/new_asthma/asthma_in_schools.htm
Department of Health and Human Services. (2000). Action against asthma. A strategic plan for the Department of Health and Human Services. Retrieved 2005/05/02, from http://aspe.hhs.gov/sp/index.shtml
Department of Health and Human Services. (2003). National agenda for public health action: The National Public Health initiative on diabetes and women’s health. Atlanta, GA: Department of Health and Human Services, Centers for Disease Control and Prevention.
Department of Health and Human Services, & Department of Education. (2000). Promoting better health for young people through physical activity and sports. A report to the President from the Secretary of Health and Human Services and

E-52
the Secretary of Education: Available at: http://www.cdc.gov/HealthyYouth/physicalactivity/promoting_health/index.htm.
Diabetes in California Task Force. California's Plan for Diabetes 2003-2007: California Diabetes Program. Available at: http://www.caldiabetes.org/content_display.cfm?CategoryID=10&ContentID=92.
Dunn, A. L., & Blair, S. N. (2002). Translating evidenced-based physical activity interventions into practice. The 2010 challenge. American Journal of Preventive Medicine, 22(4 Suppl), 8-9.
Eckersley, R. M. (2001). Losing the battle of the bulge: Causes and consequences of increasing obesity. Medical Journal of Australia, 174(11), 590-592.
Environmental Health Tracking Project Team. (2000). America's environmental health gap: Why the country need a nationwide health tracking network: The Pew Environmental Health Commission. Available at: http://www.pewtrusts.com/pubs/pubs_item.cfm?content_item_id=539&content_type_id=8&page=p1.
Federal Liaison Group on Asthma, & NHLBI. (2001). Coordination of federal asthma activities. Retrieved 2005/04/28, from http://www.nhlbi.nih.gov/resources/docs/asth01rpt.htm
Fifty-Seventh World Health Assembly. (2004). Global strategy on diet, physical activity and health: World Health Assembly. Eighth plenary meeting. Available at: http://www.who.int/dietphysicalactivity/goals/en/.
Florida Department of Health. (2001). The obesity epidemic in Florida: Available at: www.doh.state.fl.us. Florida Department of Health. (2004). Obesity in Florida. Report of the Governor’s Task Force on the obesity epidemic:
Available at: http://www.doh.state.fl.us/Family/GTFOE/index.html. Hearne, S. A., Segal, L.M., Unruh, P.J., Earls, M.J., Smolarcik, P. (2004). F as in Fat. How the obesity policies are failing in
America: Trust for America's Health. Available at: www.healthyamericans.org. Henze, C., & Plaza, C. (2004). Public health issue brief: Physical education. Year end report-2004. Issue Brief Health Policy
Track Serv., 1-16. Hoppin, P., & Donahue, S. (2004). Improving asthma management by addressing environmental triggers: Challenges and
opportunities for delivery and financing. Asthma Regional Council of New England Retrieved 2005/05/15, from http://www.asthmaregionalcouncil.org/
Hoppin, P., & Donahue, S. (2005). Improving asthma management by addressing environmental triggers: Model projects from across the country. Asthma Regional Council of New England Retrieved 2005/05/15, from http://www.asthmaregionalcouncil.org/
International Obesity TaskForce, & European Association for the Study of Obesity. (2002). Obesity in Europe. The case for action: International Obesity TaskForce. Available at: http://www.iotf.org/.
Jeffery, R. W. (1998). Prevention of obesity. In G. A. Bray, Bouchard, C., James W.P.T (Ed.), Handbook of obesity. New York: Marcel Dekker, Inc.
Kahn, E. B., Ramsey, L. T., Brownson, R. C., Heath, G. W., Howze, E. H., Powell, K. E., et al. (2002). The effectiveness of interventions to increase physical activity. A systematic review. American Journal of Preventive Medicine, 22(4 Suppl), 73-107.
Krebs, N. F., Jacobson, M. S., & American Academy of Pediatrics Committee on Nutrition. (2003). Prevention of pediatric overweight and obesity. Pediatrics, 112(2), 424-430.
Kriska, A. (2002). Striving for a more active community. Lessons from the diabetes prevention program and beyond. American Journal of Preventive Medicine, 22(4 Suppl), 6-7.
Kunzli, N., McConnell, R., Bates, D., Bastain, T., Hricko, A., Lurmann, F., et al. (2003). Breathless in Los Angeles: The exhausting search for clean air. American Journal of Public Health, 93(9), 1494-1499.
Lara, M., Nicholas, W., Morton, S., Vaiana, M., Genovese, B., Rachelefsky, G., et al. (2001). Improving childhood asthma outcomes in the United States. A blueprint for policy action: RAND. Available at: www.rand.org.
Lara, M., Rosenbaum, S., Rachelefsky, G., Nicholas, W., Morton, S. C., Emont, S., et al. (2002). Improving childhood asthma outcomes in the United States: A blueprint for policy action. Pediatrics, 109(5), 919-930.
League, C., & Dearry, A. (2004). Obesity and the built environment: Improving public health through improving community design. Research Triangle park, NC: National Institute of Environmental Health Sciences/National Institute of Health, Division of Research Coordination, Planning and Translation.
Lobstein, T., Baur, L., Uauy, R., & IASO International Obesity TaskForce. (2004). Obesity in children and young people: A crisis in public health. Obesity Reviews, 5 Suppl 1, 4-104.
McConnell, R., Berhane, K., Gilliland, F., London, S. J., Islam, T., Gauderman, W. J., et al. (2002). Asthma in exercising children exposed to ozone: A cohort study. Lancet, 359(9304), 386-391.
McKinlay, J., & Marceau, L. (2000). US public health and the 21st century: Diabetes mellitus. Lancet, 356, 757–761. National Association of State Boards of Education. Fit, healthy, and ready to learn: A school health policy guide. Retrieved
2005/07/23, from http://www.nasbe.org/healthyschools/fithealthy.mgi National Asthma Control Task Force. (2000). The Prevention and management of asthma in Canada: A major challenge now
and in the future: Available at: http://www.phac-aspc.gc.ca/publicat/pma-pca00/.

E-53
National Asthma Education and Prevention program & U.S Department of Health and Human Services & U.S Department of Education. Managing Asthma: A guide for Schools: Available at: http://www.nhlbi.nih.gov/health/prof/lung/asthma/asth_sch.htm.
National Diabetes Education Program. (2003). Helping the student with diabetes succeed. A guide for school personnel (No. 03-5217): A Joint Program of the National Institutes of Health and the Centers for Disease Control and Prevention.
National School Board Association. (2003). Helping school boards enact policies that support healthy eating. Retrieved 2005/05/20, from http://www.doh.wa.gov/sboh/Priorities/Children/SPAN/CommunityForumMaterials.htm
Nestle, M., & Jacobson, M. F. (2000). Halting the obesity epidemic: A public health policy approach. Public Health Reports, 115(1), 12-24.
New England Asthma Regional Council. (2001). New England asthma action plan. Retrieved 2005/05/07, from http://www.asthmaregionalcouncil.org/actionplan/guiding.html
Nicholas, E. (2003). Asthma: Why California’s children can’t breathe - Legislative Hearing. Long Beach Alliance for Children with Asthma Retrieved 2005/05/10, from http://www.asthma.umich.edu/meet_the_AAA_sites/projectSum.html#long
Nicholas, E., Lara, M., & Morton, S. (2002). Improving childhood asthma outcomes in the United States. A blueprint for policy action. A description of group process methods used to generate committee recommendations: RAND. Available at: www.rand.org.
Norris, S. L., Nichols, P. J., Caspersen, C. J., Glasgow, R. E., Engelgau, M. M., Jack, L., et al. (2002a). The effectiveness of disease and case management for people with diabetes. A systematic review. American Journal of Preventive Medicine, 22(4 Suppl), 15-38.
Norris, S. L., Nichols, P. J., Caspersen, C. J., Glasgow, R. E., Engelgau, M. M., Jack, L., et al. (2002b). Increasing diabetes self-management education in community settings. A systematic review. American Journal of Preventive Medicine, 22(4 Suppl), 39-66.
Nutrition Council of Oregon. (2003). A healthy, active Oregon: The Statewide Public Health Nutrition Plan. Retrieved 2005/04/14, from www.healthoregon.org/hpcdp/physicalactivityandnutrition/
Oregon Coalition for Promoting Physical Activity. (2003). A healthy active Oregon: The Statewide Physical Activity Plan. 2005/04/16, from www.healthoregon.org/hpcdp/physicalactivityandnutrition/
President’s Task Force on Environmental Health Risks and Safety Risks to Children. (Revised May 2000). Asthma and the environment: A strategy to protect children: Available at: http://yosemite.epa.gov/ochp/ochpweb.nsf/content/whatwe_tf_proj.htm.
Rigby, N., & James, P. (2003). Obesity in Europe-2. Waiting for a green light for health? International Obesity TaskForce Position Paper. Available at: www.iotf.org/media/euobesity.pdf.
Robert Wood Johnson Foundation. (2000). Healthy places, healthy people. Promoting public health and physical activity through community design. Report of an expert's meeting. Washington, DC: Available at: http://www.rwjf.org/files/publications/other/HealthyPlaces.pdf.
Samuels and Associates. (2002). An epidemic: Overweight and unfit children in California Assembly Districts: The California Center for Public Health Advocacy. Available at: www.publichealthadvocacy.org.
Samuels and Associates. (2004). An early warning sign: Diabetes deaths in California Legislative Districts: California Center for Public Health Advocacy. Available at: www.publichealthadvocacy.org.
Statewide Obesity TaskForce. (2003). Strategic plan for the prevention of obesity in Texas: Available at: http://www.tdh.state.tx.us/phn/obesity-plan.pdf.
Task Force on Community Preventive Services. (2001). Strategies for reducing morbidity and mortality from diabetes through health-care system interventions and diabetes Self-management education in community settings (No. 50(RR16); 1-15): CDC.
Task Force on Community Preventive Services. (2002a). Recommendations for healthcare system and self-management education interventions to reduce morbidity and mortality from diabetes. American Journal of Preventive Medicine, 22(4 Suppl), 10-14.
Task Force on Community Preventive Services. (2002b). Recommendations to increase physical activity in communities. American Journal of Preventive Medicine, 22(4 Suppl), 67-72.
Texas Department of State Health Services. (2004). Assessing the burden of asthma in Texas: A summary of Texas asthma surveillance system (DSHS Publication Number: 04-12094): Texas Asthma Program. Available at: http://www.dshs.state.tx.us/chronic/publications.shtm.
Texas Diabetes Council. The changing face of diabetes. A plan to prevent and control diabetes in Texas 2006-2007: Texas Diabetes Council. Available at: http://www.tdh.state.tx.us/diabetes/tdc/stateplan.htm.
Texas Diabetes Council. Putting the brakes on diabetes. A community planning guide to improve health and nutrition for Texas children and adolescents and reduce the risk of Type 2 diabetes: Texas Department of Health. Available at: http://www.tdh.state.tx.us/diabetes/PDF/t2child/Planning%20Guide1.pdf.
Texas Diabetes Council. Type 2 diabetes in children and adolescents: Statewide action plan: Texas Department of Health. Available at: http://www.tdh.state.tx.us/diabetes/PDF/t2child/Statewide%20Action1.pdf.

E-54
The American Association of School Administrators. (Spring 2003). Asthma management, policies and procedures. School Governance and Leadership, 5(No. 1), 6 &13.
The Office of the Governor and the Texas Department of Agriculture. (2004). Charting a course for change: A summary of the Governor's conference on children's obesity in Texas. Retrieved 2005/07/25, from http://squaremeals.org/fn/home/page/0,1248,2348_0_0_0,00.html
The Pew Environmental Health Commission. (2000). Attack asthma: Why America needs a public health defense system to battle environmental threats: The Pew Environmental Health Commission. Available at: http://www.pewtrusts.com/pubs/pubs_item.cfm?content_item_id=310&content_type_id=8&page=p3.
U.S. Department of Health and Human Services. (2001). The Surgeon General’s call to action to prevent and decrease overweight and obesity. [Rockville, MD]: U.S.: Department of Health and Human Services, Public Health Service, Office of the Surgeon General. Available from: U.S. GPO, Washington.
U.S. Department of Health and Human Services, National Heart, Lung and Blood Institute, & National Institutes of Medicine. (1995). Asthma and physical activity in the school. Making a difference (NIH Publication No. 95-3651): Available at: http://www.nhlbi.nih.gov/health/public/lung/asthma/phy_asth.htm.
U.S. Department of Health and Human Services, & National Institutes of Health. (2004). Strategic plan for NIH obesity research. A report of the NIH Obesity Research Task Force: NIH Publication No. 04-5493. Available at: http://obesityresearch.nih.gov/.
U.S. Environmental Protection Agency. (May 2000). Managing asthma in school environment. IAQ tools for schools. Office of Air and Radiation, Office of Radiation and Indoor Air, Indoor Environments Division. EPA # 402-K-00-003. Retrieved 2005/05/27, from http://www.epa.gov/iaq/schools/asthma/
Wechsler, H., McKenna, M. L., Lee, S.M., Dietz, W.H. (December, 2004). The role of schools in preventing childhood obesity. The State Education Standard, 5(2), Available at: http://www.nasbe.org/Standard/Past.html.
Whalen, L. G., Grunbaum, J.A., Kann, L., Hawkins, J., McManus, T., Davis, K.S. (2004). School health profiles: Surveillance for characteristics of health programs among secondary schools (Profiles 2002). Atlanta, GA: Centers for Disease Control and Prevention.
Wheeler, L. S., Boss, L.P., Williams, P.V. (2004). School-based approaches to identifying students with asthma. Journal of School Health, 74(No. 9).
WHO & FAO. (2003). Diet, nutrition and the prevention of chronic diseases. Report of a joint WHO/FAO expert consultation (No. 916). Geneva, Switzerland: WHO Technical report series.
Yancey, A. G., M.; Brown, ER.; McCarthy, W.; Diamant, A. (2003). Diabetes is major health problem for African Americans: UCLA Center for Health Policy Research.

E-55
REFERENCES
Ack, M., Miller, I., & Weil, W. B., Jr. (1961). Intelligence of children with diabetes mellitus. Pediatrics, 28, 764-770. Aday, L. A., Andersen, R., & Fleming, G. V. (1980). Health care in the US. Equitable for whom? Beverly Hills, CA: Sage. Adler, N. E., & Newman, K. (2002). Socioeconomic disparities in health: Pathways and policies. Inequality in education,
income, and occupation exacerbates the gaps between the health "haves" and "have-nots" (Project Hope). Health Affairs, 21(2), 60-76.
Anderson, J., McGee, R. (1994). Comorbidity of depression in children and adolescents. In W. Reynolds & H. F. Johnson (Eds.), Handbook of depression in children and adolescents (pp. 581-601). New York: Plenum.
Anderson, M. E., Freas, M. R., Wallace, A. S., Kempe, A., Gelfand, E. W., & Liu, A. H. (2004). Successful school-based intervention for inner-city children with persistent asthma. The Journal of Asthma, 41(4), 445-453.
Antonovsky, A. (1967). Social class, life expectancy and overall mortality. The Milbank Memorial Fund Quarterly, 45(2), 31-73. Arif, A. A., Borders, T. F., Patterson, P. J., Rohrer, J. E., & Xu, K. T. (2004). Prevalence and correlates of paediatric asthma and
wheezing in a largely rural USA population. J Paediatr Child Health, 40(4), 189-194. Armstrong, F. D., Thompson, R. J., Jr., Wang, W., Zimmerman, R., Pegelow, C. H., Miller, S., et al. (1996). Cognitive
functioning and brain magnetic resonance imaging in children with sickle cell disease. Neuropsychology Committee of the Cooperative Study of Sickle Cell Disease. Pediatrics, 97(6 Pt 1), 864-870.
Arntzen, A., & Nybo Andersen, A. M. (2004). Social determinants for infant mortality in the Nordic countries, 1980-2001. Scandinavian Journal of Public Health, 32(5), 381-389.
Arntzen, A., Samuelsen, S. O., Bakketeig, L. S., & Stoltenberg, C. (2004). Socioeconomic status and risk of infant death. A population-based study of trends in Norway, 1967-1998. International Journal of Epidemiology, 33(2), 279-288.
Auster, R., Leveson, I., & Sarachek, D. (1969). The production of health: An explanatory study. Journal of Human Resources, 4, 411-436.
Austin, J. K., Huberty, T. J., Huster, G. A., & Dunn, D. W. (1998). Academic achievement in children with epilepsy or asthma. Developmental Medicine and Child Neurology, 40(4), 248-255.
Austin, J. K., Huberty, T. J., Huster, G. A., & Dunn, D. W. (1999). Does academic achievement in children with epilepsy change over time? Developmental Medicine and Child Neurology, 41(7), 473-479.
Aye, T., & Levitsky, L. L. (2003). Type 2 diabetes: An epidemic disease in childhood. Curr Opin Pediatr, 15(4), 411-415. Backlund, E., Sorlie, P. D., & Johnson, N. J. (1996). The shape of the relationship between income and mortality in the United
States. Evidence from the National Longitudinal Mortality Study. Annals of Epidemiology, 6(1), 12-20. Ball, K., & Crawford, D. (2005). Socioeconomic status and weight change in adults: A review. Social Science & Medicine,
60(9), 1987-2010. Bandura, A. (1986). Social foundation of thought and action. Englewood Cliffs, NJ: Prentice-Hall. Barrett, D. E., Radke-Yarrow, M., & Klein, R. E. (1982). Chronic malnutrition and child behavior: Effects of early caloric
supplementation on social and emotional functioning at school age. Developmental Psychology, 18(4), 541-556. Bennett, C. L., Ferreira, M. R., & Davis, T. C. (1998). Relation between literacy, race, and stage of presentation among low-
income patients with prostate cancer. Journal of Clinical Oncology, 16, 3101-3104. Bennett, D. S. (1994). Depression among children with chronic medical problems: A meta-analysis. Journal of Pediatric
Psychology, 19(2), 149-169. Berkman, L., & Kawachi, I. (2000). Social epidemiology. Oxford; New York: Oxford University Press. Bibi, H., Shoseyov, D., Feigenbaum, D., Genis, M., Friger, M., Peled, R., et al. (2004). The relationship between asthma and
obesity in children: Is it real or a case of over diagnosis? The Journal of Asthma, 41(4), 403-410. Bicego, G. T., & Boerma, J. T. (1993). Maternal education and child survival: A comparative study of survey data from 17
countries. Social Science & Medicine, 36(9), 1207-1227. Birmaher, B., Ryan, N. D., Williamson, D. E., Brent, D. A., Kaufman, J., Dahl, R. E., et al. (1996). Childhood and adolescent
depression: A review of the past 10 years. Part I. Journal of the American Academy of Child and Adolescent Psychiatry, 35(11), 1427-1439.
Bonner, M. J., Gustafson, K. E., Schumacher, E., & Thompson, R. J., Jr. (1999). The impact of sickle cell disease on cognitive functioning and learning. School Psychology Review, 28(2), 182-193.
Botero, D., & Wolfsdorf, J. I. (2005). Diabetes mellitus in children and adolescents. Arch Med Res, 36(3), 281-290. Bray, G. A. (1992). Obesity increases risk for diabetes. Int J Obes Relat Metab Disord, 16 Suppl 4, S13-17. Breuner, C. C., Smith, M. S., & Womack, W. M. (2004). Factors related to school absenteeism in adolescents with recurrent
headache. Headache, 44(3), 217-222. Brown, R. T., Buchanan, I., Doepke, K., Eckman, J. R., Baldwin, K., Goonan, B., et al. (1993). Cognitive and academic
functioning in children with sickle-cell disease. Journal of Clinical Child Psychology, 22(2), 207-218. Brown, R. T., Davis, P. C., Lambert, R., Hsu, L., Hopkins, K., & Eckman, J. (2000). Neurocognitive functioning and magnetic
resonance imaging in children with sickle cell disease. Journal of Pediatric Psychology, 25(7), 503-513. Buor, D. (2003). Mothers' education and childhood mortality in Ghana. Health Policy, 64(3), 297-309.

E-56
Burne, K., & Walker, G. (1991). The differential effect of mother's education on mortality of boys and girls in India. Population Studies, 45, 203-219.
Burstrom, B., & Fredlund, P. (2001). Self rated health: Is it as good a predictor of subsequent mortality among adults in lower as well as in higher social classes? Journal of Epidemiology & Community Health, 55(11), 836-840.
Caldwel, J. (1979). Education as a factor in mortality decline: An examination of Nigerian data. Population Studies, 33(3), 395-413.
California Department of Education, & Standards and Assessment Division. (2002). California physical fitness testing 2002: Report to the Governor and Legislature. Retrieved 2004/05/05, from http://www.cde.ca.gov/ta/tg/pf/documents/rptgov2002.pdf
Case, R., & Griffin, S. (1991). Rightstart: An early intervention program for insuring that children's first formal learning of arithmetic is grounded in their intuitive knowledge of numbers. St. Louis, MO: Report to the James S. McDonnell Foundation.
Center on Hunger and Poverty and Nutrition Policy. (1998). Statement on the link between nutrition and cognitive development in children. Tufts University.
Centers for Disease Control and Prevention. (2005). Behavioral Risk Factor Surveillance System: Prevalence Data, Nationwide 2000: How is your general health? Retrieved 2005/05/31, from http://apps.nccd.cdc.gov/brfss/education.asp?cat=HS&yr=2000&qkey=1100&state=US
Chen, J., Fair, M., Wilkins, R., & Cyr, M. (1998). Maternal education and fetal and infant mortality in Quebec. Fetal and Infant Mortality Study Group of the Canadian Perinatal Surveillance System. Health Reports, 10(2), 53-64 (Eng); 57-70 (Fre).
Christiansen, S. C., Martin, S. B., Schleicher, N. C., Koziol, J. A., Mathews, K. P., & Zuraw, B. L. (1997). Evaluation of a school-based asthma education program for inner-city children. Journal of Allergy and Clinical Immunology, 100(5), 613-617.
Clark, N. M., Brown, R., Joseph, C. L., Anderson, E. W., Liu, M., & Valerio, M. A. (2004). Effects of a comprehensive school-based asthma program on symptoms, parent management, grades, and absenteeism. Chest, 125(5), 1674-1679.
Coburn, D., & Pope, C. R. (1974). Socioeconomic status and preventive health behavior. Journal of Health and Social Behavior, 15(2), 67-78.
Cohen, F., Kemeny, M. E., Kearney, K. A., Zegans, L. S., Neuhaus, J. M., & Conant, M. A. (1999). Persistent stress as a predictor of genital herpes recurrence. Archives of Internal Medicine, 159(20), 2430-2436.
Coleman, K. J., Tiller, C. L., Sanchez, J., Heath, E. M., Sy, O., Milliken, G., et al. (2005). Prevention of the epidemic increase in child risk of overweight in low-income schools: The El Paso coordinated approach to child health. Archives of Pediatrics and Adolescent Medicine, 159(3), 217-224.
Comstock, G. W., & Tonasica, J. A. (1977). Education and mortality in Washington County, Maryland. Journal of Health and Social Behaviour, 18, 54-61.
Crimmins, E. M., & Saito, Y. (2001). Trends in healthy life expectancy in the United States, 1970-1990: Gender, racial, and educational differences. Social Science & Medicine, 52, 1629-1641.
Crum, R. M., Ensminger, M. E., Ro, M. J., & McCord, J. (1998). The association of educational achievement and school dropout with risk of alcoholism: A twenty-five-year prospective study of inner-city children. Journal of Studies on Alcohol, 59(3), 318-326.
Dahl, R. E., Holttum, J., & Trubnick, L. (1994). A clinical picture of child and adolescent narcolepsy. Journal of the American Academy of Child and Adolescent Psychiatry, 33(6), 834-841.
Darrow, S. L., Russell, M., Cooper, M. L., Mudar, P., & Frone, M. R. (1992). Sociodemographic correlates of alcohol consumption among African American and White women. Women & Health, 18(4), 35-51.
Datar, A., Sturm, R., & Magnabosco, J. L. (2004). Childhood overweight and academic performance: National study of kindergartners and first-graders. Obesity Research, 12(1), 58-68.
Deaton, A., & Paxton, C. (1999). Mortality, education, income, and inequality among American cohorts. Strengthening Head Start: What the evidence shows. Cambridge, MA.
Dietz, W. H. (2005). Physical activity recommendations: Where do we go from here? [editorial]. Journal of Pediatrics, 146, 719-720.
Drake, C., Nickel, C., Burduvali, E., Roth, T., Efferson, C., & Ietro, B. (2003). The pediatric daytime sleepiness scale (PDSS): Sleep habits and school outcomes in middle-school children. Sleep, 26(4), 455-458.
Dunn, A. L., Trivedi, M. H., & O'Neal, H. A. (2001). Physical activity dose-response effects on outcomes of depression and anxiety. Medicine and Science in Sports and Exercise, 33(6 Suppl), S587-S597.
Dwyer, T., Coonan, W. E., Worsley, L. A., & Leitch, D. R. (1979). An assessment of the effects of two physical activity programs on coronary heart disease risk factors in primary school children. Community Health Studies, 3, 196-202.
Edelsohn, G., Ialongo, N., Werthamer-Larsson, L., Crockett, L., & Kellam, S. (1992). Self-reported depressive symptoms in first-grade children: Developmentally transient phenomena? Journal of the American Academy of Child and Adolescent Psychiatry, 31(2), 282-290.
Eliasson, A., Eliasson, A., King, J., Gould, B., & Eliasson, A. (2002). Association of sleep and academic performance. Sleep & breathing (Schlaf & Atmung), 6(1), 45-48.

E-57
Elo, I. T., & Preston, S. H. (1996). Educational differences and mortality: United States 1979-1985. Social Science and Medicine, 42, 47-57.
Epilepsy Foundation. Epilepsy and seizure statistics. Evans, D., Clark, N. M., Feldman, C. H., Rips, J., Kaplan, D., Levison, M. J., et al. (1987). A school health education program
for children with asthma aged 8-11 years. Health Education Quarterly, 14(3), 267-279. Evans, R. G., Barer, M. L., & Marmor, T. R. (1994). Why are some people healthy and others not? The determinants of health of
populations. Hawthorne, New York: Aldine de Gruyter. Falkner, N. H., Neumark-Sztainer, D., Story, M., Jeffery, R. W., Beuhring, T., & Resnick, M. D. (2001). Social, educational, and
psychological correlates of weight status in adolescents. Obesity Research, 9(1), 32-42. Fayers, P. M., & Sprangers, M. A. (2002). Understanding self-rated health. Lancet, 359(9302), 187-188. Feldman, J. J., Makuc, D. M., Kleinman, J. C., & Cornoni-Huntley, J. (1989). National trends in educational differentials in
mortality. American Journal of Epidemiology, 129(5), 919-933. Field, T., Diego, M., & Sanders, M. R. (2001). Exercise is positively related to adolescents' relationships and academics.
Adolescence, 36(141), 105-110. Fleming, J. E., & Offord, D. R. (1990). Epidemiology of childhood depressive disorders: A critical review. Journal of the
American Academy of Child and Adolescent Psychiatry, 29(4), 571-580. Floud, R., & Harris, B. (1996). Health, height and welfare: Britain 1700-1980: NBER Historical Working papers 0087. National
Bureau of Economic Research, Inc. Ford, E. S., Merritt, R. K., Heath, G. W., Powell, K. E., Washburn, R. A., Kriska, A., et al. (1991). Physical activity behaviors in
lower and higher socioeconomic status populations. American Journal of Epidemiology, 133(12), 1246-1256. Fowler, M. G., Davenport, M. G., & Garg, R. (1992). School functioning of U.S. children with asthma. Pediatrics, 90(6), 939-
944. Fowler, M. G., Johnson, M. P., & Atkinson, S. S. (1985). School achievement and absence in children with chronic health
conditions. Journal of Pediatrics, 106(4), 683-687. Fowler, M. G., Whitt, J. K., Lallinger, R. R., Nash, K. B., Atkinson, S. S., Wells, R. J., et al. (1988). Neuropsychologic and
academic functioning of children with sickle cell anemia. Journal of Developmental and Behavioral Pediatrics, 9(4), 213-220.
Fredriksen, K., Rhodes, J., Reddy, R., & Way, N. (2004). Sleepless in Chicago: Tracking the effects of adolescent sleep loss during the middle school years. Child Development, 75(1), 84-95.
Freedman, V. A., Martin, L. G., & Schoeni, R. F. (2002). Recent trends in disability and functioning among older adults in the United States: A systematic review. JAMA, 288(24), 3137-2146.
Fremont, A. M., & Bird, C. E. (2000). Social and psychological factors, physiological process, and physical health. In C. E. Bird, P. Conrad & A. M. Fremont (Eds.), The handbook of medical sociology. (5th ed., pp. 334-352). Upper Saddle River, NJ: Prentice-Hall.
Freudenberg, N., Feldman, C. H., Clark, N. M., Millman, E. J., Valle, I., & Wasilewski, Y. (1980). The impact of bronchial asthma on school attendance and performance. Journal of School Health, 50(9), 522-526.
Fuchs, V. (1982). Time preference and health: An exploratory study. In V. Fuchs (Ed.), Economic Aspects of Health. Second NBER Conference on Health, Stanford, CA: University of Chicago Press.
Fuchs, V. R. (1979). Economics, health, and post-industrial society. Milbank Memorial Fund Quarterly - Health & Society, 57(2), 153-182.
Fuchs, V. R., & Reklis, D. M. (1997). Adding up the evidence on readiness to learn. Jobs and Capital(Summer), 27-29. Gall, G., Pagano, M. E., Desmond, M. S., Perrin, J. M., & Murphy, J. M. (2000). Utility of psychosocial screening at a school-
based health center. Journal of School Health, 70(7), 292-298. Gath, A., Smith, M. A., & Baum, J. D. (1980). Emotional, behavioural, and educational disorders in diabetic children. Archives
of Disease in Childhood, 55(5), 371-375. Geierstanger, S. P., Amaral, G., Mansour, M., & Walters, S. R. (2004). School-based health centers and academic performance:
Research, challgenges, and recommendations. Journal of School Health, 74(9), 347-352. Gillham, J. E., Reivich, K. J., Jaycox, L. H., & Seligman, M. E. P. (1995). Prevention of depressive symptoms in schoolchildren:
Two-year follow-up. Psychological Science, 6(6), 343-351. Gisselmann, M. D. (2005). Education, infant mortality, and low birth weight in Sweden 1973-1990: Emergence of the low birth
weight paradox. Scandinavian Journal of Public Health, 33(1), 65-71. Glaser, R., Rabin, B., Chesney, M., Cohen, S., & Natelson, B. (1999). Stress-induced immunomodulation: Implications for
infectious diseases? JAMA, 281(24), 2268-2270. Glied, S., & Pine, D. S. (2002). Consequences and correlates of adolescent depression. Archives of Pediatrics and Adolescent
Medicine, 156, 1009-1014. Golden, M. P., Ingersoll, G. M., Brack, C. J., Russell, B. A., Wright, J. C., & Huberty, T. J. (1989). Longitudinal relationship of
asymptomatic hypoglycemia to cognitive function in IDDM. Diabetes Care, 12(2), 89-93. Goonan, B. T., Goonan, L. J., Brown, R. T., Buchanan, I., & Eckman, J. R. (1994). Sustained attention and inhibitory control in
children with sickle cell syndrome. Archives of Clinical Neuropsychology, 9(1), 89-104.

E-58
Gortmaker, S. L., Cheung, L. W., Peterson, K. E., Chomitz, G., Cradle, J. H., Dart, H., et al. (1999a). Impact of a school-based interdisciplinary intervention on diet and physical activity among urban primary school children: Eat well and keep moving. Archives of Pediatrics and Adolescent Medicine, 153(9), 975-983.
Gortmaker, S. L., Peterson, K., Wiecha, J., Sobol, A. M., Dixit, S., Fox, M. K., et al. (1999b). Reducing obesity via a school-based interdisciplinary intervention among youth: Planet Health. Archives of Pediatrics and Adolescent Medicine, 153(4), 409-418.
Gozal, D. (1998). Sleep-disordered breathing and school performance in children. Pediatrics, 102(3), 616-620. Gozal, D., & Pope Jr, D. W. (2001). Snoring during early childhood and academic performance at ages thirteen to fourteen years.
Pediatrics, 107(6), 1394. Grey, M., Whittemore, R., & Tamborlane, W. (2002). Depression in type 1 diabetes in children: Natural history and correlates.
Journal of Psychosomatic Research, 53(4), 907-911. Grissom, J. B. (2005). Physical fitness and academic achievement. Journal of Exercise Physiology online, 8(1), 11-25. Grossman, M., & Kaestner, R. (1997). Effects of education on health. In J. R. Berhman & N. Stacey (Eds.), The social benefits of
education. Ann Arbor, MI: University of Michigan Press. Gubhaju, B. B. (1991). Child mortality and survival in South Asia: Nepalese perspectives. New Delhi: Daya Publishing House. Guilleminault, C., Winkle, R., Korobkin, R., & Simmons, B. (1982). Children and nocturnal snoring: Evaluation of the effects of
sleep related respiratory resistive load and daytime functioning. European Journal of Pediatrics, 139(3), 165-171. Gutin, B., Islam, S., Manos, T., Cucuzzo, N., Smith, C., & Stachura, M. E. (1994). Relation of percentage of body fat and
maximal aerobic capacity to risk factors for atherosclerosis and diabetes in black and white seven to eleven-year-old children. J Pediatr, 125(6 Pt 1), 847-852.
Gutstadt, L. B., Gillette, J. W., Mrazek, D. A., Fukuhara, J. T., LaBrecque, J. F., & Strunk, R. C. (1989). Determinants of school performance in children with chronic asthma. American Journal of Diseases of Children, 143(4), 471-475.
Haan, M., Kaplan, G. A., & Camacho, T. (1987). Poverty and health. Prospective evidence from the Alameda County Study. American Journal of Epidemiology, 125(6), 989-998.
Haan, M. N., & Kaplan, G. (1986). The contribution of socieconomic position to minority health. In Report of the Secretary's Task Force on Black and Minority Health (Vol. 2, pp. 69-103). Washington, DC: U.S. Department of Health and Human Services.
Hagen, J. W., Barclay, C. R., Anderson, B. J., Feeman, D. J., Segal, S. S., Bacon, G., et al. (1990). Intellective functioning and strategy use in children with insulin-dependent diabetes mellitus. Child Development, 61(6), 1714-1727.
Hawkins, J. D., Catalano, R. F., Kosterman, R., Abbott, R., & Hill, K. G. (1999). Preventing adolescent health-risk behaviors by strengthening protection during childhood. Archives of Pediatrics and Adolescent Medicine, 153(3), 226-234.
Helmert, U., Herman, B., Joeckel, K. H., Greiser, E., & Madans, J. (1989). Social class and risk factors for coronary heart disease in the Federal Republic of Germany. Results of the baseline survey of the German Cardiovascular Prevention Study (GCP). Journal of Epidemiology and Community Health, 43(1), 37-42.
Hertzman, C. (1999). Population health and human development. In D. P. Keating & C. Hertzman (Eds.), Developmental Health and Wealth of Nations (pp. 21-40). New York: Guilford Press.
Hoelscher, D. M., Day, R. S., Lee, E. S., Frankowski, R. F., Kelder, S. H., Ward, J. L., et al. (2004). Measuring the prevalence of overweight in Texas school children. American Journal of Public Health, 94(6), 1002-1008.
Hoelscher, D. M., Kelder, S. H., Murray, N., Cribb, P. W., Conroy, J., & Parcel, G. S. (2001). Dissemination and adoption of the Child and Adolescent Trial for Cardiovascular Health (CATCH): A case study in Texas. Journal of Public Health Management and Practice, 7(2), 90-100.
Holmes, C. S., Dunlap, W. P., Chen, R. S., & Cornwell, J. M. (1992). Gender differences in the learning status of diabetic children. Journal of Consulting and Clinical Psychology, 60(5), 698-704.
Huberty, T. J., Austin, J. K., Harezlak, J., Dunn, D. W., & Ambrosius, W. T. (2000). Informant agreement in behavior ratings for children with epilepsy. Epilepsy and Behavior, 1(6), 427-435.
Ialongo, N. S., Edelsohn, G., & Kellam, S. G. (2001). A further look at the prognostic power of young children's reports of depressed mood and feelings. Child Development, 72(3), 736-747.
Idler, E. L., & Angel, R. J. (1990). Self-rated health and mortality in the NHANES-I epidemiologic follow-up study. American Journal of Public Health, 80(4), 446-452.
Jacobsen, B. K., & Thelle, D. S. (1988). Risk factors for coronary heart disease and level of education. The Tromso Heart Study. American Journal of Epidemiology, 127(5), 923-932.
Jimerson, S., Egeland, B., Sroufe, L. A., & Carlson, B. (2000). A prospective longitudinal study of high school dropouts examining multiple predictors across development. Journal of School Psychology, 38(6), 525-549.
Joint Interim Committee on Nutrition and Health in Public Schools. (2004). Interim report to the 79th Legislature: Available at: http://www.agr.state.tx.us/.
Joseph, C. L., Foxman, B., Leickly, F. E., Peterson, E., & Ownby, D. (1996). Prevalence of possible undiagnosed asthma and associated morbidity among urban schoolchildren. Journal of Pediatrics, 129(5), 735-742.

E-59
Kaemingk, K. L., Pasvogel, A. E., Goodwin, J. L., Mulvaney, S. A., Martinez, F., Enright, P. L., et al. (2003). Learning in children and sleep disordered breathing: Findings of the Tucson Children's Assessment of Sleep Apnea (TuCASA) Prospective Cohort Study. Journal of the International Neuropsychological Society, 9(7), 1016-1026.
Kaplan, G. A., & Kiel, J. E. (1993). Socioeconomic factors and cardiovascular disease: A review of the literature. Circulation, 88(4), 1973-1998.
Kashani, J. H., Carlson, G. A., Beck, N. C., Hoeper, E. W., Corcoran, C. M., McAllister, J. A., et al. (1987). Depression, depressive symptoms, and depressed mood among a community sample of adolescents. American Journal of Psychiatry, 144(7), 931-934.
Kaufman, F. R., Epport, K., Engilman, R., & Halvorson, M. (1999). Neurocognitive functioning in children diagnosed with diabetes before age 10 years. Journal of diabetes and its complications, 13(1), 31-38.
Keating, D. P., & Hertzman, C. (1999). Developmental health and the wealth of nations. New York: The Guilford Press. Kelder, S. H., Osganian, S. K., Feldman, H. A., Webber, L. S., Parcel, G. S., Luepker, R. V., et al. (2002). Tracking of physical
and physiological risk variables among ethnic subgroups from third to eighth grade: The Child and Adolescent Trial for Cardiovascular Health Cohort Study. Preventive Medicine, 34(3), 324-333.
Kennedy, S. (2003). The relationship between education and health in Australia and Canada (Research Paper No. 93). Hamilton, Ontario, Canada.: McMaster University, Program for Research on Social and Economic Dimensions of an Aging Population. SEDAP Research Program.
Kessler, R. C., Foster, C. L., Saunders, W. B., & Stang, P. E. (1995). Social consequences of psychiatric disorders, I: Education attainment. American Journal of Psychiatry, 152(7), 1026-1032.
Kitagawa, E., & Hauser, P. (1973). Differential mortality in the United States: A study of socio-economic epidemiology. Cambridge, Mass: Harvard University Press.
Kleinman, R. E., Hall, S., Green, H., Korzec-Ramirez, D., Patton, K., Pagano, M. E., et al. (2002). Diet, breakfast, and academic performance in children. Annals of Nutrition and Metabolism, 46 Suppl 1, 24-30.
Koivusilta, L. K., Rimpela, A. H., & Rimpela, M. K. (1999). Health-related lifestyle in adolescence-origin of social class differences in health? Health Education Research, 14(3), 339-355.
Kovacs, M., Goldston, D., & Iyengar, S. (1992). Intellectual development and academic performance of children with insulin dependent diabetes mellitus: A longitudinal study. Developmental Psychology, 28(4), 676-684.
Krieger, N. (2001). Theories for social epidemiology in the twenty-first century: An ecosocial perspective. International Journal of Epidemiology, 30(4), 668-677.
Kuczmarski, R. J., Ogden, C. L., Grummer-Strawn, L. M., Flegal, K. M., Guo, S. S., Wei, R. et al. (2000). CDC growth charts: United States. Adv.Data, 1-27.
Kunst, A., Looman, C., & Mackenbach, J. (1990). Socioeconomic mortality differences in the Netherlands in 1950-1984: A regional study of cause-specific mortality. Social Science & Medicine, 31(2), 141--152.
Kunst, M., & Mackenbach, J. (1994). The size of mortality differences associated with educational level in nine industrialized countries. American Journal of Public Health, 84(6), 932-937.
Landers, D. M., & Petruzzello, S. J. (1994). Physical activity, fitness, and anxiety. In C. Bouchard, R. J. Shephard & T. Stephens (Eds.), Physical activity, fitness and health: International proceedngs and consensus statement (pp. 868-882). Champaign, IL: Human Kinetics Publisher.
Lawrence, E. C. (1991). Poverty and the rate of time preference: Evidence from Panel data. The Journal of Political Economy, 99, 54-77.
Lebowitz, M. D. (1977). The relationship of socio-environmental factors to the prevalence of obstructive lung diseases and other chronic conditions. Journal of Chronic Diseases, 30(9), 599-611.
Leigh, J. P. (1983). Direct and indirect effects of education on health. Social Science & Medicine (1982), 17(4), 227-234. Lerner, M. (1975). Social differences in physical health. In J. Kosa, A. Antonovsky & I. K. Zola (Eds.), Poverty and Health. A
Sociological Analysis (2nd ed., pp. 80-134). Cambridge: Harvard University Press. Lewinsohn, P. M., Clarke, G. N., Seeley, J. R., & Rohde, P. (1994). Major depression in community adolescents: Age at onset,
episode duration, and time to recurrence. Journal of the American Academy of Child and Adolescent Psychiatry, 33(6), 809-818.
Lewinsohn, P. M., Hops, H., Roberts, R. E., Seeley, J. R., & Andrews, J. A. (1993). Adolescent psychopathology: I. Prevalence and incidence of depression and other DSM-III--R disorders in high school students. Journal of Abnormal Psychology, 102(1), 133-144.
Liberatos, P., Link, B. G., & Kelsey, J. L. (1988). The measurement of social class in epidemiology. Epidemiologic Reviews, 10, 87-121.
Lindgren, S., & Lokshin, B. (1992). Does asthma or treatment with theophylline limit children's academic performance? New England Journal of Medicine, 327(13), 926.
Liu, K., Cedres, L. B., Stamler, J., Dyer, A., Stamler, R., Nanas, S., et al. (1982). Relationship of education to major risk factors and death from coronary heart disease, cardiovascular diseases and all causes. Circulation, 66(6), 1308-1314.
Low, M. D., Low, B. J., Baumler, E. R., & Huynh, P. T. (Dec. 2005). Can education policy be health policy? Implication of research on the social determinants of health. Journal of Health Politics, Policy and Law. Forthcoming. (30.6).

E-60
Luepker, R. V., Perry, C. L., McKinlay, S. M., Nader, P. R., Parcel, G. S., Stone, E. J., et al. (1996). Outcomes of a field trial to improve children's dietary patterns and physical activity: The Child and Adolescent Trial for Cardiovascular Health. JAMA, 275(10), 768-776.
Lynch, J., Kaplan, G. A., Pamuk, E. R., Cohen, R. D., Heck, K. E., Balfour, J. L., et al. (1998). Income inequality and mortality in metropolitan areas of the United States. American Journal of Public Health, 88(7), 1074-1080.
Macintyre, S. (1997). The Black Report and beyond: What are the issues? Social Science & Medicine (1982), 44(6), 723-745. Maier, W. C., Arrighi, H. M., Morray, B., Llewllyn, C., & Redding, G. J. (1998). The impact of asthma and asthma-like illness in
Seattle school children. Journal of Clinical Epidemiology, 51(7), 557-568. Manton, K. G., Stallard, E., & Corder, L. (1997). Education-specific estimates of life expectancy and age-specific disability in
the US elderly population: 1982 to 1991. Journal of Aging & Health, 9(4), 419-450. Marmot, M., Kogevinas, M., & Elston, M. (1987). Social/economic status and disease. Annual Review of Public Health, 8, 111-
135. Marmot, M., & Shipley, M. (1996). Do socioeconomic differences in mortality persist after retirement? 25 year follow up of civil
servants from the first Whitehall study. British Medical Journal, 313, 1177-1180. Marmot, M. G. (1986). Social inequalities in mortality: The social environment. In R. G. Wilkinson (Ed.), Class and Health:
Research and Longitudinal Data. London: Tavistock Publishers. Marmot, M. G., Bobak, M., & Davey Smith, G. (1995). Explanations for social inequalities in health. In B. C. Amick & et al.
(Eds.), Society and health (pp. 172-210). New York: Oxford University Press. Marmot, M. G., Smith, G. D., Stansfeld, S., Patel, C., North, F., Head, J., et al. (1991). Health inequalities among British civil
servants: The Whitehall II study. Lancet, 337(8754), 1387-1393. Mathematica Policy Research Inc. (2002). Making a difference in the lives of infants and toddlers and their families: The impacts
of early Head Start. June. Princeton, NJ: Mathematica Policy Research Inc. Available on-line at: http://www.mathematica-mpr.com/3rdLevel/ehstoc.html.
Matthews, K. A., Kelsey, S. F., Meilahn, E. N., Kuller, L. H., & Wing, R. R. (1989). Educational attainment and behavioral and biologic risk factors for coronary heart disease in middle-aged women. American Journal of Epidemiology, 129(6), 1132-1144.
Mayer, S. E. (1997). What money can't buy: Family income and children's life chances. Cambridge, MA: Harvard University Press.
McCarthy, A. M., Lindgren, S., Mengeling, M. A., Tsalikian, E., & Engvall, J. (2003). Factors associated with academic achievement in children with Type 1 diabetes. Diabetes Care, 26(1), 112.
McCarthy, A. M., Lindgren, S., Mengeling, M. A., Tsalikian, E., & Engvall, J. C. (2002). Effects of diabetes on learning in children. Pediatrics, 109(1), E9.
McEwen, B. S. (1998). Protective and damaging effects of stress mediators. New England Journal of Medicine, 338(3), 171-179. McGee, D. L., Liao, Y., Cao, G., & Cooper, R. S. (1999). Self-reported health status and mortality in a multiethnic US cohort.
American Journal of Epidemiology, 149(1), 41-46. McGroder, S. M. (1990). Head Start: What do we know about what works? (Technical Analysis Paper). Office of the Assistant
Secretary for Planning and Evaluation. US Department of Health and Human Services. Available on-line at: http://aspe.hhs.gov.
McKenzie, F. D., & Richmond, J. B. (1998). Linking health and learning: An overview of coordinated school health programs. In E. Marx, S. F. Wooley & D. Northrop (Eds.), Health Is Academic: A Guide to Coordinated School Health Programs (pp. 1-14). New York: Teachers College Press.
McKenzie, T. L., Sallis, J. F., Prochaska, J. J., Conway, T. L., Marshall, S. J., & Rosengard, P. (2004). Evaluation of a two-year middle-school physical education intervention: M-SPAN. Medicine and Science in Sports and Exercise, 36(8), 1382-1388.
McKeown, T. (1979). The direction of medical research. Lancet, 2, 1281-1284. McKewen, M., Neatherlin, J., Millard, M. W., & Lawrence, G. (1998). School-based management of chronic asthma among
inner-city African-American schoolchildren in Dallas, Texas. Journal of School Health, 68, 196-200. McKinlay, J. B., & McKinlay, S. M. (1977). The questionable contribution of medical measures to the decline of mortality in the
United States in the twentieth century. The Milbank Memorial Fund Quarterly Health and Society, 55(3), 405-428. Merry, S., McDowell, M. S., Hetrick, S., Bir, J., & Muller, N. (2004). Psychological and/or educational interventions for the
prevention of depression in children and adolescents. The Cochrane Database of Systematic Reviews, Art. No.: CD003380.pub2. DOI: 10.1002/14651858.CD003380.pub2(Issue 2), 1-140.
Meyers, A. F., Sampson, A. E., Weitzman, M., Rogers, B. L., & Kayne, H. (1989). School Breakfast Program and school performance. American Journal of Diseases of Children, 143(10), 1234-1239.
Midanik, L. T., Klatsky, A. L., & Armstrong, M. A. (1990). Changes in drinking behavior: Demographic, psychosocial, and biomedical factors. The International Journal of the Addictions, 25(6), 599-619.
Millar, W. J., & Wigle, D. T. (1986). Socioeconomic disparities in risk factors for cardiovascular disease. Canadian Medical Association Journal, 134(2), 127-132.

E-61
Miller, D. S., & Miller, T. Q. (1997). A test of socioeconomic status as a predictor of initial marijuana use. Addictive Behaviors, 22(4), 479-489.
Miller, J., Rosenbloom, A., & Silverstein, J. (2004). Childhood obesity. J Clin Endocrinol Metab, 89(9), 4211-4218. Miller, M. K., & Stokes, C. S. (1978). Health status, health resources, and consolidated structural parameters: Implications for
public health care policy. Journal of Health and Social Behavior, 19(3), 263-279. Mirowsky, J., & Ross, C. E. (1986). Social patterns of distress. Annual Review of Sociology, 12, 23-45. Mirowsky, J., & Ross, C. E. (1989). Social causes of psychological distress. Hawthorne: Aldine de Gruyter. Mirowsky, J., & Ross, C. E. (2003). Education, social status, and health. New York: Aldine de Gruyter. Mitchell, W. G., Chavez, J. M., Lee, H., & Guzman, B. L. (1991). Academic underachievement in children with epilepsy.
Journal of Child Neurology, 6(1), 65-72. Morgan, W. P. (1994). Physical activity, fitness, and depression. In C. Bouchard, R. J. Shephard & T. Stephens (Eds.), Physical
activity, fitness and health: International proceedings and consensus statement (pp. 851-867). Champaign, IL: Human Kinetics Publisher.
Morgenstern, H. (1980). The changing association between social status and coronary heart disease in a rural population. Social Science & Medicine, 14A(3), 191-201.
Mossey, J. M., & Shapiro, E. (1982). Self-rated health: A predictor of mortality among the elderly. American Journal of Public Health, 72(8), 800-808.
Munoz, K. A., Krebs-Smith, S. M., Ballard-Barbash, R., & Cleveland, L. E. (1997). Food intakes of US children and adolescents compared with recommendations. Pediatrics, 100(3 Pt 1), 323-329.
Murphy, J. M., Pagano, M. E., Nachmani, J., Sperling, P., Kane, S., & Kleinman, R. E. (1998). The relationship of school breakfast to psychosocial and academic functioning: Cross-sectional and longitudinal observations in an inner-city school sample. Archives of Pediatrics and Adolescent Medicine, 152(9), 899-907.
Nabors, N. A., & Freymuth, A. K. (2002). Attention deficits in children with sickle cell disease. Perceptual and Motor Skills, 95(1), 57-67.
Nader, P. R., Stone, E. J., Lytle, L. A., Perry, C. L., Osganian, S. K., Kelder, S., et al. (1999). Three-year maintenance of improved diet and physical activity: The CATCH cohort. Archives of Pediatrics and Adolescent Medicine, 153(7), 695-704.
National Association of State Boards of Education. (2005/05/16). State-level school health policies: Texas. Retrieved 2005/07/26, from http://www.nasbe.org/HealthySchools/States/states.asp?Name=Texas
National Center for Chronic Disease Prevention and Health Promotion. (2005). Diabetes public health resource: Diabetes projects. from http://www.cdc.gov/diabetes/projects/cda2.htm
National Health Interview Survey. (2002). Summary Health Statistics for U.S. Children. Series 10, Number 221. Newacheck, P. W., Butler, L. H., Harper, A. K., Piontkowski, D. L., & Franks, P. E. (1980). Income and illness. Medical Care,
18(12), 1165-1176. Newland, K. (1981). Infant mortality and the health of the societies (Vol. 47). Worldwatch paper. Washington, DC: Worldwatch
Institute. Nicklas, T., & Johnson, R. (2004). Position of the American Dietetic Association: Dietary guidance for healthy children ages 2 to
11 years. Journal of the American Dietetic Association, 104(4), 660-677. Norris, R., Carroll, D., & Cochrane, R. (1992). The effects of physical activity and exercise training on psychological stress and
well-being in an adolescent population. Journal of Psychosomatic Research, 36(1), 55-65. O'Neil, S. L., Barysh, N., & Setear, S. J. (1985). Determining school programming needs of special population groups: A study
of asthmatic children. Journal of School Health, 55(6), 237-239. Office of the Surgeon General. (1996). Physical activity and health: A report of the Surgeon General. In (pp. 300). Atlanta, GA:
Centers for Disease Control and Prevention, National Center for Chronic Disease Prevention and Health Promotion. Olsen, O., & Madsen, M. (1999). Effects of maternal education on infant mortality and stillbirths in Denmark. Scandinavian
Journal of Public Health, 27(2), 128-136. Owens, J. A., Spirito, A., McGuinn, M., & Nobile, C. (2000). Sleep habits and sleep disturbance in elementary school-aged
children. J Dev Behav Pediatr, 21(1), 27-36. Pappas, G., Queen, S., Hadden, W., & Fisher, G. (1993). The increasing disparity in mortality between socioeconomic groups in
the United States, 1960 and 1986. New England Journal of Medicine, 329, 103-109. Parcel, G. S., Gilman, S. C., Nader, P. R., & Bunce, H. (1979). A comparison of absentee rates of elementary schoolchildren
with asthma and nonasthmatic schoolmates. Pediatrics, 64(6), 878-881. Pearlin, L. I., Lieberman, M. A., Menaghan, E. G., & Mullan, J. T. (1981). The stress process. Journal of Health and Social
Behavior, 22(4), 337-356. Pena, R., Wall, S., & Persson, L. A. (2000). The effect of poverty, social inequity, and maternal education on infant mortality in
Nicaragua, 1988-1993. American Journal of Public Health, 90(1), 64-69. Peterson, J. L., & Marin, G. (1988). Issues in the prevention of AIDS among black and Hispanic men. American Psychologist,
43(11), 871-877.

E-62
Pierce, J. P., Fiore, M. C., Novotny, T. E., Hatziandreu, E. J., & Davis, R. M. (1989). Trends in cigarette smoking in the United States. Educational differences are increasing. JAMA, 261(1), 56-60.
Pincus, E. (1998). Social conditions and self-management are more powerful determinants of health than access to health. Annals of Internal Medicine, 129, 406-411.
Pinhas-Hamiel, O., Dolan, L. M., Daniels, S. R., Standiford, D., Khoury, P. R., & Zeitler, P. (1996). Increased incidence of non-insulin-dependent diabetes mellitus among adolescents. J Pediatr, 128(5 Pt 1), 608-615.
Pollitt, E. (1995). Does breakfast make a difference in school? Journal of the American Dietetic Association, 95(10), 1134-1139. Pollitt, E., Leibel, R. L., & Greenfield, D. (1981). Brief fasting, stress, and cognition in children. American Journal of Clinical
Nutrition, 34(8), 1526-1533. Pollitt, E., Lewis, N. L., Garza, C., & Shulman, R. J. (1982). Fasting and cognitive function. Journal of Psychiatric Research,
17(2), 169-174. Porter, R. (1997). The greatest benefit to mankind: A medical history of humanity. New York and London: Norton. Possel, P., Horn, A. B., Groen, G., & Hautzinger, M. (2004). School-based prevention of depressive symptoms in adolescents: A
6-month follow-up. Journal of the American Academy of Child and Adolescent Psychiatry, 43(8), 1003-1010. Powell, C. A., Walker, S. P., Chang, S. M., & Grantham-McGregor, S. M. (1998). Nutrition and education: A randomized trial of
the effects of breakfast in rural primary school children. American Journal of Clinical Nutrition, 68(4), 873-879. Preston, S. H., & Elo, I. T. (1995). Are educational differentials in adult mortality increasing in the United States? Journal of
Aging & Health, 7(4), 476-496. Puczynski, M. S., Puczynski, S. S., Reich, J., Kaspar, J. C., & Emanuele, M. A. (1990). Mental efficiency and hypoglicemia. J
Dev Behav Pediatr, 11, 170-174. Puczynski, S., Puczynski, M. S., & Ryan, C. M. (1992). Hypoglycemia in children with insulin-dependent diabetes mellitus.
Diabetes Educator, 18(2), 151-153. Rampersaud, G. C., Pereira, M. A., Girard, B. L., Adams, J., & Metzl, J. D. (2005). Breakfast habits, nutritional status, body
weight, and academic performance in children and adolescents. Journal of the American Dietetic Association, 105(5), 743-760.
Randazzo, A. C., Muehlbach, M. J., Schweitzer, P. K., & Walsh, J. K. (1998). Cognitive function following acute sleep restriction in children ages 10-14. Sleep, 21(8), 861-868.
Reich, J. N., Kaspar, J. C., Puczynski, M. S., Puczynski, S., Cleland, J. W., Dell'Angela, K., et al. (1990). Effect of a hypoglycemic episode on neuropsychological functioning in diabetic children. Journal of Clinical and Experimental Neuropsychology, 12(4), 613-626.
Rhodes, S. K., Shimoda, K. C., Waid, L. R., O'Neil, P. M., Oexmann, M. J., Collop, N. A., et al. (1995). Neurocognitive deficits in morbidly obese children with obstructive sleep apnea. The Journal of Pediatrics, 127(5), 741-744.
Richard, H. W., & Burlew, A. K. (1997). Academic performance among children with sickle cell disease: Setting minimum standards for comparison groups. Psychological Reports, 81(1), 27-34.
Roberts, R. E., Roberts, C. R., & Chen, Y. R. (1997). Ethnocultural differences in prevalence of adolescent depression. American Journal of Community Psychology, 25(1), 95-110.
Roberts, R. E., Solari, A. C., Hernandez, M., Arambula, M. C., & Lee, E. S. (2002). The health of Valley youths: Findings from the 2001 Lower Rio Grande Valley Texas Youth Risk Behavior Survey.
Robinson, T. N. (1999). Reducing children's television viewing to prevent obesity: A randomized controlled trial. JAMA, 282(16), 1561-1567.
Rogers, R. G., Hummer, R. A., & Nam, C. B. (1999). Living and dying in the USA: Behavioral, health, and social forces of adult mortality. New York: Academic.
Rogot, E., Sorlie, P. D., & Johnson, N. J. (1992). Life expectancy by employment status, income, and education in the National Longitudinal Mortality Study. Public Health Reports, 107, 457-461.
Romelsjo, A., & Diderichsen, F. (1989). Changes in alcohol-related inpatient care in Stockholm County in relation to socioeconomic status during a period of decline in alcohol consumption. American Journal of Public Health, 79(1), 52-56.
Ross, C. E., & Bird, C. E. (1994). Sex stratification and health lifestyle: Consequences for men's and women's perceived health. Journal of Health and Social Behavior, 35(2), 161-178.
Ross, C. E., & Mirowsky, J. (1983). Social epidemiology of overweight: A substantive and methodological investigation. Journal of Health and Social Behavior, 24(3), 288-298.
Ross, C. E., & Mirowsky, J. (1992). Household, employment, and the sense of control. Social Psychology Quarterly, 55, 217-235.
Ross, C. E., & Mirowsky, J. (1999). Refining the association between education and health: The effects of quantity, credential, and selectivity. Demography, 36(4), 445-460.
Ross, C. E., & Van Willigen, M. (1997). Education and the subjective quality of life. Journal of Health & Social Behavior, 38(3), 275-297.
Ross, C. E., & Wu, C. L. (1995). The links between education and health. American Sociological Review, 60, 719-745.

E-63
Ross, C. E., & Wu, C. L. (1996). Education, age, and the cumulative advantage in health. Journal of Health & Social Behavior, 37(1), 104-120.
Ross, N. A., Wolfson, M. C., Dunn, J. R., Berthelot, J. M., Kaplan, G. A., & Lynch, J. W. (2000). Relation between income inequality and mortality in Canada and the United States: A cross-sectional assessment using census data and vital statistics. British Medical Journal, 320, 898-902.
Rotter, J. B. (1966). Generalized expectancies for internal versus external control of reinforcement. Psychological Monographs, 80(1), 1-28.
Rovet, J. F., Ehrlich, R.M., Hoppe, M. (1987). Intellectual deficits associated with early onset of insulin-dependant diabetes mellitus in children. Diabetes Care, 10, 510-515.
Rowentree, B. (2001). Poverty: A study of town life (1901). In G. D. Smith, D. Dorling & M. Shaw (Eds.), Poverty, Inequality, and Health in Britain, 1800-2000: A Reader (pp. 97-106). Bristol, England: Policy Press.
Rudolph, K. D., Lambert, S. F., Clark, A. G., & Kurlakowsky, K. D. (2001). Negotiating the transition to middle school: The role of self-regulatory processes. Child Development, 72(3), 929-946.
Ryan, C., Longstreet, C., & Morrow, L. (1985a). The effects of diabetes mellitus on the school attendance and school achievement of adolescents. Child: Care, Health and Development, 11(4), 229-240.
Ryan, C., Vega, A., & Drash, A. (1985b). Cognitive deficits in adolescents who developed diabetes early in life. Pediatrics, 75(5), 921.
Ryan, C., Vega, A., Longstreet, C., & Drash, A. (1984). Neuropsychological changes in adolescents with insulin-dependent diabetes. Journal of Consulting and Clinical Psychology, 52(3), 335-342.
Sallis, J. F., McKenzie, T. L., Alcaraz, J. E., Kolody, B., Faucette, N., & Hovell, M. F. (1997). The effects of a 2-year physical education program (SPARK [Sports, Play and Active Recreation for Kids]) on physical activity and fitness in elementary school students. American Journal of Public Health, 87(8), 1328-1334.
Sallis, J. F., McKenzie, T. L., Alcaraz, J. E., Kolody, B., Hovell, M. F., & Nader, P. R. (1993). Project SPARK. Effects of physical education on adiposity in children. Annals of the New York Academy of Science, 699, 127-136.
Sallis, J. F., McKenzie, T. L., Kolody, B., Lewis, M., Marshall, S., & Rosengard, P. (1999). Effects of health-related physical education on academic achievement: Project SPARK. Research Quarterly for Exercise and Sport, 70(2), 127-134.
Sapolsky, R. M. (1997). Why zebras don't get ulcers: An updated guide to stress, stress-related diseases, and coping. New York: W.H. Freeman.
Schatz, J. (2004). Brief report: Academic attainment in children with sickle cell disease. Journal of Pediatric Psychology, 29(8), 627-633.
Schoenfeld, J., Seidenberg, M., Woodard, A., Hecox, K., Inglese, C., Mack, K., et al. (1999). Neuropsychological and behavioral status of children with complex partial seizures. Developmental Medicine and Child Neurology, 41(11), 724-731.
Schweinhart, L. J. (1993). Significant benefits: The High/Scope Perry Preschool Study through age 27. Ypsilanti: The High Scope Press.
Seeman, M. (1983). Alienation motifs in contemporary theorizing: The hidden continuity of the classic themes. Social Psychology Quarterly, 46, 171-184.
Seeman, T. E., & Crimmins, E. (2001). Social environment effects on health and aging: Integrating epidemiologic and demographic approaches and perspectives. Annals of the New York Academy of Sciences, 954, 88-117.
Seeman, T. E., Crimmins, E., Huang, M. H., Singer, B., Bucur, A., Gruenewald, T., et al. (2004). Cumulative biological risk and socio-economic differences in mortality: MacArthur studies of successful aging. Social Science & Medicine, 58(10), 1985-1997.
Seeman, T. E., Singer, B. H., Rowe, J. W., Horwitz, R. I., & McEwen, B. S. (1997). Price of adaptation-allostatic load and its health consequences. MacArthur studies of successful aging. Archives of Internal Medicine, 157(19), 2259-2268.
Seeman, T. E., Singer, B. H., Rowe, J. W., & McEwen, B. S. (2001). Exploring a new concept of cumulative biological risk-allostatic load & its health consequences: MacArthur studies of successful aging. Proceedings of the National Academy of Sciences of the United State of America, 98(8), 4770-4775.
Seidenberg, M., Beck, N., Geisser, M., Giordani, B., Sackellares, J. C., Berent, S., et al. (1986). Academic achievement of children with epilepsy. Epilepsia, 27(6), 753-759.
Seligman, M. E. P. (1975). Helplessness: On depression, development and death. San Francisco, CA: Freeman. Sen, A. (1997). Editorial: Human capital and human capability. World Development, 25(12), 1959-1961. Shakotko, R. S., Edwards, L. N., & Grossman, M. (1980). An exploration of the dynamic relationship between health and
cognitive development in adolescence (NBER Working Paper No. W0454). National Bureau of Economic Research, Inc.
Shapiro, S., McCormick, M. C., Starfield, B. H., Krischer, J. P., & Bross, D. (1980). Relevance of correlates of infant deaths for significant morbidity at 1 year of age. American Journal of Obstetrics & Gynecology, 136(3), 363-373.
Sharp, K., Ross, C. E., & Cockerham, W. C. (1983). Symptoms, beliefs, and the use of physician services among the disadvantaged. Journal of Health and Social Behavior, 24(3), 255-263.

E-64
Shea, S., Stein, A. D., Basch, C. E., Lantigua, R., Maylahn, C., Strogatz, D. S., et al. (1991). Independent associations of educational attainment and ethnicity with behavioral risk factors for cardiovascular disease. American Journal of Epidemiology, 134(6), 567-582.
Shoham-Yakubovich, I., & Barell, V. (1988). Maternal education as a modifier of the association between low birthweight and infant mortality. International Journal of Epidemiology, 17(2), 370-377.
Sibley, B. A., & Etnier, J. L. (2003). The relationship between physical activity and cognition in children: A meta-analysis. Pediatric Exercise Science, 15, 243-256.
Silverstein, M. D., Mair, J. E., Katusic, S. K., Wollan, P. C., O'connell, E. J., & Yunginger, J. W. (2001). School attendance and school performance: A population-based study of children with asthma. Journal of Pediatrics, 139(2), 278-283.
Sorlie, P., Backlund, E., & Keller, J. (1995). US mortality by economic, demographic, and social characteristics: The National Longitudinal Mortality Study. American Journal of Public Health, 85(7), 949-956.
Spence, S. H., Sheffield, J. K., & Donovan, C. L. (2003). Preventing adolescent depression. Journal of Consulting and Clinical Psychology, 71(1), 3-13.
Spence, S. H., Sheffield, J. K., & Donovan, C. L. (2005). Long-term outcome of a school-based, universal approach to prevention of depression in adolescents. Journal of Consulting and Clinical Psychology, 73(1), 160-167.
Strong, W. B., Malina, R. M., Blimkie, C. J. R., Daniels, S. R., Dishman, R. K., Gutin, B., et al. (2005). Evidence based physical activity for school-age youth. Journal of Pediatrics, 146(6), 732-737.
Swift, A. V., Cohen, M. J., Hynd, G. W., Wisenbaker, J. M., McKie, K. M., Makari, G., et al. (1989). Neuropsychologic impairment in children with sickle cell anemia. Pediatrics, 84(6), 1077-1085.
Taylor, H. L. (1967). Occupational factors in the study of coronary heart disease and physical activity. Canadian Medical Association Journal, 96(12), 825-831.
Texas Children's Sickle Cell Center, & Texas Children's Hospital. (2005). Sickle cell disease in children. Retrieved 2005/06/16, from http://www.texaschildrenshospital.org/carecenters/cancer/Presentations/SickleinChildren.pdf
Texas Department of Agriculture. (2004). Texas school meal statistics. Retrieved 2005/07/29, from http://www.squaremeals.org/fn/render/channel/items/0,1249,2348_2368_0_0,00.html
Texas Health Care Information Council. (2003). Preventable hospitalizations in Texas 2001. Retrieved 2005/03/17, from http://www.dshs.state.tx.us/thcic/publications/hospitals/pqireport2001/cover.pdf
Tinkelman, D., & Schwartz, A. (2004). School-based asthma disease management. Journal of Asthma, 41(4), 455-462. Tortolero, S. R., Taylor, W. C., & Murray, N. G. (2001). Physical activity, physical fitness and social, psychological and
emotional health. In N. Armstrong & W. van Mechelen (Eds.), Paediatric Exercise Science and Medicine. Oxford: Oxford University Press.
Trevino, R. P., Yin, Z., Hernandez, A., Hale, D. E., Garcia, O. A., & Mobley, C. (2004). Impact of the Bienestar school-based diabetes mellitus prevention program on fasting capillary glucose levels: A randomized controlled trial. Archives of Pediatrics and Adolescent Medicine, 158(9), 911-917.
Tyroler, H. A., Knowles, M. G., Wing, S. B., Logue, E. E., Davis, C. E., Heiss, G., et al. (1984). Ischemic heart disease risk factors and twenty-year mortality in middle-age Evans County black males. American Heart Journal, 108(3 Pt 2), 738-746.
UNICEF. (2003). Social monitor 2003. Special feature: Infant mortality. Florence: UNICEF Innocenti Research Centre. Avaiable at: http://www.unicef-icdc.org/publications/pdf/monitor03/monitor2003.pdf.
Wagenknecht, L. E., Perkins, L. L., Cutter, G. R., Sidney, S., Burke, G. L., Manolio, T. A., et al. (1990). Cigarette smoking behavior is strongly related to educational status: The CARDIA study. Preventive Medicine, 19(2), 158-169.
Wagstaff, A., Bustreo, F., Bryce, J., Claeson, M., & WHO-World Bank Child Health and Poverty Working Group. (2004). Child health: Reaching the poor. American Journal of Public Health, 94(5), 726-736.
Wagstaff, A., Paci, P., & van Doorslaer, E. (1991). On the measurement of inequalities in health. Social Science & Medicine (1982), 33(5), 545-557.
Wang, W., Enos, L., Gallagher, D., Thompson, R., Guarini, L., Vichinsky, E., et al. (2001). Neuropsychologic performance in school-aged children with sickle cell disease: A report from the Cooperative Study of Sickle Cell Disease. The Journal of Pediatrics, 139(3), 391-397.
Wasserman, A. L., Wilimas, J. A., Fairclough, D. L., Mulhern, R. K., & Wang, W. (1991). Subtle neuropsychological deficits in children with sickle cell disease. The American Journal of Pediatric Hematology/Oncology, 13(1), 14-20.
Weil, W. B., Jr., & Ack, M. (1964). School achievement in juvenile diabetes mellitus. Diabetes, 13, 303-306. Weiss, B. D. (1999). 20 common problems in primary care. New York: McGraw-Hill. Westlund, K., & Nicolaysen, R. (1972). Ten-year mortality and morbidity related to serum cholesterol. A follow-up of 3,751
men aged 40-49. Scand J Clin Lab Invest Suppl, 127, 1-24. Wheaton, B. (1980). The sociogenesis of psychological disorder: An attributional theory. Journal of Health and Social Behavior,
21(2), 100-124. Wilkinson, R. G. (2001). Mind the gap: Hierarchies, health and human evolution. New Haven: Yale University Press. Williams, D. R. (1986). Socioeconomic differentials in health: The role of psychosocial factors. Unpublished
Dissertation/Thesis, Department of Sociology, University of Michigan.

E-65
Williams, D. R. (1990). Socioeconomic differentials in health: A review and redirection. Social Psychology Quarterly, 53, 81-99. Williams, M. V., Baker, D. W., Honig, E. G., Lee, T. M., & Nowlan, A. (1998a). Inadequate literacy is a barrier to asthma
knowledge and self-care. Chest, 114, 1008-1015. Williams, M. V., Baker, D. W., Parker, R. M., & Nurss, J. R. (1998b). Relationship of functional health literacy to patients'
knowledge of their chronic disease: A study of patients with hypertension or diabetes. Archives of Internal Medicine, 158, 166-172.
Winkleby, M. A., Jatulis, D. E., Frank, E., & Fortmann, S. P. (1992). Socioeconomic status and health: How education, income, and occupation contribute to risk factors for cardiovascular disease. American Journal of Public Health, 82(6), 816-820.
Wolfson, A. R., & Carskadon, M. A. (1998). Sleep schedules and daytime functioning in adolescents. Child Development, 69(4), 875-887.
Wolfson, M., Kaplan, G., Lynch, J., Ross, N., & Backlund, E. (1999). Relation between income inequality and mortality: Empirical demonstration. British Medical Journal, 319, 953-957.
Wolfson, M., Rowe, G., Gentleman, J. F., & Tomiak, M. (1993). Career earnings and death: A longitudinal analysis of older Canadian men. Journal of Gerontology, 48(4), S167-179.
Yeatts, K. B., & Shy, C. M. (2001). Prevalence and consequences of asthma and wheezing in African-American and White adolescents. The Journal of Adolescent Health, 29(5), 314-319.
Young, T. L., & Rogers, K. D. (1986). School performance characteristics preceding onset of smoking in high school students. American Journal of Diseases of Children, 140(3), 257-259.
Yu, S. L., Kail, R., Hagen, J. W., & Wolters, C. A. (2000). Academic and social experiences of children with insulin-dependent diabetes mellitus. Children's Health Care, 29(3), 189-207.

E-66
Education and Health: A Review and Assessment
APPENDIX I: Extended Summary of Studies Linking Chronic Conditions and Academic Achievement
SAMPLE, DESIGN, & INTERVENTION ACHIEVEMENT MEASURE OUTCOME
OBESITY Datar (2004) Sample: N = 11,192 first time kindergartners from the
Early Childhood Longitudinal Study (a nationally representative sample of kindergarteners in the U.S. in 1998) Weight Measures: Measured height and weight (1) fall of kindergarten, (2) spring of kindergarten, (3) spring of 1st grade Study Design: Longitudinal
Standardized Item Response Theory scale scores in reading and mathematics
Controlled for SES, parent-child interaction, birth weight, physical activity, and TV watching Baseline: Overweight boys (1.42 pts, p<.05) and girls (1.66 pts, p<.05) scored lower in reading than non-overweight children Overweight boys (1.99 pts, p<.05) and girls (1.21 pts, p<.05) scored lower in math than non-overweight children. After controlling for variables listed above, only boys’ math test scores remained statistically significant. (Effect sizes were between SDs of 0.06 and 0.12.) When baseline scores were also controlled for, there was no difference in test score gains during the first 2 years between overweight and non-overweight children.
Falkner (2001) Sample: N = 9,943 Connecticut public schools students in the 7th, 9th, and 11th grades who responded to a 1995 to 1996 statewide survey of adolescent health Weight Measures: Students reported height and weight on a questionnaire administered in the classroom Study Design: Cross-sectional
6 Items: Measures of liking school, getting along with teachers and students, self-assessment of academic performance, expectations of finishing high school, and whether students had ever repeated a grade
Controlled for grade level, race, and parental SES Obese girls were 1.51 times more likely to report being held back a grade (95% CI: 1.09, 2.10) and 2.09 times more likely to consider themselves poor students (95% CI: 1.35, 3.24) than average weight girls. Obese boys were 1.46 times more likely to consider themselves poor students (95% CI: 1.05, 2.03) and 2.18 times more likely to report that they expect to quit school (95% CI: 1.45, 3.30) than average weight boys. Overweight boys were 1.36 times more likely to consider themselves poor students (95% CI: 1.05, 1.76) and 1.54 times more likely to report that they expect to quit school (95% CI: 1.07, 2.22) than average weight boys.
ASTHMA Freudenberg (1980)
Sample: N = 200 families (children with asthma who had experienced at least 1 episode of wheezing in the past year and parents). Mean age = 10yrs. 60% Hispanic, 36% Black; 60% males, 40% females.
Questions regarding school attendance and performance (including problems in school and participation in physical
Parents reported that average absence from school was 3 days a month. 20% reported six days a month or more. In the sub sample of 50 children with asthma the absence rate was 26 days per year compared to 21 days per year of the overall school absence rate.

E-67
SAMPLE, DESIGN, & INTERVENTION ACHIEVEMENT
MEASURE OUTCOME
Selection criteria related to asthma: 1. Medical records according to American Thoracic Society. 2. One episode of wheezing in past year reported from parent or doctor. Study design: Cross-sectional
education classes) were asked to children and parents. School records for sub sample of 50.
40% of parents reported their children had some problems in schools, most of them being school absence and reading difficulties or language problems for Spanish–speaking parents. 17% of children were required to repeat the year. 70% of parents reported they discussed asthma with the teachers and specifically, absences, restriction of activities and administration of medicines. Problems included management of asthma at school, when to be absent from school and how to keep up with school when missing. Parents reported that one of the problematic classes was physical education. Half of the parents reported partly or complete restriction of activities posed to their children or sometimes teachers would not permit children to rest when needed.
Gutstadt (1989) Sample: N = 99 children between ages of 9 and 17 years (mean age [+- SD], 12.7+- 2.2 years) with moderately severe and severe asthma. Mean age at onset and evaluation of asthma 2 and 12 years respectively. Study Design: Cross sectional
Academic Performance tests: For age 9 to 12 yrs – Woodcock Reading Mastery Test, Key Math Diagnostic Arithmetic Test. For age 13 to 17 yrs – Woodcock-Johnson PsychoEducational Battery (part II test of achievement). Intelligence testing with Slosson Intelligence Tests Psychological assessment with standardized Child Behavioral Checklist (CBCL)
Performance in standardized academic test was average to above average. Mean T scores were 52.5 and 52.4 for reading and mathematics respectively. (Mean in normal population=50) IQ score test were above and average above correlating with mathematics and reading (r2=.55 and r2 =.38 respectively). Academic performance correlated significantly with use of oral steroids in preceding year and socioeconomic status. Earlier onset of disease and longer duration were associated with low performance. Poor behavioral and emotional functioning was associated with low performance. CBCL was significantly correlated with performance (math, r= -.39 and P=.0002; reading, r= -.29 and P=.007) Lack of correlation, surprisingly, between academic performance and school absenteeism.
Lindgren (1992)
Sample: N = 356 children aged 6 to 18 years-old (255 children with asthma who were seen for asthma at two subspecialty clinic in Iowa during a one year period in 1989 and 1990; 101 control siblings)
Academic achievement assessed by Iowa Tests of Basic Skills (ITBS) for grades 1 through 8.
Total children with asthma scored 0.6 to 0.8 SD above the national average for three subject areas on ITED and ITBS. Mean composite T-score = 57.1 (expected mean [+-SD] 50 +-10)

E-68
SAMPLE, DESIGN, & INTERVENTION ACHIEVEMENT
MEASURE OUTCOME
Study design: Cross sectional and matched case-control study for a sub sample????
Iowa Tests of Educational Development (ITED) for grades 9 through 12. Academic subject areas tested were: reading, mathematics, and composite achievement score.
Solely 4.8 % of 255 children had low scores in at least one achievement area. Achievement scores (composite scores on ITED or ITBS) were correlated with parental education, (correl.coef. 0.27 and p<0.001 with mother’s education; c.c. 0.29, p<0.001 with father’s education). 101 matched children with asthma (T-score 58.3) did not differ from their siblings (T-score 57.5) in academic achievement scores, with score ranges similar to total sample. No differences were found between children in boys groups, girls group, for younger or older children. Use of theophylline for at least 3months at time of testing did not have any affect on the academic achievement of children in matched group. Stratified analysis for sex, age, and parental education level yield the same results. No differences were seen in academic achievement between matched children with asthma that used inhaled steroids, even the number was a small one. 23% of parents of children with asthma believed asthma was causing learning problems and 18% thought mediation was the problem. Parents’ convictions were not supported by objective data
O’Neil (1985) Sample: N = 4,036 students aged 5 to 15 years-old (102 children diagnosed with asthma, 139 with chronic bronchitis, and 45 with both (total=286)). Study design: Cross-sectional Asthma Measures: 21- items survey based on a questionnaire related to asthma and chronic bronchitis by Connecticut Lung Association
School records on children’ school performance.
Average absences number for 286 students was 9.5 days per year. 61 out of 286 had 7 or more absences per year during the past years. Absenteeism was significantly correlated with grades (rxy (-.368), p=.01). But majority of grades for these student were average or higher. Reading and math achievements were not affected by the absenteeism. The higher the IQ scores the higher the score in math, reading and general grades.
Padur (1995) Sample: N = 100 children, aged 8 to 16 yrs, (mean = 11.5 yrs, SD =2.5), 52 girls and 48 boys. 75 Caucasian, 13 African-American, 12 other. 25 children with asthma; 25 children with cancer, 25 with diabetes and 25 healthy children served as control groups. Time since chronic disease diagnosis was 6 months or more.
Child Behavior Checklist (CBCL) for behavior problems and social competence. Child Depression Inventory – 27 item questionnaire self-
Affective adjustment: The asthma group scored significantly higher and thus had more depression in CDI-parents score, (F(3,97)=3.57, p=<.02). No differences between groups on CDI and PH anxiety scores. Differences were found for CBCL internalizing scores between groups (p=<.01) with asthma group scoring more severe behavioral problems. Conduct, social and school adjustment:

E-69
SAMPLE, DESIGN, & INTERVENTION ACHIEVEMENT
MEASURE OUTCOME
Study Design: Case-control study
administered, parent and child. Piers-Harris children’s Self-Concept Scale – 80 items, self-reported questionnaire (summary score and “anxiety” cluster scale was used). Play–Performance Scale for Children School Records of absences and grades
Cancer group missed significantly more school that other groups. Groups differed (F (3,77) = 6.70, p=<.001). No differences for CBLC externalizing and social competence scores or GPA. Significant difference between groups on self concept (p=<.04) with asthma children scoring negative self-evaluation. Analysis between groups on PPSC (P=<.001) resulted in children with asthma having greater functional impairment. Children in cancer group had significantly more absences than other groups (p=<.001). Demographic variables significantly correlated with any dependent variable (p<.05, two tailed test) like marital status, gender, time since diagnosis were used as covariates. Analysis of relationship between group status and psychosocial adjustment was controlled for functional status measured by PPSC.
OTHER CHRONIC CONDITIONS (Diabetes, Epilepsy, Sickle Cell Anemia)
DIABETES
Ack (1961)
Sample: 38 children with DM receiving total medical care at Univ. Hospitals of Cleveland aged 3 y to 18 yrs. 38 randomly selected siblings from each family Diabetes Measures: Age at onset; Duration of disease; Episodes of hypoglycemia and acidosis Study Design: case-control
Stanford-Binet Intelligence Scale (I.Q. test)
Age at onset has an effect on intellectual functioning (T=2.13, p<.05). Children with onset <5 yrs had significant lower I.Q.’s than their siblings without diabetes. No relationship between length of illness and I.Q. differences. Not conclusive on hypoglycemic episodes effect on I.Q. results
Gath (1980)
Sample: 76 children with diabetes attending same clinic at 3-monthly intervals, with the same pediatrician and ranged from 5 to 16 years of age. 43 boys , 33 girls, mean diabetes age-at-onset = 7.5 yrs Randomly selected anonymous control children Diabetes Measures: Diabetic control (daily records of urine analysis, symptoms of hypoglycemia and
School questionnaire regarding child’s attitude and attainments at school Rutter B2 behavioral scale for teachers
In overall, children with diabetes were not likely to have more behavioral and emotional problems than controls. Twenty (28.5%) of the children with diabetes and 10 (19%) of the controls were at least 2 years behind chronological age in reading backwardness. Six (8.5%) of the children with diabetes and one (1.5%) control child were slightly slower in reading. More of the boys with diabetes (13) than girls (6) were slower in reading

E-70
SAMPLE, DESIGN, & INTERVENTION ACHIEVEMENT
MEASURE OUTCOME
hyperglycemia); Profound hypoglycemic episodes (notes of the child) Study Design: case-control
backwardness but the difference was not significant. No relation between diabetes duration and psychiatric disorders or reading. Children with poor diabetes control had more psychiatric problems (p<0.02) and backwardness in reading (P<0.02) Hypoglycemic attacks were not related to backwardness in reading. The influence of psychosocial factors on reading problems was evident only when the diabetes was well controlled.
Golden (1989)
Sample: 23 children with IDDM with age-at onset <5 yrs, who were treated at James Whitcomb Riley Hospital for Children Duration of diabetes was 36±20 mo, mean age of diagnosis, mean age at testing = 71±21 mo. Diabetes Measures: HbA1 level; mean daily dose of insulin per kilogram; severe hypoglycemic episodes; total number of self-monitoring blood glucose measurements (SMBG) reported; number of SMBG measurements <2.8 mM. Asymptomatic hypoglycemia was calculated. Study Design: Partially longitudinal (only 17 followed from time of diagnosis and neurocognitive functions not followed longitudinally)
Stanford-Binet Intelligence Scale (Verbal and Quantitative Reasoning, Abstract and Visual Reasoning, Short-term Memory, Composite IQ)
Sever hypoglycemia was not correlated with cognitive scores Age at onset of IDDM correlated (r = -0.43, P = 0.024) with short-term memory, The relationship between frequency of asymptomatic hypoglycemia and intellectual performance appeared to be concentrated within abstract/visual reasoning (r = -.39, p = .037). The copying subscale (r = -.42, p = .022) contributed to the relationship Abstract reasoning score were not correlated with metabolic control (HbA1)
Hagen (1990) Sample: 30 children with IDDM [15 early-onset (EOD) (diagnosed before age 4), 15 late-onset (LOD)(diagnosed after age 4)], 30 children without diabetes all ranging in age from 8.0 to 16.6 yrs Diabetes duration = 10 yrs for EOD; 4 yrs fro LOD. All children were Caucasian Comparisons matched on CA (?), grade level, and families’ SES. Age used as covariate Diabetes Measures: Metabolic control (HbA1) Study Design: Case-control
Peabody Individual Achievement Test (reading, comprehension and mathematics) WISC-R (intelligence; vocabulary and block design subtests) Information processing (forced-choice recall task, pause-time memory task)
Significant main effects for the groups were found for 3 subtests of WISC-R: vocabulary, F(2,57) = 7.30, p<.01; digit span, F(2, 57) = 3.73, p<.05; and information F(2, 57) = 5.33, p<.01. Significant differences were found between: EOD & Controls on vocabulary, F(1,43)= 4.7, p<.05; digit span, F(1,43)= 8.06, p<.01; information, F(1,43)= 4.45, p<.05; and block design, F(1,43)= 4.7, p<.05 LOD & Controls on vocabulary, F(1, 43)= 12.90, p<.01; information, F(1, 43)= 9.62, p<.01; and reading comprehension, F(1,43)= 3.97, p = .05 Children with EOD appear to be less selective in their short-term recall, perhaps indicating an attention deficit and showed less evidence of strategy use.
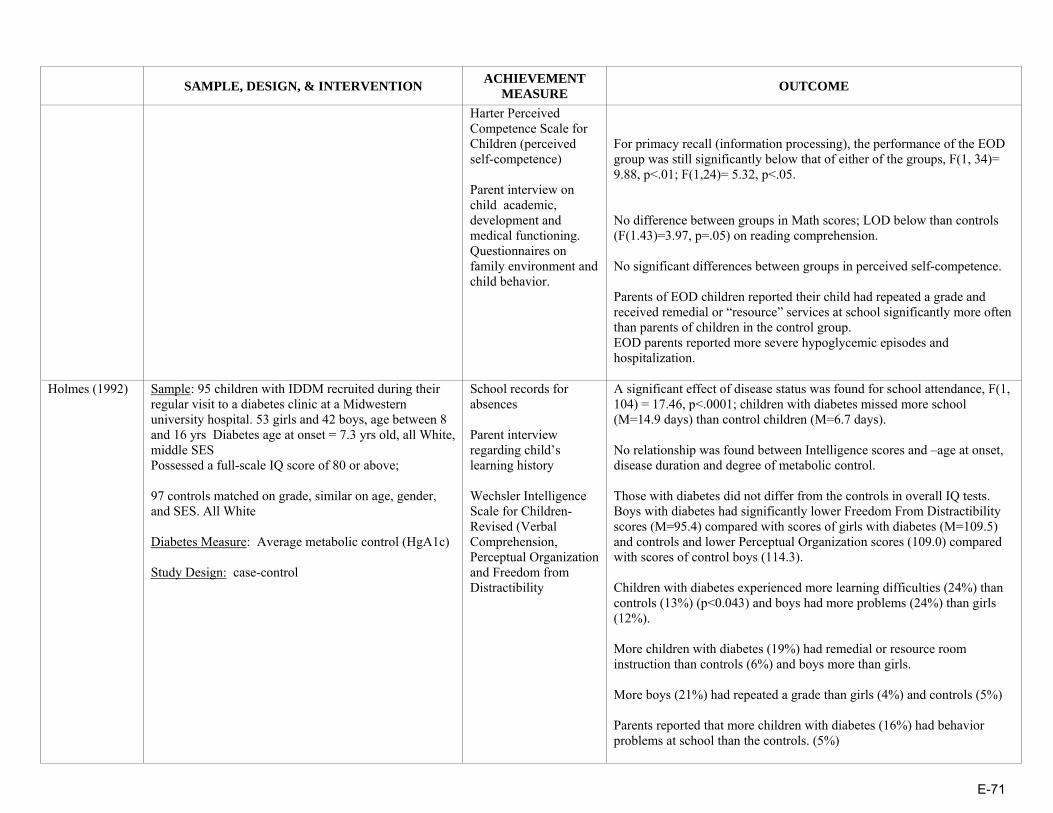
E-71
SAMPLE, DESIGN, & INTERVENTION ACHIEVEMENT
MEASURE OUTCOME
Harter Perceived Competence Scale for Children (perceived self-competence) Parent interview on child academic, development and medical functioning. Questionnaires on family environment and child behavior.
For primacy recall (information processing), the performance of the EOD group was still significantly below that of either of the groups, F(1, 34)= 9.88, p<.01; F(1,24)= 5.32, p<.05. No difference between groups in Math scores; LOD below than controls (F(1.43)=3.97, p=.05) on reading comprehension. No significant differences between groups in perceived self-competence. Parents of EOD children reported their child had repeated a grade and received remedial or “resource” services at school significantly more often than parents of children in the control group. EOD parents reported more severe hypoglycemic episodes and hospitalization.
Holmes (1992)
Sample: 95 children with IDDM recruited during their regular visit to a diabetes clinic at a Midwestern university hospital. 53 girls and 42 boys, age between 8 and 16 yrs Diabetes age at onset = 7.3 yrs old, all White, middle SES Possessed a full-scale IQ score of 80 or above; 97 controls matched on grade, similar on age, gender, and SES. All White Diabetes Measure: Average metabolic control (HgA1c) Study Design: case-control
School records for absences Parent interview regarding child’s learning history Wechsler Intelligence Scale for Children-Revised (Verbal Comprehension, Perceptual Organization and Freedom from Distractibility
A significant effect of disease status was found for school attendance, F(1, 104) = 17.46, p<.0001; children with diabetes missed more school (M=14.9 days) than control children (M=6.7 days). No relationship was found between Intelligence scores and –age at onset, disease duration and degree of metabolic control. Those with diabetes did not differ from the controls in overall IQ tests. Boys with diabetes had significantly lower Freedom From Distractibility scores (M=95.4) compared with scores of girls with diabetes (M=109.5) and controls and lower Perceptual Organization scores (109.0) compared with scores of control boys (114.3). Children with diabetes experienced more learning difficulties (24%) than controls (13%) (p<0.043) and boys had more problems (24%) than girls (12%). More children with diabetes (19%) had remedial or resource room instruction than controls (6%) and boys more than girls. More boys (21%) had repeated a grade than girls (4%) and controls (5%) Parents reported that more children with diabetes (16%) had behavior problems at school than the controls. (5%)

E-72
SAMPLE, DESIGN, & INTERVENTION ACHIEVEMENT
MEASURE OUTCOME
Kaufman (1999) Sample: 55 children with IDDM, 5 to 10 years of age, followed at Children’s Hospital Los Angeles who were primarily English-speaking. Age at diagnosis = 4.5 ± 2.2 yrs; 27 children were <5 yrs old at diabetes onset. No other diseases 15 age-matched siblings Diabetes Measure: Mean HbA1c level for the preceding year prior to entry into the study, Blood glucose levels, and logbook records for the previous year, Lifetime history of severe hypoglycemia Study Design: case-control
Woodcock-Johnson Test of Cognitive Ability Woodcock-Johnson Test of Achievement (broad reading , mathematics, written language, and knowledge overall skills); Beery Developmental Test of Visual Motor Integration; Finger Tapping and Grooved Pegboard (fine motor speed and coordination); Verbal Selective Reminding (sustained attention and the storage and retrieval of verbal information)
Overall neurocognitive scores of children with diabetes were within normal range. Age at diagnosis was negatively correlated with visual-perceptual measures (analysis-synthesis: p<.004) and specific measures of memory (verbal selective reminding retrieval: p<.04; numbers reversed: p<.0004) and positively correlated with mean test scores (finger tapping: p<.006; memory for words: p<.013). No relationship with verbal comprehension, broad cognition and academic achievement HbA1c or metabolic control was negatively associated with: two measures of memory (long-term memory p<0.04, memory for names p<0.03) and some of academic achievement (reading p<0.019, mathematics p<0.014, written languages p<0.017, basic academic skills p<0.006. Duration of diabetes did not correlate with neurocognitive results. Number of events with blood glucose less than 70 was positively associated with: Memory/Attention: Visual-auditory Learning (p<0.006); Long-term memory (p<0.004); Memory for names (p<0.04) Verbal Comprehension: Picture Vocabulary (p<0.03) Academic Achievement: Reading (p<0.04); Passage Comprehension (p<0.018) Knowledge (p<0.02); Science (p<0.05); Humanities (p<0.03) Patients with 10 or more hypoglycemic events/mo compared to subjects with fewer than 10 events/mo, had a significant difference in three measures of memory, verbal comprehension, and broad cognition on two tests of academic achievement (reading and comprehension). Patients with a history of seizures scored statistically lower on two measures of memory (short-term memory, p<0.03; memory for words, p<0.03) than those without a history.
Kovacs (1992) Sample: 95 children, 8 to 13 years of age with newly diagnosed IDDM and their parents. Admitted to the Pediatric Endocrinology inpatient unit of the Children’s Hospital of Pittsburgh (CHP) at study entry. No mental retardation and systemic diseases. 94% White, 6% Black; 45 girls and 42 boys Results based on 87 children
Yearly grade point averages GPA computed from school report cards; Number of days absent obtained from report cards or school records
Initial result show children with higher SES, White, boys performed better that respectively lower SES, Black, and girls, in vocabulary and nonvocabulary tests Over time, verbal performance and school grades declined, whereas nonverbal intellectual performance improved slightly. Vocabulary scores declined (coefficient = -0.471, p<.0005) while Block design score increased over time (coeff. = 0.376, p<.0005.

E-73
SAMPLE, DESIGN, & INTERVENTION ACHIEVEMENT
MEASURE OUTCOME
Follow-up ranged: for 56.3% for 6 yrs, 28.7% for 5 yrs and 14.9% for 3 yrs or less. Follow-up as the same like diabetes duration. Diabetes Measures: Duration of IDDM, metabolic control, and rehospitalization Covariates: SES, Gender, Race age-at onset, depression and anxiety scores Study Design: prospective cohort study over 6 years
The Vocabulary and the Block Design tests of the WISC-R The Children’s Depression Inventory and Revised Children Manifest Anxiety Scale
Degree of metabolic control did not seem to have any effect on the results. With increasing duration of IDDM, grades slightly declined (coefficient = -0.082, p = .005), more so for non-White children. Absenteeism was negatively related to GPA (coefficient= -.218, p<.0005), more so for girls than boys and for non-White children. Higher WISC-R Vocabulary scores were consistently associated with better grades (coefficient= .090, p<.0005).
McCarthy (2003)
Sample: 244 children followed for IDDM at five clinics in a rural Midwestern state, ages 8 to 18 years, who had been diagnosed with diabetes for at least 1 year. They had no other health conditions. 113 boys, 114 girls. Diabetes onset age = 8.3±3.7 yrs old . Mean duration = 7.1±3.9yrs. Middle/High SES 60% response rate. Controlled for SES Diabetes Measures: Metabolic control (mean HbA1c values for current year), number of hospitalizations, and age at onset of diabetes (All obtained from medical charts) Study Design: Cross-sectional
Grade point averages (GPA); Math, Reading, and Core Scores on the Iowa Tests of Basic Skills (grades 3 to 8) or the Iowa Tests of Educational Development (high school). Parent information on school data; Pediatric Behavioral Scale (PBS-50d)
Age at onset did not correlate with academic scores or with absences. Children with hospitalizations due to hyperglycemia and hypoglycemia performed worse in math and core total respectively than those with no hospitalization. Children in the poor control group (HbA1c>10%) performed significantly worse than those in the good-control group (HbA1c<8%) on reading, core total, and GPA and than the average control group (HbA1c = 8% to 10%) on reading and GPA. Absences did not show any impact on academic results (<10 days /year versus >10days/year. Socioeconomic status and parent ratings of behavior problems were significantly correlated with academic achievement. All PBS-50d correlated with GPA (p<.05) The relationships between academic achievement and HbA1c did not show an inverse U-shaped relationship as was hypothesized (R2 = 0.03, P<0.06).
McCarthy (2002)
Sample: 244 children with IDDM from 5 pediatric diabetes clinics in a primarily rural Midwestern state. 8-18 yrs old. No other chronic conditions. 110 siblings control group within 4 years of age of the child with diabetes. 209 anonymous matched classmate control group on age, gender and ITBS scores All groups similar on age, SES and current grade
School Data (Number of days absent, school years repeated, and grade point averages for reading, language and math; Math, Reading, and Core Scores on the Iowa Tests of Basic Skills (ITBS) (grades 3
Current academic performance on the ITBS/ITED did not show lower performance by children with diabetes; in fact, children with diabetes performed statistically better than their siblings on math (mean: 115.0 vs. 111.1) and core total scores (mean: 113.9 vs. 110.5) and better than their matched classmates on reading (mean: 108.9 vs. 106.8). Poorer academic performance tended to occur in children with poorer diabetic control.

E-74
SAMPLE, DESIGN, & INTERVENTION ACHIEVEMENT
MEASURE OUTCOME
Diabetes measures: age at onset, number of hospitalizations, diabetic control (HbA1c) Study Design: Case-control
to 8) or the Iowa Tests of Educational Development (ITED) (high school) Parent questionnaire and Pediatric behavioral scale (PBS-50d)
Children with diabetes had significantly more school absences (mean = 7.3 per year) than their siblings (M = 5.3) and more behavioral problems on items: compliance (p<.01), mood variability (p<.01), fatigue (p<.01), but not learning (p<.09). They did not differ with their siblings and matched controls in GPA, repeated grades or educational support.
Puczynski (1990)
Sample: 24 out of 47 IDDM children , age = 7-15 yrs From the American Diabetes Association summer camp in West Virginia. Info taken from parents for age of the onset, duration, seizure episodes, use of medication and other medical problems. Groups similar in age at onset and duration No medication use other than insulin, no other diseases, no seizures. Sample from low SES Experimental group =14 – blood glucose (bG) ≤60.g/dl, and Euglycemic group =10 children Diabetes measures: blood glucose Study Design: Cross-sectional
Halstead-Reitan neuropsychological test battery for children, WISC-R, and Klove-Matthews Motor steadiness Battery Interview to the parents
Experimental group: After the mild hypoglycemic episode (MHE) no differences were found in scores between children with bG≤40 mg/dl and bG≥40 ml/dl Children with 2 or more symptoms during MHE and those with early onset spend more time in completing the dominant and non dominant name writing test The experimental group scored lower in 5 of 12 measures vs. comparative group (in tap number right, maze4 time right, maze error right, digit forward and digit backward.
Reich (1990)
Sample: 24 children with diabetes recruited from 56 children, ages 6-to-14 years, who were attending a 2 week residential camp sponsored by the American Diabetes Association (10 children who were euglycemic at the time of entry to camp and later experienced a hypoglycemic episode were part of the Baseline Group; 14 children who were not euglycemic at the time of entry and later experienced a mild hypoglycemic episode within the parameters of the study were part of the Experimental Group); 14 Controls Diabetes Measures: Blood glucose levels; Study Design: cross-sectional with repetitive measurements.
Finger Oscillation Test/Finger Tapping Test, Trail Making Test, Parts A and B, and the Name Writing Test (taken from the Halstead-Reitan Neuropsychological Test Battery for Children); Wechsler Intelligence Scale for Children-Revised; Klove-Matthews Motor
On the first scores, the Experimental Group performance was lower on: • Finger Tapping Test: Right, F(2,34) = 6.22, p <.05; • Klove-Matthews Motor Steadiness Battery: Maze Test-Errors-Right, F(2,35) = 4.37, p=<.020 and Maze Test-Time Right, F(2,35) = 6.81, p=<.003; • And on WISC-R Digit Span: Total, F(2,35) = 5.55, p=<.008.
Additionally, the Baseline Group performed worse than the Control Group on the Name Writing Task: Right Hand, F(2,34) = 4.22, p=<.023. Between Trials 1 and 2 the Experimental Group displayed greater performance gains on the: • Klove-Matthews Motor Steadiness Battery: Maze Test – Time-Right, F(2,31) = 4.10, p=<.026 than did the Baseline or Control Groups. •WISC-R Digit Span: Forward, F(2,35)= 3.43, p=<0.44 than the Control

E-75
SAMPLE, DESIGN, & INTERVENTION ACHIEVEMENT
MEASURE OUTCOME
Steadiness Battery Group •on the Trail Making Task: Part A, F(2,35) = 3.72, p=<.034, while the Baseline Group displayed a performance decrement On the second scores, Neuman-Keuls analyses demonstrated that the Experimental Group again scored significantly lower on several tasks than did the Baseline and Control Groups. There is a significant decrease in performance on neuropsychological tasks by children with diabetes who had recovered from physical symptoms after a mild hypoglycemic episode as compared to children with and without diabetes assessed out of the context of a hypoglycemic episode.
Ryan (1985)
Sample: 33 children with IDDM, age 12 to 19 yrs from the Diabetes Clinic at the Children’s Hospital of Pittsburgh; all White Controls matched on age and education level, 83% were siblings Diabetes Measure: Glycosylated hemoglobin Study Design: Case-control
School Attendance: Parent Questionnaire Visuomotor tests: Trail Making, Digit Symbol Substitution, Grooved Pegboard Intelligence: Wechsler Adult Intelligence Scale or Wechsler Intelligence Scale for Children (Revised) Achievement Tests: Wide Range Achievement Test (Reading, Spelling, Math)
Teenagers with diabetes missed significantly more school each year than did control subjects. This difference is due to a greater number of days missed because of illness. Children with diabetes spent an average of 2.2 days in hospital during the preceding 2 years compared to 0 days for the controls. Those with diabetes earned significantly lower scores than those without diabetes on the three measures of school achievement, and performed significantly more slowly on the three visuomotor tasks. Scores on the 3 school achievement tests were best predicted by the School Absences variable, which accounted for between 5.7% and 17.9% of the total variance.
Ryan (1985) Sample: 125 IDDM adolescents, in treatment at the Diabetes Clinic at Children’s Hospital of Pittsburg , age 10 and 19 yrs, all White. Diabetes duration for at least 3 years; 83 controls (80% of them siblings) demographically similar in age, education, sex ratio, handedness and parent’s level of education of children with diabetes
Wechsler Intelligence Scale for Children (Information, Comprehension, Similarities, Vocabulary, and Picture Completion) or WAIS); Boston Embedded
Subjects in the early onset group (diabetes onset before 5) scored significantly worse than those in the late onset group (diagnosed after age 5) in respect to: Intelligence (vocabulary (p<0.05)); Visuospatial Ability (Block Design, Embedded Figures, Road Map); Learning and Memory (Delayed Visual Recall, Immediate Visual Recall, Incidental Memory); Attention and School Achievement (Reading); Mental and Motor Speed (Grooved Pegboard Dominant Hand, Digit Symbol). Significant differences between subjects in the EO group and control

E-76
SAMPLE, DESIGN, & INTERVENTION ACHIEVEMENT
MEASURE OUTCOME
Participation voluntary and children had not suffered from other neurological or psychiatric disorder. Diabetes Measure: Study Design: Case-control
Figures Test, Hooper Visual Organization Test, Road Map Test Symbol digit Learning Test and Ryan’s Verbal learning Test Attention & School Achievement (WAIS or WISC-R Digit Span subtest; Spelling, Reading, and Arithmetic subtests from the Wide Range Achievement Test) Trail Making test, Grooved Pegboard Piers-Harris Children’s Self Concept Scale
group included: Intelligence (Vocabulary, Information, Comprehension); Visuospatial Ability (Block Design, Embedded Figures, Road Map); Learning and Memory (Delayed Visual Recall, Immediate Visual Recall); Attention and School Achievement (Reading, Digit Span); Mental and Motor Speed (Grooved Pegboard Dominant Hand, Digit Symbol, Grooved Pegboard Nondominant Hand). Multiple regression analyses demonstrated that the duration of diabetes and age at onset best predicted scores on neuropsychological tests. No evidence that poor score test in children with diabetes were related to poor self-image.
Ryan (1984)
Sample: 40 children with IDDM who were in treatment at the Diabetes Clinic at the Children’s Hospital of Pittsburgh; age 12-19 yrs, Diabetes duration at least 3 yrs, 50% males, all White 40 controls, (75% were siblings and others demographically similar controls similar on age, grade level, sex ratio, handedness , race or SES) Diabetes Measure: Glycosylated hemoglobin Study Design: Cross-sectional with control
Wechsler intelligence subtests: Information, comprehension, similarities, digit span, vocabulary, picture completion, and block design (WISC-R and WAIS) The Symbol-Digit Paired-Associate Learning Test Short form of Ryan’s Verbal Paired-Associate Learning Test Four-Word Short-Term Memory Test
Patients with diabetes performed within normal limits on all tests. • Children with diabetes scored lower in Verbal IQ than the rest of controls (p=0.023)
• Visuomotor coordination: Children with diabetes scored significantly poorer than those without diabetes on the Digit Symbol substitution test, Grooved Pegboard (Dominant Hand), Grooved Pegboard (Non-Dominant Hand) • Critical flicker thresholds are as well altered in children with diabetes (p=.049)
Children with diabetes performed worse in Wais Comprehension (p=.003 and WAIS digit span subtest (p=.01). A similar trend was found for WAIS picture completion and Block design subtest but not for WISC-R picture completion and block design Associative learning ability and verbal and visual memory processes were found intact in children with diabetes compared to controls.

E-77
SAMPLE, DESIGN, & INTERVENTION ACHIEVEMENT
MEASURE OUTCOME
Boston Embedded Figures Test, Hooper Visual Organization Test, Road Map Test Piers-Harris Children’s Self Concept Scale
No deficits on visuospatial test, no left-right confusion, performed well in Road Map test. Neuropsychological test score did not correlate neither with duration of disease, nor with metabolic control.
Weil (1964)
Sample: 39 children with diabetes & 26 siblings without diabetes who had previous intelligence testing in the Pediatric Diabetes Clinic of the University Hospitals of Cleveland Study Design: Case-control
California Achievement Tests in Reading & Arithmetic – administered in small groups homogenous to age Stanford-Binet Intelligence Scale (Form M) – administered individually in a previous study
Children with diabetes performed no better or no worse than their siblings, each evaluated with regard to their own mental age. Age at onset played no significant role in the academic performance of children with diabetes. Duration of disease did not affect the sibling with diabetes differences in any specific manner.
Yu (2000) Sample: 66 IDDM children, mean age=12 yrs, Early onset diabetes (<5) EOD = 31 and LOD = 35. Ethnicity = White and no other diseases 36 healthy controls matched in age and similar in gender, race, SES, family status Diabetes Measure: Blood glucose levels Study Design: Case-control
Vocabulary and Block Designs subtests of the WISC-III Peabody Individual Achievement Test-Revised (Reading comprehension, Spelling, and Mathematics) Parent interview that inquired about “academic and school information”
About 17% of children with diabetes had repeated a grade; none of the comparison children had been retained. (p<.01) Children with diabetes sores lower in Vocabulary (p<.05) than the controls. The LOD group was significantly lower than the comparison group on Vocabulary (p<.05), with means of 10.5 and 12.4 respectively. Children with diabetes received lower grades in English and language arts, F(1,85) = 5.20, p<.05. The effect remained significant when the children with diabetes were divided into early- and late-onset. Children with diabetes missed days from school than controls (10.6 days/year and to 2.3 days/year respectively, F(1,90) = 6.77, p<.05. The EOD group had more absences (mean = 11.92) than the LOD group (mean = 2.23). Significantly fewer parents of children with diabetes were satisfied with their child’s school performance than were parents of controls, χ2(1, N=97) = 4.81, p<.05. Poorer management of diabetes was associated with poorer attendance

E-78
SAMPLE, DESIGN, & INTERVENTION ACHIEVEMENT
MEASURE OUTCOME
(Beta=.36), which, in turn, was associated with lower grades (Beta=-.41).
EPILEPSY Austin (1999)* Sample: N = 194 children (98 with epilepsy, 96 with
asthma) between 11 and 17 years of age who were followed for 4 years Epilepsy Measure: Seizure severity (summed type of seizure, seizure frequency, and number of antiepileptic drugs and observed side effects) Asthma Measure: Asthma severity (summed frequency of asthma attacks, medication side effects, hospitalizations, visits to hospital emergency departments, and number of school absences) Study Design: Cohort
Time 1: California Achievement Tests (CAT) or the Iowa Tests of Basic Skills (ITBS) Follow Up: Indiana Statewide Tests of Educational Progress (ISTEP)
Covariate: Age at onset The epilepsy sample as a group scored significantly lower in each of the five academic areas (composite, reading, mathematics, language, vocabulary) than the asthma sample. Subjects with high severity epilepsy scored significantly lower than each of the three asthma subgroups and the low-severity epilepsy subgroup. Males with high severity epilepsy performed significantly worse than females who had inactive epilepsy for each of the academic achievement areas. Children with either inactive or low-severity epilepsy had mean scores comparable to national norms; those with high seizure severity had mean scores ranging from 3 to 5 points below national norms. Change in academic achievement over time did not differ significantly from zero for any achievement area for either the epilepsy or asthma samples.
Austin (1998)* Sample: N = 225 children (117 with epilepsy, 108 with asthma) who had been treated with medication for their respective condition for at least 1 year and who had no other chronic condition Asthma or Epilepsy Measures: Age at onset; Seizure-severity; Seizure type; Seizure frequency; Asthma severity score; Asthma frequency scores; Asthma medication side effects; Hospitalizations and emergency room visits for the past year; School absences Study Design: Case-control
School administered group tests (including the California Achievement Test & Iowa Tests of Basic Skills) Child Behavior Checklist
Adjusted for age of onset There were significant main effects for condition for each of the five areas (reading, mathematics, language, vocabulary, and composite), with children with epilepsy fairing worse than children with asthma. Those most at risk for poor academic achievement are children with the most severe epilepsy. Correlations were generally low between academic achievement and school self-concept. Correlations between attitude and academic achievement within the asthma sample were higher than for the epilepsy sample. In the asthma sample, there was a strong trend for males to score lower than females (p = 0.052) in Language. Further, condition severity, attitude, and adaptive functioning were significantly associated with each of the academic achievement scores.

E-79
SAMPLE, DESIGN, & INTERVENTION ACHIEVEMENT
MEASURE OUTCOME
In the epilepsy sample, sex was a significant predictor for the Composite, Reading, Language, and Vocabulary. There was also a strong trend (p = 0.051) for sex to be predictive in the area of mathematics, with males faring worse than females. Condition severity was also significant for composite and language. Child attitude toward epilepsy was significantly associated with composite, language, and vocabulary and was close to significant (p = 0.06) for Reading. Finally, total adaptive functioning was significantly associated with composite, mathematics, and language scores.
Fastenau (2004) Sample: N = 173 8 to 15 year-old children with epilepsy who were recruited from outpatient pediatric neurology clinics, private pediatric neurology practices, and school nurses in Indiana and neighboring areas Epilepsy Measures: Seizure variables (seizure status, seizure type, duration of disorder, and age at onset) Study Design: Cross-sectional
WJR Broad Reading Index, Broad Math Index, Broad Written Language Index WJR Picture Vocabulary, Token Test for Children, Stroop Color-Word Test, Children’s Category Test, Kaufman Brief Intelligence Test, Wide Range Assessment of Memory and Learning, Conners’ Continuous Performance Test, Attentional Capacity Test, Trail Making Test, Grooved Pegboard
Three groups of moderating variables examined: demographic, seizure, and psychosocial variables SEM analysis identified a 3-factor measurement model of neuropsychological function: Verbal/Memory/Executive (VME), Rapid Naming/Working Memory (RN/WM), and Psychomotor (PM). VME and RN/WM were strongly related to reading, math, and writing. PM predicted writing only. Family environment moderated the impact of neuropsychological deficits on writing (p<= 0.01) and possibly for reading (p=0.05). Neuropsychological deficits had a smaller impact on achievement for children in supportive/organized homes compared with children in unsupportive/disorganized homes.
Fowler (1985) Sample: N = 270 children aged 5 to 18 years-old who were selected from 11 pediatric subspecialty clinics at North Carolina Memorial Hospital from July 1982 to May 1983 Chronic Health Conditions: Arthritis (14 children); Blood Disorder (18); Cardiac Disease (Acquired=13, Congenital=50); Chronic Bowel Disease (16); Chronic Lung Disease (17); Cystic Fibrosis (15); Diabetes (16); Epilepsy (37); Hemophilia (34); Sickle Cell Disease (21); Spina Bifida (19)
Parental data included grades repeated and parental perception of school problems School Data: Most recent national achievement test results; Number of days absent for the previous academic year; Teacher attitude regarding the
The groups with the highest rate of hospitalization in the previous 12 months were children with sickle cell disease, arthritis, or chronic bowel disease. Children with hemophilia, arthritis, or asthma were most often absent as a result of the chronic health condition, whereas the other groups reported that minor illnesses were the usual reason for absence. Children with chronic bowel disease and hemophilia scored the highest on school achievement tests, and those with epilepsy, sickle cell disease, or spina bifida the lowest.

E-80
SAMPLE, DESIGN, & INTERVENTION ACHIEVEMENT
MEASURE OUTCOME
Study Design: Cross-sectional impact of the health condition on the child’s school functioning
Three groups that appeared at particular risk for academic difficulties: children with epilepsy, sickle cell disease, or spina bifida, were the most likely to receive special services, repeat a grade, or score more poorly on achievement test, compared with other clinic groups. The variable log of days absent was related to sex, number of clinic visits, physician rating of activity limitation, and acquired cardiac disease or sickle cell disease conditions (R2 = 0.17, p = 0.001). National achievement scores were mainly related to SES factors and arthritis, cystic fibrosis, diabetes, epilepsy, or hemophilia chronic health conditions (R2 = 0.44, p = 0.001), but were unrelated to school absence.
Huberty (2000)*
Sample: N = 227 children (117 with epilepsy, 110 with asthma) drawn from four outpatient clinics in two large Midwestern medical facilities and from the private practices of neurologists and pediatricians who were followed for 4 years Epilepsy Measure: Severity Score (sum of type of seizure, frequency of seizures, and the number of antiepileptic medications and the presence of side effects) Asthma Measure: Severity Score (sum of yearly frequency of episodes, side effects of medication, hospitalizations for asthma, emergency room visits for asthma attacks, and school absences) Study Design: Longitudinal
Teacher Report Form (TRF) of the Child Behavior Checklist (academic performance, working hard, happy, behaving appropriately, and learning) Piers-Harris Self-Concept Scale for Children
Controlled for baseline TRF score and age at onset On average, the asthma sample improved more than the epilepsy sample for each of the TRF scores, with the exception of the change in Behaving Appropriately. At follow-up, the epilepsy sample was performing at the 28th percentile on Academic performance and at the 39th percentile on Total Adaptive Functioning. The asthma sample was performing slightly above the population mean on both of these TRF scales. Among the epilepsy sample, there was no effect of gender for any of the change scores. Change in condition severity was significantly related to change in mean Academic performance. Among the asthma sample, change in condition severity was related to changes in Academic performance, happy, learning, and total adaptive functioning.
Mitchell (1991) Sample: N = 78 children with epilepsy between 5 and 13 years-old who visited the Children’s Hospital Los Angeles Neurology Service Epilepsy Measures: Seizure severity; Duration of seizure disorder; Total medications Study Design: Cross-sectional
Cognitive Measures: •Children <7 years-old: McCarthy Scales of Children’s Abilities (General Cognitive Index—GCI) •Children >7 years-old: Wechsler Intelligence Scale for Children-Revised (WISC-R) •Spanish-speaking children: Escela
In the group as a whole, academic achievement was poor, if not adjusted for IQ. For example, 55% were below the 25th percentile and 40% were below the 10th percentile for reading comprehension. Median IQ was 95, with a range of 80 to 114. After adjusting expected achievement for IQ, 16% to 50% of the subjects were underachieving for each subscale of the PIAT, using criteria of a ½ standard deviation difference between the PIAT and IQ. Achievement versus underachievement in reading recognition, reading comprehension, general knowledge, and spelling was unrelated to seizure

E-81
SAMPLE, DESIGN, & INTERVENTION ACHIEVEMENT
MEASURE OUTCOME
Inteligencia por Ninos Wechsler (EINW) Academic Achievement: Peabody Individual Achievement Test (PIAT) (Subtests: Reading, Reading Comprehension, Spelling, Mathematics, & General Knowledge) Behavior: Parent’s perception of the child’s attention, activity level, conduct, coordination, and sleep problems
and medication variables. Underachievement in mathematics was slightly more frequent in the group with longer duration of seizure disorder, but this barely reached statistical significance (p = .05). Major determinants of achievement included subscales of the HOME scale, age (older children more likely to be underachieving)), and parental education. An equal proportion of newly diagnosed and/or untreated subjects were underachieving compared to those with longstanding epilepsy and anticonvulsant drug treatment.
Seidenberg (1986)
Sample: N = 122 children with epilepsy who were routinely referred for neuropsychological evaluations at the Behavioral Studies Section of the Epilepsy Center of the University of Virginia Medical Center and who were between 7 and 15 years of age Study Design: Cross-sectional
Intelligence: Wechsler Intelligence Scale for Children-Revised (WISC-R) Academic Achievement: subtests of the Wide Range Achievement Test (WRAT) including measures of word recognition, spelling, and arithmetic; reading comprehension subtest from the Peabody Individual Achievement Test
As a group, the children made less academic progress than expected for their IQ level (difference scores) and age level (percentile scores). There was a significant effect for academic area (F = 20.04, df = 3, p<.001) with deficiencies most pronounced for arithmetic and spelling, followed by reading comprehension and word recognition. There was no main effect for sex. There was a substantial percentage of children who were experiencing significant academic deficiencies (i.e., academic difference scores at least 1 SD below expectations based on their IQ level) in the four academic areas. Academic achievement levels were examined with multiple-regression using age, sex, seizure type, age of seizure onset, lifetime seizure frequency total, and number of anticonvulsant medications: Word recognition: Multiple correlation co-efficient =.24; All variables accounted for a statistically nonsignificant 6% of the variance. None of the individual predictors were significant. Spelling: Multiple correlation co-efficient =.33; All variables accounted for an 11% of the variance. Age was the most highly predictive variable, with older children performing more poorly. Reading comprehension: Multiple correlation co-efficient =.28; All

E-82
SAMPLE, DESIGN, & INTERVENTION ACHIEVEMENT
MEASURE OUTCOME
variables accounted for a statistically 8% of the variance. Age was the most highly predictive variable, with older children performing more poorly. Arithmetic: Multiple correlation co-efficient =.41; All variables accounted for a statistically 17% of the variance. Inverse relationships were observed between age and arithmetic scores and earlier age of seizure onset and achievement scores in arithmetic. Lifetime seizure frequency total was inversely related and children with generalized seizures were doing more poorly than children with partial seizures.
Schoenfeld (1999)
Sample: N = 84 children between 7 and 16 years [57 children with complex partial seizures (CPS) and 27 siblings] who were recruited from the University of Wisconsin Hospital Comprehensive Epilepsy Center Age and sex matched sibling comparison group Epilepsy Measures: Age at onset, duration of disorder, antiepilepsy mediations, laterality of interictal epileptiform EEG abnormality, frequency of CPS during the past year, and presence or absence of previous episode of status epilepticus as defined by consensus conference criteria from charts and parent interviews Study Design: Case-control
Wide Range Achievement Test-3 (WRAT-3); California Verbal Learning Test, Kaufman Brief Intelligence Test, Wide Range Assessment of Memory and Learning (WRAML), The Stroop Test, The Symbol Digit Modalities Test (SDMT), the Grooved Pegboard Test
The CPS group performed significantly worse than the sibling control group across all seven cognitive domains including: verbal memory, F(1, 81)= 4.21, p<0.05; non-verbal memory, F(1, 81)= 7.00, p<0.01; language, F(1, 81)= 16.98, p<0.001; academic achievement, F(1, 81)=6.98, p<0.01; problem solving, F(1, 81)=5.13, p<0.05; motor skills, F(1, 81)= 5.75, p<0.05; and mental efficiency, F(1, 81)= 4.07, p<0.05. The CPS group also performed worse than the sibling group on the overall general cognitive performance index, F(1, 81)= 8.39, p<0.01. Age at onset of recurrent seizures was the strongest and most consistent predictor of neuropsychological performance. Patients with a history of status epilepticus also consistently performed more poorly than those without such a history across all cognitive domains, but these differences did not reach statistical significance.
Williams (1996) Sample: N = 84 children with a diagnosis of epilepsy seen through outpatient neurology clinics at a university affiliated medical center Epilepsy Measures: Seizure type (complex partial or absence seizure disorders); Antieleptic drug levels (AED); Level of control Study Design: Cross-sectional
Academic achievement: Standardized achievement tests (Stanford, 8th ed. (n = 62); Metropolitan Achievement Test, 7th ed. (n = 5); Comprehensive Tests of Basic Skills, 4th ed. (n = 2); and Iowa Tests of Basic Skills (n = 2)) Wechsler Intelligence Scale for Children-Revised
Children with good seizure control (M = 50%tile) were reading at a significantly higher level (F[1, 70] = 4.1, p<.04) than children with poorly controlled seizures (M = 37.7%tile). Children with poor seizure control demonstrated more withdrawn behavior, thought problems, and attention problems than those with good seizure control. According to maternal reports, children with poor seizure control (M = 37.5) had more difficulty with school performance than those with good seizure control (M = 44.9).

E-83
SAMPLE, DESIGN, & INTERVENTION ACHIEVEMENT
MEASURE OUTCOME
SICKLE CELL ANEMIA Armstrong (1996)
Sample: N = 194 children with sickle cell disease (SCD) between 6 and 12 years of age (135 homozygous for HbS) Sickle Cell Measures: MRI (normal MRI, silent infarct, and clinical history of stroke (CVA)) Study Design: Cross-sectional
Wechsler Intelligence Scale for Children-Revised (WISC-R); Woodcock-Johnson-Revised, Tests of Achievement (WJ-R); Purdue Pegboard; Child Behavior Checklist (CBCL)
Age and average hematocrit levels were significantly associated with neuropsychological functioning—Used as covariates. Children with a history of CVA scored significantly poorer on intelligence, academic achievement, and motor function than their peers. Children with silent infarcts performed significantly poorer on vocabulary, arithmetic, and visual motor speed and coordination than children with normal MRIs. There was also a trend for these children to score lower on general knowledge (information).
Brown (2000) Sample: N = 63 children and adolescents (aged 6.33 years to 17.00 years) with sickle cell disease (SCD) who were receiving treatment at a comprehensive NIH sickle cell center Sickle Cell Measures: MRI (no cerebral vascular accidents; overt cerebral vascular accidents; silent strokes) Study Design: Cross-sectional
Neurocognitive Battery: Wechsler Intelligence Scale for Children-III; Woodcock-Johnson Psychoeducational Test Battery: Tests of Achievement-Revised (WJ-R); Cancellation A’s Task; Trail Making Test; Freedom-from-Distractibility; Boston Naming Test; Rapid Automatized Naming; Perdue Pegboard; Child Behavior Checklist; Vineland Adaptive Behavior Scales
Children with overt cerebral vascular accidents (CVA’s) performed more poorly than their peers on tasks requiring sustained attention and effort or on tasks that were associated with frontal lobe involvement. There were not significant differences on measures of academic achievement (WJ-R).
Chua-Lim (1993)
Sample: N = 20 (10 cases, 10 matched controls); Cases were identified through the Sickle Cell Clinic and the Ambulatory Clinic of the Department of Pediatrics, University of South Alabama; Controls were matched on age, sex, and race and were recruited from the Ambulatory Clinic of the Department of Pediatrics, University of South Alabama Study Design: Case-control
The Pediatric Examination of Educational Readiness (PEER) The McCarthy Scales of Children’s Abilities (1. General Cognitive Index 2. Scale Indices on verbal, perceptual performance, quantitative, motor, and
Children in the sickle cell group demonstrated significantly lower scores in all categories except somatesthetic input. Categories included Input (visual, verbal, sequential, somatesthetic, subtotal); Storage (short-term memory; experiential acquisition, subtotal); and Output (fine motor, motor sequential, verbal sequential, verbal experiential, subtotal). 50% to 70% of children with sickle cell disease have deficiencies in the areas of visual input, sequential input, short-term memory, experimental acquisition, fine motor output, and motor sequential output. Some of these patients, however, had no deficiencies and had scores within the normal range.

E-84
SAMPLE, DESIGN, & INTERVENTION ACHIEVEMENT
MEASURE OUTCOME
motor 3. Rating of the child’s hand dominance
There were high correlations between multiple parameters in the PEER. The McCarthy Scales of Children’s Abilities showed that children with sickle cell disease were functioning within normal cognitive levels.
Cohen (1994) Sample: N = 10 children aged 6.6 years to 16.1 years with homozygous sickle cell disease (HbSS) receiving transfusion therapy following a stroke who were recruited from the pediatric sickle cell clinic at the Medical College of Georgia in Augusta; Divided into 1.) Children with only a single left hemisphere stroke (LCI) (N = 4) and 2.) those with only a single right hemisphere stroke (RCI) (N = 6) Stroke Measures: Noncontrasted computed tomography (CT), magnetic resonance imaging (MRI), transcranial Doppler, and angiography Study Design: Cross-sectional
Neuropsychological Evaluation: (1) tests of intelligence--Wechsler Intelligence Scale for Children-revised (WISC-R); (2) tests of linguistic functions—Peabody Picture Vocabulary Test-Revised (PPVT-R), Wepman Auditory Discrimination Test (Wepman), Boston Naming Test (BNT); (3) tests of visual-spatial/constructional abilities—Developmental Test of Visual Motor Integration (DTVMI), Test of Visual Perceptual Skills, Kaufman Assessment Battery for Children (Gestalt Closure); (4) tests of sensory-motor functions: Finger Tapping, Finger Tip Number Writing; (5) test of memory-- Kaufman Assessment battery for Children, Detroit Test of Learning Aptitude-2, test of visual perceptual skills; (6) test of achievement—WRAT-R and Gray oral
The LCI subgroup exhibited a global impairment (verbal as well as nonverbal/spatial abilities) on intelligence testing. The RCI group exhibited impairment of nonverbal/ spatial abilities only. The verbal IQ of the LCI subgroup was significantly lower (p = 0.05) than that of the RCI subgroup which was in the low-average range. The LCI subgroup exhibited impairment across all language measures. The RCI group performed significantly lower (p = 0.05) on assessment of expressive vocabulary only. On measures of visual-spatial/constructional ability, both subgroups exhibited a similar pattern of performance with no significant differences. The performance of the LCI subgroup on the auditory/verbal memory assessment was significantly below (p = 0.01) than of the RCI subgroup, which was in normal limits. Both subgroups experienced mild difficulty on immediate visual/spatial memory testing, with no significant differences between groups’ notes on these measures. The LCI subgroup experienced difficult across all academic areas. The RCI subgroup tended to demonstrate poor performance in the area of arithmetic only. The only significant difference was on the reading comprehension section of the Grey Oral Reading Test-Revised. The LCI subgroup was found to be significantly below that of the RCI subgroup (p = 0.01), which was within the normal range.

E-85
SAMPLE, DESIGN, & INTERVENTION ACHIEVEMENT
MEASURE OUTCOME
Reading Test-Revised (GORT-R)
Fowler (1988) Sample: N = 56 (28 school-aged children with hemoglobin SS sickle cell anemia enrolled in the Comprehensive Sickle Cell Program at North Carolina Memorial Hospital (NCMH) between Sept 1984 and Dec 1985 who had no history or overt physical evidence of stroke; 28 controls matched for sex, race, age, and SES recruited from the NCMH Well Child Continuity and Pediatric Walk-in Clinics; All children were Black Sickle Cell Measures: Illness severity Study Design: Case-control
Neuropsychological Evaluation: Wechsler Intelligence Scale for Children-Revised (WISC-R) to test general cognitive, language, visual-motor, and attentional functioning; Developmental Test of Visual-Motor Integration (VMI) to test fine-motor coordination and visual-perceptual organization Visual attention: Kagan Matching Familiar Figures School functioning: WRAT (grade equivalents and standard scores for reading, spelling, and arithmetic; Teacher questionnaire for number of days absent in the previous year, number of grades repeated, special services received, number of grades repeated, and results from the most recent California Achievement Test (CAT)
No significant differences between the children with sickle cell anemia and the well comparison group on the neurologic/neurodevelopmental exam The control children performed significantly better on the WISC-R Coding subset which assesses visual motor skill and speed. Children with sickle cell anemia (N = 22) completed the Matching Familiar Figures Test more quickly than their healthy peers (N = 20), but with less accuracy, performing as a group in the fast/inaccurate (impulsive) performance category. Children with sickle cell anemia: o Averaged 3 ½ years behind expectations based on chronological age on visual motor integration.
o scored significantly lower on the WRAT Reading and Spelling tests than the controls
o Scored at the 38th percentile on the CAT total battery while the controls scored at the 54th percentile
o Were more likely to have repeated a grade (54%) than the controls (43%) although this difference was not statistically significant
o Were more likely to be receiving academic special services (63%) than the controls (22%)
Significant age by illness group interactions were noted in the Wechsler Intelligence Scale for Children-Revised (WISC-R) Digit Span (F = 5.31, p<0.05) and Coding (F = 5.48, p<0.05) scores after considering any effects due to SES. There was also a significant illness group main effect; the younger sickle cell children had higher average scores than either age group of control children, whereas the older sickle cell children had overall much lower scores than any of the controls. Achievement and neuropsychological scores for children with sickle cell anemia were positively related with a number of demographic factors, including increased SES, maternal education, female sex, and younger age of the child. WISC-R Similarities and Information subtests correlated with FACES II Family Cohesion, whereas arithmetic was directly related to Social Support.

E-86
SAMPLE, DESIGN, & INTERVENTION ACHIEVEMENT
MEASURE OUTCOME
Full-scale Wechsler scores were strongly correlated with CAT scores (0.66, p<0.001); WRAT reading scores (0.69, p<0.0001), spelling scores (0.61, p<0.001), and math scores (0.71, p<0.0001). Visual motor scores were moderately correlated with WRAT math scores (0.52, p<0.01). Older children with sickle cell anemia performed significantly less well then the younger children with sickle cell anemia on the WRAT Reading, Digit Span, subtest of the WISC-R, and VMI, and had increased latency on the MFF. Children with moderate activity limitation had increased VMI quotients, as well as increased WRAT reading and math achievement scores, compared with children with no activity limitation or mild physical activity limitation.
Goonan (1994) Sample: N = 35; 24 youth (15 males and 9 females) with sickle cell syndrome (SCS) between the ages of 4 years, 10 months and 15 years, 4 months who were receiving care in a pediatric sickle cell clinic at a University affiliated teaching hospital; 11 sibling controls (3 males, 8 females) ranging in age from 7 years, 5 months to 15 years, 11 months with normal hemoglobin or sickle cell trait Sickle Cell Anemia Measures: Disease severity (number of ER visits, and days hospitalized in the previous 12 months, hemoglobin levels) Study Design: Case-control
Sustained attention: Computerized vigilance task Inhibitory control: Matching Familiar Figures Test (MFFT) Behavioral Ratings: Child Behavior Checklist (attention & impulsivity)
Significant interactions were found for the number of correct responses [F (2, 32) = 35.78, p<.001], and number of errors commissions [F (2, 32) = 34.59, p<.001], and number of errors commissions [F (2, 32) = 32.70, p<.001]. There were significant differences in multiple components of attention and inhibitory control as a function of chronological age. Older patients (>9 years) were found to have increased attention and reflectivity. The development of attentional skills for sickle cell syndrome youth is suggested to proceed similarly to that of normally developing youth. Disease parameters, including hemoglobin levels, days hospitalized, and emergency room visits were not significantly correlated with performance on any of the measures. Within the limitations of this particular study, results were interpreted to refute the notion of disease-related neurocognitive impairments for children with sickle cell syndrome.
Nabors (2002) Sample: N = 39 children (26 children with sickle cell disease between the ages of 6 and 13 years; 13 sibling controls within the same age range of the cases) The sample was divided into 3 groups: (1) sickle cell disease with magnetic resonance imaging documented central nervous system involvement (n=12); sickle cell disease with no known history of central nervous system involvement (n=14); and controls (n=13).
Cancellation of Recurring Figure Test Go-No-Go Response Inhibition Time Visual Vigilance Test Kagan Matching
Children with sickle cell disease and stroke had a significantly poorer performance on the Coding subset of the WISC-R, Spelling and Arithmetic subtests from the WRAT-R and significantly slower response times for cancellation for numbers and shapes. Children with sickle cell disease and stroke had a significantly poorer performance on intelligence, achievement, attention indicators than their sibling controls.

E-87
SAMPLE, DESIGN, & INTERVENTION ACHIEVEMENT
MEASURE OUTCOME
Sickle Cell Anemia Measures: Hemoglobin concentration, history of vaso-occlusive episodes, and hospitalizations Study Design: Case-control
Familiar Figures Test Wechsler Intelligence Scale for Children-Revised (WISC-R) (Comprehension, Block Design, Mazes, Arithmetic, & Coding subtests) Wide Range Achievement Test-Revised (WRAT-R) Pediatric Neurobehavioral Inventory (Parent report)
Children with sickle cell disease without stroke did not significantly differ from the controls. Children with sickle cell disease and stroke had a significantly poorer performance on the Coding subsets of the WISC-R, Spelling, Arithmetic subtests from the WRAT-R, and significantly slower response time for cancellation for numbers and shapes than those with sickle cell disease without stroke.
Richard (1997) Sample: N = 68 African American children who were 7 to 11 years of age (42 children with sickle cell disease who were patients in a comprehensive sickle cell clinic; 26 children who did not have any chronic illness and who were selected from a list of patients who attended a general medical clinic at the same hospital during the same period) Study Design: Case-control
School Records were used to assess grades during the previous year in mathematics and reading, percentile scores on the California Achievement Test (CAT), grade retention, and attendance
Controlled for sex and age The two groups did not differ on grades in mathematics or reading, scores on standardized tests, or grade retention. Both the sickle cell and comparison groups had high rates of absenteeism and the mean percentile scores in mathematics and reading were below the national average for their ages.
Schatz (2004) Sample: N = 86 children (50 children with sickle cell disease, ages 7 to 17 years who were selected at random from local pediatric hematology Clinics; 36 comparison children recruited from the same community and were matched on age, gender distribution, ethnicity, and socioeconomic status Sickle Cell Anemia Measures: Anemia severity/hematocrit; Frequency of illness Study Design: Case-control
Academic attainment: parent report of whether the child was receiving special services at school & history of repeating a grade Academic achievement: Wide Range Achievement Test, third edition (WRAT-3); tests of single-word reading ability; and written calculations
Those with sickle cell disease (SCD) had a higher rate of academic attainment problems than peers (Fisher’s exact test, p<.05). Children with SCD also had more frequent instances of multiple grade repetitions compared to controls (15 versus 3 cases; two-tailed Fisher’s exact test, p <.05). There was a significant relationship between Attainment problems and academic achievement delays according to a Fisher’s exact test, p < .01 (80% with similar classification); however, 10 of 50 cases (20%) showed only one of the two types of deficits (5 with attainment problems only and 5 with achievement delays only). Univariate predictors of attainment problems were lower achievement scores, more school days missed due to illness, lower cognitive ability, and

E-88
SAMPLE, DESIGN, & INTERVENTION ACHIEVEMENT
MEASURE OUTCOME
lower family income. Univariate predictors of achievement scores were similar, except for school days missed for illness. A simultaneous regression model was used to predict the presence or absence of attainment problems with hematocrit, days of illness, cognitive ability scores, parent education, and family income as the predictors. The overall model was statistically significant, F(5, 44) = 4.00, p < .01, R2 = .31. Beta weights indicated that cognitive ability, β = –.40, t = −2.77, p < .01, and days of illness, β = –.24, t = 2.07, p < .05, were unique predictors of attainment problems. A parallel regression model was used to evaluate mean academic achievement scores. The overall model was significant, F(5,44) = 11.12, p < .01, R2 = .56. Cognitive ability was the only significant unique predictor of achievement scores, β = 0.65, t = 5.64, p < .01.
Swift (1989) Sample: N = 42 children (21 with sickle cell anemia and 21 sibling controls) selected from the pediatric clinic of the Comprehensive Sickle Cell Center, Medical College of Georgia, Augusta, who ranged from 7 to 16 years of age. Sickle Cell Anemia Measure: Hemoglobin concentration, percentage of Hb S, percentage of Hb F, and history of vaso-occlusive episodes and hospitalizations all taken from clinic records Study Design: Case-control
Special education placement, school progress and attendance taken school records WISC-R, Kaufman, Detroit Test of Learning Aptitude-2, Beery, Woodcock-Johnson Psychoeducational Battery
On the Wechsler Intelligence Scale for Children-Revised, the sickle cell group had a mean Full Scale IQ of 77.7 (SD 12.4) compared with 94.3 (SD 11.0) for the control group. The profile test of scores was similar for the two groups, with the sickle cell group scoring significantly lower than the control group on almost all cognitive measures. Among all the sickle cell anemia measures, only sequestration and vaso-occlusive crisis showed a significant association with cognitive outcome. Both groups showed academic achievement to be commensurate with their measured intellectual ability.
Wang (2001) Sample: N = 373 pediatric patients aged 6 to 18 years-old between September 1989 and August 1999 Sickle Cell Anemia Measure: MRI for infarction Study Design: Cross-sectional
Wechsler Intelligence Scale for Children (WISC-R or WISC III) Woodcock-Johnson Math and Reading Achievement Tests
Patients with hemoglobin SS and silent infarcts had significantly lower scores for math and reading achievement, Full-Scale IQ, Verbal IQ, and Performance IQ, when compared with those with normal MRI findings. In children with hemoglobin SS and normal MRI findings, the scores for Verbal IQ, math achievement, and coding (a subscale of Performance IQ) declined with increasing age.
Wasserman (1991)
Sample: N = 73 children 8 to 16 years old (43 patients with Hb SS, Hb SC, or Hb Sß thalassemia who had not had a clinically apparent cerebrovascular accident; 30 sibling controls who had sickle cell trait or normal
LNNB-Children’s Revision (LNNB-C) for children 8 to 12; LNNB for those 13+
Controlled for number of subjects, proportion of females, and age. The average number of school days missed within the past year was significantly greater for patients (p<0.01); however, academic performance

E-89
SAMPLE, DESIGN, & INTERVENTION ACHIEVEMENT
MEASURE OUTCOME
hemoglobin and no known central nervous system injury) Study Design: Case-control
• 11 subscales: Motor skills; Rhythm; Tactile; Visual; Receptive speech; Expressive speech; Writing; Reading; Arithmetic; Memory; Intelligence WISC-R • Verbal; Performance; Full-Scale IQ Wide-Range Achievement Test (WRAT) • Reading; Spelling; Mathematics
and the proportion of each group placed in special education were not significantly different for the two groups. The WISC-R mean performance and full-scale IQs were significantly lower for the SCD patients than for controls, although verbal IQ did not differ significantly. When compared with a standardized group of minority children, only the sickle cell patients showed significant decrements in verbal (p = 0.02) and full-scale IQ (p = 0.03) scores. On the WRAT, there were no significant differences between the patients and their siblings. The younger patients scored better than the older patients on the WRAT math subtest, but not on the reading or spelling subtests. Among the younger sample (≤ 12 years), patients’ mean scores were significantly higher (abnormal) than their sibling controls on seven LNNB-C scales: visual, expressive-speech, writing, reading, arithmetic, memory, and pathognomonic). Not only were the means higher, but the percentage of patients who were above their critical level compared with the controls was also significantly higher.
SLEEP Drake (2003) Sample: N = 450 11- to 15-year-old students, from
grades 6, 7, and 8 of a public middle school in Dayton, Ohio Sleep Measures: Pediatric Daytime Sleepiness Scale (32 items assessing daily sleep patterns, school achievement, mood, sleepiness, qualify of life, and extracurricular activities) Study Design: Cross-sectional
“My grades in school are usually: all A’s, mostly A’s, mostly A’s and B’s, all B’s, mostly B’s and C’s, all C’s or less”
There were significant linear effects for school achievement and daytime sleepiness [F(1,405) = 5.96, p=0.02].
Eliasson (2002) Sample: N = 1,200 students (1,000 high school, 200 middle school) Sleep Measures: Self-report questionnaire (no information on measures) Study Design: Cross-sectional
Self-report of grade point average
There was no correlation between sleep time and academic performance.

E-90
SAMPLE, DESIGN, & INTERVENTION ACHIEVEMENT
MEASURE OUTCOME
Fredriksen (2004)
Sample: N = 2,259 Illinois middle schools students who began sixth grade in 1995 and completed eight grade in 1997 Sleep Measures: Self-report questionnaire, “How many hours of sleep do you get on a typical school night?” Study Design: Longitudinal
Self-report questionnaire, “What kinds of grades did you earn in school last year?”
Students who experienced lower levels of sleep at the beginning of 6th grade also exhibited lower grades at that point.
Gozal (2001) Sample: N = 1,588 13- to 14- year-old children attending Jefferson County Public Schools who were ranked among the top or bottom quartiles of their class based on the computerized school database and who were matched by age, gender, race, school, and street of residence Sleep Measures: Parent questionnaire assessing 1)Does your child snore now? 2) Does the father snore? 3) Does the mother snore? 4)Did the child snore between the ages of 2 to 6 years old? 5) Did the child have his/her tonsils and/or adenoids surgically removed? If yes, was this because of 1. recurrent soar throat infections? 2. snoring? Study Design: Cross-sectional
Parent questionnaire: What are the grades of your child in his/her last report card?
Frequent and loud snoring during early childhood was reported in 103 low performing children (12.9%), whereas only 40 high performing children had frequent and loud snoring as young children (5.1%, OR: 2.79, CI: 1.88, 4.15). Tonsillectomy and adenoidectomy was reported in 24 low performing children and 7 high performing children (OR: 3.40, CI: 1.47, 7.84). Surgery for recurrent tonsillitis was reported in 21 low performing and 19 high performing children.
Gozal (1998) Sample: N = 297 first-grade children from urban public elementary schools whose school performance was in the lowest 10 percentile of their class Sleep Measures: Questionnaire w/13 items (i.e. Does the child stop breathing during sleep? Does the child struggle to breathe while asleep? Do you ever shake your child to make him/her breathe again?); Overnight recording of pulse oximetry and pulse signal and transcutaneous carbon dioxide tension at home; Parents documentation of the time at which their child seemed to be asleep and any obvious nighttime arousals Study Design: Cross-sectional
Academic grades from the school for the school year preceding and the school year after the overnight recordings
Children with sleep-associated gas exchange abnormalities (SAGEA) who had surgical removal of hypertrophic adenoids and tonsils showed significant grade improvements from the first to second grade. Children (1) without SAGEA and without snoring, (2) with primary snoring, (3) with no snoring did not show significant grade improvements from the first to second grade.
Gray (2002) Sample: N = 334 undergraduate students (121 men, 213 Self-reported estimates Only average rising time was significantly correlated with GPA

E-91
SAMPLE, DESIGN, & INTERVENTION ACHIEVEMENT
MEASURE OUTCOME
women) at the University of Iowa during the spring, summer, and fall sessions of 1998, and the spring semester of 1999 with a mean age of 19.2 years (sd = 1.8) Sleep Measures: Pittsburgh Sleep Quality Index (assesses subjective sleep quality, sleep latency, sleep duration, habitual sleep efficiency, sleep disturbances, use of sleep medication, and daytime dysfunction); Sleep questionnaire (assessed perceived sleep quality and quantity, and attitudes about sleep and current symptoms of sleep deprivation; Sleep logs Study Design: Cross-sectional
of current college and final high school grade point averages (sample cross-checked with scores from the registrar’s office, .84 correlation for university GPA and .92 correlation for high school GPA)
(University of Iowa: -.19, High School: -.17).
Hawley (2003) Sample: N = 1,010 preschool students enrolled in Jefferson County, Kentucky, Public Schools’ Early Jump Start Programs for children 5 years of age and under who are financially at-risk or developmentally disadvantaged Sleep Measures: 38 questions addressing sleep time, duration, and behaviors with 10 of the questions related to sleep-disordered breathing that were to be completed by the parent/guardian Study Design: Cross-sectional
School Performance & Behaviors: 12 questions (10 from Child Behavior Checklist); 4 questions regarding parent’s opinion of the child’s school performance (i.e. How is your child performing in school? How hard is your child working in school?)
Those at risk for sleep-disordered breathing were more likely to rank below average in school performance, less likely to rank above average in school performance, and less likely to rank above average in how hard they were working in school.
Kaemingk (2003)
Sample: N = 149 children who attended Tucson Unified School District and who participated in the TuCASA study (prospective study examining sleep in children ages 6 to 12) in the 1999-2000 school year or 2000-2001 school year Sleep Measure: Polysomnography conducted one night in the child’s home Study Design: Cross-sectional
Wechsler Abbreviated Scale of Intelligence; Letter-Word Identification, Applied Problems, and Dictation from the Woodcock-Johnson Psycho-Educational Battery-Revised Tests of Achievement; the Children’s Auditory Verbal Learning Test-2 Conner’s Parent Rating Scale (attention)
Those with an apnea/hypopnea index (AHI) of 5 or more had weaker verbal learning, lower levels of learning, and delayed recall. Differences decreased when arousal was controlled for. Those with an AHI of 5 or more had a greater percentage of Stage 1 sleep (difference = 1.99, p=.05), which was negatively associated with learning and memory. There were negative relationships between AHI and immediate recall (-.12), Full Scale IQ (-.16), Performance IQ (-.15), and math achievement (-.14). Hypoxia was associated with lower Performance IQ.

E-92
SAMPLE, DESIGN, & INTERVENTION ACHIEVEMENT
MEASURE OUTCOME
Kelly (2001) Sample: N = 148 undergraduate students enrolled in intro to psychology classes with a mean age of 19.86 years (sd = 3.85) Sleep Measures: Questionnaire asking participants to indicate their average sleep length for a 24 hour period Study Design: Cross-sectional
Self-report of overall college grade point average
There was a significant main effect for sleep length on GPA, F(2,111) = 4.61, p<.01. Long sleepers (mean = 3.24) reported significantly higher GPA’s than short sleepers (mean = 2.74).
Rhodes (1995) Sample: N = 14 morbidly obese children who had been referred to the Medical University of South Carolina Pediatric Endocrinology Clinic between March and December 1993 Sleep Measure: Nocturnal polysomnographic recording of electroencephalograms, electrooculograms, and myohyoid electromyograms for sleep staging Study Design: Cross-sectional
Wide Range Assessment of Memory and Learning & the Wechsler Intelligence Scale for Children (3rd ed.)
Children with obstructive sleep apnea (OSA) had significantly lower mean scores on general memory (88.3), verbal memory (90.4) learning (92.9), and vocabulary (8.1) than those without OSA (89.0, 68.8, 81.2, 4.0). The number of apneic/hypopneic events was found to be significantly and inversely correlated with the General Memory (-0.59) and Learning (-0.55) indexes.
Trockel (2000) Sample: N = 184 college freshmen attending a large private university who resided in a dorm Sleep Measure: Self-report questionnaire/interview assessed weekday bedtime, weekend bedtime, weekday wake-up time, weekend wake-up time, hours of sleep for weekends and weekdays Study Design: Cross-sectional
GPAs obtained from the registrar’s office
Lower GPAs were associated with later weekday wake-up (r = -.350, p<.001), later weekend wake-up (r = -.321, p<.001), later weekday (r = -2.92, p<.001) and later weekend (r = -2.11, p=.004), and greater number of hours of sleep on weekend nights (r = -.169, p=.022). For each hour of delay in reported average weekday wake-up time, the predicted GPA decreased by 0.132. For each hour of delay in reported average weekend wake-up time, the predicted GPA decreased by .115. (Other variables in the model included study of spiritually oriented material, number of work hours per week, and strength training.)
Wolfson (1998) Sample: N = 3,120 high school students at 4 public high schools from 3 Rhode Island school districts in the fall of 1994 Sleep Measures: Self-report questionnaire assessing school night total sleep, weekend night total sleep, bedtime, rise time, sleepiness (sleepiness scale asking whether the respondent had struggled to stay awake or fallen asleep in 10 different situations in the last 2 weeks), behavior (sleep/wake behavior problems scale including 10 items asking frequency of indicators of erratic sleep/wake behaviors over the last 2 weeks)
Self-reported grades in schools (Are your grades mostly A’s, A’s and B’s, B’s, B’s and C’s, C’s, C’s and D’s, D’s, or D’s and F’s?)
Generally, students with higher grades reported longer and more regular sleep, multivariate F(9, 6571) = 8.91, p<.001). Specifically, they reported more total sleep (p<.001) and earlier bedtimes (p<.001) on school nights than those with lower grades. Post-hoc analyses indicated that these differences distinguished those reporting C’s and worse from those reporting mostly B’s and better. Specifically, weekend sleep habits also differed according to grades, multivariate F(9, 6327) = 18.79, p<.001. A and B students reported early bedtimes and earlier rise times than did C and D/F students, p<.001. C and D/F students also reported greater weekend delays of sleep schedules than

E-93
SAMPLE, DESIGN, & INTERVENTION ACHIEVEMENT
MEASURE OUTCOME
Study Design: Cross-sectional
the better students, multivariate F(6, 5060)= 18.22, p<.001.
* These articles also provide insight to the relationship of asthma and academics. Source: Nancy Murray, Dr.P.H., The University of Texas School of Public Health

E-94
Education and Health: A Review and Assessment
APPENDIX II: Texas Statutes on School Health
HEALTHY SCHOOLS TEXAS HEALTH SCHOOL POLICIES • CURRICULUM AND INSTRUCTION Health Education Mandate: Statute §28.002 (2001) requires instruction in health education as part of the “enrichment curriculum” for Kindergarten through grade 12, subject to additional rules by the Texas State Board of Education. TAC §74.1 (1998) specifies that each “district must ensure that sufficient time is provided for teachers to teach and for students to learn… health [and] physical education” in grades Kindergarten through 8, but at the high school level school districts only need to offer a health course and maintain evidence that students have the opportunity to take the course. High school students must earn at least 1½ credits in health education (out of 22 credits) in order to graduate per TAC §74.41 (2001). Curriculum Content: The state does not currently require that schools use a specific health education curriculum. However, TAC §115 (1997) of the Texas Administrative Code outlines the Texas Essential Knowledge and Skills for Health Education, which are guidelines for instruction. Local school districts are free to decide for themselves what parts of the Health Education TEKS they choose to teach and the extent to which they choose to address a particular health topic. Also, under the terms of Statute §38.013-.014 (2001), part of what is commonly referred to as “Senate Bill 19”, the Texas Education Agency is required to “make available to each school district a coordinated health program designed to prevent obesity, cardiovascular disease, and Type II diabetes in elementary school students” and every school system is required to be trained in its implementation by 2007. To date TEA has approved the use of two specific curriculum programs that satisfy this requirement and the state is coordinating training opportunities in their use. State Assessment Requirement: None. Physical Education Mandate: Education Code §38.013 (2003) requires the agency to provide one or more coordinated health programs that accounts for health education, physical education and physical activity, nutrition services and parental involvement in each school district. Statute §28.002 (2001) requires instruction in physical education as part of the “enrichment curriculum” for Kindergarten through grade 12, subject to additional rules by the Texas State Board of Education TAC §74.2 (1993) requires school districts that offer K-5 must provide instruction in the physical education curriculum. TAC §74.32 (2002) further mandates enrolled K-6 students to participate in a minimum of 30 minutes per day or 135 minutes per week of physical activity. TAC §74.3 (2004) requires school districts offering grades 6-12 to provide instruction in physical education. Further, high school students are required to fulfill 1½ credits of physical education to receive a high school diploma according to TAC §74.51 (2003). TAC §74.31 (2001) requires districts to classify students for physical education into unrestricted, restricted, or adapted and remedial categories. Exemptions: None specified.

E-95
Curriculum Content: Statute §28.002 (2003) and TAC §74.1 (2004) requires each school district offering K-12 to mandate a physical education curriculum. TAC §116.1 to §116.52 (1998) describe the Texas Essential Knowledge and Skills for Physical Education. Physical Fitness Assessment: None. Asthma Awareness Education Not specifically required. Emotional, Social, and Mental Health Education The Texas Essential Knowledge and Skills for Health Education recommends personal and interpersonal skills be taught, including healthy expression of emotions and self-control in grades 1-12. Stress management skills and the various aspects of mental and social health are recommended for grades 3-10. Character Education: Statute §29.906 (2003) allows school districts to provide character education programs, stressing positive character traits, using integrated teaching strategies. Teaching specific religious or political beliefs are not authorized. Nutrition Education Education Code §38.013 (2003) requires the agency to provide one or more coordinated health programs that accounts for health education, physical education and physical activity, nutrition services and parental involvement in each school district. The Texas Essential Knowledge and Skills for Health Education recommends instruction in nutrition that includes identifying healthy and unhealthy foods, examining food labels, and healthy and unhealthy dietary practices be taught in grades K-6. Tobacco Use Prevention Education Tobacco use prevention education is recommended, not required. Texas Essential Knowledge and Skills for Health Education includes this topic throughout.
• STAFF
Requirements for All Educators (regarding Health Topics) Professional Development: The state does not require teachers to participate in professional development covering health education or violence prevention topics. Requirements for Health Educators Pre-service Requirement: The minimum requirement for prospective health teachers in elementary, middle and high school grades prior to licensure is a bachelor’s degree, with an academic major; however, health coursework is not specified. The specific details of initial licensure are outlined in Statute §21.050 (2001). Professional Development: The state does not require health education teachers to participate in on-going professional development covering health education topics. Requirements for Physical Educators Pre-service Requirement: None specified. Professional Development: None specified.

E-96
Requirements for School Nurses Pre-service Requirement: Statute §21.003 (1995) requires a school nurse to be certified by the proper state agency. Professional Development: None specified. Student-to-Nurse Ratio: None specified. Requirements for Non-Certified Personnel to Administer Medication Pre-service Requirement: None specified. Professional Development: None specified. Requirements for School Counselors Pre-service Requirement: Statute §21.003 (1995) requires a school counselor to be certified by the state. TAC §230.307 (2000) requires a minimum of a bachelor’s degree. A school counselor must also have coursework as follows: at least three semester hours covering guidance programming, six semester hours covering serviced pupils, and 21 semester hours in resource areas as part of a planned individual program detailed in TAC §239.15 (2001). A counselor is also required to have a valid professional teaching certificate and three creditable years of classroom teaching experience. TAC §230.315 (2000) requires special education counselors to have an additional six credit hours of courses in education for exceptional children. Professional Development: TAC §239.15 (2001) requires that mandated school counselor continuing professional education activities follow the foundation laid forth in detail within this statute. TAC §239.25 (2001) requires 150 hours of continuing professional education to be completed during the first 5 year renewal period. Student-to-Counselor Ratio: Statute §33.002 (2003) requires school districts, which receive certain funding for programs, provide at least 1 counselor for every 500 students at the elementary level. Those school districts with fewer than 500 students at the elementary level must provide a part-time counselor. Requirements for School Psychologists Pre-service Requirement: Statute §21.003 (1995) requires a school psychologist to be certified by the proper state agency. Professional Development: None specified. Student-to-Psychologist Ratio: None specified. Requirements for School Social Workers Pre-service Requirement: Statute §21.003 (1995) requires a school social worker to be certified by the proper state agency. Professional Development: None specified. Student-to-Social Worker Ratio: None specified. Requirements for Food Service Personnel Pre-service Requirement: None specified. Professional Development: None specified. Requirements for Athletic Coaches Pre-service Requirement: None specified. Professional Development: None specified.

E-97
• HEALTH PROMOTING ENVIRONMENT
School Food Services Food Services: The Department of Agriculture’s Policy on Foods of Minimal Nutritional Value (FMNV) (2003) [no link available] prohibits elementary schools from serving or giving access to students to FMNV at any time on school property during the school day. Middle schools must also deny access for students to FMNV anywhere on school property during meal periods and may not serve or give access to prohibited carbonated beverages in containers larger than 12 ounces anywhere on school property during the school day. Special Populations: No state policy. Vending Machines/School Stores: Statute §28.004 (2003) requires school districts to make available for inspection a statement of whether local policies were adopted that ensure compliance with agency vending machine and food service guidelines and restricting student access to vending machines. Other Food Sales: No state policy. Physical Activity (Non-curricular) Interscholastic Athletics: TAC §76.1001 (2003) states that an extracurricular activity is an activity sponsored by the school district that is not necessarily directly related to instruction of the essential knowledge and skills but may have an indirect relation to some areas of the curriculum. Further provisions of extracurricular activities are provided in the code. Recess: No state policy. Tobacco Use Texas Education Code §38.006 (1995) prohibits smoking or tobacco use or possession at a school-related activity on or off school property. Air Quality Texas Health and Safety Code §385.002 (2001) requires the State Board of Health to establish voluntary guidelines for ventilation and indoor air pollution control systems in government buildings, which includes school districts according to Code §385.001 (2001). Pesticide Use Structural Pest Control Board Law §595.11 (no date available) prohibits the application of pesticides in school buildings or on school grounds if it will expose students to unacceptable levels of pesticides. The law also requires each school district to develop a written pest management policy based on the tenets of integrated pest management.
• STUDENT SERVICES
Screening for Health Conditions Statute §38.003 (1995) requires students enrolling in public schools to be tested at appropriate times for dyslexia and related disorders. Asthma: No state policy. Body Mass Index (BMI) Screening: No state policy. Administration of Medications The Guidelines for Administering Medications in Schools (no date available) requires students who have a chronic illness or disability to receive medication during the school day. Texas Education Code §38.012 (1999) requires a school district or school to hold a public hearing

E-98
before health care services are available in the schools. At the hearing, the board will disclose all information regarding proposed health care services. Self-Administration of Medications: Texas Education Code §38.015 (2001) entitles students with asthma to possess and self-administer prescription medication while on school property or at school-related activities, provided that the medication was prescribed for the student, administration is given in compliance with the physician’s instructions, and a parent submits a written statement from the physician stating that the student is capable of self-administering the medication, and the time and dosage of the medication. Psychotropic Medications: Education Code §38.016 (2003) states school district employees may not recommend that a student use a psychotropic drug. However, this statute does not prohibit school medical staff from recommending that a child be evaluated by an appropriate medical practitioner. Storage and Record-Keeping: No state policy. Counseling and Mental Health Services Requirement to Provide Services: Code of Education §33.005 (2001) requires school counselors, working with the school and broader community, to plan, implement, and evaluate a developmental guidance program. This program is to include a responsive services component to intervene on behalf of any at-risk student and an individual planning system component to provide guidance for each student. A Model Comprehensive, Developmental Guidance and Counseling Program for Texas Public Schools: A Guide for Program Development Pre-K-12th Grade (2004) provides a model for schools to follow when developing their developmental guidance programs. Statute §29.312 (1995) also requires appropriate psychological counseling services to be made available for those students who are deaf or hard of hearing. Suicide Prevention: Texas has no specific state policy addressing suicide prevention services; however, the responsive services requirement of the Code of Education §33.005 (2001) implies suicide prevention be addressed. Identification of Students with Mental or Emotional Disorders: Statute §38.057 (2001) requires the school medical staff, along with the parental guardian, to jointly identify any health-related concerns of a student which may be interfering with their well-being or ability to succeed in school. Referrals for mental health services require notification of the parental guardian in writing, whose authorization is needed for potential treatment. Statutes §26.009 (1997) and §29.0041 (2003) require parental consent before conducting a psychological examination, test, or treatment on a child. Immunity of Liability: Education Code §22.0511 (2003) grants immunity of personal liability to all professional school employees for any act incident to or within the scope of their duties that involves the exercise of judgment or discretion. Only the use of excessive force or negligence resulting in bodily harm voids their immunity of liability. Individual Health Plan for Students No state policy.

E-99
• COORDINATION/IMPLEMENTATION
Coordinating or Advisory Councils State-level: Statute §33.084 (1995) establishes the interscholastic league advisory council composed of various state education officials and legislators who are instructed to study student eligibility to participate according to University Interscholastic League policy, the geographic distribution of UIL programs, and gender equity. Local-level: Texas Education Code §28.004 (2001), part of Senate Bill 19, requires each school district to “establish a local school health education advisory council to assist the district in ensuring that local community values are reflected in the district's health education instruction.” A majority of the members must be persons who are parents of students enrolled in the district and who are not employed by the district. In addition, Texas Education Code §38.058 (2001) allows a school district to establish a local health education and health care advisory council to make recommendations on establishing school-based health centers. School Health Program Coordinators State-level: No state policy. Local-level: No state policy. Confidentiality Student Health-Related Records: Statute §38.009 (1995) gives administrators, nurses, or teachers access to a student’s medical record maintained by the school district. Any who view these records must maintain confidentiality. More generally, Statute §28.058 (1995) requires that all information received by the commissioner concerning an individual student must be kept confidential. Student Health-Related Services: No state policy. Limitations on Student Surveys No state policy. Source: National Association of State Boards of Education. State-level school health policies: Texas. Available at: http://www.nasbe.org/HealthySchools/States/states.asp?Name=Texas

E-100
Education and Health: A Review and Assessment APPENDIX III: Texas State Policy on Asthma
• Texas is not within states with written policies on education for asthma awareness for
students and school staff. It does not recommend or require that students receive instruction in asthma education. (2005)
• Texas does not have written policies on asthma and general health examination for
students. • Texas does not have written policies requiring schools to document medical conditions of
students with asthma in an individual education plan (IEP) or individual student health plan (ISHP).
• Texas has a statewide policy that requires all schools to designate staff who will administer
medication to students during the school day. The policy requires written authorization from a parent or guardian and the prescribing physician.
• Texas has statewide policies that allow students to both possess and self-administer approved medication during the school day.
• Texas has state written policies on three environmental triggers: tobacco use, air quality, and/or pesticide use (2005)
CDC requires school to have a policy prohibiting cigarette, cigar and pipe smoking and smokeless tobacco use by students, faculty, staff and visitors; the policy prohibits tobacco use in school buildings, on school grounds, in school buses or other vehicles used to transport students, and at off-campus school-sponsored events. Texas has a written policy that prohibition of tobacco use to include all school-sponsored activities on or off the school campus, but not on school transportation vehicles.
Texas is one of the states that specifically address indoor air quality in schools. State
policy provides voluntary IAQ policies or other air quality measures in schools.
Texas requires schools to implement an integrated pest management program that includes procedural guidelines for pesticide application, education of building occupants, and inspection and monitoring of pesticide applications. The policy addresses management limiting pesticide application, requiring integrated pest management, but not notifying staff & parents and placement of posting signs.
Source: Lee, P.H. (2005) State school health policy issue brief: Summary and analyses of state policies on asthma education, medications, and triggers. National Association of State Boards of Education. Available at: http://www.nasbe.org/HealthySchools/

E-101
Education and Health: A Review and Assessment APPENDIX IV: Texas Legislative Information for Nutrition and
Physical Activity Texas bills related to children's health
Bill # Year Status (per CDC)
Status (per Texas Legislature
Online)
Date Introduced (if in committee) Notes Author/Sponsor Summary
HB55 2004 Expired in committee
Expired in committee
5/3/2004 Referred to Public School Finance, Select
Howard To place a tax on certain snack foods and beverages, and to use this tax revenue as a source of funding for public schools.
HB3283 2005 Pending Expired in committee
3/21/2005 Referred to Ways & Means
Guillen The department shall develop and administer community-based and school-based childhood obesity prevention programs. The programs must encourage children to: (1) increase their physical activities and decrease their sedentary activities; and (2) increase their consumption of nutritious foods and decrease their consumption of minimally nutritive foods; (3) educate children and parents regarding nutrition; and (4) identify and implement other methods of preventing childhood obesity and related illnesses. (5) A community-based program must include media campaigns, including public service announcements or other means, to disseminate nutrition information for and promote increased physical activity by children. (6) The childhood obesity prevention program account is an account in the general revenue fund.
HB517 2005 Pending Expired in committee
5/3/2005 No action taken in committee
Guillen, Escobar To ensure that time spent by a student for walking from one classroom to another, walking to or from school, bus, or engaging in other routine activities associated with the school day is not included in determining compliance with the daily physical activity requirement.
HB764 2003 Expired in committee
Expired in committee
5/9/2003 Left pending in committee
Wohlgemuth, Wise A bill to increase the physical activity requirements, physical activity education and nutrition education in schools to help fight the growing epidemic of childhood obesity.
HCR223 2001 Enacted Enacted Coleman Directs the Texas Department of Health to prepare a list of foods and beverages fortified with calcium for use by each primary and secondary school in Texas.
SB1357 2003 Enacted Enacted Nelson Relates to health education and physical education in schools. Establishes a health advisory council.
SB1379 2005 Pending Expired in committee
5/22/2005 Sent to Calendar committee
Lucio Relating to a statewide initiative regarding the prevention and treatment of obesity-related health concerns enacting the following obesity-related treatment and prevention initiatives: an interagency obesity council, public awareness campaigns, research to include evidence-based obesity treatment recommendations and insurance plans, nutrition and physical activity local capacity analysis, nutrition in public schools, beverage program, and mentorship program.
SB205 2005 Pending Expired in committee
2/3/2005 Referred to Education
Van de Putte The requirement of school districts to measure the body mass index of students and include the information in regular report cards.
SB29 2005 Pending Expired in committee
1/31/2005 Referred to Education
Zaffirini In regards to the school district reporting of compliance with certain health guidelines including a statement of policies adopted ensuring that students engage in at least 30 minutes per school day or 135 minutes per week of physical activity.
SB343 2003 Pending Expired in committee
2/11/2003 Referred to Education
Shapleigh For better use of schools for the education of children regarding obesity. Include the study of nutrition, fitness and the causes and effects of obesity.
SB42 2005 Pending Enacted Nelson Regarding health education in public schools and the improvement of children's health through daily physical activity in public schools.
SB474 2003 Enacted Enacted Lucio A committee formed for the establishment of a nutrition education and physical activity program in all public schools.
SB877 2001 Enacted Enacted Van de Putte, Zaffirini
Relates to the creation of an advisory committee for the special supplemental nutrition program for women, infants, and children. Provides for the committee’s membership, duties and responsibilities.
Source: CDC http://www.cdc.gov/nccdphp/states/texas.htm and Texas Legislature Online http://www.capitol.state.tx.us/

Appendix F
State Regulation of Health Insurance: Implications for Health Care Access
Sara Rosenbaum

F-1
Appendix F
State Regulation of Health Insurance: Implications for Health Care Access
Prepared by Sara Rosenbaum The George Washington University School of Public Health and Health Services
May 2005
Introduction This paper, prepared for the Task Force on Access to Health Care, examines the role of state regulation of health insurance in improving access to affordable and adequate coverage.
This analysis begins by summarizing those characteristics of uninsured Texans that would be of particular relevance to an assessment of the potential role of state insurance regulation to improve access to coverage. The analysis then discusses the role of states in health insurance regulation and reviews their powers as well as the limits on those powers. This discussion is limited to the regulation of licensed health insurance products. It is important to note that numerous types of insurance products can finance health care (on either a defined benefit or defined contribution1 basis); examples would be automobile insurance, workers compensation, accidental death and dismemberment, or disability insurance. The paper concludes with a discussion of the prospects for increased access through insurance reform. Key Characteristics of Texas’ Uninsured Population A recent study prepared for the Robert Wood Johnson Foundation2 reported that Texas leads the nation in the proportion of uninsured working age adults; even when actual employment status is taken into account, this study shows that Texas leads the nation in the proportion of individuals without coverage. In 2003, 30.7% of all working age adults in Texas were uninsured, compared to less than 10% in Minnesota, the state with the lowest proportion. This report indicates that Texas’ outlier status where uninsured adults are concerned persists regardless of state ranking criteria, including race and ethnicity, by the presence in the household of children, and actual employment status. The Texas dilemma effectively offers a “worst case” scenario of the fragility of the U.S. health insurance system for working age adults and children. For non elderly persons not yet completely disabled by a condition that prevents work, U.S. policy offers three basic pathways
1 A defined benefit product enumerates specific classes of health care benefits and services whose coverage is guaranteed in whole or in part for members during their term of enrollment. Defined benefit products can be subject to numerous limits and exclusions, discussed below. A defined contribution product offers a cash payment toward health care rather than coverage for defined services and essentially operates as a cash indemnification for medical care. The cash payment (e.g., $150 per day) also may be limited or constrained by numerous limitations and exclusions (e.g., no payment if the condition is the result of legal intoxication). 2 Robert Wood Johnson Foundation, Characteristics of the Uninsured: A View from the States (University of Minnesota, State Health Access Data Assistance Center, April, 2005) (www.shadac.org) Figure 1 (Accessed April 29, 2005)

F-2
to health insurance: voluntary employer-sponsored benefits; individually purchased coverage; and coverage through a public program.3 Statistics on health insurance by coverage source4 suggests that in Texas relative to other states, it is the employer market that is particularly weak and that neither the individual market nor public insurance are sufficiently vigorous to overcome this deficit. Were Texas’ employer-sponsored health insurance coverage rates equal to the U.S. average, 2003 coverage rates would have been a full six percentage points higher (54% versus 48%). A “back-of-the-envelope” effort to translate these percentage figures into actual people covered suggests that, were employer coverage available to 54 percent rather than 48 percent of the state’s 19.6 million non-elderly residents, some 1 million additional residents would have had employer coverage in 2003. 5
Data prepared by the Texas Department of Insurance (TDI) under a HRSA planning grant6 offer important insight into the characteristics of uninsured Texans. The uninsured span all ages, but persons ages 18-44 appear to be at particular risk for lack of coverage in relation to other age groups.7 Unemployment exponentially increases the risk of insurance among working age adults, but as noted, the uninsured rate even for employed adults is significantly elevated. 8 Immigration status affects coverage rates, but the lack of coverage among native and naturalized citizens also is notable according to the TDI data.9
Certain Texas industries also are associated with reduced health insurance coverage:
construction, personal services, entertainment and recreation, agriculture, wholesale and retail trade, and health care and social services.10 Notably, public employment is a strong predictor of coverage, a key factor in assessing the power of state regulation to provide some level of meaningful intervention. Industries associated with low coverage rates typically are characterized by part time and seasonal employment, cyclical work patterns with frequent layoffs, and relatively low cash wages and limited non-cash compensation (including even basic non-cash compensation such as sick leave).11
These employment characteristics are recognized predictors of reduced access to
employer-sponsored coverage.12 Furthermore, considerable data suggest that low levels of employer-sponsored coverage are by and large attributable to employers’ failure to offer coverage at all, rather than employees’ failure to take up coverage that is offered. 13 Smaller and lower wage firms face particular challenges in finding affordable coverage and subsidizing the
3 Institute of Medicine, Insuring America’s Health (Washington D.C., 2004) 4 Kaiser Family Foundation, State Health Facts (http://www.statehealthfacts.org/cgi-bin/healthfacts.cgi?action=compare&category=Health+Coverage+%26+Uninsured&subcategory=Insurance+Status&topic=Distribution+by+Insurance+Status) (Accessed April 30, 2005) 5 The state resident population figure of 19.6 million non-elderly persons comes from the Kaiser Family Foundation State Health Facts website. http://www.kff.org/statepolicy/index.cfm (Accessed May 1, 2005). 6 Texas Department of Insurance, Texas State Planning Grant: Final Report to the Secretary, U. S. Department of Health and Human Services (March 2003) 7 Id., Table 1.5 8 Id., Table 1.7 9 Id., Table 1.9 10 Id. Table 2.3. 11 Employer-sponsored benefit plans, particularly when subsidized, are a critical source of overall compensation. 12 Institute of Medicine, Insuring America’s Health: Principles and Recommendations (Washington D.C. 2004) 13 C. Hoffman, D. Rowland, And A. Carbaugh, Holes in the Health Insurance System: Who Lacks Coverage and Why?, National Health Reform and America’s Uninsured (S. Rosenbaum, ed.) Journal of Law, Med. & Ethics 32:3 (Fall, 2004) 390-407; Insuring America’s Health , note 11, supra.

F-3
coverage they offer. 14 By 2004 only 63 percent of small firms surveyed nationally in one major study offered coverage, down from 68 percent in 2001.15 These numbers also are reflected in the TDI data. To the extent that declining employee take-up rates in fact is a growing issue, cost again appears to be the driver. One widely reported study has estimated that virtually all of the decline between 1988 and 2001 in employee take-up rates among full-time male workers could be attributed to increases in the employee share of the premium over this time period.16
As both the TDI and national data show, working-age adults who are not in the labor
market face especially challenging health insurance access problems because the individual insurance market is both limited and costly. Non-working adults are more likely to experience elevated poverty and reduced health status, both of which predict coverage rates. Unless they qualify for Medicare or Medicaid, their coverage options may be exceedingly limited, even with such regulatory interventions in the insurance market as guaranteed issue and high-risk pools, both of which are features of Texas law,17 as well as the insurance laws of virtually all states.
Taken together, these statistics suggest a weak employer insurance market in the state,
compounded by inadequate alternatives to employer-sponsored coverage. This weakness is significantly attributable to the cost of coverage in relation to employee compensation and family income. The TDI study cites health insurance cost figures that are comparable to national data showing that in 2004, the total average monthly cost of employer-sponsored family coverage exceeded $800 while the cost of single coverage hovered at the $300 mark.18 For older persons in poor health and dependent on the individual market, the monthly figure is much higher. Even for younger workers with no serious conditions, coverage under a limited individual plan can exceed $200 (post-tax) monthly, with no employer contribution.
In view of the relationship between family income and health insurance coverage, a
central question thus becomes the extent to which regulatory intervention alone can open up a market and/or make it more affordable. Even the most energetic proponents of a market driven approach to health insurance reform that emphasizes individual coverage rather than employee benefits assume subsidization through tax credits. 19 In the absence of a subsidy program, expectations from regulation alone may be modest, and a more appropriate way of thinking about the issue might be to consider which regulatory interventions, in combination with subsidies, might do the most to aid the market.
In this regard, two basic types of regulatory interventions are relevant. The first is
interventions aimed at creating more affordable and attractive employer-sponsored benefits. The second is interventions aimed at strengthening the individual coverage market. A matter to bear in mind in assessing the relative value of interventions into the individual and group markets is the underlying drivers of insurance costs. Other than for the elderly and workers with 14 Insuring America’s Health , note 11, supra. 15 J. Gabel, G. Claxton, I. Gil, J. Pickreign, H. Whitmore, E. Holve, B. Finder, S. Hawkins, and D. Rowland, “Health Benefits in 2004: Four Years of Double-Digit Premium Increases Take their Toll on Coverage,” Health Affairs 23:5 (Sept. /Oct. 2004) pp. 200-209. 16 David Cutler, Employee Costs and the Decline in Health Insurance Coverage (Harvard/NBER, 2002). 17 Texas State Planning Grant, note 6, supra. 18 Kaiser Family Foundation and Health Research Educational Trust, Trends and Indicators in the Changing Health Care Marketplace (2004 ed.) http://www.kff.org/insurance/index.cfm (Accessed May 1, 2005). 19 See, e.g, M. Pauley, Conflict and Compromise over Tradeoffs in Universal Health Insurance Plans, Journal of Law, Medicine and Ethics, note 12, supra. 465-473. Laura Trueman, Health Tax Credits for the Uninsured (Brief Analysis #498) National Center for Policy Analysis (2005) http://www.ncpa.org/pub/ba/ba498/

F-4
severe disabilities, the U.S. depends on a voluntary coverage system.20 In such a system, the cost of coverage can be expected to be inherently higher as a result of adverse selection.21 Employer coverage somewhat mitigates this likelihood because of who works, constraints on the timing of enrollment, and the incentivization of healthy workers through the employer contribution. Thus, regulatory models that aim to build on the individual system either will have only limited impact without heavy subsidies or must aim to replicate the market characteristics of voluntary group products.
The Role of States in the Regulation of Health Insurance Some Preliminary Considerations
In assessing state regulatory powers in the health insurance market, it is valuable to consider the two fundamental factors that underlie the basic architecture of the market: pooling and design.
• The insurance pool: Who enrolls in an insurance pool greatly affects the market. The greater the proportion of younger, healthier members, the lower the cost of coverage for the group as a whole, although costs for young and healthy enrollees could be expected to be higher because of the characteristics of the group. Many aspects of insurance products are designed to keep bad risks out of insurance pools, with the notion of bad risks encompassing not only people who attempt to enroll at the point of services (adverse selection) but also persons whose characteristics and health status place them at higher risk for use of services.
• Coverage design: Health insurance coverage design considerations are complex and intricate, and highly relevant to a discussion of regulatory intervention. It is well understood that coverage can be limited or comprehensive in design in terms of deductibles, coinsurance, copayments, the application of annual and lifetime maximum coverage limits, and the presence of stop-loss on out-of-pocket payments for covered benefits. Beyond these factors, the concept of design encompasses many other considerations: the classes and categories of benefits covered and the array of services and procedures covered within each class; applicable limitations and exclusions on coverage; the use of waiting periods and pre-existing condition exclusions to apply post-enrollment coverage limits on specific services; the rigor of certain key terms and definitions such as “medical necessity;” and the scope of discretion accorded to insurers to make final and binding coverage determinations and with broad discretion to construe the terms of the agreement.22
Any assessment of state health insurance regulatory options in the context of enrollment
and design inevitably brings into sharp relief the paradoxical nature of insurance regulation: As state regulators use their powers to expand -- and improve coverage within – insurance pools, costs in turn may rise for persons who are already adequately covered members of the insurance pool. For example, efforts to open up an insurance pool for older persons in fair to
20 Medicare of course is compulsory and universal. As noted, to some extent, other types of insurance products (such as automobile insurance, workers compensation, or homeowners’ insurance) may cover certain health care costs and may in fact be compulsory under state or federal law (e.g., state laws related to driver qualifications, state workers compensation laws, federal banking laws regulating mortgage insurance). The health care coverage offered under these arrangements is, as noted, beyond the purview of this paper, which examines state regulation of health insurance products. 21 Mark Merlis, Fundamentals of Underwriting in the Nongroup Health Insurance Market: Access to Coverage and Options for Reform (National Health Policy Forum, Washington D.C., April, 2005) 22 Rand Rosenblatt, Sylvia Law, and Sara Rosenbaum, Law and the American Health Care System (Foundation Press, 1997; 2001-2002 Supplement) Ch. 2.

F-5
poor health may make coverage more accessible and affordable for them, while commensurately increasing costs for younger and healthier persons. Efforts to provide for more adequate coverage for persons who already are members of a pool, by limiting diagnostic-specific exclusions or strict annual payouts on claims may improve coverage for members of the pool with health conditions while elevating premiums for those without such conditions. These concepts of using regulatory powers to broaden and strengthen insurance pools are sometimes referred to as risk solidarity, and these types of regulatory interventions tend to generate fierce opposition from the insurance industry. The Legal and Political Limits of State Insurance Regulatory Powers
Under principles of U.S. law, states play the primary role in the regulation of health insurance. 23 For state governments however, this hardly feels like an accurate statement. A host of federal laws have a limiting and pre-emptive effect on state insurance regulatory powers. The Employee Retirement Act of 1974 (ERISA),24 which governs virtually all benefit plans offered by private employers, may be the best known federal law in this regard; while ERISA pre-emption principles “save” state laws that regulate insurance, self insured employer-sponsored health plans are not considered “insurance.”25 As the Texas Insurance Department reports in its health insurance study, of the 11.4 million Texas residents with some form of private coverage, 5 million are members of self insured plans.26
Other federal laws have a similar pre-emptive effect. Depending on the labor patterns
within the state, their cumulative limiting impact on state power to affect insurance through regulation may be considerable. Two important examples of other pre-emptive laws are TriCare and the Federal Employee Health Benefit Act, both of which regulate insurance sold or furnished to the federal civilian and military workforce. Medicare standards for insurance products sold to beneficiaries offers another relevant example of pre-emptive law.
Federal law also directly affects certain state insurance regulatory practices. The most
important of these laws, the Health Insurance Portability and Accountability Act of 1996 (HIPAA), establishes minimum federal standards for state regulated insurance markets in several critical areas, all of which may affect coverage costs to some degree. HIPAA requires state licensed health insurers to make their small group products available to all small employers (i.e., employers with between 2 and 50 employees) regardless of their claims experience or employee health status.27 HIPAA itself does not regulate the rates that can be charged for these products, although many states regulate rates in the small group market.28
HIPAA also requires state licensed insurers to accept persons transitioning from group
to individual coverage and who meet a series of strict conditions, such as ineligibility for any other coverage and continuous coverage in the group market for at least 18 months.29 Persons 23 Law and the American Health Care System, n. 22, supra. Ch. 2 The federal law delegating this power to states is the McCarrn-Ferguson Act of 1945, 15 U.S.C. §§1011 et. seq. 24 29 U.S. C. §1001 et. seq. 25 Federal law however, does regulate certain coverage practices by ERISA plans, even in the case of self insured health benefit plans. For example, federal law requires most plans to offer continuation coverage, mandates certain benefits (e.g., maternity and newborn care), and prohibits variations based on health status among similarly situated individuals covered through employer plans. GAO, Private Health Insurance, Federal and State Requirements Affecting Coverage Offered by Small Businesses (GAO-03-1133, Sept. 2003) 26 Texas Department of Insurance, n. 6, supra, p. 13. 27 G. Claxton, How Private Insurance Works: A Primer (Kaiser Family Foundation, Washington D.C., April 2002). 28 Id. 29 Id.

F-6
protected under these transitional rules are known as HIPAA-eligible persons because they are considered to have continuous and “creditable” coverage prior to entering the individual market. They also must have exhausted their group continuation coverage (known as “COBRA” coverage) and must apply for individual coverage within 63 days of leaving group coverage.30 In many states, coverage is available through risk pools rather than through individual product.31
HIPAA requires licensed insurers to guarantee renewal of coverage sold to multiple
employers, although the level of the renewal premium is left to insurer discretion. 32 Finally, HIPAA prohibits discrimination based on health related factors in rates charged to members of an employee group.33
The extremely fragmented and segmented nature of the health insurance market,
coupled with a raft of pre-emptive statutes, poses both financial and legal challenges to states. To the extent that state residents are enrolled in plans exempt from state insurance law through pre-emption, their coverage is “off limits” to state regulations. Even where state regulators can reach employer plans, as is the case with products sold to fully insured plans by licensed health insurers, insurers may strongly resist regulation so as to avoid what they perceive as changes that will affect both their insured and self insured markets.
It is critical to bear in mind that there is one sizable group of insured residents who are
members of a pool that is fully accessible state regulation, either directly or indirectly depending on the legal structure of the relationship between state and local government. This group consists of residents who are public employees of a state, its localities, and the governmental units and instrumentalities of the state. In Texas this group would be of considerable size and range.34 Were state regulators to use this large pool of relatively healthy workers and their families as the basis for a broader restructuring for the group and individual markets, the impact might be substantial. Where reforms built on public employees are concerned, the constraints may be more operational and political than legal.
An Inventory of State Insurance Regulatory Powers
State insurance laws essentially are designed to accomplish three basic goals: (1) ensuring financial standards for licensure that guarantee the stability and solvency of insurance products; (2) to ensure appropriate market conduct and guard against marketing fraud or unfair business practices; and (3) and to regulate the accessibility, affordability, structure and content of licensed products. It is the third power of state regulators that is most relevant to this analysis. All states have laws falling into all three categories; beyond this threshold fact however, state laws vary enormously in their scope, range and the specifics of their requirements.
Some states, such as New York, tend to be cited in the literature for their comparatively
regulatory approach to insurance; other states, (notably Texas) tend to be identified as states that engage in only limited regulatory practices.35 Whether these differences in regulation
30 Id. 31 Id. 32 Id. 33 GAO, Private Insurance: Federal and State Requirements Affecting Coverage Offered by Small Businesses(GAO, 03-1133, Washington D.C. 2003). 34 It is worth noting that the very low percentage of individuals engaged in public employment who appear to be uninsured suggests that, in Texas as nationally, the problem is not the lack of willingness to participate in employer coverage, but the lack of affordable coverage to begin with. 35 See, e.g.,Federal and State Requirements, n. 33, supra.

F-7
account for most, or even much, of the state-to-state variation in the cost of health insurance is not known. As noted, numerous factors (such as the underlying cost of medical care, the insurance markets present in particular states, the nature of the industry operating in any particular state, and even the unique health care culture of the state in which coverage is offered)36 play important roles in determining the cost of coverage. It is perhaps worth noting again that the TDI insurance cost figures cited in its 2003 report parallel national norms; thus, to the extent that Texas falls into the deregulated end of the regulation spectrum, this fact does not seem to have produced major cost differences.
Three basic classes of licensed health insuring organizations can be found in most if not all states: commercial insurers; Blue Cross and Blue Shield plans (which may or may not continue to operate as non-profit organizations rather than licensed insurers); and health maintenance organizations (HMOs). 37 State regulatory activities may be aimed at one, two or all three license holders, who in turn may sell in both the group and individual market. Regardless of their licensure category, all three classes of insurer would share an interest in attracting a coverage pool that parallels the general population and is not disproportionately comprised of adverse risks. Insurers also may segment their markets by both purchaser (individuals, small groups, large groups, trade associations) and by product type (e.g., different products made available to specific markets). Certain common factors are used to segment the market: age, occupation, gender, health status and geographic location.38
Insurers also may use underwriting in order to keep pools stable; underwriting is the process by which insurers will accept applicants for coverage and set the terms and price of coverage. Even where state laws require an insurer to accept applicants in the small group and individual market, they may give companies broad discretion where post-enrollment underwriting is concerned in order to set the coverage terms for enrollees. These terms, part of the product design itself, offer insurers additional safeguards against adverse selection.
States typically exercise various types of regulatory powers over health insurance products; these powers have been chronicled in a particularly understandable manner by Gary Claxton, an expert in health insurance regulation, who also notes that the exercise of these powers varies considerably by insurance product and by state:39
• Premium regulation: States can regulate premiums in numerous respects. They can establish “rate bands” that limit the discretion of insurers to adopt wide ranges between the lowest and highest premiums charged for the same product. Rate band laws can be limited or broad in scope and may set strict or limited ranges (e.g., restricting the highest rate to no more than 150% of the lowest rate for the same product). Thus, for example, a state insurance agency might specify that rates charged to small group purchasers be no more than 150% greater than the rate charged to very large groups such as a teachers’ union. Premium regulation also can consist of community rating standards which can be strict or modified to permit some variation in the rates at which different enrollees are charged for the same product. States also may establish “loss ratios” to ensure a reasonable ratio of benefit payments to premiums charged. Regulation of loss ratios acts both as a check on premium costs and as an indirect form of benefit design regulation.
36 Localities vary enormously in how much and what type of health care they use. Utilization of course affects the cost of coverage. 37 How Private Insurance Works n. 26, supra. 38 Id. 39 Id.

F-8
• Medical underwriting: Regulators also may regulate the extent to which insurers can engage in medical underwriting either at the point of application or subsequent to enrollment as a means of limiting adverse selection in terms of coverage use. Medical underwriting is particularly common in the individual market. Medical underwriting can lead to high levels of applicant rejection rates and a very limited number of “clean offers”, that is, offers without a host of riders and exclusions that limit the terms of coverage. 40 Similar to premium banding, the regulation of medical underwriting practices would be distinct from the direct regulation of how much can be charged to any particular purchaser (or group of purchasers) for any particular product.
• Renewability and guaranteed issue: Renewability is designed to ensure that, at the end of a coverage term, an individual or small group purchaser is not denied contract renewal. Guaranteed issue is designed to ensure initial access to the market. HIPAA regulates guaranteed issue for transitioning individuals who are HIPAA-eligible, as well as small employers. But neither renewability nor guaranteed issue alone ensures affordable rates, since HIPAA does not regulate rates.
• Coverage continuation: As is the case under federal law (COBRA) states frequently require insurers to allow former members of a covered employee or association group to continue coverage under certain circumstances. In this sense, COBRA, like many federal laws, represents an evolution of state insurance law.
• Benefit design: All states regulate benefit design to some degree, with coverage of specified benefits required. A 2001 GAO study found that Texas fell into the group of states with the highest number of mandates, although the study did not appear to group mandate by anticipated cost and grouped all forms of mandates (small group, large group, and individual market) together.41
• Review and appeals: An insurer’s discretion to make final and non-reviewable decisions typically is the subject of state regulation, with all states permitting at least some level of review for at least certain types of denials.
HIPAA’s provisions in context. HIPAA represents an effort on the federal government’s part
to set minimum standards for non-group products. Beyond the issue of portability from group to group and for persons transitioning between the group and individual markets, HIPAA requires guaranteed issue for persons who are “HIPAA-eligible”, that is, who previously had group coverage and who are transitioning without significant break in “creditable coverage” from the group to the individual market.” HIPAA permits states to choose between requiring their insurers to offer guarantee issued products or establishing an alternative approach such as high-risk pools. The critical issue here is that HIPAA protects only persons transitioning from the group to the individual market, not individuals attempting to initially secure individual coverage. Furthermore, individuals who experience a break in “creditable coverage” (e.g., who cannot pay their COBRA continuation premiums) lose their HIPAA guaranteed issue protections.
HIPAA’s guaranteed renewal provisions are more generous than its limited guaranteed
issue protections. Regardless of an individual’s HIPAA eligibility status as a person protected for purposes of guaranteed issue, HIPAA protects against denial of a renewal, but as noted previously, HIPAA does not regulate the rates that are charged upon renewal, just as it does not regulate guaranteed issue rates.
40 Fundamentals of Underwriting, n. 23, supra; K. Pollitz, R. Sorian and K. Thomas, How Accessible is Individual Health Insurance for Consumers in Less than Perfect Health? (Georgetown Institute for Health Policy Studies for the Kaiser Family Foundation, Washington D.C. , 2001) 41 Federal and State Requirements Affecting Coverage Offered by Small Businesses, n. 33, supra. Figure 1.

F-9
More active state intervention in the individual market. Over the past 20 years, states have begun to more actively regulate the small group market (employers between 2 and 50 persons; in some states, the self-employed are treated as a small group).42 As one expert notes, a few states have begun to apply regulatory tools to the non-group (i.e., individual) market, but these incursions are often quite controversial because of their impact on lower risk individual purchasers. 43
Table 1 summarizes the status of state regulation in the non-group market as of April, 2004.
In some states, the level of regulatory protection exceeds minimum HIPAA requirements. As Table 1 shows, Texas has opted for few of these added protections.
One important “HIPPA +” protection would be a “guaranteed issue” rule that protects all applicants, HIPAA-eligible or otherwise. Table 1 shows that as of 2004, this protection was rare (5 states only). Another 12 states provided at least a limited additional level of guaranteed issue protection for certain classes of non-HIPAA qualified persons. Texas does not offer limited protections.
Some states have elected to make guaranteed issue a rule for self-employed persons as well as small groups. As table 1 shows, Texas did not extend this protection to self employed persons as of 2004.
A much larger group of states offers conversion coverage. Conversion coverage differs from
HIPAA portability protections, because it covers persons who may not meet HIPAA qualification standards. A conversion rule would require an insurer to offer an individual product to a person losing coverage under a group plan offered by the insurer. Texas offers a high risk pool but as Table 1 indicates, Texas does not offer conversion protection. While many states establish conversion protections, very few regulate the rate that can be charged for a conversion policy.
Some states offer continuation coverage for persons employed by firms not covered by
COBRA protections because they employ fewer than 20 persons on a full-time basis.
With respect to regulation of exclusionary provisions and premiums, Table 1 also shows that Texas has not elected to pursue options used in some states in the nongroup market. About one third of all states either totally or partially restrict the use of post-enrollment exclusion riders based on underwriting. Texas does not do so. Texas does place limits on the period of time that insurers can “look back” in setting exclusion riders but limits this protection to HMO enrollment. The state also limits individuals who can benefit from this “lookback” protection to persons with HIPAA- creditable coverage. Direct rate regulation is of course the most far-reaching form of regulatory intervention, since it directly affects the rate that an issuer can charge. The rate spread between high and low risk enrollees in any particular product can be enormous. While rate banding and rate restrictions would make coverage affordable to persons with higher risks, it would elevate the price for lower risks. Furthermore, as rates for the lowest risk enrollees rise, the rates at the highest end would fall but not always appreciably in an affordability context. For example, a requirement that a premium not be more than 50% higher or lower than the standard rate might drop an $11,000 premium to $7,800 for a high risk person. 44 As Mark Merlis notes in his
42 Id. 43 Id. 44 Id.

F-10
excellent review of underwriting, rating restrictions could send products into a death spiral, as the lowest risks abandon the pool because of the rate increase. 45 Merlis notes that compulsory membership with tax subsidies might avert this result. States, including Texas, have established high risk pools; as of 2003, 31 states had such pools, as Table 1 shows. Because these pools cover very high risk persons, even exceedingly high individual premium payments must be supplemented (typically by an assessment on insurers) to meet the costs of coverage. Even this assessment (typically 1 percent) may not be enough to make coverage affordable. In order to avoid outright rate regulation of these rates, states supplement their assessments on non-group insurers with group insurance assessments. Whether ERISA would pre-empt a similar assessment on self insured group health plans is an issue that has never been litigated. Alternative approaches to structuring such a supplemental assessment on self insuring employers might pass muster. One possible alternative that avoids a direct assessment on an ERISA benefit plan was used in recent Maryland legislation, where the state legislature placed the assessment on large employers whose health expenditures for workers fall below a certain threshold. (This approach was dubbed the “Walmart Tax” because Walmart was the only large employer that, evidence suggested, could not satisfy the threshold expenditure requirements). Finally, creating a broader insurance pool that extends well beyond high risks and includes large numbers of healthy and well covered individuals might have an impact. In this regard, a state could use its own public employee pool as the basis for such an intervention, with regulation of rates and premiums pegged to the pool. Of course, such an intervention is beyond the limits of state insurance regulatory powers in the traditional sense and would require a fundamental rethinking of the relationship between small groups and individuals on the one hand, and public employees on the other. One approach that is highly dependent on federal law is reforms in the small group market. Federal legislation to establish “Association Health Plans” would exempt such plans from state insurance regulation, just as self-insured ERISA plans are exempt. Proponents argue that preemption of state insurance laws regulating products sold to small groups would help reduce the cost of coverage, although there appears to be no definitive evidence to confirm this viewpoint. Opponents argue that the legislation would pre-empt more active state efforts to make small group coverage more affordable and accessible through such techniques as premium and rate regulation, curbs on post-enrollment underwriting, and guaranteed issue.46 More active state intervention in the small group market: Tables 2-4 are taken from Appendices III-V of a 2003 GAO report that examines state regulation of the small group market. Table 2 (GAO Appendix III) shows that Texas was among the 47 states that in 2003 maintained at least some restrictions on the setting of rates in the small group market. Texas uses a rating band approach, which allows for variation within limits in premiums among types of small business based on factors such as age, group size and industry Twelve states use either pure or modified community rating, which prohibit the use of health status to set premiums, thereby ensuring greater affordability for small firms with sicker employees, while potentially elevating rates charged firms with healthy employees during a particular contract year.
45 Id. 46 Id.

F-11
Table 3 (GAO Appendix IV) shows which states exceed federal requirements in two respects in terms of how they approach small group plans. Texas was one of 40 states that required insurers to offer continuation coverage to former members of employer groups of fewer than 20 full-time employees (state COBRA). On the other hand, Texas did not elect to tighten HIPAA standards regarding the use of pre-existing condition exclusions. HIPAA limits these exclusions to 12 months, and some states have established shorter periods; Texas has not elected this option. Efforts to open the group insurance market to new products. Individual coverage typically is subject to high deductibles, so the attention in recent years given to hybrid insurance products offering health savings accounts coupled with high-deductible plans may be most relevant to coverage access in the small employer group market where affordability is a major barrier. Growth of these products in the employer group market has been slow, although as costs continue to escalate, employer interest may increase.47 Whether a state would want to take aggressive steps to encourage a more robust market for this type of hybrid product is an issue for careful consideration. This is because introduction of such a product into the group market could have further segmentation effects on existing coverage arrangements, with elevated premiums for higher risk individuals. Without a companion initiative to stabilize premium rates for small groups with higher risk individuals, the risk carried by these hybrid products is their ultimate impact on affordability of coverage for the highest risk state residents. 48 It is also unclear whether the lower rates for hybrid products would be sufficiently low to attract large numbers of small low wage firms. Even if these products are appreciably less expensive than standard insurance, firms may find that they cannot afford even lower rates of incremental compensation associated with offering subsidized high deductible health products. Discussion and Implications The evidence presented in this paper supports several conclusions. First, Texas’ extensive health insurance problem appears to be primarily attributable to the weakness of the state’s employer-based insurance system for workers and their families. Many factors dictate the strength of employer-sponsored insurance markets, and an assessment of their relative contribution to the state’s insurance dilemma is beyond the scope of this paper. Even were the state to pursue Medicaid expansions and encourage a far more dynamic individual market (and national estimates of individual coverage suggest that at best this market is quite limited), the coverage shortfall produced by a weak employer market is so great that the road to reform in Texas is particularly steep. Reforms that stimulate greater employer participation appears to be a critical part of the puzzle. Second, stimulating greater employer participation appears to be a function of the extent to which employers view coverage as affordable. Putting aside direct financial subsidies to employers and employees, there are regulatory interventions that might be worth considering. One such intervention is more active use of premium controls, such as modified community rating that eliminates rating based on health experience. Another might be to place smaller employers into larger pools by restructuring the public employee system to include smaller groups. In this way, the state might create a single and very large “state purchasing group” that might give small employers the benefit of a far larger group membership, more choices, and better rates. Enlarging the group also might make use of a modified community rating system
47 B. Fuchs and J. James, Health Savings Accounts: The Fundamentals (National Health Policy Forum, Washington D.C., 2005) 48 M. Kofman, State Coverage Initiatives Issue Brief V:3: Health Savings Accounts: Issues and Implementation Decisions for States (AcademyHealth, Washington D.C., 2004)

F-12
more conceptually feasible. Whether this approach is operationally and politically feasible remains an important question for consideration by the Task Force.
Third, this analysis also suggests that the state has made only modest use of its power to regulate products purchased in the non-group market, when compared to other states. Most notably, the state appears not to have extended certain basic protections to self-employed individuals that are in use in other states. Nor does Texas provide basic conversion protection or other bridging arrangements for persons losing group coverage, who do not qualify for HIPAA protections. Finally, of course, the evidence suggests that the state does not offer the premium controls and cross subsidies available in other states.
Whether more aggressive approach to regulation and pooling reform would significantly
alter the insurance picture in the absence of considerable subsidization cannot be known for sure. This is because states that show radically different insurance patterns experience these differences for many reasons that go well beyond their willingness to regulate the market. At the same time, the information presented here suggests that certain reforms in the individual and small group market are worthy of consideration, as is a more comprehensive approach to create a “state purchasing pool” using the state’s considerable power to affect market conditions through the purchase of health benefit plans for public employees.

Appendix G
Emergency and Trauma Care in Texas: Assessment, Challenges, and Options
Charles Begley, Sharron Cox , Arlo Weltge,
Cindy Gunn, and Munseok Seo

G-1
Appendix G
Emergency and Trauma Care in Texas: Assessment, Challenges, and Options
Prepared by Charles Begley,i Sharron Cox,ii Arlo Weltge,I Cindy Gunn,iii
and Munseok Seoi iCenter for Health Services Research
School of Public Health The University of Texas Health Science Center – Houston
iiHouston- Galveston Area Council iiiMemorial Hermann Healthcare System
October 2005
I. Introduction
Trauma is the leading cause of death for Texans under the age of 45 and the third
leading cause of death and disability for all Texans. Every day there are an average of 32 trauma deaths in Texas with motor vehicle crashes, suicide and homicide topping the list of causes.a Emergency and trauma care systems have been shown to increase survival of severely injured patients by providing pre-hospital emergency (EMS) and specialized hospital care (trauma care).b State and regional efforts to develop regionalized trauma systems have been ongoing in Texas for about 30 years. This paper provides a historical overview of the factors contributing to the development of these systems, describes their characteristics, discusses current issues and challenges, and suggests options to enhance their development and performance.
II. Historical Overview
The historical development of trauma systems in Texas can be understood in relation to the history of emergency medicine in the military, the realization of injury as a public health problem in the United States in the 1960s, and the subsequent federal and state government funding of systems and services.
The earliest historical evidence of emergency transport and treatment of wounded
soldiers in military campaigns dates back to the Roman Empire. Emergency medical practices employed by France in the Napoleonic Wars by Baron Dominique-Jean Larrey remain guiding principles still in use today. Baron Larrey developed battlefield protocols that included a rapid mode of transport, known as an ambulance volante, where trained personnel could reach the wounded quickly and provide stabilization and minor treatment before quickly evacuating them to aide stations or a medical facility for more definitive care. Efforts to replicate Larrey’s precepts of rapid transport, immediate treatment, and triage were made in the United States during the Civil War. c
In the 20th century, medical knowledge, technology and practice in treatment of wounded
soldiers advanced in the two world wars leading to progressively higher survival rates. Motorized transport provided quicker access to the wounded and to the various levels of care.

G-2
The treatment of shock prior to surgery and new surgical therapies were among the medical innovations employed especially during World War II. The Korean War led to broad use of helicopters as transport vehicles and the mobile surgical army hospital, or MASH unit.d e
While these advancements in medical care were being made in the military, the expertise and resources to transport and care for critically injured civilians in the United States was also slowly being developed. Near the end of the Civil War, a few major urban areas began to develop ambulance services, primarily organized by local hospitals. Cincinnati General Hospital opened an ambulance service in 1865 shortly followed by services opened by local hospitals in Atlanta, New Orleans and New York City.f Other than a few major municipalities with this foresight, most early emergency transports were organized by local funeral homes.g
Urban teaching hospitals gradually began to develop trauma care capacity and faculty began to publish clinical research on trauma care and outcomes, and provide training in trauma care. However, when trained trauma surgeons left the urban hospital setting, they found little support for their specialty and gaps remained between military and civilian capacity and the number of preventable deaths of injured patients grew.h
The organized, modern emergency medical services and trauma system only began to look like it does today following the publication of Accidental Death and Disability: The Neglected Disease of Modern Society by the National Research Council/National Academy of Sciences in 1966. With the publication of this paper, policymakers in the United States began to look at death and disability from injury as a public health problem worthy of governmental attention and funding.
This paper had far-reaching recommendations, most of which have been implemented over the last 40 years to create the modern trauma system. The report called for training and credentialing of ambulance service providers, implementation of radio-communication technology, special training of physicians in emergency medicine and trauma care, regulatory authority to categorize hospital capabilities, hospital and care provider accountability for patient outcomes, patient registries, and investment in injury prevention through research, public education and governmental intervention.i Congress responded to the report by passing the National Traffic and Motor Vehicle Safety Act and the National Highway Safety Act of 1966. These acts not only established motor vehicle safety standards, but created the EMS Program within the Department of Transportation, ultimately leading to systematic planning and program development of emergency medical services and trauma care.
Federal funding for emergency system planning and provider training was granted during the 1970s through two pieces of legislation – the Emergency Medical Services System Act of 1973 and the Emergency Medical Services Amendments in 1976. Although $300 million was spent over eight years and 304 EMS regions were created, only a few areas were able to establish continual funding for EMS at the state or local government level.j k The Omnibus Budget Reconciliation Act of 1981 substantially reduced the allocation of EMS grants to the states and incorporated the funding in block grants to states for programs to support preventive measures and health services.l
Additional federal funding of trauma systems includes block and categorical grants from
the Health Resources and Services Administration (HRSA), and the Centers for Disease Control and Prevention (CDC). HRSA provides trauma-emergency medical services systems state grants based upon the 2002 National Assessment of State Trauma System Development, Emergency Medical Services Resources, and Disaster Readiness for Mass Casualty Events.

G-3
The CDC provides funding to state and research programs based upon their Injury Research Agenda which was recently revised to increase support for acute injury research. Funding is focused primarily on injury prevention efforts and injury research centers. Texas does not receive any of these federal funds. Additional federal legislation that impacts trauma care includes the Emergency Medical Treatment and Labor Act (EMTALA).m Passed in 1986 as part of the Consolidated Omnibus Reconciliation Act of 1985 (Pub Law 99-272), this law, often referred to as the ‘anti-dumping law,’ creates a requirement for medical screening and stabilization of patients with emergencies presenting to a hospital emergency center. In addition, this law imposes regulations and restrictions on transfer of patients between hospitals. While provisions have been made for payment for screening examinations, this law still largely imposes an ‘unfunded mandate’ on hospitals and trauma centers caring for injured patients.n
The Centers for Medicare & Medicaid Services (CMS) issued final guidance in May of 2005 for a nationwide $1 billion program mandated under the Medicare Prescription Drug, Improvement, and Modernization Act (MMA) to help hospitals and other providers with the cost of providing emergency care to undocumented aliens. The 4-year program provides extra funding to those states, including Texas, with a higher burden of care for undocumented aliens. The funding, often referred to as Section 1011, designates a national contractor to administer reimbursement to hospitals, certain physicians and ambulance providers.o
Initial state legislation to establish regionalized emergency and trauma care systems in Texas was passed in 1989. The Texas Legislature charged the Texas Department of Health (now the Texas Department of State Health Services, or TDSHS) to implement a statewide EMS and trauma care system including a designation system for trauma facilities and a trauma registry. No funding was provided to TDSHS to accomplish these directives, however.p In 1992, the Texas Board of Health adopted rules for implementing the Texas trauma system which called for the state to be divided into 22 trauma service areas (TSAs). Each TSA was required to develop a regional advisory council (RAC) with appropriate representation from local EMS agencies and trauma hospitals. RACs were required to develop and implement a regional trauma system plan. The TDSHS rules also required the department to develop a trauma facility designation process and a statewide trauma registry.q
Throughout the decade, emergency services and trauma system planning and development continued as the TDSHS rules were implemented. Yet, much of these activities took place with little funding. In 1997, the Texas Legislature redirected $4 million from 9-1-1 funds to the newly created EMS/Trauma System fund. Each legislative session thereafter has redirected approximately $4 million to this account each biennium from 9-1-1 fees. In 1999, $100 million of the state’s tobacco funds was set aside in a permanent endowment with the interest on these funds directed toward trauma and EMS needs. The annual interest from these funds, approximately $3 million a year, is directed toward local project grants to EMS agencies and funding for the RACs. Also during the 1999 legislative session, the tertiary medical account was established to reimburse trauma hospitals the cost of uncompensated trauma care incurred for out-of-county patients.r A little over $16 million was allocated to this account in 2001 and 2002. No funds have been appropriated since 2002.
An important development in trauma and emergency services system planning was the establishment of the Governor’s EMS and Trauma Advisory Council (GETAC) in 1999 by the TDSHS Sunset legislation. GETAC was established to provide input and recommendations to the Texas Board of Health and TDSHS staff. Later, GETAC’s charge was expanded to assess

G-4
the EMS needs in rural areas of the state and to create a strategic plan relating to development of EMS and trauma systems in the state and to refine educational and certification requirements of EMS providers.s
With a growing vocal constituency calling for funding support for the state’s EMS agencies and trauma centers, the 78th Texas Legislature passed two funding vehicles in 2003. Senate Bill 1131 directed funds to EMS and trauma care providers through an additional $100 fee to be paid by those convicted of certain intoxication offenses and was expected to bring between $3 million to $6 million annually in funding for uncompensated trauma care. Funding realized from this legislation in the most recent biennium was just over $2 million to support trauma hospitals, EMS agencies, the RACs and the TDSHS Office of EMS/Trauma Coordination. House Bill 3588, on the other hand, promised a great deal more in funding to EMS and trauma care providers through its Driver Responsibility Program. This program, which would penalize habitually bad drivers, was expected to generate $220 million annually for uncompensated trauma care costs, as well as the cost to provide EMS services throughout Texas.
Simultaneously with the development of the EMS and trauma system was the
implementation and growth of the emergency communications system. The publication of Accidental Death and Disability: The Neglected Disease of Modern Society in 1966 called for a radio-communications system throughout the country and the following year the Federal Communications Commission supported the concept of a single nationwide emergency number promoted by Congress.t
While Odessa was the first city in Texas to implement the universal emergency telephone number of 9-1-1 in 1970, u by the end of the decade, only 20 such systems existed in Texas cities. The 1980s saw the creation of emergency communication districts in various counties in Texas. During the 70th Texas Legislature in 1987, a bill known as House Bill 9-1-1 was passed, charging regional planning councils to develop a statewide emergency communications system. By 1990, all regions within the state not covered by an existing emergency communications district had submitted plans for the development of the telecommunications system needed to support 9-1-1. The regions were then allowed to begin collecting fees charged on local citizens and business’ telephone lines to fund implementation of the telecommunications plans.v
From the perspective of emergency management, the importance of adequate funding for EMS agencies and trauma facilities cannot be minimized. Today, funding for local EMS services remains primarily an obligation of local governmental entities in Texas, despite federal and state efforts to provide support. Likewise, support for trauma services is generally dependent upon the voluntary decisions of local hospitals. One state legislator exclaimed when hearing of issues related to inadequate provider funding, “Do you mean that the Texas Legislature has worked to ensure 9-1-1 capability in all 254 counties in Texas and neither can we guarantee that there will be an ambulance to pick someone up after a 9-1-1 emergency call nor can we expect that there will be a hospital available to care for this constituent?”1 1 Personal communication from Guy Clifton, M.D.

G-5
III. Facilities and Utilization Trauma Centers Currently, there are 227 designated trauma centers in Texas, 13 Level I, 9 Level II, 40 Level III, and 165 Level IV.w The Texas DSHS designates facilities using standards set forth by the American College of Surgeons. The resources that must be maintained by these facilities is described below.
Level I trauma centers typically serve a large city or a population dense area and are expected to manage large numbers of injured patients. These centers are required to have a trauma program, trauma service, trauma team and medical director. There must be departments or divisions of surgery, neurosurgery, orthopedic surgery, emergency medicine and anesthesia. General surgeons, anesthesiologists and emergency medicine specialists must be immediately available 24 hours a day. Every surgical subspecialty as well as obstetrics/gynecology, critical care medicine and radiology must be on call and promptly available 24 hours a day. Board certification is expected for general surgeons, emergency physicians, neurosurgeons and orthopedic surgeons. Level I trauma centers are expected to maintain specific emergency department personnel as well as equipment pertinent to trauma in all age groups. Twenty-four hour a day immediate operative capability, a staffed recovery room, intensive care units for the critically injured, respiratory therapy services, radiological services (including angiography, sonography, computed tomography with an in house technician and MRI), clinical laboratory services, hemodialysis, burn care and acute spinal cord management are all essential. Rehabilitation services must be available. Performance improvement including chart audits, care reviews and a trauma registry are essential. Finally Level I trauma centers are expected to be leaders in continuing education, trauma prevention programs and research.
Level II trauma centers provide care either in a population dense area to supplement the activity of a Level I center or in a less populated dense area where a Level I center is not immediately available. In the second case, there should be transfer agreements prearranged with a distant Level I facility. Level II centers are expected to have similar institutional organization, hospital departments/divisions and clinical capabilities as Level I facilities. However, cardiac surgery, microvascular/replant surgery and acute in-house hemodialysis are not required. A surgeon is expected to be on call 24 hours a day and present at resuscitations and operative procedures. The operating room must be adequately staffed and available when needed in a timely fashion. Emergency department personnel and equipment, recovery room and intensive care unit availability mirror that of a Level I institution. Many of the radiological services expected for the Level I center are expected for the Level II center. However, it is acceptable to not have an in-house CT technician or an MRI unit. There are fewer requirements for continuing education/outreach programs, prevention programs and research.
Level III trauma centers are required to have the capability to manage the initial care of the majority of injured patients and have 24-hour general surgical coverage. They should have transfer agreements in place for patients that exceed resources. The only specialties considered essential are emergency medicine, anesthesia, orthopedics, plastic surgery and radiology. Twenty-four hour availability of an operating room and on-call personnel are desirable. In-house radiological services are desirable but not expected; computed tomography availability is expected. A trauma registry and CME availability for physician and nursing staff are expected. Prevention programs and research are desirable, but not required.

G-6
Level IV trauma centers should be able to provide the initial evaluation, assessment and resuscitation of injured patients. Patients with known or potentially serious injuries are to be stabilized and arrangements made for safe transfer to a larger facility with more resources. The facility should have 24-hour coverage by a physician; surgical coverage may not be available. These facilities are typically located in rural areas. Continuing education and prevention programs are desirable. Trauma Service Areas and Regional Advisory Councils
The trauma services areas (TSAs) provide integration with local EMS agencies and trauma hospitals. The Trauma Regional Advisory Councils (Trauma RACs) are responsible for oversight of EMS diversion criteria. The TDSHS maintains EMS and trauma registry databases and has established rules for EMS and trauma oversight. The TDSHS certifies Emergency Medical Technicians (EMT) and approves EMS providers (first responders, basic and advanced, and air vehicles). Oversight is provided by county or city government for 9-1-1 response. Trauma Care Use and Outcomes
Trauma volume in Texas hospitals for 1999, 2000 and 2003 was estimated from Texas
hospital admission data.2 Trauma patients were identified by principal ICD-9-CM diagnosis code in the range 800.00 – 959.99, excluding 905-909 (late effects of injuries), 930-939 (effects of foreign bodies entering through an orifice), 958 (traumatic complications), and 820.0-820.99 if age >= 65 (hip fractures in the elderly). These are widely accepted codes for trauma cases.15
There has been an overall increase of 16.1% during the five year period (Table 1). As a
percentage of total discharges, trauma admissions increased from 3% to 4%. The characteristics of trauma cases has remained relatively stable over the period. The majority of cases are adults age 18-64. The race/ethnicity distribution reflects that of the population. About one third are commercially insured, 40% are covered by Medicare and Medicaid, and 15% are uninsured.
2 Data problems prevented us from reporting estimates for 2001 and 2002.

G-7
Table 1. Trauma Cases, 1999 – 2003 1999 2000 2003 Total discharges 74,275 76,642 86,203 Gender (%) Female 42.9 42.7 46.2 Male 57.1 57.3 53.8 Age (%) Children 0-17 15.6 15.1 15.3 Adults 18 – 64 58.3 58.6 55.9 Elderly 65 and older 26.1 26.4 28.7 Race (%) American Indian/ Eskimo/Aleut
.2 .1 .1
Black (non-Hispanic) 10.5 10.4 9.6 White (non-Hispanic) 58.4 58.5 60.0 Hispanic 24.7 24.8 26.0 Asian/Pacific Islander
.8 .8 .7
Other 3.9 5.4 5.1 Payment Source (%) Commercial Insurance
36.5 36.1 32.9
Medicare 25.3 25.8 30.2 Medicaid 8.8 8.4 11.5 Other Government .3 .3 .3 Other Private 6.4 6.4 5.0 Uninsured/Self-pay 16.7 15.6 15.3 Other 5.6 6.9 4.6 Source: Texas Health Care Information Council, Hospital Discharge Surveyx
The Injury Severity Score (ISS) is used to measure the severity of the patient’s injury. Table 2 shows the distribution of admissions by severity and outcome. Most cases fall in the 1-15 range of severity with 8-9% per year hospitalized for major trauma (ISS>15). The percentage of major trauma cases did not change over the period. Over 70% of all patients treated were discharged home or to self-care expecting a full recovery. Approximately a fourth of the patients were transferred to another facility where their condition upon discharge is unknown. Only 2-3 % died before discharge or were discharged to hospice care.

G-8
Table 2. Trends in Trauma Severity, Deaths, and Charges 1999 2000 2003 Trauma Severity3 # (%) # (%) # (%) Trauma ISS < =15 64,712 (87.1) 66,635 (86.9) 75,751(87.9) Major Trauma ISS >15 6,480 (8.7) 6,740 (8.8) 7,157(8.3) Unknown or Non-injury 3,083 (4.2) 3,267 (4.3) 3,295 (3.8) Discharge Status Discharged to home or self-care
53,499 (72.0) 55,629 (72.6) 61,281 (71.1)
Discharged to other Facility
19,089 (25.7) 19, 175 (25.0) 22,912 (26.6)
Deceased 1,687 (2.3) 1,838 (2.4) 2,010 (2.3) Source: Texas Health Care Information Council, Hospital Discharge Survey24 IV. Current Issues and Challenges
Uncompensated Care
Trauma centers are financially vulnerable because in their role of providing critical care services to a community they treat a disproportionate share of uninsured and underinsured patients. There has not been an on-going effort to measure the amount of trauma care costs that are uncompensated in Texas’ EMS and trauma care systems. However, uncompensated trauma hospital costs can be extrapolated from figures supplied by hospitals to the TDSHS to solicit HB 3588 funds. If these self-reported figures are used, it would appear that Texas hospitals spent about $208 million treating uninsured trauma patients in 2003.y This figure is based on uncompensated trauma care charges to which DSHS applied hospital specific cost-to-charge ratios to derive uncompensated trauma care costs for each designated facility. The figure is similar to an independent estimate by Bishop+Associates in a 2002 study conducted on behalf of Save Our ERs in Houston.z Based upon their analysis, 32% of all trauma patients in Texas were uninsured, generating uncompensated costs at these facilities of over $181 million. An effort is being made at the TDSHS to include questions in the annual survey of hospitals related to the provision of care to uninsured emergency and trauma patients. This will likely be included in the 2005 Annual Survey which will be administered in mid-2006.
Hospitals must recoup their costs, or risk going out of business. The standard practice is
to shift the cost of uncompensated care to those who can pay. A recent national study estimated that in 2005, premium costs for family health insurance coverage provided by private employers will include $922 in premiums due to the cost of care for the uninsured.aa Health insurance premiums for Texas families is estimated to be $1,551 higher due to the unreimbursed cost of health care for the uninsured. The portion of these costs attributable to uncompensated costs of trauma care is unknown.
3 Injury severity scores are translated from ICD-9 diagnosis codes using the program developed by Mackenzie.

G-9
ER Overcrowding and Trauma Care
In addition to providing specialized trauma services, many trauma centers are also a critical part of their community's health care safety net. With the enactment of the Emergency Medical Treatment and Active Labor Act (EMTALA) in 1986, they became the legally mandated "open door" for everyone in a community. Under EMTALA, all Medicare-participating hospitals with emergency departments must provide a medical screening exam, followed by stabilization and further care or transfer as needed, regardless of the patient’s ability to pay. EMTALA also requires hospitals to maintain a list of on-call physicians in a manner that best meets the needs of the hospital’s patients in accordance with the resources available to the hospital. This obligation does not mandate the provision of broader emergency department services, yet most hospitals offer a wide range of specialty coverage to attract insured patients and to meet local expectations.
Several studies have shown that the uninsured without a regular source of primary care
are disproportionate users of hospital ERs.bb, cc, dd The reliance on hospital emergency rooms for basic care, particularly by low-income uninsured populations, contributes to the ER overcrowding problem. ER overcrowding is the term used to describe a nationwide problem of overloaded emergency departments that can lead to ER closures, diverted ambulances and greater risks for all patients and providers.
Emergency room data have been collected from four major trauma centers --
Brackenridge in Austin (a Level II trauma center), Parkland in Dallas (a Level I center), and Ben Taub and Memorial Hermann in Houston (both Level I centers) -- to examine the frequency of primary care-related visits being made by the uninsured in Texas.4 The data indicate that the primary care-related visits (non-emergent, primary care treatable, or preventable)5 represented 52.0% of visits at Brackenridge, 42.4% at Parkland, 57.2% at Ben Taub, and 45.1% at Memorial Hermann. The magnitude of primary care-related visits at these hospitals is not unusual. What is extraordinary is that the patients making these visits are mostly uninsured or on Medicaid, reflecting the payment characteristics of the populations served by these hospitals. The percentage of patients making primary care-related visits at Brackenridge that were uninsured was 46.0%, 48.1% at Parkland, 43.9% at Ben Taub, and 22.9% at Memorial Hermann. The percentage with Medicaid coverage were 24.1% at Brackenridge, 18.0% at Parkland, 19.4% at Ben Taub, and 42.0% at Memorial Hermann. Those making primary care-related visits to these hospitals that were commercially insured ranged from 3.4% at Ben Taub to 31.4% at Parkland.
Data on the relationship between ER overcrowding and hospital diversion is available
only for Houston hospitals. Figure 1 shows the pattern of hospital diversion and caution in total hours per month for the two Level I centers in Houston from January 2003 through June 2005.ee Diversion hours indicate when the hospitals were unable to provide appropriate care to all trauma patients. Caution hours, which Houston hospitals began reporting in April 2003, indicate when the hospitals were only open for some trauma patients. During 2003, the two Level Is serving the greater Houston area experienced high levels of diversion totaling 4,366 hours (50.2% of the available total open time). This number was reduced to 2,857 hours in 2004 with additional reductions in 2003. Even with the diversion hour reductions, for 23 of the 30 months,
4 These data were supplied by Sandy Coe Simmons, Indigent Care Collaborative of Travis, Hays, and Williamson Counties; Dan Culica, UTSPH Dallas; Charles Begley UTSPH Houston. 5 These categories come from the New York University ED Algorithm, which was applied to the data allowing comparisons of rates of primary care-related and non-primary care-related ER visits. See reference 30 for more details.

G-10
the hospitals were on diversion or caution more than 400 hours a month or 27% of the time. For 10 of the months, they were on diversion or caution more than 800 hours or 55% of the time.
The hospitals also report the reasons for diversion (medical saturation, trauma
saturation, ER saturation) and caution (CT scan down, equip down, no burn beds, no medical/surgical beds, no neurology beds, no psychiatry beds, no pediatric beds, no telemedicine beds). ER saturation was reported as the reason for 46.1% of all diversion hours for these two hospitals over the 2003 - 2005 period.
Studies have examined the effectiveness of diversion in reducing the volume of patients treated at overloaded hospitalsff,gg and the impact of diversion on pre-hospital transit time of diverted patients.hh, ii A study completed in Houston found a possible effect of EMS diversion on mortality.jj A comparison was made of death rates of trauma patients hospitalized on significant diversion days, defined as days when both Level I hospitals were on diversion for more than eight hours, and non-significant diversion days when one or both hospitals were on diversion for less than eight hours or not on diversion at all. The study found that the percentage of deaths among all trauma patients, both those transferred and those not transferred, admitted on significant diversion days was consistently higher than on non-significant diversion days. For the most severe trauma patients who were transferred from another hospital the higher mortality rate approached statistical significance (p<= .11).
Figure1. Diversion & Caution of Level I (Ben Taub & Memorial Hermann), Yr '03 - June '05
0
200
400
600
800
1000
1200
Month & Year
Dur
atio
n H
ours
Diversion(plus 2 H) Caution

G-11
Additional research is needed to confirm these relationships, but the combined findings from the mortality study, the diversion data, and the ER use data suggest that: 1) delays in treatment of trauma patients caused by hospital diversion may increase mortality, 2) diversion is frequently caused by saturation of the ER and, 3) primary care-related ER use of trauma centers contributes to ER saturation. These findings provide support for addressing the ER overcrowding problem through efforts to streamline ER procedures, triage patients to urgent care, creation of after-hours hot lines, assignment of case managers, or some other strategy that has the potential to reduce ER saturation and diversion. Hospitals should not be complacent about the possible harm that may be caused if they divert. The Driver Responsibility Program
If fully funded and allocated, HB 3588 has the potential to cover a significant portion of Texas’ EMS and trauma care systems’ uncompensated care. However, many questions have arisen over the potential long-term viability and sustainability of the Driver Responsibility Program and whether the objective of alleviating the uncompensated trauma care cost burden of the hospitals will be fully achieved. Due to implementation delays, disbursements from HB 3588 by the Department of State Health Services was only a little over $18 million in 2004 and reached $46 million in 2005. At the end of the 79th Regular Legislative Session the Texas Legislature placed a cap on the account in which funding from the Driver Responsibility Program accrues. This account was capped at $31.5 million for both state fiscal years 2006 and 2007 though it was projected to accrue $59 million in 2006 and $80 million in 2007. This is problematic for several reasons. First, and most obviously, this cap artificially lowers the amount in which hospitals, EMS programs and Regional Advisory Councils will receive from the fund assuming that it does grow to projected revenue amounts. Second, this cap is an indication that within the Texas Legislature support for this program has begun to erode. The author of the Driver Responsibility Program, State Representative Delisi, continues to be the champion of this program by working to make improvements to and protect the program. Governor Perry has also shown support for the program by recently issuing an Executive Order directing the Legislative Budget Board to lift the cap that was placed during the 79th Regular Legislative Session. However, the Legislative Budget Board is made up of both House and Senate members whose action is required to execute the Governor’s order and it remains uncertain at this time whether this will happen.
The Texas Department of Public Safety (TDPS) is the primary agency responsible for
enforcement of the Driver Responsibility Program, as well as for collection of surcharges resulting from traffic violations. According to a Texas State Auditor’s Report,kk the TDPS has not fully implemented the Driver Responsibility Program, nor have they effectively overseen the collection of surcharges by a vendor contracted to do so in 2003. The report states that at the end of February 2005 greater than $25 million had yet to be billed for or collected. It is uncertain at this time whether the TDPS will make necessary improvements to collections that are essential to the viability of the program.
On the other hand, the program has continued support from stakeholder groups,
including the Texas Hospital Association, the Governor’s EMS and Trauma Advisory Council, Trauma Regional Advisory Councils, the Houston-Galveston Area Council, and the TDSHS. TDSHS is responsible for implementing any rules changes and disbursement of the funding that becomes available as a result of the collection of surcharges. Initially upon passage of HB 3588 there was an outpouring of enthusiasm and optimism over the potential positive impact of the Driver Responsibility Program on the state’s uncompensated trauma care costs. Though the program was slow to meet projections, optimism continued through the 79th Legislature as

G-12
Representative Delisi was successful in passing HB 2470 that made needed improvements and changes to the Driver Responsibility Program. However, in light of problems at the Department of Public Safety related to collections and delayed implementation, and apparent eroding support in the Texas Legislature, the future of the program is less certain than ever.
State and Local EMS/Trauma Councils
Despite chronic funding issues, concerted efforts have continued to not only build and strengthen the emergency and trauma system in Texas but to make strategic improvements as well. GETAC remains a respected forum for policy-making and planning. With committees that focus on medical direction, pediatric care, trauma system development, EMS, injury prevention, education and air medical issues, GETAC’s quarterly meetings draw hundreds of trauma center representatives and leadership of EMS agencies from across the state to continue its charge of providing input and leadership on emergency and trauma care issues.
Several of the major trauma regions in Texas have pursued initiatives of their own designed to make improvements in their systems’ response and function. In early July 2005, the Austin-Travis County area announced that hospitals had reached an agreement to not divert ambulances to other hospitals when faced with routine or on-going capacity challenges.ll As a means to alleviate pressure in their own facilities, hospitals across the country employ a practice whereby they notify local EMS agencies when they have reached capacity and request that incoming ambulances be directed, or diverted, to other hospitals. Generally, this leads to a domino-effect in the emergency health care system where capacity issues in one hospital quickly leads to over-utilization of emergency rooms in neighboring hospitals and resulting in delays in medical treatment provided to critically ill or injured patients as they are driven to hospitals that are in less favorable proximity. Austin area hospitals recognized the use of diversion was not in the best interest of the patient and have agreed to no longer refuse ambulance delivery unless their facility is dealing with a particular and short-term disaster, such as flooding or loss of heating or air conditioning. In recognition of the challenges rural and suburban hospitals have in seeking to transfer their patients who need a higher level of care than they can provide, the North Central Texas Trauma RAC in the Dallas-Fort Worth area has established a formal hospital transfer process. Hospitals needing to arrange a patient transfer contact a toll-free number for the Trauma Transfer Hotline. Dispatch workers contact contracted hospitals, on a rotating basis, which can provide a higher level of care to inquire whether they have the capability or capacity to accept this patient transfer. Hospitals have a contracted 15-minute window to accept the transfer before the dispatch center contacts the next hospital on the list. This system has been an effective process for hospitals in the outlying areas to arrange patient transfers in a seamless and time-sensitive manner.mm
The Southwest Texas RAC in the San Antonio area has implemented a unified identification badge for EMS personnel, nurses and physicians throughout the region to not only improve security but decrease frustration related to facility access. The ID badge is also a security keycard to gain entrance to hospital emergency departments, freeing EMTs and paramedics from having to remember separate security codes for each hospital they deliver patients to and allowing physicians quick parking access to the different hospitals they staff. Another initiative in the San Antonio area is the development of the Regional Medical Operations Center. Initially a response to 9/11 events, the vision for this center was expanded to focus on disaster preparedness and crisis response, whether natural or man-made. It serves

G-13
as a combined dispatch and transfer center during times of identified crisis that integrates public health, acute care and EMS. Once activated by either the public health officer, the emergency management coordinator or a hospital CEO, the center identifies hospital bed availability in the region, assesses stockpile of critical medications, arranges patient reception if necessary and coordinates identified medical personnel needs. The center activated for the first time in the fall of 2005 in preparation for welcoming Hurricane Katrina evacuees to the San Antonio area and stayed in operation to do the same for Hurricane Rita evacuees from southeast Texas.nn
With a growing diversion rate, Houston area physicians, hospitals and the business community began to work together to find solutions for the growing trauma and emergency services crisis in the Texas Gulf Coast region. They created Save Our ERs in late 2001 with the goals to educate the public and implement regional solutions to help ensure that the Gulf Coast's trauma system could meet the area's growing needs. Local task forces were begun to explore these issues and four major studies were commissioned to measure the exact impact of the lack of resources on this community.oo
In response to the growing crisis, the Houston-Galveston Area Council created the Emergency/Trauma Care Policy Council in 2003. The Policy Council was designed to examine policy options and possible strategic initiatives to improve the functioning of the region’s emergency and trauma care system. Its data committee has begun to measure hospital diversion in the eight-county region through EMSystem data provided by the Southeast Texas Trauma RAC. The Committee has worked with the TDSHS for access to the region’s trauma registry data to measure EMS response time and hospital trauma admissions. The Policy Council’s long range planning committee selected a nationally respected EMS and trauma care consulting firm to analyze pre-hospital and hospital resources and needs in the region. The study, due to be released in late fall of 2005, is expected to provide the region with a roadmap for system improvements.pp Reorganization
With the passage of House Bill 2292 in 2003, the entire infrastructure of health and human services programs in Texas was reorganized with 12 separate agencies consolidated into four distinct departments under the Health and Human Services Commission. This reorganization was designed to bring cost savings to the State and allow more local programmatic control of health and human services programs. The Bureau of Emergency Management within the TDH, with oversight of EMS credentialing and trauma center designation among other responsibilities, was converted to the Office of EMS/Trauma Coordination. With that redesign, many EMS and trauma care stakeholders have expressed concern whether the State can fulfill its critical oversight mission. Data and Information Systems There is very little information about the performance of trauma systems throughout the state. The TDSHS requires the collection of trauma registry data from EMS providers and trauma centers but until recently the data were poorly managed, there was poor compliance, and there has never been any sort of analysis or public report using the data. Inclusion criteria for reported cases has not been standardized nor have criteria been developed for excluding outliers. The State is actively taking steps to validate historical data and to improve data management of future data. It is anticipated that the validation work will be done in late 2005 and that access to the historical databases will follow in 2006.

G-14
Mental Health Access Challenges Care for mental health patients is a burgeoning problem across the state and the safety net for these patients is the emergency department. In the Houston area, approximately 11% of all ED visits are for mental health reasons. Most EDs do not have mental health clinicians on staff to treat these patients and thus must transfer the patients to other sites, which is difficult. Response to Disasters
Hurricanes Katrina and Rita highlighted the need for enhanced integration of emergency services at the regional and state level While some regions met the challenges of these crises ably, there is an underlying need to see greater responsiveness and integration with local disaster planners, emergency medical services, tertiary and trauma care hospitals, RACs, and Texas Department of Transportation and other state agencies. The needs of evacuating citizens as demonstrated by Hurricane Rita required collaborative work across state agencies, municipalities, counties and emergency health care providers of all levels. Likewise, the health care needs of the Hurricane Katrina evacuees mobilized unprecedented collaboration on the regional level, yet issues still remain unresolved, like the repatriation of patients dispersed throughout the state.
V. Conclusions and Recommendations
Texas has done significant work to develop its emergency and trauma system. Adequate funding continues to be one of the most important concerns and regional leadership is needed to further develop coordinated systems of care and to distribute the responsibility for emergency and trauma care more widely among providers. With the Driver Responsibility Program, Texas has one of the richest authorized funding sources for trauma centers in the entire country. Efforts need to be made to ensure that all of the dollars predicted are realized. Even with full implementation, this source will only meet a portion of the need. Other funding mechanisms will need to be developed to pay for regionalized systems of care. Long-term legislative funding should be pursued through special taxing authorities or some other appropriate funding structure, such as restoring the medically indigent spend-down program in Medicaid. At the present time there are no strings attached to the dollars being distributed to EMS providers and trauma hospitals but a goal for the future should be to link payments to EMS and trauma center commitment to better coordination and development of organized systems of care.
The TDSHS should continue to focus on completing the assessment of trauma registry
data and making it available. The State should work with providers to substantially improve consistency of EMS and hospital reporting. The State should also develop a complete inventory of emergency resources and begin to use these and other datasets to study the current emergency healthcare delivery system in terms of performance.
Since the mission of trauma centers is adversely affected by overcrowding of their ERs
by the uninsured seeking primary care, the centers should develop assistance programs for safety net primary care clinics. This may include assessing, identifying or funding care-givers including nurse practitioners, physicians, residents and nurses. They should provide assistance in the identification of needed equipment and furniture for the clinics and when possible prioritize these sites for charity care. They should also provide technical assistance to improve administrative and back-office capability of the clinics. Finally, they should help access

G-15
specialty care referrals for primary care patients needing specialists in a timely manner. Other more comprehensive reforms are needed to address the uninsurance problem but trauma centers have a direct interest in taking steps to minimize the effects of the current system.
More work is needed to study the problems of patients with mental health needs and
determine an appropriate response with more precise resources. Best practice models need to be developed for treating these patients in the ED and making transfers to appropriate settings for follow-up care.
An evaluation of the appropriateness of the new organizational structure of TDSHS and
whether it is meeting the needs of the public and private stakeholders in emergency and trauma care should be conducted to ensure the State’s oversight is adequate and appropriate. The level of responsiveness and responsibility should be benchmarked with other states and best practices should be identified to ensure that needed day-to-day infrastructure exists as well as the ability to ramp up activities to meet crises like bioterrorism threats and natural disasters
A review of lessons learned from hurricanes Katrina and Rita should be performed and a
model of active cooperation and collaboration developed. The role of multiple agencies of the State need to be examined in light of the need for improved coordination and response. The State’s different regions for disaster areas, pubic health and TSAs may be creating an unnecessary barrier for communication and response. After the storms, disaster coordinators were obligated to work with multiple public health regions and trauma regional advisory councils were required to work with several disaster coordinators. Standardization of regional subdivisions should be explored to improve efficiencies in planning, communication and responsiveness.
It is clear from our review that much remains to be done for Texas to become a leader in
regionalized emergency and trauma care systems. Some of the challenges are symptomatic of much larger issues – the growing un-insurance problem, bioterrorism, natural disasters – but efforts must continue to be made to shore up the system through funding mechanisms, oversight and infrastructure development.
References
a Jones L, Johnson K, Hellsten J, Mathabela B. Overview of injury in Texas and the role of the EMS/Trauma Registry, November 2004, Texas Department of State Health Services, Austin. b Nathens AB, Fabrice PB, Maier RV. 2004. Development of trauma systems and effect on outcomes after injury. The Lancet, Vol. 363, 1794-1801. c http://www.techproservices.net/history.php. d Mullins, RJ. A historical perspective of trauma system development in the United States. Journal of Trauma. 1999;47 (3 suppl):S8-14. e King, B,, Jatoi, I. The mobile army surgical hospital (MASH): a military and surgical legacy. Journal of the National Medical Association. 2005; 97:648-656.

G-16
f http://www.techproservices.net/history.php. g Texas EMS History, http://www.tdh.state.tx.us/hcqu/ems/emshx.htm. h Mullins. i Mullins. j Mullins. k American Trauma Society, National Highway Traffic Safety Administration, U.S. Department of Transportation. Trauma system agenda for the future. http://www.nhtsa.dot.gov/people/injury/ems/TRAUMA_SYSTEM/. l Mullins. m Kamoi, Brian. EMTALA: Dedicating an Emergency Department Near You. Journal of Health Law, Winter 2004;37#1,41-60. n Fields, WW, BR Asplin, GL Larkin et al. The Emergency Medical Treatment and Labor Act as a Federal Health Care Safety Net Program. Academic Emerg Med 2001;8#11:1064-1069. o (http://www.cms.hhs.gov/providers/section1011/ p Texas Department of Health – Bureau of Emergency Management. Texas Trauma Systems History. http://www.tdh.state.tx.us/hcqs/ems/Etrahist.htm. q Ibid. r Ibid. s Governor’s EMS and Trauma Advisory Council. A strategic plan for the Texas EMS/Trauma system. http://www.tdh.state.tx.us/hcqs/ems/STRACPlan.pdf. t http://www.dispatchmonthly.com/911/history/911history.html. u The Odessa American. New Emergency Number Scheduled for Odessa, March 30, 1970, page 1-B. v http://www.galco911.org/faq.htm w http://www.tdh.state.tx.us/hcqs/ems/Etrahosp.htm. x Texas Health Care Information Council, Hospital Discharge Survey, TDSHS, Austin.

G-17
yhttp://www.tdh.state.tx.us/hcqs/ems/August262005DSHSUncompensatedTraumaCareDistrHospitals.xls. z http://www.saveourers.org/BishopsReport.pdf. aa Families USA. Paying a Premium: The Added Cost of Care for the Uninsured. Washington DC, June 2005 bb Jones DS, McNagny SE, Williams MV, et al. Lack of a regular source of care among children using a public hospital emergency department. Pediatric Emergency Care 1999;15:13-16. cc O’Brien GM, Stein MD, Zierler S, et al. Use of the ED as a regular source of care: associated factors beyond lack of health insurance. Annals of Emergency Medicine 1997;30:386-291. dd Grumback K, Keane D, Bindman A. Primary care and public emergency department overcrowding. American Journal of Public Health 1993;83:372-378. ee Data provided by David Rives, Southeast Texas Regional Advisory Council. ff Schull MJ, Lazier K, Vermeulen M, Mawhinney S, Morrison LJ. Emergency department contributors to ambulance diversion: a quantitiative analysis. Ann Emerg Med. 2003;41:467-476. gg Lagoe RJ. Hunt RC. Nadle PA. Kohlbrenner JC. Utilization and impact of ambulance diversion at the community level. Prehosp Emerg Care. 2002; 6:191-198. hh Scheulen JJ, Li G, Kelen GD. Impact of ambulance diversion policies in urban, suburban, and rural areas of central Maryland. Acad Emerg Med. 2001; 8:36-40. ii Silka PA, Geiderman JM, Kim JY. Diversion of ALS ambulances: characteristics, causes, and effects in a large urban system. Prehosp Emerg Care. 2001; 5:23-28. jj Begley CE, Chang YC, Wood RC, Weltge A. Emergency department diversion and trauma mortality: evidence from Houston, Texas. J of Trauma 57(6):1260-1265. kk State Auditor’s Office, July 13, 2005 An Audit Report on the Department of Public Safety's Implementation of the Driver Responsibility Program ll Austin American-Statesman. Mary Ann Roser. Hospitals no longer refusing ambulances. July 5, 2005. mm Conversation with Jimmy Dunne, Executive Director of North Central Texas Regional Advisory Council, September 2005. nn Conversation with Eric Epley, Executive Director of Southwest Texas Regional Advisory Council, September 2005.

G-18
oo http://www.saveourers.org/reports.html. pp http://www.h-gac.com/HGAC/Programs/Emergency_Trauma_Care/default.htm.

Appendix H
Brief: Consulate Clinic
Denise Sanchez

H-1
Appendix H
Brief: Consulate Clinic
Denise Sanchez [email protected]
Findings Although there appears to be no legal prohibition stateside to creating a clinic within the boundaries of a Mexican consulate, there are nevertheless several obstacles and issues which would need to be addressed. Mexican Consulate policy states:
The Consulate never asks if an immigrant is legal or not. The Consulate only asks if they are legal. The party must prove that they are Mexican before services are offered. It is against International Law (Geneva Convention) for the Mexican Consulate to offer services to anyone NOT Mexican. The Consulate can provide an Identification Card to proven Mexicans …The Mexican Consulate can not provide services of healthcare for the growing Mexican population in Colorado (503,518). Healthcare issues are handled by local agencies/governments .
If a consulate clinic could be established, services would be limited to Mexican citizens. In essence, healthcare for Mexican nationals would remain on Mexican soil. This would also open the door for requesting greater responsibility on the part of the Mexican government in regard to healthcare cost. This may help to explain the last clause cited: “The Mexican consulate cannot provide services of healthcare for the growing Mexican population.” Since there appears to be no legal restriction for providing health services it may be the case that the resources may simply not be available. Another issue to consider is the likely political response this may encourage. Joe Guzzardi, in an article entitled Veterans Lose, Illegals Win - Illegal Aliens: The Health Cost Dimension, states:
On January 17th, Secretary of Veteran Affairs Anthony J. Principi stated that VA health care enrollment for Category 8 veterans would be suspended for one year. (A Category 8 veteran is one who does not have a service-connected disability and has an income in excess of $13,000.). ..There is something terribly wrong with this picture. The Mexican Consulate provides free legal advice on how their citizens who reside here illegally can receive U.S. taxpayer-paid benefits and defend their rights to receive them -- I would much rather pay the healthcare costs of a fellow Veteran than a foreign citizen living here illegally.
Such a viewpoint fails to take into account the economic contribution of Mexican workers. Many have also voiced concern over Mexican women giving birth on U.S. soil, entitling their children to citizenship and services. In a roundtable discussion organized by the Humanitarian Accountability Project and the World Health Organization it was noted that a “companion policy document” to the Declaration of Geneva called the WMA International Code of Medical Ethics “demarcates a duty to give emergency care to patients which is considered binding unless other medical professionals are both willing and able to provide that care.” It is not unlikely that documented and undocumented Mexican nationals may be refused emergency medical care if a consulate clinic in the area begins to provide those services. Although the opening of

H-2
consulate clinics, if established, may successfully provide needed healthcare to Mexican nationals, a more viable option may be to open clinics in conjunction with Mexican and/or Latin American medical schools. Partnerships with Mexican medical schools at or near the border may prove to be the most convenient and beneficial means to improve and provide healthcare to those in need. Insufficiency The Teague Grant Authorization Act, introduced into the House as H.R. 2126 found the following:
(1) A severe shortage in the number of physicians and other health care professionals in the United States is predicted for the next two decades, as a result of a substantial growth in demand for medical services compared with the number of medical school graduates, foreign doctors in the United States, and other health care professionals available to meet that demand. The availability and cost of healthcare is an issue that concerns all persons living in the U.S., regardless of citizenship and origin. At the same time, there is a “continuing restrictive trend” in regards to issuance of National Interest Waivers (NIW) which enable foreign doctors to practice medicine in the U.S.. In “a precedent decision called” Matter of New York State Dept. of Transportation, Interim Decision No. 3363 (Acting Assoc. Comm’r, Programs, Aug. 7, 1998)(NYSDOT) eligibility requirements were set forth as follows:
(1) the person must be working in an area of “substantial intrinsic merit” (2) the proposed benefit must be “national in scope” and (3) “the petitioner seeking the waiver must persuasively demonstrate that he/she will serve the national interest to a substantial better degree than would an available U.S. worker having the same minimum qualifications.
The above three requirements are seen as sufficient justification for allowing foreign physicians to practice medicine in the U.S.. The provisions under law are insufficient to meet the growing need for affordable health care. Although the above requirements, cited from True Walsh and Milller, LLP, apply to doctors working in specific medical fields, including research, the requirements highlighted may serve to formulate effective arguments for foreign physicians wishing to work in clinics that meet the needs of the medically underserved. It is for this reason that the U.S. Mexico border may prove to be the ideal starting point. Conditions
The first requirement in the “three part test for” NIW eligibility states that the “person must be working in an area of ‘substantial intrinsic merit.’ ” A report by The United States – Mexico Border Health Commission found the following:
* Three of the 10 poorest counties in the United States are located in the border area * Twenty-one of the counties on the border have been designated as economically distressed areas * Approximately 432,000 people live in 1,200 colonias in Texas and New Mexico, which are unincorporated, semi-rural communities that are characterized by substandard housing and unsafe public drinking water or wastewater systems * The unemployment rate along the U.S. side of the Texas-Mexico border is 250-300% higher than in the rest of the country; and * Due to rapid industrialization, the communities on the Mexican side of the border have less access to basic water and sanitation services than the rest of the nation

H-3
In addition, the roundtable discussion on Medical Ethics and Humanitarian Work observed:
The mission to help those less fortunate is fundamental to the medical enterprise. Humanitarian interventions, however, typically occur in situations where the normal power dynamic between the care provider and patients is exaggerated.
Although, the above statement was made in reference to third-world countries where there exists instability and/or extreme poverty, the latter condition applies to no other region in or around the U.S. as it does to the U.S.-Mexico border region. Not only does the border region have the highest unemployment rate in the nation, but it is also the most uninsured region, with El Paso leading the way. Furthermore, in general, “the Mexican origin” population is overrepresented in low-wage jobs that neither offer insurance benefits or pay enough for the individual to afford insurance. In fact, overall, “Hispanic workers are less likely to get health benefits on the job, even if they are doing the same work as black or white employees.” Undocumented workers are even more susceptible to exploitation since avenues for legal redress are practically non-existent. To make matters worse, areas on the border are projected to lose funding for healthcare services. Economic hardship, low wages, lack of transportation, large areas with inadequate housing and basic services, a shortage of physicians, a lack of adequate health-services and funding are all disproportionately evident in the border region. The conditions for many more on the Mexican side of the border are certainly comparable to that of a third-world country. The article, Texas Borderlands: Ground Zero of Health Issues states:
Border residents cope with health issues that other Texans do not face. Sharing an international boundary ensures that disease, and other chronic illnesses will travel freely across this frontier, creating crises due to lack of physical infrastructure, inadequate access to resources and a poor health care infrastructure.
Infectious diseases that are unique to the Border cause serious health risks to residents. Multiple factors, including inadequate water and wastewater infrastructure, migration from Mexico, the movement of disease vectors across the Border… and inadequate disease surveillance contribute to higher rates of some infectious and chronic disease … infectious diseases are not bound by borders … Border residents deal with outbreaks of mosquito-borne dengue fever and west nile virus, tuberculosis, hepatitis A and C, among others.
Cost and Integration Not only are inadequate healthcare conditions evident to a substantially greater degree than in the rest of the country, but sharing a highly permeable international border with “inadequate disease surveillance” also raises issues of security. The primary goals of the US - Mexico Border Health Commission (USMBHC) “are to institutionalize a domestic focus on border health, which can transcend changes and create an effective venue for bi-national discussions to address public health issues and problems which affect the US-Mexico border populations.” The trend towards integration and the need to provide healthcare to Mexican nationals and others along the border is evident. The availability of healthcare in Mexico is limited to individuals who actually hold jobs in Mexico. Persons who work in the U.S. are not eligible for healthcare services in Mexico through Seguro Social (Social Security). Furthermore there are few provisions for general welfare. Although a national boundary exists between Mexico and the United States, the USMBHC asserts:

H-4
The US-Mexico border region should be viewed as one epidemiological unit, despite the fact that it lies in two countries. The fourteen pairs of ‘sister cities’ that straddle the border reflect similar epidemiological issues whether the people live on the US-side or the Mexican side of the border…
A press release by the U.S. Consulate General in Ciudad Juarez announced that “HHS has recently invested $5.5 million through the commission to improve laboratory capacity, surveillance, and training on the Mexican side of the border.” The trend towards integration follows from economic ties. The USMBHC observes:
Mexico is the United States’ second-largest trading partner…Exports to Mexico more than quadrupled between 1986 and 1994, going from U.S. $12.3 billion to over U.S. $50 billion and then doubled again by 2000 …The United States-Mexico Border is recognized as one of the busiest in the world.
Not only do Mexican nationals work for less, but they are also major consumers of American goods on either side of the border. There appears to be at least some willingness to acknowledge the contribution made by Mexican workers. Jerry Seper from the Washington Times, in his article, Mexico lobbies for alien amnesty; Uses coalition to seek benefits observed that “Mr. Bush proposed a guest-worker program that could give legal status to millions of illegal aliens, mostly Mexican nationals, who hold jobs in the United States.” The proposition was cited as the product of a “…growing political alliance” that “…also seeks expanded education and healthcare benefits.” As economic ties continue to grow, it is reasonable to expect and hope for greater cooperation between the two countries. Despite the fact that the two countries are separate political entities, cooperation in regards to healthcare, including standards and information sharing, would be mutually beneficial. The department of Health and Human Services has invested millions through the USMBCH “to improve laboratory capacity, surveillance, and training on the Mexican side of the border.” Other efforts include “support for 30 health centers in the border area” that provide “preventive and primary care to patients regardless of their ability to pay.” In total:
The U.S. Department of Health and Human Services (HHS) through its Health Resources and Services Administration, spends more than 75 million each year to improve health care along the border. These resources provide residents with primary health care, maternal and child healthcare, HIV/AIDS care and support, and also underwrite programs to train and replace health professionals in the region.
Currently, the patient to physician ratio in El Paso is approximately 92 per 100,000 while the statewide average is 160 per 100,000. The expenses incurred by the state are substantial. However, as already stated they are insufficient:
…the State spends significantly less per-capita for Medicaid acute care services delivered on the Border than in other geographic regions of Texas…rates are based on historic utilization of healthcare services in a county. The Border has low utilization due primarily to the lack of health care providers and infrastructure.
The shortage of healthcare cannot be effectively addressed without also taking into consideration the need for physicians. The latter part of the statement which reads “…and also underwrite programs to train and replace health professionals in the region” seems particularly interesting since this is exactly what the proposed clinic would accomplish. Overall, setting up

H-5
clinic(s) affiliated with medical schools along the border seems not only to fit the current trends of integration but also the specific goals of government agencies presently addressing the issue. This strategy also avoids the political obstacles mentioned at the outset. A clinic set up in cooperation with Mexican medical schools would provide healthcare not only for Mexican nationals but also for U.S. residents and citizens who cannot afford healthcare. The educational benefits would also be twofold. Preventive care education for diseases prevalent along the border would benefit the public, while medical students, professors and medical professionals involved on both sides of the border would also benefit from the cultural exchange. Melissa T. Bell writes in her article, Immigrants’ Access to Quality Health Care:
As the immigrant population grows and the country becomes more racially and ethnically diverse, health issues that are more prevalent among immigrants will likely gain more attention. For instance, there may be more demand for research funds devoted to diseases that affect the immigrant population disproportionately. Consequently, there may be a greater emphasis on prevention and treatment of these diseases, which is intertwined with the problems of cultural competency and health literacy as well as access to health insurance .
A physician's ability to effectively treat a patient is to some extent contingent on his/her ability to communicate with the patient. The same article states:
Health literacy is low among poorly educated people and non-English speakers. Immigrants' health depends on their ability to process medical information, so health care professionals will need to find ways to communicate more effectively with these groups. Inability to speak English well can serve as a barrier to health care access … patients who do not speak English are less likely to see primary care physicians and use preventive care services and more likely to receive emergency room treatment … patients with chronic illnesses, such as asthma, are less likely to go to follow-up appointments and follow their medication regimen if there are language barriers between them and their doctors.
This factor addresses the third prong required for NIW eligibility. The roundtable discussion organized by the Human Accountability Project, under the heading Principles of Biomedical Ethics, acknowledges that “The current trend … is toward patient self-determination, with a partnership mode held as the ideal.” Informed consent is defined as follows:
Informed consent is understood as a demanding requirement, involving good communication with the patient, and patient explanation of unfamiliar terms and procedures; and a choice (where appropriate) among effective options that permit patients to make medical decisions in accord with their personal goals and values.
Furthermore, such a program may also foster more effective means of information sharing, such as a universal patient history form that would facilitate or may minimize the need for translation. Fluency in both English and Spanish would be encouraged as well as standardization of medical services on both sides of the border. There's also the probability that such a program will facilitate legislation which could make it easier for Mexican doctors to practice in the U.S. Thus, the shortage of physicians may be reduced and cooperation as a whole would be encouraged. In regard to national security and long term benefits, the article Texas Borderlands: Ground Zero of Health Issues makes the following observations of diseases particular to the border region:

H-6
… these diseases are very costly for Borderland hospitals to treat, and if left unaddressed, they will continue to travel North and impact other parts of the state.
The costly treatment of these unique diseases coupled with high rates of infection pose a double threat to the Border Region…In addition, these areas often serve as a hub for frequent travel, increasing the likelihood of outbreaks in crowded living situations … One person with untreated active TB will infect on average as many as 15 people per year … Early detection is a key preventative measure in minimizing TB incidence rates in the state … each case of TB costs $13,000 to treat … Economically speaking, the loss of productivity due to preventable disease incurs significant costs for the Region … with health costs rising every year, individuals who may already deal with unemployment or low wages must face the added burden of paying, for medical treatment they cannot afford.
Clearly there is a pressing need to address healthcare on the borders. Failure to do so would not only worsen the situation in this region but would also eventually have a negative impact in other areas of the country. Thus, health, security and economic issues overlap. Not only are poor healthcare services linked to falling productivity, but cutbacks in existing healthcare programs inevitably lead to greater healthcare burdens for both the populace and government. Conclusion
Education on health issues, patients’ participation in preventive care, and greater cultural awareness on the part of physicians are key. From understanding, effective strategies and supporting legislation would result. Melissa B. Taylor asserts, “the healthcare system must adapt” as the nation becomes more diverse. Among the policy changes encouraged, she lists the following: * encouraging of mandating access to medical translation and interpretation services; and * promoting foreign language skills and cultural competency in college health care curricula and professional education programs Also among the options listed is “creating incentives for employers to provide health insurance benefits." The first steps towards making health insurance available have already been taken . Included in this packet are also several articles and excerpts that may prove useful, including some contact information. As already stated, the border is unique in regard to healthcare needs. The overall trend is towards integration. This is the most realistic path. Not only do Mexican nationals receive healthcare in the U.S. but many native-born American citizens also seek more affordable healthcare in Mexico . It is only reasonable that better cooperation along the border, a realistic view of the issues, and mutual understanding should foster practical solutions .

Appendix I
Common Abbreviations

I-1
Appendix I
Common Abbreviations AACN American Association of Colleges of Nursing AHCCCS Arizona Health Care Cost Containment System BMI Body Mass Index CATCH Coordinated Approach to Child Health CEO Chief Executive Officer CHC Community Health Centers CHPA Community Health Purchasing Alliances CICP Colorado Indigent Care Program CIHCP County Indigent Health Care Program CMHMRCs Community Mental Health and Mental Retardation Centers CMS Centers for Medicare and Medicaid Services CMWF The Commonwealth Fund CSHP Coordinated School Health Program CT Computed Tomography DHP Dirigo Health Plan DSH Disproportional Share Hospital Program EBRI Employee Benefit Research Institute EHR Electronic Health Records EMS Emergency Medical Services EMTALA Emergency Medical Treatment and Labor Accountability ER Emergency Room ERISA Employee Retirement Act of 1974 FBR Federal Benefit Rate FDA Food and Drug Administration FFS Fee-for-Service FFY Federal Fiscal Year FPL Federal Poverty Line FQHC Federally Qualified Health Centers FY Fiscal Year GAMC General Assistance Medical Care GAO U.S General Accounting Office GETAC Governor’s EMS and Trauma Advisory Council GME Graduate Medical Education GR General Revenue GRTL General Revenue Tax Levy HCHD Harris County Hospital District HHS U.S. Department of Health and Human Services HIFA Health Insurance Flexibility and Accountability demonstration
initiative HIPAA Health Insurance Portability and Accountability Act HIPP Health Insurance Premium Payment Program

I-2
HMO Health Maintenance Organization HRQOL Health-Related Quality of Life HRSA Health Resources and Services Administration ICF/MR Intermediate Care Facilities/Mental Retarded IHCTA Indigent Health Care and Treatment Act IOM Institute of Medicine ISS Injury Severity Score LBB Legislative Budget Board LIU Low Income Utilization MCHA Minnesota Comprehensive Health Association MCOs Managed Care Organizations MGMA Medical Group Management Association MMA Medicare Prescription Drug, Improvement, and Modernization Act MOG Maine Office of the Governor MRI Magnetic Resonance Imaging PCCM Primary Care Case Management PCP Primary Care Provider PMPM Per Member Per Month PRWORA Personal Responsibility and Work Opportunity Reconciliation Act of
1996 RAC Regional Advisory Council RVU Relative Value Units SAT-9 Stanford Achievement Test Ninth Edition SBP School Breakfast Program SCHIP State Children’s Health Insurance Program SCI State Coverage Initiatives SFY State Fiscal Year SPARK Sports, Play, and Active Recreation for Kids SSA Social Security Act SSI Supplemental Security Income TAC Texas Administrative Code TANF Temporary Assistance for Needy Families TDI Texas Department of Insurance TDSHS Texas Department of State Health Services THHSC Texas Health Human Services Commission TMA Transitional Medicaid Assistance TRAG Texas Recommended Authorization Guidelines TSA Trauma Service Areas UPL Upper Payment Limit

Appendix J
Presenters

J-1
Appendix J
Presenters Date/Location: Presenters: Presentation Title: September 9, 2004 Rice University Houston, Texas
David Leebron President, Rice University
Welcome
Edward Djerejian
Founding Director, James A. Baker III Institute for Public Policy
Welcome
Wayne Riley
Vice President for Health Affairs and Governmental Relations, Baylor College of Medicine
Welcome
December 14-15, 2004 The University of Texas
System Austin, Texas
Dianne Longley Director of Special Projects, Texas Department of Insurance
The State Planning Grant Lessons Learned and New Opportunities
The Honorable David Dewhurst
Lt. Governor, State of Texas Health Care Challenges in Texas
Anne Dunkelberg
Assistant Director, Center for Public Policy Priorities
Public Programs to Improve Health Coverage
James Walton
Senior Vice President, Health Texas Provider Network
Increasing Access to Care The Dallas Experience
Travis Froehlich Vice President of Planning, Seton Healthcare Network
Increasing Access to Care The Austin Experience
Charles E. Begley Professor, Management and Policy
Sciences, U. T. Health Science Center-Houston, School of Public Health
Increasing Access to Care The Houston Experience
Ronald Cookston
Director, Gateway to Care, Harris County Community Access College Access Collaborative
Increasing Access to Care The Houston Experience

J-2
Eduardo Sanchez Commissioner State Health Services
Challenge of Uninsured in Texas
Camille Miller
President/CEO, Texas Institute for Health Policy Research
The Shared Vision Initiatives – Plans and Prospects
Jose Camacho
Executive Director, Texas Association of Community Health Centers, Inc.
The Role of Community Health Centers – Obstacles and Opportunities
April 12-13, 2005 University Health Center -
Downtown San Antonio San Antonio, Texas
Francisco Cigarroa President, U. T. Health Science Center- San Antonio
Welcome
Fernando Guerra
Director of Health at San Antonio Metropolitan Health District
Welcome
Roberto Jimenez
Chairman, Board of Managers at University Health System
Welcome
Chris Patterson
Director of Research, Texas Public Policy Foundation
The Role of Government in Health Care
Ray Perryman
President, The Perryman Group The Economic Impact of the Uninsured in Texas
Stephen Linder
Associate Professor, U. T. Health Science Center-Houston, School of Public Health
Education and Health – White Paper
Nancy Murray
Assistant Professor, U. T. Health Science Center-Houston, School of Public Health
Education and Health – White Paper
Michael Hudson and Manda Wong
The Health Policy Group Medicaid and SCHIP Funding in Washington
November 16-17, 2005 The University of Texas
Southwestern Medical School at Dallas
Dallas, Texas
Kern Wildenthal President, UT Southwestern Medical School
Welcome
Ron Anderson
President & CEO, Dallas County Hospital District, Parkland Memorial Hospital
Welcome
Margaret Keliher
Dallas County Judge Welcome

Appendix K
Provider Taxes: A Different Perspective
Richard Johnson, Jr. and Donna Kinney

K-1
Appendix K
Provider Taxes: A Different Perspective
Prepared by Richard Johnson, Jr. and Donna Kinney
December 2005
Some form of Medicaid expansion is a very attractive way to increase state funding for services to the uninsured because of the potential federal match contribution, which is currently above 60 percent. Consequently, every state dollar that is raised and used for Medicaid spending could draw down $1.54 to benefit Texas citizens. Raising the state matching funds, however, should be done carefully with a clear eye to the potential unintended consequences of any funding methodology.
Providers Who Benefit From the viewpoint of some inpatient providers with high charity care case loads, provider taxes may appear to be a relatively harmless method for raising the state funds. For them, potential returns in new Medicaid revenues would far exceed the increased cost caused by the tax, itself. For other providers, however, that is not the case, and a guaranteed return of the tax cost is not possible, due the prohibition in current Medicaid rules.
Providers Who Do Not Benefit Some providers may not benefit from a Medicaid expansion for several reasons. For those providers, a provider tax could become an additional cost. One reason that providers might not benefit from a Medicaid expansion is that their primary patient base is not part of the Medicaid expansion population. This would likely be the case, for example, for long-term-care facilities because most Medicaid expansion plans designed to cover the uninsured would not target the elderly. Similarly, pediatric providers would not benefit from Medicaid expansions targeted at adult family members. A second reason that providers might not benefit from a Medicaid expansion is that Medicaid fees are too low to cause a net revenue increase. In outpatient settings, uninsured patients generally pay for services that they receive and those payments are generally adequate to cover the cost of their services. Any Medicaid expansion is likely to “crowd out” some of this self-pay business, and possibly some commercially insured business, too, by replacing it with Medicaid coverage. For some providers, including physician practices and other outpatient or ambulatory care providers, Medicaid patients are a major source of uncompensated care cost, because Medicaid fees are inadequate to cover the actual cost of providing services. In the case of physicians, Texas Medicaid fees cover only half of the average cost of services, and limited information on ambulatory surgery fees indicate that the ASC fees may be even less adequate, paying as little as 19 percent of cost for some services and averaging less than 40 percent. Thus, a Medicaid expansion that converts some self-pay and commercially insured patients into Medicaid patients can actually increase uncompensated care cost for these providers because of inadequate reimbursement, even though it partially pays for services that

K-2
were previously categorized as charity care. In that regard the tax, itself, would add to total cost, while the Medicaid expansion could actually reduce revenues.
Who Bears the Cost? For providers who will not receive tax-offsetting reimbursement increases, the impact seems clear. It is a known consequence of business taxes that all tax increases, like all other cost increases, are ultimately borne by the users of the business’ services. In health care however, it is also clear that not all buyers of services will bear a share of the increased costs. Medicare does not prospectively factor state or local taxes into fees, or does so only indirectly and after a delay of several years as historical data are available. Furthermore, Medicare spending growth is limited by budgetary considerations, without regard to actual provider cost increases. Medicaid payment methodologies are often completely unresponsive to provider cost increases. So government payers will generally not bear the increased costs. Commercial payers are unlikely to increase fees to cover increased tax burdens, or will do so only for selected providers who have some form of negotiating leverage. If government and commercial payers do not carry a share of the tax burden, all of the increased cost will fall on uninsured, self-pay patients and others who are not protected by network pricing or negotiated discounts. Thus, a tax at 3 percent of gross receipts, which would yield a 3% increase in cost if borne equally by all payers, could become a 15 percent to 20 percent cost increase when borne only by the uninsured and self-pay patients in outpatient settings. Such a policy also could provide a financial disincentive for the uninsured and self-payers to seek needed care.
A Better Mousetrap The fact remains that federal match dollars are an attractive way to reduce losses to charity care for some health care providers. But generating state funds by taxing providers will add to total healthcare costs that fall disproportionately on sick and vulnerable patients who pay for their own care. At a very minimum, providers should be allowed offsetting deductions or credits, so that the government-paid portion of their revenues that is unresponsive to cost increases will not be subject to the tax. It would be far more equitable to identify a broad-based tax source for the necessary funds, thus spreading smaller shares across a broader population base. Any Medicaid expansion should be funded by all taxpayers, not borne disproportionately by health care and long-term care users who are taking financial responsibility for their own care. From a public policy standpoint a more widely distributed tax burden with appropriate credits/cost offsets makes sense in pursuing improved access to health care. That type of focus yields a more equitable and less constitutionally risky tax policy, generates needed revenues and provides important incentives for providers to deliver services to vulnerable populations and the uninsured.