Coconino County June 30, 2016 Comprehensive Annual ......Mandy Metzger Lena Fowler . District 4...
206
Comprehensive Annual Financial Report Fiscal Year Ended June 30, 2016
Transcript of Coconino County June 30, 2016 Comprehensive Annual ......Mandy Metzger Lena Fowler . District 4...

Comprehensive Annual Financial Report
Fiscal Year Ended June 30, 2016

Coconino County Comprehensive Annual Financial Report
Fiscal Year Ended June 30, 2016
COCONINO COUNTY BOARD OF SUPERVISORS
Art Babbott Elizabeth C. Archuleta Matthew G. Ryan District 1 District 2 District 3
Vice Chairperson
Mandy Metzger Lena Fowler District 4 District 5
Chairperson
Cynthia Seelhammer County Manager
Neal Young MikeTownsend Deputy County Manager Deputy County Manager
Finance Team
Bonny Lynn, MPA, Chief Financial Officer Thomas Johnson, CPA, Accounting Manager
Nancy Ho, MBA, Senior Accountant Chyenne Schmidt, CPA, Senior Accountant
Marsha Westling, Accountant
www.coconino.az.gov
COCONINO COUNTY MANAGEMENT
PageLetter of Transmittal 3Certificate of Achievement for Excellence in Financial Reporting 13Organization Chart 14Coconino County officials 15
Independent Auditors' Report 19
Management’s Discussion and Analysis (MD&A) 23
Basic Financial StatementsGovernment-Wide Statements
Statement of Net Position 41Statement of Activities 43
Fund Financial StatementsGovernmental Funds Financial Statements
Balance Sheet 44Reconciliation of the Balance Sheet of Governmental Funds
to the Statement of Net Position 47Statement of Revenues, Expenditures, and Changes in Fund Balances 48Reconciliation of the Statement of Revenues, Expenditures, and Changes in
Fund Balances of the Governmental Funds to the Statement of Activities 50
Proprietary Fund Financial StatementsStatement of Net Position 51Statement of Revenues, Expenses, and Changes in Fund Net Position 52Statement of Cash Flows 53
Fiduciary Funds Financial StatementsStatement of Fiduciary Net Position 54Statement of Changes in Fiduciary Net Position 55
Notes to Financial Statements 57
Required Supplementary InformationBudgetary Comparison Schedules - General Fund and Major Special Revenue Fund
General Fund 106Public Works/HURF Fund 108Jail District Fund 109Public Health Services District Fund 110
Introductory Section
Financial Section
Coconino CountyTable of Contents
Year Ended June 30, 2016
i

PageNotes to Budgetary Comparison Schedules 111
Schedule of the County’s Proportionate Share of the Net Pension Liability – 112Cost-Sharing Pension Plans
Schedule of Changes in the County’s Net Pension Liability and 113Related Ratios – Agent Pension Plans
Schedule of County Pension Contributions 115
Notes to Pension Plan Schedules 117
Schedule of Agent Retirement Plan’s and Coconino County Postemployment 118Healthcare Plan’s Funding Progress
Notes to Schedule of Agent Retirement Plan’s and Coconino County 119Postemployment Healthcare Plan’s Funding Progress
Combining and Individual Fund Statements and Schedules123Listing of Nonmajor Governmental Funds
Governmental Funds126Combining Balance Sheet – Nonmajor Governmental Funds
Combining Statement of Revenues, Expenditures, and Changes in Fund Balances – 134Nonmajor Governmental Funds
Schedules of Revenues, Expenditures, and Changes in Fund Balances – Budget and Actual
Special Revenue FundsAdult Probation Grants and Fees 142Assessor Storage and Retrieval 143Career Center Grants 144Clerk of the Superior Court Grants and Fees 145Community Services Grants and Fees 146Conciliation Court 147County Attorney Grants and Fees 148County Improvement Districts-Special Revenue 149County Library District 150Emergency Services Grants 151Flood Control District Fund 152Inmate Welfare 153Jail Enhancement 154Justice Courts Grants and Fees 155Juvenile Court Grants and Fees 156Legal Defender Grants and Fees 157
Financial Section (Continued)
Coconino CountyTable of Contents
Year Ended June 30, 2016
ii

PageSpecial Revenue Funds (Continued)
National Forest Fees 158Parks and Recreation Grants and Fees 159Public Defender Grants and Fees 160Recorder Storage and Retrieval 161School Superintendent Grants and Fees 162Sheriff Grants and Fees 163Solid Waste 164Superior Court Grants and Fees 165Taxpayer Information Fund 166Other Special Revenue Funds 167
Debt Service FundCounty Improvement Districts – Debt Service 168
Capital Project FundsParks and Open Spaces Tax Projects Fund 169Accommodation School 170County Improvement Districts - Capital Projects 171Other Capital Projects Funds 172
Investment Trust FundsCombining Statement of Fiduciary Net Position – Investment Trust Funds 173Combining Statement of Changes in Fiduciary Net Position –
Investment Trust Funds 174
Agency FundStatement of Changes in Assets and Liabilities – Agency Fund 175
Financial TrendsNet Position by Component 181Changes in Net Position 182Fund Balances - Governmental Funds 184Changes in Fund Balances – Governmental Funds 185
Revenue CapacityAssessed Value and Estimated Market Value of Taxable Property 186Direct and Overlapping Property Tax Rates 187Principal Property Tax Payers 188Property Tax Levies and Collections 189
Financial Section (Continued)
Statistical Section
Coconino CountyTable of Contents
Year Ended June 30, 2016
iii

PageDebt Capacity
Ratios of Outstanding Debt By Type 190Legal Debt Margin 191Pledged Revenue Coverage 192
Demographic and Economic InformationDemographic and Economic Statistics 193Principal Employers 195
Operating InformationFull-Time Equivalent Employees By Function 196Operating Indicators By Function/Program 198Capital Asset and Infrastructure Statistics By Function 200
Statistical Section (Continued)
Coconino CountyTable of Contents
Year Ended June 30, 2016
iv

INTRODUCTORY SECTION
1

THIS PAGE BLANK
2
December 22, 2016
The Honorable Board of Supervisors and Citizens of Coconino County, Arizona:
We are pleased to provide you the Comprehensive Annual Financial Report (CAFR)of Coconino County for the fiscal year ended June 30, 2016. The report providesadditional information to the Board and citizens on the County’s financial position and results of operations. Pursuant to Arizona Revised Statute (A.R.S.) 41-1279.21 theCoconino County CAFR was audited in accordance with generally accepted auditingstandards for the year ended June 30, 2016 and has been issued an unmodified(“clean”) opinion.
This report consists of management’s representations concerning the finances of Coconino County. Consequently management assumes full responsibility for theaccuracy of the information and completeness and reliability of all the informationpresented in this report. To provide a reasonable basis for making theserepresentations, management of the County has established a comprehensive internalcontrol framework that is designed both to protect the government’s assets from loss, theft, or misuse, and to compile sufficient reliable information for the preparation of theCounty’s financial statements in conformity with generally accepted accounting principles (GAAP). Because the cost of internal controls should not exceed anticipatedbenefits, the objective is to provide reasonable, rather than absolute, assurance thatthe financial statements are free of any material misstatements.
The Arizona Office of the Auditor General has audited the County’s financial statements. The goal of the independent audit was to provide reasonable assurancethat the financial statements of the County for the fiscal year ended June 30, 2016, arefree of material misstatement. The independent audit involved examining, on a testbasis, evidence supporting amounts and disclosures in the financial statements;assessing the accounting principles used and significant estimates made bymanagement; and evaluating the overall financial statement presentation. Theindependent auditor concluded that there was a reasonable basis for rendering anunmodified (“clean”) opinion that the County’s financial statements for the fiscal year ended June 30, 2016, are fairly presented in conformity with GAAP. The IndependentAuditor’s Report is located at the front of the financial section of this report.
The report is prepared in conformance with standards of financial reporting establishedby the Governmental Accounting Standards Board (GASB), and using the guidelinesestablished by the Government Finance Officers Association of the United States andCanada (GFOA). GAAP requires that management provide an analysis, narrativeintroduction, and overview to accompany the basic financial statements, called theManagement’s Discussion and Analysis (MD&A). This letter of transmittal is designedto complement the MD&A and should be read in conjunction with it. The MD&A
3
immediately follows the independent auditor’s report in the financial section of this report. The County’s CAFR is intended to fulfill the State of Arizona Transparency Law, Arizona Revised Statutes §41-725. This report consists of management’s representations concerning the finances of the County. Consequently, management assumes full responsibility for the completeness and reliability of the information contained in this report. As management, we assert that, to the best of our knowledge and belief, this financial report is complete and reliable in all material respects. Coconino County Profile Coconino County was established on February 19, 1891 by the 16th Territorial Assembly with an initial population count of 4,000. The County encompasses approximately 18,617 square miles – it is the largest county in Arizona and the second largest in the United States. Despite its size, Coconino County is one of the most sparsely populated counties in Arizona with a population of 7.3 per square mile (2010 Census). Only 12% of the County’s total square miles are private property. The remainder is a combination of state, federal and reservation land. The estimated 2016 population of Coconino County is 143,616. Flagstaff is the County seat and the largest city in the County. The County is home to the Grand Canyon, four other federal recreation areas and three state parks. The County is also home to reservation land belonging to the Navajo, Hopi, Havasupai, Hualapai and Paiute tribes. Coconino County’s government consists of an elected Board of Supervisors (Board). There are five districts, each represented by a Supervisor who resides in the district. The Board holds the policy-making and legislative authority for the County. It is responsible for the overall management and approval of all departmental budgets and tax rates. The Board appoints a County Manager who serves as the Chief Administrative Officer for the County. Departments are either headed by an appointed official, appointed by the Board, or an elected official. Elected offices are statutorily determined and include the Sheriff, County Attorney, Recorder, Treasurer, Assessor, Superintendent of Schools, Constable, Clerk of the Superior Court, and the Judiciary. Coconino County provides a full range of services including law enforcement and public safety, health services, sanitation, welfare programs, highway construction and maintenance, parks and recreation, and education. The financial reporting entity includes all the funds of the primary government. Component units are legally separate entities for which the County is considered to be financially accountable. Blended component units, although legally separate entities, are, in substance, part of the County’s operations. Additional information can be found in the notes to the financial statements (See Note 1.A.). The Board and the County Manager use a ten-year financial plan, along with fiscal management policies, budget management policies, and strategic goals and priorities
4

to guide the overall development and management of the budget. Annually, departments are required to provide revenue and expenditure estimates for the current fiscal year and planned operations for the following year. These estimates are used to update the ten-year financial plan. Departments submit their budgets which are evaluated using criteria and strategies adopted by the Board and budget recommendations are based on these evaluations. Final budget decisions are also subject to the availability of funds within the context of the ten-year financial plans; conformance with fiscal and budget management policies; and meeting the County’s strategic goals and priorities. The final budget must be adopted by the Board on or before the third Monday in July. The tax rate and levy must be set on or before the third Monday in August each year. The level of budgetary control is at the department level within a fund. Transfers between these levels must be approved by the Board. Additionally, actual expenditures may legally not exceed the final budget. Assessing Coconino County’s Economic Condition The information presented in the financial statements is best understood when it is considered from the broader perspective of the specific environment within which the County operates. Economic Outlook.
Arizona’s economy contains some positive trends. As reported by the Economic and Business Research Center of the University of Arizona’s Eller College of Management in June 2016, the State of Arizona’s economy is on an accelerated growth track from the prior year. The State continues to add jobs and residents at a faster pace than the nation, and is expected to continue to do so in the next three years. Employment increased 2.6% in CY 2015 for the state outpacing last year’s 2.0% rate, with population growth rising modestly from 1.3% to 1.4%. Single family housing permits in the Greater Phoenix area were up over 44% in January 2016 compared to a year prior. Total activity at Sky Harbor Airport was up 4.5% in 2015. The local and State economy are very dependent on visitors to the State, which adds to our largest source of revenue, the sales tax.
Coconino County’s local economy lags the State and includes a poverty level of 23% of total population compared to the State at 18%. For population under age 18, the level rises to 28% in the County compared to 26% for the State. The higher rates of poverty in the County create an opportunity to focus public health, education, public safety, and community services toward the needs of this population. Both the government and private sectors are experiencing slow growth, however the government sector is not growing at the rate of the private sector. This will challenge local governments in planning for adequate compensation levels to compete for experienced staff and to plan for implementing deferred capital needs in the areas of technology and facilities capital repair and replacement. In addition, retirement contributions have continued to grow at an accelerated rate prior to, and after the
5

recent recession. The changes implemented over many years to the Arizona State Retirement System resulted in slowing the growth of contribution requirements and in the next few years rates may begin to decline. The area of concern that has had the largest growth of unfunded liabilities and contribution requirements is the Public Safety Personnel Retirement System (PSPRS). Impact of State Economic Condition. Although the County’s sound long-term financial planning considered and included a recessionary growth model based on prior recessions, the depth and breadth of the most recent economic downturn to both the State and local economies continues to impact County revenues. The County anticipates potential reduced and reallocated State and Federal Highways and Streets revenues, shifts in mandated State costs to counties, and further cuts to County funding for Public Safety, Courts, Health and Social Services programs. This causes continued uncertainty for Counties across the state and into the foreseeable future. The County will continue to work with the Governor, State Legislators, County Supervisors Association and the Arizona Association of Counties to find solutions to state cost shifts to counties. In addition to these efforts, the County is actively pursuing solutions to decrease reliance on state controlled revenues and to increase locally controlled sources. Additional details are included in Management’s Discussion and Analysis (MD&A) under “Economic Factors and Next Year’s Budget” which can be found in the Financial section of the CAFR. Local economy. The economy of Coconino County is based primarily on public administration, the service industry, wholesale and retail trade, and tourism. The City of Flagstaff (the County seat) is the center of educational, governmental and scientific employment. The list of major employers include; Northern Arizona University, Flagstaff Medical Center, W.L. Gore and Associates, Flagstaff Unified School District, Coconino County, City of Flagstaff, Twin Arrows Navajo Casino and Resort, Walmart, Grand Canyon Railway, SCA Tissue, Coconino Community College, the U.S. Forest Service, the U.S. National Park Service, the Navajo Nation, and Nestle-Purina. Tourism significantly impacts the local economy. Old Route 66 runs across most of the County as well as US Interstate 40. Attractions include National Parks, National Monuments and State Parks, some of which are: the Grand Canyon, Sedona/Oak Creek Canyon, Glen Canyon National Recreation Area, Wupatki National Monument, Sunset Crater National Monument, Walnut Canyon National Monument, and Slide Rock State Park. Over 9.5 million people visited these attractions in FY16. Strategic Budget Process and Financial Planning. The County has had a comprehensive long-term financial planning process in place since fiscal year (FY) 2007. In FY16 the County continued to expand on the Strategic Budget Process begun in FY10. The goal of the process is to provide consistent delivery of essential services to its residents in times of economic growth or recession, and to identify opportunities for cost containment through prevention efforts. Keys to this process are; 1) a ten-year financial plan, 2) aligning high probability revenue types with mission critical expenditures, 3) balancing recurring expenditures with recurring revenue, 4) building prudent reserves, 5) planning the budget to include employee compensation, facilities
6

R & R, and IT, 6) continued development of the Strategic Budgeting Process, and 7) development of new revenue sources. The County, as a member of the Northern Arizona Public Employee Benefit Trust (NAPEBT), has successfully achieved lower than average growth in health insurance costs over the past several years. Through becoming a self-funded trust and implementing a wellness program, claims experience has stayed well below national averages. In addition, during FY16, NAPEBT opened an on-site-model health clinic, called the Vera Clinic. All employees and their dependents, covered by NAPEBT for health insurance, can utilize the Vera Clinic. The goal in operating the clinic is to attain sustainable, long-term health care cost containment. Budget Management Policy The Board uses the approved County fiscal policies and strategic priorities to guide
the County’s budget process. Decisions are evaluated within these contexts as well as the accompanying ten-year financial plan.
During the budget process, departments are asked to develop and evaluate a line
item budget for both revenues and expenditures and present program performance measures and outcomes. Funding for all County programs is submitted to the Budget Team and County Manager, for a recommendation to the Board for approval of funding. Requests for increases to program funding must demonstrate the estimated return on investment, efficiency, or be clearly tied to a specific strategic priority outcome indicator, as adopted by the Board.
All requested funding increases should be tied to the outcomes of the adopted
Strategic Priority Areas and will be evaluated for funding based on criteria adopted by the Board.
Coconino County’s fiscal policies promote long-term stability, provide perspective to the financial picture of the County in its entirety rather than single issues, link long-term financial planning to day-to-day operations, and provide a framework for the Board and the citizens for measuring the fiscal impact of government services against established fiscal parameters. The fiscal policies include: Operating Budget Policies. The operating budget is a plan for allocating resources. Capital Budget Policies. The capital budget provides resources for capital maintenance and future capital needs, without adversely affecting the operating budget. Revenue Policies. Funding for public programs should be derived from a fair, equitable and adequate resource base, while minimizing tax differential burdens.
7

Reserve Policies. Responsible reserve policies will provide adequate resources for cash flow and contingency purposes, while maintaining reasonable tax rates. The County maintains a contingency for cash liquidity and as an emergency contingency in the County General Fund equal to at least 10% of its annual revenue budget. The County also maintains a revenue smoothing reserve of 5% of its annual revenue budget. These funds should only be utilized to cover short-term drops in County revenues to maintain service levels in difficult economic times. Debt Policies. Responsible debt management policy maintains the County’s ability to incur present and future debt at minimal interest rates in amounts needed for infrastructure and economic development without endangering its ability to finance essential County services. Major Initiatives/Impacts Road Maintenance Sales Tax (RMST) (Proposition 403) Revenue reductions from HURF funds and lack of federal dollars for highway and road improvements left the Board with few options to address seriously deteriorating roads. County residents were involved in a Citizens Road Advisory Committee, which came out of their deliberations with a recommendation to the Board that a ballot measure was the best option. Coconino County led a successful educational campaign, over a six month period, leading up to the November 2014 election to ask the voters of the county to approve Prop 403, a 3/10th of a cent sales tax dedicated to maintenance of the county road system. The voters approved the ballot measure by a good margin. The 3/10th of a cent sales tax went into effect on January 1, 2015. The tax will be in effect for 20 years. Fiscal Year 2016 was the first year of full twelve month collections for the RMST. Total collections were $ 8.43 million. A partial list of road projects completed using RMST funds includes; Townsend-Winona Pavement Project, Flagstaff Meadows Unit I Pavement Repair Projects, Lake Mary Road Chip Seal, Williams and Parks Chip Seal projects, Fort Tuthill Loop and Purple Sage, Pine Del Estates and Westwood Estates. With the RMST revenue, Public Works was also able to replace aging heavy equipment and fill many of the 40 vacant positions held open during the past two years, which will staff the multitude of projects slated for completion over the next 20 years. Public Safety Personnel Retirement System (PSPRS) The state oversees many of the public pension systems, but the PSPRS is the responsibility of each separate jurisdiction. In the State of Arizona, the PSPRS is only 50 percent funded. That means there is an unfunded liability – a debt -- of $6.40 billion (yes with a “b”) in the State of Arizona. These pensions are a promise that was made to our law enforcement officers, so this is a debt that must be paid.
8

For Coconino County, as of June 1, 2016, our PSPRS account had assets of $10.00 million and liabilities of $40.20 million. This means an unfunded liability (debt) of $30.20 million. The June 1, 2016 funded status was 25 percent. Coconino County pays about $2.50 million to PSPRS every year to cover the costs of current law enforcement employee pensions. During FY16 the County had the ability, and statutory authority, to make a major payment toward PSPRS. In the month of June 2016, the County Board of Supervisors authorized making a $10.00 million payment toward the PSPRS unfunded pension liability. This pay down now will improve the County’s financial situation greatly in the future. That $10.00 million paid now saves between $22.00 and $25.00 million over the next 20 years. The savings is a result of a combination of factors; 1) the much higher return on investment at PSPRS compared to local returns on the $10 million, and 2) reduction by $ 0.50 million per year now paid by Coconino County on the debt, based on current amortization of the unfunded liability on a straight line basis over 20 years. The cash to make the $10.00 million payment came from Jail District fund balance. Through the good work of the Criminal Justice Coordinating Council (CJCC), and programs to reduce recidivism and manage jail populations, jail beds became available over the past decade and a half, to rent to other agencies. A total of $28.00 million in bed rental revenue was raised. The county retired remaining Jail District debt and was able to generate savings through greater efficiency and effectiveness throughout the CJCC system; including judges, police, the sheriff, probation and specialty court programs. After making the $10.00 million payment, the Jail District has a remaining fund balance of $12.57 million at June 30, 2016. Repair and Replacement (R&R) and Strategic Capital Planning The County maintains a Facilities Repair and Replacement Fund for the routine maintenance of County facilities. This fund is used for carpet replacement, HVAC repairs and replacements, painting, window replacements, and many other projects. Facilities staff has a planned ten-year schedule of projects and the financial plan includes maintaining funding for a minimum of four years of projects. Four years of funding will allow the County to continue investing in our assets during the average two-year economic downturn and through a two-year recovery period. This four-year funding target was funded as part of the FY16 budget. The County also has a strategic plan for our Information Technology department that we hope to begin implementing in the near future. Legislative Impacts Legislation was introduced and passed at the State level, in FY14, reestablishing the County Assistance Fund which provides lottery revenues to the counties. Coconino County received additional revenue of $550,038 in FY15 and FY16. This funding is subject to loss through further legislative action. In FY15 the Legislature passed a measure which eliminated County Assistance Funding from 3 additional counties, and Coconino County is in the next level of counties which could see elimination of funding.
9

Legislation was passed at the State level, in FY15, which requires all counties to provide funds to support the operations of the Arizona Department of Revenue (ADOR) and Arizona Department of Juvenile Corrections (ADJC). The impact of this legislation, in FY16, required the County to fund ADOR in the amount of $141,935 and ADJC in the amount of $ 252,400. Compensation plan The Board approved a 1.5% compression adjustment which was implemented in FY16, in addition to continuing the budgeted funding of a 2.5% merit increase for County staff. Coconino County continued innovative one-time monetary and non-monetary compensation programs, such as, the Personal Day Purchase Program (a type of voluntary furlough), as well as a Vacation Sell Back Program. A new employee benefit program in FY16, funded by the Board, is a Tuition Reimbursement Program. Wellness program Coconino County, as a partner of the NAPEBT, implemented a Wellness Incentive Program in FY13 and continued to expand and grow the program with much success through FY16. The program provides a monetary incentive to encourage employees to participate in a proactive health screening assessment and to live healthy lifestyles. The results are healthy employees that lead more fulfilling lives and a reduction in targeted catastrophic illnesses that drive health claims experience, which keep overall health care costs lower. During FY16 NAPEBT initiated the Vera on-site model health Clinic. Vera will provide more efficient health care for NAPEBT employees, reduce time away from work, provide access to primary care at reduced co-pays with extended hours and incorporates wellness and chronic disease management. Criminal Justice Coordinating Council (CJCC) The purpose of the CJCC is to study the criminal justice systems in the region, review opportunities to collaborate, identify areas for improvement and formulate policy, plans and programs for change to create efficiencies within our criminal justice system. Its mission is to communicate and present planning, financial, operational, managerial, and programmatic recommendations to the agencies represented on the Council. The Council is committed to providing the coordinated leadership necessary to establish cohesive public policies which are based on research, evaluation and monitoring of policy decisions and program implementations. There are currently nineteen members of the council from multiple jurisdictions within the region. The consensus of these members is required for decisions and recommendations. The direction and mission of the CJCC has been clear and the partners are motivated to make improvements to the system. The CJCC has developed a system performance tool to identify changes to performance criteria. This helps to identify changes early in the process in order to analyze and understand what impacts occur throughout the system. In addition, the County’s Chief Health Officer was added to the Executive Committee as the impacts for those dealing with behavioral health problems are having an increasing impact on criminal justice systems in Coconino County and across the country.
10

Other Initiatives Coconino County completed intergovernmental agreements with municipalities for Court Services in Tusayan and Williams. This allows the Justice of the Peace to fill the duties of Town Magistrate and leverage the investment of support staff, one-stop court services for citizens and delivery of services at reduced costs for taxpayers. Other Single Audit The independent audit of the financial statements of the County included the federally mandated “Single Audit” designed to meet the special needs of federal grantor agencies. The standards governing Single Audit engagements require the independent auditor to report on the audited government’s internal controls and compliance with legal requirements in addition to the fair presentation of the financial statements. This “Single Audit” puts special emphasis on internal controls and compliance with legal requirements involving the administration of federal awards. These reports are available in the County’s separately issued Single Audit report. Expenditure Limitation Arizona voters approved a proposition amending the state constitution in 1980 that established expenditure limitations for local governments, including Coconino County. The County has not exceeded the limitation. The County has accumulated expenditure limit carryforwards from prior years when actual expenditures were less than the limit and used some of these this year when expenditures would otherwise exceed the limit for this year. The County is required by state statute to prepare an Annual Expenditure Limitation Report (AELR), in conjunction with the required annual financial statements. The AELR must be audited and an opinion rendered on whether the AELR presents fairly, in all material respects, the information required by the Uniform Expenditure Reporting System. This report is available in the County’s separately issued Annual Expenditure Limitation Report. Awards Coconino County has received The Government Finance Officers Association of the United States and Canada (GFOA) Certificate of Achievement for Excellence in Financial Reporting for its comprehensive annual financial report for fiscal years 2009, 2010, 2011, 2012, 2014, and 2015. In order to be awarded a Certificate of Achievement, a government must publish an easily readable and efficiently organized comprehensive annual financial report. The report must satisfy both generally accepted accounting principles and applicable legal requirements. In addition, Coconino County has received the GFOA’s Distinguished Budget Presentation Award for its annual budget for fiscal years 2001 through 2015. In order to qualify for the award the County’s budget had to be judged proficient as a policy document, a financial plan, an operations guide, and a communication device.
11

Acknowledgments
Preparation of this report could not be accomplished without the dedicated service ofthe staff of the County’s Finance Department, the assistance of personnel in thevarious departments, and the assistance of Arizona Office of the Auditor General. Wealso wish to recognize that preparation of this report could not be accomplished withoutthe interest and support of the Board of Supervisors and their continued commitmentto professional and fiscally responsible financial management and planning.
Respectfully submitted,
12

13

Organizational Chart
COCONINO COUNTY
CITIZENS OF COCONINO COUNTY
JUDICIARY SUPERIOR COURT
Court Administration Division I Division II Division III/Drug Court Division IV Division V Division VI Clerk of Superior Court Adult Probation
JUVENILE COURT Juvenile Division Juvenile Probation
JUSTICE COURTS Court Administration Flagstaff Fredonia Page Williams
CONSTABLE COUNTY ATTORNEY
ELECTED OFFICIALS Assessor Treasurer Attorney Recorder
Sheriff Superintendent of Schools
BOARD OF SUPERVISORS Districts
1 2 3 4 5
Board Assistants
DEPUTY COUNTY MANAGER
Public Defender Legal Defender
Finance Facilities Management Community Services
Community Development
COUNTY MANAGER
Governmental Relations Human Resources
Public Information Officer
CLERK OF THE BOARD
DEPUTY COUNTY MANAGER
Emergency Management Public Health Services District
Public Works Career Center
Parks and Recreation Information Technology
14
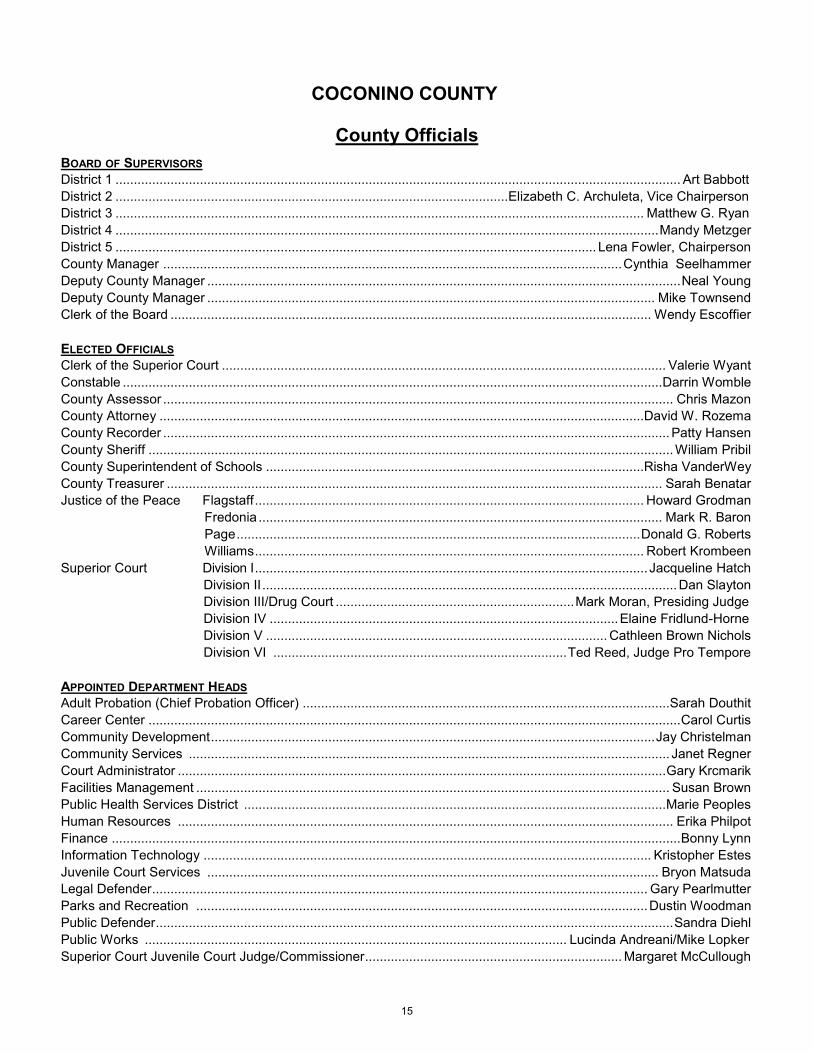
County Officials
COCONINO COUNTY
BOARD OF SUPERVISORS District 1 .......................................................................................................................................................... Art Babbott District 2 ........................................................................................................... Elizabeth C. Archuleta, Vice Chairperson District 3 ................................................................................................................................................ Matthew G. Ryan District 4 .................................................................................................................................................... Mandy Metzger District 5 ................................................................................................................................... Lena Fowler, Chairperson County Manager ............................................................................................................................. Cynthia Seelhammer Deputy County Manager ................................................................................................................................. Neal Young Deputy County Manager .......................................................................................................................... Mike Townsend Clerk of the Board ................................................................................................................................... Wendy Escoffier
ELECTED OFFICIALS Clerk of the Superior Court ......................................................................................................................... Valerie Wyant Constable ................................................................................................................................................... Darrin Womble County Assessor ........................................................................................................................................... Chris Mazon County Attorney ....................................................................................................................................David W. Rozema County Recorder .......................................................................................................................................... Patty Hansen County Sheriff ............................................................................................................................................... William Pribil County Superintendent of Schools .......................................................................................................Risha VanderWey County Treasurer ....................................................................................................................................... Sarah Benatar Justice of the Peace Flagstaff .......................................................................................................... Howard Grodman
Fredonia .............................................................................................................. Mark R. Baron Page .............................................................................................................. Donald G. Roberts Williams .......................................................................................................... Robert Krombeen
Superior Court Division I ........................................................................................................... Jacqueline Hatch Division II ................................................................................................................. Dan Slayton Division III/Drug Court ................................................................. Mark Moran, Presiding Judge Division IV ............................................................................................... Elaine Fridlund-Horne Division V ............................................................................................. Cathleen Brown Nichols Division VI ................................................................................ Ted Reed, Judge Pro Tempore
APPOINTED DEPARTMENT HEADS Adult Probation (Chief Probation Officer) .................................................................................................... Sarah Douthit Career Center ................................................................................................................................................. Carol Curtis Community Development ......................................................................................................................... Jay Christelman Community Services ................................................................................................................................... Janet Regner Court Administrator ..................................................................................................................................... Gary Krcmarik Facilities Management ................................................................................................................................. Susan Brown Public Health Services District ................................................................................................................... Marie Peoples Human Resources ....................................................................................................................................... Erika Philpot Finance ........................................................................................................................................................... Bonny Lynn Information Technology .......................................................................................................................... Kristopher Estes Juvenile Court Services ........................................................................................................................... Bryon Matsuda Legal Defender ....................................................................................................................................... Gary Pearlmutter Parks and Recreation ........................................................................................................................... Dustin Woodman Public Defender ............................................................................................................................................. Sandra Diehl Public Works ................................................................................................................... Lucinda Andreani/Mike Lopker Superior Court Juvenile Court Judge/Commissioner ...................................................................... Margaret McCullough
15

THIS PAGE BLANK
16

FINANCIAL SECTION
17

THIS PAGE BLANK
18
2910 NORTH 44th STREET • SUITE 410 • PHOENIX, ARIZONA 85018 • (602) 553-0333 • FAX (602) 553-0051
Independent auditors’ report
Members of the Arizona State Legislature
The Board of Supervisors of Coconino County, Arizona
Report on the financial statements
We have audited the accompanying financial statements of the governmental activities, each major fund, and aggregate remaining fund information of Coconino County as of and for the year ended June 30, 2016, and the related notes to the financial statements, which collectively comprise the County’s basic financial statements as listed in the table of contents.
Management’s responsibility for the financial statements
Management is responsible for the preparation and fair presentation of these financial statements in accordance with U.S. generally accepted accounting principles; this includes the design, implementation, and maintenance of internal control relevant to the preparation and fair presentation of financial statements that are free from material misstatement, whether due to fraud or error.
Auditors’ responsibility
Our responsibility is to express opinions on these financial statements based on our audit. We conducted our audit in accordance with U.S. generally accepted auditing standards and the standards applicable to financial audits contained in Government Auditing Standards, issued by the Comptroller General of the United States. Those standards require that we plan and perform the audit to obtain reasonable assurance about whether the financial statements are free from material misstatement.
An audit involves performing procedures to obtain audit evidence about the amounts and disclosures in the financial statements. The procedures selected depend on the auditors’ judgment, including the assessment of the risks of material misstatement of the financial statements, whether due to fraud or error. In making those risk assessments, the auditors consider internal control relevant to the County’s preparation and fair presentation of the financial statements in order to design audit procedures that are appropriate in the circumstances, but not for the purpose of expressing an opinion on the effectiveness of the County’s internal control. Accordingly, we express no such opinion. An audit also includes evaluating the appropriateness of accounting policies used and the reasonableness of significant accounting estimates made by management, as well as evaluating the overall presentation of the financial statements.
We believe that the audit evidence we have obtained is sufficient and appropriate to provide a basis for our audit opinions.
19

Opinions
In our opinion, the financial statements referred to above present fairly, in all material respects, the respective financial position of the governmental activities, each major fund, and aggregate remaining fund information of Coconino County as of June 30, 2016, and the respective changes in financial position and, where applicable, cash flows thereof for the year then ended in accordance with U.S. generally accepted accounting principles.
Emphasis of matter
As discussed in Note 1 to the financial statements, for the year ended June 30, 2016, the County adopted new accounting guidance, Governmental Accounting Standards Board Statement No. 72, Fair Value Measurement and Application. Our opinions are not modified with respect to this matter.
Other matters
Required supplementary information
U.S. generally accepted accounting principles require that the management’s discussion and analysis on pages 24 through 37, budgetary comparison schedules on pages 106 through 111, schedule of the County’s proportionate share of the net pension liability—cost-sharing pension plans on page 112, schedule of changes in the County’s net pension liability and related ratios—agent pension plans on pages 113 through 114, schedule of county pension contributions on pages 115 through 116, and schedule of agent retirement plans’ and Coconino County postemployment healthcare plans’ funding progress on page 118 be presented to supplement the basic financial statements. Such information, although not a part of the basic financial statements, is required by the Governmental Accounting Standards Board, who considers it to be an essential part of financial reporting for placing the basic financial statements in an appropriate operational, economic, or historical context. We have applied certain limited procedures to the required supplementary information in accordance with U.S. generally accepted auditing standards, which consisted of inquiries of management about the methods of preparing the information and comparing the information for consistency with management’s responses to our inquiries, the basic financial statements, and other knowledge we obtained during our audit of the basic financial statements. We do not express an opinion or provide any assurance on the information because the limited procedures do not provide us with sufficient evidence to express an opinion or provide any assurance.
Supplementary and other information Our audit was conducted for the purpose of forming opinions on the financial statements that collectively comprise the County’s basic financial statements. The combining and individual fund statements and schedules and the introductory and statistical sections listed in the table of contents are presented for purposes of additional analysis and are not required parts of the basic financial statements.
The combining and individual fund statements and schedules are management’s responsibility and were derived from and relate directly to the underlying accounting and other records used to prepare the basic financial statements. Such information has been subjected to the auditing procedures applied in the audit of the basic financial statements and certain additional procedures, including comparing and reconciling such information directly to the underlying accounting and other records used to prepare the basic financial statements or to the basic financial statements themselves, and other additional procedures in accordance with U.S. generally accepted auditing standards. In our opinion, the combining and individual fund statements and schedules are fairly stated, in all material respects, in relation to the basic financial statements as a whole.
20

The introductory and statistical sections have not been subjected to the auditing procedures applied in the audit of the basic financial statements, and accordingly, we do not express an opinion or provide any assurance on them.
Compliance over the use of highway user revenue fund and other dedicated state transportation revenue monies
In connection with our audit, nothing came to our attention that caused us to believe that the County failed to use highway user revenue fund monies the County received pursuant to Arizona Revised Statutes Title 28, Chapter 18, Article 2, and any other dedicated state transportation revenues the County received solely for the authorized transportation purposes, insofar as they relate to accounting matters. However, our audit was not directed primarily toward obtaining knowledge of such noncompliance. Accordingly, had we performed additional procedures, other matters may have come to our attention regarding the County’s noncompliance with the use of highway user revenue fund monies and other dedicated state transportation revenues, insofar as they relate to accounting matters.
The communication related to compliance over the use of highway user revenue fund and other dedicated state transportation revenue monies in the preceding paragraph is intended solely for the information and use of the members of the Arizona State Legislature, the Board of Supervisors, management, and other responsible parties within the County and is not intended to be and should not be used by anyone other than these specified parties.
Other reporting required by Government Auditing Standards
In accordance with Government Auditing Standards, we will issue our report on our consideration of the County’s internal control over financial reporting and on our tests of its compliance with certain provisions of laws, regulations, contracts, and grant agreements and other matters at a future date. The purpose of that report is to describe the scope of our testing of internal control over financial reporting and compliance and the results of that testing, and not to provide an opinion on internal control over financial reporting or on compliance. That report is an integral part of an audit performed in accordance with Government Auditing Standards in considering the County’s internal control over financial reporting and compliance.
Debbie Davenport Auditor General
December 22, 2016
21

THIS PAGE BLANK
22

MANAGEMENT’S DISCUSSION AND ANALYSIS (MD&A)
(REQUIRED SUPPLEMENTARY INFORMATION)
23

Management’s Discussion and Analysis (MD&A) of the County’s financial performance provides an overview of the County’s financial activities for the fiscal year ended June 30, 2016. Please read it in conjunction with the transmittal letter on pages 3-12 and the County’s basic financial statements, which follow this section. FINANCIAL HIGHLIGHTS FOR FISCAL YEAR 2016
The assets and deferred outflows of resources of the County exceeded its liabilities and deferred inflows of resources at the close of fiscal year 2016 by $140.54 million (net position). The unrestricted net deficit in the amount of $77.73 million consists of positive net position in the amount of $45.16 million that may be used to meet the government's ongoing obligations to citizens and creditors. The negative unrestricted net position in the amount of $122.89 million is primarily the result of the County’s unfunded pension and OPEB obligations.
The increase in the County’s net position was $2.76 million in fiscal year 2016. At the close of fiscal year 2016, the County’s governmental funds reported
combined ending fund balances of $96.66 million, a decrease of $2.00 million. The General Fund reported an unassigned fund balance of $28.96 million at the
close of fiscal year 2016, an increase of $2.84 million. OVERVIEW OF THE FINANCIAL STATEMENTS This discussion and analysis is intended to serve as an introduction to the County’s basic financial statements. The County’s basic financial statements are comprised of three components:
1. Government-wide financial statements, 2. Fund financial statements, and 3. Notes to the financial statements.
This report also contains other required supplementary information in addition to the basic financial statements. Government-wide Financial Statements The government-wide financial statements are designed to provide readers with a broad overview of the County’s finances, in a manner similar to a private sector business. One of the most important questions asked about the County’s finances is, “Is the County as a whole better off or worse off as a result of this year’s activities?” The Statement of Net Position and the Statement of Activities report information about the County as a whole and about its activities in a way that helps answer this question. These statements include all non-fiduciary assets and liabilities using the accrual basis of accounting.
Coconino County Management's Discussion and Analysis
June 30, 2016
24

The Statement of Net Position presents information on all of the County’s assets and deferred outflows of resources and liabilities and deferred inflows of resources, with the difference reported as Net Position.
Net Position = (Assets + Deferred Outflows of Resources) – (Liabilities + Deferred Inflows of Resources)
When viewed over a period of time, increases and decreases in net position are a useful indicator of an improving or deteriorating County financial condition. In addition to this change, other financial and non-financial factors should be considered. The Statement of Activities presents information showing how the County’s net position changed during the most recent fiscal year. All changes in net position are reported as soon as the underlying events giving rise to the change occur, regardless of the timing of related cash flow. Therefore, revenues and expenses are reported in these statements for some items that will result in cash flows in future fiscal periods, such as revenues pertaining to uncollected taxes, and expenses pertaining to earned but unused vacation and sick leave. All of the County’s basic services are considered to be governmental activities, including general government, health, welfare, public safety, highways and streets, culture and recreation, education, and sanitation. Sales taxes, property taxes, intergovernmental revenues and user fees finance most of these activities. The government-wide financial statements can be found on pages 41-43 of this report. Fund Financial Statements
The fund financial statements provide detailed information about the most significant County funds – not the County as a whole. A fund is a grouping of related accounts that is used to maintain control over resources that have been segregated for specific activities or objectives. Some funds are required to be established by State law or by bond covenants. However, the Board of Supervisors establishes other funds to help control and manage money for particular purposes or to show that legal responsibilities are being achieved for using certain taxes, grants and other money. All of the County’s funds can be divided into three categories: governmental, proprietary, and fiduciary. Governmental funds—Most of the County’s basic services are reported in governmental funds, which focus on near-term inflows and outflows of spendable resources and the balances of spendable resources available at year-end. These funds are reported using modified accrual accounting, which measures cash and all other financial assets that can readily be converted to cash. The governmental fund statements provide a detailed, short-term view of the County’s operations and the basic services it provides. Governmental fund information helps determine financial resources that can be spent in the near future to finance the County’s programs.
Coconino County Management's Discussion and Analysis
June 30, 2016
25

Because the focus of the governmental funds is narrower than that of the government-wide statements, it is useful to compare the information presented for the governmental funds with similar information presented for the governmental activities in the government-wide financial statements. Reconciliations between governmental activities, as reported in the Statement of Net Position and the Statement of Activities, and the governmental funds, as reported in the fund financial statements, is provided to facilitate this comparison. The County maintains numerous individual governmental funds. Information is presented separately in the governmental funds balance sheet and the governmental funds statement of revenues, expenditures, and changes in fund balances for the General Fund, Public Works/HURF Fund, Jail District Fund, Parks and Open Spaces Tax Projects Fund and Public Health Services District Fund, which are considered to be major funds. Data from the other nonmajor governmental funds are combined into a single aggregate presentation. Individual fund data for these nonmajor governmental funds are provided in the form of combining statements elsewhere in this report. The basic governmental fund financial statements can be found on pages 44-50 of this report.
Proprietary funds—The County has one proprietary fund, an internal service fund, to report fleet service activities provided to the County’s other programs and activities. The County’s internal service fund only provides services to County departments, as such it is reported as a governmental activity in the Statement of Net Position and the Statement of Activities. The basic proprietary fund financial statements can be found on pages 51-53 of this report. Fiduciary funds—Fiduciary funds are used to account for resources held for the benefit of parties outside the government. Fiduciary funds are not reflected in the government-wide financial statements as the resources of those funds are not available to support the County’s programs. The basic fiduciary funds financial statements can be found on pages 54-55 of this report. Notes to the Financial Statements and Required Supplementary Information Notes to the financial statements—The notes to the financial statements provide additional information that is essential to the full understanding of the data provided in the government-wide and fund financial statements. The notes to the financial statements can be found on pages 58-104 of this report. Required supplementary information—In addition to the basic statements and accompanying notes, the report presents required supplementary information on the County’s budgeting and budgetary control and the County’s Proportionate Share of the Net Pension Liability for Cost Sharing Plans, the Schedule of Changes in the County’s Net Pension Liability and Related Ratios for Agent Pension Plans, the Schedule of County Pension Contributions, and the Schedule of Agent Retirement Plans’ and Coconino County Postemployment Healthcare Plan's Funding Progress. Required supplementary information can be found on pages 106-119 of this report.
Coconino County Management's Discussion and Analysis
June 30, 2016
26
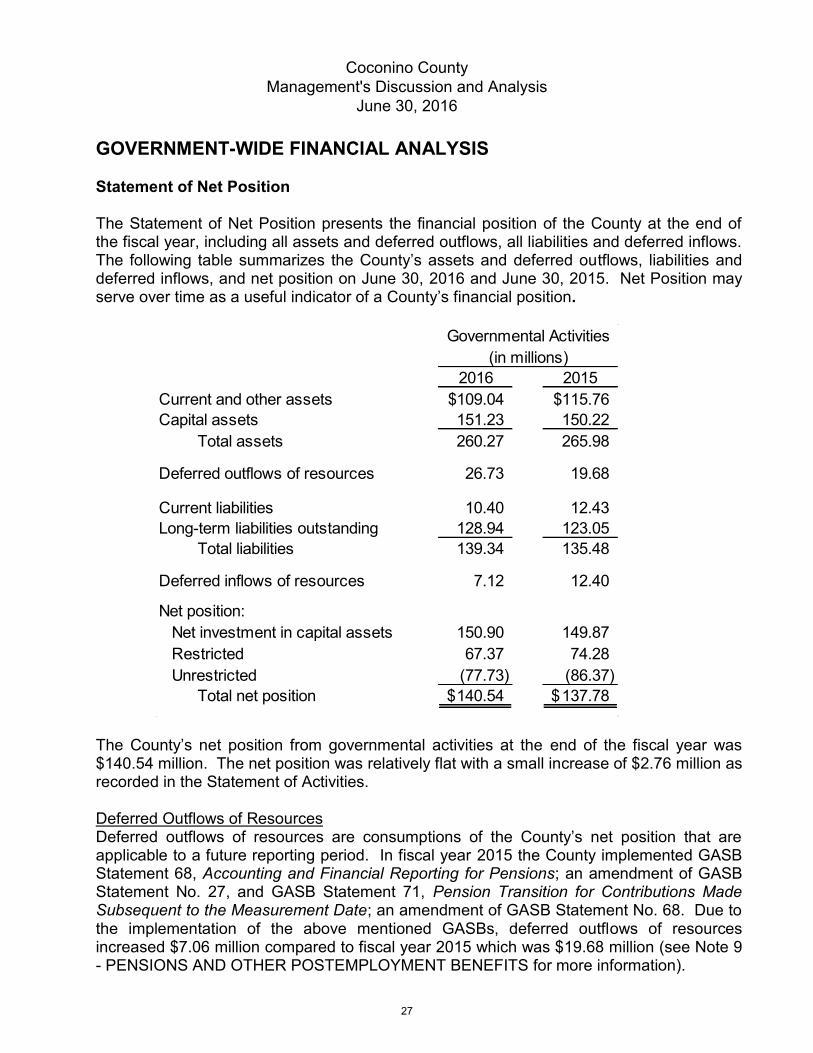
GOVERNMENT-WIDE FINANCIAL ANALYSIS Statement of Net Position The Statement of Net Position presents the financial position of the County at the end of the fiscal year, including all assets and deferred outflows, all liabilities and deferred inflows. The following table summarizes the County’s assets and deferred outflows, liabilities and deferred inflows, and net position on June 30, 2016 and June 30, 2015. Net Position may serve over time as a useful indicator of a County’s financial position.
The County’s net position from governmental activities at the end of the fiscal year was $140.54 million. The net position was relatively flat with a small increase of $2.76 million as recorded in the Statement of Activities. Deferred Outflows of Resources Deferred outflows of resources are consumptions of the County’s net position that are applicable to a future reporting period. In fiscal year 2015 the County implemented GASB Statement 68, Accounting and Financial Reporting for Pensions; an amendment of GASB Statement No. 27, and GASB Statement 71, Pension Transition for Contributions Made Subsequent to the Measurement Date; an amendment of GASB Statement No. 68. Due to the implementation of the above mentioned GASBs, deferred outflows of resources increased $7.06 million compared to fiscal year 2015 which was $19.68 million (see Note 9 - PENSIONS AND OTHER POSTEMPLOYMENT BENEFITS for more information).
2016 2015Current and other assets 109.04$ 115.76$ Capital assets 151.23 150.22
Total assets 260.27 265.98
Deferred outflows of resources 26.73 19.68
Current liabilities 10.40 12.43 Long-term liabilities outstanding 128.94 123.05
Total liabilities 139.34 135.48
Deferred inflows of resources 7.12 12.40
Net position:Net investment in capital assets 150.90 149.87 Restricted 67.37 74.28 Unrestricted (77.73) (86.37)
Total net position 140.54$ 137.78$
Governmental Activities(in millions)
Coconino County Management's Discussion and Analysis
June 30, 2016
27

Total Liabilities Total liabilities increased $3.86 million compared to fiscal year 2015 due to the following: a decrease in due to other governments of $2.11 million, a decrease in accounts payable of $0.52 million, an increase in accrued payroll and employee benefits of $0.64 million, and an increase in long term liabilities of $5.89 million. The decrease in accounts payable is attributable to large Public Works projects completed over the summer of 2015. The decrease in due to other governments was the result of Forest Fee revenue received too late to expend prior to June 30, 2015. The increase in long term liabilities is attributable to future postemployment health benefit liability and net pension liability (see Note 5 – LONG-TERM LIABILITIES).
Deferred Inflows of Resources Deferred inflows of resources are an acquisition of net position by the County that are applicable to a future reporting period. In fiscal year 2015 the County implemented GASB Statement 68, Accounting and Financial Reporting for Pensions; an amendment of GASB Statement No. 27, and GASB Statement 71, Pension Transition for Contributions Made Subsequent to the Measurement Date; an amendment of GASB Statement No. 68. Due to the implementation, in fiscal year 2015, of the above mentioned GASBs, deferred inflows of resources decreased $5.27 million compared to fiscal year 2015 which was $12.40 million (see Note 9 – PENSIONS AND OTHER POSTEMPLOYMENT BENEFITS for more information).
Net Investment in Capital Assets The County’s net investment in capital assets increased by $1.03 million in the current fiscal year, with total net investment in capital assets of $150.90 million. Capital assets include land, buildings, equipment, and infrastructure. These assets are used to provide services to citizens, but are not available for future spending.
Restricted Net Position Expendable restricted net position includes resources in which the County is legally obligated to spend the resources in accordance with restrictions provided by external parties. The portion of the County’s net position which is subject to external restrictions is $67.37 million. The County’s restricted net position decreased by $6.91 million in the current fiscal year. This is mainly attributable to the use of Jail District Funds, previously restricted for construction of an additional pod, to make a substantial payment to reduce the PSPRS pension liability.
Unrestricted Net Position Unrestricted net position is not subject to externally imposed stipulations; however, most of these resources have been designated for particular capital projects and for the County’sunfunded pension and OPEB obligations. The reported negative balance of the County’snet position, $77.73 million, is unrestricted and consists of, positive net position in the amount of $45.16 million that may be used to meet the government's ongoing obligations to citizens and creditors without constraints established by debt covenants or other legal requirements, and negative unrestricted net position in the amount of $122.89 million which
Coconino CountyManagement's Discussion and Analysis
June 30, 2016
28
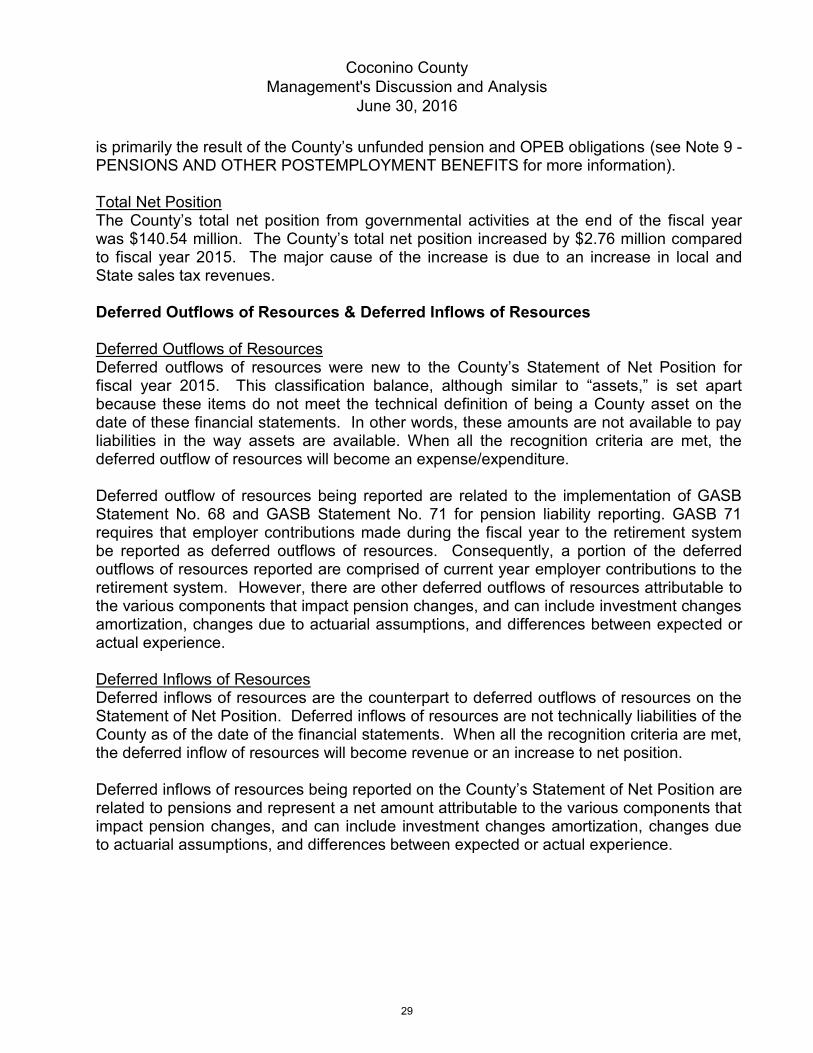
is primarily the result of the County’s unfunded pension and OPEB obligations (see Note 9 - PENSIONS AND OTHER POSTEMPLOYMENT BENEFITS for more information). Total Net Position The County’s total net position from governmental activities at the end of the fiscal year was $140.54 million. The County’s total net position increased by $2.76 million compared to fiscal year 2015. The major cause of the increase is due to an increase in local and State sales tax revenues. Deferred Outflows of Resources & Deferred Inflows of Resources Deferred Outflows of Resources Deferred outflows of resources were new to the County’s Statement of Net Position for fiscal year 2015. This classification balance, although similar to “assets,” is set apart because these items do not meet the technical definition of being a County asset on the date of these financial statements. In other words, these amounts are not available to pay liabilities in the way assets are available. When all the recognition criteria are met, the deferred outflow of resources will become an expense/expenditure. Deferred outflow of resources being reported are related to the implementation of GASB Statement No. 68 and GASB Statement No. 71 for pension liability reporting. GASB 71 requires that employer contributions made during the fiscal year to the retirement system be reported as deferred outflows of resources. Consequently, a portion of the deferred outflows of resources reported are comprised of current year employer contributions to the retirement system. However, there are other deferred outflows of resources attributable to the various components that impact pension changes, and can include investment changes amortization, changes due to actuarial assumptions, and differences between expected or actual experience. Deferred Inflows of Resources Deferred inflows of resources are the counterpart to deferred outflows of resources on the Statement of Net Position. Deferred inflows of resources are not technically liabilities of the County as of the date of the financial statements. When all the recognition criteria are met, the deferred inflow of resources will become revenue or an increase to net position. Deferred inflows of resources being reported on the County’s Statement of Net Position are related to pensions and represent a net amount attributable to the various components that impact pension changes, and can include investment changes amortization, changes due to actuarial assumptions, and differences between expected or actual experience.
Coconino County Management's Discussion and Analysis
June 30, 2016
29
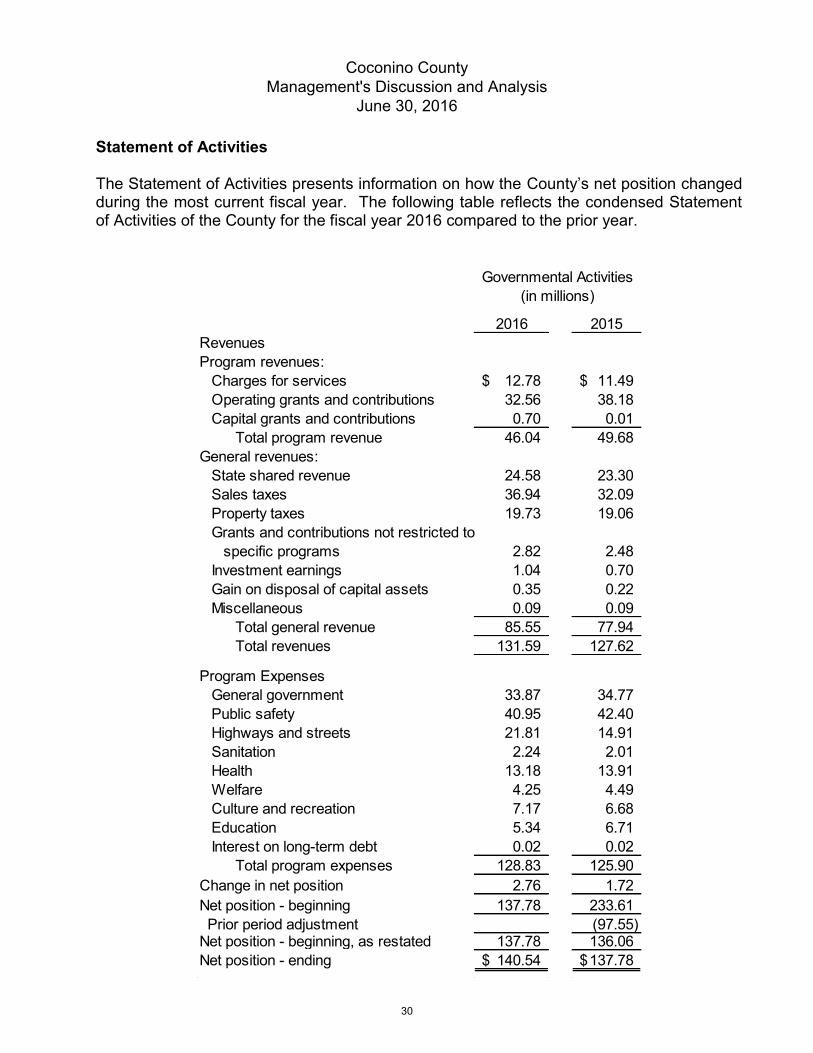
Statement of Activities The Statement of Activities presents information on how the County’s net position changed during the most current fiscal year. The following table reflects the condensed Statement of Activities of the County for the fiscal year 2016 compared to the prior year.
2016 2015RevenuesProgram revenues:
Charges for services 12.78$ 11.49$ Operating grants and contributions 32.56 38.18 Capital grants and contributions 0.70 0.01
Total program revenue 46.04 49.68 General revenues:
State shared revenue 24.58 23.30 Sales taxes 36.94 32.09 Property taxes 19.73 19.06 Grants and contributions not restricted to
specific programs 2.82 2.48 Investment earnings 1.04 0.70 Gain on disposal of capital assets 0.35 0.22 Miscellaneous 0.09 0.09
Total general revenue 85.55 77.94 Total revenues 131.59 127.62
Program ExpensesGeneral government 33.87 34.77 Public safety 40.95 42.40 Highways and streets 21.81 14.91 Sanitation 2.24 2.01 Health 13.18 13.91 Welfare 4.25 4.49 Culture and recreation 7.17 6.68 Education 5.34 6.71 Interest on long-term debt 0.02 0.02
Total program expenses 128.83 125.90 Change in net position 2.76 1.72 Net position - beginning 137.78 233.61 Prior period adjustment (97.55) Net position - beginning, as restated 137.78 136.06 Net position - ending 140.54$ 137.78$
(in millions)Governmental Activities
Coconino County Management's Discussion and Analysis
June 30, 2016
30

Overall program revenues decreased by $3.64 million in the current fiscal year. This decrease was from a reduction in operating grants and contributions of $5.62 million due primarily to the completion of large flood control projects, increase in charges for services of $1.29 million, and an increase in capital grants and contributions of $0.69 million in highway grants. Program expenses were relatively flat with a small increase of $2.93 million in the current fiscal year. Total general revenue increased by $7.61 million in fiscal year 2016. This was due in large part to increased State shared and local county sales tax collections of $6.13 million, increase in property tax collections of $0.67 million, an increase in investment earnings of $0.34 million due to investment market changes, and an increase in grants and contributions not restricted to specific programs of $0.34 million. State shared revenue increased $1.28 million due in part to the moderate rebound in taxable sales at the state level. Local county sales tax revenue increased by $4.85 million due in large part to the improving economy.
As shown in the “Revenues by Source for Governmental Activities” chart and “Program Revenues and Expenses for Governmental Activities” chart, for governmental activities overall, without regard to program, sales taxes are the largest single source of funds (28%), followed by operating grants and contributions (24%), and State shared revenue (19%).
Investment earnings1% Charges for services
10%Capital grants and
contributions1%
Operating grants and contributions
24%State shared revenue
19%Gain on disposal of
capital assets0%
Sales taxes28%
Miscellaneous0%
Property taxes15%
Unrestricted Grants and contributions
2%
Revenues by Source - Governmental Activities 2015/2016
Coconino County Management's Discussion and Analysis
June 30, 2016
31

Public safety is the largest functional area in expense (32%), followed by general government (26%), highways and streets (17%) and public health services (10%).
General Government expenses were relatively flat with a small decrease of $0.90 million in the current fiscal year. Highways and streets expenses increased to fund deferred road maintenance projects with the Road Maintenance Sales Tax passed by Coconino County voters in November 2014. Welfare expenses and education expenses decreased due to reduced grant expenses for Community Services, the Career Center, and in the Superintendent of Schools Office. The County uses credit cards to pay certain vendors for goods and services and for employee travel expenses. The County received a financial consideration resulting from credit card payments for the year ended June 30, 2016 in the amount of $65,746.
$0
$5,000
$10,000
$15,000
$20,000
$25,000
$30,000
$35,000
$40,000
$45,000
Program Revenues and Expenses for Governmental ActivitiesFiscal Year 2015-2016
(In thousands)
Expenses
Revenues
Coconino County Management's Discussion and Analysis
June 30, 2016
32

FINANCIAL ANALYSIS OF THE COUNTY’S FUNDS The County reported five major funds for this fiscal year – General Fund, Public Works/HURF, Jail District, Public Health Services District, and Parks and Open Spaces Tax Projects. At year-end the County’s governmental funds reported combined fund balances of $96.66 million, which is a decrease of $2.00 million from last year, or a decrease of 2.03%. Of the total, $95.49 million (98.79%) constitutes spendable fund balance. Revenues and expenditures for governmental functions overall increased by 6.49% and 10.48%, respectively. These increases were the result of an increase in local and State sales tax revenues, and on the expenditure side from the substantial payment made to reduce pension liability. Governmental fund expenditures exceeded governmental fund revenues by $2.39 million in the current fiscal year and the fund balance decreased by $2.00 million. The General Fund is the County’s primary operating fund. At the end of the current fiscal year the spendable fund balance of the General Fund was $28.96 million. Spendable fund balance represents 96.49% of the General Fund’s total fund balance. The General Fund’s fund balance increased by $2.37 million over fiscal year 2015. The Public Works/HURF Fund, fund balance decreased by $1.00 million in the current fiscal year. The decrease was from expenditures exceeding revenues. Many road maintenance projects which had been deferred for several years, were completed in FY16 from the Road Maintenance Sales Tax Revenue, and many vacant positions were filled. The Jail District Fund, fund balance decreased by $7.04 million in the current fiscal year. It decreased primarily due to a $10.00 million dollar transfer to the General Fund for payment to PSPRS to reduce the County’s unfunded pension liability. The Parks and Open Spaces Tax Projects Fund, fund balance decreased by $0.99 million in the current fiscal year. This decrease was due to completion of planned FY15 projects in FY16. The Public Health Services District Fund, fund balance increased by $0.67 million in the current fiscal year. The change in fund balance was primarily from the implementation of several cost saving measures, including closing the County Dental Clinic and replacing with dental care vouchers, and other staffing changes.
Coconino County Management's Discussion and Analysis
June 30, 2016
33

General Fund Budgetary Highlights
The final budgeted expenditures for the General Fund at year-end were $2.00 million less than the original adopted budget. This change was primarily due to budget adjustments for new grants and construction projects.
For the General Fund, actual expenditures were $10.58 million less than the final budget. The expenditures variance was primarily unexpended contingency funds and fiscal reserves.
The final budgeted revenues for the General Fund at year-end were flat with the original adopted budget. For the General Fund, actual revenues exceeded the final budget by $4.54 million. The increase was primarily due to significant increases in County Sales tax and State Shared Sales tax revenues.
Capital Assets and Debt Administration Capital Assets (Note 4) During the current fiscal year, the County added $1.62 million to its buildings and other improvements inventory, and added to its machinery and equipment inventory by $2.27 million. The addition in machinery and equipment was to replace old, inefficient heavy equipment and vehicles which had been kept running, beyond expected life-cycle, awaiting the passage of the Road Maintenance Sales Tax. The County added $7.97 million to its infrastructure inventory. The increase in infrastructure inventory includes culverts for Turkey Trail and Bowstring Road, improvements to Koch Field Road and Pinewood Boulevard, and drainage improvements on lower Crisp Hill Road and South Paintbrush. Also added were additional improvements to Campbell Avenue. The County’s overall estimated value of capital asset inventory increased $1.01 million net of increases in depreciation (see Note 4 – CAPITAL ASSETS found on page 72 of this report). The following table reflects the changes in capital assets for the County for the fiscal year 2016 compared to fiscal year 2015.
2016 2015
Land 40.84$ 40.85$ Buildings and other improvements 50.52 51.28 Machinery and equipment 7.35 5.13 Infrastructure 50.58 45.71 Construction in progress 1.94 7.25 Total 151.23$ 150.22$
Governmental Activities(net of depreciation)
(in millions)
Coconino County Management's Discussion and Analysis
June 30, 2016
34

Long-term Debt (Note 5) At the end of the current fiscal year the County had $260,000 in special assessment debt outstanding. The long-term liability for future postemployment health benefit (OPEB) liability has increased by $0.50 million to $6.83 million in the current year. This change is the result of $0.90 million in additional annual OPEB cost and only $0.40 million in actual contributions made during fiscal year 2016 (see Note 5 – LONG-TERM LIABILITIES found on page 73 of this report). ECONOMIC FACTORS AND NEXT YEAR’S BUDGETS The County utilizes a Ten-Year Financial Plan, which is updated quarterly, to forecast the County’s financial future. The largest single revenue source is local and State shared sales taxes. Local and State shared sales taxes constitute approximately 45% of the County’s government-wide general revenues and approximately 67% of General Fund revenues. This makes the County’s revenues sensitive to both improvements and downturns in the economy. County staff incorporated historical financial trends, and local, national and global economic trends into the County’s fiscal 2016 budget. State shared sales tax and County sales tax revenues stabilized in fiscal year 2012 and are now above the pre-recession measurement year of fiscal year 2007 levels; State shared sales tax exceeds the fiscal year 2007 level by 15.9% and County sales tax is 14.0% above the fiscal year 2007 level. The key elements of the fiscal year 2016 budget are based on the assumption that economic recovery began in fiscal year 2011, and we are now showing recovery in our state revenues. The county continues to see lower levels in federal and state grant revenue, and uncertainty in federal payments for Payments In Lieu of Taxes and the Secure Rural Schools Act. The county established the following Financial Planning Milestones in the fiscal year 2016 budget:
Align “high probability of receipt” revenue types with recurring expenditures. Allocate budgeted receipts above recessionary revenue levels to one-time or non-
mission-critical expenditures. Plan adequate reserves for revenue smoothing and an emergency reserve, to allow
for unknown and unplanned events. Provide adequate compensation to retain trained and experienced staff, who will
efficiently and effectively deliver services. Strategically plan for long-term facility and technology resources to have appropriate
work space and tools available for staff. In developing the fiscal year 2016 budget, major areas of concern were:
Impacts from the State shifting costs to the County, while reducing County revenue allocations to subsidize the State budget deficit. For FY16 new State cost shifts
Coconino County Management's Discussion and Analysis
June 30, 2016
35
added more than $0.50 million impact, in addition to the over $4.00 million in continuing cost shifts from prior fiscal years.
o The new shifts include; Paying the State to operate the Arizona Department of Revenue for
collecting county sales tax Paying for the operating costs of the Arizona Department of Juvenile
Corrections Paying all the costs of the state-required Presidential Preference
Election in 2016 Potential reductions in Federal funding, particularly the loss of Secure Rural Schools
funding (previously known as Forest Fees), a major source of funding for schools and roads.
Focus on Criminal Justice by back-filling reduced special revenue funds and lost State funding by using the General Fund to provide an excess of $0.30 million in one-time funding for the County Attorney and Public Defender.
Focus on Public Safety by adding 6 new positions in the Jail District (4 in Flagstaff and 2 in Page) and approving a 2% market adjustment for Sheriff’s Officers and Jail Detention Officers, in addition to their pay plan step increases. The additional positions were recommended in a recent Jail study.
The commitment to our employees in the form of appropriate compensation to the extent possible and avoiding the cost of increased turnover which decreases efficiency. A 2.5% merit increase, zero increase in health benefit premiums, and funding of a tuition reimbursement program are examples of support for employees.
Continuing increases in pension costs that further constrict limited resources. Focus on holding health insurance costs well below national averages by expanding
participation in the successful wellness program for employees, while considering other best practices. An on-site model health clinic, called the Vera Clinic, was opened in FY16 for use by all employees and dependents of agencies who are participants in the Northern Arizona Public Employee Benefit Trust (NAPEBT), of which Coconino County is a participating agency. The goal in opening the Vera Clinic is to create sustainable, long-term cost containment for health care of our employees.
Addressing long-term deficits for the Public Health Services District (PHSD). This is being accomplished through programmatic changes, reductions in staffing (cutting 4.6 FTE), increases in revenue through user fees, and reorganization. A projected deficit of nearly $1.00 million has been reduced to $0.08 million.
The County’s financial planning is based on realistic revenue estimates and the use of a strategic planning process to focus the expenditure of limited resources on meeting the current and future needs of its citizens, including the level of recurring costs that may be maintained during a recession.
Coconino County Management's Discussion and Analysis
June 30, 2016
36
REQUESTS FOR INFORMATION This financial report is designed to provide our citizens, taxpayers, customers, investors, and creditors with a general overview of the County’s finances and to show the County’s accountability for the money it receives. If you have questions about this report or need additional financial information, contact the County’s Finance Department, Coconino County, 219 East Cherry Avenue, Flagstaff, Arizona 86001.
Coconino County Management's Discussion and Analysis
June 30, 2016
37

THIS PAGE BLANK
38

BASIC FINANCIAL STATEMENTS
39

THIS PAGE BLANK
40

Governmental Activities
Assets Cash and cash equivalents 90,311,693$ Investments 602,590 Cash and investments held by trustee 30,209 Receivables (net of allowances for uncollectibles): Property taxes 681,771 Accounts 270,182 Special assessments 153,644 Road sales tax 1,618,011 Jail District sales tax 2,679,956 Accrued interest 172,990
Due from other governments 12,161,394 Inventories 184,126 Prepaid items 170,541 Capital assets, not being depreciated 42,783,144 Capital assets, being depreciated, net 108,446,084
Total assets 260,266,335
Deferred Outflows of Resources Deferred outflows related to pensions 26,733,586
Total deferred outflows of resources 26,733,586
Liabilities Accounts payable 7,260,190 Accrued payroll and employee benefits 3,066,793 Deposits held for others 38,063 Unearned revenues 34,094 Noncurrent liabilities Due within 1 year 3,647,392 Due in more than 1 year 125,290,414 Total liabilities 139,336,946
Deferred Inflows of Resources Deferred inflows related to pensions 7,124,795
Total deferred inflows of resources 7,124,795
Net Position Net investment in capital assets 150,901,461 Restricted for: Public safety 14,259,749 Highways and streets 25,364,855 Sanitation 1,355,407 Health 2,779,816 Welfare 140,641 Culture and recreation 761,496 Education 2,239,084 Debt service 348,312 Capital projects 17,276,936 Other purposes 2,843,991
Unrestricted (77,733,568) Total net position 140,538,180$
Coconino CountyStatement of Net Position
June 30, 2016
The accompanying notes are an integral part of these basic financial statements.
41

THIS PAGE BLANK
42

Net (Expenses) Revenues and Changes in Net
PositionOperating Capital
Charges for Grants and Grants andExpenses Services Contributions Contributions Total
Functions/ProgramsPrimary government:
Governmental activities: General government 33,869,932 5,751,943 1,949,408 (26,168,581)$ Public safety 40,947,920 3,159,188 5,686,093 (32,102,639) Highways and streets 21,815,377 72,866 13,180,607 701,112 (7,860,792) Sanitation 2,235,478 1,348,145 296,727 339 (590,267) Health 13,180,529 1,143,207 3,786,316 (8,251,006) Welfare 4,254,709 123,744 1,994,181 (2,136,784) Culture and recreation 7,172,432 810,926 95,611 (6,265,895) Education 5,336,344 373,206 5,569,238 606,100 Interest on long-term debt 18,128 (18,128)
Total governmental activities 128,830,849$ 12,783,225$ 32,558,181$ 701,451$ (82,787,992)$
General revenues Taxes:
Property taxes, levied for general purposes 9,511,567 Property taxes, levied for library 3,924,459 Property taxes, levied for flood control 2,444,129 Property taxes, levied for accommodation school 8 Property taxes, levied for health services 3,847,788 General county sales tax 14,123,077 Road sales tax 8,426,665 Jail District sales tax 14,127,110 Parks and open spaces sales tax 27,012 Excise tax 139,804 Franchise tax 97,267
Shared revenue - state sales tax 21,004,646 Shared revenue - state vehicle license tax 3,570,541 Grants and contributions not restricted to specific programs 2,822,490 Investment earnings 1,037,145 Gain on disposal of capital assets 354,668 Miscellaneous 90,144
Total general revenues 85,548,520Change in net position 2,760,528
Net position, July 1, 2015 137,777,652 Net position, June 30, 2016 140,538,180$
Program Revenues
Coconino CountyStatement of Activities
Year Ended June 30, 2016
The accompanying notes are an integral part of these basic financial statements.
43

General Fund
Public Works/HURF
FundJail District
Fund Assets Cash and cash equivalents 24,665,045$ 20,366,951$ 10,577,142$ Investments Cash and investments held by trustee Receivables (net of allowances for uncollectibles):
Property taxes 310,496 Accounts 18,607 645 Special assessments Road sales tax 1,618,011 Jail District sales tax 2,679,956 Accrued interest 37,246 41,362 25,447
Advances to other funds 1,001,783 Due from:
Other funds 1,629,123 177,195 78,787 Other governments 7,531,112 1,951,095 327,285
Inventories 326 Prepaid items 52,944 1,667 1,124
Total assets 35,246,682$ 24,156,281$ 13,690,386$
Liabilities, Deferred Inflows of Resources, and Fund Balances Liabilities:
Accounts payable 1,768,401$ 3,606,800$ 436,741$ Accrued payroll and employee benefits 1,700,014 216,674 340,196 Advances from other funds Due to:
Other funds 1,477,052 346,177 345,667 Deposits held for others 5,651 Unearned revenue 19,123
Total liabilities 4,970,241 4,169,651 1,122,604
Deferred Inflows of Resources Unavailable revenue - property taxes 259,815 Unavailable revenue - special assessments Unavailable revenue - intergovernmental Unavailable revenue - other
Total deferred inflows of resources 259,815
Fund balances: Nonspendable 1,055,053 1,667 1,124 Restricted 19,984,963 12,566,658 Unassigned 28,961,573
Total fund balances 30,016,626 19,986,630 12,567,782Total liabilities, deferred inflows of resources,and fund balances 35,246,682$ 24,156,281$ 13,690,386$
Coconino CountyBalance Sheet
Governmental FundsJune 30, 2016
The accompanying notes are an integral part of these basic financial statements.
44

Public Health Services District
Fund
Parks and Open Spaces Tax Projects
Fund
Nonmajor Governmental
Funds
Total Governmental
Funds
1,974,219$ 13,916,289$ 18,059,151$ 89,558,797$ 602,590 602,590 30,209 30,209
140,885 230,390 681,77157,709 159,637 236,598
153,644 153,644 1,618,011 2,679,956
4,678 26,947 36,091 171,771 1,001,783
134,415 2,088,252 4,107,772968,251 3,782 1,379,869 12,161,394
32677,245 37,561 170,541
3,357,402$ 13,947,018$ 22,777,394$ 113,175,163$
205,964$ 372,906$ 779,741$ 7,170,553$ 219,913 3,991 352,273 2,833,061
1,001,783 1,001,783
151,709 2,130,276 4,450,881 32,412 38,063 14,971 34,094
577,586 376,897 4,311,456 15,528,435
118,748 189,239 567,802153,644 153,644256,270 256,270
10,210 10,210118,748 609,363 987,926
77,245 37,561 1,172,6502,583,823 13,570,121 19,057,814 67,763,379
(1,238,800) 27,722,7732,661,068 13,570,121 17,856,575 96,658,802
3,357,402$ 13,947,018$ 22,777,394$ 113,175,163$
45

THIS PAGE BLANK
46

Fund balances − total governmental funds 96,658,802$
Amounts reported for governmental activities in the Statement of Net Position are different because:
Capital assets used in governmental activities are not financial resources and, therefore, are not reported in the funds. 150,327,400
Some receivables are not available to pay for current-period expendituresand, therefore, are reported as unavailable revenue in the funds. 987,926
Internal service fund is used by management to charge the costs ofcertain activities, such as automotive maintenance, to individual funds.The assets, deferred outflows of resources, liabilities, and deferred inflows ofresources of the internal service fund are included in governmental activitiesin the Statement of Net Position. 1,201,740
Long-term liabilities, including bonds payable, compensated absences payable, and claims and judgments payable, are not due and payablein the current period and, therefore, are not reported in the funds. (12,836,031)
Net pension liabilities are not due and payable in the current period and,therefore, are not reported in the funds. (115,421,560)
Deferred outflows and inflows of resources related to pensions are applicable to future periods and, therefore, are not reported in the funds.
Deferred outflows of resources related to pensions 26,680,145 Deferred inflows of resources related to pensions (7,060,242)
Net position of governmental activities 140,538,180$
Coconino CountyReconciliation of the Balance Sheet of Governmental Funds
to the Statement of Net PositionJune 30, 2016
The accompanying notes are an integral part of these basic financial statements.
47

General Fund
Public Works/HURF
FundJail District
FundRevenues:
Property taxes 9,498,577$ $ $ County sales taxes 14,360,222 8,426,665 14,127,110 Special assessments Licenses and permits 1,135,405 25,974 Fees, fines, and forfeits 1,351,348 Intergovernmental 28,885,641 11,732,298 190,258 Charges for services 2,142,798 6,592 527,292 Investment earnings 298,660 278,249 219,294 Contributions 245,964 14,000 Miscellaneous 188,357 2,425 39
Total revenues 58,106,972 20,472,203 15,077,993
Expenditures: Current:
General government 29,113,447 Public safety 24,945,723 13,863,593 Highways and streets 451,477 22,422,188 Sanitation Health 28,619 Welfare 1,179,379 Culture and recreation 1,489,745 Education 458,272
Capital outlay Debt service:
Principal Interest and other charges
Total expenditures 57,666,662 22,422,188 13,863,593
Excess (deficiency) of revenues over expenditures 440,310 (1,949,985) 1,214,400
Other financing sources (uses): Capital lease agreement 90,011 Sale of capital assets 3,300 352,249 Transfers in 11,213,384 772,160 2,587,635 Transfers out (9,373,964) (178,835) (10,838,189)
Total other financing sources (uses) 1,932,731 945,574 (8,250,554)
Net change in fund balances 2,373,041 (1,004,411) (7,036,154)
Fund balances, July 1, 2015 27,643,585 20,991,041 19,603,936Fund balances, June 30, 2016 30,016,626$ 19,986,630$ 12,567,782$
Coconino CountyStatement of Revenues, Expenditures, and Changes in Fund Balances
Governmental FundsYear Ended June 30, 2016
The accompanying notes are an integral part of these basic financial statements.
48

Public Health Services
District Fund
Parks and Open Spaces Tax
Projects Fund
Nonmajor Governmental
Funds
Total Governmental
Funds
3,839,304$ $ 6,363,869$ 19,701,750$ 5,897 27,012 5,682 36,952,588
57,851 57,851555,200 4,650 1,721,229
536,294 1,887,6424,224,237 16,873,350 61,905,784
621,834 3,624,490 6,923,00623,678 186,421 257,775 1,264,077
111,401 307,838 679,2031,248,510 1,439,331
9,381,551 213,433 29,280,309 132,532,461
2,308,412 31,421,859737,683 9,160,703 48,707,702
63,106 22,936,7712,065,123 2,065,123
12,694,622 12,723,241142,422 2,703,150 4,024,951
4,435,151 5,924,8964,683,198 5,141,470
1,207,850 665,144 1,872,994
85,000 85,00018,128 18,128
13,574,727 1,207,850 26,187,115 134,922,135
(4,193,176) (994,417) 3,093,194 (2,389,674)
90,0114,551 1,235 361,335
4,909,041 3,223,994 22,706,214(49,885) (2,325,916) (22,766,789)
4,863,707 899,313 390,771
670,531 (994,417) 3,992,507 (1,998,903)
1,990,537 14,564,538 13,864,068 98,657,7052,661,068$ 13,570,121$ 17,856,575$ 96,658,802$
49
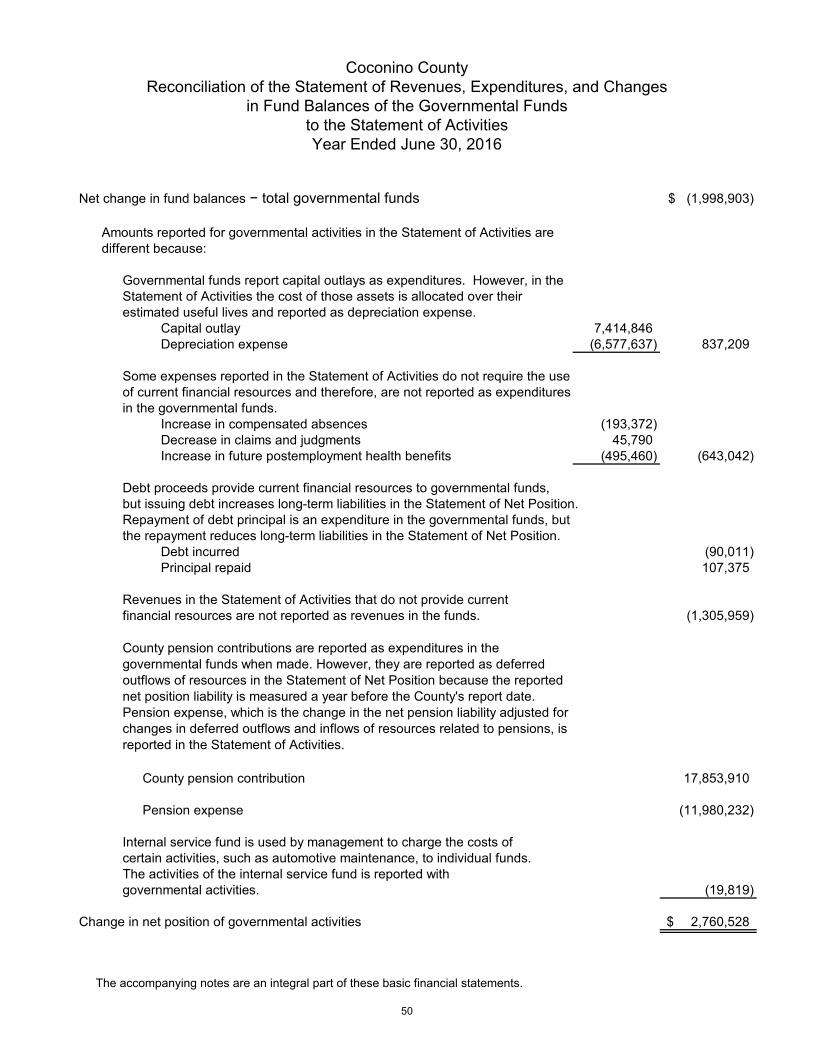
Net change in fund balances − total governmental funds (1,998,903)$
Amounts reported for governmental activities in the Statement of Activities aredifferent because:
Governmental funds report capital outlays as expenditures. However, in theStatement of Activities the cost of those assets is allocated over theirestimated useful lives and reported as depreciation expense.
Capital outlay 7,414,846 Depreciation expense (6,577,637) 837,209
Some expenses reported in the Statement of Activities do not require the useof current financial resources and therefore, are not reported as expendituresin the governmental funds.
Increase in compensated absences (193,372) Decrease in claims and judgments 45,790 Increase in future postemployment health benefits (495,460) (643,042)
Debt proceeds provide current financial resources to governmental funds,but issuing debt increases long-term liabilities in the Statement of Net Position.Repayment of debt principal is an expenditure in the governmental funds, butthe repayment reduces long-term liabilities in the Statement of Net Position.
Debt incurred (90,011) Principal repaid 107,375
Revenues in the Statement of Activities that do not provide current financial resources are not reported as revenues in the funds. (1,305,959)
County pension contribution 17,853,910
Pension expense (11,980,232)
Internal service fund is used by management to charge the costs of certain activities, such as automotive maintenance, to individual funds.The activities of the internal service fund is reported with governmental activities. (19,819)
Change in net position of governmental activities 2,760,528$
County pension contributions are reported as expenditures in the governmental funds when made. However, they are reported as deferred outflows of resources in the Statement of Net Position because the reported net position liability is measured a year before the County's report date. Pension expense, which is the change in the net pension liability adjusted for changes in deferred outflows and inflows of resources related to pensions, is reported in the Statement of Activities.
Coconino CountyReconciliation of the Statement of Revenues, Expenditures, and Changes
in Fund Balances of the Governmental Fundsto the Statement of ActivitiesYear Ended June 30, 2016
The accompanying notes are an integral part of these basic financial statements.
50

Governmental Activities -
Internal Service Fund
AssetsCurrent assets:
Cash and cash equivalents 752,896$ Receivables (net of allowances for uncollectibles):
Accounts 33,584 Accrued interest 1,219 Due from other funds 343,883 Inventories 183,800
Total current assets 1,315,382
Noncurrent assets: Capital assets, net of accumulated depreciation:
Buildings, net 38,653 Equipment, net 863,175
Capital assets, net 901,828 Total noncurrent assets 901,828
Total assets 2,217,210
Deferred Outflows of Resources Deferred outflows related to pensions 53,441
Total deferred outflows of resources 53,441
LiabilitiesCurrent liabilities:
Accounts payable 89,637 Accrued payroll and employee benefits 272,887 Due to other funds 774
Total current liabilities 363,298
Noncurrent liabilities: Net pension liability 641,060
Total noncurrent liabilities 641,060
Total liabilities 1,004,358
Deferred Inflows of Resources Deferred inflows related to pensions 64,553
Total deferred inflows of resources 64,553
Net Position Net investment in capital assets 901,828 Unrestricted 299,912
Total net position 1,201,740$
Coconino CountyStatement of Net Position
Proprietary FundJune 30, 2016
The accompanying notes are an integral part of these basic financial statements.
51
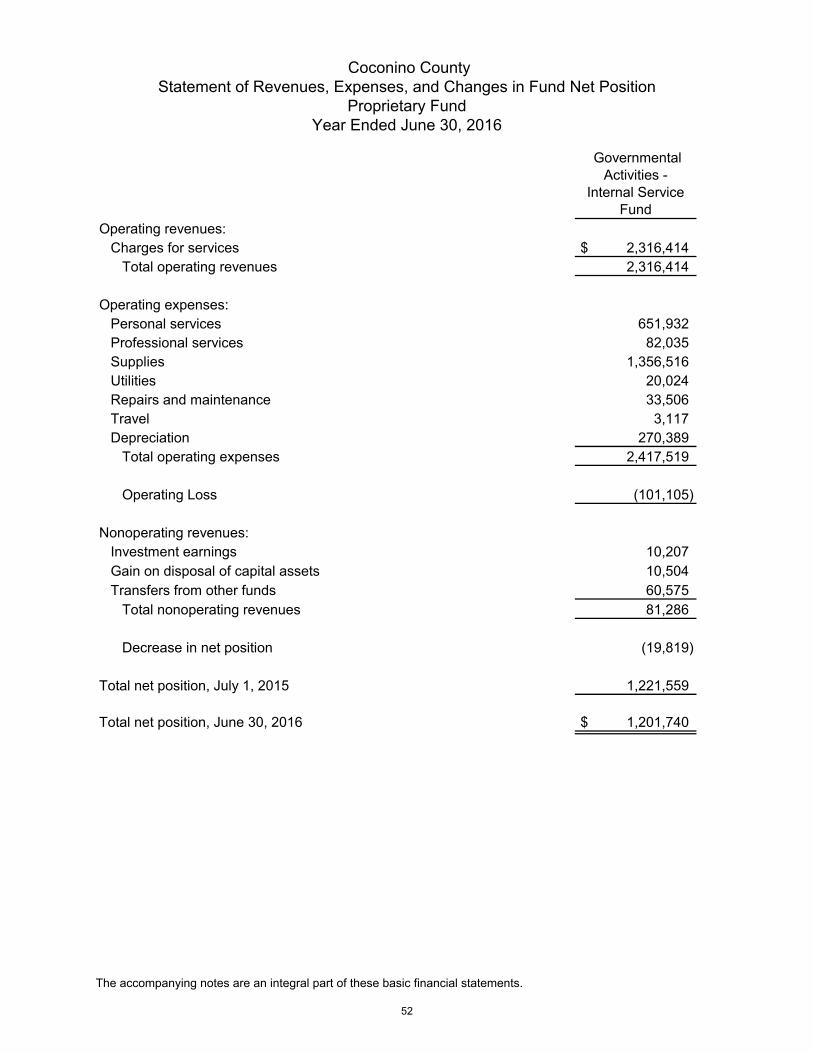
Governmental Activities -
Internal Service Fund
Operating revenues: Charges for services 2,316,414$
Total operating revenues 2,316,414
Operating expenses: Personal services 651,932 Professional services 82,035 Supplies 1,356,516 Utilities 20,024 Repairs and maintenance 33,506 Travel 3,117 Depreciation 270,389
Total operating expenses 2,417,519
Operating Loss (101,105)
Nonoperating revenues: Investment earnings 10,207 Gain on disposal of capital assets 10,504 Transfers from other funds 60,575
Total nonoperating revenues 81,286
Decrease in net position (19,819)
Total net position, July 1, 2015 1,221,559
Total net position, June 30, 2016 1,201,740$
Coconino CountyStatement of Revenues, Expenses, and Changes in Fund Net Position
Proprietary FundYear Ended June 30, 2016
The accompanying notes are an integral part of these basic financial statements.
52

Governmental Activities- Internal
Service FundCash flows from operating activities: Receipts from other funds for services provided 2,312,271$ Payments to suppliers and providers of goods and services (1,531,978) Payments to employees (627,313)
Net cash provided by operating activities 152,980
Cash flows from noncapital financing activities: Cash transfers from other funds 60,575
Net cash provided by noncapital financing activities 60,575
Cash flows from capital and related financing activities: Proceeds from sale of capital assets 13,075 Purchases of capital assets (447,509)
Net cash used for capital and related financing activities (434,434)
Cash flows from investing activities: Interest received on investments 7,718 Net increase in fair value of investments 2,779
Net cash provided by investing activities 10,497
Net decrease in cash and cash equivalents (210,382)
Cash and cash equivalents, July 1, 2015 963,278
Cash and cash equivalents, June 30, 2016 752,896$
Reconciliation of operating loss to net cash provided by operating activities:Operating loss (101,105)$ Adjustments to reconcile operating loss to net cash provided by operating activities: Depreciation 270,389Changes in assets, deferred outflows of resources, liabilities, and deferred inflows of resources: Increase in:
Due from other funds (30,254) Accrued payroll and employee benefits 32,914 Due to other funds 628 Net pension liability 25,009
Decrease in: Accounts receivable 25,483 Accounts payable (45,350) Inventories 8,570 Deferred outflows related to pensions 18,527 Deferred inflows related to pensions (51,831)
Net cash provided by operating activities 152,980$
Coconino CountyStatement of Cash Flows
Proprietary FundYear Ended June 30, 2016
The accompanying notes are an integral part of these basic financial statements.
53
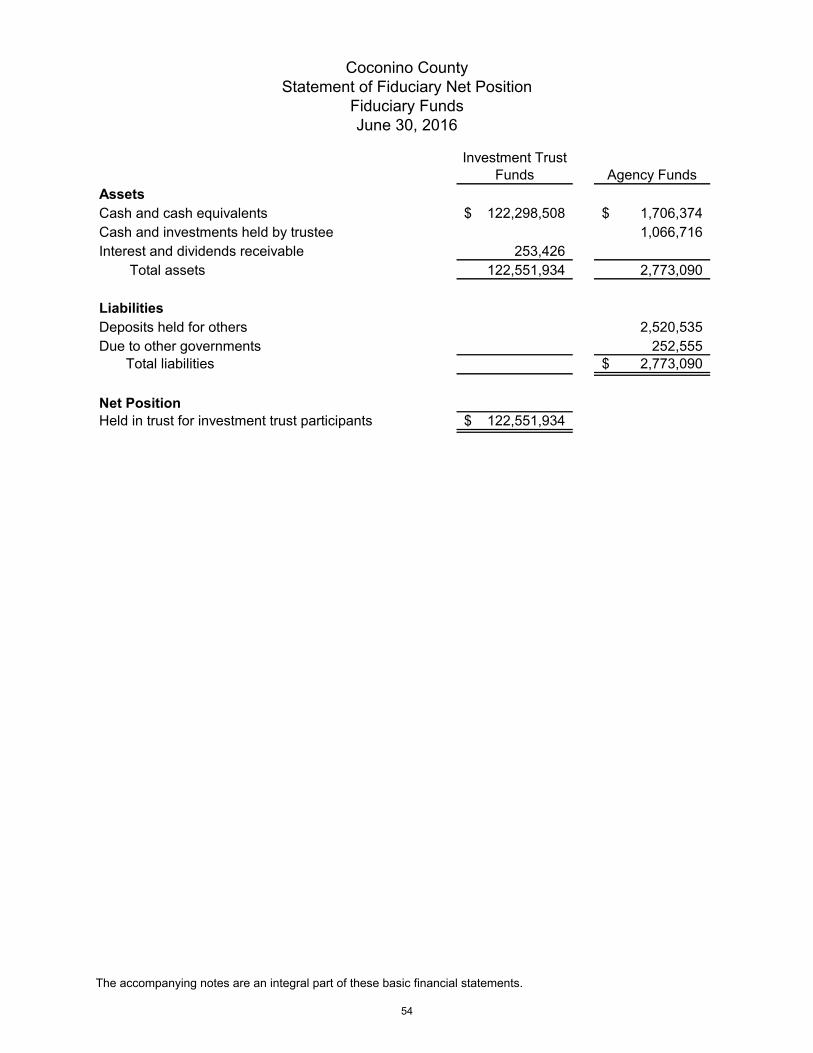
Investment Trust Funds Agency Funds
AssetsCash and cash equivalents 122,298,508$ 1,706,374$ Cash and investments held by trustee 1,066,716Interest and dividends receivable 253,426 Total assets 122,551,934 2,773,090
LiabilitiesDeposits held for others 2,520,535Due to other governments 252,555 Total liabilities 2,773,090$
Net PositionHeld in trust for investment trust participants 122,551,934$
Coconino County Statement of Fiduciary Net Position
Fiduciary Funds June 30, 2016
54
The accompanying notes are an integral part of these basic financial statements.
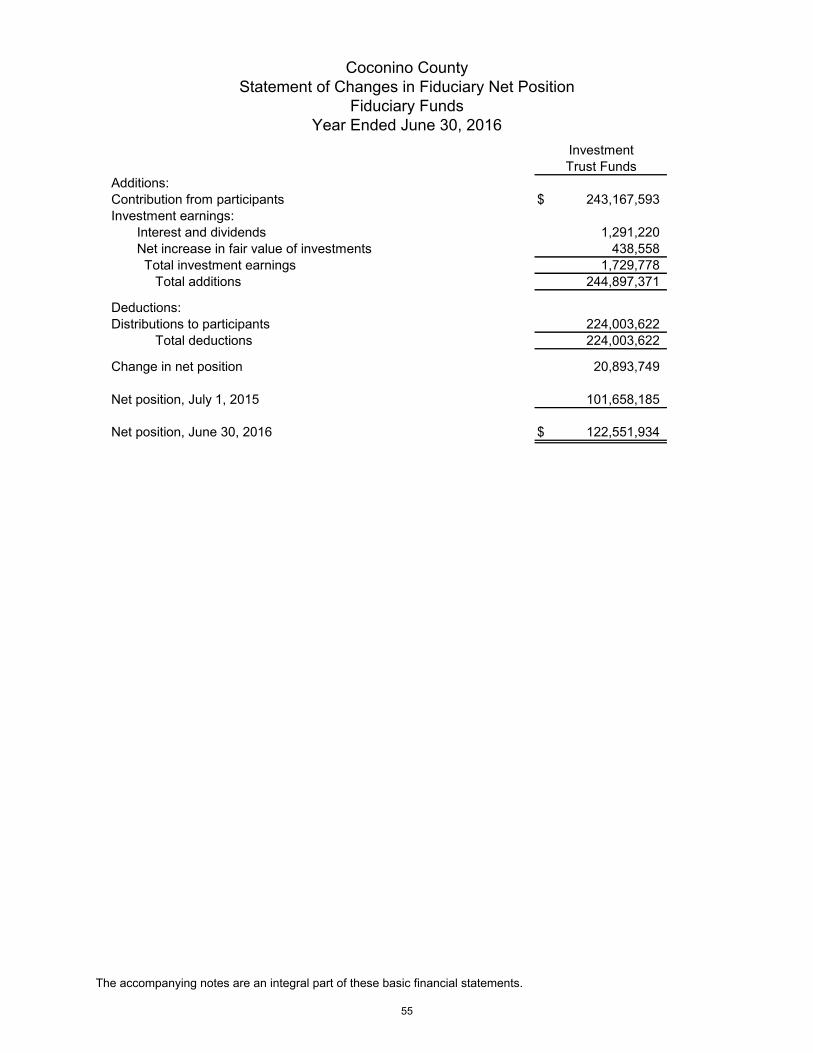
InvestmentTrust Funds
Additions:Contribution from participants 243,167,593$ Investment earnings: Interest and dividends 1,291,220 Net increase in fair value of investments 438,558 Total investment earnings 1,729,778
Total additions 244,897,371
Deductions:Distributions to participants 224,003,622
Total deductions 224,003,622
Change in net position 20,893,749
Net position, July 1, 2015 101,658,185
Net position, June 30, 2016 122,551,934$
Coconino CountyStatement of Changes in Fiduciary Net Position
Fiduciary FundsYear Ended June 30, 2016
The accompanying notes are an integral part of these basic financial statements.
55

THIS PAGE BLANK
56

BASIC FINANCIAL STATEMENTS - NOTES
57

NOTE 1 – SUMMARY OF SIGNIFICANT ACCOUNTING POLICIES
Coconino County’s accounting policies conform to generally accepted accounting principles applicable to governmental units adopted by the Governmental Accounting Standards Board (GASB).
For the year ended June 30, 2016, the County implemented the provisions of GASB Statement No. 72, Fair Value Measurement and Application and GASB Statement No. 76, The Hierarchy of Generally Accepted Accounting Principles for State and Local Governments. GASB Statement No. 72 establishes standards for measuring fair value and applying fair value to certain investments and disclosures related to all fair value measurements. GASB Statement No. 76 establishes the hierarchy of sources of accounting principles used to prepare financial statements of state and local governmental entities in conformity with generally accepted accounting principles.
A. Reporting Entity The County is a general purpose local government that is governed by a separately elected board of five county supervisors. The accompanying financial statements present the activities of the County (the primary government) and its component units.
Component units are legally separate entities for which the County is considered to be financially accountable. Blended component units, although legally separate entities, are so intertwined with the County that they are in substance part of the County’s operations. Therefore, data from these units is combined with data of the primary government. Discretely presented component units, on the other hand, are reported in a separate column in the government-wide financial statements to emphasize they are legally separate from the County. Each blended component unit discussed below has a June 30 year-end. The County has no discretely presented component units.
As the Coconino County Board of Supervisors serves as the Board of Directors of all special districts discussed below, it is able to significantly influence the programs, projects, activities, and level of services provided by the Districts; the Board also establishes policy, appoints management, exercises budgetary control and determines tax rates. Further, the Districts provide services almost entirely for the benefit of the County; therefore, the Districts are considered blended component units of the County. Separate financial statements for the Districts are not available.
58
Coconino County Notes to Financial Statements
June 30, 2016
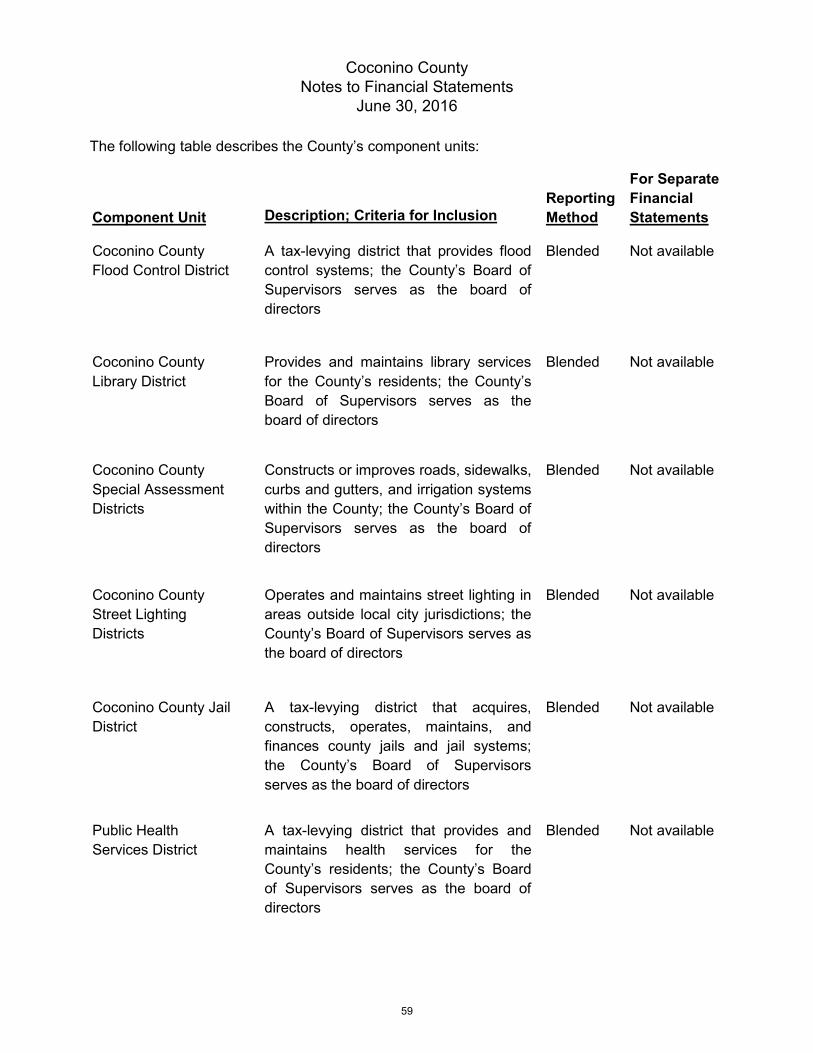
The following table describes the County’s component units:
Component Unit
Description; Criteria for Inclusion
Reporting Method
For Separate Financial Statements
Coconino County Flood Control District
A tax-levying district that provides flood control systems; the County’s Board of Supervisors serves as the board of directors
Blended Not available
Coconino County Library District
Provides and maintains library services for the County’s residents; the County’s Board of Supervisors serves as the board of directors
Blended Not available
Coconino County Special Assessment Districts
Constructs or improves roads, sidewalks, curbs and gutters, and irrigation systems within the County; the County’s Board of Supervisors serves as the board of directors
Blended Not available
Coconino County Street Lighting Districts
Operates and maintains street lighting in areas outside local city jurisdictions; the County’s Board of Supervisors serves as the board of directors
Blended Not available
Coconino County Jail District
A tax-levying district that acquires, constructs, operates, maintains, and finances county jails and jail systems; the County’s Board of Supervisors serves as the board of directors
Blended Not available
Public Health Services District
A tax-levying district that provides and maintains health services for the County’s residents; the County’s Board of Supervisors serves as the board of directors
Blended Not available
59
Coconino County Notes to Financial Statements
June 30, 2016

Related Organization:
The Industrial Development Authority of Coconino County (Authority) is a legally separate entity that was created to assist in the financing of commercial activities, including a health care institution, residential real property for dwelling units located within the County, and industrial park facilities. The Authority fulfills its function through the issuance of tax exempt bonds. The County Board of Supervisors appoints the Authority’s Board of Directors, but cannot remove a member of the Authority’s Board at-will. The Authority’s operations are completely separate from the County and the County is not financially accountable for the Authority. Therefore, the financial activities of the Authority have not been included in the accompanying financial statements.
B. Basis of Presentation The basic financial statements include both government-wide statements and fund financial statements. The government-wide statements focus on the County as a whole, while the fund financial statements focus on major funds. Each presentation provides valuable information that can be analyzed and compared between years and between governments to enhance the information’s usefulness.
Government-wide statements – Provide information about the primary government (the County) and its component units. The statements include a statement of net position and a statement of activities. These statements report the financial activities of the overall government, except for fiduciary activities. Governmental activities generally are financed through taxes and intergovernmental revenues.
A statement of activities presents a comparison between direct expenses and program revenues for each function of the County’s governmental activities. Direct expenses are those that are specifically associated with a program or function, and therefore, are clearly identifiable to a particular function. Program revenues include:
charges to customers or applicants for goods, services, or privileges provided,
operating grants and contributions, and
capital grants and contributions.
Revenues that are not classified as program revenues, including internally dedicated resources and all taxes the County levies or imposes, are reported as general revenues.
Generally, the effect of interfund activity has been eliminated from the government-wide financial statements to minimize the double-counting of internal activities. However, charges for interfund services provided and used are not eliminated if the prices approximate their external exchange values.
60
Coconino County Notes to Financial Statements
June 30, 2016

Fund financial statements – Provide information about the County’s funds, including fiduciary funds and blended component units. Separate statements are presented for the governmental, proprietary, and fiduciary fund categories. The emphasis of fund financial statements is on major governmental funds, each displayed in a separate column. All remaining governmental funds are aggregated and reported as nonmajor funds. Fiduciary funds are aggregated and reported by fund type.
Proprietary fund revenues and expenses are classified as either operating or nonoperating. Operating revenues and expenses generally result from transactions associated with the fund’s principal activity. Accordingly, revenues, such as user charges in which each party receives and gives up essentially equal values are operating revenues. Other revenues, such as investment earnings, result from transactions in which the parties do not exchange equal values and are considered nonoperating revenues along with revenues generated by ancillary activities. Operating expenses include the cost of services, administrative expenses, and depreciation on capital assets.
The County reports the following major governmental funds:
The General Fund is the County’s primary operating fund. It accounts for all financial resources of the general government, except those required to be accounted for in another fund.
The Public Works/HURF Fund is a special revenue fund used to account for highway user fees restricted to the construction, repair, and maintenance of county roads that are funded primarily by a State-shared fuel tax and a County Road Maintenance Sales Tax.
The Jail District Fund is a special revenue fund used to account for jail operations and jail capital improvements that are funded by a one-half cent sales tax.
The Public Health Services District Fund is a special revenue fund used to account for health services for County residents that are funded by a $0.2500 per $100 of assessed valuation property tax, grants and contributions, and charges for services.
The Parks and Open Spaces Tax Projects Fund is a capital projects fund used to account for parks and open space acquisitions and improvements that are funded by collections from a one-eighth cent sales tax and grants. Collections from the one-eighth cent sales tax ceased after September 2014.
The County also reports the following fund types:
The internal service fund accounts for automotive maintenance and operation provided to the County’s departments or to other governments on a cost-reimbursement basis.
The investment trust funds account for pooled and non-pooled assets held and invested by the County Treasurer on behalf of other governmental entities.
61
Coconino County Notes to Financial Statements
June 30, 2016

The agency fund accounts for assets held by the County as an agent for the State and various local governments, and for property taxes collected and distributed to the State, local school districts, community college districts, and special districts.
C. Basis of Accounting The government-wide, proprietary fund, and fiduciary fund financial statements are presented using the economic resources measurement focus and the accrual basis of accounting. The agency funds are custodial in nature and do not have a measurement focus but utilize the accrual basis of accounting for reporting its assets and liabilities. Revenues are recorded when earned and expenses are recorded at the time liabilities are incurred, regardless of when the related cash flows take place. Property taxes are recognized as revenue in the year for which they are levied. Grants and donations are recognized as revenue as soon as all eligibility requirements the provider imposed have been met.
Under the terms of grant agreements, the County funds certain programs by a combination of grants and general revenues. Therefore, when program expenses are incurred, there are both restricted and unrestricted resources available to finance the program. The County applies grant resources to such programs before using general revenues.
Governmental funds in the fund financial statements are reported using the current financial resources measurement focus and the modified accrual basis of accounting. Under this method, revenues are recognized when they become both measurable and available. The County considers all revenues reported in the governmental funds to be available if the
revenues are collected within 60 days after year-end. Tax revenues collected within 60 days after year-end are accrued as the County had a claim to those revenues at year-end. Other revenues, including grants from federal and state governments, are considered available if collected within 90 days if the County has a claim to the revenues, and the amount is measurable and available to pay liabilities of the current period. The County’s major revenue sources that are subject to accrual are state-shared sales taxes and fuel taxes, county sales taxes, property taxes, and grants from the federal and state governments. Expenditures are recorded when the related fund liability is incurred, except for principal and interest on general long-term debt, claims and judgments, and compensated absences, which are recognized as expenditures to the extent they are due and payable. General capital asset acquisitions are reported as expenditures in governmental funds. Issuances of general long-term debt and acquisitions under capital lease agreements are reported as other financing sources.
D. Cash and Investments For the statement of cash flows, the County’s cash and cash equivalents are considered to be cash on hand, demand deposits, cash on deposit with the County Treasurer, highly liquid investments with a maturity of three months or less when purchased, and investments that may be called by the Treasurer at any time without penalty.
62
Coconino County Notes to Financial Statements
June 30, 2016

Nonparticipating interest-earning investment contracts are stated at cost. Money market investments and participating interest-earning investment contracts with a remaining maturity of one year or less at time of purchase that are not in the County Treasurer's investment pool are stated at amortized cost. Tuba City Unified School District bonds are stated at amortized cost. All other investments are stated at fair value.
E. Inventories Inventories in the government-wide and the proprietary fund’s financial statements are recorded as assets when purchased and expensed when consumed. These inventories are stated at cost using the first-in, first-out, and moving weighted average methods of valuation for the government-wide financial statements, and the weighted average method of valuation for the proprietary fund’s financial statement.
The County accounts for its inventories in the governmental funds using the consumption method. Inventories of the governmental funds are recorded as assets when purchased and expensed when consumed. Amounts on hand at year-end are shown on the balance sheet as an asset and as nonspendable fund balance to indicate that they do not constitute “available spendable resources.” These inventories are stated at cost using the first-in, first-out method of valuation.
F. Prepaid Items
Certain payments to vendors reflect costs applicable to future accounting periods and are recorded as prepaid items in both the government-wide and fund financial statements. Amounts on hand at year-end are shown on the balance sheet as an asset and as nonspendable fund balance to indicate that they do not constitute “available spendable resources.”
G. Property Tax Calendar
The County levies real and personal property taxes on or before the third Monday in August that become due and payable in two equal installments. The first installment is due on the first day of October and becomes delinquent after the first business day of November. The second installment is due on the first day of March of the next year and becomes delinquent after the first business day of May.
A lien assessed against real and personal property attaches on the first day of January preceding assessment and levy.
63
Coconino County Notes to Financial Statements
June 30, 2016

H. Capital Assets
Capital assets are reported at actual cost or estimated historical cost if historical records are not available. Donated assets are reported at acquisition value.
Capitalization thresholds (the dollar values above which asset acquisitions are added to the capital asset accounts), depreciation methods, and estimated useful lives of capital assets reported in the government-wide and proprietary fund’s statements are as follows:
I. Deferred Outflows and Inflows of Resources
The statement of net position and balance sheet include separate sections for deferred outflows of resources and deferred inflows of resources. Deferred outflows of resources represent a consumption of net position that applies to future periods that will be recognized as an expense or expenditure in future periods. Deferred inflows of resources represent an acquisition of net position or fund balance that applies to future periods and will be recognized as a revenue in future periods.
J. Pensions
For purposes of measuring the net pension liability, deferred outflows of resources and deferred inflows of resources related to pensions, and pension expense, information about the pension plan’s fiduciary net position and additions to/deductions from the plan’s fiduciary net position have been determined on the same basis as they are reported by the plan. For this purpose, benefit payments (including refunds of employee contributions) are recognized when due and payable in accordance with the benefit terms. Investments are reported at fair value.
K. Fund Balance Classifications The governmental funds’ fund balances are reported separately within classifications based on a hierarchy of the constraints placed on those resources’ use. The classifications are based on the relative strength of the constraints that control how the specific amounts can be spent. The classifications are nonspendable, restricted, and unrestricted, which includes committed, assigned, and unassigned fund balance classifications.
Capitalization Threshold
Depreciation Method
Estimated Useful Life
Land All N/A N/AConstruction in progress $5,000 N/A N/ABuildings and other improvements 5,000 Straight-Line 5-50 YearsMachinery and equipment 5,000 Straight-Line 3-40 YearsInfrastructure 5,000 Straight-Line 7-50 Years
64
Coconino County Notes to Financial Statements
June 30, 2016

The nonspendable fund balance classification includes amounts that cannot be spent because they are either not in spendable form, such as inventories, or are legally or contractually required to be maintained intact. Restricted fund balances are those that have externally imposed restrictions on their usages by creditors (such as through debt covenants), grantors, contributors, or laws and regulations.
The unrestricted fund balance category is comprised of committed, assigned, and unassigned resources. Committed fund balances are self-imposed limitations that the County’s Board of Supervisors approved, which is the highest level of decision-making authority within the County. Only the Board can remove or change the constraints placed on committed fund balances.
Assigned fund balances are resources constrained by the County’s intent to be used for specific purposes, but that are neither restricted nor committed. The Board of Supervisors has authorized the County Manager to assign resources for a specific purpose.
The unassigned fund balance is the residual classification for the General Fund and includes all spendable amounts not reported in the other classifications. Also, deficits in fund balances of the other governmental funds are reported as unassigned.
When an expenditure is incurred that can be paid from either restricted or unrestricted fund balances, the County will use restricted fund balance first. The County has no formal policy as to its disbursing of unrestricted fund balances.
L. Investment Earnings Investment earnings is composed of interest, dividends, and net changes in the fair value of applicable investments.
M. Compensated Absences
Compensated absences payable consist of vacation leave, compensatory time, and a calculated amount of sick leave employees earned based on services already rendered.
Employees may accumulate up to 240 hours of vacation depending on years of service, but they forfeit any unused vacation hours in excess of the maximum amount. Upon terminating employment, the County pays all unused and unforfeited vacation benefits to employees. Any unused vacation hours in excess of the maximum amount at fiscal year-end is forfeited. Accordingly, vacation benefits are accrued as a liability in the government-wide and proprietary fund’s financial statements.
Non-exempt, eligible employees may accumulate up to 80 hours of compensatory time. Accruals beyond 80 hours require approval of the Human Resources director. The Fair Labor Standards Act requires the payoff of any compensatory time balance above 240 hours for most non-exempt positions and 480 hours for public safety positions. This is done periodically throughout the year. Upon termination, all unused compensatory time is paid to
65
Coconino County Notes to Financial Statements
June 30, 2016

the employee. Accordingly, compensatory time is accrued as a liability in the government-wide and proprietary fund’s financial statements.
Employees may accumulate up to 1,040 hours of sick leave. Generally, sick leave benefits provide for ordinary sick pay and are cumulative but employees forfeit them upon terminating employment. However, for employees who terminate with a minimum of 20 years of continuous service, sick leave benefits do vest. Such eligible terminating employees are compensated at the rate of one day for each four sick days accrued. Accordingly, this vested sick leave is accrued as a liability in the government-wide and proprietary fund’s financial statements.
NOTE 2 – DEPOSITS AND INVESTMENTS
Arizona Revised Statutes (A.R.S.) authorize the County Treasurer to invest public monies in securities and deposits with a maximum maturity of five years. All public monies shall be invested in eligible investments, including: the State Treasurer’s investment pool; obligations issued or guaranteed by the United States or any of the senior debt of its agencies, sponsored agencies, corporations, sponsored corporations, or instrumentalities; specified state and local government bonds, notes, and other evidences of indebtedness including those of counties, incorporated cities or towns, school districts or special taxing districts, including registered warrants; interest-earning investments such as savings accounts, certificates of deposit, and repurchase agreements in eligible depositories; commercial paper of prime quality issued by corporations organized and doing business in the United States; specified bonds, debentures, notes, and other evidences of indebtedness that are denominated in United States dollars and certain open-end and closed-end mutual funds, including exchange traded funds. In addition, the County Treasurer may invest trust funds in certain fixed income securities of corporations doing business in the United States or District of Columbia.
Credit risk
Statutes have the following requirements for credit risk:
1. Commercial paper must be of prime quality and be rated within the top two ratings by a nationally recognized rating agency.
2. Bonds, debentures, notes, and other evidences of indebtedness that are denominated in United States dollars must be rated “A” or better at the time of purchase by at least two nationally recognized rating agencies.
3. Fixed income securities must carry one of the two highest ratings by Moody’s Investors Service and Standard and Poor’s rating service. If only one of the above-mentioned services rates the security, it must carry the highest rating of that service.
66
Coconino County Notes to Financial Statements
June 30, 2016

Custodial credit risk
The Arizona State Treasurer’s Office administers a State Wide Pooled Collateral Program. The purpose of the Pooled Collateral Program is to ensure all taxpayer funds on deposit with any federally insured depository in excess of any insurance is backed with 102% of eligible collateral and provide an efficient means for eligible depositories to aggregate collateral for public deposits. Under the Pooled Collateral Program, each financial institution with public deposits pledges a pool of collateral against all of the public deposits it holds for the state and local governments of the State of Arizona except as provided by law. That collateral is pledged to the pooled collateral administrator who is responsible for monitoring the collateral on behalf of all public depositors. The Pooled Collateral Administrator (“Administrator”) is established in the Arizona State Treasurer’s Office and may adopt and enforce policies and procedures as necessary to carry out its duties pursuant to A.R.S. §35-1202 et seq. The Administrator is responsible for ensuring that eligible depositories have posted 102% collateral for each public depositor in excess of any federally insured deposits. Coconino County’s deposits are covered under the State Wide Pooled Collateral Program.
Concentration of credit risk
Statutes do not include any requirements for concentration of credit risk.
Interest rate risk
Statutes require that public monies invested in securities and deposits have a maximum maturity of 5 years. The maximum maturity for investments in repurchase agreements is 180 days.
Foreign currency risk
Statutes do not allow foreign investments unless the investment is denominated in United States dollars.
Deposits – At June 30, 2016, the carrying amount of the County’s deposits was $40,311,383 and the bank balance was $46,810,066. The County does not have a formal policy with respect to custodial credit risk. The County adheres to the custodial credit risk requirements in Statutes.
67
Coconino County Notes to Financial Statements
June 30, 2016

Investments – The County’s investments at June 30, 2016, categorized within the fair value hierarchy established by generally accepted accounting principles, were as follows:
Investments categorized as Level 1 are valued using prices quoted in active markets for those investments.
The investments categorized as Level 2 of the fair value hierarchy are valued using a matrix pricing technique. Matrix pricing is used to value securities based on the securities’ relationship to benchmark quoted prices.
Investments in the State Treasurer’s investment pool are valued at the pool’s share price multiplied by the number of shares the County held. The fair value of a participant’s position in the pool approximates the value of that participant’s pool shares. The State Board of Investment provides oversight for the State Treasurer’s investment pools.
Investments measured at amortized cost consist of school improvement bonds issued by the Tuba City Unified School District to the Coconino County Treasurer.
Fair value measurement usingQuoted prices in active markets
for identical assets
Significant other
observable inputs
Significant unobservable
inputs
(Level 1) (Level 2) (Level 3)Investment by fair value level AmountU.S. agency securities 99,884,543$ 99,884,543$ Corporate bonds 33,392,223 33,392,223 Commercial paper 15,659,257 15,659,257 Municipal bonds 12,407,455 12,407,455 Negotiable CDs 8,739,005 8,739,005 Mutual funds-debt 457,572 457,572Mutual funds-equity 206,886 206,886Money market mutual funds 95,714 95,714$
Total investment by fair value level 170,842,655$ 760,172$ 170,082,483$
External investment pools measured at fair valueState Treasurer's investment pool #7 2,655,699$
Total investment measured at fair value 2,655,699$
Investments measured at amortized costMunicipal bonds 2,084,709$
Total investment measured at amortized cost 2,084,709$
Total investments 175,583,063$
68
Coconino County Notes to Financial Statements
June 30, 2016
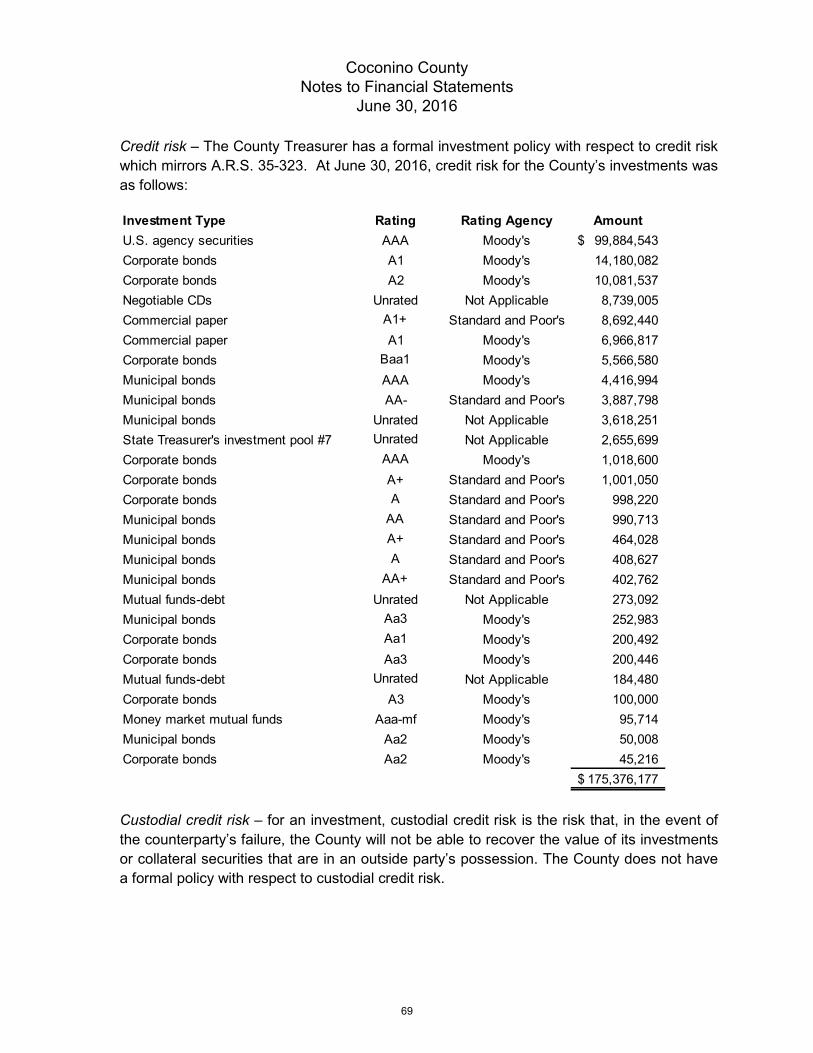
Credit risk – The County Treasurer has a formal investment policy with respect to credit risk which mirrors A.R.S. 35-323. At June 30, 2016, credit risk for the County’s investments was as follows:
Custodial credit risk – for an investment, custodial credit risk is the risk that, in the event of the counterparty’s failure, the County will not be able to recover the value of its investments or collateral securities that are in an outside party’s possession. The County does not have a formal policy with respect to custodial credit risk.
Investment Type Rating Rating Agency AmountU.S. agency securities AAA Moody's 99,884,543$ Corporate bonds A1 Moody's 14,180,082 Corporate bonds A2 Moody's 10,081,537 Negotiable CDs Unrated Not Applicable 8,739,005 Commercial paper A1+ Standard and Poor's 8,692,440 Commercial paper A1 Moody's 6,966,817 Corporate bonds Baa1 Moody's 5,566,580 Municipal bonds AAA Moody's 4,416,994 Municipal bonds AA- Standard and Poor's 3,887,798 Municipal bonds Unrated Not Applicable 3,618,251 State Treasurer's investment pool #7 Unrated Not Applicable 2,655,699 Corporate bonds AAA Moody's 1,018,600 Corporate bonds A+ Standard and Poor's 1,001,050 Corporate bonds A Standard and Poor's 998,220 Municipal bonds AA Standard and Poor's 990,713 Municipal bonds A+ Standard and Poor's 464,028 Municipal bonds A Standard and Poor's 408,627 Municipal bonds AA+ Standard and Poor's 402,762 Mutual funds-debt Unrated Not Applicable 273,092 Municipal bonds Aa3 Moody's 252,983 Corporate bonds Aa1 Moody's 200,492 Corporate bonds Aa3 Moody's 200,446 Mutual funds-debt Unrated Not Applicable 184,480 Corporate bonds A3 Moody's 100,000 Money market mutual funds Aaa-mf Moody's 95,714 Municipal bonds Aa2 Moody's 50,008 Corporate bonds Aa2 Moody's 45,216
175,376,177$
69
Coconino County Notes to Financial Statements
June 30, 2016
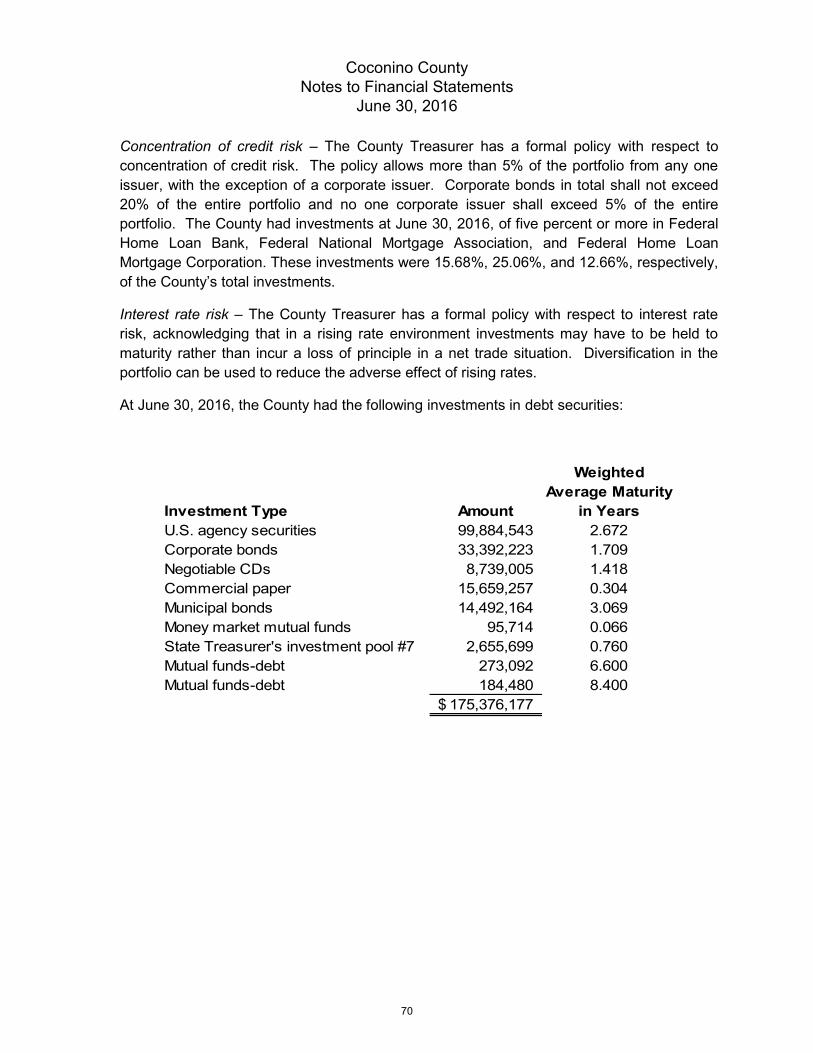
Concentration of credit risk – The County Treasurer has a formal policy with respect to concentration of credit risk. The policy allows more than 5% of the portfolio from any one issuer, with the exception of a corporate issuer. Corporate bonds in total shall not exceed 20% of the entire portfolio and no one corporate issuer shall exceed 5% of the entire portfolio. The County had investments at June 30, 2016, of five percent or more in Federal Home Loan Bank, Federal National Mortgage Association, and Federal Home Loan Mortgage Corporation. These investments were 15.68%, 25.06%, and 12.66%, respectively, of the County’s total investments.
Interest rate risk – The County Treasurer has a formal policy with respect to interest rate risk, acknowledging that in a rising rate environment investments may have to be held to maturity rather than incur a loss of principle in a net trade situation. Diversification in the portfolio can be used to reduce the adverse effect of rising rates.
At June 30, 2016, the County had the following investments in debt securities:
Investment Type Amount
Weighted Average Maturity
in YearsU.S. agency securities 99,884,543 2.672Corporate bonds 33,392,223 1.709Negotiable CDs 8,739,005 1.418Commercial paper 15,659,257 0.304Municipal bonds 14,492,164 3.069Money market mutual funds 95,714 0.066State Treasurer's investment pool #7 2,655,699 0.760Mutual funds-debt 273,092 6.600Mutual funds-debt 184,480 8.400
175,376,177$
70
Coconino County Notes to Financial Statements
June 30, 2016

A reconciliation of cash, deposits, and investments to amounts shown on the Statements of Net Position follows:
NOTE 3 – RECEIVABLES Due from other governments – Amounts due from other governments at June 30, 2016, include $3,618,367 and $1,810,476 in state-shared revenue from sales taxes and fuel taxes, respectively; $259,053 from the State of Arizona for state vehicle license tax; $2,679,725 in county sales tax; $1,360,625 in grants from the federal government; $695,905 in grants from various state agencies; and $3,429 in reimbursements from the Arizona Department of Emergency Management. The remaining balance of $1,733,814 is composed of miscellaneous receivables from federal, state, and local government.
Cash, deposits, and investments:Cash on hand 121,644$ Amount of deposits 40,311,383 Amount of investments 175,583,063Total 216,016,090$
Governmental Investment AgencyStatement of Net Position: Activities Trust Funds Funds Total
Cash and cash equivalents 90,311,693$ 122,298,508$ 1,706,374$ 214,316,575$ Investments 602,590 602,590 Cash and investments held by trustee(s) 30,209 1,066,716 1,096,925
Total 90,944,492$ 122,298,508$ 2,773,090$ 216,016,090$
71
Coconino County Notes to Financial Statements
June 30, 2016
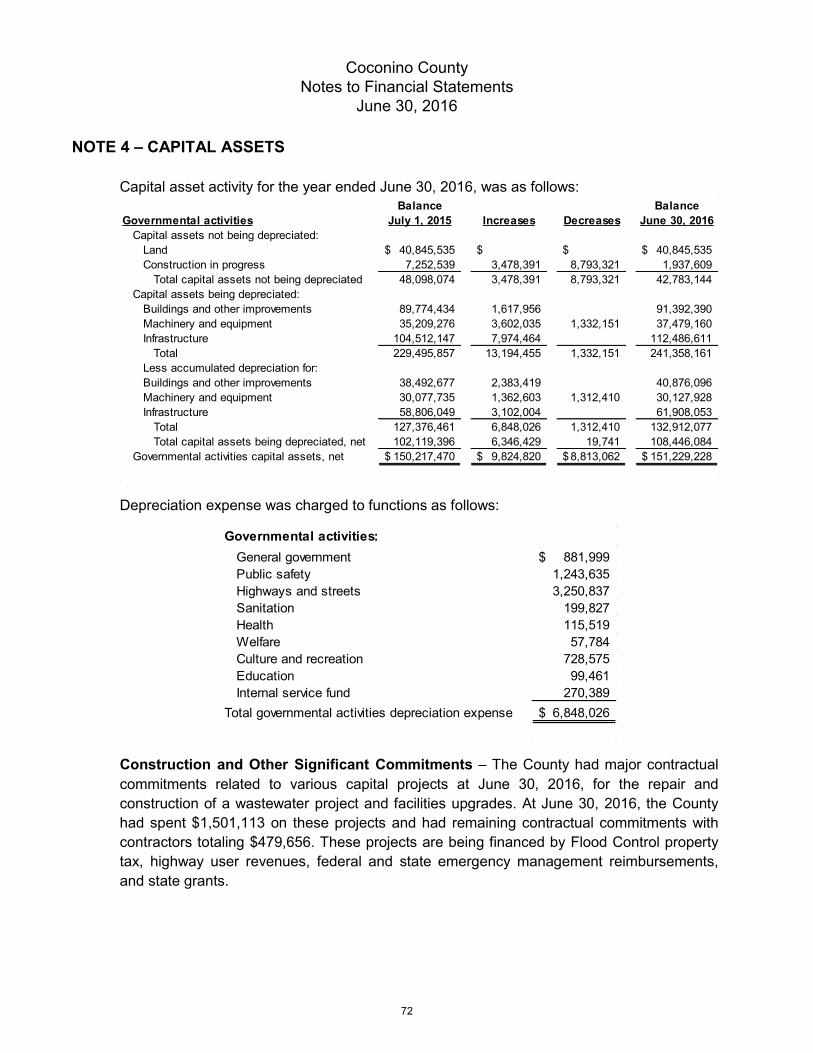
NOTE 4 – CAPITAL ASSETS Capital asset activity for the year ended June 30, 2016, was as follows:
Depreciation expense was charged to functions as follows:
Construction and Other Significant Commitments – The County had major contractual commitments related to various capital projects at June 30, 2016, for the repair and construction of a wastewater project and facilities upgrades. At June 30, 2016, the County had spent $1,501,113 on these projects and had remaining contractual commitments with contractors totaling $479,656. These projects are being financed by Flood Control property tax, highway user revenues, federal and state emergency management reimbursements, and state grants.
Balance BalanceGovernmental activities July 1, 2015 Increases Decreases June 30, 2016
Capital assets not being depreciated:Land 40,845,535$ $ $ 40,845,535$ Construction in progress 7,252,539 3,478,391 8,793,321 1,937,609
Total capital assets not being depreciated 48,098,074 3,478,391 8,793,321 42,783,144 Capital assets being depreciated:
Buildings and other improvements 89,774,434 1,617,956 91,392,390 Machinery and equipment 35,209,276 3,602,035 1,332,151 37,479,160 Infrastructure 104,512,147 7,974,464 112,486,611
Total 229,495,857 13,194,455 1,332,151 241,358,161 Less accumulated depreciation for:Buildings and other improvements 38,492,677 2,383,419 40,876,096 Machinery and equipment 30,077,735 1,362,603 1,312,410 30,127,928 Infrastructure 58,806,049 3,102,004 61,908,053
Total 127,376,461 6,848,026 1,312,410 132,912,077 Total capital assets being depreciated, net 102,119,396 6,346,429 19,741 108,446,084
Governmental activities capital assets, net 150,217,470$ 9,824,820$ 8,813,062$ 151,229,228$
Governmental activities:General government 881,999$ Public safety 1,243,635Highways and streets 3,250,837Sanitation 199,827Health 115,519Welfare 57,784Culture and recreation 728,575Education 99,461Internal service fund 270,389
Total governmental activities depreciation expense 6,848,026$
72
Coconino County Notes to Financial Statements
June 30, 2016

NOTE 5 – LONG-TERM LIABILITIES
The following schedule details the County’s long-term liability and obligation activity for the year ended June 30, 2016:
Special Assessment Bonds – Special assessment bonds are secured by pledges of revenues from special assessments levied against the benefiting property owners. Proceeds from special assessment bonds are used for improvements such as paving, street lighting, and sewers. The special assessment districts pledged these assessments to repay the principal amount of $795,000 in special assessment debt. Payment made by the assessed property owners are 100 percent pledged to pay the scheduled principal and interest payments on special assessment bonds. In the event of default by the property owner, the lien created by the assessment is sold at public auction and the proceeds are used to offset the default assessment. At June 30, 2016, future pledged revenues through final maturity at July 1, 2019 totaled $286,850 consisting of $260,000 for principal and $26,850 for interest. Future principal and interest payments are expected to require 100 percent of pledged special assessment revenues. Principal and interest paid for the current year and total current year special assessment revenues were $103,128 and $57,851, respectively. While there is no legal obligation for the County to further secure the special assessment debt of the districts below, the County has made a moral commitment to take steps necessary to prevent default.
The following special assessment bonds were outstanding at June 30, 2016:
Governmental ActivitiesBalance
July 1, 2015 Additions ReductionsBalance
June 30, 2016Due within
1 year
Bonds payable:Special assessment bonds with governmental commitment 345,131$ $ 85,131$ 260,000$ 89,000$ Total bonds payable 345,131 85,131 260,000 89,000
Capital lease payable 90,011 22,244 67,767 29,869 Net pension liability (Note 9) 110,838,473 33,731,088 28,506,941 116,062,620 Compensated absences payable 4,840,736 3,474,879 3,246,889 5,068,726 3,394,113 Claims and judgments payable 692,902 156,144 201,935 647,111 134,410 Future postemployment health
benefit liability (Note 9) 6,331,584 895,123 395,125 6,831,582 Total Governmental activities long-term liabilities 123,048,826$ 38,347,245$ 32,458,265$ 128,937,806$ 3,647,392$
DescriptionOriginalAmount
MaturityDate
InterestRates
OutstandingPrincipal
Special assessment bonds with governmental commitment 795,000$ July 1, 2019 4.90-5.65% 260,000$
73
Coconino County Notes to Financial Statements
June 30, 2016

The following schedule details debt service requirements to maturity for the County’s special assessment bonds payable at June 30, 2016:
Capital Lease – The County has acquired equipment under the provisions of a long-term lease agreement classified as a capital lease for accounting purposes because it provides for transfer of ownership by the end of the lease term. The following assets were acquired through capital lease:
Governmental activities
Machinery and equipment 70,762 Less: accumulated depreciation 17,691 Carrying value 53,071
The following schedule details debt service requirements to maturity for the County’s capital lease payable at June 30, 2016:
The present value of net minimum lease payments at June 30, 2016, of $67,767 exceeds the total capital assets of $53,071 because a portion of the assets acquired through the capital lease are for computer related equipment that is below the County’s capitalization threshold. Insurance Claims – The County provides life, health and disability benefits to its employees and their dependents through the Northern Arizona Public Employee Benefit Trust (Trust),
YearEndingJune 30 Principal Interest
2017 89,000 13,700 2018 94,000 9,039 2019 77,000 4,111 Total 260,000$ 26,850$
Governmental Activities
Special Assessment Bonds
Governmental activities
Year ending June 302017 30,593 2018 30,593 2019 7,648
Total minimum lease payments 68,834 Less amount representing interest 1,067 Present value of net minimum lease payments 67,767
74
Coconino County Notes to Financial Statements
June 30, 2016
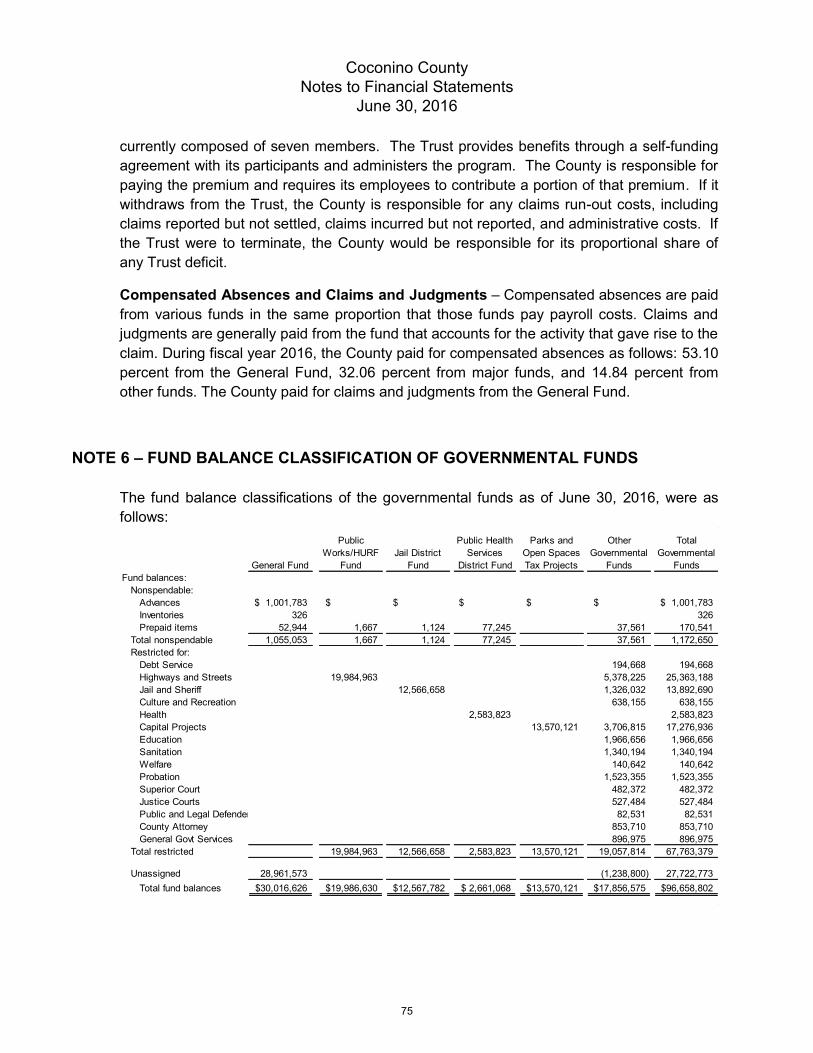
currently composed of seven members. The Trust provides benefits through a self-funding agreement with its participants and administers the program. The County is responsible for paying the premium and requires its employees to contribute a portion of that premium. If it withdraws from the Trust, the County is responsible for any claims run-out costs, including claims reported but not settled, claims incurred but not reported, and administrative costs. If the Trust were to terminate, the County would be responsible for its proportional share of any Trust deficit.
Compensated Absences and Claims and Judgments – Compensated absences are paid from various funds in the same proportion that those funds pay payroll costs. Claims and judgments are generally paid from the fund that accounts for the activity that gave rise to the claim. During fiscal year 2016, the County paid for compensated absences as follows: 53.10 percent from the General Fund, 32.06 percent from major funds, and 14.84 percent from other funds. The County paid for claims and judgments from the General Fund.
NOTE 6 – FUND BALANCE CLASSIFICATION OF GOVERNMENTAL FUNDS The fund balance classifications of the governmental funds as of June 30, 2016, were as follows:
General Fund
Public Works/HURF
FundJail District
Fund
Public Health Services
District Fund
Parks and Open Spaces Tax Projects
Other Governmental
Funds
Total Governmental
FundsFund balances:
Nonspendable:Advances 1,001,783$ $ $ $ $ $ 1,001,783$ Inventories 326 326 Prepaid items 52,944 1,667 1,124 77,245 37,561 170,541
Total nonspendable 1,055,053 1,667 1,124 77,245 37,561 1,172,650 Restricted for:
Debt Service 194,668 194,668Highways and Streets 19,984,963 5,378,225 25,363,188Jail and Sheriff 12,566,658 1,326,032 13,892,690Culture and Recreation 638,155 638,155Health 2,583,823 2,583,823Capital Projects 13,570,121 3,706,815 17,276,936Education 1,966,656 1,966,656Sanitation 1,340,194 1,340,194Welfare 140,642 140,642Probation 1,523,355 1,523,355Superior Court 482,372 482,372Justice Courts 527,484 527,484Public and Legal Defenders 82,531 82,531County Attorney 853,710 853,710General Govt Services 896,975 896,975
Total restricted 19,984,963 12,566,658 2,583,823 13,570,121 19,057,814 67,763,379
Unassigned 28,961,573 (1,238,800) 27,722,773 Total fund balances 30,016,626$ 19,986,630$ 12,567,782$ 2,661,068$ 13,570,121$ 17,856,575$ 96,658,802$
75
Coconino County Notes to Financial Statements
June 30, 2016

NOTE 7 – STEWARDSHIP, COMPLIANCE, AND ACCOUNTABILITY At June 30, 2016, the following nonmajor governmental fund reported a deficit in fund balance.
The fund balance deficit for the Emergency Services Grants Fund resulted from operations during the year and is expected to be corrected during normal operations in fiscal year 2017. The Flood Control District expenditures exceeded revenue in FY16 in a planned effort to finalize flood control projects from recent major flooding incidents, including the Slide and Schultz Floods. In FY17 the Flood Control District will limit expenditures to project planning efforts for future fiscal year implementation. This will allow the annual Flood Control District property tax levy in the amount of $ 2,490,852 to cover the deficit and build a fund balance for future use.
NOTE 8 – RISK MANAGEMENT The County is exposed to various risks of loss related to torts; theft of, damage to and destruction of assets; errors and omissions; injuries to employees and others; and natural disasters. These risks of loss are accounted for and financed by the following described insurance coverage and internal risk management program.
The County contracts with CopperPoint Mutual Insurance Company to meet Arizona statutory requirements on workers compensation coverage for its elected officials, employees, and volunteers. There is no deductible associated with this coverage and no loss limit per claim. The employer’s liability section of our workers’ compensation policy is insured with coverage limits at the $1,000,000 level. There have been no claims against our employer’s liability to date.
The County also purchases coverage from insurers for property insurance, commercial general liability, public official errors and omissions liability, law enforcement liability, employment practices liability, employee benefits liability, automobile liability and physical damage, healthcare professional liability, cyber liability, environmental impairment liability, and non-owned aircraft liability. The County self-insures liability claims for the first $125,000 with the exception of a few specialty lines noted here after. The County self- insures environmental liability claims for the first $50,000 and healthcare professional liability for the first $100,000. There is a $25,000 deductible for cyber liability, and also a $25,000
Fund DeficitGovernmental Funds:
Emergency Services Grants 139,668$ Flood Control District Fund 1,099,132
1,238,800$
76
Coconino County Notes to Financial Statements
June 30, 2016

deductible for automobile physical damage. A self-insurance retention fund has been established for these losses. There is no self-insured retention or deductible on our non-owned aircraft liability policy.
The County carries excess layers of liability with a combined limit of $30,000,000 over our basic individual $1,000,000 liability limits for commercial general liability, public official errors and omissions liability, law enforcement liability, employment practices liability, employee benefits liability, and automobile liability. We carry a separate $5,000,000 on professional healthcare liability, $2,000,000 on cyber liability, $1,000,000 on environmental impairment liability, and $5,000,000 on non- owned aircraft liability which are not included in our excess liability insurance coverage.
For real property and business personal property damage coverage the County has a $25,000 deductible with blanket coverage up to the property values insured on a replacement cost basis on the special property form. This property insurance includes flood with a $5,000,000 sublimit and a $100,000 deductible for most properties. Two locations are listed with higher deductibles of $250,000 and $500,000 for flood insurance. Our property insurance also includes coverage for earthquake with a $5,000,000 sublimit and a $100,000 deductible. Crime coverage is carried at a limit of $1,000,000 with a $25,000 deductible. Settled claims have not exceeded commercial insurance coverage for any of the past three fiscal years.
NOTE 9 – PENSIONS AND OTHER POSTEMPLOYMENT BENEFITS
The County contributes to the plans described below. The plans are component units of the State of Arizona.
At June 30, 2016, the County reported the following aggregate amounts related to pensions for all plans to which it contributes:
Statement of Net Position and Statement of Activities
Governmental Activities
Net pension liabilities $116,062,620
Deferred outflows of resources 26,733,586
Deferred inflows of resources 7,124,795
Pension expense 12,007,885
The County’s accrued payroll and employee benefits includes $52,643 of outstanding pension contribution amounts payable to all pension plans for the year ended June 30,
77
Coconino County Notes to Financial Statements
June 30, 2016

2016. Also, the County reported $17,853,910 of pension contributions as expenditures in the governmental funds related to all pension plans to which it contributes.
A. Arizona State Retirement System
Plan description – County employees not covered by the other pension plans described below participate in the Arizona State Retirement System (ASRS). The ASRS administers a cost-sharing, multiple-employer defined benefit pension plan, a cost-sharing, multiple-employer defined benefit health insurance premium benefit (OPEB) plan, and a cost-sharing, multiple-employer defined benefit long-term disability (OPEB) plan. The Arizona State Retirement System Board governs the ASRS according to the provisions of A.R.S. Title 38, Chapter 5, Articles 2 and 2.1. The ASRS issues a publicly available financial report that includes its financial statements and required supplementary information. The report is available on its website at www.azasrs.gov.
Benefits provided – The ASRS provides retirement, health insurance premium supplement, long-term disability, and survivor benefits. State statute establishes benefit terms. Retirement benefits are calculated on the basis of age, average monthly compensation, and service credit as follows:
ASRS Retirement Initial membership date:
Before July 1, 2011 On or after July 1, 2011 Years of service and age required to receive benefit
Sum of years and age equals 80 10 years, age 62 5 years, age 50*
any years, age 65
30 years, age 55 25 years, age 60 10 years, age 62 5 years, age 50*
any years, age 65 Final average salary is based on
Highest 36 consecutive months of last 120 months
Highest 60 consecutive months
of last 120 months
Benefit percent per year of service
2.1% to 2.3% 2.1% to 2.3%
*With actuarially reduced benefits.
Retirement benefits for members who joined the ASRS prior to September 13, 2013, are subject to automatic cost-of-living adjustments based on excess investment earning. Members with a membership date on or after September 13, 2013, are not eligible for cost-of-living adjustments. Survivor benefits are payable upon a member’s death. For retired members, the retirement benefit option chosen determines the survivor benefit. For all other members, the beneficiary is entitled to the member’s account balance that includes the member’s contributions and employer’s contributions, plus interest earned.
78
Coconino County Notes to Financial Statements
June 30, 2016

Contributions – In accordance with state statutes, annual actuarial valuations determine active member and employer contribution requirements. The combined active member and employer contribution rates are expected to finance the costs of benefits employees earn during the year, with an additional amount to finance any unfunded accrued liability. For the year ended June 30, 2016, active ASRS members were required by statute to contribute at the actuarially determined rate of 11.47 percent (11.35 percent for retirement and 0.12 percent for long-term disability) of the members’ annual covered payroll, and the County was required by statute to contribute at the actuarially determined rate of 11.47 percent (10.85 percent for retirement, 0.50 percent for health insurance premium benefit, and 0.12 percent for long-term disability) of the active members’ annual covered payroll. In addition, the County was required by statute to contribute at the actuarially determined rate of 9.36 percent (9.17 percent for retirement, 0.13 percent for health insurance premium benefit, and 0.06 percent for long-term disability) of annual covered payroll of retired members who worked for the County in positions that would typically be filled by an employee who contributes to the ASRS. The County’s contributions to the pension plan for the year ended June 30, 2016, were $4,071,019. The County’s contributions for the current and 2 preceding years for OPEB, all of which were equal to the required contributions, were as follows:
During fiscal year 2016, the County paid for ASRS pension and OPEB contributions as follows: 54.9 percent from the General Fund, 32.0 percent from major funds, and 13.1 percent from other funds.
Pension liability – At June 30, 2016, the County reported a liability of $61,051,275 for its proportionate share of the ASRS’ net pension liability. The net pension liability was measured as of June 30, 2015. The total pension liability used to calculate the net pension liability was determined using update procedures to roll forward the total pension liability from an actuarial valuation as of June 30, 2014, to the measurement date of June 30, 2015. The County’s proportion of the net pension liability was based on the County’s actual contributions to the plan relative to the total of all participating employers’ contributions for the year ended June 30, 2015. The County’s proportion measured as of June 30, 2015, was 0.392 percent, which was a decrease of .005 from its proportion measured as of June 30, 2014.
Pension expense and deferred outflows/inflows of resources – For the year ended June 30, 2016, the County recognized pension expense for ASRS of $2,691,574. At June 30, 2016, the County reported deferred outflows of resources and deferred inflows of resources related to pensions from the following sources:
ASRS
Year ended June 30
Health Benefit Supplement
Fund
Long-Term Disability
Fund2016 187,605$ 45,025$ 2015 212,883 43,298 2014 214,717 85,887
79
Coconino County Notes to Financial Statements
June 30, 2016

The $4,071,019 reported as deferred outflows of resources related to ASRS pensions resulting from county contributions subsequent to the measurement date will be recognized as a reduction of the net pension liability in the year ending June 30, 2017. Other amounts reported as deferred outflows of resources and deferred inflows of resources related to ASRS pensions will be recognized in pension expense as follows:
Actuarial Assumptions – The significant actuarial assumptions used to measure the total pension liability are as follows:
Actuarial assumptions used in the June 30, 2014, valuation were based on the results of an actuarial experience study for the 5-year period ended June 30, 2012.
ASRS Deferred Outflows of Resources
Deferred Inflows of Resources
Differences between expected and actual experience $ 1,665,957 $ 3,199,148 Net difference between projected and actual earnings on pension plan investments 1,956,558 Changes in proportion and differences between county contributions and proportionate share of contributions 23,168 1,036,900 County contributions subsequent to the measurement date 4,071,019 Total $ 5,760,144 $ 6,192,606
Year ending June 302017 $(1,892,350)2018 (2,556,816)2019 (1,466,704)2020 1,412,389
ASRSActuarial valuation date June 30, 2014Actuarial roll forward date June 30, 2015Actuarial cost method Entry age normalInvestment rate of return 8%Projected salary increases 3 - 6.75%Inflation 3%Permanent benefit increase IncludedMortality rates 1994 GAM Scale BB
80
Coconino County Notes to Financial Statements
June 30, 2016
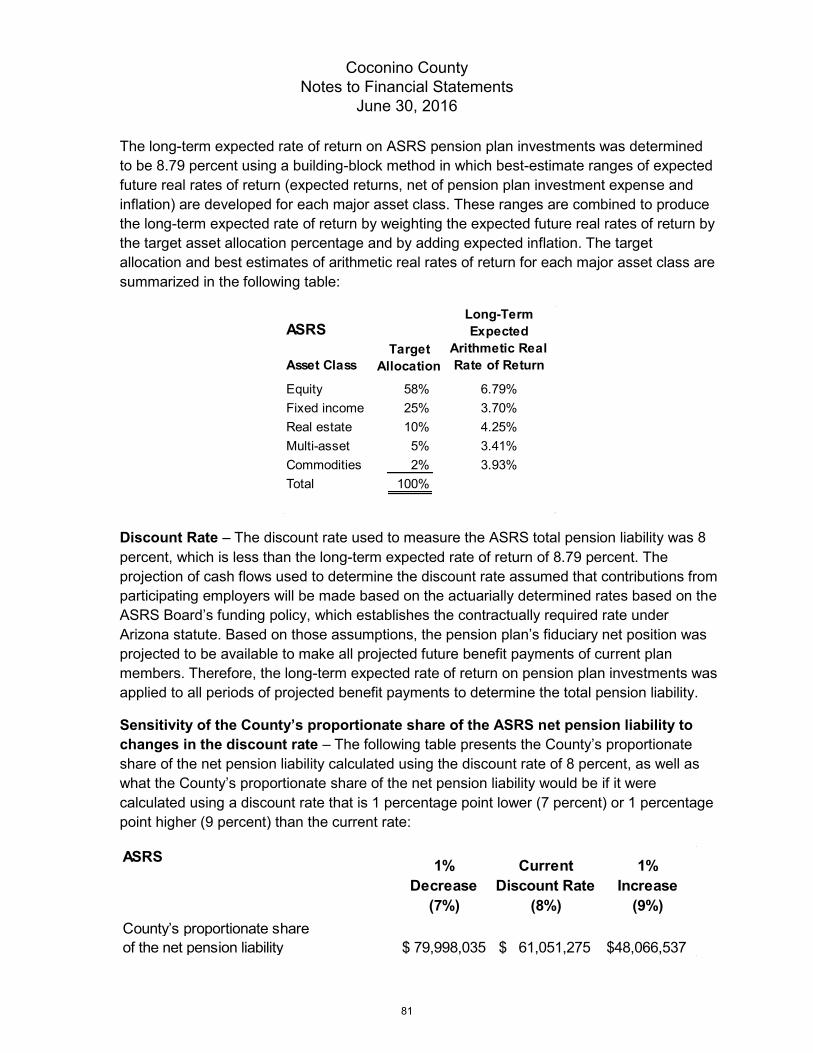
The long-term expected rate of return on ASRS pension plan investments was determined to be 8.79 percent using a building-block method in which best-estimate ranges of expected future real rates of return (expected returns, net of pension plan investment expense and inflation) are developed for each major asset class. These ranges are combined to produce the long-term expected rate of return by weighting the expected future real rates of return by the target asset allocation percentage and by adding expected inflation. The target allocation and best estimates of arithmetic real rates of return for each major asset class are summarized in the following table:
Discount Rate – The discount rate used to measure the ASRS total pension liability was 8 percent, which is less than the long-term expected rate of return of 8.79 percent. The projection of cash flows used to determine the discount rate assumed that contributions from participating employers will be made based on the actuarially determined rates based on the ASRS Board’s funding policy, which establishes the contractually required rate under Arizona statute. Based on those assumptions, the pension plan’s fiduciary net position was projected to be available to make all projected future benefit payments of current plan members. Therefore, the long-term expected rate of return on pension plan investments was applied to all periods of projected benefit payments to determine the total pension liability.
Sensitivity of the County’s proportionate share of the ASRS net pension liability to changes in the discount rate – The following table presents the County’s proportionate share of the net pension liability calculated using the discount rate of 8 percent, as well as what the County’s proportionate share of the net pension liability would be if it were calculated using a discount rate that is 1 percentage point lower (7 percent) or 1 percentage point higher (9 percent) than the current rate:
ASRS
Asset Class
Long-Term Expected
Arithmetic Real Rate of Return
Equity 58% 6.79%Fixed income 25% 3.70%Real estate 10% 4.25%Multi-asset 5% 3.41%Commodities 2% 3.93%Total 100%
Target Allocation
ASRS 1% Decrease
(7%)
Current Discount Rate
(8%)
1%Increase
(9%)County’s proportionate share of the net pension liability $ 79,998,035 $ 61,051,275 $48,066,537
81
Coconino County Notes to Financial Statements
June 30, 2016

Pension plan fiduciary net position – Detailed information about the pension plan’s fiduciary net position is available in the separately issued ASRS financial report.
B. Public Safety Personnel Retirement System and Corrections Officer Retirement Plan
Plan descriptions – County sheriff employees who are regularly assigned hazardous duty participate in the Public Safety Personnel Retirement System (PSPRS). The PSPRS administers an agent multiple-employer defined benefit pension plan and an agent multiple-employer defined benefit health insurance premium benefit (OPEB) plan (agent plans). A seven-member board known as the Board of Trustees and the participating local boards govern the PSPRS according to the provisions of A.R.S. Title 38, Chapter 5, Article 4.
County detention officers and Administrative Office of the Courts (AOC) probation, surveillance, and juvenile detention officers participate in the Corrections Officer Retirement Plan (CORP). The CORP administers an agent multiple-employer defined benefit pension plan and an agent multiple-employer defined benefit health insurance premium benefit (OPEB) plan for county detention officers (agent plans), and a cost-sharing multiple-employer defined benefit pension plan and a cost-sharing multiple-employer defined benefit health insurance premium benefit (OPEB) plan for AOC officers (cost-sharing plans). The PSPRS Board of Trustees and the participating local boards govern CORP according to the provisions of A.R.S. Title 38, Chapter 5, Article 6.
The PSPRS issues a publicly available report that includes financial statements and required supplementary information for the PSPRS and CORP plans. The report is available on the PSPRS website at www.psprs.com.
Benefits provided – The PSPRS and CORP provide retirement, health insurance premium supplement, disability, and survivor benefits. State statute establishes benefit terms. Retirement, disability, and survivor benefits are calculated on the basis of age, average monthly compensation, and service credit as follows:
PSPRS Initial membership date: Before January 1, 2012 On or after January 1, 2012
Retirement and Disability
Years of service and age required to receive benefit
20 years, any age 15 years, age 62
25 years, age 52.5
Final average salary is based on
Highest 36 consecutive months of last 20 years
Highest 60 consecutive months of last 20 years
82
Coconino County Notes to Financial Statements
June 30, 2016

PSPRS Initial membership date: Before January 1, 2012 On or after January 1, 2012
Benefit percent Normal Retirement
50% less 2.0% for each year of credited service less than 20 years OR plus 2.0% to 2.5% for each year
of credited service over 20 years, not to exceed 80%
2.5% per year of credited service, not to exceed 80%
Accidental Disability Retirement
50% or normal retirement, whichever is greater
Catastrophic Disability Retirement
90% for the first 60 months then reduced to either 62.5% or normal retirement, whichever is greater
Ordinary Disability Retirement
Normal retirement calculated with actual years of credited service or 20 years of credited service, whichever is greater, multiplied by years of
credited service (not to exceed 20 years) divided by 20 Survivor Benefit Retired Members 80% to 100% of retired member’s pension benefit Active Members 80% to 100% of accidental disability retirement benefit or 100% of average
monthly compensation if death was the result of injuries received on the job
CORP Initial membership date: Before January 1, 2012 On or after January 1, 2012
Retirement and Disability
Years of service and age required to receive benefit
Sum of years and age equals 80 20 years, any age 10 years, age 62
25 years, age 52.5 10 years, age 62
Final average salary is based on
Highest 36 consecutive months of last 10 years
Highest 60 consecutive months of last 10 years
Benefit percent Normal Retirement
2.0% to 2.5% per year of credited service, not to exceed 80%
Accidental Disability Retirement
50% or normal retirement if more than 20 years of credited service
50% or normal retirement if more than 25 years of credited service
83
Coconino County Notes to Financial Statements
June 30, 2016

CORP Initial membership date: Before January 1, 2012 On or after January 1, 2012
Total and Permanent Disability Retirement
50% or normal retirement if more than 25 years of credited service
Ordinary Disability Retirement
2.5% per year of credited service
Survivor Benefit Retired Members 80% of retired member’s pension benefit Active Members 40% of average monthly compensation or 100% of average monthly
compensation if death was the result of injuries received on the job. If there is no surviving spouse or eligible children, the beneficiary is entitled to 2
times the member’s contributions.
Retirement and survivor benefits are subject to automatic cost-of-living adjustments based on excess investment earning. In addition, from and after December 31, 2015, the Legislature may enact permanent one-time benefit increases after a Joint Legislative Budget Committee analysis of the increase’s effects on the plan. PSPRS also provides temporary disability benefits of 50 percent of the member’s compensation for up to 12 months.
Employees covered by benefit terms – At June 30, 2016, the following employees were covered by the agent pension plans’ benefit terms:
Contributions and annual OPEB cost – State statutes establish the pension contribution requirements for active PSPRS and CORP employees. In accordance with state statutes, annual actuarial valuations determine employer contribution requirements for PSPRS and CORP pension and health insurance premium benefits. The combined active member and employer contribution rates are expected to finance the costs of benefits employees earn during the year, with an additional amount to finance any unfunded accrued liability. Contributions rates for the year ended June 30, 2016, are indicated below. Rates are a percentage of active members’ annual covered payroll.
PSPRS Sheriff
CORP Detention
Inactive employees or beneficiaries currently receiving benefits 52 9
Inactive employees entitled to but not yet receiving benefits 13 54
Active employees 54 93Total 119 156
84
Coconino County Notes to Financial Statements
June 30, 2016

In addition, the County was required by statute to contribute at the actuarially determined rate of 28.62 percent for the PSPRS of annual covered payroll of retired members who worked for the County in positions that would typically be filled by an employee who contributes to the PSPRS.
For the agent plans, the County’s contributions to the pension plan and annual OPEB cost and contributions for the health insurance premium benefit for the year ended June 30, 2016, were:
Pension PSPRS Sheriff
CORP Detention
Contributions made $12,403,682 $378,425 Health Insurance Premium Benefit Annual OPEB cost 23,029 8,162 Contributions made 23,029 8,162
PSPRS Contributions include a voluntary $10 million excess contribution to reduce the unfunded liability.
Contributions to the CORP AOC pension plan for the year ended June 30, 2016, were $642,596. The County’s contributions for the current and 2 preceding years for the CORP AOC OPEB, all of which were equal to the required contributions, were as follows:
During fiscal year 2016, the County paid for PSPRS, CORP, and CORP AOC pension and OPEB contributions as follows: 93.0 percent from the General Fund, 3.0 percent from major funds, and 4.0 percent from other funds.
PSPRSSheriff
CORPDetention
CORPAOC
Active members—Pension 11.65% 8.41% 8.41%County
Pension 75.15% 10.20% 19.10%Health insurance premium benefit 0.72% 0.22% 0.85%
CORP AOC Health
Year ended June 30Insurance
Fund2016 $ 28,597 2015 43,781 2014 39,346
85
Coconino County Notes to Financial Statements
June 30, 2016
Pension liability – At June 30, 2016, the County reported the following net pension liabilities:
Net Pension Liability PSPRS Sheriff $30,388,556 CORP Detention 2,448,767 CORP AOC (County’s proportionate share) 7,590,997 The net pension liabilities were measured as of June 30, 2015, and the total pension liability used to calculate the net pension liability was determined by an actuarial valuation as of that date.
In May 2016 voters approved Proposition 124 that authorized certain statutory adjustments to PSPRS’ automatic cost-of-living adjustments. The statutory adjustments change the basis for future cost-of-living adjustments from excess investment earnings to the change in the consumer price index, limited to a maximum annual increase of 2 percent. The change in the County’s net pension liability as a result of the statutory adjustments is not known.
Pension actuarial assumptions – The significant actuarial assumptions used to measure the total pension liability are as follows:
PSPRS and CORP – Pension Actuarial valuation date June 30, 2015 Actuarial cost method Entry age normal Investment rate of return 7.85% Projected salary increases 4.0%–8.0% for PSPRS and 4.0%–7.25% for CORP Inflation 4.0% Permanent benefit increase Included Mortality rates RP-2000 mortality table (adjusted by 105% for both males
and females)
Actuarial assumptions used in the June 30, 2015, valuation were based on the results of an actuarial experience study for the 5-year period ended June 30, 2011.
The long-term expected rate of return on PSPRS and CORP pension plan investments was determined to be 7.85 percent using a building-block method in which best-estimate ranges of expected future real rates of return (expected returns, net of pension plan investment expenses and inflation) are developed for each major asset class. The target allocation and best estimates of geometric real rates of return for each major asset class are summarized in the following table:
86
Coconino County Notes to Financial Statements
June 30, 2016

PSPRS and CORP
Asset Class Target
Allocation
Long-Term Expected
Geometric Real Rate of Return
Short term investments 2% 0.75% Absolute return 5% 4.11% Risk parity 4% 5.13% Fixed income 7% 2.92% Real assets 8% 4.77% GTAA 10% 4.38% Private equity 11% 9.50% Real estate 10% 4.48% Credit opportunities 13% 7.08% Non-U.S. equity 14% 8.25% U.S. equity 16% 6.23% Total 100%
Pension discount rates – The discount rate used to measure the PSPRS and CORP total pension liabilities was 7.85 percent. The projection of cash flows used to determine the discount rates assumed that plan member contributions will be made at the current contribution rate and that employer contributions will be made at rates equal to the difference between the actuarially determined contribution rate and the member rate. Based on those assumptions, the pension plans’ fiduciary net position was projected to be available to make all projected future benefit payments of current plan members. Therefore, the long-term expected rate of return on pension plan investments was applied to all periods of projected benefit payments to determine the total pension liability.
87
Coconino County Notes to Financial Statements
June 30, 2016

Changes in the Net Pension Liability
PSPRS Sheriff Total
Pension Liability
Plan Fiduciary Net
Position
Net Pension Liability
(a) (b) (a) – (b) Balances at June 30, 2015 39,892,490 9,933,371 29,959,119
Changes for the year:
Service cost 542,285 542,285
Interest on the total pension liability 3,045,276 3,045,276 Differences between expected and actual experience in the measurement of the pension liability
(519,453) (519,453)
Contributions—employer 1,798,480 (1,798,480)Contributions—employee 451,605 (451,605)Net investment income 360,105 (360,105)Benefit payments, including refunds of employee contributions (2,740,615) (2,740,615)
Administrative expense (9,163) 9,163 Other changes 37,644 (37,644)
Net changes 327,493 (101,944) 429,437 Balances at June 30, 2016 40,219,983 9,831,427 30,388,556
Increase (Decrease)
88
Coconino County Notes to Financial Statements
June 30, 2016
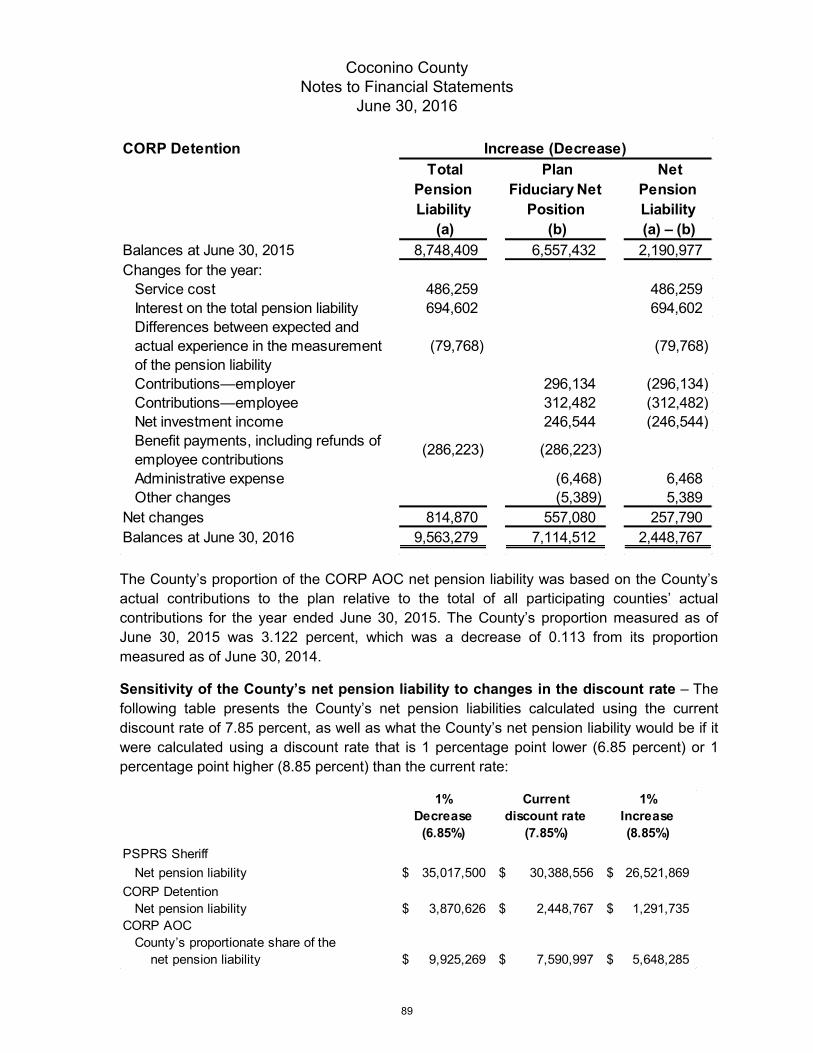
The County’s proportion of the CORP AOC net pension liability was based on the County’s actual contributions to the plan relative to the total of all participating counties’ actual contributions for the year ended June 30, 2015. The County’s proportion measured as of June 30, 2015 was 3.122 percent, which was a decrease of 0.113 from its proportion measured as of June 30, 2014.
Sensitivity of the County’s net pension liability to changes in the discount rate – The following table presents the County’s net pension liabilities calculated using the current discount rate of 7.85 percent, as well as what the County’s net pension liability would be if it were calculated using a discount rate that is 1 percentage point lower (6.85 percent) or 1 percentage point higher (8.85 percent) than the current rate:
CORP Detention Total
Pension Liability
Plan Fiduciary Net
Position
Net Pension Liability
(a) (b) (a) – (b) Balances at June 30, 2015 8,748,409 6,557,432 2,190,977 Changes for the year:
Service cost 486,259 486,259 Interest on the total pension liability 694,602 694,602 Differences between expected and actual experience in the measurement of the pension liability
(79,768) (79,768)
Contributions—employer 296,134 (296,134)Contributions—employee 312,482 (312,482)Net investment income 246,544 (246,544)Benefit payments, including refunds of employee contributions (286,223) (286,223)
Administrative expense (6,468) 6,468 Other changes (5,389) 5,389
Net changes 814,870 557,080 257,790 Balances at June 30, 2016 9,563,279 7,114,512 2,448,767
Increase (Decrease)
1%Decrease
(6.85%)
Currentdiscount rate
(7.85%)
1%Increase(8.85%)
PSPRS SheriffNet pension liability 35,017,500$ 30,388,556$ 26,521,869$
CORP DetentionNet pension liability 3,870,626$ 2,448,767$ 1,291,735$
CORP AOCCounty’s proportionate share of the net pension liability 9,925,269$ 7,590,997$ 5,648,285$
89
Coconino County Notes to Financial Statements
June 30, 2016
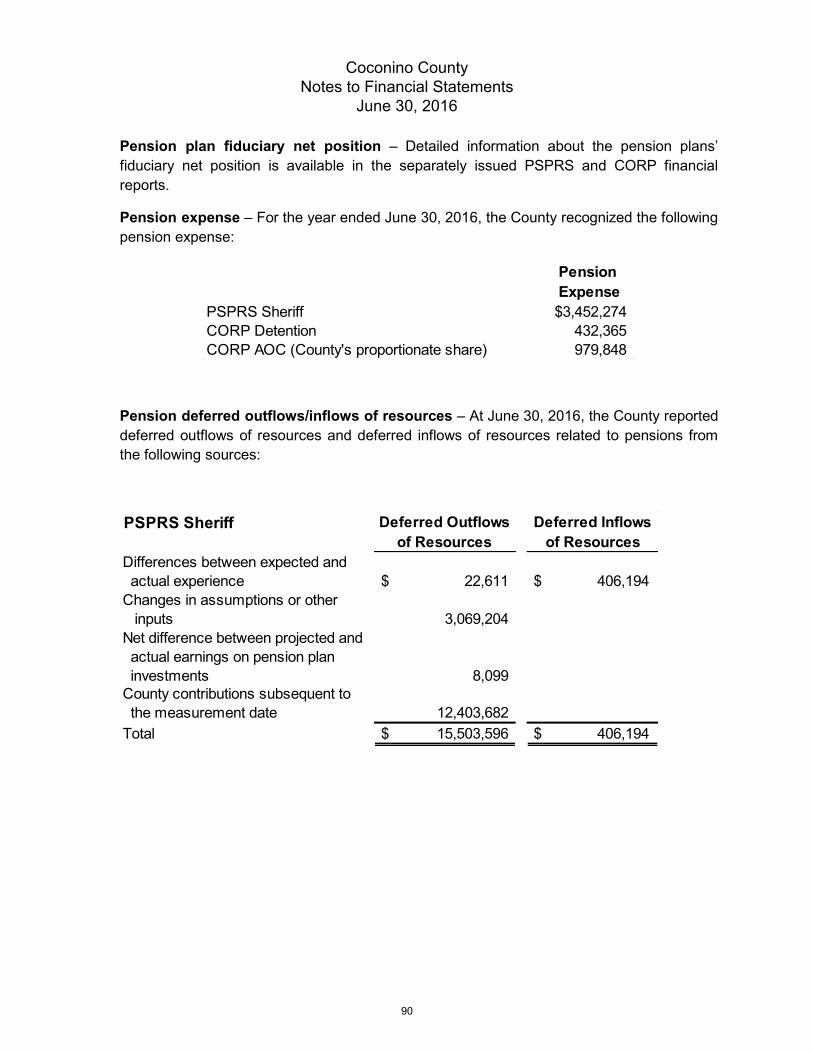
Pension plan fiduciary net position – Detailed information about the pension plans’ fiduciary net position is available in the separately issued PSPRS and CORP financial reports.
Pension expense – For the year ended June 30, 2016, the County recognized the following pension expense:
Pension deferred outflows/inflows of resources – At June 30, 2016, the County reported deferred outflows of resources and deferred inflows of resources related to pensions from the following sources:
Pension Expense
PSPRS Sheriff 3,452,274$ CORP Detention 432,365 CORP AOC (County's proportionate share) 979,848
PSPRS Sheriff Deferred Outflows of Resources
Deferred Inflows of Resources
Differences between expected and actual experience $ 22,611 $ 406,194 Changes in assumptions or other inputs 3,069,204 Net difference between projected and actual earnings on pension plan investments 8,099 County contributions subsequent to the measurement date 12,403,682 Total $ 15,503,596 $ 406,194
90
Coconino County Notes to Financial Statements
June 30, 2016

The amounts reported as deferred outflows of resources related to pensions resulting from county contributions subsequent to the measurement date will be recognized as a reduction of the net pension liability in the year ending June 30, 2017. County contributions for PSPRS include a voluntary $10 million excess payment to reduce the unfunded liability. Other amounts reported as deferred outflows of resources and deferred inflows of resources related to pensions will be recognized in pension expense as follows:
CORP Detention Deferred Outflows of Resources
Deferred Inflows of Resources
Differences between expected and actual experience $ 79,159 $ 65,025 Changes in assumptions or other inputs 285,928 Net difference between projected and actual earnings on pension plan investments 28,035 County contributions subsequent to the measurement date 378,425 Total $ 771,547 $ 65,025
CORP AOC Deferred Outflows of Resources
Deferred Inflows of Resources
Differences between expected and actual experience $ 259,959 $ 42,845 Changes in assumptions or other inputs 804,601 Net difference between projected and actual earnings on pension plan investments 41,737 Changes in proportion and differences between county contributions and proportionate share of contributions 177,380 County contributions subsequent to the measurement date 642,596 Total $ 1,748,893 $ 220,225
91
Coconino County Notes to Financial Statements
June 30, 2016

Agent plan OPEB actuarial assumptions – The health insurance premium benefit contribution requirements for the year ended June 30, 2016, were established by the June 30, 2014, actuarial valuations, and those actuarial valuations were based on the following actuarial methods and assumptions.
Actuarial valuations involve estimates of the reported amounts’ value and assumptions about the probability of events in the future. Amounts determined regarding the plans’ funded status and the annual required contributions are subject to continual revision as actual results are compared to past expectations and new estimates are made. The required schedule of funding progress for the health insurance premium benefit presented as required supplementary information provides multiyear trend information that shows whether the actuarial value of the plans’ assets are increasing or decreasing over time relative to the actuarial accrued liability for benefits.
Projections of benefits are based on (1) the plans as the County and plans’ members understand them and include the types of benefits in force at the valuation date, and (2) the pattern of sharing benefit costs between the County and plans’ members to that point. Actuarial calculations reflect a long-term perspective and employ methods and assumptions designed to reduce short-term volatility in actuarial accrued liabilities and the actuarial value of assets. The significant actuarial methods and assumptions used are the same for all PSPRS and CORP plans and related benefits (unless noted), and the following actuarial methods and assumptions were used to establish the fiscal year 2016 contribution requirements:
PSPRS and CORP – OPEB Contribution Requirements Actuarial valuation date June 30, 2014 Actuarial cost method Entry age normal Amortization method
Level percent closed for unfunded actuarial accrued liability, open for excess
Remaining amortization period
22 years for unfunded actuarial accrued liability, 20 years for excess
Asset valuation method 7-year smoothed market value; 20% corridor Actuarial assumptions:
Investment rate of return 7.85% Projected salary increases 4%–8% for PSPRS and 4%–7.25% for CORP Wage growth 4% for PSPRS and CORP
Year ending June 30PSPRS Sheriff
CORP Detention CORP AOC
2017 $ 1,085,653 $ 79,849 $ 233,203 2018 1,085,653 79,849 233,203 2019 508,527 79,848 233,203 2020 13,888 94,603 205,148 2021 (6,053) (18,685)
92
Coconino County Notes to Financial Statements
June 30, 2016

Agent plan OPEB trend information – Annual OPEB cost information for the health insurance premium benefit for the current and 2 preceding years follows for each of the agent plans:
Agent plan OPEB funded status – The health insurance premium benefit plans’ funded status as of the most recent valuation date, June 30, 2016, along with the actuarial assumptions and methods used in those valuations follow.
PSPRS Sheriff2016 23,029$ 100% 0$ 2015 68,725 100% 0 2014 68,144 100% 0
Net OPEB Obligation
Year Ended June 30
Annual OPEB Cost
Percentage of Annual Cost Contributed
CORP Detention2016 8,162 100% 0$ 2015 31,500 100% 0 2014 30,825 100% 0
PSPRS Sheriff
CORP Detention
Actuarial value of assets (a) $ 647,863 $ 468,299
Actuarial accrued liability (b)
834,307 424,012
Unfunded actuarial accrued liability (funding excess) (b) – (a)
186,444 (44,287)
Funded ratio (a)/(b) 77.7% 110.4%
Annual covered payroll (c) $ 2,845,463 $ 3,421,091
Unfunded actuarial accrued liability (funding excess) as a percentage of covered payroll (b) – (a) / (c)
6.6% (1.3)%
93
Coconino County Notes to Financial Statements
June 30, 2016
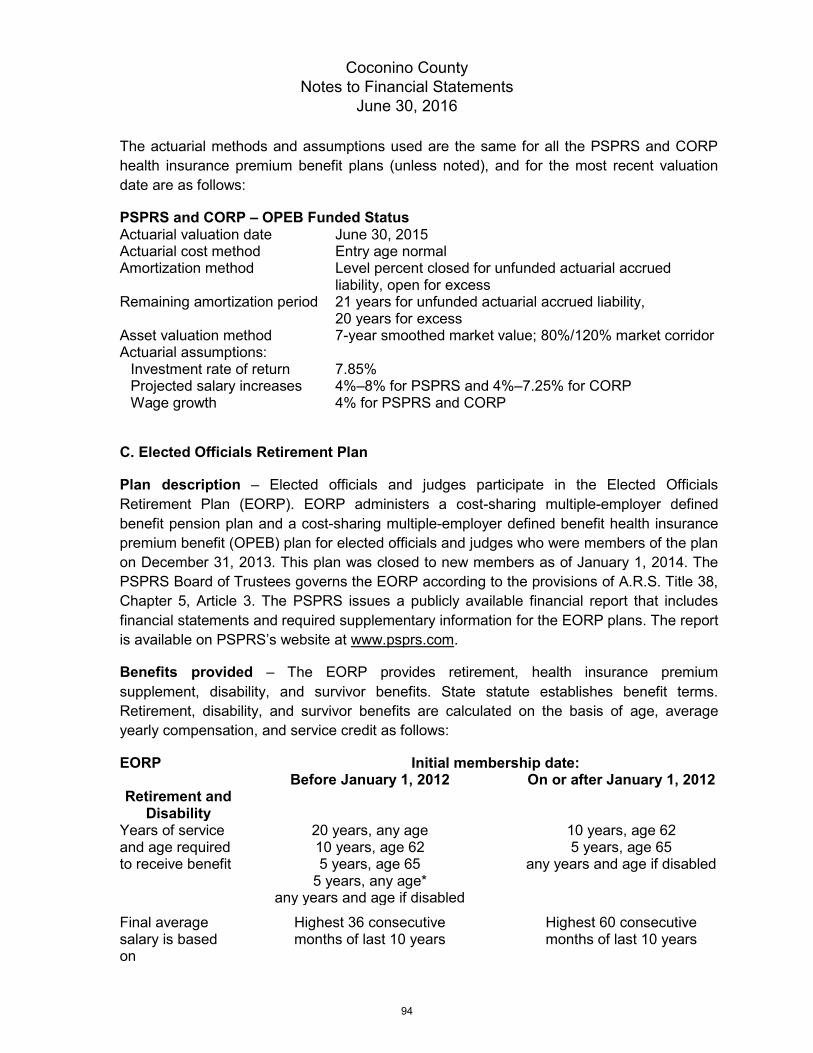
The actuarial methods and assumptions used are the same for all the PSPRS and CORP health insurance premium benefit plans (unless noted), and for the most recent valuation date are as follows:
PSPRS and CORP – OPEB Funded Status Actuarial valuation date June 30, 2015 Actuarial cost method Entry age normal Amortization method
Level percent closed for unfunded actuarial accrued liability, open for excess
Remaining amortization period
21 years for unfunded actuarial accrued liability, 20 years for excess
Asset valuation method 7-year smoothed market value; 80%/120% market corridor Actuarial assumptions:
Investment rate of return 7.85% Projected salary increases 4%–8% for PSPRS and 4%–7.25% for CORP Wage growth 4% for PSPRS and CORP
C. Elected Officials Retirement Plan
Plan description – Elected officials and judges participate in the Elected Officials Retirement Plan (EORP). EORP administers a cost-sharing multiple-employer defined benefit pension plan and a cost-sharing multiple-employer defined benefit health insurance premium benefit (OPEB) plan for elected officials and judges who were members of the plan on December 31, 2013. This plan was closed to new members as of January 1, 2014. The PSPRS Board of Trustees governs the EORP according to the provisions of A.R.S. Title 38, Chapter 5, Article 3. The PSPRS issues a publicly available financial report that includes financial statements and required supplementary information for the EORP plans. The report is available on PSPRS’s website at www.psprs.com.
Benefits provided – The EORP provides retirement, health insurance premium supplement, disability, and survivor benefits. State statute establishes benefit terms. Retirement, disability, and survivor benefits are calculated on the basis of age, average yearly compensation, and service credit as follows:
EORP Initial membership date: Before January 1, 2012 On or after January 1, 2012
Retirement and Disability
Years of service and age required to receive benefit
20 years, any age 10 years, age 62 5 years, age 65
5 years, any age* any years and age if disabled
10 years, age 62 5 years, age 65
any years and age if disabled
Final average salary is based on
Highest 36 consecutive months of last 10 years
Highest 60 consecutive months of last 10 years
94
Coconino County Notes to Financial Statements
June 30, 2016

EORP Initial membership date: Before January 1, 2012 On or after January 1, 2012
Benefit percent Normal Retirement
4% per year of service, not to exceed 80%
3% per year of service, not to exceed 75%
Disability Retirement
80% with 10 or more years of service
40% with 5 to 10 years of service 20% with less than 5 years of
service
75% with 10 or more years of service
37.5% with 5 to 10 years of service 18.75% with less than 5 years of
service Survivor Benefit Retired Members 75% of retired member’s benefit 50% of retired member’s benefit Active Members and Other Inactive Members
75% of disability retirement benefit 50% of disability retirement benefit
*With reduced benefits of 0.25% for each month early retirement precedes themember’s normal retirement age, with a maximum reduction of 30%.
Retirement and survivor benefits are subject to automatic cost-of-living adjustments based on excess investment earning. In addition, from and after December 31, 2015, the Legislature may enact permanent one-time benefit increases after a Joint Legislative Budget Committee analysis of the increase’s effects on the plan.
Contributions – State statutes establish active member and employer contribution requirements. Statute also appropriates $5 million annually through fiscal year 2043 for the EORP from the State of Arizona to supplement the normal cost plus an amount to amortize the unfunded accrued liability and designates a portion of certain court fees for the EORP. For the year ended June 30, 2016, statute required active EORP members to contribute 13 percent of the members’ annual covered payroll and the County to contribute 23.5 percent of active EORP members’ annual covered payroll. The County’s contributions to the pension plan for the year ended June 30, 2016, were $394,136. No OPEB contributions were required or made for the years ended June 30, 2015 and 2016. The County’s OPEB contributions for the current and 2 preceding years, all of which were equal to the required contributions, were as follows:
EORP Health
Year ended June 30Insurance
Fund2016 $ 20152014 27,154
95
Coconino County Notes to Financial Statements
June 30, 2016

During fiscal year 2016, the County paid for EORP pension contributions as follows: 96.4 percent from the General Fund and 3.6 percent from major funds.
Pension liability – At June 30, 2016, the County reported a liability for its proportionate share of the EORP’s net pension liability that reflected a reduction for the County’s proportionate share of the State’s appropriation for EORP. The amount the County recognized as its proportionate share of the net pension liability, the related state support, and the total portion of the net pension liability that was associated with the County were as follows:
County’s proportionate share of the EORP net pension liability
$14,583,025
State’s proportionate share of the EORP net pension liability associated with the County 4,546,380
Total $19,129,405
The net pension liability was measured as of June 30, 2015, and the total pension liability used to calculate the net pension liability was determined by an actuarial valuation as of that date.
The County’s proportion of the net pension liability was based on the County’s actual contributions to the plan relative to the total of all participating employers’ actual contributions for the year ended June 30, 2015. The County’s proportion measured as of June 30, 2015 was 1.866 percent, which was a decrease of 0.026 from its proportion measured as of June 30, 2014.
Pension expense and deferred outflows/inflows of resources – For the year ended June 30, 2016, the County recognized pension expense for EORP of $4,451,824 and revenue of $1,223,264 for the County’s proportionate share of the State’s appropriation to EORP and the designated court fees. At June 30, 2016, the County reported deferred outflows of resources and deferred inflows of resources related to pensions from the following sources:
96
Coconino County Notes to Financial Statements
June 30, 2016
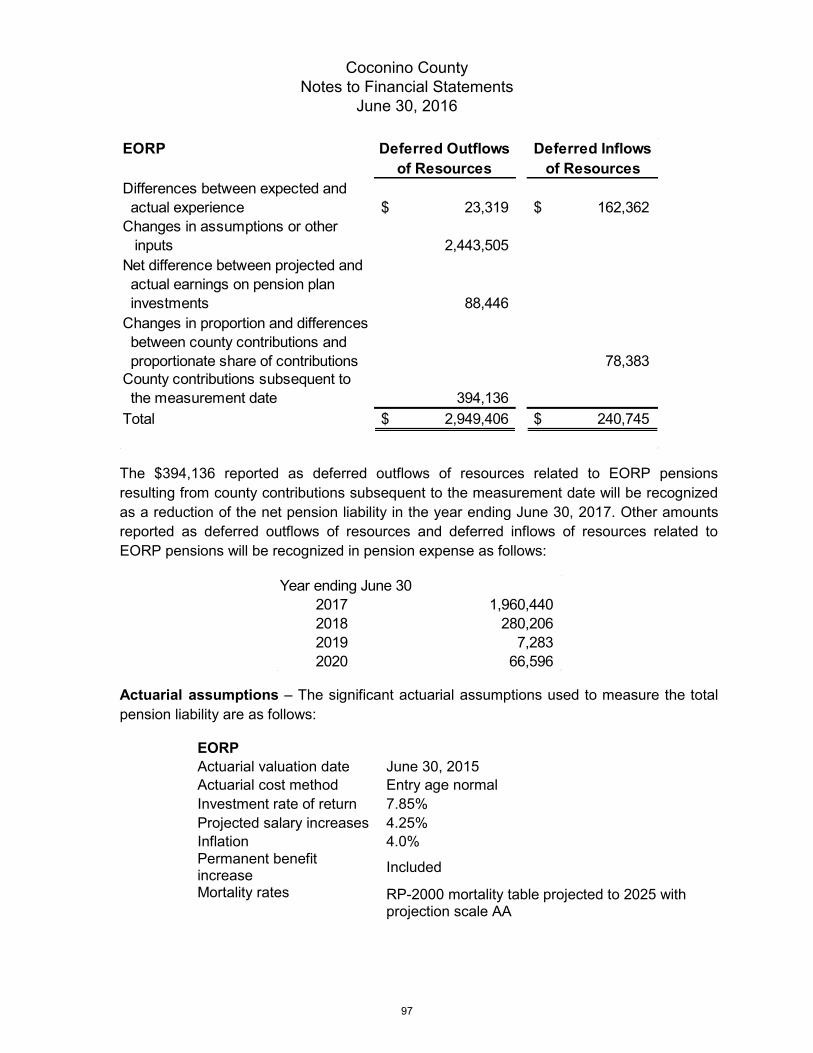
The $394,136 reported as deferred outflows of resources related to EORP pensions resulting from county contributions subsequent to the measurement date will be recognized as a reduction of the net pension liability in the year ending June 30, 2017. Other amounts reported as deferred outflows of resources and deferred inflows of resources related to EORP pensions will be recognized in pension expense as follows:
Actuarial assumptions – The significant actuarial assumptions used to measure the total pension liability are as follows:
EORP Actuarial valuation date June 30, 2015 Actuarial cost method Entry age normal Investment rate of return 7.85% Projected salary increases 4.25% Inflation 4.0% Permanent benefit increase Included
Mortality rates RP-2000 mortality table projected to 2025 with projection scale AA
EORP Deferred Outflows of Resources
Deferred Inflows of Resources
Differences between expected and actual experience $ 23,319 $ 162,362 Changes in assumptions or other inputs 2,443,505 Net difference between projected and actual earnings on pension plan investments 88,446 Changes in proportion and differences between county contributions and proportionate share of contributions 78,383 County contributions subsequent to the measurement date 394,136 Total $ 2,949,406 $ 240,745
Year ending June 302017 1,960,440 2018 280,206 2019 7,283 2020 66,596
97
Coconino County Notes to Financial Statements
June 30, 2016

Actuarial assumptions used in the June 30, 2015, valuation were based on the results of an actuarial experience study for the 5-year period ended June 30, 2011.
The long-term expected rate of return on EORP pension plan investments was determined to be 7.85 percent using a building-block method in which best-estimate ranges of expected future real rates of return (expected returns, net of pension plan investment expenses and inflation) are developed for each major asset class. The target allocation and best estimates of geometric real rates of return for each major asset class are summarized in the following table:
EORP
Asset Class Target
Allocation
Long-Term Expected Geometric Real Rate
of Return Short term investments 2% 0.75% Absolute return 5% 4.11% Risk parity 4% 5.13% Fixed income 7% 2.92% Real assets 8% 4.77% GTAA 10% 4.38% Private equity 11% 9.50% Real estate 10% 4.48% Credit opportunities 13% 7.08% Non-U.S. equity 14% 8.25% U.S. equity 16% 6.23% Total 100%
Discount rate – At June 30, 2015, the discount rate used to measure the EORP total pension liability was 4.86 percent, which was a decrease of 0.81 from the discount rate used as of June 30, 2014. The projection of cash flows used to determine the discount rate assumed that plan member contributions will be made at the current contribution rate, employer contributions will be made at the statutorily set rates, and state contributions will be made as currently required by statute. Based on those assumptions, the pension plan’s fiduciary net position was projected to be insufficient to make all projected future benefit payments of current plan members. Therefore, to determine the total pension liability for the plan, the long-term expected rate of return on pension plan investments of 7.85 percent was applied to periods of projected benefit payments through the year ended June 30, 2028. A municipal bond rate of 3.80 percent obtained from the 20-year Bond Buyer Index, as published by the Federal Reserve as of June 25, 2015, was applied to periods of projected benefit payments after June 30, 2028.
98
Coconino County Notes to Financial Statements
June 30, 2016
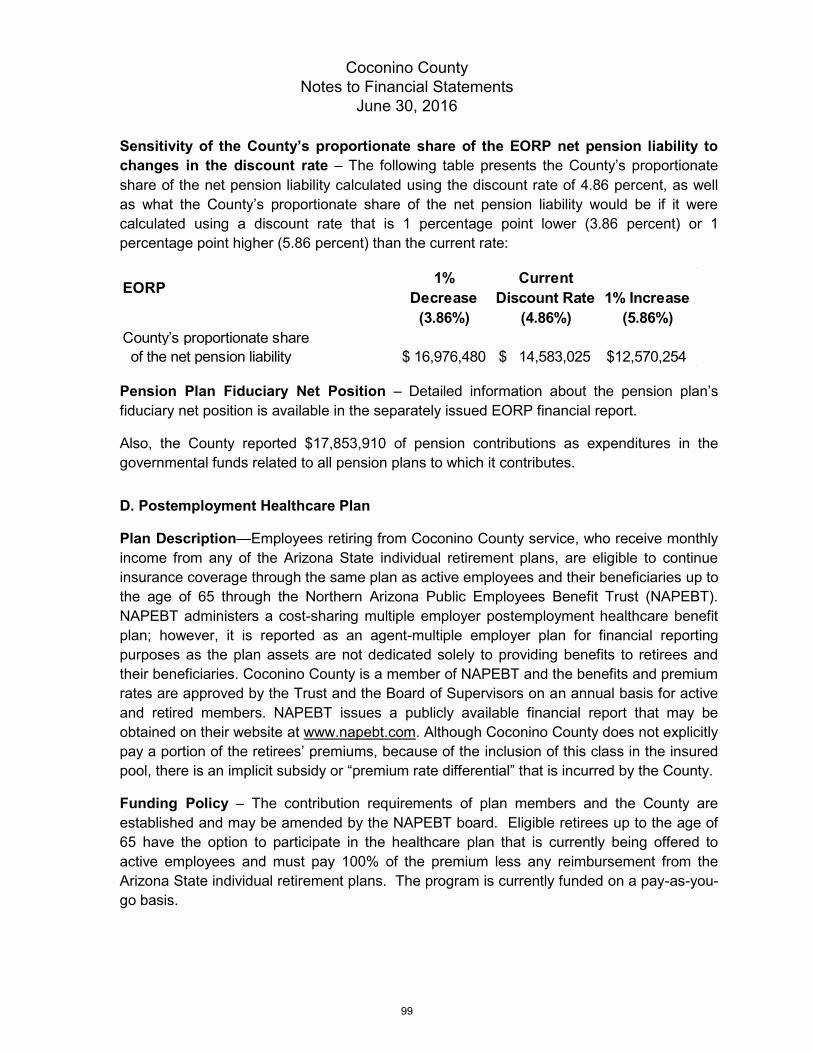
Sensitivity of the County’s proportionate share of the EORP net pension liability to changes in the discount rate – The following table presents the County’s proportionate share of the net pension liability calculated using the discount rate of 4.86 percent, as well as what the County’s proportionate share of the net pension liability would be if it were calculated using a discount rate that is 1 percentage point lower (3.86 percent) or 1 percentage point higher (5.86 percent) than the current rate:
Pension Plan Fiduciary Net Position – Detailed information about the pension plan’s fiduciary net position is available in the separately issued EORP financial report.
Also, the County reported $17,853,910 of pension contributions as expenditures in the governmental funds related to all pension plans to which it contributes.
D. Postemployment Healthcare Plan
Plan Description—Employees retiring from Coconino County service, who receive monthly income from any of the Arizona State individual retirement plans, are eligible to continue insurance coverage through the same plan as active employees and their beneficiaries up to the age of 65 through the Northern Arizona Public Employees Benefit Trust (NAPEBT). NAPEBT administers a cost-sharing multiple employer postemployment healthcare benefit plan; however, it is reported as an agent-multiple employer plan for financial reporting purposes as the plan assets are not dedicated solely to providing benefits to retirees and their beneficiaries. Coconino County is a member of NAPEBT and the benefits and premium rates are approved by the Trust and the Board of Supervisors on an annual basis for active and retired members. NAPEBT issues a publicly available financial report that may be obtained on their website at www.napebt.com. Although Coconino County does not explicitly pay a portion of the retirees’ premiums, because of the inclusion of this class in the insured pool, there is an implicit subsidy or “premium rate differential” that is incurred by the County.
Funding Policy – The contribution requirements of plan members and the County are established and may be amended by the NAPEBT board. Eligible retirees up to the age of 65 have the option to participate in the healthcare plan that is currently being offered to active employees and must pay 100% of the premium less any reimbursement from the Arizona State individual retirement plans. The program is currently funded on a pay-as-you-go basis.
EORP 1% Decrease
(3.86%)
Current Discount Rate
(4.86%)1% Increase
(5.86%)County’s proportionate share of the net pension liability $ 16,976,480 $ 14,583,025 $12,570,254
99
Coconino County Notes to Financial Statements
June 30, 2016

Annual OPEB Cost and Net OPEB Obligation – The County’s annual OPEB cost, the percentage of annual OPEB cost contributed to the plan, and the net OPEB obligations for 2016 and the two preceding years were as follows:
Components of Annual OPEB Costs and Net OPEB Obligation – The annual components of OPEB cost and net OPEB obligation as of June 30, 2016, were as follows:
Funding Status and Funding Progress – The latest actuarial valuation done was as of July 1, 2015. The funded status of the plan as of June 30, 2016, was as follows:
Actuarial Methods and Assumptions – Actuarial valuations involve estimates of the value of reported amounts and assumptions about the probability of events far into the future. Actuarially determined amounts are subject to continual revision as actual results are compared to past expectations and new estimates are made about the future. The required schedule of the funding progress presented as required supplementary information provides multiyear trend information that shows whether the actuarial value of plan’s assets are increasing or decreasing over time relative to the actuarial accrued liability for benefits. Projections of benefits are based on 1) the plan as the County and plan’s members understand it and include the types of benefits in force at the valuation date, and 2) the pattern of sharing benefit costs between the County and plan’s members to that point. Actuarial calculations reflect a long-term perspective and employ methods and assumptions designed to reduce short-term volatility in actuarial accrued liabilities and the actuarial value of assets. The actuarial methods and assumptions used for most recent valuation date are as follows:
Fiscal Year Ended
Annual OPEB Cost
Actual Contributions
Percentage of Annual
OPEB Cost Contributed
Change in Net OPEB
Obligation6/30/2016 895,123$ 395,125$ 44.14% 499,998$ 6/30/2015 996,848 93,243 9.35% 903,605 6/30/2014 949,983 133,882 14.09% 816,101
Annual required
contribution (ARC)
Interest on existing net
OPEB obligation
ARC adjustment
Increase in OPEB
obligationNet OPEB obligation
998,908$ 284,921$ (388,706)$ 499,998$ 6,831,582$
Actuarial Valuation
Date
(1) Actuarial
value of plan assets
(2) Actuarial accrued
liability (AAL)
(3) Funded
ratio(1) / (2)
(4)Unfunded
AAL(2) - (1)
(5) Covered payroll
(6) Unfunded AAL as a percentage of covered payroll
(4) / (5)7/1/2015 $ 8,119,959$ 0.00% 8,119,959$ 49,643,004$ 16.36%
100
Coconino County Notes to Financial Statements
June 30, 2016

NOTE 10 – INTERFUND BALANCES AND ACTIVITY
Interfund Receivables and Payables – Interfund balances at June 30, 2016, were as follows: The interfund balances resulted from time lags between the dates that (1) interfund goods and services are provided or reimbursable expenditures occur, (2) transactions are recorded in the accounting system, and (3) payments between funds are made.
Valuation Date July 1, 2015Actuarial cost method Entry Age, Level DollarAmortization method 30-Year Amortization, level dollar, OpenRemaining amortization period 30 yearsInvestment rate of return 4.50%Medicare coverage age 65
Retirement and disability age Based on the assumptions for the ASRS Defined Benefit valuation as of June 30, 2014
Active members 909Retirees, beneficiaries, and dependents 75Asset Valuation method N/A. No assets in an OPEB trustInflation rate N/AProjected salary increase N/APost-retirement benefits increase N/AHealthcare cost trend rate 7.00% graded down to ultimate rate of 5.00% over 8 years
General Fund
Public Works/
HURF FundJail District
Fund
Public Health Services
District Fund
Nonmajor Governmental
Funds
Internal Service Fund Total
Payable fromGeneral Fund $ 12,368$ 78,787$ 133,452$ 1,146,521$ 105,924$ 1,477,052$ Public Works/HURF Fund 62,478 129,394 154,305 346,177 Jail District Fund 265,277 77,079 3,311 345,667 Public Health Services District Fund 133,619 8,000 10,090 151,709 Nonmajor Governmental Funds 1,166,975 164,827 963 727,258 70,253 2,130,276 Internal Service Fund 774 774 Total 1,629,123$ 177,195$ 78,787$ 134,415$ 2,088,252$ 343,883$ 4,451,655$
Payable to
101
Coconino County Notes to Financial Statements
June 30, 2016
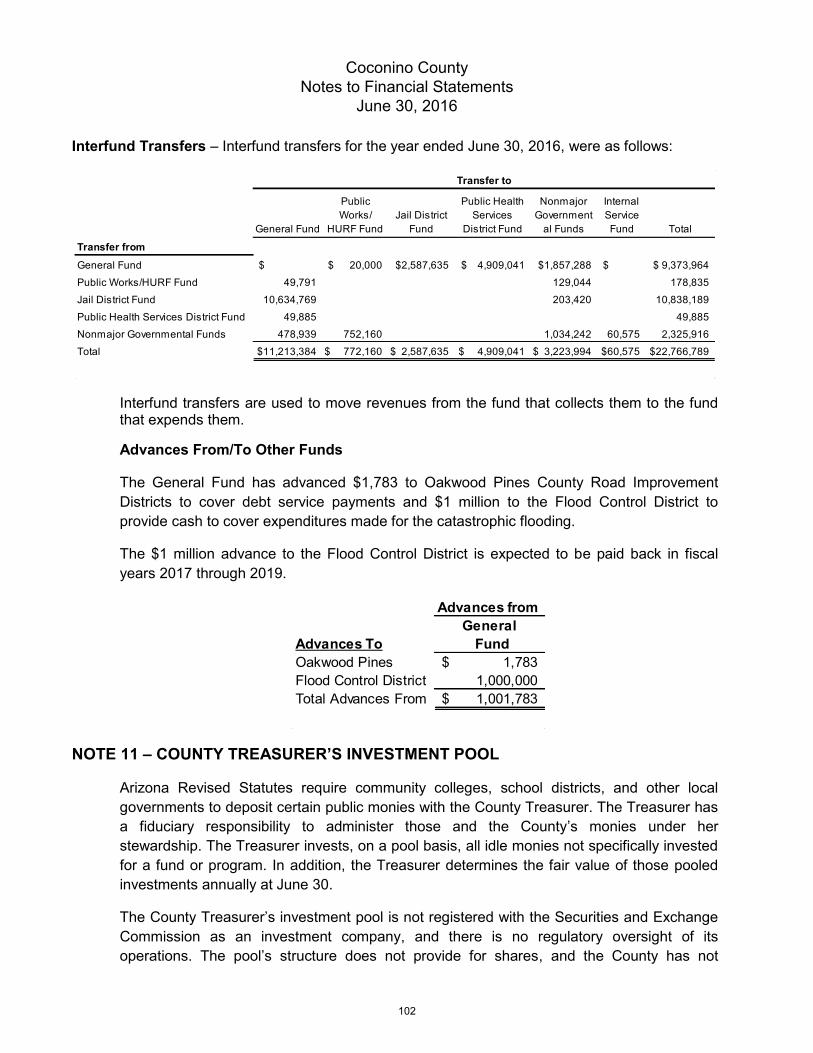
Interfund Transfers – Interfund transfers for the year ended June 30, 2016, were as follows:
Interfund transfers are used to move revenues from the fund that collects them to the fund that expends them.
Advances From/To Other Funds
The General Fund has advanced $1,783 to Oakwood Pines County Road Improvement Districts to cover debt service payments and $1 million to the Flood Control District to provide cash to cover expenditures made for the catastrophic flooding.
The $1 million advance to the Flood Control District is expected to be paid back in fiscal years 2017 through 2019.
NOTE 11 – COUNTY TREASURER’S INVESTMENT POOL
Arizona Revised Statutes require community colleges, school districts, and other local governments to deposit certain public monies with the County Treasurer. The Treasurer has a fiduciary responsibility to administer those and the County’s monies under her stewardship. The Treasurer invests, on a pool basis, all idle monies not specifically invested for a fund or program. In addition, the Treasurer determines the fair value of those pooled investments annually at June 30.
The County Treasurer’s investment pool is not registered with the Securities and Exchange Commission as an investment company, and there is no regulatory oversight of its operations. The pool’s structure does not provide for shares, and the County has not
General Fund
Public Works/
HURF FundJail District
Fund
Public Health Services
District Fund
Nonmajor Government
al Funds
Internal Service Fund Total
Transfer fromGeneral Fund $ 20,000$ 2,587,635$ 4,909,041$ 1,857,288$ $ 9,373,964$ Public Works/HURF Fund 49,791 129,044 178,835 Jail District Fund 10,634,769 203,420 10,838,189 Public Health Services District Fund 49,885 49,885 Nonmajor Governmental Funds 478,939 752,160 1,034,242 60,575 2,325,916 Total 11,213,384$ 772,160$ 2,587,635$ 4,909,041$ 3,223,994$ 60,575$ 22,766,789$
Transfer to
Advances fromGeneral
Advances To FundOakwood Pines 1,783$ Flood Control District 1,000,000 Total Advances From 1,001,783$
102
Coconino County Notes to Financial Statements
June 30, 2016

provided or obtained any legally binding guarantees to support the value of the participants’ investments.
The Treasurer allocates interest earnings to each of the pool’s participants.
The deposits and investments the County holds are included in the County Treasurer’s investment pool, except for $3,300,441 of deposits, $457,572 of investments in mutual funds-debt, $2,655,699 in the State Treasurer’s Investment Pool #7, and $206,886 of investments in equities. Therefore, the deposit and investment risks of the Treasurer’s investment pool are substantially the same as the County’s deposit and investment risks. See Note 2 for the disclosure of the County’s deposit and investment risks.
Details of each major investment classification follow:
A condensed statement of the investment pool’s net position and changes in net position follows:
Investment Type Principal Interest Rates Maturities AmountU.S. agency securities 99,688,206$ 0-1.750% 07/15/2016-05/17/2021 99,884,543$ Corporate bonds 33,569,258 1.000-3.350% 07/05/2016-09/14/2020 33,392,223Negotiable CDs 8,682,103 0.650-2.650% 07/28/2016-08/12/2020 8,739,005Commercial paper 15,659,257 0.610-1.700% 08/01/2016-04/21/2017 15,659,257Municipal bonds 14,324,406 0.600-4.276% 07/01/2016-11/01/2020 14,492,164Money market mutual funds 95,714 0.191% less than 1 year 95,714
Statement of Net PositionAssets 209,700,249$ Net position 209,700,249$
Net position held in trust for: Internal participants 89,665,783$ External participants 120,034,466Total net position held in trust 209,700,249$
Statement of Changes in Net PositionTotal additions 371,508,422$ Total deletions 357,869,289Net increase 13,639,133Net position held in trust July 1, 2015 196,061,116 June 30, 2016 209,700,249$
103
Coconino County Notes to Financial Statements
June 30, 2016

NOTE 12 – MAINTENANCE OF EFFORT Coconino County is required to maintain statutory levels of support for the Coconino County Jail District and the Coconino County Public Health Services District. In accordance with A.R.S. Section 48-4024, Coconino County is required to make annual maintenance of effort payments (MOE) to the Coconino County Jail District, a special revenue fund type. The payments will be made through fiscal year 2027, and are determined by first establishing a base expenditure which was used as the initial fiscal year 1998 MOE payment. Subsequent payments are determined by adjusting the base expenditure by the annual change in the gross domestic product price deflator, obtained from the State of Arizona Economic Estimates Commission. These payments are recorded by the jail district as transfers. The MOE payment for fiscal year 2016 was $2,587,635. In accordance with A.R.S. Section 48-5802 Coconino County is required to maintain a specific level of expenditures for public health services. This is accomplished by transferring funds to the Public Health Services District, a special revenue fund type. The payment for fiscal year 2016 was $4,780,393.
104
Coconino County Notes to Financial Statements
June 30, 2016

REQUIRED SUPPLEMENTARY INFORMATION
105

Original Final Actual AmountsVariance with Final Budget
Revenues: Property taxes 9,517,093$ 9,517,093$ 9,498,577$ (18,516)$ County sales taxes 13,414,100 13,414,100 14,360,222 946,122 Licenses and permits 1,062,928 1,062,928 1,135,405 72,477 Fees, fines, and forfeits 1,121,150 1,121,150 1,351,348 230,198 Intergovernmental 26,315,683 27,338,564 28,885,641 1,547,077 Charges for services 1,702,341 1,702,341 2,142,798 440,457 Investment earnings 121,400 121,400 298,660 177,260 Contributions 206,000 206,000 245,964 39,964 Miscellaneous 106,315 106,315 188,357 82,042
Total revenues 53,567,010 54,589,891 58,106,972 3,517,081
Expenditures: General government
Assessor 2,006,550 2,087,608 1,754,467 333,141 Board of Supervisors 1,237,003 1,245,383 1,324,346 (78,963) Clerk of the Superior Court 1,196,098 1,196,098 1,174,061 22,037 Community Development 2,125,174 2,133,225 1,641,559 491,666 Community Initiatives 206,935 222,744 131,484 91,260 County Attorney 3,613,523 3,576,707 3,239,696 337,011 County Manager 1,332,152 1,327,052 1,226,936 100,116 Facilities 4,142,644 4,208,850 3,115,762 1,093,088 Finance/Budget 1,442,215 1,440,175 1,222,666 217,509 Flagstaff Justice Court 1,200,980 1,200,980 1,185,461 15,519 Fredonia Justice Court 192,427 192,427 187,935 4,492 Human Resources 1,301,440 1,308,324 1,081,851 226,473
Information Technology 2,256,879 2,265,971 1,485,562 780,409 Legal Defender 1,029,042 1,026,322 1,033,304 (6,982)
Non-departmental 20,074,091 7,309,799 1,039,654 6,270,145 Page Justice Court 369,081 369,081 376,272 (7,191) Public Defender 2,298,973 2,289,367 2,207,186 82,181 Recorder 1,827,188 2,327,188 1,722,559 604,629 Superior Courts 3,173,505 3,263,998 3,096,786 167,212 Treasurer 622,281 622,281 449,083 173,198 Williams Justice Court 362,499 418,486 416,817 1,669 Total general government 52,010,680 40,032,066 29,113,447 10,918,619
Budgeted Amounts
Coconino County Required Supplementary Information
Budgetary Comparison Schedule General Fund
Year Ended June 30, 2016
The Notes to the Budgetary Comparison Schedules are an integral part of this schedule. (continued)
106

Original Final Actual AmountsVariance with Final Budget
Budgeted Amounts
Public safety Adult Probation 1,574,886 1,574,646 1,569,889 4,757 Constable 96,237 96,237 93,782 2,455 Juvenile Probation 3,035,749 3,035,749 2,813,145 222,604 Sheriff 9,829,493 20,832,865 20,468,907 363,958 Total public safety 14,536,365 25,539,497 24,945,723 593,774
Highways and streets Information Technology 535,828 535,828 451,477 84,351
Health Information Technology 26,471 26,471 28,619 (2,148)
Welfare Community Services 1,029,327 1,028,527 1,179,379 (150,852)
Culture and recreation Parks and Recreation 1,639,911 1,638,078 1,489,745 148,333
Education School Superintendent 467,217 467,217 458,272 8,945 Total expenditures 70,245,799 69,267,684 57,666,662 11,601,022
Excess (deficiency) of revenues over expenditures (16,678,789) (14,677,793) 440,310 15,118,103
Other financing sources (uses): Capital lease agreement 90,011 90,011 Sale of capital assets 3,300 3,300 Transfers in 1,206,594 11,206,594 11,213,384 6,790 Transfers out (9,807,050) (9,715,028) (9,373,964) 341,064 Total other financing sources (uses) (8,600,456) 1,491,566 1,932,731 441,165
Net change in fund balances (25,279,245) (13,186,227) 2,373,041 15,559,268
Fund balance, July 1, 2015 25,279,245 25,279,245 27,643,585 2,364,340Fund balance, June 30, 2016 12,093,018$ 30,016,626$ 17,923,608$
Coconino CountyRequired Supplementary Information
Budgetary Comparison ScheduleGeneral Fund (Continued)Year Ended June 30, 2016
The Notes to the Budgetary Comparison Schedules are an integral part of this schedule.
107

Original FinalActual
AmountsVariance with Final Budget
Revenues: County sales taxes 7,839,498$ 7,839,498$ 8,426,665$ 587,167 Licenses and permits 28,100 28,100 25,974 (2,126) Intergovernmental 11,249,165 11,249,165 11,732,298 483,133 Charges for services 6,592 6,592 Investment earnings 50,000 50,000 278,249 228,249 Miscellaneous 2,425 2,425
Total revenues 19,166,763 19,166,763 20,472,203 1,305,440
Expenditures: Highways and streets
Public Works 26,121,694 28,681,464 22,422,188 6,259,276 Total expenditures 26,121,694 28,681,464 22,422,188 6,259,276
Excess (deficiency) of revenues over expenditures (6,954,931) (9,514,701) (1,949,985) 7,564,716
Other financing sources (uses): Sale of capital assets 150,000 150,000 352,249 202,249 Transfers in 760,000 780,000 772,160 (7,840) Transfers out (221,091) (221,091) (178,835) 42,256 Total other financing sources (uses) 688,909 708,909 945,574 236,665
Net change in fund balances (6,266,022) (8,805,792) (1,004,411) 7,801,381
Fund balance, July 1, 2015 16,715,253 16,715,253 20,991,041 4,275,788Fund balance, June 30, 2016 10,449,231$ 7,909,461$ 19,986,630$ 12,077,169$
Budgeted Amounts
Coconino CountyRequired Supplementary Information
Budgetary Comparison SchedulePublic Works/HURF FundYear Ended June 30, 2016
The Notes to the Budgetary Comparison Schedules are an integral part of this schedule.
108

Original FinalActual
AmountsVariance with Final Budget
Revenues: County sales taxes 13,274,100$ 13,274,100$ 14,127,110$ 853,010$ Intergovernmental 12,000 169,254 190,258 21,004 Charges for services 1,407,483 1,407,483 527,292 (880,191) Investment earnings 193,057 193,057 219,294 26,237 Contributions 14,000 14,000 Miscellaneous 39 39
Total revenues 14,886,640 15,057,894 15,077,993 20,099
Expenditures: Public safety
Sheriff 19,454,964 19,879,697 13,863,593 6,016,104 Total expenditures 19,454,964 19,879,697 13,863,593 6,016,104
Excess (deficiency) of revenues over expenditures (4,568,324) (4,821,803) 1,214,400 6,036,203
Other financing sources (uses): Transfers in 2,595,929 2,595,929 2,587,635 (8,294) Transfers out (855,149) (10,856,657) (10,838,189) 18,468 Total other financing sources (uses) 1,740,780 (8,260,728) (8,250,554) 10,174
Net change in fund balances (2,827,544) (13,082,531) (7,036,154) 6,046,377
Fund balance, July 1, 2015 18,277,784 18,277,784 19,603,936 1,326,152Fund balance, June 30, 2016 15,450,240$ 5,195,253$ 12,567,782$ 7,372,529$
Budgeted Amounts
Coconino CountyRequired Supplementary Information
Budgetary Comparison ScheduleJail District Fund
Year Ended June 30, 2016
The Notes to the Budgetary Comparison Schedules are an integral part of this schedule.
109

Original Final Actual AmountsVariance with Final Budget
Revenues: Property taxes 3,850,071$ 3,850,071$ 3,839,304$ (10,767)$ County sales taxes 5,897 5,897 Licenses and permits 561,253 561,253 555,200 (6,053) Intergovernmental 4,354,957 4,756,297 4,224,237 (532,060) Charges for services 546,171 546,171 621,834 75,663 Investment earnings 6,034 6,034 23,678 17,644 Contributions 23,000 23,000 111,401 88,401 Miscellaneous 27,833 66,691 (66,691)
Total revenues 9,369,319 9,809,517 9,381,551 (427,966)
Expenditures: Public safety Medical Examiner 706,409 706,409 737,683 (31,274)
Health Health Department 13,306,130 13,823,603 12,694,622 1,128,981
Welfare Community Services 142,731 142,731 142,422 309
Total expenditures 14,155,270 14,672,743 13,574,727 1,098,016
Excess (deficiency) of revenues over expenditures (4,785,951) (4,863,226) (4,193,176) 670,050
Other financing sources (uses): Sale of capital assets 4,551 4,551 Transfers in 4,914,244 4,910,444 4,909,041 (1,403) Transfers out (137,022) (145,775) (49,885) 95,890 Total other financing sources (uses) 4,777,222 4,764,669 4,863,707 99,038
Net change in fund balances (8,729) (98,557) 670,531 769,088
Fund balance, July 1, 2015 1,586,580 1,586,580 1,990,537 403,957Fund balance, June 30, 2016 1,577,851$ 1,488,023$ 2,661,068$ 1,173,045$
Budgeted Amounts
Coconino CountyRequired Supplementary Information
Budgetary Comparison SchedulePublic Health Services District Fund
Year Ended June 30, 2016
The Notes to the Budgetary Comparison Schedules are an integral part of this schedule.
110

NOTE 1 – BUDGETING AND BUDGETARY CONTROL
A.R.S. requires the County to prepare and adopt a balanced budget annually for each governmental fund. The Board of Supervisors must approve such operating budgets on or before the third Monday in July to allow sufficient time for the legal announcements and hearings required for the adoption of the property tax levy on the third Monday in August. A.R.S. prohibits expenditures or liabilities in excess of the amounts budgeted.
Expenditures may not legally exceed appropriations at the department level. In certain instances, transfers of appropriations between departments or from the contingency account to a department may be made upon the Board of Supervisors’ approval. With the exception of the General Fund and the Public Health Services District Fund, each fund includes only one department.
NOTE 2 – BUDGETARY BASIS OF ACCOUNTING
The County’s budget is prepared on a basis consistent with generally accepted accounting principles.
NOTE 3 – EXPENDITURES IN EXCESS OF APPROPRIATIONS
For the year ended June 30, 2016, expenditures exceeded final budget amounts at the department level (the legal level of budgetary control) as follows:
Departments may exceed their department’s budget for various reasons, including unexpected events. When departments exceed their budget, this is addressed with the departments in their subsequent budget meetings with the County Manager and the Board of Supervisors.
Fund/Department ExcessGeneral Fund
Community Services $150,543Board of Supervisors 78,963 Page Justice Court 7,191 Legal Defender 6,982
Public Health Services District FundMedical Examiner 31,274
Coconino County Required Supplementary Information
Notes to Budgetary Comparison Schedules June 30, 2016
111

2016 2015(2015) (2014)
County’s proportion of the net pension liability 0.39% 0.40% InformationCounty’s proportionate share of the net pension liability $ 61,051,275 $ 58,741,596 not availableCounty’s covered payroll $ 36,081,751 $ 35,786,206 County’s proportionate share of the net pension liability as a percentage of its covered payroll 169.20% 164.15%
Plan fiduciary net position as a percentage of the total pension liability 68.35% 69.49%
Arizona State Retirement System Reporting Fiscal Year(Measurement Date)
2014 through 2007
2016 2015(2015) (2014)
County’s proportion of the net pension liability 3.12% 3.24% InformationCounty’s proportionate share of the net pension liability $ 7,590,997 $ 7,259,716 not availableCounty’s covered payroll $ 3,530,713 $ 3,481,917 County’s proportionate share of the net pension liability as a percentage of its covered payroll 215.00% 208.50%
Plan fiduciary net position as a percentage of the total pension liability 57.89% 58.59%
2014 through 2007
Corrections Officer Retirement Plan—Administrative Office of the Courts
Reporting Fiscal Year(Measurement Date)
2016 2015(2015) (2014)
County’s proportion of the net pension liability 1.87% 1.89% InformationCounty’s proportionate share of the net pension liability $ 14,583,025 $ 12,687,065 not availableState's proportionate share of the net pension liability
associated with the County 4,546,380 3,889,972 Total $ 19,129,405 $ 16,577,037 County’s covered payroll $ 1,695,740 $ 1,740,635 County’s proportionate share of the net pension liability as a percentage of its covered payroll 859.98% 728.88%
Plan fiduciary net position as a percentage of the total pension liability 28.32% 31.91%
Elected Officials Retirement Plan Reporting Fiscal Year(Measurement Date)
2014 through 2007
112
Coconino CountyRequired Supplementary Information
Schedule of the County’s Proportionate Share of the Net Pension LiabilityCost-Sharing Pension Plans
June 30, 2016
See accompanying notes to pension plan schedules.

2016 2015(2015) (2014)
Total pension liability InformationService cost $ 542,285 $ 526,940 not availableInterest on the total pension liability 3,045,276 2,499,646 Changes of benefit terms - 1,149,553 Differences between expected and actual experience in the measurement of the pension liability (519,453) 40,499
Changes of assumptions or other inputs - 5,497,276 Benefit payments, including refunds of employee contributions (2,740,615) (2,801,153)
Net change in total pension liability 327,493 6,912,761 Total pension liability—beginning 39,892,490 32,979,729 Total pension liability—ending (a) $ 40,219,983 $ 39,892,490
Plan fiduciary net positionContributions—employer $ 1,798,480 $ 1,717,418 Contributions—employee 451,605 342,096 Net investment income 360,105 1,251,743 Benefit payments, including refunds of employee contributions (2,740,615) (2,801,153)
Administrative expense (9,163) (10,081)Other changes 37,644 24,720
Net change in plan fiduciary net position (101,944) 524,743 Plan fiduciary net position—beginning 9,933,371 9,408,628 Plan fiduciary net position—ending (b) $ 9,831,427 $ 9,933,371
County’s net pension liability—ending (a) – (b) $ 30,388,556 $ 29,959,119
Plan fiduciary net position as a percentage of the total pension liability 24.44% 24.90%
Covered payroll $ 3,241,732 $ 3,069,559
County’s net pension liability as a percentage of covered payroll 937.42% 976.01%
Public Safety Personnel Retirement System - Sheriff Reporting Fiscal Year(Measurement Date)
2014 through 2007
113
Coconino CountyRequired Supplementary InformationSchedule of Changes in the County’s
Net Pension Liability and Related RatiosAgent Pension Plans
June 30, 2016
See accompanying notes to pension plan schedules.

2016 2015(2015) (2014)
Total pension liability InformationService cost $ 486,259 $ 536,007 not availableInterest on the total pension liability 694,602 588,300 Changes of benefit terms - 43,775 Differences between expected and actual experience in the measurement of the pension liability (79,768) 124,233
Changes of assumptions or other inputs - 448,734 Benefit payments, including refunds of employee contributions (286,223) (437,813)
Net change in total pension liability 814,870 1,303,236 Total pension liability—beginning 8,748,409 7,445,173 Total pension liability—ending (a) $ 9,563,279 $ 8,748,409
Plan fiduciary net positionContributions—employer $ 296,134 $ 313,756 Contributions—employee 312,482 320,700 Net investment income 246,544 788,339 Benefit payments, including refunds of employee contributions (286,223) (437,813)
Administrative expense (6,468) (6,198)Other changes (5,389) (67,789)
Net change in plan fiduciary net position 557,080 910,995 Plan fiduciary net position—beginning 6,557,432 5,646,437 Plan fiduciary net position—ending (b) $ 7,114,512 $ 6,557,432
County’s net pension liability—ending (a) – (b) $ 2,448,767 $ 2,190,977
Plan fiduciary net position as a percentage of the total pension liability 74.39% 74.96%
Covered payroll $ 3,705,907 $ 3,669,661
County’s net pension liability as a percentage of covered payroll 66.08% 59.71%
Correction Officers Retirement Plan - Detention Reporting Fiscal Year(Measurement Date)
2014 through 2007
114
Coconino CountyRequired Supplementary InformationSchedule of Changes in the County’s
Net Pension Liability and Related RatiosAgent Pension Plans
June 30, 2016
See accompanying notes to pension plan schedules.

Arizona State Retirement System
2016 2015 20142013
through 2007
Statutorily required contribution $ 4,071,019 $ 3,929,303 $ 3,829,124 InformationCounty’s contributions in relation to the statutorily required contribution 4,071,019 3,929,303 3,829,124 not
availableCounty’s contribution deficiency (excess) $ $ $ County’s covered payroll $ 37,520,908 $36,081,751 $35,786,206 County’s contributions as a percentage of covered payroll 10.85% 10.89% 10.70%
Reporting Fiscal Year
Correction Officer Retirement Plan -Administrative Office of the Courts
2016 2015 20142013
through 2007
Statutorily required contribution $ 642,596 $ 525,370 $ 503,137 InformationCounty’s contributions in relation to the statutorily required contribution 642,596 525,370 503,137 not
availableCounty’s contribution deficiency (excess) $ $ $ County’s covered payroll $ 3,364,379 $ 3,530,713 $ 3,481,917 County’s contributions as a percentage of covered payroll 19.10% 14.88% 14.45%
Reporting Fiscal Year
Elected Officials Retirement Plan
2016 2015 20142013
through 2007
Statutorily required contribution $ 394,136 $ 398,499 $ 403,131 InformationCounty’s contributions in relation to the statutorily required contribution 394,136 398,499 403,131 not
availableCounty’s contribution deficiency (excess) $ $ $ County’s covered payroll $ 1,677,173 $ 1,695,740 $ 1,740,635 County’s contributions as a percentage of covered payroll 23.50% 23.50% 23.16%
Reporting Fiscal Year
115
Coconino CountyRequired Supplementary Information
Schedule of County Pension ContributionsJune 30, 2016
See accompanying notes to pension plan schedules.
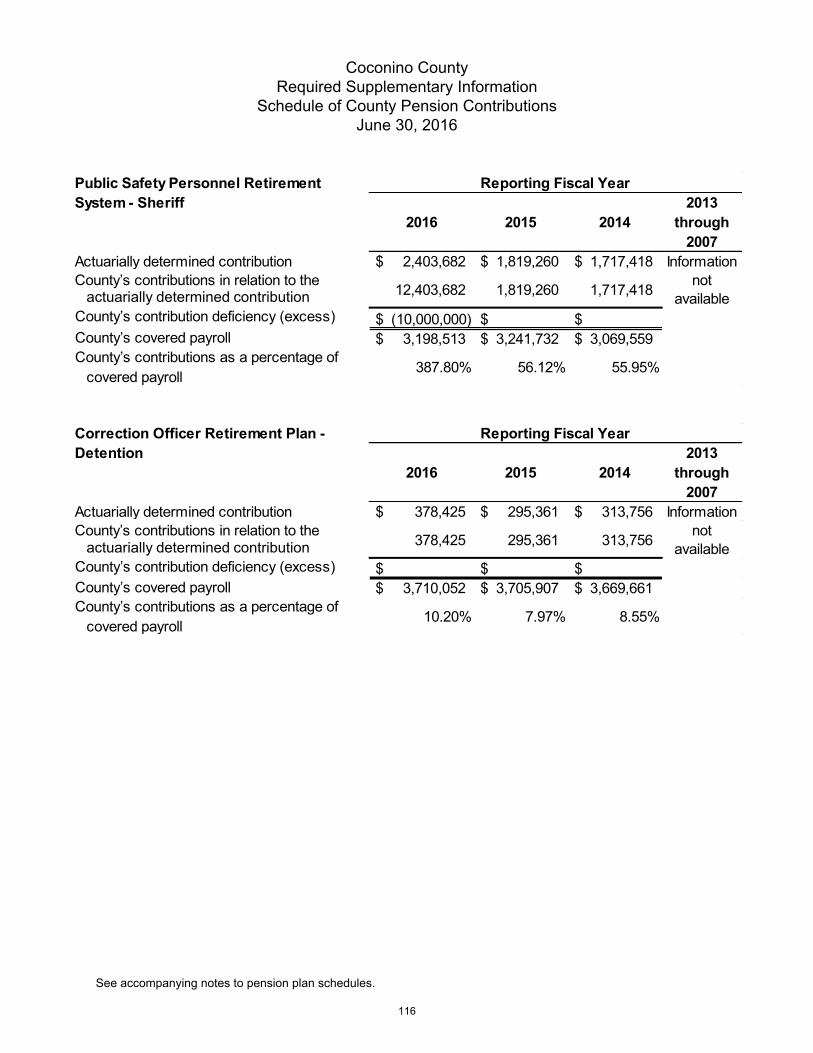
Public Safety Personnel RetirementSystem - Sheriff
2016 2015 20142013
through2007
Actuarially determined contribution $ 2,403,682 $ 1,819,260 $ 1,717,418 InformationCounty’s contributions in relation to the 12,403,682 1,819,260 1,717,418 not
available$ (10,000,000) $ $$ 3,198,513 $ 3,241,732 $ 3,069,559
actuarially determined contribution
County’s contribution deficiency (excess)
County’s covered payrollCounty’s contributions as a percentage of
covered payroll 387.80% 56.12% 55.95%
Reporting Fiscal Year
Correction Officer Retirement Plan -Detention
2016 2015 20142013
through2007
Actuarially determined contribution $ 378,425 $ 295,361 $ 313,756 InformationCounty’s contributions in relation to the 378,425 295,361 313,756 not
available$ $ $$ 3,710,052 $ 3,705,907 $ 3,669,661
actuarially determined contribution
County’s contribution deficiency (excess)
County’s covered payrollCounty’s contributions as a percentage of
covered payroll 10.20% 7.97% 8.55%
Reporting Fiscal Year
116
Coconino CountyRequired Supplementary Information
Schedule of County Pension ContributionsJune 30, 2016
See accompanying notes to pension plan schedules.

Note 1 – Actuarially Determined Contribution Rates
Actuarial determined contribution rates for PSPRS and CORP are calculated as of June 30 two years prior to the end of the fiscal year in which contributions are made. The actuarial methods and assumptions used to establish the contribution requirements are as follows:
Actuarial cost method Entry age normal Amortization method Level percent closed for unfunded actuarial accrued
liability, open for excess Remaining amortization
period as of the 2014 actuarial valuation
22 years for unfunded actuarial accrued liability, 20 years for excess
Asset valuation method 7-year smoothed market value; 80%/120% market corridor
Actuarial assumptions: Investment rate of return In the 2013 actuarial valuation, the investment rate of
return was decreased from 8.0% to 7.85% Projected salary increases In the 2014 actuarial valuation, projected salary
increases were decreased from 4.5%–8.5% to 4.0%–8.0% for PSPRS and from 4.5%–7.75% to 4.0%–7.25% for CORP. In the 2013 actuarial valuation, projected salary increases were decreased from 5.0%–9.0% to 4.5%–8.5% for PSPRS and from 5.0%–8.25% to 4.5%–7.75% for CORP
Wage growth In the 2014 actuarial valuation, wage growth was decreased from 4.5% to 4.0% for PSPRS and CORP. In the 2013 actuarial valuation, wage growth was decreased from 5.0% to 4.5% for PSPRS and CORP
Retirement age Experience-based table of rates that is specific to the type of eligibility condition. Last updated for the 2012 valuation pursuant to an experience study of the period July 1, 2006 - June 30, 2011.
Mortality RP-2000 mortality table (adjusted by 105% for both males and females)
Note 2 - Factors That Affect Trends
In fiscal year 2016, the County made a $10 million excess payment to reduce the PSPRS unfunded liability which significantly affected the trends in the amounts reported. Had the County only made the actuarially determined contribution, the County’s contribution as a percentage of covered payroll would have been 75.15% for the 2016 fiscal year.
117
Coconino CountyRequired Supplementary Information
Notes to Pension Plan SchedulesJune 30, 2016

Health Insurance Premium Benefit
Valuation Date
Actuarial Value ofAssets
(a)
Actuarial Accrued
Liability (AAL)(b)
Unfunded AAL (UAAL)
(b-a)
Funded ratio(a/b)
Annual Covered Payroll
(c)
UAAL as a % of
Covered Payroll
((b-a)/c))
PSPRS Sheriff6/30/2016 647,863$ 834,307$ 186,444$ 77.65% 2,845,463$ 6.55%6/30/2015 633,475 798,157 164,682 79.37% 3,122,030 5.27%6/30/2014 587,700 776,530 188,830 75.68% 2,950,184 6.40%
CORP Detention6/30/2016 468,299$ 424,012$ (44,287)$ 110.44% 3,421,091$ (1.29)%6/30/2015 444,438 402,809 (41,629) 110.33% 3,670,869 (1.13)%6/30/2014 400,984 366,967 (34,017) 109.27% 3,488,706 (0.98)%
Coconino County Postemployment Healthcare Plan7/1/2015 8,119,959$ 8,119,959$ 0.00% 49,643,004$ 16.36%7/1/2013 8,472,061 8,472,061 0.00% 49,547,980 17.10%7/1/2011 9,911,098 9,911,098 0.00% 48,579,979 20.40%
118
Coconino CountyRequired Supplementary Information
Schedule of Agent Retirement Plans’ and Coconino CountyPostemployment Healthcare Plan’s Funding Progress
June 30, 2016
See accompanying notes to schedule of agent OPEB plans’ funding progress.

Note 1 – Actuarial Information Available
New actuarial measurements are required by GASB 45 to be made biennially for the Coconino County Postemployment Healthcare Plan. The County used the most recent actuarial valuation, since the full actuarial valuation as of July 1, 2016 was not available.
Note 2 – Factors That Affect the Identification of Trends
Beginning in fiscal year 2014, PSPRS and CORP established separate funds for pension benefits and health insurance premium benefits. Previously, the plans recorded both pension and health insurance premium contributions in the same Pension Fund. During fiscal year 2014, the plans transferred prior-year health insurance premium benefit contributions that exceeded benefit payments from each plan’s Pension Fund to the new Health Insurance Fund.
119
Coconino County Required Supplementary Information
Notes to Schedule of Agent Retirement Plans’ and Coconino County Postemployment Healthcare Plan’s Funding Progress
June 30, 2016

THIS PAGE BLANK
120

COMBINING AND INDIVIDUAL FUND STATEMENTS AND SCHEDULES
NONMAJOR GOVERNMENTAL FUNDS
121

THIS PAGE BLANK
122

Special Revenue Funds
Adult Probation Grants and Fees – accounts for various Adult Probation programs provided by a combination of grants and fees.
Assessor Storage and Retrieval – accounts for the collection and use of a special recording surcharge, not to exceed four dollars, to be used to convert the assessor’s property information and storage retrieval system to micrographics or computer automation, as established by A.R.S. 11-269.06.
Career Center Grants – accounts for various federal and state employment grants, such as the Workforce Investment Act and the Youthbuild Program.
Clerk of the Superior Court Grants and Fees – accounts for various Clerk of the Court programs provided by a combination of grants and fees.
Community Services Grants and Fees – accounts for various public assistance programs provided by a combination of grants and fees.
Conciliation Court – this program provides a means for the reconciliation of spouses and the amicable settlement of domestic and family controversies. This program is funded by fees collected under A.R.S. 25-381.
County Attorney Grants and Fees – accounts for various County Attorney programs funded by a combination of fees, grants and forfeiture. Programs included Anti-Racketeering, Attorney Enhancement and Victim Rights.
County Improvement Districts – Special Revenue – accounts for the operation of various Road Maintenance Districts and the Kachina Village Water and Wastewater operations.
County Library District – accounts for the provision and maintenance of libraries and library services through the County. Funded by a secondary property tax levy.
Emergency Services Grants – accounts for various federal and state grants that fund purchases of equipment and disaster planning and training.
Flood Control District Fund – accounts for flood control services that are funded by a $0.4000 per $100 of assessed valuation property tax.
Inmate Welfare – accounts for funds held in trust for the benefit and welfare of inmates, established under A.R.S. 31-121. Revenues are derived from sales of commissary items to inmates and pay phone usage.
Jail Enhancement – accounts for state funds established under A.R.S. 41-2401.D.9. to be used to enhance county jail facilities and operations.
Justice Courts Grants and Fees – accounts for various Justice Court programs provided by a combination of grants and fees
Coconino CountyListing of Nonmajor Governmental Funds
Year Ended June 30, 2016
123

Juvenile Court Grants and Fees – accounts for various Juvenile Probation programs, including Juvenile Court, provided by a combination of grants and fees
Legal Defender Grants and Fees – accounts for various Legal Defender programs provided by a combination of grants and fees
National Forest Fees – accounts for funds received under the federal Secure Rural Schools and Community Self-Determination Act of 2000. These funds may be used to fund schools, roads, search and rescue, and wildlife protection.
Parks and Recreation Grants and Fees – accounts for various parks programs funded by federal and state grants, fees and General Fund transfers. These programs include the County Fair and the County Horse Races.
Public Defender Grants and Fees – accounts for various Public Defender programs provided by a combination of grants and fees
Recorder Storage and Retrieval – accounts for a recording surcharge, established by A.R.S. 11-475.01, to be used to defray the cost of converting the Recorder’s documentand storage retrieval system to micrographics or computer automation.
School Superintendent Grants and Fees – accounts for various Schools programs, including the Accommodation School, provided by a combination of grants and fees
Sheriff Grants and Fees – accounts for various Sheriff programs provided by a combination of grants and fees
Solid Waste – accounts for the costs of providing solid waste services, including the operation of transfer stations and payments for the use of the City of Flagstaff landfill. Funded by a combination of grants, fees and General Fund transfers.
Superior Court Grants and Fees – accounts for various Superior Court programs provided by a combination of grants and fees
Taxpayer Information Fund – accounts for fees collected by the County Treasurer, established by A.R.S. 11-495, to be used to upgrade an automated taxpayer information system.
Other Special Revenue Funds – accounts for other small grants and fees.
Coconino CountyListing of Nonmajor Governmental Funds
Year Ended June 30, 2016
124

Debt Service Fund
County Improvement Districts – Debt Service – accounts for special assessment collected for the payment of principal and interest on the revenue bonds issued for special assessment bonds issued by various county improvement districts, or National Forest Fees loans, for road improvements.
Capital Projects Funds
Accommodation School – accounts for various grants used to fund capital improvements for the Accommodation School.
County Improvement Districts – Capital Projects – accounts for the construction of road improvements in various county improvement districts, funded by special assessment bonds, assessment payments by benefiting property owners and National Forest Fees contributions or loans.
Other Capital Projects Funds – accounts for other small capital projects funded by fees, grants and transfers from the General Fund.
Coconino CountyListing of Nonmajor Governmental Funds
Year Ended June 30, 2016
125

Adult Probation Grants and Fees
Assessor Storage and
RetrievalCareer Center
Grants
Clerk of the Superior Court
Grants and FeesAssets
Cash and cash equivalents 743,696$ 8,105$ $ 349,572$ Investments Cash and investments held by trustee Receivables (net of allowances for
uncollectibles): Property taxes Accounts 3,607 Special assessments Accrued interest 1,529 675 Advances to other funds
Due from: Other funds 105,336 16,308 2,596
Other governments 34,580 118,307 Prepaid items 229
Total assets 888,977$ 8,105$ 134,615$ 352,843$
Liabilities and Fund BalancesLiabilities:
Accounts payable 62,942$ 55$ 20,986$ $ Accrued payroll and employee benefits 89,812 29,908 3,021 Advances from other funds Due to:
Other funds 2,968 77,111 Other governments Deposits held for others Unearned revenue
Total liabilities 155,722 55 128,005 3,021
Deferred Inflows of Resources Unavailable revenue
Total deferred inflows of resources
Fund balances: Nonspendable 229 Restricted 733,026 8,050 6,610 349,822 Unassigned
Total fund balances 733,255 8,050 6,610 349,822 Total liabilities, deferred inflows of resources, and fund balances 888,977$ 8,105$ 134,615$ 352,843$
Special Revenue
Coconino CountyCombining Balance Sheet
Nonmajor Governmental FundsJune 30, 2016
126

Assets Cash and cash equivalents Investments Cash and investments held by trustee Receivables (net of allowances for
uncollectibles): Property taxes Accounts Special assessments Accrued interest Advances to other funds
Due from: Other funds
Other governments Prepaid items
Total assets
Liabilities and Fund BalancesLiabilities:
Accounts payable Accrued payroll and employee benefits Advances from other funds Due to:
Other funds Other governments Deposits held for others Unearned revenue
Total liabilities
Deferred Inflows of Resources Unavailable revenue
Total deferred inflows of resources
Fund balances: Nonspendable Restricted Unassigned
Total fund balances Total liabilities, deferred inflows of resources, and fund balances
Coconino CountyCombining Balance Sheet
ajor Governmental FundsJune 30, 2016
Community Services Grants
and FeesConciliation
Court
County Attorney Grants and
Fees
County Improvement
Districts-Special Revenue
$ 39,481$ 338,162$ 1,353,220$ 457,572
30,209
13,727 7,809 105,421
480 74 744 2,545
690,882 225,970 48092,123 5,705 44,220 15,213
797,212$ 45,260$ 1,104,686$ 1,476,879$
32,198$ 788$ 27,120$ 74,800$ 28,033 1,307 14,189 19,116
590,977 209,667 7,132
11,972 20,440
663,180 2,095 250,976 121,488
15,21315,213
134,032 43,165 853,710 1,340,178
134,032 43,165 853,710 1,340,178
797,212$ 45,260$ 1,104,686$ 1,476,879$
Special Revenue
Coconino County Combining Balance Sheet
Nonmajor Governmental Funds (Continued) June 30, 2016
127

Assets Cash and cash equivalents Investments Cash and investments held by trustee Receivables (net of allowances for
uncollectibles): Property taxes Accounts Special assessments Accrued interest Advances to other funds
Due from: Other funds
Other governments Prepaid items
Total assets
Liabilities and Fund BalancesLiabilities:
Accounts payable Accrued payroll and employee benefits Advances from other funds Due to:
Other funds Other governments Deposits held for others Unearned revenue
Total liabilities
Deferred Inflows of Resources Unavailable revenue
Total deferred inflows of resources
Fund balances: Nonspendable Restricted Unassigned
Total fund balances Total liabilities, deferred inflows of resources, and fund balances
Coconino CountyCombining Balance Sheet
ajor Governmental FundsJune 30, 2016
County Library District
Emergency Services Grants
Flood Control District Fund Inmate Welfare
141,489$ $ $ 241,332$
145,988 84,40210,789
380 382
92,472 11,453 49,7383,429 5,032
380,329$ 14,882$ 139,172$ 252,503$
95,628$ 18,943$ 35,967$ 2,112$ 8,050 12,939 4,372
1,000,000
124,553 123,500 963
95,628 151,546 1,172,406 7,447
123,341 3,004 65,898 10,196123,341 3,004 65,898 10,196
161,360 234,860(139,668) (1,099,132)
161,360 (139,668) (1,099,132) 234,860
380,329$ 14,882$ 139,172$ 252,503$
Special Revenue
Coconino County Combining Balance Sheet
Nonmajor Governmental Funds (Continued) June 30, 2016
128

Assets Cash and cash equivalents Investments Cash and investments held by trustee Receivables (net of allowances for
uncollectibles): Property taxes Accounts Special assessments Accrued interest Advances to other funds
Due from: Other funds
Other governments Prepaid items
Total assets
Liabilities and Fund BalancesLiabilities:
Accounts payable Accrued payroll and employee benefits Advances from other funds Due to:
Other funds Other governments Deposits held for others Unearned revenue
Total liabilities
Deferred Inflows of Resources Unavailable revenue
Total deferred inflows of resources
Fund balances: Nonspendable Restricted Unassigned
Total fund balances Total liabilities, deferred inflows of resources, and fund balances
Coconino CountyCombining Balance Sheet
ajor Governmental FundsJune 30, 2016
Jail Enhancement
Justice Courts Grants and Fees
Juvenile Court Grants and
Fees
Legal Defender Grants and
Fees
693,885$ 832,981$ 907,079$ 8,490$
112 17
1,344 1,481 1,896 16
12,026 5,97315,514 1,867 2,111 621
1,689 350712,544$ 836,346$ 923,462$ 15,100$
7,286$ 8,133$ 51,090$ 933$ 4,339 65,837
296,390 15,856 5,708
7,286 308,862 132,783 6,641
1414
1,689 350703,555 527,484 790,329 8,459
705,244 527,484 790,679 8,459
712,544$ 836,346$ 923,462$ 15,100$
Special Revenue
Coconino County Combining Balance Sheet
Nonmajor Governmental Funds (Continued) June 30, 2016
129

Assets Cash and cash equivalents Investments Cash and investments held by trustee Receivables (net of allowances for
uncollectibles): Property taxes Accounts Special assessments Accrued interest Advances to other funds
Due from: Other funds
Other governments Prepaid items
Total assets
Liabilities and Fund BalancesLiabilities:
Accounts payable Accrued payroll and employee benefits Advances from other funds Due to:
Other funds Other governments Deposits held for others Unearned revenue
Total liabilities
Deferred Inflows of Resources Unavailable revenue
Total deferred inflows of resources
Fund balances: Nonspendable Restricted Unassigned
Total fund balances Total liabilities, deferred inflows of resources, and fund balances
Coconino CountyCombining Balance Sheet
ajor Governmental FundsJune 30, 2016
National Forest Fees
Parks and Recreation
Grants and Fees
Public Defender Grants and
Fees
Recorder Storage and
Retrieval
5,481,750$ 581,237$ 76,979$ 385,282$
119 12
10,262 1,115 153 715
53,7565,978 34,562
4435,492,012$ 582,352$ 137,428$ 420,571$
$ 70,917$ 9,038$ 4$ 5,966 113
113,799 13,703 53,875
14,971113,799 105,557 62,913 117
4435,378,213 476,795 74,072 420,454
5,378,213 476,795 74,515 420,454
5,492,012$ 582,352$ 137,428$ 420,571$
Special Revenue
Coconino County Combining Balance Sheet
Nonmajor Governmental Funds (Continued) June 30, 2016
130

Assets Cash and cash equivalents Investments Cash and investments held by trustee Receivables (net of allowances for
uncollectibles): Property taxes Accounts Special assessments Accrued interest Advances to other funds
Due from: Other funds
Other governments Prepaid items
Total assets
Liabilities and Fund BalancesLiabilities:
Accounts payable Accrued payroll and employee benefits Advances from other funds Due to:
Other funds Other governments Deposits held for others Unearned revenue
Total liabilities
Deferred Inflows of Resources Unavailable revenue
Total deferred inflows of resources
Fund balances: Nonspendable Restricted Unassigned
Total fund balances Total liabilities, deferred inflows of resources, and fund balances
Coconino CountyCombining Balance Sheet
ajor Governmental FundsJune 30, 2016
School Superintendent
Grants and FeesSheriff Grants
and Fees Solid Waste
Superior Court Grants and
Fees
1,480,333$ 220,212$ $ 359,962$
17,191 129 704
3,465 617 358
72,869 134,759 209,077 286,282743,396 131,636 116,604 4,020
34,375 4752,351,629$ 487,224$ 325,810$ 651,801$
96,391$ 10,097$ 100,031$ 52,729$ 16,154 26,753 3,903 14,458
62,757 221,860 101,767
112,545 99,607 325,794 168,954
238,053238,053
34,375 4751,966,656 387,617 16 482,372
2,001,031 387,617 16 482,847
2,351,629$ 487,224$ 325,810$ 651,801$
Special Revenue
Coconino County Combining Balance Sheet
Nonmajor Governmental Funds (Continued) June 30, 2016
131

Assets Cash and cash equivalents Investments Cash and investments held by trustee Receivables (net of allowances for
uncollectibles): Property taxes Accounts Special assessments Accrued interest Advances to other funds
Due from: Other funds
Other governments Prepaid items
Total assets
Liabilities and Fund BalancesLiabilities:
Accounts payable Accrued payroll and employee benefits Advances from other funds Due to:
Other funds Other governments Deposits held for others Unearned revenue
Total liabilities
Deferred Inflows of Resources Unavailable revenue
Total deferred inflows of resources
Fund balances: Nonspendable Restricted Unassigned
Total fund balances Total liabilities, deferred inflows of resources, and fund balances
Coconino CountyCombining Balance Sheet
ajor Governmental FundsJune 30, 2016
Debt Service
Taxpayer Information Fund
Other Special Revenue Funds
County Improvement Districts-Debt
Service
76,888$ $ 195,695$
153,644147 756
111,705
77,035$ 111,705$ 350,095$
1,551$ $ $ 4,003
1,783
107,690
1,551 111,693 1,783
153,644153,644
75,484 12 194,668
75,484 12 194,668
77,035$ 111,705$ 350,095$
Special Revenue
Coconino County Combining Balance Sheet
Nonmajor Governmental Funds (Continued) June 30, 2016
132

Assets Cash and cash equivalents Investments Cash and investments held by trustee Receivables (net of allowances for
uncollectibles): Property taxes Accounts Special assessments Accrued interest Advances to other funds
Due from: Other funds
Other governments Prepaid items
Total assets
Liabilities and Fund BalancesLiabilities:
Accounts payable Accrued payroll and employee benefits Advances from other funds Due to:
Other funds Other governments Deposits held for others Unearned revenue
Total liabilities
Deferred Inflows of Resources Unavailable revenue
Total deferred inflows of resources
Fund balances: Nonspendable Restricted Unassigned
Total fund balances Total liabilities, deferred inflows of resources, and fund balances
Coconino CountyCombining Balance Sheet
ajor Governmental FundsJune 30, 2016
Accommodation School
County Improvement
Districts-Capital Projects
Other Capital Projects Funds
Total Nonmajor Governmental
Funds
110,661$ 426,462$ 3,006,198$ 18,059,151$ 73,004 72,014 602,590
30,209
230,390159,637153,644
211 982 5,764 36,091
6,570 2,088,2524,951 1,379,869
37,561115,823$ 500,448$ 3,090,546$ 22,777,394$
1$ 1$ $ 779,741$ 352,273
1,001,783
2,130,276
32,41214,971
1 1 4,311,456
609,363609,363
37,561115,822 500,447 3,090,546 19,057,814
(1,238,800)
115,822 500,447 3,090,546 17,856,575
115,823$ 500,448$ 3,090,546$ 22,777,394$
Capital Projects
Coconino County Combining Balance Sheet
Nonmajor Governmental Funds (Continued) June 30, 2016
133

Adult Probation Grants and
Fees
Assessor Storage and
RetrievalCareer Center
Grants
Clerk of the Superior Court
Grants and Fees
Revenues: Property taxes $ $ $ $ County sales taxes Special assessments Licenses and permits Fees, fines, and forfeits Intergovernmental 2,219,770 754,918 Charges for services 636,569 55,902 Investment earnings 9,801 28 4,729 Contributions Miscellaneous
Total revenues 2,866,140 754,946 60,631
Expenditures: Current:
General government 1,580 98,908 Public safety 2,878,535 Highways and streets Sanitation Welfare 813,348 Culture and recreation Education
Capital outlay Debt service: Principal Interest and other charges Total expenditures 2,878,535 1,580 813,348 98,908
Excess (deficiency) of revenues over expenditures (12,395) (1,580) (58,402) (38,277)
Other financing sources (uses): Sale of capital assets 1,235 Transfers in 105,336 55,495 2,596 Transfers out Total other financing sources (uses) 106,571 55,495 2,596
Net changes in fund balances 94,176 (1,580) (2,907) (35,681)
Fund balances, July 1, 2015 639,079 9,630 9,517 385,503Fund balances, June 30, 2016 733,255$ 8,050$ 6,610$ 349,822$
Special Revenue
Coconino CountyCombining Statement of Revenues, Expenditures,
and Changes in Fund BalancesNonmajor Governmental Funds
Year Ended June 30, 2016
134

Revenues: Property taxes County sales taxes Special assessments Licenses and permits Fees, fines, and forfeits Intergovernmental Charges for services Investment earnings Contributions Miscellaneous
Total revenues
Expenditures: Current:
General government Public safety Highways and streets Sanitation Welfare Culture and recreation Education
Capital outlay Debt service: Principal Interest and other charges Total expenditures
Excess (deficiency) of revenues over expenditures
Other financing sources (uses): Sale of capital assets Transfers in Transfers out Total other financing sources (uses)
Net changes in fund balances
Fund balances, July 1, 2015Fund balances, June 30, 2016
Coconino Countyent of Revenues, Expenditures,
Changes in Fund Balancesmajor Governmental Fundsear Ended June 30, 2016
Community Services Grants
and FeesConciliation
CourtCounty Attorney Grants and Fees
County Improvement
Districts-Special Revenue
$ $ $ $
11,198
513,7471,048,933 8,387 444,971
21,592 41,127 31,893 1,174,9253,799 589 24,589 18,897
84,33071,039 21,653
1,229,693 50,103 1,015,200 1,226,673
2,686 64,815 904,270
1,426,3221,889,802
1,892,488 64,815 904,270 1,426,322
(662,795) (14,712) 110,930 (199,649)
846,506 258,146(60,258) (297,086)786,248 (38,940)
123,453 (14,712) 71,990 (199,649)
10,579 57,877 781,720 1,539,827134,032$ 43,165$ 853,710$ 1,340,178$
Special Revenue
Coconino County Combining Statement of Revenues, Expenditures,
and Changes in Fund BalancesNonmajor Governmental Funds (Continued)
Year Ended June 30, 2016
135

Revenues: Property taxes County sales taxes Special assessments Licenses and permits Fees, fines, and forfeits Intergovernmental Charges for services Investment earnings Contributions Miscellaneous
Total revenues
Expenditures: Current:
General government Public safety Highways and streets Sanitation Welfare Culture and recreation Education
Capital outlay Debt service: Principal Interest and other charges Total expenditures
Excess (deficiency) of revenues over expenditures
Other financing sources (uses): Sale of capital assets Transfers in Transfers out Total other financing sources (uses)
Net changes in fund balances
Fund balances, July 1, 2015Fund balances, June 30, 2016
Coconino Countyent of Revenues, Expenditures,
Changes in Fund Balancesmajor Governmental Fundsear Ended June 30, 2016
County Library District
Emergency Services Grants
Flood Control District Fund Inmate Welfare
3,925,585$ $ 2,438,276$ $ 5,682
4,650
253,492 2,289,356106,506
5,377 2,46090,336 547 10,623
126,0404,026,980 254,039 4,742,905 235,006
351,883 2,770,832 219,540
3,939,470
3,939,470 351,883 2,770,832 219,540
87,510 (97,844) 1,972,073 15,466
129,568 49,738(92,472)(92,472) 129,568 49,738
(4,962) 31,724 2,021,811 15,466
166,322 (171,392) (3,120,943) 219,394161,360$ (139,668)$ (1,099,132)$ 234,860$
Special Revenue
Coconino County Combining Statement of Revenues, Expenditures,
and Changes in Fund BalancesNonmajor Governmental Funds (Continued)
Year Ended June 30, 2016
136
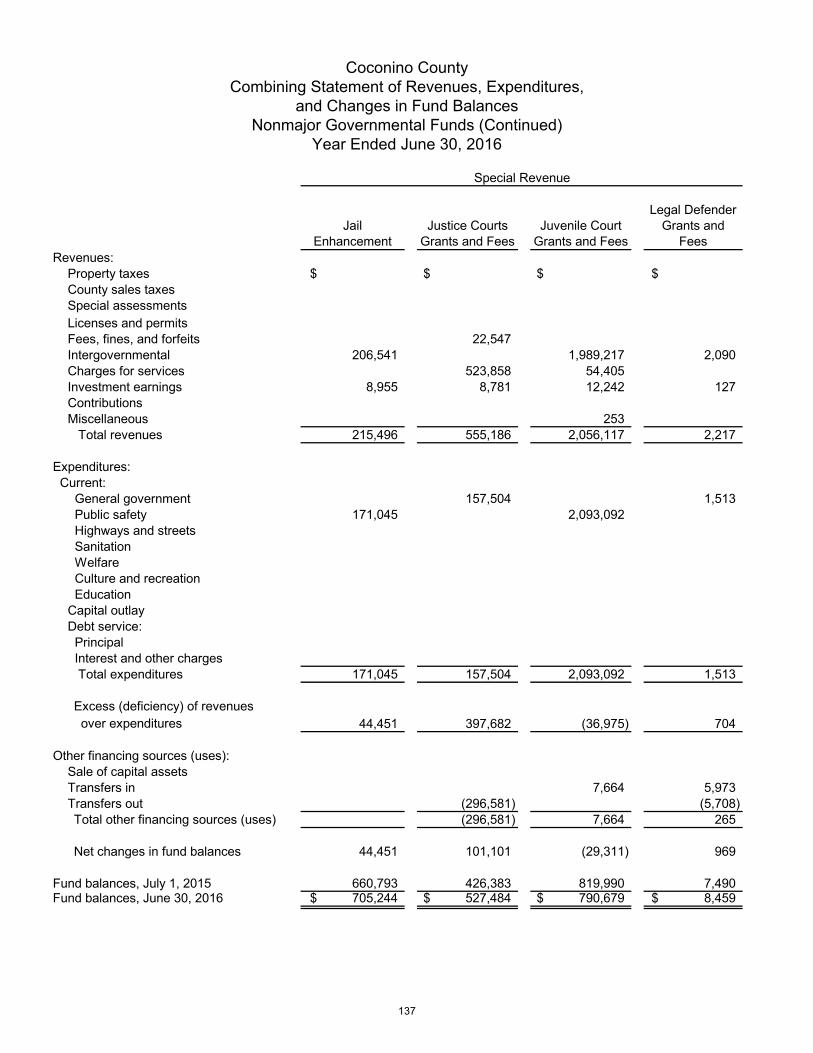
Revenues: Property taxes County sales taxes Special assessments Licenses and permits Fees, fines, and forfeits Intergovernmental Charges for services Investment earnings Contributions Miscellaneous
Total revenues
Expenditures: Current:
General government Public safety Highways and streets Sanitation Welfare Culture and recreation Education
Capital outlay Debt service: Principal Interest and other charges Total expenditures
Excess (deficiency) of revenues over expenditures
Other financing sources (uses): Sale of capital assets Transfers in Transfers out Total other financing sources (uses)
Net changes in fund balances
Fund balances, July 1, 2015Fund balances, June 30, 2016
Coconino Countyent of Revenues, Expenditures,
Changes in Fund Balancesmajor Governmental Fundsear Ended June 30, 2016
Jail Enhancement
Justice Courts Grants and Fees
Juvenile Court Grants and Fees
Legal Defender Grants and
Fees
$ $ $ $
22,547206,541 1,989,217 2,090
523,858 54,4058,955 8,781 12,242 127
253215,496 555,186 2,056,117 2,217
157,504 1,513171,045 2,093,092
171,045 157,504 2,093,092 1,513
44,451 397,682 (36,975) 704
7,664 5,973(296,581) (5,708)(296,581) 7,664 265
44,451 101,101 (29,311) 969
660,793 426,383 819,990 7,490705,244$ 527,484$ 790,679$ 8,459$
Special Revenue
Coconino County Combining Statement of Revenues, Expenditures,
and Changes in Fund BalancesNonmajor Governmental Funds (Continued)
Year Ended June 30, 2016
137
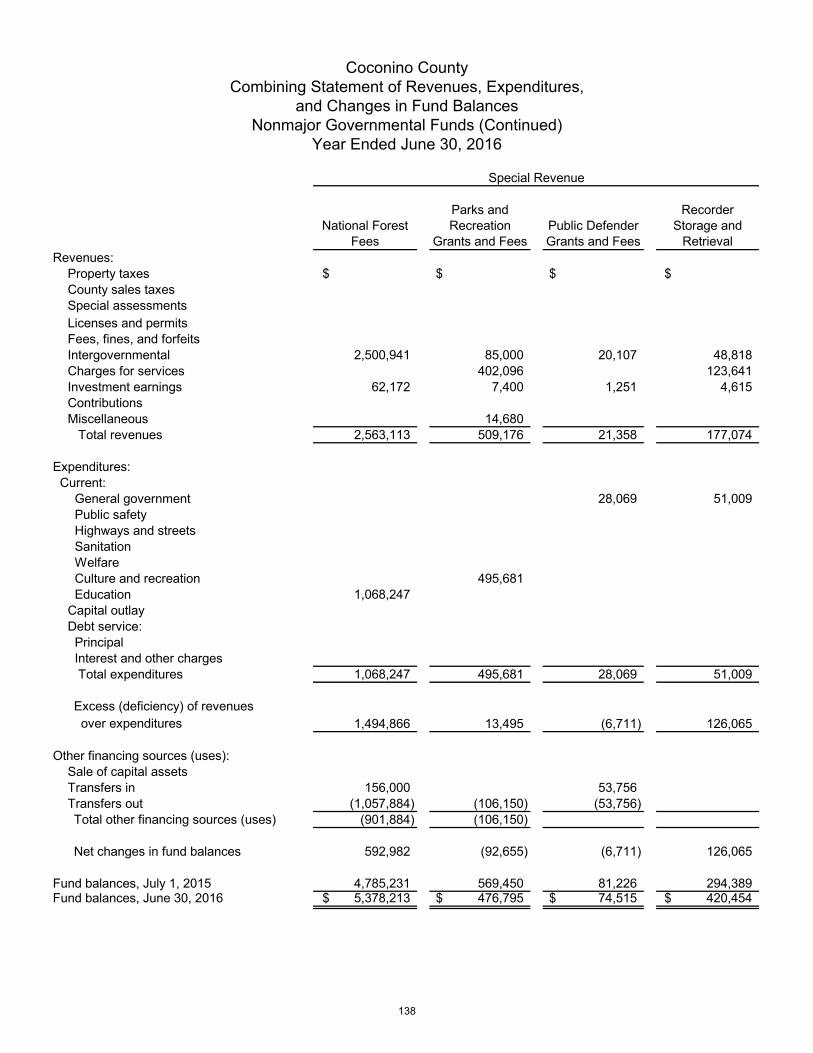
Revenues: Property taxes County sales taxes Special assessments Licenses and permits Fees, fines, and forfeits Intergovernmental Charges for services Investment earnings Contributions Miscellaneous
Total revenues
Expenditures: Current:
General government Public safety Highways and streets Sanitation Welfare Culture and recreation Education
Capital outlay Debt service: Principal Interest and other charges Total expenditures
Excess (deficiency) of revenues over expenditures
Other financing sources (uses): Sale of capital assets Transfers in Transfers out Total other financing sources (uses)
Net changes in fund balances
Fund balances, July 1, 2015Fund balances, June 30, 2016
Coconino Countyent of Revenues, Expenditures,
Changes in Fund Balancesmajor Governmental Fundsear Ended June 30, 2016
National Forest Fees
Parks and Recreation
Grants and FeesPublic Defender Grants and Fees
Recorder Storage and
Retrieval
$ $ $ $
2,500,941 85,000 20,107 48,818402,096 123,641
62,172 7,400 1,251 4,615
14,6802,563,113 509,176 21,358 177,074
28,069 51,009
495,6811,068,247
1,068,247 495,681 28,069 51,009
1,494,866 13,495 (6,711) 126,065
156,000 53,756(1,057,884) (106,150) (53,756)
(901,884) (106,150)
592,982 (92,655) (6,711) 126,065
4,785,231 569,450 81,226 294,3895,378,213$ 476,795$ 74,515$ 420,454$
Special Revenue
Coconino County Combining Statement of Revenues, Expenditures,
and Changes in Fund BalancesNonmajor Governmental Funds (Continued)
Year Ended June 30, 2016
138

Revenues: Property taxes County sales taxes Special assessments Licenses and permits Fees, fines, and forfeits Intergovernmental Charges for services Investment earnings Contributions Miscellaneous
Total revenues
Expenditures: Current:
General government Public safety Highways and streets Sanitation Welfare Culture and recreation Education
Capital outlay Debt service: Principal Interest and other charges Total expenditures
Excess (deficiency) of revenues over expenditures
Other financing sources (uses): Sale of capital assets Transfers in Transfers out Total other financing sources (uses)
Net changes in fund balances
Fund balances, July 1, 2015Fund balances, June 30, 2016
Coconino Countyent of Revenues, Expenditures,
Changes in Fund Balancesmajor Governmental Fundsear Ended June 30, 2016
School Superintendent
Grants and Fees
Sheriff Grants and Fees Solid Waste
Superior Court Grants and
Fees
8$ $ $ $
3,898,555 527,448 296,727 214,10452,013 80,080 132,996 170,09421,899 4,268 3,02572,618 1,250 48,134
321,343 1,4264,366,436 613,046 429,723 436,783
936,244675,776
638,801
3,614,951
3,614,951 675,776 638,801 936,244
751,485 (62,730) (209,078) (499,461)
72,869 155,353 209,077 500,376(60,575) (2,596)
72,869 94,778 209,077 497,780
824,354 32,048 (1) (1,681)
1,176,677 355,569 17 484,5282,001,031$ 387,617$ 16$ 482,847$
Special Revenue
Coconino County Combining Statement of Revenues, Expenditures,
and Changes in Fund BalancesNonmajor Governmental Funds (Continued)
Year Ended June 30, 2016
139

Revenues: Property taxes County sales taxes Special assessments Licenses and permits Fees, fines, and forfeits Intergovernmental Charges for services Investment earnings Contributions Miscellaneous
Total revenues
Expenditures: Current:
General government Public safety Highways and streets Sanitation Welfare Culture and recreation Education
Capital outlay Debt service: Principal Interest and other charges Total expenditures
Excess (deficiency) of revenues over expenditures
Other financing sources (uses): Sale of capital assets Transfers in Transfers out Total other financing sources (uses)
Net changes in fund balances
Fund balances, July 1, 2015Fund balances, June 30, 2016
Coconino Countyent of Revenues, Expenditures,
Changes in Fund Balancesmajor Governmental Fundsear Ended June 30, 2016
Debt Service
Taxpayer Information Fund
Other Special Revenue Funds
County Improvement Districts-Debt
Service
$ $ $
46,653
15,229 1,564975 5,001
15316,204 1,717 51,654
11,498 50,316
63,106
85,00018,128
11,498 113,422 103,128
4,706 (111,705) (51,474)
111,705 11,019(7,110)
111,705 3,909
4,706 (47,565)
70,778 12 242,23375,484$ 12$ 194,668$
Special Revenue
Coconino County Combining Statement of Revenues, Expenditures,
and Changes in Fund Balances Nonmajor Governmental Funds (Continued)
Year Ended June 30, 2016
140

Revenues: Property taxes County sales taxes Special assessments Licenses and permits Fees, fines, and forfeits Intergovernmental Charges for services Investment earnings Contributions Miscellaneous
Total revenues
Expenditures: Current:
General government Public safety Highways and streets Sanitation Welfare Culture and recreation Education
Capital outlay Debt service: Principal Interest and other charges Total expenditures
Excess (deficiency) of revenues over expenditures
Other financing sources (uses): Sale of capital assets Transfers in Transfers out Total other financing sources (uses)
Net changes in fund balances
Fund balances, July 1, 2015Fund balances, June 30, 2016
Coconino Countyent of Revenues, Expenditures,
Changes in Fund Balancesmajor Governmental Fundsear Ended June 30, 2016
Accommodation School
County Improvement
Districts-Capital Projects
Other Capital Projects Funds
Total Nonmajor Governmental
Funds
$ $ $ 6,363,869$ 5,682
57,8514,650
536,29463,975 16,873,350
3,624,4901,434 9,406 35,955 257,775
307,838691,923 1,248,510
65,409 701,329 35,955 29,280,309
2,308,4129,160,703
63,1062,065,1232,703,1504,435,1514,683,198
41,140 615,000 9,004 665,144
85,00018,128
41,140 615,000 9,004 26,187,115
24,269 86,329 26,951 3,093,194
1,235486,247 6,570 3,223,994
(285,740) (2,325,916)200,507 6,570 899,313
24,269 286,836 33,521 3,992,507
91,553 213,611 3,057,025 13,864,068115,822$ 500,447$ 3,090,546$ 17,856,575$
Capital Projects
Coconino County Combining Statement of Revenues, Expenditures,
and Changes in Fund Balances Nonmajor Governmental Funds (Continued)
Year Ended June 30, 2016
141

Variance withFinal Budget-
Original FinalActual
AmountsPositive
(Negative)Revenues: Intergovernmental 2,234,649$ 2,310,408$ 2,219,770$ (90,638)$ Charges for services 600,000 600,000 636,569 36,569 Investment earnings 5,050 5,050 9,801 4,751
Total revenues 2,839,699 2,915,458 2,866,140 (49,318)
Expenditures: Public safety
Adult Probation 3,300,369 3,257,314 2,878,535 378,779 Total expenditures 3,300,369 3,257,314 2,878,535 378,779
Excess (deficiency) of revenues over expenditures (460,670) (341,856) (12,395) 329,461
Other financing sources (uses): Sale of capital assets 1,235 1,235 Transfers in 283,068 163,198 105,336 (57,862) Transfers out Total other financing sources (uses) 283,068 163,198 106,571 (56,627)
Net changes in fund balances (177,602) (178,658) 94,176 272,834
Fund balance, July 1, 2015 544,193 544,193 639,079 94,886Fund balance, June 30, 2016 366,591$ 365,535$ 733,255$ 367,720$
Budgeted Amounts
Coconino CountySchedule of Revenues, Expenditures, and Changes in
Fund Balances - Budget and ActualAdult Probation Grants and Fees
Year Ended June 30, 2016
142

Variance withFinal Budget-
Original FinalActual
AmountsPositive
(Negative)Revenues:
Total revenues $ $ $ $
Expenditures: General government
Assessor 9,912 9,630 1,580 8,050 Total expenditures 9,912 9,630 1,580 8,050
Excess (deficiency) of revenues
over expenditures (9,912) (9,630) (1,580) 8,050
Net changes in fund balances (9,912) (9,630) (1,580) 8,050
Fund balance, July 1, 2015 9,913 9,913 9,630 (283)Fund balance, June 30, 2016 1$ 283$ 8,050$ 7,767$
Budgeted Amounts
Coconino CountySchedule of Revenues, Expenditures, and Changes in
Fund Balances - Budget and ActualAssessor Storage and Retrieval
Year Ended June 30, 2016
143

Variance withFinal Budget-
Original FinalActual
AmountsPositive
(Negative)Revenues: Intergovernmental 1,060,619$ 1,183,968$ 754,918$ (429,050)$ Investment earnings 28 28
Total revenues 1,060,619 1,183,968 754,946 (429,022)
Expenditures: Welfare
Career Center 1,116,895 1,240,244 813,348 426,896 Total expenditures 1,116,895 1,240,244 813,348 426,896
Excess (deficiency) of revenues over expenditures (56,276) (56,276) (58,402) (2,126)
Other financing sources (uses): Transfers in 55,495 55,495 55,495 Total other financing sources (uses) 55,495 55,495 55,495
Net changes in fund balances (781) (781) (2,907) (2,126)
Fund balance, July 1, 2015 8,540 8,540 9,517 977Fund balance, June 30, 2016 7,759$ 7,759$ 6,610$ (1,149)$
Budgeted Amounts
Coconino CountySchedule of Revenues, Expenditures, and Changes in
Fund Balances - Budget and ActualCareer Center Grants
Year Ended June 30, 2016
144

Variance withFinal Budget-
Original FinalActual
AmountsPositive
(Negative)Revenues: Fees, fines, and forfeits 100,000$ 100,000$ $ (100,000)$ Charges for services 50,300 50,300 55,902 5,602 Investment earnings 2,000 2,000 4,729 2,729
Total revenues 152,300 152,300 60,631 (91,669)
Expenditures: General government
Clerk of the Superior Court 157,290 157,290 98,908 58,382 Total expenditures 157,290 157,290 98,908 58,382
Excess (deficiency) of revenues over expenditures (4,990) (4,990) (38,277) (33,287)
Other financing sources (uses): Transfers in 12,581 12,581 2,596 (9,985) Total other financing sources (uses) 12,581 12,581 2,596 (9,985)
Net changes in fund balances 7,591 7,591 (35,681) (43,272)
Fund balance, July 1, 2015 400,189 400,189 385,503 (14,686)Fund balance, June 30, 2016 407,780$ 407,780$ 349,822$ (57,958)$
Budgeted Amounts
Coconino CountySchedule of Revenues, Expenditures, and Changes in
Fund Balances - Budget and ActualClerk of the Superior Court Grants and Fees
Year Ended June 30, 2016
145

Variance withFinal Budget-
Original FinalActual
AmountsPositive
(Negative)Revenues: Intergovernmental 1,394,115$ 1,353,115$ 1,048,933$ (304,182)$ Charges for services 249,997 249,997 21,592 (228,405) Investment earnings 2,000 2,000 3,799 1,799 Contributions 114,016 114,016 84,330 (29,686) Miscellaneous 1,800 1,800 71,039 69,239
Total revenues 1,761,928 1,720,928 1,229,693 (491,235)
Expenditures: General government Facilities 25,004 35,815 2,686 33,129 Welfare
Community Services 2,550,090 2,507,790 1,889,802 617,988 Total expenditures 2,575,094 2,543,605 1,892,488 651,117
Excess (deficiency) of revenues over expenditures (813,166) (822,677) (662,795) 159,882
Other financing sources (uses): Transfers in 764,513 763,213 846,506 83,293 Transfers out (60,258) (60,258) Total other financing sources (uses) 764,513 763,213 786,248 23,035
Net changes in fund balances (48,653) (59,464) 123,453 182,917
Fund balance, July 1, 2015 153,593 153,593 10,579 (143,014)Fund balance, June 30, 2016 104,940$ 94,129$ 134,032$ 39,903$
Budgeted Amounts
Coconino CountySchedule of Revenues, Expenditures, and Changes in
Fund Balances - Budget and ActualCommunity Services Grants and Fees
Year Ended June 30, 2016
146

Variance withFinal Budget-
Original FinalActual
AmountsPositive
(Negative)Revenues: Intergovernmental 7,300$ 8,500$ 8,387$ (113)$ Charges for services 44,400 44,400 41,127 (3,273) Investment earnings 250 250 589 339
Total revenues 51,950 53,150 50,103 (3,047)
Expenditures: General government
Superior Courts 85,449 86,649 64,815 21,834 Total expenditures 85,449 86,649 64,815 21,834
Excess (deficiency) of revenues over expenditures (33,499) (33,499) (14,712) 18,787
Net changes in fund balances (33,499) (33,499) (14,712) 18,787
Fund balance, July 1, 2015 55,037 55,037 57,877 2,840Fund balance, June 30, 2016 21,538$ 21,538$ 43,165$ 21,627$
Budgeted Amounts
Coconino CountySchedule of Revenues, Expenditures, and Changes in
Fund Balances - Budget and ActualConciliation Court
Year Ended June 30, 2016
147

Variance withFinal Budget-
Original FinalActual
AmountsPositive
(Negative)Revenues: Fees, fines, and forfeits 450,000$ 450,000$ 513,747$ 63,747$ Intergovernmental 469,008 452,675 444,971 (7,704) Charges for services 37,142 37,142 31,893 (5,249) Investment earnings 7,250 7,250 24,589 17,339
Total revenues 963,400 947,067 1,015,200 68,133
Expenditures: General government
County Attorney 1,360,725 1,256,111 904,270 351,841 Total expenditures 1,360,725 1,256,111 904,270 351,841
Excess (deficiency) of revenues over expenditures (397,325) (309,044) 110,930 419,974
Other financing sources (uses): Transfers in 86,875 253,419 258,146 4,727 Transfers out (35,002) (297,110) (297,086) 24 Total other financing sources (uses) 51,873 (43,691) (38,940) 4,751
Net changes in fund balances (345,452) (352,735) 71,990 424,725
Fund balance, July 1, 2015 530,828 530,828 781,720 250,892Fund balance, June 30, 2016 185,376$ 178,093$ 853,710$ 675,617$
Budgeted Amounts
Coconino CountySchedule of Revenues, Expenditures, and Changes in
Fund Balances - Budget and ActualCounty Attorney Grants and Fees
Year Ended June 30, 2016
148

Variance withFinal Budget-
Original FinalActual
AmountsPositive
(Negative)Revenues: Special assessments 11,400$ 11,400$ 11,198$ (202)$ Charges for services 1,170,600 1,170,600 1,174,925 4,325 Investment earnings 9,465 9,465 18,897 9,432 Miscellaneous 20,000 20,000 21,653 1,653
Total revenues 1,211,465 1,211,465 1,226,673 15,208
Expenditures: Sanitation
KVID 1,655,926 1,655,926 1,426,322 229,604 Total expenditures 1,655,926 1,655,926 1,426,322 229,604
Excess (deficiency) of revenues over expenditures (444,461) (444,461) (199,649) 244,812
Net changes in fund balances (444,461) (444,461) (199,649) 244,812
Fund balance, July 1, 2015 1,239,133 1,239,133 1,539,827 300,694Fund balance, June 30, 2016 794,672$ 794,672$ 1,340,178$ 545,506$
Budgeted Amounts
Coconino CountySchedule of Revenues, Expenditures, and Changes in
Fund Balances - Budget and ActualCounty Improvement Districts - Special Revenue
Year Ended June 30, 2016
149

Variance withFinal Budget-
Original FinalActual
AmountsPositive
(Negative)Revenues: Property taxes 3,936,314$ 3,936,314$ 3,925,585$ (10,729)$ County sales taxes 5,682 5,682 Investment earnings 5,377 5,377 Contributions 90,336 90,336
Total revenues 3,936,314 3,936,314 4,026,980 90,666
Expenditures: Culture and recreation
Library District 3,843,842 3,843,842 3,939,470 (95,628) Total expenditures 3,843,842 3,843,842 3,939,470 (95,628)
Excess (deficiency) of revenues over expenditures 92,472 92,472 87,510 (4,962)
Other financing sources (uses): Transfers out (92,472) (92,472) (92,472) Total other financing sources (uses) (92,472) (92,472) (92,472)
Net changes in fund balances (4,962) (4,962)
Fund balance, July 1, 2015 24,604 24,604 166,322 141,718Fund balance, June 30, 2016 24,604$ 24,604$ 161,360$ 136,756$
Budgeted Amounts
Coconino CountySchedule of Revenues, Expenditures, and Changes in
Fund Balances - Budget and ActualCounty Library District
Year Ended June 30, 2016
150
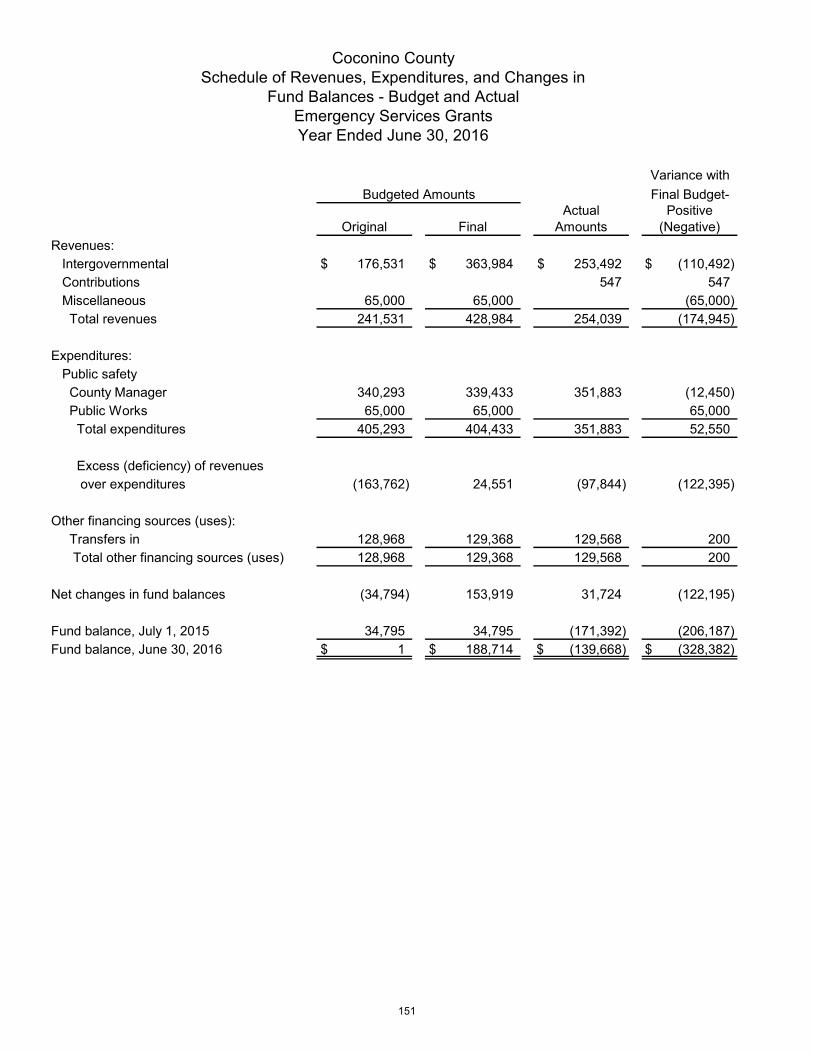
Variance withFinal Budget-
Original FinalActual
AmountsPositive
(Negative)Revenues: Intergovernmental 176,531$ 363,984$ 253,492$ (110,492)$ Contributions 547 547 Miscellaneous 65,000 65,000 (65,000)
Total revenues 241,531 428,984 254,039 (174,945)
Expenditures: Public safety
County Manager 340,293 339,433 351,883 (12,450) Public Works 65,000 65,000 65,000
Total expenditures 405,293 404,433 351,883 52,550
Excess (deficiency) of revenues over expenditures (163,762) 24,551 (97,844) (122,395)
Other financing sources (uses): Transfers in 128,968 129,368 129,568 200 Total other financing sources (uses) 128,968 129,368 129,568 200
Net changes in fund balances (34,794) 153,919 31,724 (122,195)
Fund balance, July 1, 2015 34,795 34,795 (171,392) (206,187)Fund balance, June 30, 2016 1$ 188,714$ (139,668)$ (328,382)$
Budgeted Amounts
Coconino CountySchedule of Revenues, Expenditures, and Changes in
Fund Balances - Budget and ActualEmergency Services GrantsYear Ended June 30, 2016
151

Variance withFinal Budget-
Original FinalActual
AmountsPositive
(Negative)Revenues: Property taxes 2,445,058$ 2,445,058$ 2,438,276$ (6,782)$ Licenses and permits 4,650 4,650 Intergovernmental 514,726 514,726 2,289,356 1,774,630 Contributions 8,063 8,063 10,623 2,560
Total revenues 2,967,847 2,967,847 4,742,905 1,775,058
Expenditures: Public Safety
Flood Control 3,015,085 3,018,042 2,770,832 247,210 Total expenditures 3,015,085 3,018,042 2,770,832 247,210
Excess (deficiency) of revenues over expenditures (47,238) (50,195) 1,972,073 2,022,268
Other financing sources (uses): Transfers in 47,238 47,238 49,738 2,500 Total other financing sources (uses) 47,238 47,238 49,738 2,500
Net changes in fund balances (2,957) 2,021,811 2,024,768
Fund balance, July 1, 2015 41,778 41,778 (3,120,943) (3,162,721)Fund balance, June 30, 2016 41,778$ 38,821$ (1,099,132)$ (1,137,953)$
Budgeted Amounts
Coconino CountySchedule of Revenues, Expenditures, and Changes in
Fund Balances - Budget and ActualFlood Control District FundYear Ended June 30, 2016
152

Variance withFinal Budget-
Original FinalActual
AmountsPositive
(Negative)Revenues: Charges for services 110,000$ 110,000$ 106,506$ (3,494)$ Investment earnings 2,000 2,000 2,460 460 Miscellaneous 140,250 140,250 126,040 (14,210)
Total revenues 252,250 252,250 235,006 (17,244)
Expenditures: Public safety
Sheriff 374,142 374,142 219,540 154,602 Total expenditures 374,142 374,142 219,540 154,602
Excess (deficiency) of revenues over expenditures (121,892) (121,892) 15,466 137,358
Net changes in fund balances (121,892) (121,892) 15,466 137,358
Fund balance, July 1, 2015 179,434 179,434 219,394 39,960Fund balance, June 30, 2016 57,542$ 57,542$ 234,860$ 177,318$
Budgeted Amounts
Coconino CountySchedule of Revenues, Expenditures, and Changes in
Fund Balances - Budget and ActualInmate Welfare
Year Ended June 30, 2016
153
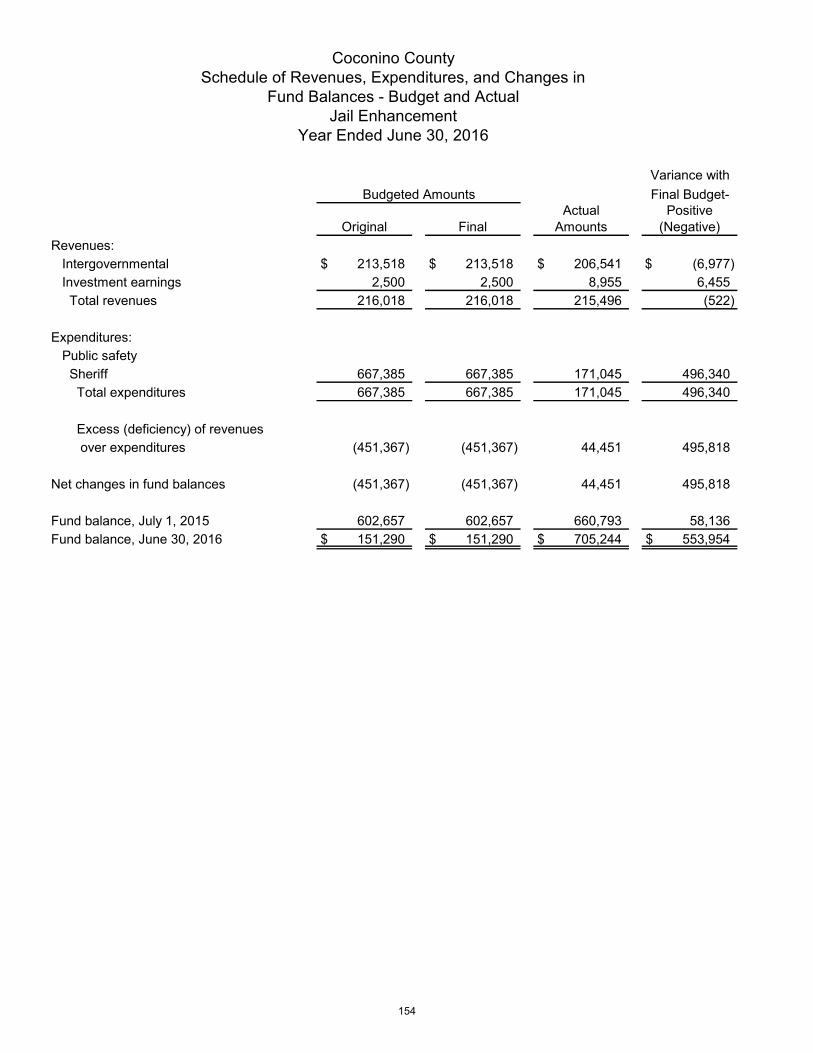
Variance withFinal Budget-
Original FinalActual
AmountsPositive
(Negative)Revenues: Intergovernmental 213,518$ 213,518$ 206,541$ (6,977)$ Investment earnings 2,500 2,500 8,955 6,455
Total revenues 216,018 216,018 215,496 (522)
Expenditures: Public safety
Sheriff 667,385 667,385 171,045 496,340 Total expenditures 667,385 667,385 171,045 496,340
Excess (deficiency) of revenues over expenditures (451,367) (451,367) 44,451 495,818
Net changes in fund balances (451,367) (451,367) 44,451 495,818
Fund balance, July 1, 2015 602,657 602,657 660,793 58,136Fund balance, June 30, 2016 151,290$ 151,290$ 705,244$ 553,954$
Budgeted Amounts
Coconino CountySchedule of Revenues, Expenditures, and Changes in
Fund Balances - Budget and ActualJail Enhancement
Year Ended June 30, 2016
154

Variance withFinal Budget-
Original FinalActual
AmountsPositive
(Negative)Revenues: Fees, fines, and forfeits 43,300$ 43,300$ 22,547$ (20,753)$ Charges for services 423,155 423,155 523,858 100,703 Investment earnings 10,650 10,650 8,781 (1,869)
Total revenues 477,105 477,105 555,186 78,081
Expenditures: General government
Flagstaff Justice Court 215,651 215,651 100,018 115,633 Fredonia Justice Court 19,100 19,100 6,607 12,493 Page Justice Court 33,846 33,846 17,670 16,176 Williams Justice Court 51,929 51,929 33,209 18,720
Total expenditures 320,526 320,526 157,504 163,022
Excess (deficiency) of revenues over expenditures 156,579 156,579 397,682 241,103
Other financing sources (uses): Transfers out (264,803) (264,803) (296,581) (31,778) Total other financing sources (uses) (264,803) (264,803) (296,581) (31,778)
Net changes in fund balances (108,224) (108,224) 101,101 209,325
Fund balance, July 1, 2015 430,972 430,972 426,383 (4,589)Fund balance, June 30, 2016 322,748$ 322,748$ 527,484$ 204,736$
Budgeted Amounts
Coconino CountySchedule of Revenues, Expenditures, and Changes in
Fund Balances - Budget and ActualJustice Courts Grants and Fees
Year Ended June 30, 2016
155

Variance withFinal Budget-
Original FinalActual
AmountsPositive
(Negative)Revenues: Intergovernmental 2,105,068$ 2,031,050$ 1,989,217$ (41,833)$ Charges for services 51,310 51,310 54,405 3,095 Investment earnings 5,000 3,600 12,242 8,642 Miscellaneous 1,000,000 1,000,000 253 (999,747)
Total revenues 3,161,378 3,085,960 2,056,117 (1,029,843)
Expenditures: Public safety
Juvenile Probation 4,048,531 3,799,049 2,093,092 1,705,957 Total expenditures 4,048,531 3,799,049 2,093,092 1,705,957
Excess (deficiency) of revenues over expenditures (887,153) (713,089) (36,975) 676,114
Other financing sources (uses): Transfers in 160,320 9,817 7,664 (2,153) Total other financing sources (uses) 160,320 9,817 7,664 (2,153)
Net changes in fund balances (726,833) (703,272) (29,311) 673,961
Fund balance, July 1, 2015 729,785 729,785 819,990 90,205Fund balance, June 30, 2016 2,952$ 26,513$ 790,679$ 764,166$
Budgeted Amounts
Coconino CountySchedule of Revenues, Expenditures, and Changes in
Fund Balances - Budget and ActualJuvenile Court Grants and Fees
Year Ended June 30, 2016
156

Variance withFinal Budget-
Original FinalActual
AmountsPositive
(Negative)Revenues: Intergovernmental 2,000$ 2,000$ 2,090$ 90$ Investment earnings 71 71 127 56
Total revenues 2,071 2,071 2,217 146
Expenditures: General government Legal Defender 2,455 2,455 1,513 942 Total expenditures 2,455 2,455 1,513 942
Excess (deficiency) of revenues over expenditures (384) (384) 704 1,088
Other financing sources (uses): Transfers in 5,317 5,317 5,973 656 Transfers out (5,727) (5,727) (5,708) 19 Total other financing sources (uses) (410) (410) 265 675
Net changes in fund balances (794) (794) 969 1,763
Fund balance, July 1, 2015 6,419 6,419 7,490 1,071Fund balance, June 30, 2016 5,625$ 5,625$ 8,459$ 2,834$
Budgeted Amounts
Coconino CountySchedule of Revenues, Expenditures, and Changes in
Fund Balances - Budget and ActualLegal Defender Grants and Fees
Year Ended June 30, 2016
157

Variance withFinal Budget-
Original FinalActual
AmountsPositive
(Negative)Revenues: Intergovernmental $ $ 2,500,941$ 2,500,941$ Investment earnings 1,300 1,300 62,172 60,872
Total revenues 1,300 1,300 2,563,113 2,561,813
Expenditures: Education
School Superintendent 1,068,247 (1,068,247) Total expenditures 1,068,247 (1,068,247)
Excess (deficiency) of revenues over expenditures 1,300 1,300 1,494,866 1,493,566
Other financing sources (uses): Transfers in 156,000 156,000 Transfers out (1,067,138) (1,046,418) (1,057,884) (11,466) Total other financing sources (uses) (1,067,138) (1,046,418) (901,884) 144,534
Net changes in fund balances (1,065,838) (1,045,118) 592,982 1,638,100
Fund balance, July 1, 2015 3,028,722 3,028,722 4,785,231 1,756,509Fund balance, June 30, 2016 1,962,884$ 1,983,604$ 5,378,213$ 3,394,609$
Budgeted Amounts
Coconino CountySchedule of Revenues, Expenditures, and Changes in
Fund Balances - Budget and ActualNational Forest Fees
Year Ended June 30, 2016
158

Variance withFinal Budget-
Original FinalActual
AmountsPositive
(Negative)Revenues: Intergovernmental 164,794$ 173,481$ 85,000$ (88,481)$ Charges for services 409,100 409,100 402,096 (7,004) Investment earnings 7,400 7,400 Miscellaneous 7,500 7,500 14,680 7,180
Total revenues 581,394 590,081 509,176 (80,905)
Expenditures: Culture and recreation
Parks and Recreation 496,435 496,251 495,681 570 Total expenditures 496,435 496,251 495,681 570
Excess (deficiency) of revenues over expenditures 84,959 93,830 13,495 (80,335)
Other financing sources (uses): Transfers out (106,150) (106,150) (106,150) Total other financing sources (uses) (106,150) (106,150) (106,150)
Net changes in fund balances (21,191) (12,320) (92,655) (80,335)
Fund balance, July 1, 2015 505,559 505,559 569,450 63,891Fund balance, June 30, 2016 484,368$ 493,239$ 476,795$ (16,444)$
Budgeted Amounts
Coconino CountySchedule of Revenues, Expenditures, and Changes in
Fund Balances - Budget and ActualParks and Recreation Grants and Fees
Year Ended June 30, 2016
159

Variance withFinal Budget-
Original FinalActual
AmountsPositive
(Negative)Revenues: Intergovernmental 16,000$ 16,000$ 20,107$ 4,107$ Investment earnings 700 700 1,251 551
Total revenues 16,700 16,700 21,358 4,658
Expenditures: General government
Public Defender 30,000 30,000 28,069 1,931 Total expenditures 30,000 30,000 28,069 1,931
Excess (deficiency) of revenues over expenditures (13,300) (13,300) (6,711) 6,589
Other financing sources (uses): Transfers in 47,855 47,855 53,756 5,901 Transfers out (47,855) (47,855) (53,756) (5,901) Total other financing sources (uses)
Net changes in fund balances (13,300) (13,300) (6,711) 6,589
Fund balance, July 1, 2015 73,340 73,340 81,226 7,886Fund balance, June 30, 2016 60,040$ 60,040$ 74,515$ 14,475$
Budgeted Amounts
Coconino CountySchedule of Revenues, Expenditures, and Changes in
Fund Balances - Budget and ActualPublic Defender Grants and Fees
Year Ended June 30, 2016
160

Variance withFinal Budget-
Original FinalActual
AmountsPositive
(Negative)Revenues: Intergovernmental 51,665$ 51,665$ 48,818$ (2,847)$ Charges for services 130,000 130,000 123,641 (6,359)$ Investment earnings 900 900 4,615 3,715
Total revenues 182,565 182,565 177,074 (5,491)
Expenditures: General government
Recorder 250,977 254,155 51,009 203,146 Total expenditures 250,977 254,155 51,009 203,146
Excess (deficiency) of revenues over expenditures (68,412) (71,590) 126,065 197,655
Net changes in fund balances (68,412) (71,590) 126,065 197,655
Fund balance, July 1, 2015 277,907 277,907 294,389 16,482Fund balance, June 30, 2016 209,495$ 206,317$ 420,454$ 214,137$
Budgeted Amounts
Coconino CountySchedule of Revenues, Expenditures, and Changes in
Fund Balances - Budget and ActualRecorder Storage and Retrieval
Year Ended June 30, 2016
161

Variance withFinal Budget-
Original FinalActual
AmountsPositive
(Negative)Revenues: Property taxes $ $ 8$ 8$ Intergovernmental 3,405,170 4,062,093 3,898,555 (163,538) Charges for services 45,000 45,000 52,013 7,013 Investment earnings 350 350 21,899 21,549 Contributions 30,000 70,276 72,618 2,342 Miscellaneous 150,000 150,000 321,343 171,343
Total revenues 3,630,520 4,327,719 4,366,436 38,717
Expenditures: Education
School Superintendent 3,117,532 3,839,289 3,614,951 224,338 Total expenditures 3,117,532 3,839,289 3,614,951 224,338
Excess (deficiency) of revenues over expenditures 512,988 488,430 751,485 263,055
Other financing sources (uses): Transfers in 70,671 70,671 72,869 (2,198) Total other financing sources (uses) 70,671 70,671 72,869 (2,198)
Net changes in fund balances 583,659 559,101 824,354 265,253
Fund balance, July 1, 2015 1,491,649 1,491,649 1,176,677 (314,972)Fund balance, June 30, 2016 2,075,308$ 2,050,750$ 2,001,031$ (49,719)$
Budgeted Amounts
Coconino CountySchedule of Revenues, Expenditures, and Changes in
Fund Balances - Budget and ActualSchool Superintendent Grants and Fees
Year Ended June 30, 2016
162

Variance withFinal Budget-
Original FinalActual
AmountsPositive
(Negative)Revenues: Intergovernmental 752,716$ 803,047$ 527,448$ (275,599)$ Charges for services 61,439 61,439 80,080 18,641 Investment earnings 1,400 1,400 4,268 2,868 Contributions 5,000 5,000 1,250 (3,750) Miscellaneous 2,789,000 2,757,390 (2,757,390)
Total revenues 3,609,555 3,628,276 613,046 (3,015,230)
Expenditures: Public safety
Sheriff 3,763,065 3,948,882 675,776 3,273,106 Total expenditures 3,763,065 3,948,882 675,776 3,273,106
Excess (deficiency) of revenues over expenditures (153,510) (320,606) (62,730) 257,876
Other financing sources (uses): Transfers in 118,022 215,726 155,353 (60,373) Transfers out (60,575) (60,575) Total other financing sources (uses) 118,022 155,151 94,778 (60,373)
Net changes in fund balances (35,488) (165,455) 32,048 197,503
Fund balance, July 1, 2015 446,225 446,225 355,569 (90,656)Fund balance, June 30, 2016 410,737$ 280,770$ 387,617$ 106,847$
Budgeted Amounts
Coconino CountySchedule of Revenues, Expenditures, and Changes in
Fund Balances - Budget and ActualSheriff Grants and Fees
Year Ended June 30, 2016
163

Variance withFinal Budget-
Original FinalActual
AmountsPositive
(Negative)Revenues: Intergovernmental 255,000$ 255,000$ 296,727$ 41,727$ Charges for services 129,470 129,470 132,996 3,526
Total revenues 384,470 384,470 429,723 45,253
Expenditures: Sanitation
Public Works 665,285 685,885 638,801 47,084 Total expenditures 665,285 685,885 638,801 47,084
Excess (deficiency) of revenues over expenditures (280,815) (301,415) (209,078) 92,337
Other financing sources (uses): Transfers in 318,868 309,088 209,077 (100,011) Total other financing sources (uses) 318,868 309,088 209,077 (100,011)
Net changes in fund balances 38,053 7,673 (1) (7,674)
Fund balance, July 1, 2015 17 17Fund balance, June 30, 2016 38,053$ 7,673$ 16$ (7,657)$
Budgeted Amounts
Coconino CountySchedule of Revenues, Expenditures, and Changes in
Fund Balances - Budget and ActualSolid Waste
Year Ended June 30, 2016
164
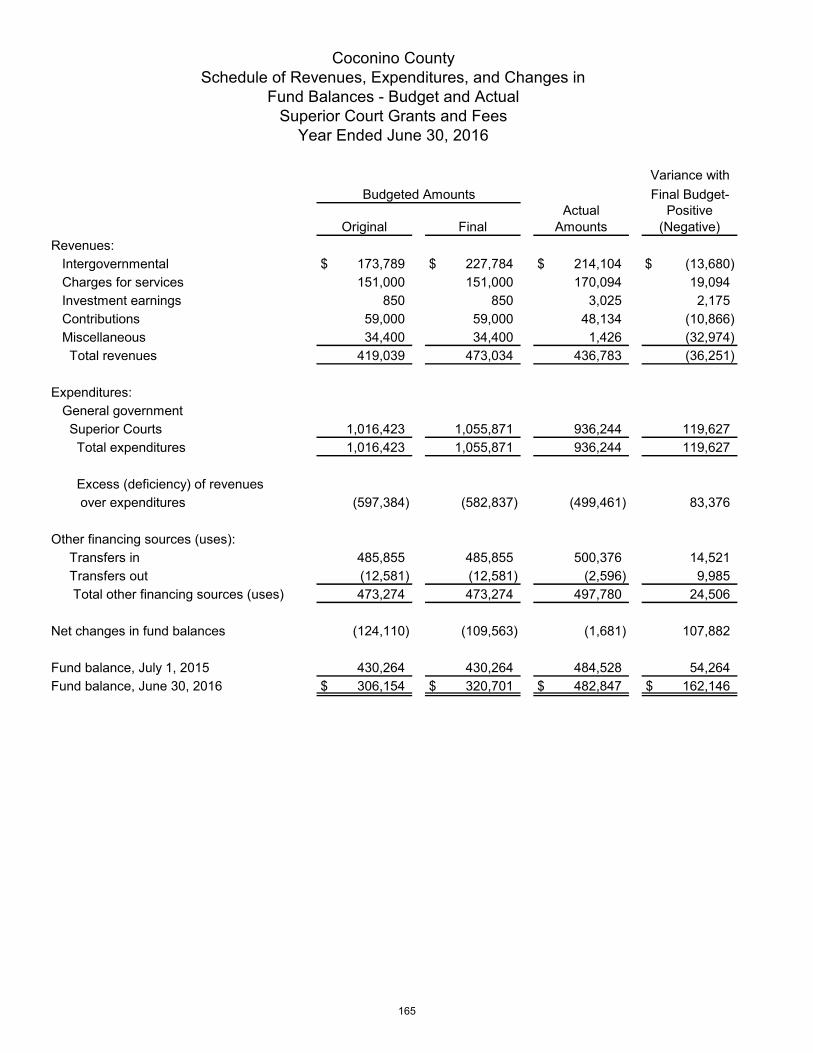
Variance withFinal Budget-
Original FinalActual
AmountsPositive
(Negative)Revenues: Intergovernmental 173,789$ 227,784$ 214,104$ (13,680)$ Charges for services 151,000 151,000 170,094 19,094 Investment earnings 850 850 3,025 2,175 Contributions 59,000 59,000 48,134 (10,866) Miscellaneous 34,400 34,400 1,426 (32,974)
Total revenues 419,039 473,034 436,783 (36,251)
Expenditures: General government
Superior Courts 1,016,423 1,055,871 936,244 119,627 Total expenditures 1,016,423 1,055,871 936,244 119,627
Excess (deficiency) of revenues over expenditures (597,384) (582,837) (499,461) 83,376
Other financing sources (uses): Transfers in 485,855 485,855 500,376 14,521 Transfers out (12,581) (12,581) (2,596) 9,985 Total other financing sources (uses) 473,274 473,274 497,780 24,506
Net changes in fund balances (124,110) (109,563) (1,681) 107,882
Fund balance, July 1, 2015 430,264 430,264 484,528 54,264Fund balance, June 30, 2016 306,154$ 320,701$ 482,847$ 162,146$
Budgeted Amounts
Coconino CountySchedule of Revenues, Expenditures, and Changes in
Fund Balances - Budget and ActualSuperior Court Grants and Fees
Year Ended June 30, 2016
165

Variance withFinal Budget-
Original FinalActual
AmountsPositive
(Negative)Revenues: Charges for services 16,500$ 16,500$ 15,229$ (1,271)$ Investment earnings 1,250 1,250 975 (275)
Total revenues 17,750 17,750 16,204 (1,546)
Expenditures: General government
Treasurer 31,000 31,000 11,498 19,502 Total expenditures 31,000 31,000 11,498 19,502
Excess (deficiency) of revenues over expenditures (13,250) (13,250) 4,706 17,956
Net changes in fund balances (13,250) (13,250) 4,706 17,956
Fund balance, July 1, 2015 52,600 52,600 70,778 18,178Fund balance, June 30, 2016 39,350$ 39,350$ 75,484$ 36,134$
Budgeted Amounts
Coconino CountySchedule of Revenues, Expenditures, and Changes in
Fund Balances - Budget and ActualTaxpayer Information FundYear Ended June 30, 2016
166

Variance withFinal Budget-
Original FinalActual
AmountsPositive
(Negative)Revenues: Charges for services 7,000$ 7,000$ 1,564$ (5,436)$ Miscellaneous 153 153
Total revenues 7,000 7,000 1,717 (5,283)
Expenditures: General government Finance/Budget 54,478 54,478 50,316 4,162 Highways and streets
Public Works 66,259 67,279 63,106 4,173 Total expenditures 120,737 121,757 113,422 8,335
Excess (deficiency) of revenues over expenditures (113,737) (114,757) (111,705) 3,052
Other financing sources (uses): Transfers in 113,737 113,737 111,705 (2,032) Total other financing sources (uses) 113,737 113,737 111,705 (2,032)
Net changes in fund balances (1,020) 1,020
Fund balance, July 1, 2015 12 12Fund balance, June 30, 2016 $ (1,020)$ 12$ 1,032$
Budgeted Amounts
Coconino CountySchedule of Revenues, Expenditures, and Changes in
Fund Balances - Budget and ActualOther Special Revenue Funds
Year Ended June 30, 2016
167

Variance withFinal Budget-
Original FinalActual
AmountsPositive
(Negative)Revenues: Special assessments 103,150$ 103,150$ 46,653$ (56,497)$ Investment earnings 5,001 5,001 Total revenues 103,150 103,150 51,654 (51,496)
Expenditures: Debt service: Principal 85,000 85,000 85,000 Interest and other charges 18,150 18,150 18,128 22 Total expenditures 103,150 103,150 103,128 22
Excess (deficiency) of revenues over expenditures (51,474) (51,474)
Other financing sources (uses): Transfers in 11,019 (11,019) Transfers out (7,110) 7,110 Total other financing sources (uses) 3,909 (3,909)
Net changes in fund balances (47,565) (47,565)
Fund balance, July 1, 2015 247,529 247,529 242,233 (5,296)Fund balance, June 30, 2016 247,529$ 247,529$ 194,668$ (52,861)$
Budgeted Amounts
Coconino CountySchedule of Revenues, Expenditures, and Changes in
Fund Balances - Budget and ActualCounty Improvement Districts - Debt Service
Year Ended June 30, 2016
168
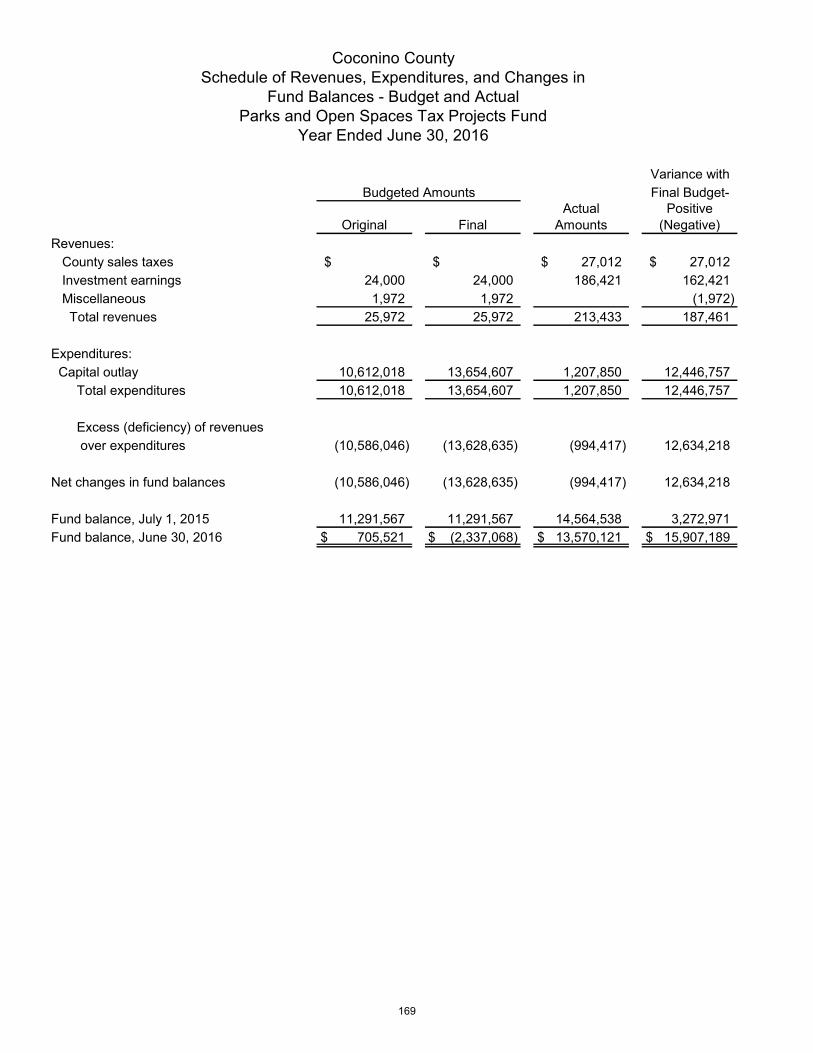
Variance withFinal Budget-
Original FinalActual
AmountsPositive
(Negative)Revenues: County sales taxes $ $ 27,012$ 27,012$ Investment earnings 24,000 24,000 186,421 162,421 Miscellaneous 1,972 1,972 (1,972)
Total revenues 25,972 25,972 213,433 187,461
Expenditures: Capital outlay 10,612,018 13,654,607 1,207,850 12,446,757 Total expenditures 10,612,018 13,654,607 1,207,850 12,446,757
Excess (deficiency) of revenues over expenditures (10,586,046) (13,628,635) (994,417) 12,634,218
Net changes in fund balances (10,586,046) (13,628,635) (994,417) 12,634,218
Fund balance, July 1, 2015 11,291,567 11,291,567 14,564,538 3,272,971Fund balance, June 30, 2016 705,521$ (2,337,068)$ 13,570,121$ 15,907,189$
Budgeted Amounts
Coconino CountySchedule of Revenues, Expenditures, and Changes in
Fund Balances - Budget and ActualParks and Open Spaces Tax Projects Fund
Year Ended June 30, 2016
169

Variance withFinal Budget-
Original FinalActual
AmountsPositive
(Negative)Revenues: Intergovernmental 63,754$ 63,754$ 63,975$ 221$ Investment earnings 679 679 1,434 755
Total revenues 64,433 64,433 65,409 976
Expenditures: Capital outlay 56,500 56,500 41,140 15,360 Total expenditures 56,500 56,500 41,140 15,360
Excess (deficiency) of revenues over expenditures 7,933 7,933 24,269 16,336
Net changes in fund balances 7,933 7,933 24,269 16,336
Fund balance, July 1, 2015 88,486 88,486 91,553 3,067Fund balance, June 30, 2016 96,419$ 96,419$ 115,822$ 19,403$
Budgeted Amounts
Coconino CountySchedule of Revenues, Expenditures, and Changes in
Fund Balances - Budget and ActualAccommodation School
Year Ended June 30, 2016
170

Variance withFinal Budget-
Original FinalActual
AmountsPositive
(Negative)Revenues: Investment earnings $ $ 9,406$ 9,406$ Miscellaneous 691,923 691,923
Total revenues 701,329 701,329
Expenditures: Capital outlay 615,000 615,000 Total expenditures 615,000 615,000
Excess (deficiency) of revenues over expenditures (615,000) 86,329 701,329
Other financing sources (uses): Transfers in 486,247 486,247 Transfers out (285,740) (285,740) Total other financing sources (uses) 200,507 200,507
Net changes in fund balances (615,000) 286,836 901,836
Fund balance, July 1, 2015 212,240 212,240 213,611 1,371Fund balance, June 30, 2016 212,240$ (402,760)$ 500,447$ 903,207$
Budgeted Amounts
Coconino CountySchedule of Revenues, Expenditures, and Changes in
Fund Balances - Budget and ActualCounty Improvement Districts - Capital Projects
Year Ended June 30, 2016
171

Variance withFinal Budget-
Original FinalActual
AmountsPositive
(Negative)Revenues: Investment earnings 10,000$ 10,000$ 35,955$ 25,955$
Total revenues 10,000 10,000 35,955 25,955
Expenditures: Capital outlay 475,890 623,568 9,004 614,564 Total expenditures 475,890 623,568 9,004 614,564
Excess (deficiency) of revenues over expenditures (465,890) (613,568) 26,951 640,519
Other financing sources (uses): Transfers in 475,890 623,569 6,570 (616,999) Total other financing sources (uses) 475,890 623,569 6,570 (616,999)
Net changes in fund balances 10,000 10,001 33,521 23,520
Fund balance, July 1, 2015 3,038,484 3,038,484 3,057,025 18,541Fund balance, June 30, 2016 3,048,484$ 3,048,485$ 3,090,546$ 42,061$
Budgeted Amounts
Coconino CountySchedule of Revenues, Expenditures, and Changes in
Fund Balances - Budget and ActualOther Capital Projects FundsYear Ended June 30, 2016
172

Treasurer'sInvestment Pool
IndividualInvestmentAccounts
Total InvestmentTrust Funds
AssetsCash and cash equivalents 119,787,461$ 2,511,047$ 122,298,508$ Interest and dividends receivable 253,426 253,426
Total assets 120,040,887 2,511,047 122,551,934
LiabilitiesTotal liabilities
Net positionHeld in trust for investment trust participants 120,040,887$ 2,511,047$ 122,551,934$
Coconino CountyCombining Statement of Fiduciary Net Position
Investment Trust FundsJune 30, 2016
173

Treasurer's Investment Pool
Individual Investment Accounts
Total Investment Trust Funds
Additions:Contribution from participants 240,600,899$ 2,566,694$ 243,167,593$ Investment earnings 1,729,778 1,729,778
Total additions 242,330,677 2,566,694 244,897,371
Deductions:Distributions to participants 223,785,125 218,497 224,003,622
Total deductions 223,785,125 218,497 224,003,622
Change in net position 18,545,552 2,348,197 20,893,749
Net position, July 1, 2015 101,495,335 162,850 101,658,185
Net position, June 30, 2016 120,040,887$ 2,511,047$ 122,551,934$
Coconino CountyCombining Statement of Changes in Fiduciary Net Position
Investment Trust FundsYear Ended June 30, 2016
174

Balance BalanceJuly 1, 2015 Additions Deletions June 30, 2016
AssetsCash and cash equivalents 1,835,811$ 69,145,792$ 69,275,229$ 1,706,374$ Cash and investments held by trustee 950,113 1,538,225 1,421,622 1,066,716 Total assets 2,785,924$ 70,684,017$ 70,696,851$ 2,773,090$
LiabilitiesDeposits held for others 2,514,606$ 67,100,873$ 67,094,944$ 2,520,535$ Due to other governments 271,318 3,583,143 3,601,906 252,555 Total liabilities 2,785,924$ 70,684,016$ 70,696,850$ 2,773,090$
Coconino CountyStatement of Changes in Assets and Liabilities
Agency FundYear Ended June 30, 2016
175

THIS PAGE BLANK
176

STATISTICAL SECTION
177

THIS PAGE BLANK
178

This part of the Coconino County’s comprehensive annual financial report presents detailed information as a context for understanding what the information in the financial statements, note disclosures, and required supplementary information says about the County’s overall financial health.
Contents
Financial Trends These schedules contain trend information to help the reader
understand how the County’s financial performance and well-being have changed over time. ......................................................... 181-185
Revenue Capacity These schedules contain information to help the reader assess the County’s most significant local revenue source, the property tax. .............................................................................................. 186-189
Debt Capacity These schedules present information to help the reader assess the affordability of the County’s current levels of outstanding debt and the County’s ability to issue additional debt in the future. ..................................................................... 190-192
Demographic and Economic Information These schedules offer demographic and economic indicators to help the reader understand the environment within which the County’s financial activities take place. .............................................. 193-195
Operating Information These schedules contain service and infrastructure data to help the reader understand how the information in the County’s financial report relates to the services the County provides and the activities it performs. .................................................................... 196-200
Coconino County Statistical Section
Year Ended June 30, 2016
179

THIS PAGE BLANK
180

2007 2008 2009 2010 2011 2012 2013 2014 2015 2016
Primary government:
Governmental activities
Invested in capital assets,
net of related debt 106,913,167$ 128,198,350$ 129,694,889$ 128,372,030$ 145,814,515$ 142,964,843$ 145,559,259$ 145,480,845$ 149,872,339$ 150,901,461$
Restricted 36,994,894 29,929,358 28,345,559 28,386,829 63,914,015 65,858,399 63,564,437 69,537,246 74,284,443 67,370,287
Unrestricted 64,103,998 52,345,917 52,251,638 53,636,533 22,113,670 23,547,699 22,747,752 18,591,785 (86,379,130) (77,733,568)Total governmental activities net position 208,012,059$ 210,473,625$ 210,292,086$ 210,395,392$ 231,842,200$ 232,370,941$ 231,871,448$ 233,609,876$ 137,777,652$ 140,538,180$
Source: Coconino County Single Audit Reporting Package
Note: Due to the implementation of GASB Statement No. 68, Accounting and Financial Reporting for Pensions , in fiscal year 2015, net position for the year ended June 30, 2014 was restated, however this change was not reflected in this schedule.
Fiscal Year
Coconino County Net Position by Component
Last Ten Fiscal Years (accrual basis of accounting)
181

2007 2008 2009 2010Expenses Governmental activities: General government 30,137,861$ 32,252,372$ 32,364,030$ 31,501,241$ Public safety 29,170,427 32,282,534 33,164,905 31,592,406 Highways and streets 18,699,298 17,990,951 16,655,737 15,639,291 Sanitation 3,138,878 3,216,176 3,274,456 3,138,985 Health 11,575,909 12,192,703 12,692,864 11,216,546 Welfare 5,902,878 6,666,186 7,615,522 8,273,139 Culture and recreation 5,628,042 6,957,602 7,814,879 7,725,556 Education 3,816,081 4,437,125 4,892,986 5,278,556 Transportation Interest on long term debt 1,602,303 603,969 512,256 414,902 Defeasance of long-term debt 832,030
Total expenses 109,671,677$ 117,431,648$ 118,987,635$ 114,780,622$
Program RevenuesGovernmental activities: Charges for services:
General government 4,322,299 8,273,916 7,316,495 7,169,300 Public safety 4,132,207 2,986,695 3,421,790 3,679,918 Highways and streets 3,459,682 74,556 1,152,294 69,689 Sanitation 1,437,621 1,375,478 1,375,437 1,321,418 Health 1,520,902 1,340,236 1,316,870 1,247,031 Welfare 1,599,249 1,337,392 1,262,876 2,101,024 Culture and recreation 1,188,201 1,159,535 1,170,109 794,306 Education 107,301 115,216 95,016 116,020 Transportation
Operating grants and contributions 33,695,469 34,185,253 34,581,839 34,922,841 Capital grants and contributions 134,120 898,314 118,520 84,811Total governmental activities program revenues 51,597,051$ 51,746,591$ 51,811,246$ 51,506,358$
Net (expenses) revenues (58,074,626)$ (65,685,057)$ (67,176,389)$ (63,274,264)$
General Revenues and Other Changes in Net AssetsGovernmental activities:
Property taxes, levied for general purposes 7,011,847 7,180,218 7,935,524 8,185,332 Property taxes, levied for library 1,263,035 3,847,035 4,708,037 5,107,399 Property taxes, levied for flood control 2,860,021 1,510,077 2,011,055 1,959,193 Property taxes, levied for accommodation school 189,318 4,310 Property taxes, levied for health services General county sales tax 12,384,595 12,445,915 11,497,627 10,774,208 Road sales tax Jail District sales tax 9,691,689 12,395,931 11,486,443 10,791,078 Parks and open spaces sales tax 3,076,949 3,105,737 2,871,495 2,689,346 Excise tax 111,593 102,863 92,118 68,688 Franchise tax 134,640 46,966 41,944 39,207
Shared revenue - state sales tax 18,125,003 17,000,598 15,287,328 14,353,390 Shared revenue - state vehicle license tax 5,695,838 5,622,049 5,240,676 4,971,307 Grants and contributions not restricted to specific programs 1,646,585 1,727,679 2,866,290 2,139,437 Investment earnings 4,489,537 2,726,375 2,388,053 2,090,720 Gain (loss) on disposal of capital assets 158,415 209,636 2,100 130,889 Miscellaneous 23,279 225,544 376,842 73,066 Donated capital (7,282,396)Total general revenues 59,390,630$ 68,146,623$ 66,994,850$ 63,377,570$
Change in net position 1,316,004$ 2,461,566$ (181,539)$ 103,306$
Source: Coconino County Single Audit Reporting Package
Fiscal year
Coconino County Changes in Net Position Last Ten Fiscal Years
(accrual basis of accounting)
182

2011 2012 2013 2014 2015 2016
30,768,963$ 31,590,773$ 32,049,113$ 29,994,545$ 34,766,812$ 33,869,932$ 36,552,608 33,763,301 37,609,509 42,122,131 42,398,679 40,947,92013,811,657 15,955,413 15,958,230 14,058,678 14,906,659 21,815,377
3,151,415 3,088,446 2,102,071 1,611,107 2,007,358 2,235,47811,045,264 11,550,850 12,199,793 13,735,528 13,915,744 13,180,529
8,284,852 6,907,365 6,642,756 4,932,758 4,486,667 4,254,7097,286,373 7,243,089 7,063,893 6,594,783 6,682,930 7,172,4324,767,625 5,232,363 5,941,255 7,332,953 6,708,189 5,336,344
287,272178,025 69,723 46,622 24,582 18,128
115,956,029$ 115,509,625$ 119,636,343$ 120,429,105$ 125,897,620$ 128,830,849$
6,022,842 4,995,911 4,465,482 4,868,512 4,737,629 5,751,9433,821,300 3,272,289 3,107,973 2,937,416 2,538,879 3,159,188
93,370 93,636 99,728 54,445 114,459 72,8661,386,848 1,402,290 1,346,328 1,342,276 1,327,150 1,348,1451,151,680 1,181,490 1,301,249 1,353,915 1,463,783 1,143,2071,905,924 1,802,447 1,467,637 795,045 243,096 123,744
865,254 760,863 850,519 838,718 879,799 810,926130,681 113,749 171,298 183,275 180,507 373,206
39,900,147 32,332,327 36,156,108 35,999,361 38,184,459 32,558,1816,320,016 13,130 (1,892) 14,217 6,821 701,451
61,598,062$ 45,968,132$ 48,964,430$ 48,387,180$ 49,676,582$ 46,042,857$
(54,357,967)$ (69,541,493)$ (70,671,913)$ (72,041,925)$ (76,221,038)$ (82,787,992)$
8,405,307 8,807,267 8,744,783 9,040,033 9,023,305 9,511,5674,879,638 4,313,244 4,157,084 3,906,545 3,848,918 3,924,4591,849,054 3,179,252 2,943,787 2,462,802 2,425,568 2,444,129
275 142 33 (18) 8 84,923,145 4,801,721 4,390,334 3,816,050 3,761,327 3,847,788
11,118,458 11,369,591 11,705,643 12,271,635 13,579,820 14,123,0773,778,550 8,426,665
11,109,910 11,368,185 11,699,874 12,270,130 13,576,136 14,127,1102,775,886 2,832,704 2,923,093 3,065,409 997,627 27,012
118,795 107,980 74,510 83,589 70,356 139,80436,969 36,788 47,198 58,608 94,022 97,267
15,670,801 17,208,420 18,592,227 19,067,396 19,995,985 21,004,6464,932,200 4,676,609 3,082,023 3,180,936 3,301,848 3,570,541
1,974,042 1,930,854 1,902,703 2,616,490 2,484,148 2,822,490684,904 1,162,458 (316,192) 1,420,929 700,571 1,037,145
1,037,009 (882,441) 42,869 453,292 218,749 354,668111,114 55,430 182,451 66,527 86,637 90,144
5,169,26874,796,775$ 70,968,204$ 70,172,420$ 73,780,353$ 77,943,575$ 85,548,520$
20,438,808$ 1,426,711$ (499,493)$ 1,738,428$ 1,722,537$ 2,760,528$
Fiscal year
Coconino CountyChanges in Net PositionLast Ten Fiscal Years
(accrual basis of accounting)
183

Fiscal Year2007 2008 2009 2010 2011 1 2012 2013 2014 2015 2016
General Fund Reserved 60,623$ 133,364$ 173,499$ 40,720$ $ $ $ $ $ $ Unreserved 33,986,837 27,495,342 24,956,598 22,206,572 Nonspendable 85,029 1,509,973 1,541,383 1,556,369 1,517,238 1,055,053 Restricted 15,000 Unassigned 26,368,723 28,450,416 29,184,907 26,643,317 26,126,347 28,961,573
Total general fund 34,047,460$ 27,628,706$ 25,130,097$ 22,247,292$ 26,453,752$ 29,960,389$ 30,726,290$ 28,214,686$ 27,643,585$ 30,016,626$
All other governmental funds Reserved 7,954,393$ 549,455$ 384,735$ 592,136$ $ $ $ $ $ $ Unreserved, reported in: Special revenue funds 39,555,023 41,731,738 52,444,661 58,066,418
Capital project funds 1,968,757 10,265,707 1,176,745 842,548 Debt service fund 12,318,744 15,066 46
Nonspendable 84,711 271,992 231,804 139,493 104,770 117,597 Restricted 58,606,383 60,899,020 61,776,253 69,921,012 74,212,850 67,763,379 Unassigned (2,077,795) (3,303,500) (1,238,800) Total all other governmental funds 61,796,917$ 52,561,966$ 54,006,187$ 59,501,102$ 58,691,094$ 61,171,012$ 62,008,057$ 67,982,710$ 71,014,120$ 66,642,176$
Source: Coconino County Single Audit Reporting Package
1 Due to implementation of GASB 54 in FY 2011, categories regarding fund balances have been redefined.See Note 1 of Notes to Basic Financial Statements.
Coconino CountyFund Balances, Governmental Funds
Last Ten Fiscal Years(modified accrual basis of accounting)
184

2007 2008 2009 2010 2011 2012 2013 2014 2015 2016
Revenues: Property taxes 10,944,924$ 12,447,359$ 14,683,323$ 15,286,914$ 19,877,174$ 21,134,274$ 20,320,244$ 19,255,927$ 18,966,331$ 19,701,750$ County sales taxes 31,096,502 33,726,601 31,235,155 29,334,804 30,092,941 30,395,929 26,455,658 27,750,211 32,096,706 36,952,588 Special assessments 800,422 697,085 533,246 567,822 528,262 443,889 454,223 232,948 137,434 57,851 Licenses and permits 2,412,270 2,028,139 1,596,184 1,531,423 1,544,071 2,080,424 1,428,438 1,585,215 1,520,047 1,721,229 Fees, fines, and forfeits 1,958,043 2,426,546 2,636,342 2,475,047 1,912,702 1,536,208 1,434,276 1,890,338 1,609,332 1,887,642 Intergovernmental 52,924,453 52,807,937 52,131,109 51,035,314 61,706,361 51,173,921 60,388,098 60,348,857 60,921,308 61,905,784 Charges for services 12,413,030 11,059,144 10,616,158 11,421,254 11,176,829 9,280,931 8,764,702 7,751,499 7,004,301 6,923,006 Investment earnings 5,076,801 3,426,238 2,941,346 2,547,186 894,731 1,450,443 (360,692) 1,713,752 1,038,111 1,264,077 Contributions 420,695 638,673 498,811 654,529 582,801 629,849 674,720 658,818 600,116 679,203 Miscellaneous 681,321 644,530 1,039,999 411,152 547,255 491,740 613,048 531,987 565,043 1,439,331
Total revenues 118,728,461$ 119,902,252$ 117,911,673$ 115,265,445$ 128,863,127$ 118,617,608$ 120,172,715$ 121,719,552$ 124,458,729$ 132,532,461$
Expenditures: Current:
General government 29,462,096$ 31,775,048$ 31,104,566$ 30,537,222$ 30,019,684$ 30,768,104$ 31,049,633$ 29,107,514$ 31,139,164$ 31,421,859$ Public safety 28,039,150 31,240,851 31,381,596 30,336,374 36,611,002 34,375,074 39,373,290 45,050,982 43,662,534 48,707,702 Highways and streets 19,756,618 16,548,734 16,992,456 13,181,875 10,912,173 12,105,577 13,312,515 10,949,715 13,734,826 22,936,771 Sanitation 2,880,863 3,154,224 3,146,581 2,978,416 2,919,328 2,874,688 1,820,482 1,413,555 1,941,069 2,065,123 Health 11,403,856 12,077,635 12,361,518 10,956,358 10,795,196 11,338,648 12,036,240 13,528,580 13,091,067 12,723,241 Welfare 5,993,228 6,605,519 7,517,819 8,149,363 8,109,040 6,806,132 6,464,632 4,936,174 4,091,392 4,024,951 Culture and recreation 5,727,983 8,320,721 8,045,985 7,607,898 19,136,103 6,650,038 6,122,803 5,986,724 6,598,582 5,924,896 Education 3,618,428 4,273,975 4,730,288 5,110,500 4,727,587 5,085,903 5,783,644 7,176,253 6,456,550 5,141,470
Capital outlay 359,940 1,711,967 1,434,116 771,393 1,049,137 148,465 2,213,866 147,146 1,281,468 1,872,994 Debt service:
Principal 4,303,256 18,545,471 2,508,901 2,637,213 2,255,923 2,353,289 396,669 415,808 105,144 85,000 Interest and other charges 1,602,303 1,435,999 512,256 414,902 287,272 178,025 69,723 46,622 24,582 18,128 Total expenditures 113,147,721$ 135,690,144$ 119,736,082$ 112,681,514$ 126,822,445$ 112,683,943$ 118,643,497$ 118,759,073$ 122,126,378$ 134,922,135$
Excess (deficiency) of revenues over expenditures 5,580,740 (15,787,892) (1,824,409) 2,583,931 2,040,682 5,933,665 1,529,218 2,960,479 2,332,351 (2,389,674)
Other financing sources (uses): Capital lease agreement $ $ $ $ $ $ $ $ $ 90,011$ Sale of capital assets 368,694 22,911 2,100 28,179 1,329,950 20,194 502,570 127,958 361,335 Bond proceeds (791,550) 795,000 Transfers in 12,934,995 37,093,497 15,481,676 15,042,578 21,912,454 14,661,648 14,454,693 14,188,062 15,427,307 22,706,214 Transfers out (12,934,995) (36,982,221) (15,508,755) (15,042,578) (21,894,634) (14,608,758) (14,401,159) (14,188,062) (15,427,307) (22,766,789)
Total other financing sources and uses (422,856) 134,187 770,021 28,179 1,347,770 52,890 73,728 502,570 127,958 390,771
Net changes in fund balances 5,157,884$ (15,653,705)$ (1,054,388)$ 2,612,110$ 3,388,452$ 5,986,555$ 1,602,946$ 3,463,049$ 2,460,309$ (1,998,903)$
Debt service as a percentage of noncapital expenditures 5.53% 17.53% 2.62% 2.80% 2.06% 2.30% 0.42% 0.41% 0.12% 0.08%
Source: Coconino County Single Audit Reporting Package
Note: Financial statement amounts adjusted to show Capital Outlay in FY 2006 through 2008
Fiscal Year
Coconino County Changes in Fund Balances, Governmental Funds
Last Ten Fiscal Years (modified accrual basis of accounting)
185

Secured Unsecured
2007 1,288,341,613 225,916,527 1,514,258,140 0.8521 13,799,610,572 11.02008 1,458,940,955 229,241,854 1,688,182,809 0.8588 16,687,281,012 10.12009 1,605,854,299 234,920,747 1,840,775,046 0.8791 17,790,931,957 10.32010 1,694,104,159 224,614,413 1,918,718,572 0.8340 17,143,465,763 11.22011 1,607,918,353 232,224,257 1,840,142,610 1.0820 15,460,396,890 11.92012 1,714,437,231 45,163,364 1,759,600,595 1.3170 14,840,670,920 11.92013 1,714,436,551 45,173,364 1,759,609,915 1.3347 14,840,650,090 11.92014 1,475,006,428 58,058,854 1,533,065,282 1.4522 13,008,153,658 11.82015 1,478,590,523 55,893,415 1,534,483,938 1.4702 13,223,453,140 11.62016 1,545,641,492 56,698,420 1,602,339,912 1.4702 14,061,706,204 11.4
Source: Coconino County Assessor
Note: Secured and Unsecured assessed property values and estimated market values aredetermined each calendar year. The tax rates are applicable beginning July 1st of thenext fiscal year. The Board of Supervisors approves the tax rates on the third Mondayof August.
Total Assessed Value as a
Percentage of Total Estimated Market Value
Total Secured and Unsecured
Estimated Market Value
Total Direct Tax
Rate Total
Fiscal Year Ended June
30,
Property Values Assessed
Coconino CountyAssessed Value and Estimated Market Value of
Taxable PropertyLast Ten Years
186

Fiscal Year
County Operating Library District
Flood Control District
Public Health Service District Total Direct
2007 0.4622 0.1899 0.2000 0.8521 2008 0.4383 0.2205 0.2000 0.8588 2009 0.4338 0.2293 0.2160 0.8791 2010 0.3973 0.2367 0.2000 0.8340 2011 0.3953 0.2367 0.2000 0.2500 1.0820 2012 0.4303 0.2367 0.4000 0.2500 1.3170 2013 0.4480 0.2367 0.4000 0.2500 1.3347 2014 0.5466 0.2556 0.4000 0.2500 1.4522 2015 0.5466 0.2556 0.4000 0.2500 1.4522 2016 0.5646 0.2556 0.4000 0.2500 1.4702
Overlapping Rates
Fiscal Year
Fire District Assistance
School Equalization
Community College Cities Fire Districts
Other Special Districts School Districts
2007 0.1000 0.5269 0 - 1.5929 0.4700 - 3.0000 0 - 1.3500 0.0500 - 9.46062008 0.1000 0.4865 0 - 1.5519 0.4100 - 2.7500 0 - 2.2300 0.0500 - 9.90252009 0.0972 0.4643 0 - 1.5169 0.4100 - 2.7500 0 - 2.2300 0.0500 - 10.98962010 0.0904 0.3306 0.4267 0 - 1.4913 0.3000 - 3.0000 0 - 2.9705 0.0500 - 9.93712011 0.0925 0.3564 0.4308 0 - 1.4845 0.2742 - 3.0000 0 - 2.6680 0.0500 - 8.45202012 0.0986 0.4259 0.4734 0 - 1.5283 0.0600 - 3.2500 0 - 1.5640 0.0500 - 8.59342013 0.1000 0.4717 0.4927 0 - 1.5497 0.3000 - 3.2500 0 - 1.6919 0.0500 - 10.70072014 0.1000 0.5123 0.5879 0 - 1.6795 0.3500 - 3.2500 0 - 3.3685 0.0500 - 11.94612015 0.1000 0.5123 0.5879 0 - 1.6784 0.4000 - 3.2500 0 - 1.6659 0.0500 - 11.94612016 0.1000 0.5089 0.6056 0 - 1.6784 0.4000 - 3.2500 0 - 1.6659 0.0500 - 13.0827
Source: Coconino County adopted tax rate schedules
Note: Tax rates are per $100 assessed valuation.
Direct Rates
Coconino CountyDirect and Overlapping Property Tax Rates
Last Ten Fiscal Years
187

2016 2009
TaxpayerTotal Assessed
Value Rank
Percentage of Total Primary
Assessed Value
Total Assessed Value Rank
Percentage of Total Primary
Assessed Value
Arizona Public Service Company 78,375,580$ 1 4.89% 77,017,813$ 1 4.18%Transwestern Pipeline Company 25,246,409 2 1.58 35,331,053 2 1.92Unisource Energy Corporation 19,498,977 3 1.22 18,541,722 4 1.01BNSF Railway Company 19,294,328 4 1.20 16,356,913 7 0.89W.L. Gore & Associates Inc. 18,164,529 5 1.13 18,043,975 5 0.98City of Los Angeles Dept of Wtr & Pwr 15,870,784 6 0.99 18,018,149 6 0.98Kinder Morgan (El Paso Natural Gas) 15,446,144 7 0.96 19,625,984 3 1.07Nevada Power Company 9,921,570 8 0.62 9,866,303 9 0.54Qwest Corporation 5,697,142 9 0.36 13,184,230 8 0.72Wal-mart Stores Inc. 4,915,014 10 0.31HTS-CHC (Sedona) LLC 5,431,114 10 0.30Total Principal Taxpayers 212,430,477$ 13.26% 231,417,256$ 12.59%
Total Coconino County Primary Assessed Value 1,602,339,912$ 1,840,775,046$
Source: Coconino County Assessor
Coconino County Principal Property Tax Payers
Current Year and Seven Years Ago
188

Collected within the FiscalYear of the Levy Total Collections to Date
Fiscal Year Ended June
30,
County Tax Levied For the
Fiscal Year Amount Percentage of
Levy
Collections in Subsequent
Years Amount Percentage
of Levy
2007 10,373,130$ 10,197,426$ 98.31 172,828$ 10,370,254$ 99.972008 11,991,569 11,693,983 97.52 283,373 11,977,356 99.882009 14,061,783 13,583,453 96.60 456,882 14,040,335 99.852010 14,383,909 13,977,568 97.18 406,803 14,384,371 100.002011 19,513,519 18,641,220 95.53 734,404 19,375,624 99.292012 19,880,920 19,239,142 96.77 527,319 19,766,461 99.422013 19,356,876 18,811,741 97.18 421,051 19,232,792 99.362014 18,532,923 18,092,321 97.62 319,253 18,411,574 99.352015 18,693,720 18,610,772 99.56 910 18,611,682 99.562016 19,059,353 18,622,068 97.71 18,622,068 97.71
County Tax Levied for the Fiscal YearFiscal Year Ended June
30, County
Operating Public Health Service District
Flood Control District County Library Total County
2007 6,332,859 1,237,412 2,802,859 10,373,130 2008 6,637,571 1,508,651 3,845,347 11,991,569 2009 7,328,876 2,014,075 4,718,832 14,061,783 2010 7,320,104 1,961,323 5,102,482 14,383,909 2011 7,631,149 5,153,351 1,849,827 4,879,193 19,513,519 2012 7,774,986 4,588,969 3,172,129 4,344,836 19,880,920 2013 7,836,325 4,397,524 2,959,452 4,163,575 19,356,876 2014 8,321,922 3,828,370 2,468,506 3,914,125 18,532,923 2015 8,541,404 3,820,326 2,426,088 3,905,901 18,693,720 2016 8,828,938 3,848,713 2,446,777 3,934,925 19,059,353
Source: Taxes levied and collections are obtained from the Coconino County Treasurer.
Note: Collections to date may exceed 100%, as the initial amount levied is not updated to reflect any adjustments or exemptions arising from taxpayer disputes.
Coconino CountyProperty Tax Levies and Collections
Last Ten Fiscal Years
189
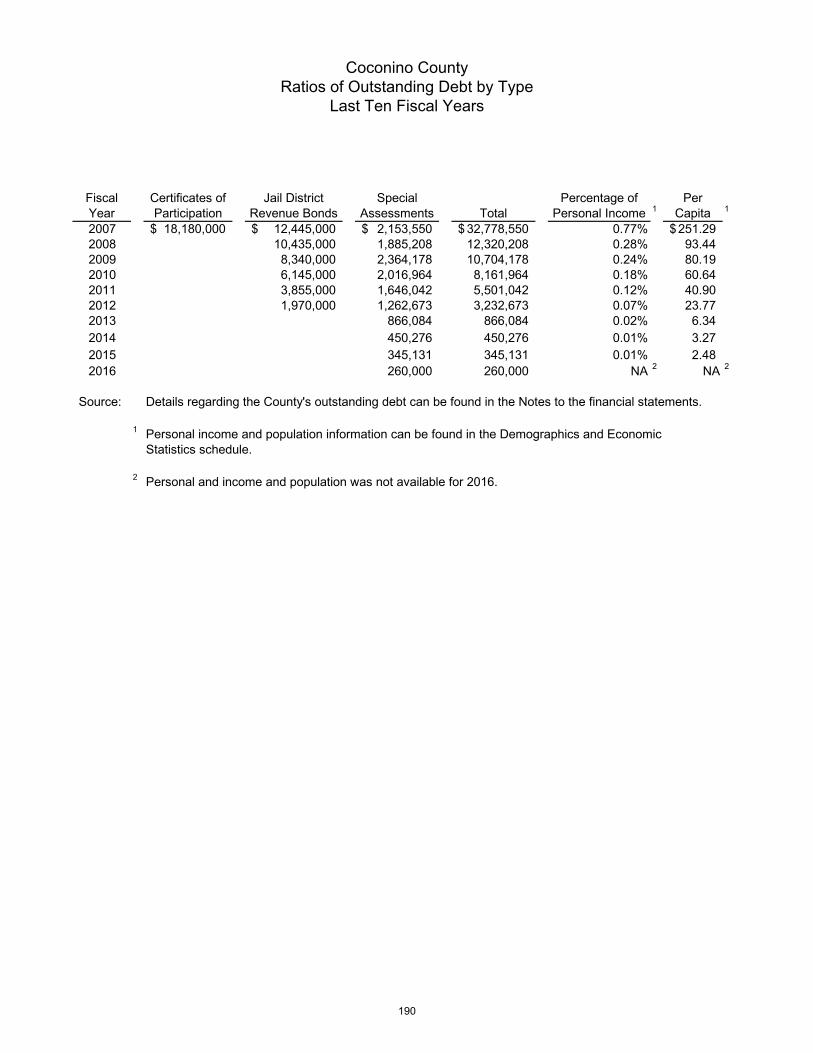
Fiscal Year
Certificates of Participation
Jail District Revenue Bonds
Special Assessments Total
Percentage of Personal Income 1
Per Capita 1
2007 18,180,000$ 12,445,000$ 2,153,550$ 32,778,550$ 0.77% 251.29$ 2008 10,435,000 1,885,208 12,320,208 0.28% 93.44 2009 8,340,000 2,364,178 10,704,178 0.24% 80.19 2010 6,145,000 2,016,964 8,161,964 0.18% 60.64 2011 3,855,000 1,646,042 5,501,042 0.12% 40.90 2012 1,970,000 1,262,673 3,232,673 0.07% 23.77 2013 866,084 866,084 0.02% 6.34 2014 450,276 450,276 0.01% 3.27 2015 345,131 345,131 0.01% 2.48 2016 260,000 260,000 NA 2 NA 2
Source: Details regarding the County's outstanding debt can be found in the Notes to the financial statements.
1 Personal income and population information can be found in the Demographics and Economic Statistics schedule.
2 Personal and income and population was not available for 2016.
Coconino CountyRatios of Outstanding Debt by Type
Last Ten Fiscal Years
190
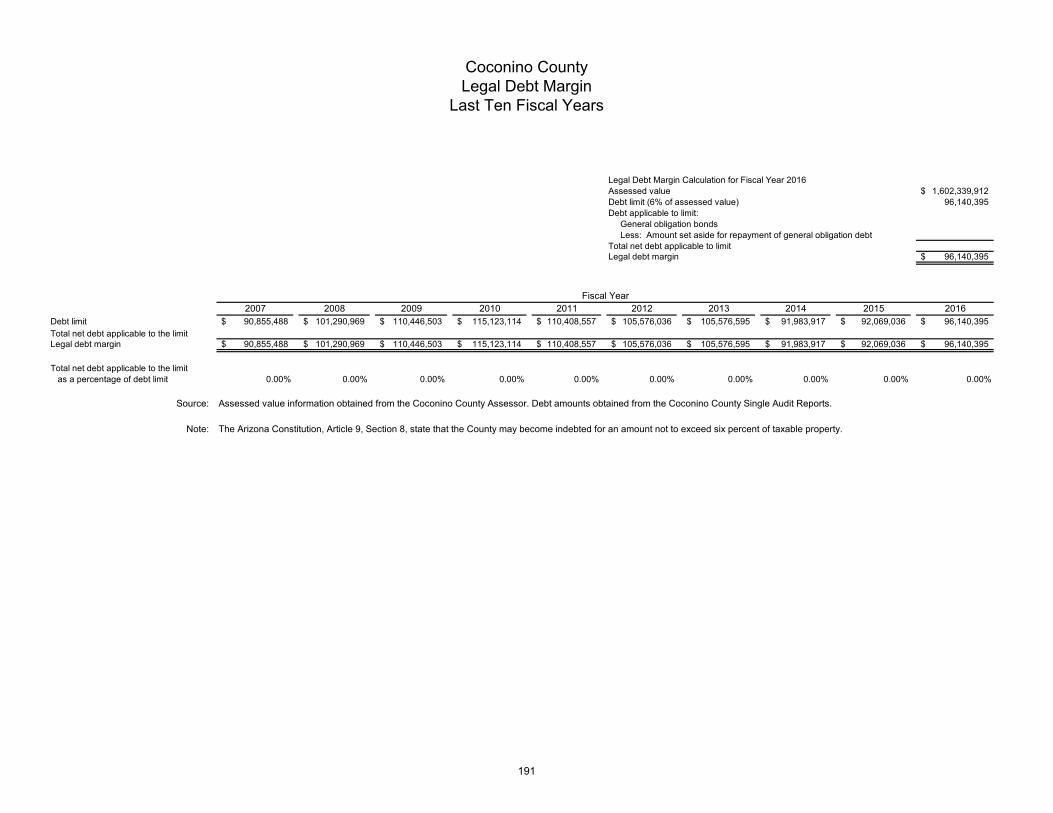
Legal Debt Margin Calculation for Fiscal Year 2016Assessed value 1,602,339,912$ Debt limit (6% of assessed value) 96,140,395 Debt applicable to limit:
General obligation bonds Less: Amount set aside for repayment of general obligation debtTotal net debt applicable to limitLegal debt margin 96,140,395$
2007 2008 2009 2010 2011 2012 2013 2014 2015 2016Debt limit 90,855,488$ 101,290,969$ 110,446,503$ 115,123,114$ 110,408,557$ 105,576,036$ 105,576,595$ 91,983,917$ 92,069,036$ 96,140,395$ Total net debt applicable to the limitLegal debt margin 90,855,488$ 101,290,969$ 110,446,503$ 115,123,114$ 110,408,557$ 105,576,036$ 105,576,595$ 91,983,917$ 92,069,036$ 96,140,395$
Total net debt applicable to the limit as a percentage of debt limit 0.00% 0.00% 0.00% 0.00% 0.00% 0.00% 0.00% 0.00% 0.00% 0.00%
Source: Assessed value information obtained from the Coconino County Assessor. Debt amounts obtained from the Coconino County Single Audit Reports.
Note: The Arizona Constitution, Article 9, Section 8, state that the County may become indebted for an amount not to exceed six percent of taxable property.
Fiscal Year
Coconino CountyLegal Debt Margin
Last Ten Fiscal Years
191

NetFiscal Jail District Less: AvailableYear Revenues 1 Expenditures 2 Revenue Principal Interest Coverage2007 17,132,399$ 10,708,410$ 6,423,989$ 2,010,000$ 566,908$ 2.49 2008 20,714,914 12,543,072 8,171,842 2,095,000 477,958 3.18 2009 22,039,625 12,175,349 9,864,276 2,195,000 383,992 3.82 2010 23,176,800 12,060,220 11,116,580 2,290,000 284,622 4.32 2011 24,465,343 12,366,420 12,098,923 1,885,000 177,311 5.87 2012 25,597,226 12,638,737 12,958,489 1,970,000 89,333 6.29 2013 26,432,645 12,954,957 13,477,688 1,500 2014 29,764,353 13,793,638 15,970,715 2015 33,158,650 13,554,714 19,603,936 2016 37,112,310 24,544,528 12,567,782
SpecialFiscal AssessmentYear Revenues 1 Principal Interest Coverage2007 762,301$ 293,256$ 168,330$ 1.652008 1,024,569 270,471 126,011 2.582009 1,082,701 313,901 128,264 2.452010 938,727 347,213 130,280 1.972011 1,001,654 370,923 109,961 2.082012 971,522 370,923 109,961 2.022013 931,380 396,669 68,223 2.002014 704,051 415,808 46,622 1.522015 371,959 105,144 24,582 2.872016 297,796 85,000 18,128 2.89
Source:
1 Revenues included beginning fund balances and transfers in.2 Expenditures include transfers out.
Details regarding the County's outstanding debt can be found in the Notes to the financial statements.
Debt Service
Debt Service
Jail District Revenue Bonds
Special Assessment Bonds
Coconino CountyPledged Revenue Coverage
Last Ten Fiscal Years
192

Year Population
Personal Income
(thousands of dollars)
Per Capita Personal Income
Unemployment Rate
2007 130,442 4,348,995$ 33,340$ 3.7%2008 131,853 4,590,014 34,812 5.12009 133,477 4,514,396 33,822 7.12010 134,611 4,523,918 33,607 8.42011 134,105 4,617,232 34,430 8.22012 136,011 4,735,934 34,820 8.32013 136,539 4,906,294 35,933 7.92014 137,682 5,399,899 39,220 7.12015 139,097 5,705,476 41,018 6.42016 143,616 NA 1 NA 1 6.5
Sources: Population and personal income through 2015 obtained from U.S. Department ofCommerce, Bureau of Economic Analysis (BEA).
Population projection for 2016 obtained from Office of Employment & PopulationStatistics, Arizona Department of Administration.
Unemployment rate obtained from Arizona Unemployment Statistics Program, Research Administration.
1 Personal income estimates were not yet available for fiscalyear 2016.
Coconino CountyDemographic and Economic Statistics
Last Ten Fiscal Years
193

THIS PAGE BLANK
194

2016 1 2007 2
Employer Employees Rank
Percentage of Total County Employment Employees Rank
Percentage of Total County Employment
Northern Arizona University 2,815 1 4.10% 3,393 1 4.99%Flagstaff Medical Center 2,350 2 3.42% 1,999 2 2.94%W.L. Gore 2,200 3 3.20% 1,300 4 1.91%Flagstaff Unified School District 1,436 4 2.09% 1,700 3 2.50%Coconino County 1,294 5 1.88% 1,056 5 1.55%City of Flagstaff 872 6 1.27% 948 6 1.39%Twin Arrows Navajo Casino Resort 700 7 1.02%Walmart 630 8 0.92%Grand Canyon Railway 421 9 0.61%SCA Tissue 279 10 0.41% 279 8 0.41%Walgreens Distribution Center 400 7 0.59%
Total Employment in Coconino County As of June 30 3 68,662 67,997
Sources: 1 Economic Collaborative of Northern Arizona, Flagstaff Chamber of Commerce2 Arizona Department of Economic Security, Workforce Arizona Statistics3 Arizona Unemployment Statistics Program, Research Administration
Coconino CountyPrincipal Employers
Current Year and Nine Years Ago
195

Function/Program 2007 2008 2009 2010
General GovernmentAssessor 26.00 27.00 27.08 27.00 Board of Supervisors 13.50 13.50 14.50 14.00 Clerk of the Superior Court 23.50 23.35 23.35 23.35 Community Development 21.50 23.00 23.50 23.50 County Attorney 42.00 42.75 43.00 42.00 County Manager 5.00 10.50 10.50 11.00 Facilities Management 28.00 28.00 28.00 28.00 Finance 19.00 19.00 18.00 18.00 Human Resources 10.00 11.00 10.00 10.00 Government RelationsInformation Technology 28.00 28.00 30.00 30.00 Justice Court - Flagstaff 22.00 24.25 24.50 23.50 Justice Court - Fredonia 2.50 2.50 2.50 2.50 Justice Court - Page 5.00 5.00 5.00 5.00 Justice Court - Williams 5.00 5.00 5.00 5.00 Legal Defender 4.48 5.00 5.00 5.00 Non-DepartmentalOrganizational Development 1.00 1.00 1.00 1.00 Public Defender 22.00 22.00 22.00 21.00 Recorder 17.00 19.00 19.00 19.00 Superintendent of Schools 10.40 11.36 11.36 11.36 Superior Court 31.00 34.75 35.00 36.00 Treasurer 8.50 8.50 8.00 8.00
Public SafetyAdult Probation 59.60 60.10 60.10 60.10 Constable 1.00 1.00 1.00 1.00 Emergency ManagementJail District 146.33 165.83 168.83 168.83 Juvenile Court Services 75.28 75.48 75.28 72.08 Sheriff 93.50 94.50 94.50 96.50
Highways and StreetsPublic Works 136.40 136.40 136.40 136.40
SanitationKachina Village Imp. Dist. 8.00 8.00 8.00 8.00
HealthHealth 122.50 129.58 132.53 135.17
WelfareCareer Center 10.88 10.88 13.88 13.00 Community Services 47.92 49.15 51.65 43.17
Culture and RecreationParks and Recreation 19.00 20.50 21.00 21.00
Total 1,065.79 1,115.88 1,129.46 1,119.46
Source: Coconino County Budget Books 2007-2016
Full-time Equivalent Employees as of June 30
Coconino CountyFull-Time Equivalent Employees by Function
Last Ten Fiscal Years
196

2011 2012 2013 2014 2015 2016
25.00 25.00 26.00 27.00 27.00 26.00 13.50 13.50 13.50 14.50 14.50 14.50 23.35 23.35 23.98 23.60 23.60 25.60 22.50 22.50 22.50 23.50 30.00 30.00 42.00 42.00 42.00 43.00 43.00 43.00 12.00 12.40 13.22 12.47 7.00 7.00 26.00 26.00 26.00 26.00 26.00 26.00 17.00 18.25 18.25 18.00 18.00 18.00 10.00 9.73 9.73 10.63 10.63 11.75
4.00 4.00 31.00 28.00 24.00 24.00 24.00 24.25 22.75 22.75 22.75 21.50 21.50 21.50 2.50 2.50 2.50 2.50 2.50 2.75 5.00 5.00 5.00 5.00 5.00 5.00 5.00 5.00 5.00 6.00 6.00 6.00 5.00 5.00 5.00 6.00 6.00 6.25 4.00 3.00
21.00 21.00 21.00 20.00 20.00 20.00 17.00 17.00 17.00 17.50 17.50 17.50 9.58 8.88 11.66 10.83 10.00 10.71
35.00 33.50 34.33 34.33 36.33 36.33 8.00 8.00 8.00 8.00 8.00 8.00
59.50 59.50 58.80 56.80 56.80 57.81 1.00 1.00 1.00 1.00 1.00 1.00
3.00 3.00 166.83 169.63 169.68 170.98 172.89 181.50 71.20 69.58 68.63 70.11 69.93 70.55 97.50 97.50 99.65 96.83 98.75 97.13
121.15 120.50 132.13 127.54 125.51 125.51
8.00 8.00 8.00 8.00 8.00 8.00
111.65 113.71 111.60 114.33 102.32 95.43
13.00 12.00 12.00 12.00 13.00 13.00 48.22 51.22 50.32 48.33 34.83 34.42
19.75 19.75 20.00 19.00 19.00 19.00 1,074.98 1,074.75 1,083.23 1,079.28 1,065.59 1,070.49
197

Function/Program 2007 2008 2009 2010
General GovernmentClerk of the Superior Court
New Court Cases 3,805 3,502 3,910 3,950 Community Development
Building Permits Issued 1,934 1,794 1,581 1,783 Building Inspection/Site Visits 7,487 6,950 6,295 4,624
County AttorneyAdult Felony and Misdemeanor cases 8,994 8,334 7,518 7,009 Victim Restitution Collected for Bad Checks 52,846$ 49,833$ 35,028$ 24,150$
Justice CourtsTotal Cases 27,462 26,206 27,596 26,801
Legal DefenderTotal Cases 605 512 466 400
Public DefenderTotal Cases 4,562 4,001 3,889 3,393
RecorderDocuments Recorded by Fiscal Year 54,356 42,701 37,929 37,000 Registered Voters 62,046 66,000 71,000 66,000
Superior CourtTotal Number of Criminal Cases Filed 1,192 1,108 1,179 1,024 Total Number of Domestic Relations Cases Filed 725 619 692 766 Total Number of Civil Cases Filed 998 874 1,111 1,166
TreasurerTotal Real Property Notices 72,518 74,000 77,100 73,796
Public safetyAdult Probation
Monthly Average Probationers Supervised 1,343 1,280 1,236 1,253 Restitution Collected 244,527$ 220,000$ 237,055$ 196,824$
Jail DistrictAverage Local Population 365 397 366 372
Juvenile Court ServicesDelinquents and Incorrigible Petitions Filed 870 878 817 662 Contributed to Community Through Restitution Hours 34,650$ 34,779$ 54,433$ 46,906$
SheriffCalls for Service 42,344 38,911 40,656 50,311
Culture and recreationParks and Recreation
County Fair participants 42,536 43,126 45,049 41,711 Highways and streets
Public WorksNumber of miles graded 1,712 2,114 2,382 2,303 Number of miles resurfaced 28 35 53 45 Miles of road chip sealed 24 75 21 60
HealthHealth Department
Patient Vaccination visits 10,729 10,783 10,512 10,510 Restaurant/Public Facility Inspections 3,664 4,048 3,838 3,662
WelfareCommunity Services
Home Delivered Meals 21,227 24,400 20,806 20,500 Congregate Meals 23,612 25,100 24,366 25,076 Cases Managed 3,591 3,042 3,012 3,180
Source: County Department records and Adopted Budgets
Fiscal Year
Coconino CountyOperating Indicators by Function/Program
Last Ten Fiscal Years
198
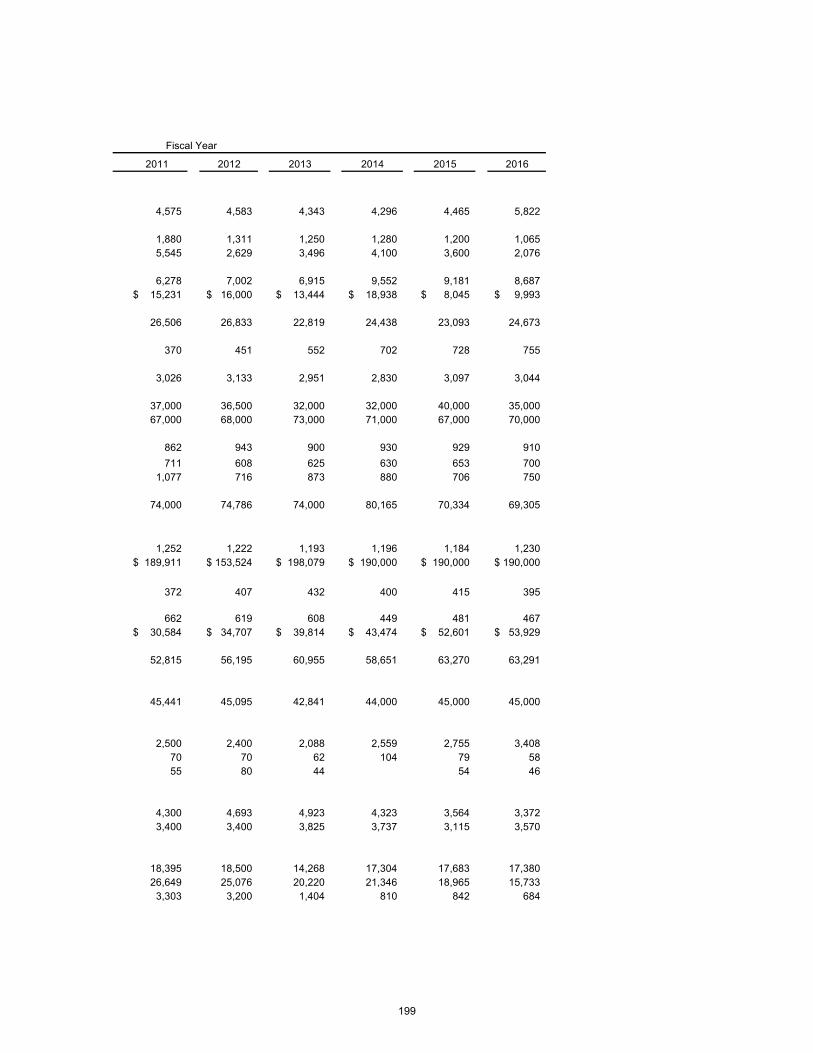
2011 2012 2013 2014 2015 2016
4,575 4,583 4,343 4,296 4,465 5,822
1,880 1,311 1,250 1,280 1,200 1,065 5,545 2,629 3,496 4,100 3,600 2,076
6,278 7,002 6,915 9,552 9,181 8,687 15,231$ 16,000$ 13,444$ 18,938$ 8,045$ 9,993$
26,506 26,833 22,819 24,438 23,093 24,673
370 451 552 702 728 755
3,026 3,133 2,951 2,830 3,097 3,044
37,000 36,500 32,000 32,000 40,000 35,000 67,000 68,000 73,000 71,000 67,000 70,000
862 943 900 930 929 910 711 608 625 630 653 700
1,077 716 873 880 706 750
74,000 74,786 74,000 80,165 70,334 69,305
1,252 1,222 1,193 1,196 1,184 1,230 189,911$ 153,524$ 198,079$ 190,000$ 190,000$ 190,000$
372 407 432 400 415 395
662 619 608 449 481 467 30,584$ 34,707$ 39,814$ 43,474$ 52,601$ 53,929$
52,815 56,195 60,955 58,651 63,270 63,291
45,441 45,095 42,841 44,000 45,000 45,000
2,500 2,400 2,088 2,559 2,755 3,408 70 70 62 104 79 58 55 80 44 54 46
4,300 4,693 4,923 4,323 3,564 3,372 3,400 3,400 3,825 3,737 3,115 3,570
18,395 18,500 14,268 17,304 17,683 17,380 26,649 25,076 20,220 21,346 18,965 15,733
3,303 3,200 1,404 810 842 684
Fiscal Year
199

2008 2009 2010 2011 2012 2013 2014 2015 2016FunctionGeneral government
Facilities square footage managed 684,914 684,914 684,914 684,914 684,914 684,914 679,914 682,455 682,455Public safety
Jails 2 2 2 2 2 2 2 2 2Substations 8 8 8 8 8 8 7 7 7Patrol vehicles 74 74 75 77 79 55 46 47 56
Highways and streetsBridges 30 30 30 30 30 38 39 39 39Miles of paved roads 322 323 323 332 319 319 333 323 322Miles of unpaved roads 711 711 711 711 611 604 590 672 676
SanitationSolid Waste transfer stations 10 10 10 10 8 8 2 2 2Wastewater treatment facilities 1 1 1 1 1 1 1 1 1Wells 5 5 5 5 5 5 5 5 5
HealthPublic health facilities 1 1 1 1 1 1 1 1 1Animal transport vehicles 3 3 3 3 4 4 4 4 4
Culture and recreationParks 9 9 9 9 9 9 9 9 9Acres protected as open space 589 589 589 2,503 2,600 2,600 2,600 2,600 2,600Trail miles available for public use 16 17 17 18 18 18 18 23 23
EducationSchool building 2 2 2 2 2 2 2 2 2
Source: Coconino County capital asset records and county departmentsNote: Information was only available for nine years.
Fiscal Year
Coconino CountyCapital Asset and Infrastructure Statistics by Function
Last Nine Fiscal Years
200