Development of a vector construct for the transformation of the coccolithophore Emiliania huxleyi
Biogeosciences, 14, 4577–4599, 2017https://doi.org/10.5194/bg-14-4577-2017© Author(s) 2017. This work is distributed underthe Creative Commons Attribution 3.0 License.
Coccolithophore fluxes in the open tropical North Atlantic: influenceof thermocline depth, Amazon water, and Saharan dustCatarina V. Guerreiro1,6, Karl-Heinz Baumann1,2, Geert-Jan A. Brummer3,4, Gerhard Fischer1,2, Laura F. Korte3,Ute Merkel1,2, Carolina Sá5,6, Henko de Stigter3, and Jan-Berend W. Stuut2,3
1University of Bremen, Geosciences Department, Klagenfurter Str., 28359 Bremen, Germany2MARUM – Center for Marine Environmental Sciences, University of Bremen, Leobener Str. 8, 28359 Bremen, Germany3NIOZ Royal Netherlands Institute for Sea Research, Department of Ocean Systems, Den Burg 1790 AB, and UtrechtUniversity, the Netherlands4VU University, Earth and Climate Cluster, Department of Earth Sciences, Faculty of Earth and Life Sciences,De Boelelaan 1085 1081 HV Amsterdam, the Netherlands5MARE Marine and Environmental Science Centre, Faculdade de Ciências da Universidade de Lisboa, Campo Grande,1749-016 Lisbon, Portugal6CIMA, Centre for Marine and Environmental Research, Universidade do Algarve, 8005-139 Faro, Portugal
Correspondence to: Catarina V. Guerreiro ([email protected])
Received: 29 May 2017 – Discussion started: 14 June 2017Revised: 7 September 2017 – Accepted: 8 September 2017 – Published: 17 October 2017
Abstract. Coccolithophores are calcifying phytoplanktonand major contributors to both the organic and inorganicoceanic carbon pumps. Their export fluxes, species compo-sition, and seasonal patterns were determined in two sedi-ment trap moorings (M4 at 12◦ N, 49◦W and M2 at 14◦ N,37◦W) collecting settling particles synchronously from Oc-tober 2012 to November 2013 at 1200 m of water depth inthe open equatorial North Atlantic.
The two trap locations showed a similar seasonal pat-tern in total coccolith export fluxes and a predominantlytropical coccolithophore settling assemblage. Species fluxeswere dominated throughout the year by lower photic zone(LPZ) taxa (Florisphaera profunda, Gladiolithus flabella-tus) but also included upper photic zone (UPZ) taxa (Umbel-losphaera spp., Rhabdosphaera spp., Umbilicosphaera spp.,Helicosphaera spp.). The LPZ flora was most abundant dur-ing fall 2012, whereas the UPZ flora was more important dur-ing summer. In spite of these similarities, the western part ofthe study area produced persistently higher fluxes, averag-ing 241× 107
± 76× 107 coccoliths m−2 d−1 at station M4compared to only 66×107
±31×107 coccoliths m−2 d−1 atstation M2. Higher fluxes at M4 were mainly produced bythe LPZ species, favoured by the westward deepening ofthe thermocline and nutricline. Still, most UPZ species also
contributed to higher fluxes, reflecting enhanced productivityin the western equatorial North Atlantic. Such was the caseof two marked flux peaks of the more opportunistic speciesGephyrocapsa muellerae and Emiliania huxleyi in Januaryand April 2013 at M4, indicating a fast response to the nutri-ent enrichment of the UPZ, probably by wind-forced mix-ing. Later, increased fluxes of G. oceanica and E. huxleyiin October–November 2013 coincided with the occurrenceof Amazon-River-affected surface waters. Since the springand fall events of 2013 were also accompanied by two dustflux peaks, we propose a scenario in which atmospheric dustalso provided fertilizing nutrients to this area. Enhanced sur-face buoyancy associated with the river plume indicates thatthe Amazon acted not only as a nutrient source, but also asa surface density retainer for nutrients supplied from the at-mosphere. Nevertheless, lower total coccolith fluxes duringthese events compared to the maxima recorded in Novem-ber 2012 and July 2013 indicate that transient productiv-ity by opportunistic species was less important than “back-ground” tropical productivity in the equatorial North At-lantic. This study illustrates how two apparently similar sitesin the tropical open ocean actually differ greatly in ecologicaland oceanographic terms. The results presented here providevaluable insights into the processes governing the ecological
Published by Copernicus Publications on behalf of the European Geosciences Union.
4578 C. V. Guerreiro et al.: Coccolithophore fluxes in the open tropical North Atlantic
dynamics and the downward export of coccolithophores inthe tropical North Atlantic.
1 Introduction
The centres of subtropical gyres and tropical open-ocean re-gions are marked by nearly permanently stratified waters,which result in nutrient depletion at the surface and low pri-mary production, particularly at the surface during most ofthe year (see Mann and Lazier, 2006). With the exceptionof equatorial upwelling areas where the renewal of nutri-ents in the mixed layer results from the upward advection ofnutrient-rich deeper water, algal blooms in subtropical gyresand tropical oceans are highly dependent on the seasonaldynamics of the mixed layer depth, the latter changing asa geostrophic response to the wind field and the curl of thewind stress (e.g. Longhurst et al., 1995). Basin-scale ther-mocline tilting, mesoscale eddies, and vertical mixing due towind forcing and winter cooling are recognized as the mainmechanisms responsible for bringing nutrients to the upperphotic layer and promoting algal blooms in tropical and sub-tropical areas (e.g. Longhurst, 1993; Dufois et al., 2016). Inaddition, millions of tons of Saharan dust blown over and intothe Atlantic Ocean every year are also thought to act as majornutrient suppliers to the nutrient-depleted equatorial NorthAtlantic (see Goudie and Middleton, 2001 and refs. therein;Okin et al., 2011). The fertilizing potential of Saharan dustis supported by previous studies in the Amazon Basin (Ma-howald et al., 2008, 2009; Bristow et al., 2010), the Gulfof Mexico and the coast of southern Florida (Walsh et al.,2006; Lenes et al., 2012), and the North Atlantic subtropi-cal gyre (Pabortsava et al., 2017). In addition to Saharan dustinputs, N2 fixation by marine diazotrophs (Carpenter et al.,1999) and the seasonal discharge and eastward advection ofthe nutrient-enriched Amazon River Plume (e.g. De Masteret al., 1986) are additional nutrient sources for marine phyto-plankton in the tropical Atlantic.
Despite relatively low primary production rates, tropicaloceans play an important role in the global carbon cyclebecause of their large surface area (e.g. Wang et al., 2013;Signorini and McClain, 2012; Longhurst, 1993). How theseoceanographic and atmospheric processes are linked to phy-toplankton productivity on seasonal to annual timescales inthe tropics, however, remains poorly understood. As longer-term phytoplankton sampling in the vast and remote openocean is rather costly, most of the available studies are basedon data from snapshots taken during research cruises orremote-sensing estimates that only cover the phytoplanktonbiomass at the surface of the photic layer. Time-series sed-iment traps collecting settling particles (organic and inor-ganic) from phytoplankton export productivity over longerperiods of time (from weeks to years) offer a good alterna-tive to plankton studies for assessing the seasonal variationof marine phytoplankton and the relative proportion of indi-
vidual species or groups of species in the open ocean (e.g.Milliman, 1993; Baumann et al., 2005).
Coccolithophores, being at the same time photosyntheticand calcifying, are major contributors to the organic and inor-ganic oceanic carbon pumps (e.g. Rost and Riebesell, 2004).Due to their ability to cover their cells with tiny calcite plates(the coccoliths), coccolithophores can be studied in time se-ries samples collected by deep-ocean sediment traps (e.g.Broerse et al., 2000; Sprengel et al., 2002; Ziveri et al., 1995;Köbrich et al., 2015), thus providing insight into the seasonalto inter-annual dynamics of open-ocean phytoplankton. Coc-colithophores are amongst the most important phytoplanktongroups within open-ocean, stratified oligotrophic waters (e.g.Winter et al., 1994), hence displaying features more typicalof K-selected taxa (Margalef, 1978). These so-called “K-selected” taxa are typically better adapted to compete suc-cessfully for limited nutrient availability in more stable en-vironments, such as tropical regions and subtropical gyres,within populations that are at or near equilibrium conditionsfor long periods of time (K; see Margalef, 1978). Still, coc-colithophores also include more opportunistic taxa, so-called“r-selected”, that quickly respond to short-term changes as-sociated with nutrient input (e.g. Guerreiro et al., 2013). Thelatter are characterized by living in highly variable popula-tions (for r) and being well adapted to rapidly reproducingin unstable and nutrient-enriched conditions, such as turbu-lent coastal environments. Sediment trap studies using thisgroup are based on the assumption that the settling of coc-coliths in open-ocean areas is primarily related to the pro-duction occurring in the overlying photic layer (see Deuseret al., 1981; Honjo, 1982; Steinmetz, 1994; Beaufort andHeussner, 2001), allowing for the assessment of the exportfluxes and seasonal trends of distinct coccolithophore speciesduring longer periods than most plankton studies (Baumannet al., 2005).
Although a significant amount of sediment trap data oncoccolithophores fluxes exists for the open ocean (e.g. Knap-pertsbusch and Brummer, 1995; Broerse et al., 2000) andfor regions near continental margins and islands (Beaufortand Heussner, 2001; Romero et al., 2002; Köbrich et al.,2015; Sprengel et al., 2002) at subtropical and temperatelatitudes in the Atlantic, there is no information availableon the export and seasonal patterns of coccolithophores inthe equatorial Atlantic region. Previous studies by Kinkelet al. (2000) and Winter et al. (2002) focusing on the livingcoccolithophore communities in the tropical Atlantic havereported Florisphaera profunda as the dominant species inthe lower photic zone (LPZ) and Emiliania huxleyi as thedominant species in the upper photic zone (UPZ) close tothe equatorial upwelling and in the western Caribbean Sea,whereas Umbellosphaera spp. were most abundant in theUPZ of more open-ocean oligotrophic areas. Further north,in the subtropics of offshore Bermuda, Haidar and Thier-stein (2001) studied the relationship between the seasonalcoccolithophore dynamics and several environmental param-
Biogeosciences, 14, 4577–4599, 2017 www.biogeosciences.net/14/4577/2017/

C. V. Guerreiro et al.: Coccolithophore fluxes in the open tropical North Atlantic 4579
eters, including light, dissolved nutrients, salinity, and tem-perature, over a period of 3 years. The results showed that liv-ing coccolithophores display pronounced seasonal and inter-annual variability, with the highest standing stocks from win-ter to spring and the lowest during summer. E. huxleyi wasthe dominant species at the surface during spring, whereasthe LPZ species F. profunda and Gladiolithus flabellatus (re-ferred to by these authors as Thoracosphaera flabellata) weremost common below the surface during fall. During max-imum stratification conditions in summer and fall, Umbel-losphaera spp. increase in abundance in the top 75 m of wa-ter depth but in much lower cell densities than E. huxleyior F. profunda. Several of these previous observations wereconfirmed by Poulton et al. (2017), who defined three flo-ral depth groups in the subtropical gyres and equatorial wa-ters of the Atlantic Ocean: (1) an upper euphotic zone floracharacterized by high levels of surface radiance and high celldensities of Umbellosphaera spp. and holococcolithophores;(2) a lower euphotic zone flora characterized by interme-diate to low surface radiance levels and high cell densitiesof E. huxleyi and Gephyrocapsa ericsonii; and (3) a sub-euphotic zone flora characterized by high cell densities ofF. profunda and Gladiolithus spp. thriving below the depth atwhich light is considered sufficient to support photosynthe-sis, probably by mechanisms of mixotrophy and/or phagotro-phy. Therefore, more insight into the ecological preferencesand environmental needs of coccolithophores can be ex-pected from a clear distinction between the distribution andabundance of UPZ and LPZ taxa.
Here, we present new data on the coccolithophore exportfluxes, seasonal patterns, and species composition from theopen equatorial North Atlantic to investigate the environ-mental factors triggering phytoplankton productivity, includ-ing Saharan dust deposition and the discharge and eastwarddispersion of the Amazon River water. To assess the spatio-temporal variability of these processes, we (a) compare re-sults from two sediment trap moorings, M2 and M4, locatedin the central and western parts of the equatorial North At-lantic, respectively, and (b) relate coccolithophore data withenvironmental time series data obtained from satellite remotesensing for the sediment trap sampling period and with par-ticle flux data collected from the same sediment traps andrecently published by Korte et al. (2017).
2 Oceanographic and meteorological settings
Surface water circulation in the study area, involving trop-ical surface water (TSW) and the South Atlantic Cen-tral Water (SACW), is mostly driven by the north-easterlytrade winds responsible for generating the westward-flowingNorth Equatorial Current (NEC) between approximately 10and 20◦ N (Fig. 1). South of the NEC is the North Equa-torial Counter Current (NECC) flowing in the eastward di-rection counter to the wind (Stramma and Schott, 1999).
Both currents are subjected to the latitudinal migration ofthe Intertropical Convergence Zone (ITCZ) between approx-imately 5◦ S and 12◦ N depending on the season (Bashaet al., 2015). During boreal summer when the ITCZ is atits northernmost position, the SE trade winds intensify alongthe Equator, even penetrating into the Northern Hemisphereand intensifying the surface circulation. Between summerand late fall, the NECC flows along an equatorial bandcentred between 5 and 8◦ N (Longhurst, 1993; Garzoli andKatz, 1983). During the same period an important part ofthe northward-flowing North Brazilian Current (NBC) isretroflected off the South American north-eastern margin to-wards the east into the western tropical North Atlantic af-ter crossing the Equator (approximately at 8◦ N and 50◦W;Philander, 2001), feeding into the NECC (Richardson andWalsh, 1986), and often expanding northward through theshedding of anticyclonic eddies drifting in the NW direc-tion (Schott et al., 1998; Fig. 1). During boreal winter, thesouthward migration of the ITCZ causes the weakening ofthe trade winds along the Equator and the concomitant dis-appearance of the NECC in the western part of the equato-rial region. This results in a generally westward-flowing cir-culation in the equatorial North Atlantic north of the Equa-tor west of 25◦W (Stramma and Schott, 1999). At the sametime, the NBC ceases to retroflect but rather continues to flownorth-westward along the continental slope off the coast ofSouth America (Johns et al., 1998; Lux et al., 2001; Philan-der, 2001). This is the period of maximum northward trans-port of heat across the Equator (Philander, 2001), for whichthe NBC is the main pathway (Goni and Johns, 2001).
The western equatorial North Atlantic where station M4was located is also seasonally influenced by the AmazonRiver, the world’s largest river with respect to freshwater dis-charge into the open ocean (Mann and Lanzier, 2006). FromAugust to December, when the retroflection of the NBC car-ries the river plume eastward in the uppermost ∼ 50 m of thewater column, large amounts of nutrients (Boyle et al., 1977;Sholkovitz et al., 1978; De Master et al., 1986) are entrainedinto the NECC far into the central equatorial North Atlantic(Muller-Karger et al., 1988; Molleri et al., 2010; Ffield, 2005;Fig. 1). From August to October, the Amazon Plume wasobserved to reach speeds of ∼ 90 cms−1 near 45◦W witha gradual slowdown to 30 cms−1 while moving eastward.Near the African continent, a part of it continued into theGuinea Current, while another part moved northward intothe NEC and then westward (e.g. Muller-Karger et al., 1988;Molleri et al., 2010).
The upper water masses in the study area, including themixed layer, consist mostly of the warm, salty, and nutrient-depleted TSW in the upper ∼ 100 m (temperature – T :∼ 27 ◦C, salinity – S: 36.7–37) and the cooler, less salty,and relatively nutrient-enriched South Atlantic Central Water(SACW) at depths down to ∼ 500 m (T : 6.0–18 ◦C, S: 34.3–35.8). Further down to 1200 m of water depth the AntarcticIntermediate Water (AAIW) is characterized by a subsurface
www.biogeosciences.net/14/4577/2017/ Biogeosciences, 14, 4577–4599, 2017

4580 C. V. Guerreiro et al.: Coccolithophore fluxes in the open tropical North Atlantic
Figure 1. Location of the trap mooring sites M4 and M2 and a schematic representation of (a) the main surface currents in the equatorialAtlantic Ocean, with the inset showing the seasonal eastward retroflection of the North Brazilian Current (NBC) during boreal summer(adapted from Mann and Lazier, 2006). (b) The main water masses present in the study area (TWS – tropical surface water; SACW – SouthAtlantic Central Water; AAIW – Antarctic Intermediate Water; NADW – North Atlantic Deep Water) based on water depths reported byEmery and Meincke (1986), Reid (1994), and Stramma and Schott (1999) and on water temperature profiles performed along a transatlanticarray (12◦ N) from 12 January and 2 February 2015 on-board RV Pelagia (cruise PE395; Stuut et al., 2015).
oxygen maximum and a salinity minimum (T : 2–6 ◦C, S:33.8–34.8; Emery and Meincke, 1986; Reid, 1994; Strammaand Schott, 1999). Below the AAIW is the cold NorthAtlantic Deep Water (NADW) flowing southward between1200 and 4000 m (Stramma and Schott, 1999; see Fig. 1b)
3 Material and methods
3.1 Sediment trap sampling
Two sediment traps at sites M2 (14◦ N, 37◦W) and M4(12◦ N, 49◦W) collected sinking particles in synchronous in-tervals of 16 days from 19 October 2012 to 7 November 2013in the central and western equatorial North Atlantic, respec-tively (Fig. 1, Table 1). Details of the mooring equipment, thedeployment and recovery of the sediment traps, and the treat-ment of the recovered sample bottles are described in Stuutet al. (2013).
3.2 Laboratory and microscope analysis
Sediment trap samples from stations M4 and M2 wereinitially wet-sieved over a 1 mm mesh, wet-split into fivealiquot subsamples using a rotary splitter (WSD-10; McLaneLaboratories), washed to remove the HgCl2 and salts, andcentrifuged. Average weight differences between replicatealiquots were within 2.4 % (SD= 2.2), with 87 % of all sam-ples differing < 5 % between splits (detailed procedure inKorte et al., 2017). Micropalaeontological analysis was un-dertaken from one 1/5 split of each original sample after be-ing oxidized in a low-temperature asher for approximately4 h to remove the organic matter and obtain a sample strictlycomposed of mineral particles (Fallet et al., 2009). The coc-colith export fluxes and species composition were assessedfollowing the methods described in Andruleit (1996). De-pending on the particle content of the samples, a split ofusually 1/2000 of the original sample was filtered onto poly-carbonate membrane filters (47 mm diameter, 0.45 µm poresize). The only exception was the material-loaded sampleM4-24 for which a split of 1/16000 was necessary. Oncedried, a segment of each filter was cut and mounted on
Biogeosciences, 14, 4577–4599, 2017 www.biogeosciences.net/14/4577/2017/

C. V. Guerreiro et al.: Coccolithophore fluxes in the open tropical North Atlantic 4581
Table 1. Background information regarding the DUSTTRAFFIC sediment trap moorings (M4 and M2) used in this study.
Mooring station M4 M2
Position 12◦ N 49◦W 14◦ N 37◦WTrap depth (m) 1130 1235Bottom depth (m) 4670 4790Sampling period 19 Oct 2012–7 Nov 2013 19 Oct 2012–7 Nov 2013Number of studied samples 23 23Sampling resolution (days) 16 16
a scanning electron microscope (SEM) stub. A minimum of500 coccoliths was then counted from an arbitrarily chosentransect and each coccolith was identified to the lowest tax-onomic level possible at 3000×magnification using a ZeissDSM 940A SEM at 10 kV of accelerating voltage.
The taxonomic identification of coccolithophore speciesfollowed Jordan et al. (2004) and Young et al. (2011). Coc-colith species counts were converted into coccolith exportfluxes (i.e. coccoliths m−2 d−1) by extrapolating to the entireeffective filter area and to the original sample and dividingby the sample interval and the trap aperture area. Finally, theShannon–Weaver diversity index H ′ (e.g. Tuomisto, 2013)was determined to assess the coccolithophore species diver-sity at each location.
Shallowing or deepening of the nutricline was inferredfrom the ratio between upper photic zone (UPZ) speciesand lower photic zone (LPZ) species, with larger ratios (i.e.higher abundance of UPZ taxa) indicating shallower depthsof the nutricline. The ratio was calculated as the sum of thefluxes of Gephyrocapsa muellerae, G. oceanica, and Emilia-nia huxleyi divided by the sum of the fluxes of Florisphaeraprofunda and Gladiolithus flabellatus (e.g. Molfino andMcIntyre, 1990; Beaufort et al., 1997; Stoll et al., 2007). Inspite of also being considered an LPZ species, Reticulofenes-tra sessilis was not included in the equation due to its muchlower export fluxes and different seasonality compared to thelatter two species.
3.3 Oceanographic and meteorological data
Time series of hydrological (sea surface temperature – SST,salinity – SSS, and Chl a concentrations) and meteorolog-ical parameters obtained from satellite data (i.e. daily pre-cipitation rates, photosynthetically available radiance (PAR),wind speed) were used as a complementary framework forinterpreting the influence of environmental variability on thecoccolithophore export fluxes (Table 2). The aerosol opticaldepth (AOD) was used as a measure of aerosols distributedwithin a column of air from the top of the atmosphere tothe surface of the Earth. Based on Lelli et al. (2014), spatio-temporal variations in AOD during the sampling period wereinterpreted as an indicator of the atmospheric aerosols orig-inating from the African deserts. The percentage of cloudcover was estimated from MODIS data as the percentage of
pixels in the image flagged (L2-flags) with “probable cloudor ice contamination”. For each trap location, satellite datawere retrieved considering a 2◦× 2◦ latitude–longitude areacentred around the trap location and averaged for each 16-day interval of the sediment trap sampling period. The 2◦×2◦
box, corresponding to ∼ 119× 119 Nmi (1◦ =∼ 59 Nmi),was assumed to be representative of the catchment area ofa trap deployed at 1200 m of depth, taking into account thesinking speed for marine phytoplankton and algal aggregates(e.g. Waniek et al., 2000) and based on temperature–pressuremeasurements; this indicates that M2 and M4 were equallyand effectively vertical during the deployment period (Korteet al., 2017). Data were downloaded from various sources aslisted in the Supplement and processed for the study period2012–2013, as shown in Fig. 2.
3.4 Statistical multivariate analysis
The relationship between the coccolithophore taxa and theenvironmental conditions during the monitored period wasinvestigated on the basis of a statistical multivariate analysis(r-mode factor analysis; Statistica 13) performed upon a datamatrix of 46 samples (i.e. cases) and 17 variables (columns).The factor analysis considered only the percentages of the10 most common species or taxonomic groups (i.e. > 2 %of the annual mean assemblage in at least one of the stations)and the hydrological and meteorological parameters obtainedfrom satellite data (SST, SSS, Chl a, PAR, precipitation rate,AOD, and wind speed). Results from the original data matri-ces were optimized through a varimax raw rotation and theobtained factor scores were plotted against time to assess thetemporal variability of the factors at both mooring locations.
4 Results
4.1 Oceanographic and meteorological conditionsduring the sampling period
The seasonal development of sea surface conditions did notdiffer drastically between the two mooring stations duringthe monitored period, despite considerable differences in therange of values of salinity and Chl a concentrations (Fig. 2).SST tended to be lower from late winter to early summer
www.biogeosciences.net/14/4577/2017/ Biogeosciences, 14, 4577–4599, 2017

4582 C. V. Guerreiro et al.: Coccolithophore fluxes in the open tropical North Atlantic
Figure 2. Time series of relevant atmospheric and oceanographic parameters during the monitored time interval determined from remotesensing; (a, b) sea surface temperature (SST), sea surface salinity (SSS) and Chl a concentrations, (c, d) photosynthetic available radiance(PAR), precipitation rate and wind speed, and (e, f) aerosol optical depth (AOD) and cloud cover percentage (for data sources and processing,see the Supplement and Sect. 3.3). Dark and light grey bands refer to fall and summer, respectively.
and higher during late summer and fall in both areas, al-though it was generally higher at station M4 (26.2–29.2 ◦C)than at M2 (24.3–28.2 ◦C). SST minima were recorded in lateMarch and April 2013 at station M4 and in late March andlate May of the same year at station M2. Differences were,however, encountered in terms of the range and seasonal pat-terns of SSS. Whereas station M2 revealed little variability insurface salinity (35.5–36.3), station M4 experienced a sharpand quite distinct decrease during the fall months, particu-larly in October–November 2013 (33.9–36.5). Surface Chl a
concentrations were generally low during most of the yearat both stations (∼ 0.1 µgL−1) but distinctively increased inOctober–November 2013 at station M4 (up to 1.13 µgL−1)(Fig. 2a, b).
Atmospheric conditions were similar at both locations.Despite the narrow range of PAR values observed at bothstations, a clear seasonality is evidenced from slightlyhigher PAR during spring and summer (up to 65.615 Ein-stein m−2 d−1 in April 2013) towards slightly lower PAR dur-ing fall and winter (down to 65.588 Einstein m−2 d−1 in De-cember 2012) at both stations (Fig. 2c and d). Precipitation
rates were higher during summer and fall, up to 10 mmd−1
in early November 2012 at M2 and up to 9 mmd−1 inSeptember–October 2013 at M4. Both stations received lit-tle to no precipitation during the winter and spring months(Fig. 2c and d). Winds were stronger albeit variable dur-ing winter and spring and then dropped during the sum-mer months to gradually increase again during the follow-ing fall. Slightly stronger winds prevailed during winter andspring at M4 (up to 10 ms−1 in December 2013, April, andJune 2013) and during spring, summer, and fall at M2 (up to9.5 ms−1 in May–June and October–November 2013; Fig. 2cand d). AOD had a similar month-to-month variation at bothlocations, generally increasing during the spring–summertransition but reaching higher values at station M2, partic-ularly in May–June 2013 (up to ∼ 0.85), compared to M4(only 0.35; Fig. 2e and f). Cloud cover percentage was fairlyvariable during the sampling period, generally higher at sta-tion M2 with a tendency to increase during spring and sum-mer. Clouds and AOD appear weakly covariant (ascending)during winter and spring, whereas during summer and fallthe discrepancy between the two parameters increases, point-
Biogeosciences, 14, 4577–4599, 2017 www.biogeosciences.net/14/4577/2017/
C. V. Guerreiro et al.: Coccolithophore fluxes in the open tropical North Atlantic 4583
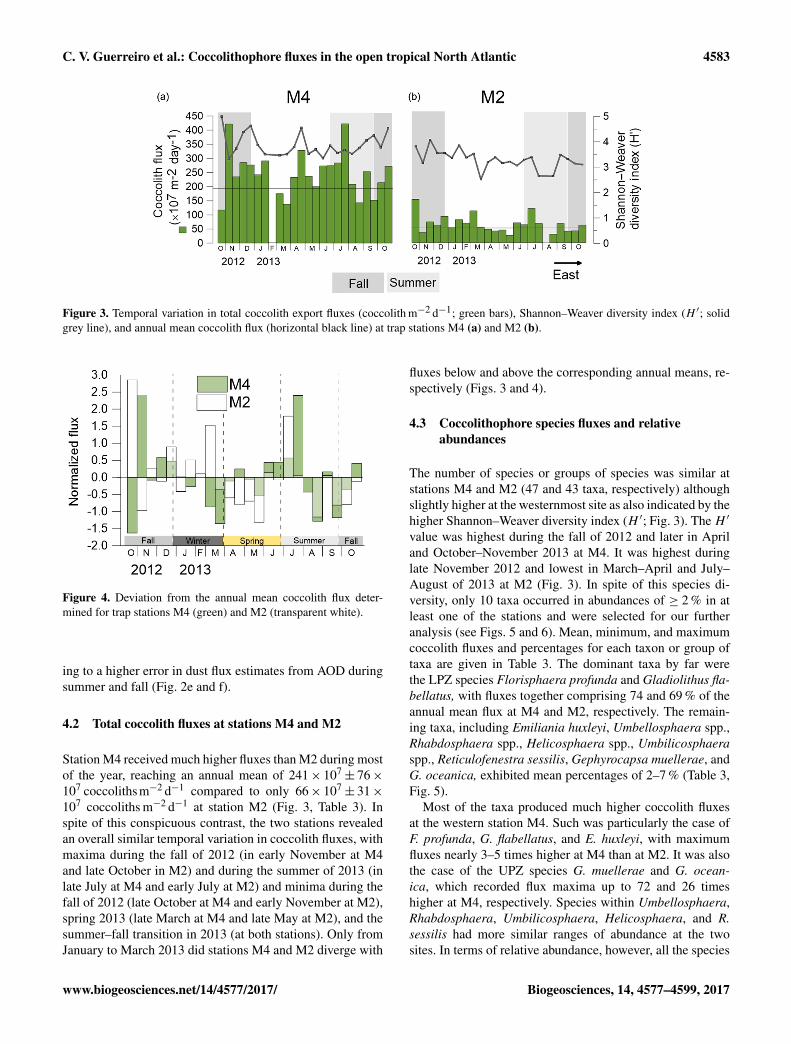
Figure 3. Temporal variation in total coccolith export fluxes (coccolith m−2 d−1; green bars), Shannon–Weaver diversity index (H ′; solidgrey line), and annual mean coccolith flux (horizontal black line) at trap stations M4 (a) and M2 (b).
Figure 4. Deviation from the annual mean coccolith flux deter-mined for trap stations M4 (green) and M2 (transparent white).
ing to a higher error in dust flux estimates from AOD duringsummer and fall (Fig. 2e and f).
4.2 Total coccolith fluxes at stations M4 and M2
Station M4 received much higher fluxes than M2 during mostof the year, reaching an annual mean of 241× 107
± 76×107 coccolithsm−2 d−1 compared to only 66× 107
± 31×107 coccoliths m−2 d−1 at station M2 (Fig. 3, Table 3). Inspite of this conspicuous contrast, the two stations revealedan overall similar temporal variation in coccolith fluxes, withmaxima during the fall of 2012 (in early November at M4and late October in M2) and during the summer of 2013 (inlate July at M4 and early July at M2) and minima during thefall of 2012 (late October at M4 and early November at M2),spring 2013 (late March at M4 and late May at M2), and thesummer–fall transition in 2013 (at both stations). Only fromJanuary to March 2013 did stations M4 and M2 diverge with
fluxes below and above the corresponding annual means, re-spectively (Figs. 3 and 4).
4.3 Coccolithophore species fluxes and relativeabundances
The number of species or groups of species was similar atstations M4 and M2 (47 and 43 taxa, respectively) althoughslightly higher at the westernmost site as also indicated by thehigher Shannon–Weaver diversity index (H ′; Fig. 3). The H ′
value was highest during the fall of 2012 and later in Apriland October–November 2013 at M4. It was highest duringlate November 2012 and lowest in March–April and July–August of 2013 at M2 (Fig. 3). In spite of this species di-versity, only 10 taxa occurred in abundances of ≥ 2 % in atleast one of the stations and were selected for our furtheranalysis (see Figs. 5 and 6). Mean, minimum, and maximumcoccolith fluxes and percentages for each taxon or group oftaxa are given in Table 3. The dominant taxa by far werethe LPZ species Florisphaera profunda and Gladiolithus fla-bellatus, with fluxes together comprising 74 and 69 % of theannual mean flux at M4 and M2, respectively. The remain-ing taxa, including Emiliania huxleyi, Umbellosphaera spp.,Rhabdosphaera spp., Helicosphaera spp., Umbilicosphaeraspp., Reticulofenestra sessilis, Gephyrocapsa muellerae, andG. oceanica, exhibited mean percentages of 2–7 % (Table 3,Fig. 5).
Most of the taxa produced much higher coccolith fluxesat the western station M4. Such was particularly the case ofF. profunda, G. flabellatus, and E. huxleyi, with maximumfluxes nearly 3–5 times higher at M4 than at M2. It was alsothe case of the UPZ species G. muellerae and G. ocean-ica, which recorded flux maxima up to 72 and 26 timeshigher at M4, respectively. Species within Umbellosphaera,Rhabdosphaera, Umbilicosphaera, Helicosphaera, and R.sessilis had more similar ranges of abundance at the twosites. In terms of relative abundance, however, all the species
www.biogeosciences.net/14/4577/2017/ Biogeosciences, 14, 4577–4599, 2017

4584 C. V. Guerreiro et al.: Coccolithophore fluxes in the open tropical North Atlantic
Figure 5. Percentage of the most abundant coccolithophore taxa (> 2 %) at stations M4 and M2.
recorded higher percentages at station M2 compared to M4,with the exception of G. flabellatus, E. huxleyi, and specieswithin Gephyrocapsa spp.
4.3.1 Site M4
Coccoliths produced by F. profunda (29–56 %) were highin November 2012 and late July 2013, with lower fluxesin October 2012, late March, late August, and late Septem-ber 2013. In terms of relative abundances, F. profunda wasmost common in early November 2012 and least commonin late April 2013 (Fig. 6a). A similar seasonal pattern wasshown by G. flabellatus (18–47 %) but with a less abrupt de-crease in the transition to spring compared to F. profunda.Lower fluxes of G. flabellatus occurred in October 2012,March, and October–November 2013, whereas its relativeabundances generally followed the same seasonal patternof the fluxes (Fig. 6b). Seasonality in Umbellosphaera spp.(2–8 %) and R. sessilis (0.2–2 %) was somewhat similar tothat of G. flabellatus. Maximum fluxes of Umbellosphaeraspp. occurred in December 2012 and September 2013, andlower fluxes occurred from late winter to early spring, withhigher percentages in October and December 2012 and laterin September 2013 (Fig. 6d). Flux maxima of R. sessilis oc-curred in late December 2012 and late July and early Octo-ber 2013, and flux minima occurred in October 2012, lateMarch, late April, and late May 2012 (Fig. 6h).
Rhabdosphaera spp. (0–3 %) and Umbilicosphaera spp.(1–3 %) revealed similar seasonal patterns, with the high-est fluxes recorded during spring and summer and max-ima in late July 2013 and later in April and June 2013(Fig. 6e and g). In the case of Umbilicosphaera spp.,flux increases were also noticed in early December 2012and November 2013. The lowest fluxes of both taxa wererecorded from January to March 2013. The seasonal pat-tern of their relative abundance generally followed that of thecoccolith export fluxes. In spite of some similarity with thelatter taxa, Helicosphaera spp. (0.1–2 %) was clearly moreabundant in late April and late July, with the lowest fluxesfrom late summer to late winter (Fig. 6f), whereas E. huxleyi
(0.1–2 %) showed two distinct and very sharp peaks in lateApril 2013 and in October–November 2013 (Fig. 6c).
Gephyrocapsa muellerae (0–25 %) occurred in persis-tently low fluxes and percentages throughout the year butremarkably increased in January 2013 (Fig. 6i). Season-ality in G. oceanica (0.1–9 %) was somewhat in betweenG. muellerae and E. huxleyi, but it was slightly more abun-dant from December 2012 until April 2013 and strikinglyincreased in October–November 2013 (Fig. 6j).
4.3.2 Site M2
In comparison to the western site where different species re-vealed distinct seasonal variations, at the more central siteM2 most of the taxa revealed a very similar seasonality,with the highest fluxes in late October 2012 and early July2013 and lower fluxes in early November 2012, late May,and August 2013 (Fig. 6) The exceptions were G. flabella-tus (Fig. 6b), which was the only one of the most abundantspecies without a flux increase in early March 2013, and He-licosphaera spp. (Fig. 6f), which were clearly more abundantfrom late winter to early summer 2013.
F. profunda (53–72 %) stood out for being much morecommon at site M2 compared to M4 (Fig. 6a), and specieswithin Umbellosphaera spp. (4–10 %), H. carteri (1–9 %),Rhabdosphaera spp. (1–5 %), Umbilicosphaera spp. (1–5 %), and R. sessilis (1–4 %) were also generally more com-mon in this area than at M4 (Fig. 6d–h). By contrast, G. fla-bellatus (4–16 %), E. huxleyi (3–13 %), G. oceanica (0–2 %),and G. muellerae (0–1 %) revealed much lower fluxes andpercentages as well as comparatively low month-to-monthvariation in fluxes compared to M4 (Fig. 6b, c, i, and j).
4.4 Coccolithophore variability from multivariatefactor analysis
Four factors were extracted from the multivariate factor anal-ysis, together explaining 63 % of the total variability withinthe data (Fig. 7, Table 3). Factor 1 (F1, explaining 30 % of thetotal variance) is represented by F. profunda, R. sessilis, Um-bellosphaera spp., Helicosphaera spp., and Rhabdosphaera
Biogeosciences, 14, 4577–4599, 2017 www.biogeosciences.net/14/4577/2017/

C. V. Guerreiro et al.: Coccolithophore fluxes in the open tropical North Atlantic 4585
Figure 6. Coccolith export fluxes and relative abundance of the most important species at stations M4 and M2: (a) F. profunda, (b) G. flabel-latus, (c) E. huxleyi, (d) Umbellosphaera spp., (e) Rhabdosphaera spp., (f) Helicosphaera spp., (g) Umbilicosphaera spp., (h) R. sessilis, (i)G. muellerae, and (j) G. oceanica. Dark and light grey bars indicate boreal fall and summer, respectively. Numbers 7, 12, and 24 indicate thesample reference for the time intervals during which G. muellerae, E. huxleyi, and G. oceanica produced “pulse-like” maxima at station M4(i.e. late January, middle April, and late October to early November 2013, respectively), whereas number 9 indicates the sample referencefor the time interval during which enhanced fluxes of E. huxleyi occurred at station M2 (i.e. early March 2013).
spp. in opposition to G. flabellatus and SST. Whereas bothgroups of variables do not show a clear seasonal patternthroughout the study period, they indicate contrasting eco-logical conditions between M2 and M4. The first group wasclearly more associated with station M2 during the entire
year, particularly during spring (most negative score in lateMarch 2013), whereas the second group was persistentlymore associated with station M4 (most positive scores inNovember 2012 and later from May to September 2013).
www.biogeosciences.net/14/4577/2017/ Biogeosciences, 14, 4577–4599, 2017

4586 C. V. Guerreiro et al.: Coccolithophore fluxes in the open tropical North Atlantic
Table 2. Annual mean and range of coccolith fluxes and relative abundances of the most abundant coccolithophore taxa (mean > 2 %) formooring stations M4 (left) and M2 (right). Loadings marked in bold refer to the strongest significant correlations (r ≥ 0.4).
Taxa Coccolith fluxes (coccoliths m−2 d−1× 10⁷) Relative abundances (%)
M4 M2 M4 M2
Mean Min–Max Mean Min–Max Mean Min–Max Mean Min–Max
Total fluxes 247 117–423 66 25–153
UPZ TAXAG. oceanica 4 0.2–26 0.3 0–1 2 0.1–9 0,4 0–2E. huxleyi 17 4–69 4 1–14 7 3–21 5 3–13G. muellerae 7 0–72 0.2 0–1 3 0–25 0.3 0–1Helicosphaera spp. 2 0.1–6 2 1–4 1 0.1–2 3 1–9Rhabdos. spp. 4 0–11 2 0.3–5 1 0–3 2 1–5Umbellos. spp. 9 3–16 5 1–11 4 2–8 7 4–10Umbilico. spp. 4 2–9 1 0.3–3 2 1–3 2 1–3
LPZ TAXAR. sessilis 2 1–5 2 0.4–3 1 0.2–2 3 1–4F. profunda 97 51–235 39 14–90 39 29–56 60 53–72G. flabellatus 85 36–146 6 2–24 35 18–47 9 4–16
Factor 2 (F2 – 16 %) is represented by precipitation, SST,and Chl a in opposition to SSS, AOD, PAR, and to a lesserextent, wind and Helicosphaera spp. The two groups of vari-ables showed a similar seasonal pattern at both stations, withprecipitation, SST, and Chl a displaying a stronger nega-tive signal during the fall months, particularly at M4 (mostnegative score in October 2013). The second group wasmost strongly correlated during spring and early summer atboth stations (most positive scores in late May and earlyJune 2013; Fig. 7, Table 3).
Factor 3 (F3, 10 %) is represented by G. muellerae and toa lesser extent G. oceanica, in opposition to Rhabdosphaeraspp., Umbilicosphaera spp., PAR, and to a lesser extent, Um-bellosphaera spp. The latter group revealed little statisticalsignificance throughout the year at either location (i.e. scoresclose to zero) except in January 2013 when G. muelleraerecorded high negative scores at station M4 (Fig. 7, Table 3).
Factor 4 (F4, 8 %) reflects F. profunda in opposition toE. huxleyi, G. oceanica, and to a lesser extent, wind speed.F4 reveals a weak signal at both locations during most of theyear, except in April and October 2013 when two sharp pos-itive peaks at station M4 reflected the short-term and sharpincreases in E. huxleyi and G. oceanica. Relatively minor butstill significant positive peaks occurred in January at M4 andin March at M2. Negative peaks were recorded in Novem-ber 2012 at both stations, later in early May at M4, and inlate August 2013 at both stations, reflecting the higher pres-ence of F. profunda during these periods (Fig. 7, Table 3).
5 Discussion
5.1 Similar temporal variations in the tropical flora inthe western and central equatorial North Atlantic
Comparable seasonal patterns in total coccolith fluxes ob-served at stations M4 and M2 point to similar environmentalbackground conditions during the sampling period at bothsites (Figs. 3 and 4). This is better expressed in Factor 2(explaining 16 % of the variance), showing that the overallatmospheric and oceanographic conditions did not vary con-siderably between the two locations (Fig. 7). In the tropicalNorth Atlantic, meteorological conditions are mostly con-trolled by seasonal variations in the trade winds and the In-tertropical Convergence Zone (ITCZ), the latter being a zoneof low pressure and increased cloudiness and precipitationnear the Equator (e.g. Oschlies and Garçon, 1998). The ITCZmigrates in latitude during summer and winter months inthe Northern Hemisphere, shifting on average between 5◦ Sduring January and 12◦ N during July (e.g. Basha et al.,2015; see Fig. 8). Maxima in coccolith flux in October–November 2012 and July 2013 (Figs. 3 and 4) appear to haveoccurred under the direct influence of the ITCZ. This wasespecially the case in the fall months, as revealed by the pre-vailing high precipitation rates, weaker winds, and low PARconditions during this period (Figs. 2c, d and 7; F2 negativescores). Whereas persistently high SSTs can be interpretedas an indicator of the generally stratified conditions typicalof tropical open-ocean regions (e.g. Mann and Lazier, 2006;Haidar and Thierstein, 2001), the highest temperature valuesduring the fall of 2012 and from mid-summer to the fall of2013 suggest that stratification was the strongest under theinfluence of the ITCZ, probably reflecting the weakening of
Biogeosciences, 14, 4577–4599, 2017 www.biogeosciences.net/14/4577/2017/

C. V. Guerreiro et al.: Coccolithophore fluxes in the open tropical North Atlantic 4587
Figure 7. Spatio-temporal variation in the scores obtained from factor analysis. For taxonomical references, see Table 3.
the winds during these periods. The highest coccolith fluxesrecorded under these conditions suggest that higher stabilityof the photic layer favoured the development and/or the set-tling of coccolithophores during these periods. In contrast,minima in coccolith flux during the winter–spring period oc-curred when the ITCZ was displaced further south of thestudy area, and hence surface circulation was mostly influ-enced by the NE trade winds and by the westward-flowingNEC (see Sect. 2). This appears to be reflected in the pos-itive correlation between wind strength and high PAR (F2positive scores) and the negative correlation between windand precipitation (Fig. 7). SST minima and the intensifica-tion of the wind during winter and spring suggest that deep-ening of the mixed layer due to winter cooling combined withsome wind-forced vertical mixing (Fig. 2a, b, e, and f) couldhave resulted in some nutrient entrainment from below (seeSect. 5.2.2). The lowest coccolith fluxes under these condi-tions seem to indicate that enhanced wind-forced mixing wasless favourable to the productivity and/or downward transferof coccoliths compared to the more stable conditions in thefall and summer.
Comparable seasonal developments in total coccolith ex-port fluxes at stations M2 and M4 were also reflected inthe species composition. A predominantly tropical assem-blage was found throughout the investigated period in bothareas (Figs. 5 and 6), in general agreement with previousstudies from nearby tropical and subtropical areas (Kinkelet al., 2000; Haidar and Thierstein, 2001; Winter et al.,2002; Boeckel and Baumann, 2008; Poulton et al., 2017).It included species considered well adapted to the high-nutrient and low-light conditions prevailing in the LPZ, suchas F. profunda, G. flabellatus, and R. sessilis (e.g. Okada
and Honjo, 1973; Young, 1994; Haidar and Thierstein, 2001;Winter et al., 2002), and taxa that are more often found in thenutrient-depleted and well-illuminated UPZ, such as Umbel-losphaera spp., Rhabdosphaera spp., and Umbilicosphaeraspp. (e.g. Winter et al., 1994, 2002; Young, 1994; Haidarand Thierstein, 2001). The presence of taxa with a higheraffinity for mesotrophic conditions, such as Helicosphaeraspp. (Haidar and Thierstein, 2001; Boeckel et al., 2006;Ziveri et al., 2004), and species with affinity with moreturbulent and eutrophic environments, such as E. huxleyi,G. muellerae, and G. oceanica (e.g. Winter et al., 1994, 2002;Kinkel et al., 2000; Guerreiro et al., 2013), point to occasion-ally enhanced environmental variability promoting nutrientinput, as discussed in Sect. 5.2.2.
In terms of seasonal patterns, however, little is knownabout the living coccolithophore communities thriving in thetropical Atlantic. In the subtropical Atlantic near Bermuda,2200 km further north, seasonal variability appears more pro-nounced with the highest standing stocks from winter tospring and the lowest during summer (Haidar and Thierstein,2001). This is opposite to our observations in the tropicalAtlantic showing coccolith flux maxima during fall and sum-mer (Figs. 3 and 4). Species relative proportions are differ-ent as well; whereas the subtropical Bermuda living coc-colithophore community was largely dominated by the fast-blooming E. huxleyi, the settling coccolith assemblages atstations M4 and M2 were persistently dominated by the LPZspecies F. profunda and G. flabellatus (Fig. 5). The differencebetween the two areas appears to reflect the much strongerwinter cooling, vertical mixing, nutrient entrainment, andsummer stratification in the subtropical Atlantic off Bermudacompared to the more oligotrophic and persistently strati-
www.biogeosciences.net/14/4577/2017/ Biogeosciences, 14, 4577–4599, 2017

4588 C. V. Guerreiro et al.: Coccolithophore fluxes in the open tropical North Atlantic
Figure 8. Climatological seasonal means of wind (speed and direction; reference vector length: 3 ms−1) and precipitation rates (colourshading; mm/day) over the central-western equatorial Atlantic Ocean for boreal (a) winter (December–February), (b) spring (March–May),(c) summer (June–August), and (d) autumn (September–November) illustrating the seasonal latitudinal migrations of the Intertropical Con-vergence Zone (ITCZ). Wind data (years: 1988–2015) were obtained from the CCMP Ocean Surface Wind Vector Analyses (Atlas et al.,2011) and precipitation data (years: 1979–2015) from the CPC Merged Analysis of Precipitation (CMAP; Xie and Arkin, 1997). Red andblack stars refer to the location of sites M4 and M2, respectively.
fied conditions in the tropical Atlantic (Molfino and McIn-tyre, 1990; Haidar and Thierstein, 2001; Mann and Lazier,2006 and references therein). Nevertheless, higher coccol-ith and coccosphere concentrations of F. profunda (∼ 30–100 liths per sphere; Okada and Honjo, 1973) and possiblyalso G. flabellatus compared to E. huxleyi (∼ 9–50 liths persphere; Cros and Fortuno, 2002) could result in overestima-tion of their abundance in the traps. This means that the dom-inance of the LPZ flora in the settling coccolith assemblagesfrom the equatorial North Atlantic may not necessarily reflectoverwhelmingly higher productivity compared to E. huxleyibut simply a high production rate combined with higher set-tling of coccoliths per cell.
That F. profunda and G. flabellatus revealed similar sea-sonal patterns and the highest abundances during strong strat-ification conditions in fall and summer, which is consistentwith observations from the open subtropical North Atlantic(Haidar and Thierstein, 2001; Broerse et al., 2000; Fig. 6aand b). The increase in both fluxes and percentages duringfall at both stations appears to reflect their better adaptation tohigh stratification conditions and lower light intensities com-
pared to other species. Conversely, the increase in severalUPZ tropical species within Umbellosphaera spp., Rhab-dosphaera spp., Helicosphaera spp., and Umbilicosphaeraspp. during summer appears to be related to slightly higherPAR levels during this period (Figs. 2c, d and 7). The gen-eral affinity of Umbellosphaera spp., Rhabdosphaera spp.,and Umbilicosphaera spp. for stratified and well-illuminatedconditions was also evidenced by their higher percentagesand positive correlation with PAR from late spring to earlyfall at both stations (F3; Fig. 7). This is also consistent withprevious studies from other tropical and subtropical areasin the North Atlantic (Haidar and Thierstein, 2001; Kinkelet al., 2000; Winter et al., 2002; Poulton et al., 2017).
5.2 Spatial variations in coccolith fluxes: western vs.central equatorial North Atlantic
In spite of similar seasonal developments in both coccolithfluxes and species composition, stations M2 and M4 revealedstriking differences in export fluxes by most species, pointingto the influence of environmental factors that are specific to
Biogeosciences, 14, 4577–4599, 2017 www.biogeosciences.net/14/4577/2017/

C. V. Guerreiro et al.: Coccolithophore fluxes in the open tropical North Atlantic 4589
Table 3. Factor loadings (varimax raw), eigenvalues, and percent-age of the explained variance extracted from the data matrices refer-ring to the period from October 2012 to October–November 2013at stations M4 and M2 (r-mode factor analysis by Statistica 13;marked loadings are > 0.4). Chl a – surface phytoplankton biomass,SST and SSS – sea surface temperature and salinity, PAR – photo-synthetic available radiance, AOD – aerosol optical depth, Prec –daily precipitation rate, and Wind – wind speed. In Factor 3, num-bers 7 and 12 indicate the sample reference for the time intervalsduring which G. muellerae and E. huxleyi produced “pulse-like”maxima at station M4 (i.e. late January and middle April 2013, re-spectively; see Fig. 6i and c), whereas in Factor 4, number 24 in-dicates the sample reference for the time interval during which thepulse-like maxima of sea surface Chl a and G. oceanica, togetherwith a sharp increase in E. huxleyi, occurred at station M4 (i.e. lateOctober to early November 2013; see Fig. 6c and j). In Factor 2,numbers 23 and 24 indicate the time intervals during which SSSminima were recorded during fall at the same site (see Fig. 2).
F1 F2 F3 F4
F. profunda (Fp) −0.8 0.2 0.1 −0.4G. flabellatus (Gf) 0.9 −0.2 0 0E. huxleyi (Eh) 0.2 0.1 0.2 0.8Umbellosphaera spp. (Umbel) −0.7 −0.2 0.4 −0.1Rhabdosphaera spp. (Rhab) −0.5 0 0.6 0.2Helicosphaera spp. (Heli) −0.6 0.4 0.2 0Umbilicosphaera spp. (Umbil) −0.3 0.1 0.5 0.2R. sessilis (Rses) −0.8 0 0.1 −0.2G. muellerae (Gm) 0.2 0.1 −0.8 0.1G. oceanica (Go) 0.2 −0.2 −0.4 0.6Chl a 0 −0.5 0 0.2SST 0.5 −0.7 0.1 −0.1PAR 0.2 0.5 0.5 0.1AOD −0.2 0.6 0.2 0SSS −0.1 0.8 0.2 −0.1Prec 0.1 −0.8 0.2 0Wind 0 0.4 −0.3 0.4Eigenvalues 3.8 3.2 2.1 1.6Expl. Var. (%) 30 16 10 8
each location. Below we highlight the main differences be-tween the two areas and discuss the factors that potentiallytrigger them.
5.2.1 Higher productivity and/or transfer efficiency ofthe LPZ flora at the western site M4
Fluxes recorded at station M4 were high not only in com-parison to station M2, but also to several other locationsin the Atlantic Ocean, including open-ocean temperate andsubtropical settings (e.g. Knappertsbusch and Brummer,1995; Broerse et al., 2000; Sprengel et al., 2002), areas inthe vicinity of islands (Sprengel et al., 2002), and moremarginal regions, even when under the influence of coastalupwelling (Beaufort and Heussner, 1999; Köbrich and Bau-mann, 2009). Furthermore, most of these flux studies referredto the opportunistic E. huxleyi as being the dominant species,while the unexpectedly high total coccolith fluxes we found
in the presumably oligotrophic western equatorial North At-lantic were mostly due to the LPZ dwellers F. profunda andG. flabellatus. Mean fluxes of G. flabellatus, in particular,were almost 14 times higher at M4 than at M2 (Fig. 6b, Ta-ble 2) and contributed importantly to Factor 1, explainingthe highest percentage of the variability within the taxa andenvironmental parameters (i.e. 30 %) compared to the otherfactors (16, 10, and 9 % for F2, F3, and F4, respectively;Fig. 7). That F1 is clearly characterized by the oppositionbetween the central station M2 and the western station M4highlights the much higher abundances of G. flabellatus fur-ther west as the most important feature or difference betweenthe two sites and indicates the presence of spatial variabil-ity shown by the LPZ flora as the statistically more relevantfactor explaining our flux records. This finding is consistentwith what it is known about the well-constrained enhance-ment of this species in surface sediments from the westernequatorial Atlantic and Brazilian continental margin (Kinkelet al., 2000; Boeckel et al., 2006). That Umbellosphaera spp.,Rhabdosphaera spp., Umbilicosphaera spp., E. huxleyi, andgephyrocapsids also produced higher coccolith fluxes in thisarea points to enhanced productivity throughout the entirephotic zone at M4.
The persistent and overwhelming dominance of the LPZflora suggests profiting from some subsurface and year-roundnutrient supply. Forced by the trade winds, the westwarddeepening of the equatorial mixed layer and associated nu-tricline (see Hastenrath and Merle, 1987; Longhurst, 1993;Philander, 2001) could have promoted higher production ofthe LPZ flora in the western equatorial Atlantic (Fig. 10).In situ CTD and nutrient measurements at both stations doindicate a consistently deeper nutricline at M4, particularlyduring spring when the deep chlorophyll maximum (DCM)was found deeper at station M4 compared to station M2 (datanot shown; Roepert and Brummer in Stuut et al., 2016).
In addition to the westward tilting of the nutricline,changes in the depth range of the Antarctic IntermediateWater (AAIW) flowing in from the south-west (Reid, 1994)may have also contributed to the enhanced fluxes of the LPZflora further west (see http://whp-atlas.ucsd.edu and Fig. 10).Originating from the surface region of the Antarctic circum-polar layer, this water mass is known to follow the SouthAtlantic subtropical gyre to enter the western equatorial At-lantic (Stramma et al., 2003; Stramma and England, 1999).It crosses the Equator and spreads along the Brazilian shelf(Talley, 1996), contributing high nutrients and low oxygento the Gulf Stream and North Atlantic Current (Reid, 1994).Furthermore, Poulton et al. (2017) have recently reported thatF. profunda and Gladiolithus spp. thrive below the depth atwhich light is thought to be sufficient to support photosynthe-sis in equatorial waters, probably by mechanisms of mixotro-phy and/or phagotrophy. This means that these two speciesmay be able to live even deeper in the water column thanoriginally thought.
www.biogeosciences.net/14/4577/2017/ Biogeosciences, 14, 4577–4599, 2017

4590 C. V. Guerreiro et al.: Coccolithophore fluxes in the open tropical North Atlantic
Higher fluxes at station M4 may also be related to thehigher production of faecal pellets by zooplankton grazersacting as vehicles for the downward flux of coccolithophoresin this area. Recent observations by Knebel (2016) reporthigher fluxes of spinose planktonic foraminifera at stationM4 compared to M2. Knappertsbusch and Brummer (1995)argued earlier that the export of coccolithophores is inti-mately related to day-to-day fluctuations in faecal pellet pro-duction by migrating zooplankton and nekton in the overly-ing mesopelagic zone. Therefore, higher zooplankton graz-ing in the western equatorial North Atlantic may have in-creased the coccoliths’ transfer efficiency, hence contributingto the much higher coccolith fluxes compared to the centralequatorial North Atlantic (Fig. 10).
5.2.2 Transient productivity of the r-selected UPZ floraat the western site M4
Spatial environmental variability in the equatorial North At-lantic is most clearly expressed by the much higher fluxesand the pulsed maxima of the more opportunistic speciesE. huxleyi, G. muellerae, and G. oceanica at station M4 com-pared to their persistently low abundances and weak season-ality at station M2 (Figs. 6c, i, j, and 5). Their occurrence inthe form of short-term high-flux events in January, April, andOctober–November 2013 at station M4 was associated withstrikingly increasing ratios between these species and theLPZ flora (Fig. 9). Stoll et al. (2007) have used similar ratiosas indicators of upwelling in the Bay of Bengal based on theidea that the decrease in the LPZ flora reflects the shallow-ing of the nutricline (Molfino and McIntyre, 1990; Beaufortet al., 1997). The sporadic sharp increase in the UPZ/LPZratio at station M4 hence suggests that the nutricline was tem-porarily shallower, resulting in a fast production response ofthe more opportunistic placolith-bearing species to increasednutrient input. Higher fluxes of these UPZ taxa at station M4support the argument that the equatorial North Atlantic be-comes generally more productive further west.
Influence of wind-forced water mixing and dispersal ofthe Amazon River Plume
The pronounced maximum of G. muellerae in January 2013(samples M4-6 and M4-7; Figs. 6i and 9a) was strong enoughto be reflected in Factor 3, explaining 10 % of the variance(Fig. 7). This event occurred when the wind had just startedto intensify and PAR was gradually increasing, as expectedfrom the fall–winter transition in the equatorial North At-lantic (Fig. 2). This probably resulted in some degree of ver-tical mixing, as suggested by the decrease in SST, whichin turn may have led to the supply of nutrients from belowthe pycnocline to shallower levels in the photic zone (seeSect. 5.1). The lack of a significant response by E. huxleyiand G. oceanica during this period suggests that nutrientavailability was lower and/or not persistent enough for these
species to bloom. Previous studies reported G. muellerae tohave an affinity for intermediate to higher nutrient conditionsin more transitional water conditions where competition withE. huxleyi and G. oceanica is lower (e.g. Giraudeau and Bai-ley, 1995; Boeckel et al., 2006; Guerreiro et al., 2013) andto occupy a deeper position in the photic zone than otherspecies of the genus Gephyrocapsa (Boeckel and Baumann,2008; Guerreiro et al., 2013). Low surface Chl a concentra-tions (Fig. 9a) and the absence of any significant increase inbiogenic mass fluxes during this January period (Korte et al.,2017; Fig. 9b) point to a scenario in which only a few speciesprofit from short-term nutrient supply and moderate light in-tensities at intermediate levels in the photic zone.
Similar conditions appear to have recurred in April 2013(sample M4–12), with a pulsed maximum of E. huxleyi oc-curring under maximum PAR and lower SST following a pe-riod of more persistent wind strength increase that lastedfrom early winter until late spring (Figs. 2, 6c, and 9). Thissuggests that the water masses were stratified enough butstill nutrient enriched due to previous wind-forced verticalmixing, hence promoting favourable conditions for bloom-ing species to rapidly develop in the UPZ. The observed re-sponse of E. huxleyi is consistent with previous observationsfrom other open-ocean areas reporting this species to domi-nate spring coccolithophore blooms (Haidar and Thierstein,2001) and to induce enhanced coccolith fluxes (Broerse et al.,2000; Sprengel et al., 2002) following the water mixing andconcomitant nutrient replenishment of the photic zone typi-cal of late winter and early spring. That E. huxleyi respondedin April but not in January suggests that it was more effi-ciently growing under presumably higher nutrient availabil-ity and maximum light levels during spring. This is consis-tent with previous observations of E. huxleyi bursting intoa bloom within only a few days in response to nutrient avail-ability and clear sky conditions in surface waters (Guerreiroet al., 2013). The high tolerance of this species to high levelsof light has been considered crucial for its capacity to dom-inate coccolithophore assemblages (Nanninga and Tyrrell,1996; Tyrell and Merico, 2004). Although to a lesser ex-tent compared to E. huxleyi, other taxa that also increasedduring this April period include Helicosphaera spp., Rhab-dosphaera spp., and Umbilicosphaera spp. This event wasstrong enough to be reflected in Factor F4, explaining 8 %of the variance (Fig. 7) in enhanced total coccolith fluxesand species H ′ (Fig. 3), and by a striking flux increase inCaCO3, organic matter, and biogenic silica (Korte et al.,2017; Fig. 9b). This suggests that nutrient and light condi-tions were sufficiently favourable and persistent enough topromote the development of the entire UPZ plankton com-munity during this short period.
The pulsed maxima of G. oceanica and E. huxleyi inOctober–November 2013 (sample M4-24) were also strongenough to be revealed by Factor 4 (Fig. 7) and by a slight in-crease in the total coccolith export production (Figs. 3 and 6c,j). Higher fluxes of these species were accompanied by in-
Biogeosciences, 14, 4577–4599, 2017 www.biogeosciences.net/14/4577/2017/

C. V. Guerreiro et al.: Coccolithophore fluxes in the open tropical North Atlantic 4591
Figure 9. (a, b) Seasonal variation in total coccolith fluxes (black), sea surface salinity (SSS; dark blue), Chl a concentrations (green), andUPZ/LPZ ratio (purple) calculated from the sum of the fluxes by G. muellerae, G. oceanica, and E. huxleyi divided by the sum of the fluxesby F. profunda and G. flabellatus; (c, d) fluxes of dust inferred from the residual lithogenic fraction (orange bars) and organic material (OM,green bars) recently published by Korte et al. (2017); (e, f) correlation between UPZ/LPZ and the dust. Dark and light grey bands refer tofall and summer, respectively.
creased surface Chl a concentrations (Fig. 9a), pointing tohigh productivity in the uppermost photic zone (Figs. 6c, jand 9a). During the SEM counting of coccoliths throughoutsample M4-24, extremely high amounts of large diatom frag-ments were found, strongly supporting a scenario in whichnutrient enrichment at the surface and clear sky conditionspromoted the development of more competitive phytoplank-ton species. This is further supported by a striking flux in-crease in organic matter, biogenic silica, and to a lesser ex-tent, CaCO3 during the same period (Korte et al., 2017;Fig. 9b). The ability of E. huxleyi and G. oceanica to competewith diatoms in surface waters and to rapidly respond to nu-trient availability was observed in coastal waters off centralPortugal, confirming its capacity for rapid population growthin nutrient-rich environments (Guerreiro et al., 2013).
During the fall 2013 event, SSS had dropped to a mini-mum of 33.9 at station M4 compared to ∼ 36.25 recorded atstation M2 during the same period (Figs. 2a, b and 9a, b).Since both areas are under the influence of the ITCZ with acomparable precipitation regime (see Fig. 8) and given thathigher precipitation during the fall of 2012 at M2 was asso-ciated with much higher SSS than at M4 for the same pe-riod (Fig. 2c and d), the distinctly lower salinity at M4 inOctober–November 2013 likely reflected advected AmazonRiver water (Figs. 9 and 10). A strong positive correlationbetween high surface Chl a concentrations and the salinityminimum revealed by Factor 2 (Fig. 7) along with the sharp
increase in surface-dwelling opportunistic species, biogenicsilica, and organic matter during this period (Fig. 9; Korteet al., 2017) suggest that this nutrient-rich buoyant plumepromoted the development of phytoplankton at the surfaceof the western equatorial North Atlantic. The presence ofthe plume at station M4 was also noticed in a CTD pro-file taken during the recovery of the sediment trap moor-ing in late November 2013, showing a relatively shallowchlorophyll maximum associated with Amazon-related phy-toplankton productivity (unpublished data, not shown). Pre-vious satellite observations from this area have shown thenorth-eastward dispersion of the Amazon River Plume forcedby the NBC retroflection at around 5–10◦ N, 50◦W, typicallyfrom August to December (e.g. Muller-Karger et al., 1988;Molleri et al., 2010; see Sect. 2). The plume resulted in a dra-matic surface salinity contrast (Wilson et al., 1994) and pro-moted a gradient in environmental conditions that evolvedwhile the plume was meandering northward and mixing withthe open-ocean waters, with a strong impact on the magni-tude and composition of phytoplankton communities (refs. inGoes et al., 2014). The influence of the Amazon River wateron the living coccolithophore communities has been previ-ously reported by Winter et al. (2002) in the Caribbean Seawhere enhanced cell densities of E. huxleyi and G. oceanicawere seen coupled with this buoyant water mass. Our traprecord clearly testifies to its impact by changing the flux andspecies composition of the coccolithophore communities in
www.biogeosciences.net/14/4577/2017/ Biogeosciences, 14, 4577–4599, 2017

4592 C. V. Guerreiro et al.: Coccolithophore fluxes in the open tropical North Atlantic
Figure 10. Schematic figure summarizing the main environmental mechanisms interpreted as being at the origin of the ecological contrastsobserved between stations M4 and M2 from October 2012 to October–November 2013: (A) nutrient supply by AAIW depth range oscillations(dark blue lowermost layer) combined with (B) nutricline E–W basin-scale tilting (dashed black line), promoting the development of the LPZspecies G. flabellatus and F. profunda further west; (C) wind-forced surface ocean mixing and (D) eastward dispersion of the Amazon RiverPlume, resulting in transient “pulse-like” increases in the opportunistic UPZ species E. huxleyi, G. muellerae, and G. oceanica; (E) higherproduction of faecal pellets by zooplankton grazers (white vertical arrow) at M4 contributing to increase the coccolith export efficiency; (F)Saharan dust deposition (yellow dots) influencing the study area, particularly at M4 where the Amazon River Plume acts as a surface densityretainer of nutrients settling from the atmosphere; (G) sea surface Chl a concentrations averaged for the sampling period in the equatorialAtlantic Ocean illustrating the contrast between higher and lower surface productivity at stations M4 and M2, respectively. Abbreviations:UPZ – upper photic zone; LPZ – lower photic zone; E. huxleyi – Eh; G. muellerae – Gm; G. oceanica – Go; Fp – F. profunda; Gf –G. flabellatus; TSW – tropical surface water; SACW – South Atlantic Central Water; AAIW – Antarctic Intermediate Water.
Biogeosciences, 14, 4577–4599, 2017 www.biogeosciences.net/14/4577/2017/

C. V. Guerreiro et al.: Coccolithophore fluxes in the open tropical North Atlantic 4593
the oligotrophic western equatorial North Atlantic. Further-more, despite the limitations of using environmental data thatonly represent the atmospheric conditions and the surface ofthe ocean, it highlights the remarkably good statistical corre-lation between surface satellite data (i.e. drastic salinity de-crease and associated increase in Chl a) and enhanced coc-colith fluxes of G. oceanica, E. huxleyi, organic matter, andbiogenic silica (Korte et al., 2017) in the trap at 1200 m ofdepth.
Influence of Saharan dust deposition
The present-day deposition of Saharan dust has been recentlyquantified based on a transatlantic array of four sediment trapmoorings between NW Africa and the Caribbean, which in-cluded mooring traps M4 and M2 (Korte et al., 2017; vander Does et al., 2016). The increase in AOD from springto mid-summer at both stations (Fig. 2e and f) and its pos-itive correlation with wind speed during this time (F2 pos-itive scores; Fig. 7) corresponds to the same period whenKorte et al. (2017) found the best accordance between dustoutbreaks detected from satellite and high fluxes of dust-driven lithogenic particles. This agrees with previous obser-vations that transatlantic Saharan dust fluxes are the highestduring summer (e.g. Prospero et al., 2014). Since precipi-tation started to increase at the beginning of July at bothstations (Fig. 2c and d), wet dust deposition probably con-tributed to the observed enhanced coccolith fluxes (Figs. 3and 4). Through the exposure of the dust particles to cloudprocesses and mixing with anthropogenic species such asHNO3 in the atmosphere, wet dust deposition is thought toprovide more bioavailable (soluble) nutrients compared todry dust deposition and hence to have a greater fertilizingeffect for primary production (Ridame et al., 2014). With theexception of R. sessilis, all the tropical taxa, including bothUPZ and LPZ flora, showed increased fluxes during the Julyperiod at both locations, suggesting that coccolithophoresbenefited from the nutrient input by dust along the entirephotic zone. A positive correlation between AOD and Heli-cosphaera species thought to thrive in waters of moderatelyhigh fertility (Roth and Bergen, 1975; Haidar and Thierstein,2001; Boeckel et al., 2006) points to an ecological responseto increased nutrient levels in July (F2; Fig. 7). WhereasE. huxleyi and G. oceanica also slightly increased during thisperiod, one would expect these species to have a more sig-nificant response compared to the tropical assemblage. Thiswas, however, not the case, suggesting that the dust actedmore as a ballast than as a fertilizer during summer.
Two prominent dust flux peaks not detected by satellitewere recorded in April and October–November of 2013 atstation M4 (Korte et al., 2017), precisely when E. huxleyiand G. oceanica revealed a pulse-like increase in abundance(Figs. 6c, j and 9). This points to a scenario in which Saharandust also acted as a nutrient fertilizer in this area in addi-tion to surface–ocean mixing (spring) and the discharge and
advection of the Amazon River Plume (fall). In fact, our ob-servations suggest that the Amazon acted not only as a nutri-ent supplier during fall, but also as a buoyant surface densityretainer of dust nutrients in the surface layer. Such a com-bination would explain the much higher fluxes of biogenicsilica reported for this period by Korte et al. (2017) and thedrastic increase in Chl a at the surface of the ocean (Figs. 2aand 9a). A similar case was observed offshore of central Por-tugal where the stabilization of a river buoyant plume wasseen providing optimum stratification and nutrient-rich con-ditions for phytoplankton to bloom at the surface, resultingin a striking increase in Chl a concentrations, E. huxleyi,G. oceanica, and long-chain diatoms within only a few days(Guerreiro et al., 2013). Given the huge amounts of Saharandust continuously blown into and over the Atlantic Ocean(e.g. Prospero et al., 2014), one could argue that the mas-sive algal blooms reported to occur in the western equatorialNorth Atlantic, until now interpreted as being solely asso-ciated with nutrients provided by the Amazon, could actu-ally result from the combination of surface buoyancy andnutrients provided by atmospheric dust deposition. In addi-tion, the fall event was also marked by high precipitationrates, possibly resulting in higher nutrient bioavailability bymeans of wet dust deposition. In contrast, the Amazon Plumewas not yet present in the study area during spring and thenearly non-existent precipitation possibly resulted in com-parably lower nutrient bioavailability by dry dust deposition(see Ridame et al., 2014). Such differences in atmospheric–sea surface conditions between the two events apparently hadan effect on phytoplankton species composition, resultingin higher development of several opportunist phytoplanktonspecies during the fall and only E. huxleyi during spring.
The observed short-term shift from a more typicallytropical (K-selected) to a more opportunistic (r-selected)settling coccolith assemblage during April and October–November 2013 at station M4 supports the dust fertilizationhypothesis earlier proposed by Martin (1990) and later cor-roborated by observations from the Amazon Basin (Bristowet al., 2010), the Gulf of Mexico, and the coast of southernFlorida (Lenes et al., 2012). High fluxes of organic materialrecently observed in a sediment trap in the North Atlanticsubtropical gyre (23◦ N, 41◦W) have been associated withenhanced phytoplankton productivity resulting from stimu-lated nitrogen fixation by Trichodesmium species followingthe deposition of dust-derived nutrients (Pabortsava et al.,2017). The role of aeolian dust for nitrogen fixation in sub-tropical and tropical oligotrophic regions has been previouslyreported by several authors (e.g. Falkowski et al., 1998; Millset al., 2004; Jickels et al., 2005 and refs. therein; Martinoet al., 2014). In the tropical North Atlantic where phyto-plankton communities are nitrogen limited, experiments con-ducted by Mills et al. (2004) have shown Saharan dust addi-tion to stimulate nitrogen fixation in this area, presumably bysupplying iron and phosphorous. This is supported by Bakeret al. (2006), who reported soluble phosphorous concentra-
www.biogeosciences.net/14/4577/2017/ Biogeosciences, 14, 4577–4599, 2017

4594 C. V. Guerreiro et al.: Coccolithophore fluxes in the open tropical North Atlantic
tions to be the highest in Saharan aerosols from the NorthAtlantic. Guieu et al. (2014), on the other hand, report theimportance of strong and short-term (pulse-like) dust depo-sition events for marine productivity in low-nutrient, low-chlorophyll (LNLC) areas, whereas Romero et al. (2011)add that when dust input is accompanied by turbulence (i.e.strong winds), its potential fertilizing effects on phytoplank-ton are prone to be amplified. This fits well with the episodicnature of the dust deposition events at station M4 and the factthat they were accompanied by some degree of wind intensi-fication.
In spite of all this evidence, mineral dust deposition is alsothought to increase carbon sequestration to the deep oceanby acting as a mineral ballast of sinking particles (Pabort-sava et al., 2017). Van der Jagt et al. (2017) report moreabundant and faster-sinking aggregates when formed froma natural plankton community that has been exposed to Sa-haran dust deposition compared to less abundant and slower-sinking aggregates when formed without dust. The same au-thors argue that such dust-influenced aggregates would be-come heavily ballasted with lithogenic material at the sur-face and hence without scavenging any additional particlesduring their settling. This could at least partially explain whythe dust peaks in spring and fall were marked by maximaof surface-dwelling species but not maxima of the deep-dwelling species. To confirm whether the pulsed flux max-ima of opportunistic species presented in our study truly re-flected the response of living coccolithophores thriving inthe overlying photic layer to such a combination of factors(ecological signal) or resulted from enhanced particle trans-fer efficiency (e.g. ballasting by dust; faecal pellet produc-tion by zooplankton grazers; Armstrong et al., 2002; Ziveriet al., 2007; Fischer and Karakas, 2009; Fischer et al., 2016),a comparison between settling coccolith assemblages and theliving coccolithophore communities as well as with in situatmospheric–oceanographic observations would be required.
Whereas the spring and fall r-selected pulse events wereaccompanied by a slight increase in the total coccolith ex-port, such an increase was never as high as in the peaks ofNovember 2012 and July 2013 (see Sects. 4.1 and 5.1). Thissuggests that r-selected transient productivity is compara-bly less important than tropical background productivity forthe overall bulk coccolith export production in the equatorialNorth Atlantic. Our observations indicate that enhanced pro-ductivity and/or transfer efficiency in the LPZ in the contextof highly stratified tropical regions may be at least as impor-tant from a long-term perspective as that of the fast-bloomingtaxa more often found at higher latitudes and within produc-tive coastal neritic areas.
5.2.3 Typical oligotrophic open-ocean conditions at thecentral site M2
In contrast to station M4, persistently lower abundancesof opportunistic coccolithophore species, in particular the
gephyrocapsids, and the absence of major pulse-like in-creases in these species at station M2 point to comparablymore stable and oligotrophic conditions in this area. A nar-rower range and lower values of the UPZ/LPZ ratios at sta-tion M2 suggest that the UPZ was more persistently stratifiedand nutrient depleted in the central equatorial North Atlantic(Fig. 9). An exception occurs in early March 2013 when anincrease in the UPZ/LPZ ratio at M2 and a species compo-sition similar to that recorded in April at M4 is observed. Itcoincides with a slight flux increase in dust and carbonate(Korte et al., 2017), suggesting that M2 was also subjectedto some degree of wind-forced water mixing (Fig. 2c and d)combined with Saharan dust deposition (Fig. 9). There areno indications of influence from Amazon River water at M2,as revealed by persistently low Chl a concentrations at thesurface and low fluxes of opportunistic taxa during the fall of2013 (Fig. 9a). Our observations suggest that, compared toM4, M2 was less affected by continental influences whetherfrom Amazon River water or Saharan dust. The location ofstation M2, which is more central and 2◦ further north thanstation M4 closer to the centre of the North Atlantic sub-tropical gyre, may have contributed to the more oligotrophiccharacter of this station (Fig. 10).
That the evidence we found for ocean fertilization by Sa-haran dust is more significant at station M4 than at stationM2 may be due to the presence of buoyant Amazon waterretaining nutrients and phytoplankton near the surface at M4and to higher wet dust deposition during fall 2013 at stationM4 (e.g. Ridame et al., 2014; Fig. 2c and d). A longer dis-tance to the dust source in Africa at M4 compared to M2may have also contributed to increasing the bioavailability ofdust-driven nutrients further west (see Stuut and Prins, 2014).This could also help explain the lack of clear evidence fordust fertilization in open-ocean regions west of Africa (seeFischer et al., 2016; Neuer et al., 2004) since aerosols sink-ing in these areas would not be fine and chemically processedenough to act as fertilizers.
6 Conclusions
Our study provides important insights into the environmen-tal factors governing the spatio-temporal variability of coc-colithophores in the equatorial North Atlantic and illustrateshow this supposedly oligotrophic and stable open-ocean re-gion actually reveals significant ecological variability. Themain findings from our sediment trap study are as follows.
1. A predominantly tropical coccolith settling assemblageand a generally similar seasonality in total coccolithfluxes at the western station M4 and central station M2point to comparable background environmental condi-tions at both sites. Flux maxima were associated withstronger stratification conditions under the influenceof the Intertropical Convergence Zone (ITCZ) duringsummer and fall, whereas flux minima occurred during
Biogeosciences, 14, 4577–4599, 2017 www.biogeosciences.net/14/4577/2017/

C. V. Guerreiro et al.: Coccolithophore fluxes in the open tropical North Atlantic 4595
stronger NE trade winds and lower SSTs during winterand spring.
2. Low-light- and deep-nutricline-dwelling F. profundaand G. flabellatus dominated at both locations dur-ing the entire sampling period, especially during fall.Upper photic zone taxa such as Umbellosphaera spp.,Rhabdosphaera spp., Helicosphaera spp., and Umbili-cosphaera spp. were more abundant during summer.
3. In spite of the similar seasonal pattern, the two open-ocean locations in the oligotrophic equatorial NorthAtlantic revealed striking differences in coccolith ex-port fluxes, species proportions, and oceanographic pro-cesses.
4. Total coccolith fluxes were almost 4 times higher atthe western station M4 than at the central station M2,mostly due to G. flabellatus and F. profunda, althoughmany other species showed higher fluxes year-round.We interpret this as resulting from (i) westward deepen-ing of the north equatorial nutricline and nutrient sup-ply by the Antarctic Intermediate Water (AAIW), bothfavouring the LPZ flora, and (ii) higher transfer effi-ciency, possibly by enhanced zooplankton grazing inthis area.
5. Higher abundances and pulsed flux maxima of more op-portunistic species at station M4 point to the occurrenceof transient productivity in this area: (a) the increase inE. huxleyi in April reflected a fast ecological responseto intermittent nutrient input promoted by sea surfacecooling and wind-forced vertical mixing combined withdry dust deposition, whereas (b) pulsed maxima ofE. huxleyi and G. oceanica in October–November re-flected a response to surface nutrient enrichment derivedfrom Amazon River discharge combined with wet dustdeposition.
6. Enhanced surface buoyancy provided by the relativelyless saline Amazon River Plume appears to have con-tributed through retaining dust-derived nutrients in thesurface layer during the fall of 2013, promoting thedevelopment of several opportunistic phytoplanktongroups in the western site M4.
7. In contrast, persistently low coccolith fluxes in the cen-tral site M2, in particular of more opportunistic species,and the absence of major r-selected pulsed maximapoint to comparatively more stable and oligotrophicconditions prevailing in the centres of subtropical gyres.
Our findings (i) provide relevant evidence to support the hy-pothesis of Saharan dust acting as a fertilizer for marine phy-toplankton in the Atlantic Ocean and (ii) highlight the im-portance of LPZ coccolithophore species in terms of coccol-ith export production in the tropical Atlantic, with possibleimplications for the global oceanic carbonate budget.
Data availability. Data are available at https://doi.org/10.1594/PANGAEA.881485.
Competing interests. The authors declare that they have no conflictof interest.
The Supplement related to this article is available onlineat https://doi.org/10.5194/bg-14-4577-2017-supplement.
Acknowledgements. Moorings were deployed during RV Meteorcruise M89 and recovered after 1 year during RV Pelagia cruise64PE378 by the Royal Netherlands Institute for Sea Research(NIOZ) in the framework of the ongoing multidisciplinary projectsTRAFFIC, funded by the Netherlands Organization for ScientificResearch (NWO; project no. 822.01.008), and DUSTTRAF-FIC, funded by the European Research Council (ERC; projectno. 311152). Lab preparation of the 1/5 split of the originalsediment trap sample was conducted at the NIOZ, whereas thesplitting, filtering, and SEM taxonomical analysis were performedat the Geosciences Department of the University of Bremen,Germany. The first author benefited from a Marie Curie post-doctoral fellowship supported by the University of Bremen and theEuropean Union FP7 COFUND under grant agreement no. 600411.Regarding the satellite data used in this study, the authors wouldlike to acknowledge the following: the MODIS Atmosphere Sci-ence Team, the Aerosol Retrieval Group, and the MODIS AdaptiveProcessing System (MODAPS); the NASA EOSDIS PhysicalOceanography Distributed Active Archive Centre (PO.DAAC)(http://podaac.jpl.nasa.gov/SeaSurfaceSalinity/Aquarius); and theOcean Biology Processing Group (OBPG) and the AtmosphereArchive and Distribution System (LAADS) at the NASA GoddardSpace Flight Center. The CCMP version 2.0 vector wind analyseswere produced by Remote Sensing Systems (www.remss.com) andthe CMAP precipitation data were provided by NOAA/OAR/ESRLPSD, Boulder, Colorado, USA (http://www.esrl.noaa.gov/psd/).The authors are thankful to Leandro Ponsoni, Lluisa Cros,Oliver Knebel, and Friederike Ebersbach for their contributionsduring the discussion of the data and to Alex Poulton and twoanonymous referees for their constructive reviews.
The article processing charges for this open-accesspublication were covered by the University of Bremen.
Edited by: Emilio MarañónReviewed by: Alex Poulton and two anonymous referees
References
Andruleit, H.: A filtration technique for quantitative studies of coc-coliths, Micropaleontology, 42, 403–406, 1996.
Armstrong, R. A., Lee, C., Hedges, J. I., Honjo, S., and Wakeham,S. G.: A new, mechanistic model of organic carbon fluxes in theocean based on the quantitative association of POC with ballastminerals, Deep-Sea Res. Pt. II, 49, 219–236, 2002.
www.biogeosciences.net/14/4577/2017/ Biogeosciences, 14, 4577–4599, 2017

4596 C. V. Guerreiro et al.: Coccolithophore fluxes in the open tropical North Atlantic
Atlas, R., Hoffman, R. N., Ardizzone, J., Leidner, S. M.,Jusem, J. C., Smith, D. K., and Gombos, D.: A cross-calibrated,multiplatform ocean surface wind velocity product for meteoro-logical and oceanographic applications, B. Am. Meteorol. Soc.,92, 157–174, 2011.
Baker, A. R., Jickells, T. D., Biswas, K. F., Weston, K., andFrench, M.: Nutrients in atmospheric aerosol particles along theAtlantic Meridional Transect, Deep-Sea Res. Pt. II, 53, 1706–1719, 2006.
Basha, G., Kishore, P., Venkat Ratnamc, M., Ouarda, T. B. M. J.,Velicogna, I., and Sutterley, T.: Vertical and latitudinal variationof the intertropical convergence zone derived using GPS radiooccultation measurements, Remote Sens. Environ., 163, 262–269, 2015.
Baumann, K.-H., Andruleit, H., Bockel, B., Geisen, M., andKinkel, H.: The significance of extant coccolithophores as in-dicators of ocean water masses, surface water temperature, andpaleoproductivity: a review, Palaeont. Z., 79, 93–112, 2005.
Beaufort, L. and Heussner, S.: Coccolithophorids on the continentalslope of the Bay of Biscay – production, transport and contribu-tion to mass fluxes, Deep-Sea Res. Pt. II, 46, 2147–2174, 1999.
Beaufort, L. and Heussner, S.: Seasonal dynamics of calcareousnannoplankton on a West European continental margin: the Bayof Biscay, Mar. Micropaleontol., 43, 27–55, 2001.
Beaufort, L., Lancelot, Y., Camberlin, P., Cayre, O., Vincent, E.,Bassinot, F., and Labeyrie, L.: Insolation Cycles as a Major Con-trol of Equatorial Indian Ocean Primary Production, Science,278, 1451–1454, 1997.
Boeckel, B. and Baumann, K.-H.: Vertical and lateral variationsin coccolithophore community structure across the subtropicalfrontal zone in the South Atlantic Ocean, Mar. Micropaleontol.,76, 255–273, 2008.
Boeckel, B., Baumann, K.-H., Henrich, R., and Kinkel, H.: Coc-colith distribution patterns in South Atlantic and Southern Oceansurface sediments in relation to environmental gradients, Deep-Sea Res. Pt. I, 53, 1073–1099, 2006.
Boyle, E. A., Edmond, J. M., and Sholkovitz, E. R.: On the mecha-nism of iron removal in estuaries, Geoch. Geoph. Acta, 41, 1313–1324, 1977.
Bristow, C. S., Hudson-Edwards, K. A., and Chappell, A.:Fertilizing the Amazon and equatorial Atlantic withWest African dust, Geophys. Res. Lett., 37, L14807,https://doi.org/10.1029/2010GL043486, 2010.
Broerse, A. T. C., Ziveri, P., van Hinte, J. E., and Honjo, S.: Coccol-ithophore export production, species composition and coccolith-CaCO3 fluxes in the NE Atlantic (34◦ N 21◦W and, 48◦ N21◦W). Deep-Sea Res. Pt. II, 47, 1877–1906, 2000.
Carpenter, E. J., Montoya, J. P., Burns, J., Mulholland, M. R., Subra-maniam, A., and Capone, D. G.: Extensive bloom of a N2-fixingdiatom/cyanobacterial association in the tropical Atlantic Ocean,Mar. Ecol.-Prog. Ser., 185, 273–283, 1999.
Cros, L. and Fortuño, J.-M.: Atlas of northwestern Mediterraneancoccolithophores, Sci. Mar., 66, 7–182, 2002.
De Master, D. J., Kuehl, S. A., and Nittrouer, C. A.: Effects of sus-pended sediments on geochemical processes near the mouth ofthe Amazon River: examination of biogenic silica uptake and thefate of particle-reactive elements, Cont. Shelf Res., 6, 107–125,1986.
Deuser, W. G., Ross, E. H., and Anderson, R. F.: Seasonality in thesupply of sediment to the deep Sargasso Sea and implications forthe rapid transfer of matter to the deep ocean, Deep-Sea Res. I,28A, 495–505, 1981.
Dufois, F., Hardman-Mountford, N. J., Greenwood, J., Richard-son, A. J., Feng, M., and Matear, R. J.: Anticyclonic ed-dies are more productive than cyclonic eddies in subtropi-cal gyres because of winter mixing, Sci. Adv., 2, 1600282,https://doi.org/10.1126/sciadv.1600282, 2016.
Emery, W. J. and Meincke, J.: Global water masses: summary andreview, Oceanol. Acta, 9, 383–391, 1986.
Falkowski, P. G., Barber, R. T., and Smetacek, V.: BiogeochemicalControls and Feedbacks on Ocean Primary Production, Science,281, 200–207, 1998.
Fallet, U., van Assen, C., Boer, W., Greaves, M., andBrummer, G.-J. A.: A novel application of wet-oxidationto retrieve carbonates from large organic-rich samples forocean-Clim. Res., Geochem. Geophy. Geosy., 10, Q08004,https://doi.org/10.1029/2009GC002573, 2009.
Ffield, A.: North Brazil current rings viewed by TRMM MicrowaveImager SST and the influence of the Amazon Plume, Deep-SeaRes. Pt. I, 52, 137–160, 2005.
Fischer, G. and Karakas, G.: Sinking rates and ballast composi-tion of particles in the Atlantic Ocean: implications for the or-ganic carbon fluxes to the deep ocean, Biogeosciences, 6, 85–102, https://doi.org/10.5194/bg-6-85-2009, 2009.
Fischer, G., Romero, O., Merkel, U., Donner, B., Iversen,M., Nowald, N., Ratmeyer, V., Ruhland, G., Klann, M.,and Wefer, G.: Deep ocean mass fluxes in the coastal up-welling off Mauritania from 1988 to 2012: variability on sea-sonal to decadal timescales, Biogeosciences, 13, 3071–3090,https://doi.org/10.5194/bg-13-3071-2016, 2016.
Garzoli. S. and Katz, E. J.: The forced reversal of the Atlantic Northequatorial countercurrent, J. Phys. Oceanogr., 13, 2082–2090,1983.
Giraudeau, J. and Bayley, G. W.: Spatial dynamics of coccol-ithophore communities during an upwelling event in the South-ern Benguela system, Cont. Shelf Res., 15, 1825–1852, 1995.
Goes, J. I., Gomes, H. R., Chekalyuk, A. M., Carpenter, E. J.,Montoya, J. P., Coles, V. J., Yager, P. L., Berelson, W. M.,Capone, D. G., Foster, R. A., Steinberg, D. K., Subramaniam, A.,and Hafez, M. A.: Influence of the Amazon River discharge onthe biogeography of phytoplankton communities in the westerntropical north Atlantic, Prog. Oceanogr., 120, 29–40, 2014.
Goni, G. J. and Johns, W. E.: A census of North Brazil current ringsobserved from TOPEX/POSEIDON altimetry: 1992–1998, Geo-phys. Res. Lett., 28, 1–4, 2001.
Goudie, A. S. and Middleton, N. J.: Saharan dust storms: nature andconsequences, Earth-Sci. Rev., 56, 179–204, 2001.
Guerreiro, C., Oliveira, A., Cachão, M., de Stigter, H., Sá, C.,Borges, C., Cros, C., Santos, A., and Rodrigues, A.: Late wintercoccolithophore bloom off central Portugal in response to riverdischarge and upwelling, Cont. Shelf Res., 59, 65–83, 2013.
Guieu, C., Aumont, O., Paytan, A., Bopp, L., Law, C. S., Mahowald,N., Achterberg, E. P., Marañón, E., Salihoglu, B., Crise, A., Wa-gener, T., Herut, B., Desboeufs, K., Kanakidou, M., Olgun, N.,Peters, F., Pulido-Villena, E., Tovar-Sanchez, A., and Völker, C.:The significance of the episodic nature of atmospheric depositionto Low Nutrient Low Chlorophyll regions, Global Biogeochem.
Biogeosciences, 14, 4577–4599, 2017 www.biogeosciences.net/14/4577/2017/

C. V. Guerreiro et al.: Coccolithophore fluxes in the open tropical North Atlantic 4597
Cy., 28, 1179–1198, https://doi.org/10.1002/2014GB004852,2014.
Haidar, A. T. and Thierstein, H. R.: Coccolithophore dynamics offBermuda (N. Atlantic), Deep-Sea Res. Pt. II, 48, 1925–1956,2001.
Hastenrath, S. and Merle, J.: Annual Cycle of Subsurface ThermalStructure in the Tropical Atlantic Ocean, J. Phys. Oceanogr., 17,1518–1538, 1987.
Honjo, S.: Seasonality and interaction of biogenic and lithogenicparticle flux at the Panama Basin, Science, 281, 883–884, 1982.
Jickells, T. D., An, Z. S., Andersen, K. K., Baker, A. R., Bergametti,G., Brooks, N., Cao, J. J., Boyd, P. W., Duce, R. A., Hunter, K.A., Kawahata, H., Kubilay, N., laRoche, J., Liss, P. S., Mahowald,N., Prospero, J. M., Ridgwell, A. J., Tegen, I., and Torres, R.:Global Iron Connections Between Desert Dust, Ocean Biogeo-chemistry, and Climate, Science, 308, 67–71, 2005.
Johns, W., Lee, T., Beardsley, R. C., Candela, J., Limeburner, R.,and Castro, B.: Annual cycle and variability of the North BrazilCurrent, J. Phys. Oceanogr., 28, 103–128, 1998.
Jordan, R., Cros, L., and Young, J. A revised classification schemefor living haptophytes, Micropaleontol., 50, 55–79, 2004.
Kinkel, H., Baumann, K.-H., and Cepek, M.: Coccolithophores inthe equatorial Atlantic Ocean: response to seasonal and LateQuaternary surface water variability, Mar. Micropaleontol., 39,87–112, 2000.
Knappertsbusch, M. and Brummer, G.-J. A.: A sediment trap inves-tigation of sinking coccolithophores in the North Atlantic, Deep-Sea Res. I, 42, 1083–1109, 1995.
Knebel, O.: Production and export fluxes of biomineralising mi-croplankton in the equatorial mid North Atlantic Ocean, MScThesis (AM_1147, 24 ects), Vrije Universiteit Amsterdam, Am-sterdam, the Netherlands, 190 pp., 2016.
Köbrich, M. I. and Baumann, K.-H.: Coccolithophore flux in a sed-iment trap off Cape Blanc (NW Africa), J. Nannoplankton Res.,30, 83–96, 2009.
Köbrich, M. I., Baumann, K.-H., and Fischer, G.: Seasonal andinter-annual dynamics of coccolithophore fluxes from the up-welling region off Cape Blanc, NW Africa, J. Micropalaeontol.,35, 103–116, https://doi.org/10.1144/jmpaleo2014-024, 2015.
Korte, L. F., Brummer, G.-J. A., van der Does, M., Guerreiro,C. V., Hennekam, R., van Hateren, J. A., Jong, D., Munday,C. I., Schouten, S., and Stuut, J.-B. W.: Downward particlefluxes of biogenic matter and Saharan dust across the equa-torial North Atlantic, Atmos. Chem. Phys., 17, 6023–6040,https://doi.org/10.5194/acp-17-6023-2017, 2017.
Lelli, L., von Hoyningen-Huene, W., Vountas, M., Jäger, M., andBurrows, J. P.: Dust deposition rates derived from optical satelliteobservations, Past. Glob. C., 22, 64–65, 2014.
Lenes, J. M., Prospero, J. M., Landing, W. M., Virmani, J. I., andWalsh, J. J.: A model of Saharan dust deposition to the easternGulf of Mexico, Mar. Chem., 134, 1–9, 2012.
Levy, R., Hsu, C., et al.: MODIS Atmosphere L2 Aerosol Prod-uct, NASA MODIS Adaptive Processing System, Goddard SpaceFlight Center, USA, 2015.
Longhurst, A.: Seasonal cooling and blooming in tropical oceans,Deep-Sea Res. I, 40, 2145–2165, 1993.
Longhurst, A., Sathyendranath, S., Platt, T., and Caverhill, C.: Anestimate of global primary production in the ocean from satelliteradiometer data, J. Plankton Res., 17, 1245–1271, 1995.
Lux, M., Mercier, H., and Arhan, M.: Interhemispheric exchangesof mass and heat in the Atlantic Ocean in January–March 1993,Deep-Sea Res. I, 48, 605–638, 2001.
Mahowald, N., Jickells, T. D., Baker, A. R., Artaxo, P., Benitez-Nelson, C. R., Bergametti, G., Bond, T. C., Chen, Y., Co-hen, D. D., Herut, B., Kubilay, N., Losno, R., Luo, C.,Maenhaut, W., McGee, K. A., Okin, G. S., Siefert, R. L.,and Tsukuda, S.: Global distribution of atmospheric phos-phorous sources, concentration and deposition rates, and an-thropogenic impacts, Global Biogeochem. Cy., 22, GB4026,https://doi.org/10.1029/2008GB003240, 2008.
Mahowald, N. M., Engelstaedter, S., Luo, C., Sealy, A., Ar-taxo, P., Benitez-Nelson, C., Bonnet, S., Chen, Y., Chuang, P. Y.,Cohen, D. D., Dulac, F., Herut, B., Johansen, A. M., Kubi-lay, N., Losno, R., Maenhaut, W., Paytan, A., Prospero, J. M.,Shank, L. M., and Siefert, R. L.: Atmospheric iron deposition:global distribution, variability, and human perturbations, Annu.Rev. Mar. Sci., 1, 245–278, 2009.
Mann, K. H. and Lazier, J. R.: Dynamics of Marine Ecosystems,Biological-Physical Interactions in the Oceans, 3 Edn., Black-well Publishing, Malden, MA, Oxford, UK, 512 pp., 2006.
Margalef, R.: Life-forms of phytoplankton as survival alternativesin an unstable environment, Oceanol. Acta, 1, 493–509, 1978.
Martin, J. H.: Glacial–Interglacial CO2 change: the Iron Hypothe-sis, Paleoceanography, 5, 1–13, 1990.
Martino, M., Hamilton, D., Baker, A. R., Jickells, T. D., Brom-ley, T., Nojiri, Y., Quack, B., and Boyd, P. W.: Western Pa-cific atmospheric nutrient deposition fluxes, their impact on sur-face ocean productivity, Global Biogeochem. Cy., 28, 712–728,https://doi.org/10.1002/2013GB004794, 2014.
Milliman, J. D.: Production and accumulation of calcium carbonatein the ocean: budget of a nonsteady state, Global Biogeochem.Cy., 7, 927–957, 1993.
Mills, M. M., Ridame, C., Davey, M., Roche, J. L., and Geider, R. J.:Iron and phosphorus co-limit nitrogen fixation in the easterntropical North Atlantic, Nature, 429, 292–294, 2004.
Molfino, B. and McIntyre, A.: Precessional forcing of nutricline dy-namics in the equatorial Atlantic, Science, 249, 766–769, 1990.
Molleri, G. S. F., Novo, E. M. L., and Kampel, M.: Space–timevariability of the Amazon River plume based on satellite oceancolor, Cont. Shelf Res., 30, 342–352, 2010.
Muller-Karger, F., McClain, C., and Richardson, P.: The dispersalof the Amazon’s water, Nature, 333, 56–58, 1988.
Nanninga, J. H. and Tyrrell, T.: Importance of light for the formationof algal blooms by Emiliania huxleyi, Mar. Ecol.-Prog. Ser., 136,195–203, 1996.
Neuer, S., Torres-Padron, M. E., Gelado-Caballero, M. D.,Rueda, M. J., Hernandez-Brito, J., Davenport, R., andWefer, G.: Dust deposition pulses to the eastern sub-tropical North Atlantic gyre: Does ocean’s biogeochem-istry respond?, Global Biogeochem. Cy., 18, GB4020,https://doi.org/10.1029/2004GB002228, 2004.
Okada, H. and Honjo, S.: The distribution of oceanic coccol-ithophorids in the Pacific, Deep-Sea Res., 20, 355–374, 1973.
Okin, G. S., Baker, A. R., Tegen, I., Mahowald, N. M., Den-tener, F. J., Duce, R. A., Galloway, J. N., Hunter, K., Kanaki-dou, M., Kubilay, N., Prospero, J. M., Sarin, M., Surapip-ith, V., Uematsu, M., and Zhu, T.: Impacts of atmosphericnutrient deposition on marine productivity: roles of nitrogen,
www.biogeosciences.net/14/4577/2017/ Biogeosciences, 14, 4577–4599, 2017

4598 C. V. Guerreiro et al.: Coccolithophore fluxes in the open tropical North Atlantic
phosphorous and iron, Global Biogeochem. Cy., 25, GB2022,https://doi.org/10.1029/2010GB003858, 2011.
Oschlies, A. and Garçon, V.: Eddy-induced enhancement of pri-mary production in a coupled ecosystem-circulation model of theNorth Atlantic Ocean, Nature, 394, 266–269, 1998.
Pabortsava, K., Lampitt, R. S., Benson, J., Crowe, C., McLachlan,R., Le Moigne, F. A. C., Moore, C. M., Pebody, C., Provost, P.,Rees, A. P., Tilstone, G. H., and Woodward, E. M. S.: Carbonsequestration in the deep Atlantic enhanced by Saharan dust, Nat.Geosci., 10, 189–194, https://doi.org/10.1038/ngeo2899, 2017.
Philander, S. G.: Atlantic Ocean Equatorial Currents,Encyclopedia of Ocean Sciences 2001, 188–191,https://doi.org/10.1006/rwos.2001.0361, 2001.
Poulton, A. J., Holligan, P. M., Charalampopoulou, A., andAdey, T. R.: Coccolithophore ecology in the tropical andsubtropical Atlantic Ocean: new perspectives from the At-lantic Meridional Transect (AMT) programme, Prog. Oceanogr.,https://doi.org/10.1016/j.pocean.2017.01.003, 2017.
Prospero, J., Collard, F-X., Molinié, J., and Jeannot, A.: Character-izing the annual cycle of African dust transport to the CaribbeanBasin and South America and its impact on the environment andair quality, Global Biogeochem. Cy., 29, 757–773, 2014.
Reid, J. L.: On the total geostrophic circulation of the North AtlanticOcean: flow patterns, tracers, and transports, Prog. Oceanogr.,33, 1–92, 1994.
Richardson, P. L. and Walsh, D.: Mapping Climatological Season-alVariations of Surface Currents in the Tropical Atlantic UsingShip Drifts, J. Geophys. Res., 91, 10537–10550, 1986.
Ridame, C., Dekaezemacker, J., Guieu, C., Bonnet, S., L’Helguen,S., and Malien, F.: Contrasted Saharan dust events in LNLC envi-ronments: impact on nutrient dynamics and primary production,Biogeosciences, 11, 4783–4800, https://doi.org/10.5194/bg-11-4783-2014, 2014.
Romero, O., Boeckel, B., Donner, B., Lavik, G., Fischer, G., andWefer, G.: Seasonal productivity dynamics in the pelagic centralBenguela System inferred from the flux of carbonate and silicateorganisms, J. Marine Syst., 37, 259–278, 2002.
Romero, E., Peters, F., Marraseì, C., Guadayol, O., Gasola, J. M.,and Weinbauer, M. G.: Coastal Mediterranean plankton stimula-tion dynamics through a dust storm event: an experimental sim-ulation, Estuar. Coast. Shelf S., 93, 27–39, 2011.
Rost, B. and Riebesell, U.: Coccolithophores and the biologi-cal pump: responses to environmental changes. in: Coccol-ithophores: from Molecular Processes to Global Impact, editedby: Thierstein, H. R. and Young, J. R., Springer, Berlin, 99–125,2004.
Roth, P. H. and Berger, H.: Distribution and dissolution of coccol-iths in the South and Central Pacific, in: Dissolution of Deep-Sea Carbonates, 13, edited by: Sliter, W. V., Be, A. W. H. andBerger, W. H., Cushman Found, Foraminiferal Res. Spec. Pub.,American Science Foundation, 87–113, 1975.
Schott, F. A., Fischer, J. and Stramma, L.: Transports and pathwaysof the upper- layer circulation in the western tropical Atlantic,J. Phys. Oceanogr., 28, 1904–1928, 1998.
Sholkovitz, E. R., Boyle, E. A., and Price, N. B.: The removal ofdissolved humic acids and iron during estuarine mixing, EarthPlanet. Sc. Lett., 40, 130–136, 1978.
Signorini, S. R. and McClain, C. R.: Subtropical gyre variability asseen from satellites, Remote Sens. Lett., 3, 471–479, 2012.
Sprengel, C., Baumann, K.-H., Henderiks, J., Henrich, R., andNeuer, S.: Modern coccolithophore and carbonate sedimentationalong a productivity gradient in the Canary Islands region: sea-sonal export production and surface accumulation rates, Deep-Sea Res. II, 49, 3577– 3598, 2002.
Steinmetz, J. C.: Sedimentation of coccolithophores, in: Coccol-ithophores, edited by: Winter, A., and Siesser, W., CambridgeUniversity Press, Cambridge, 13–37, 1994.
Stoll, H. M., Arevalos, A., Burke, A., Ziveri, P., Mortyn, G.,Shimizu, N., and Unger, D.: Seasonal cycles in biogenic pro-duction and export in Northern Bay of Bengal sediment traps,Deep-Sea Res. II, 54, 558–580, 2007.
Stramma, L. and England, M.: On the water masses and mean cir-culation of the South Atlantic Ocean, J. Geophys. Res., 104,20863–20883, 1999.
Stramma, L. and Schott, F.: The mean flow field of the tropical At-lantic Ocean, Deep-Sea Res. II, 46, 279–303, 1999.
Stramma, L., Fischer, J., Brandt, P., and Schott, F.: Circulation, vari-ability and near-equatorial meridional flow in the central tropi-cal Atlantic, in: Interhemispheric Water Exchange in the AtlanticOcean, edited by: Goni, G. J. and Malanotte-Rizzoli, P., 22 pp.,2003.
Stuut, J.-B. and Prins, M.: The significance of particle size of long-range transported mineral dust, Past Glob. Changes, 22, 70–71,2014.
Stuut, J.-B. W., Brummer, G.-J., van der Does, M., Friese, C.,Geerken, E., van der Heide, R., Korte, L., Koster, B., Metcalfe,B., Munday, C., van Ooijen, J., Siccha, M., Veldhuizen, R., deVisser, J.-D., Witte, Y., and Wuis, L.: Cruise report and prelimi-nary results (64PE378), TRAFFIC II: Transatlantic fluxes of Sa-haran dust (Las Palmas de Gran Canaria, Spain – St. Maarten),Royal NIOZ, the Netherlands, 54 pp., 2013.
Stuut, J.-B. W., Witte, Y., de Visser, J.-D., Boersen, B., Koster,B., Bakker, K., Laan, P., van der Does, M., Korte, L., Mun-day, C., and van Hateren, H.: Cruise report and preliminaryresults (64PE378), DUSTTRAFFIC III: Transatlantic fluxes ofSaharan dust (Mindelo, Sao Vicente (Cape-Verdian Islands) –Bridgetown, Barbados), Royal NIOZ, the Netherlands, 51 pp.,2015.
Stuut, J.-B. W., Boekschoten, B., Boersen, B., Brummer, G.-J.,Brussaard, C., de Boer, J., de Bruin, T., Jong, D., Knebel, O.,Kooijman, K., Korte, L., Koster, B., Laan, P., Martens, M., Mun-day, C., Noordeloos, A., Pausch, F., Roepert, A., Rosell-Melé,T., Schreuder, L., Sevenster, L., van der Does, M., Venhuizen,G., Guerreiro, C. V., and Witte, Y.: Cruise report and prelimi-nary results (JC134). DUSTTRAFFIC IV: Transatlantic fluxesof Saharan dust (St. Johns, Antigua – Sta. Cruz, Tenerife, Spain),Royal NIOZ, the Netherlands, 101 pp., 2016.
Talley, L. D.: Antarctic intermediate water in the South Atlantic,in: The South Atlantic – Present and Past Circulation, edited by:Wefer, G., Berger, W. H., Siedler, G. and Webb, D. J., Springer,Berlin, 219–238, 1996.
Tuomisto, H.: Defining, Measuring, and Partitioning SpeciesDiversity, Encyclopedia of Biodiversity, 2, 434–446,https://doi.org/10.1016/B978-0-12-384719-5.00378-6, 2013.
Tyrell, T. and Merico, A.: Emiliania huxleyi: bloom observationsand the conditions that induce them, in: Coccolithophores –From Molecular Processes to Global Impact, edited by: Thier-stein, H. R. and Young, J. R., Springer, Berlin, 75–98, 2004.
Biogeosciences, 14, 4577–4599, 2017 www.biogeosciences.net/14/4577/2017/
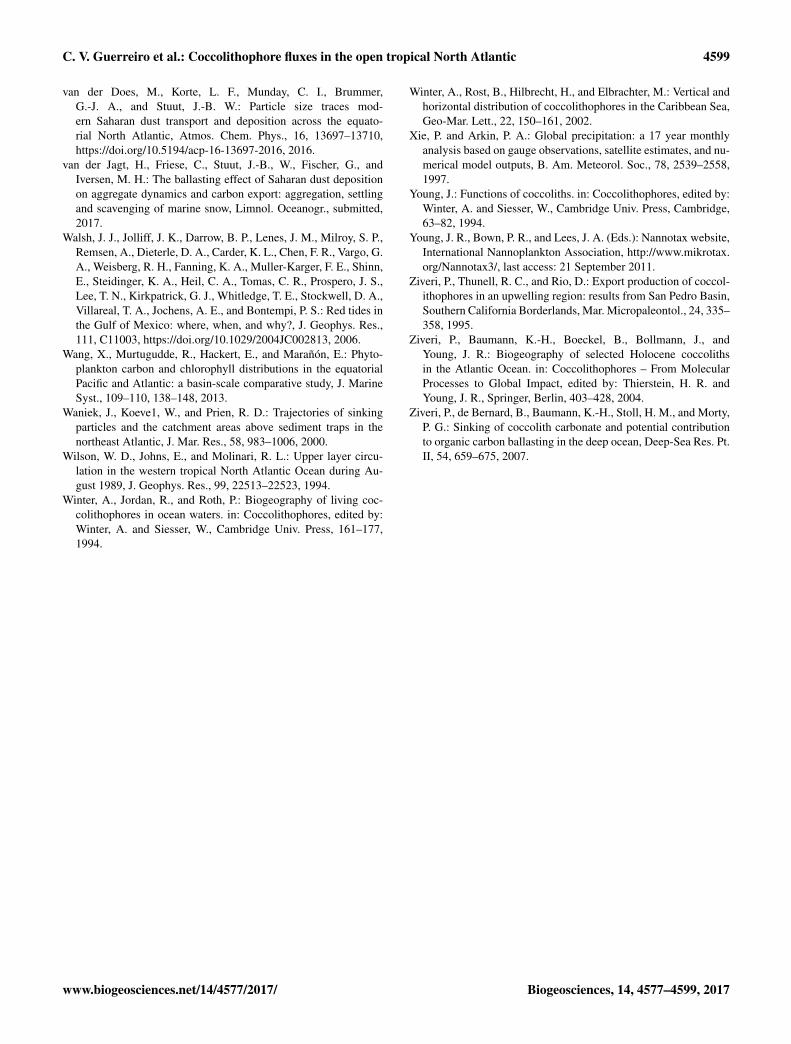
C. V. Guerreiro et al.: Coccolithophore fluxes in the open tropical North Atlantic 4599
van der Does, M., Korte, L. F., Munday, C. I., Brummer,G.-J. A., and Stuut, J.-B. W.: Particle size traces mod-ern Saharan dust transport and deposition across the equato-rial North Atlantic, Atmos. Chem. Phys., 16, 13697–13710,https://doi.org/10.5194/acp-16-13697-2016, 2016.
van der Jagt, H., Friese, C., Stuut, J.-B., W., Fischer, G., andIversen, M. H.: The ballasting effect of Saharan dust depositionon aggregate dynamics and carbon export: aggregation, settlingand scavenging of marine snow, Limnol. Oceanogr., submitted,2017.
Walsh, J. J., Jolliff, J. K., Darrow, B. P., Lenes, J. M., Milroy, S. P.,Remsen, A., Dieterle, D. A., Carder, K. L., Chen, F. R., Vargo, G.A., Weisberg, R. H., Fanning, K. A., Muller-Karger, F. E., Shinn,E., Steidinger, K. A., Heil, C. A., Tomas, C. R., Prospero, J. S.,Lee, T. N., Kirkpatrick, G. J., Whitledge, T. E., Stockwell, D. A.,Villareal, T. A., Jochens, A. E., and Bontempi, P. S.: Red tides inthe Gulf of Mexico: where, when, and why?, J. Geophys. Res.,111, C11003, https://doi.org/10.1029/2004JC002813, 2006.
Wang, X., Murtugudde, R., Hackert, E., and Marañón, E.: Phyto-plankton carbon and chlorophyll distributions in the equatorialPacific and Atlantic: a basin-scale comparative study, J. MarineSyst., 109–110, 138–148, 2013.
Waniek, J., Koeve1, W., and Prien, R. D.: Trajectories of sinkingparticles and the catchment areas above sediment traps in thenortheast Atlantic, J. Mar. Res., 58, 983–1006, 2000.
Wilson, W. D., Johns, E., and Molinari, R. L.: Upper layer circu-lation in the western tropical North Atlantic Ocean during Au-gust 1989, J. Geophys. Res., 99, 22513–22523, 1994.
Winter, A., Jordan, R., and Roth, P.: Biogeography of living coc-colithophores in ocean waters. in: Coccolithophores, edited by:Winter, A. and Siesser, W., Cambridge Univ. Press, 161–177,1994.
Winter, A., Rost, B., Hilbrecht, H., and Elbrachter, M.: Vertical andhorizontal distribution of coccolithophores in the Caribbean Sea,Geo-Mar. Lett., 22, 150–161, 2002.
Xie, P. and Arkin, P. A.: Global precipitation: a 17 year monthlyanalysis based on gauge observations, satellite estimates, and nu-merical model outputs, B. Am. Meteorol. Soc., 78, 2539–2558,1997.
Young, J.: Functions of coccoliths. in: Coccolithophores, edited by:Winter, A. and Siesser, W., Cambridge Univ. Press, Cambridge,63–82, 1994.
Young, J. R., Bown, P. R., and Lees, J. A. (Eds.): Nannotax website,International Nannoplankton Association, http://www.mikrotax.org/Nannotax3/, last access: 21 September 2011.
Ziveri, P., Thunell, R. C., and Rio, D.: Export production of coccol-ithophores in an upwelling region: results from San Pedro Basin,Southern California Borderlands, Mar. Micropaleontol., 24, 335–358, 1995.
Ziveri, P., Baumann, K.-H., Boeckel, B., Bollmann, J., andYoung, J. R.: Biogeography of selected Holocene coccolithsin the Atlantic Ocean. in: Coccolithophores – From MolecularProcesses to Global Impact, edited by: Thierstein, H. R. andYoung, J. R., Springer, Berlin, 403–428, 2004.
Ziveri, P., de Bernard, B., Baumann, K.-H., Stoll, H. M., and Morty,P. G.: Sinking of coccolith carbonate and potential contributionto organic carbon ballasting in the deep ocean, Deep-Sea Res. Pt.II, 54, 659–675, 2007.
www.biogeosciences.net/14/4577/2017/ Biogeosciences, 14, 4577–4599, 2017