Coca Cola HBC- Equity Report - Express Dissertations List of Figures Table 1: Competitors of Coca...
30
Researcher NUMBER Date COCA COLA HBC- EQUITY REPORT
Transcript of Coca Cola HBC- Equity Report - Express Dissertations List of Figures Table 1: Competitors of Coca...

Researcher
NUMBER Date
COCA COLA HBC- EQUITY REPORT

1
Table of Contents
Introduction ........................................................................................................................... 1
Description of Organisation and Products .......................................................................... 1
Industry, Economic Outlook and Competition ........................................................................ 2
Competition ....................................................................................................................... 2
Industry Performance ........................................................................................................ 4
Economic Outlook ............................................................................................................. 5
Implication for Coca Cola HBC .......................................................................................... 5
Rivalry in the Market .......................................................................................................... 7
External Environment Analysis .......................................................................................... 8
Key Implication ................................................................................................................ 10
Accounting and Financial analysis ...................................................................................... 11
Profitability Assessment .................................................................................................. 11
Liquidity Ratios ................................................................................................................ 12
Efficiency Ratios .............................................................................................................. 14
Gearing Ratio .................................................................................................................. 15
Share Valuation Performance ............................................................................................. 16
DCF Valuation ................................................................................................................... 1
Investor Importance Ratios ................................................................................................... 2
Investor Ratios Assessment .............................................................................................. 2
Risk Assessment ............................................................................................................... 3
Corporate Governance ...................................................................................................... 4
Conclusion ............................................................................................................................ 4
References ........................................................................................................................... 5
Appendix – I .......................................................................................................................... 8

2
List of Figures
Table 1: Competitors of Coca Cola HBC and Competitors .................................................... 3
Table 2: PEST Analysis ........................................................................................................ 9
Table 3: Projections of Income .............................................................................................. 1
Table 4: DCF Method ............................................................................................................ 1
Table 5: Industry Comparison ............................................................................................... 3
Figure 1: Report Areas of Focus ........................................................................................... 2
Figure 2: Coca Cola HCN and Competitors Stock Market Performance ................................ 3
Figure 3: Value and Volume of UK Beverage Industry - Current Trends ............................... 4
Figure 4: Value and Volume of the UK Beverage Industry- Forecast ..................................... 4
Figure 5: External Environment Analysis ............................................................................... 6
Figure 6: Porter’s Analysis .................................................................................................... 8
Figure 7: Increase in Costs ................................................................................................... 9
Figure 8: Skills Shortage ..................................................................................................... 10
Figure 9: Profitability Ratios ................................................................................................ 12
Figure 10: Liquidity Ratios ................................................................................................... 13
Figure 11: Efficiency Ratio .................................................................................................. 14
Figure 12: Gearing Ratio ..................................................................................................... 15
Figure 13: EPS growth .......................................................................................................... 2

1
Introduction
Description of Organisation and Products
Company Coca Cola HBC
Stock Exchange London Stock Exchange, FTSE 100
Sector / Sub-sector Beverage industry
Market capitalisation £ 4842.53 million
Share price as of April, 2nd
2015
53.21
Report’s date April, 5th 2015
Source: Bloomberg (2015)
According to Coca Cola HBC (2015), since most of Coca Cola’s products are manufactured
and sold for specific bottling partners, the organisation adopts a sustained subsidiary and
partnership approach. The Coca Cola Enterprise sells the concentrated product to
authorised bottling and canning operations who exclusively deal with the Coca Cola product.
The focus of this report is on one such partner of Coca Cola.
The focus of this report is on Coca-Cola HBC AG. This organisation is listed on the London
Stock exchange as (LSE: CCH). It also has a secondary listing at Athens Exchange
(ATHEX: EEE). The organisation is part of the FTSE 100 index and is an industry leader in
the UK beverage companies list. The organisation was listed as a key constituent of the
2014, Dow Jones Sustainability Index (DJSI) (Coca Cola HBC, 2015). Coca Cola HBC (AG)
is the key bottler and vendor of the Coca Cola products in Europe and Africa. The Coca-Cola
HBC is a company which is formed as a result of a merger between Coca Cola Beverages
Ltd and Hellenic Bottling Company. The organisation is listed in LSE as its main market but
this shift only occurred in 2012.
The organisation markets all products of Coca-Cola including Coca Cola,Coca Cola Light,
Coca Cola Zero, Fanta, Sprite, all water related brands of Coca Cola and juices including
Minute Maid and Iced Tea. The organisation operates its business through three primary
segments including the established market segment, developing countries, and emerging
countries.
Reilly and Brown (2011) contend that understand the competitive position of an organisation
along with its financial and historical performance is important in determining the
effectiveness of its portfolio management process. Furthermore, Grant (2010) also reports
that the assessment of organisation’s strategy, its financial position, risk management and
corporate governance help glean information on the market value and performance of the
organisation. The following figure shows the key areas of focus needed in this report.

2
Figure 1: Report Areas of Focus
Source: Author (2015)
Therefore, this research will consider many of these attributes to arrive at clear implications
on the future of the organisation’s performance.
Industry, Economic Outlook and Competition
According to Grant (2010), a key factor that needs to be examined is comprehension of the
economic and industrial context of the organisation. The assessment of the economic
environment helps provide views on market outlook and market share of the product.
Competition
The top competitors of Coca Cola HBC include Hansen Beverage Company, Danone and
PepsiCo at a global level. The following figure presents a comparison of the performance of
Coca Cola HBC against that of Pepsi Co and the FTSE 100 index. It is seen that in
comparison, to the FTSE 100 index and Pepsico performance, Coca Cola HBC has
performed less effectively.
Market
Environment
Assessment
Macro
Environment Industry
Environment
Internal
Environment
Financial
performance
Risks and CSR
Financial
Valuation

3
Figure 2: Coca Cola HCN and Competitors Stock Market Performance
Source: FT (2015),
The following table presents a comparison of Coca Cola HBC with Pepsico and Britvic Plc
along with the industry average. In comparison to other industries listed on the London
Stock Exchange, Coca Cola HBC has a higher market capitalisation and net income.
Table 1: Competitors of Coca Cola HBC and Competitors
Market Cap
Net Income
Mil Mil
Coca Cola HBC
4,842 294
PepsiCo
1,37,806 6,513
Britvic PLC (GBP)
1,860 89
Industry Average
22,210 974
Source: Morningstar (2015)

4
Industry Performance
The value of the UK beverage industry can be seen from the following figure. It is evident
that overall the industry has grown by 0.9% CAGR in the period 2009-2013. In the same
period, the volume growth of the industry was at 1.5%. The forecast of UK beverage industry
performance shows higher growth compared to existing values with a 1.6% CAGR for 2013-
2018 in terms of value and 1.7% growth during the same period in terms of volume. The
following figure present key highlights of this performance.
Figure 3: Value and Volume of UK Beverage Industry - Current Trends
Source: Marketline (2014)
Figure 4: Value and Volume of the UK Beverage Industry- Forecast
-0.50%
0.00%
0.50%
1.00%
1.50%
2.00%
2.50%
0.00%
0.50%
1.00%
1.50%
2.00%
2.50%
3.00%
2010 2011 2012 2013
Value and Volume of UK Beverage Industry - Current Trends
Volume Value

5
Source: Marketline (2014)
Economic Outlook
In general, the economic outlook for the organisation is positive given the recovery of the
global economy and the increase in sale of beverages as observed below.
Recovery of the global economy: According to Keynote (2014), the growth of UK economy is
moderate with an expected average improvement by 1.7% in 2013 in the UK. The global
economy has shown sustained growth during this period. For instance, in the UK the rate of
inflation fell by 0.2% in 2013 increasing household disposable income.
Increase in Sale of Beverages: According to Marketline (2014), the UK beverage market
had a total revenue of $84.6 billion in 2013. Furthermore, from 2009-2013, there was a 0.9%
growth in the market. During the same period, the increase in sale of beverages was higher
in the French and the German markets with a 1.2% and a 1.3% growth respectively.
Implication for Coca Cola HBC
From the above assessment of the general competition it is seen that the organisation in
general is performing better than its competitors listed on the LSE. The economic outlook
for the global beverage industry is optimal along with positive growth in market performance
of the industry. Therefore, the general outlook for Coca Cola HBC from this segment is
positive.
0.00%
0.50%
1.00%
1.50%
2.00%
2.50%
0.00%
0.50%
1.00%
1.50%
2.00%
2.50%
2013 2014 2015 2016 2017 2018
Value and Volume of the UK Beverage Industry- Forecast
Value Volume

6
External Environment Analysis
According to Grant (2010), to understand the true market position of the organisation and its
related strategy an examination of the external environment position of the organisation in
terms of competitive structure of the industry and the political, environmental, economic,
social, technological and legal factors is important. The key factors which are to be
examined in the case of Coca Cola is presented below.
Figure 5: External Environment Analysis
Specific Environment Industry-Competitors
Organization
Substitute
Products
Bargaining Power of
Suppliers
Bargaining Power of Buyers
Potential
Entrants
Current
Rivalry
Technological
Economic
Political-
Legal
Demographic
Sociocultural
General Environment

7
Source:
Rivalry in the Market
The purpose of the following table is to present a comparative analysis of the five forces
which impact the operations of Coca Cola HBC.
Worldwide buyer power is high given the limited costs linked to switching. The
globalisation of markets has resulted in shift in consumer tastes and requirements
(Euromonitor, 2014). Therefore, buyer power is considered to be
Supplier power assessment shows that in most countries Coca Cola HBC adopts a
tiered supply system where the product is bottled and in some cases franchised or
promoted by subsidiaries (Marketline, 2014). Therefore, there is significant vertical
integration. Therefore, supplier power is considered to be
Threat of new entrants is moderately less given the large scale integration of
incumbents in the market and high economies of scale by Coca Cola HBC and Coca
Cola Enterprises. This along with brand recognition is a key factor impacting choice.
Therefore, threat of new entrants is considered to be
Threat of substitutes is seen as many consumers would like to shift away from the
drinking of soft drinks given its low health and nutritional value. However since Coca
Cola HBC produces both soft drinks and other fruit juices and water, the threat of
substitutes is considered to be
Threat of competitors is moderately high given that Coca Cola HBC operates in
competitor with other Coca Cola Partners and its own subsidiaries along with
competition from Pepsico and Bretvit Plc in the industry. Therefore, competitive
rivalry is considered to be
The detailed assessment of Porter’s Five Forces is given below.

8
Figure 6: Porter’s Analysis
Source:
External Environment Analysis
The following table presents a detailed assessment of the environmental performance of
Coca Cola HCN.
Competition from other bottling
partners of Coca Cola.
Competition from external companies
like Pepsico. .
Competitive Rivalry- High
Economies of scale is high
Brand recognition for Coca Cola HCN is high
given consumer knowledge of Coca
Cola as a product.
Threat of New Entry – Low
Consumer preferences for alternatives to
softdrinks with more healthy options
(BSDA, 2013)
Integration of Coca Cola HCN production
of softdrinks with other products
Threat of Substitutes – Low
Labour intensive production
Increase in cost of production (BSDA,
2013).
Tiered supply chain with good integration
Supplier Power - Low
Minimal lack of switching with
multiple options to customers
(Euromonitor, 2014).
Safety of food and food content are few
concerns (Waldeimer, 2014)
Consumer changing preferences for
beverages (Euromonitor, 2014)
Consumer purchase of soft drink alterntatives
(Euromonitor, 2014)
Buyer Power -High
9
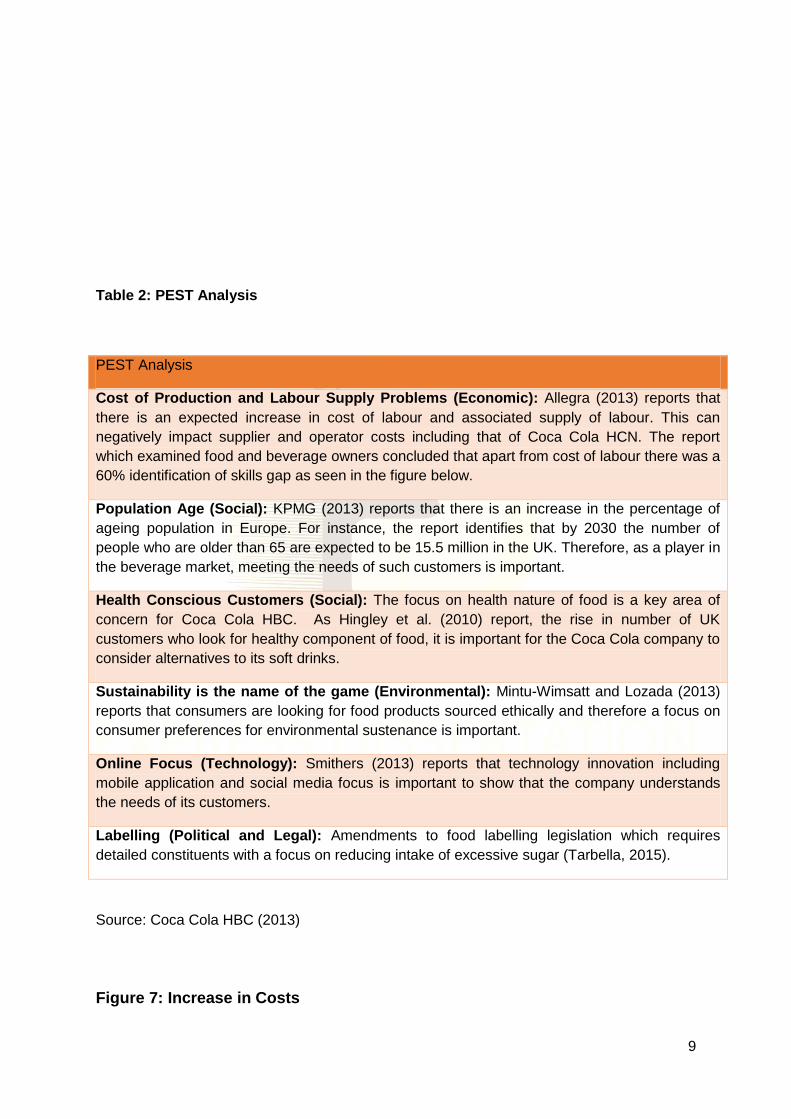
Table 2: PEST Analysis
PEST Analysis
Cost of Production and Labour Supply Problems (Economic): Allegra (2013) reports that
there is an expected increase in cost of labour and associated supply of labour. This can
negatively impact supplier and operator costs including that of Coca Cola HCN. The report
which examined food and beverage owners concluded that apart from cost of labour there was a
60% identification of skills gap as seen in the figure below.
Population Age (Social): KPMG (2013) reports that there is an increase in the percentage of
ageing population in Europe. For instance, the report identifies that by 2030 the number of
people who are older than 65 are expected to be 15.5 million in the UK. Therefore, as a player in
the beverage market, meeting the needs of such customers is important.
Health Conscious Customers (Social): The focus on health nature of food is a key area of
concern for Coca Cola HBC. As Hingley et al. (2010) report, the rise in number of UK
customers who look for healthy component of food, it is important for the Coca Cola company to
consider alternatives to its soft drinks.
Sustainability is the name of the game (Environmental): Mintu-Wimsatt and Lozada (2013)
reports that consumers are looking for food products sourced ethically and therefore a focus on
consumer preferences for environmental sustenance is important.
Online Focus (Technology): Smithers (2013) reports that technology innovation including
mobile application and social media focus is important to show that the company understands
the needs of its customers.
Labelling (Political and Legal): Amendments to food labelling legislation which requires
detailed constituents with a focus on reducing intake of excessive sugar (Tarbella, 2015).
Source: Coca Cola HBC (2013)
Figure 7: Increase in Costs

10
Source: Allegra (2013)
Figure 8: Skills Shortage
Source: Allegra (2013)
Key Implication
From the Porter’s five force analysis it is seen that the buyer preferences are the key threat
that the organisation faces. This is supported by the PESTLE analysis. However, the threat
from new entrants is low along with threats of substitutes given the diverse product portfolio.
Furthermore, it is important to acknowledge that the organisation should look at technology
advancement, environmental concerns and social needs. Therefore Coca Cola CCN should
look for positive attributes which may contribute to success of the firm in the external
environment.
0% 10% 20% 30% 40% 50% 60%
Significantly increase
Increase
About the same
Decrease
Significantly decrease
Don't know
Views on Increase in Costs
Views on Increase in Costs
0% 5% 10% 15% 20% 25% 30% 35%
Significantly increase
Increase
About the same
Decrease
Significantly decrease
Don't know
Skills Shortage
Skills Shortage

11
Accounting and Financial analysis
According to Arnold (2008), an examination of the financial data of the organisation from
previous years is important. This helps in comparing the effective performance of the
organisation with that of its competitors and thereby permit an analysis of the associated
strength and weaknesses of the current financial position of the company. The different
ratios which are examined in this report and their relevance is given in the following figure. It
is important to understand that while ratio analysis provides some positive inputs it is also
just historical performance of the organisation. Appendix I gives the formulae of the ratios
used in this report. Appendix II presents the detailed ratios of Coca Cola HCN.
Profitability Assessment
Gross margin: According to Brigham and Erdhardt (2013), the assessment of gross
margin of the organisation presents a comparative analysis of the revenue of the
organisation after deducting the costs linked to good and service production. The
purpose of measuring gross margin is to determine the percentage of sales retained
by the organisation. From the following figure, it is clear that the the gross profit
margin for Coca Cola HBC has increased from 11.97% to 13.52%. A gradual growth
from the drop in 2012 is seen. The fall in 2012 can be attributed to the shift in Coca
Cola HCN from the US market to the UK market.
Operating margin: According to Arnold (2008), the operating margin helps determine
the ratio of operating profit to the sales of the organisation. The operating margin
considers the income to the organisation before tax is made. The operating profit of
the organisation increased from 6.33% in 2013 to 6.86% in 2014. The increase in
operating profits is marginal as the organisation had lower net sales revenue driven
by lower sales volume in countries like Russia. Furthermore, as Coca Cola HCN
(2013) reports, the organisation also faced higher costs of raw material and absolute
and unfavourable currency fluctuations which caused only a moderate increase in
operating margin.
Return on Equity: The assessment of ROE helps determine the profit that the
organisation made as a share of the shareholder equity (Arnold, 2008). . The return
on equity of the organisation increased from 7.54% in 2013 to 10.54% in 2014.
Return on Capital Employed (ROCE): ROCE provides an assessment of the profits
made by the organisation by determining the efficiency with which the organisation
has used its capital (Arnold, 2008). The ROCE of Coca Cola HCN increased from
8.58% in 2013 to 10.92% in 2014.

12
Figure 9: Profitability Ratios
Source: FT (2015), Morningstar (2015) and Coca Cola HBC (2013)
Key Implications: The drop in profitability of Coca Cola in 2012 can be linked to a fall
in European market due to the crisis. For instance, Coca Cola HBC (2013) reports that
under optimistic conditions, in 2013 despite the fall in operational volume the
organisation was able to improve its overall operating profit through efficient
management of operating expenses and more importantly leveraging the scale and
footprint of the organisation’s performance. Furthermore, the organisation was also
able to leverage their performance by investing and expanding subsidiary operations
in emerging markets.
Liquidity Ratios
Current Ratio (x): The assessment of liquidity shows the ability of the organisation to
meet its immediate and long term obligations (Brigham and Ehrhardt, 2013). The
assessment of the quick ratio and the current ratio as seen in the following figure for
CCN is effective in understanding current liquidity position. The liquidity of the
organisation has dropped moderately from 1.03 in 2013 to 0.928 in 2014. Furthermore,
the cash ratio of the organisation also fell from 0.36 in 2013 to 0.31 in 2014.
0.00%
5.00%
10.00%
15.00%
GrossMargin
OperatingMargin
NetMargin
Return ofEquity
Return onNet
Assets
Return onCapital
Employed
RA
TIO
%
RESULTS
Profitability Ratios
2010
2011
2012
2013
2014

13
Figure 10: Liquidity Ratios
Source: FT (2015), Morningstar (2015) and Coca Cola HBC (2013)
Key Implications: According to Coca Cola HBC (2013) annual report, innovations and
technology development are vital in understanding the growth of the organisation.
Brigham and Houston (2011) also reports that investments in key sectors is more
important. Given the possibility of change in environmental conditions and possible
fluctuations in exchange rates along with high competitive rivalry as observed from
the PEST and Porter’s analysis, this report contends that having positive equity is
important. Therefore, positive liquidity ratios present key results.
C U R R E N T R A T I O Q U I C K R A T I O C A S H R A T I O
0.938538206 0.703422272 0.153117061
1.054419254 0.82015398
0.242321354
0.882148306 0.67605626
0.214281355
1.039448359 0.831808382
0.363971077
0.938617912 0.749989801 0.315501134
2010 2011 2012 2013 2014

14
Efficiency Ratios
Asset Turnover ratio: The asset turnover ratio identifies how effectively the organisation
is able to deploy its assets to bring positive improvements in performance. It is
considered as the overall sales or revenue generated for every one dollar of the asset
spent. The efficiency of the organisation in terms of asset turnover has remained
moderately the same across 2013 and 2014 at 0.94.
Stock Turnover Ratio: The stock turnover identifies the ability of the organisation to
reduce its inventory and thereby is a key indicator of operational efficiency (Brigham and
Houston, 2011). The stock turnover on the other hand has reduced from 14.89 in 2013 to
14.07 in 2014. This is linked to improvement in overall efficiency of operations.
Figure 11: Efficiency Ratio
Source: FT (2015), Morningstar (2015) and Coca Cola HBC (2013)
Key Implications: Coca Cola HBC (2013) reports that consolidation of assets has
taken place over the years which may account for the more or less steady asset
turnover ratios. The organisation was able to consolidate some factories into
emerging markets like Poland and expand their businesses into newer sites to meet
their requirements. The launch of the may also have impacted the asset turnover
0 2 4 6 8 10 12 14 16
Asset Turnover Ratio
Stock Turnover Ratio
0.941073181
12.83530131
0.942127506
13.5990345
0.971668608
14.59486725
0.944906087
14.8988764
0.946387575
14.07178316
2014 2013 2012 2011 2010

15
ratio. Furthermore, the annual report also shows that Belarus as an economy showed
a 100% net inflation therefore reduction of assets in this section may have contributed
to asset consolidation. The organisation has been able to leverage cloud technology
in an effective manner for infrastructure optimisation which helps in lowering costs of
additional operations.
Gearing Ratio
Net gearing ratios: Gearings is a term used to understand the efficiency of leverage
performance. The Gearings ratio helps understand the degree to which the organisation
is able to maintain its capital structure (i.e debt to equity ratio).
Interest Cover: Interest cover ratio provides an assessment of the ability of the
organisation to pay the interest on its debt. A low interest cover indicates signs of
financial trouble as the organisation will be unable to borrow if needed (Arnold, 2008).
The gearings has reduced from 0.75 in 2013 to 0.67 which is good. At the same time the
interest coverage of the organisation has increased from 4.88 in 2013 to 7.01.
Figure 12: Gearing Ratio
Source: FT (2015), Morningstar (2015) and Coca Cola HBC (2013)
Net gearing Interest coverage ratio
2010 0.700537518 9.014916193
2011 0.826040612 5.816146881
2012 0.672308437 5.282354541
2013 0.755368728 4.883059253
2014 0.677870044 7.014044944
0
1
2
3
4
5
6
7
8
9
10
Gearing Ratio

16
Key implications: The net debt of Coca Cola HBC is aimed at maintaining less than
45% of overall debt. The organisation has 13.3% of its debt in dollars and 63.4% of its
debt in Euro. The organisation has its debt in two distinct portfolios including short
term debt and long term debt with clear policies for both debt. Furthermore, the
overall expenditure on new investments in R&D has also increased significantly.
Given the fall in gearings and an associated rise in investment, this report concludes
that more loans for R&D developments can be made as only 18% of the investments
are made by the customers directly.
Share Valuation Performance
To examine the share valuation and performance firstly a projected income was presented.

1
Table 3: Projections of Income
Projections
2015 2016 2017 2018 2019
Average five year performance (2010-2014)
Assumption 31-Dec-15 31-Dec-16 31-Dec-17 31-Dec-18 31-Dec-19
96% Assuming average increase with 2 % growth
5,341.23 5,661.71 6,058.03 6,542.67 7,066.08
95% Assuming average
5,060.35 5,363.97 5,739.44 6,198.60 6,694.49
11% Assuming average
640.95 679.41 726.96 785.12 847.93
71% Assuming Same 280.89 297.74 318.58 344.07 371.60
Assuming Same as EBIT
280.89 297.74 318.58 344.07 371.60
Assumin nil - - - - -
-75.33 Assume average -75.33 -75.33 -75.33 -75.33 -75.33
Assume same interest coverage ratio
-40.05 -42.45 -45.42 -49.05 -52.98
165.51 179.96 197.83 219.68 243.28
Same as last year
27.18 29.55 32.48 36.07 39.95
138.33 150.41 165.35 183.61 203.34
- - - - -
138.33 150.41 165.35 183.61 203.34
Same as last year
60.53 65.82 72.36 80.35 88.98
- - - - -
77.80 84.59 92.99 103.26 114.36

1
DCF Valuation
According to Reilly and Brown (2011), the valuation of shares involves the use of financial
and accounting data. The need for valuation is to identify the sale of shares by one person
to another, to identify future trends for mergers or acquisitions or for purchase of large
amount of shares in private companies.
This research uses the DCF valuation approach to identify the attractiveness of investment
opportunities linked to a particular investment. The use of the DCF method involves the use
of future cash flow projections and discounts to identify present value. The use of the DCF
method in this report calculates NRR as the 1/PE ratio. It is seen that if thereis assumptions
of no increase in average EPS growth in the last seven years the share price valuation of
18.49 can be arrived at.
The following table presents the valuation of shares.
Table 4: DCF Method
1. DCF Method
in MN
Profits for the future
Amt Discounted at NRR
DCF
2015 77.80
0.96
74.48
2016 84.59
0.92
77.53
2017 92.99
0.88
81.60
2018 103.26
0.84
86.75
2019 114.36
0.80
91.97
Perpetual value 7,863
0.80
6,323.68
Total 6,736.00
Shares outstanding
364.37
Value per share 18.49
NRR is 1/PE Ratio i.e 25%
Current PE Ratio 22
NRR 4.45% 4.454343
Growth 3.0% (Assuming seven
year EPS

2
growth average)
Key Implications: From the above table it is clear that the organisation is expected to
have a positive valuation in the next five years. The presence of a positive five year
performance in terms of financial ratios as well as future forecasts of valuation shows
that the organisation has a positive future growth.
Investor Importance Ratios
Investor Ratios Assessment
According to Brigham and Houston (2011), the EPS growth of the organisation has been
negative over the last three years has been negative. However, 25.35% growth in 2015 is
clear.
Figure 13: EPS growth
Source: Morningstar (2015)
The above table compares the performance of Coca Cola HBC with that of its competitors. It
is seen that the P/E ratio of Coca Cola HBC is higher than that of its LSE listed competitor at
2011 2012 2013 2014
-25.47
-12.17 -9.19
25.35
EPS GROWTH

3
20.7. It is also seen that the growth of Coca Cola HBC in terms of five year revenue is at
5.6% which is higher than the industry average of 3.2%. Similarly the debt equity ratio of
Coca Cola is at 0.6 when compared to Britvic Plc which has 6.5. Therefore, performance is
better.
Table 5: Industry Comparison
P/E Dividend 5-Yr Rev Med Oper. Interest D/E
Yield% CAGR% Margin% Coverage
Coca Cola
HBC
21.9 2.1 5.6 5.6 6.2 0.6
PepsiCo
22.9 2.7 9.1 14.4 10.6 1.4
Britvic PLC
(GBP)
20.7 2.8 6.6 8.6 5.7 6.5
Industry
Average
— — 3.2 10.7 23.2 —
Risk Assessment
Liquidity risk, Exchange risk and Credit risk are the three important risks that the
organisation faces.
According to Coca Cola HBC (2013), the liquidity risk of the organisation is a factor
that should be considered given the wide range of countries which the organisation
operates. It is clear that the organisation is able to manage its liquidity risks based on
sufficient funds that it has a strict capital structure
Another key risk that the organisation faces is the foreign exchange risk where
changes in exchange currency rates between the Euro and US dollar along with
currencies in non-Euro territories is faced. To overcome this risk, the exposure that
the organisation has is high especially when the raw material is purchased from a
foreign market where there is no operation (Coca Cola HBC, 2013).

4
Finally, the credit risk faced by the organisation needs to be examined to ensure that
if the counterparties are unable to perform their obligations then the group should be
able to bear the losses. To reduce the impact of the risk proper assessment of credit
rating of the parties is carried out and credit limits are set (Coca Cola HSB, 2013).
Corporate Governance
According to Bauer et al. (2004) the portfolio management of the organisation and the
investor performance also requires a detailed assessment of how the organisation is able to
maintain its code of governance. The governance structure is a bit different at Coca Cola
HBC. For instance, the remuneration committee which is independent and non-executive
does not decide the compensation of the organisation. The organisation follows European
rules where the entire board gets together to decide remuneration. This is a negative factor
which may have impact on the organisation’s view in the industry (Coca Cola HBC, 2013).
Key Implication: The organisation has performed well in the market with a moderately high
P/E and is part of the FTSE index. However, the recovery in EPS performance is found to be
recent. Furthermore, the organisation also has low debt/equity and has good interest cover.
The risks of the organisation are understood and are often focused on to help reduce impact.
Furthermore, the governance is slowly changing from a Euro structure to the UK structure
which needs to be examined in detail by investors.
Conclusion
The organisation has performed moderately well in the market with a marginally high P/E
ratio. Furthermore, it is argued that the organisation has shown a moderate increase in price
since the recession recovery in 2013. The financial position of the organisation is effective
and most importantly the organisation has a positive five year share valuation. However, this
report also cautions that changes in economic climate, recent shift to the LSE without
complete following of UK code of conduct in corporate governance and possible negative
growth in emerging markets of Eastern Europe makes it important to hold the stock.
Therefore, this report recommends holding the stocks of Coca Cola.
5
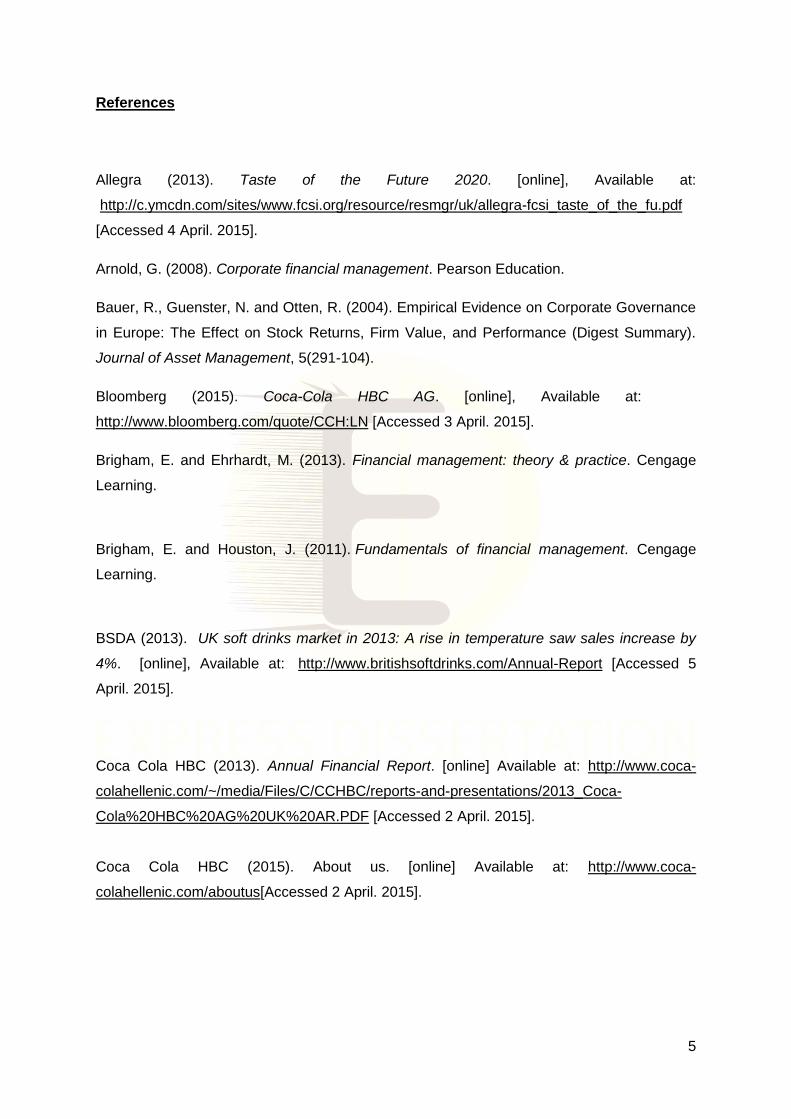
References
Allegra (2013). Taste of the Future 2020. [online], Available at:
http://c.ymcdn.com/sites/www.fcsi.org/resource/resmgr/uk/allegra-fcsi_taste_of_the_fu.pdf
[Accessed 4 April. 2015].
Arnold, G. (2008). Corporate financial management. Pearson Education.
Bauer, R., Guenster, N. and Otten, R. (2004). Empirical Evidence on Corporate Governance
in Europe: The Effect on Stock Returns, Firm Value, and Performance (Digest Summary).
Journal of Asset Management, 5(291-104).
Bloomberg (2015). Coca-Cola HBC AG. [online], Available at:
http://www.bloomberg.com/quote/CCH:LN [Accessed 3 April. 2015].
Brigham, E. and Ehrhardt, M. (2013). Financial management: theory & practice. Cengage
Learning.
Brigham, E. and Houston, J. (2011). Fundamentals of financial management. Cengage
Learning.
BSDA (2013). UK soft drinks market in 2013: A rise in temperature saw sales increase by
4%. [online], Available at: http://www.britishsoftdrinks.com/Annual-Report [Accessed 5
April. 2015].
Coca Cola HBC (2013). Annual Financial Report. [online] Available at: http://www.coca-
colahellenic.com/~/media/Files/C/CCHBC/reports-and-presentations/2013_Coca-
Cola%20HBC%20AG%20UK%20AR.PDF [Accessed 2 April. 2015].
Coca Cola HBC (2015). About us. [online] Available at: http://www.coca-
colahellenic.com/aboutus[Accessed 2 April. 2015].

6
Euromonitor (2014). Soft Drinks in the United Kingdom. [online], Available at:
http://www.euromonitor.com/soft-drinks-in-the-united-kingdom/report [Accessed 3 April.
2015].
FT (2015). Coca Cola HBC AG. [online] Available at:
http://markets.ft.com/research/Markets/Tearsheets/Summary?s=CCH:LSE [Accessed 2
April. 2015].
Grant, R. M. (2010). Contemporary Strategy Analysis: Text and Cases. 7th ed. Wiley,
Chichester.
Hingley, M., Lindgreen, A. and Beverland, M. (2010). Network Innovation in U.K. Ethnic
Fresh Produce Supply. [online], Available at:
http://www2.hull.ac.uk/hubs/pdf/memorandum81.pdf [Accessed 4 April. 2015].
Keynote (2014). Ethnic Foods Market Update 2014. [online], Available at:
http://www.keynote.co.uk/market-intelligence/view/product/11188/ethnic-foods [Accessed 4
April. 2015].
KPMG (2013). How will demographic trends affect the retail sector? . [online], Available at:
http://www.kpmg.com/uk/en/issuesandinsights/articlespublications/newsreleases/pages/how-
will-demographic-trends-in-the-uk-affect-the-retail-sector.aspx [Accessed 3 April . 2015].
Marketline (2014). Coca Cola HBC Report. Marketline Report.
Meggitt (2015). Capabilities, heritage, values. [online] Available at:
http://www.meggitt.com/about-us [Accessed 2 April. 2015].
Mintu-Wimsatt, A. T. and Loader, H. R. (2013). Green marketing in a unified Europe.
Routledge.
Morningstar (2015). Coca-Cola HBC AG CCH. [online], Available at:
http://financials.morningstar.com/income-statement/is.html?t=CCH®ion=gbr&culture=en-
US [Accessed 3 April. 2015].
Reilly, F. and Brown, K. (2011). Investment analysis and portfolio management. Cengage
Learning.

7
Smithers (2013). UK online grocery sales forecast to double amid shakeup of retail market.
[online], Available at: http://www.theguardian.com/business/2013/sep/12/uk-online-
grocery-sales-forecast-to-double-retail-shakeup [Accessed 5 April. 2015].
Waldeimer, P. (2014). Fast food faces indigestion in China amid rapid expansion. [online],
Available at: http://www.ft.com/intl/cms/s/0/2a2adacc-29a4-11e4-baec-
00144feabdc0.html#axzz3UipVplRH [Accessed 5 April. 2015].
8
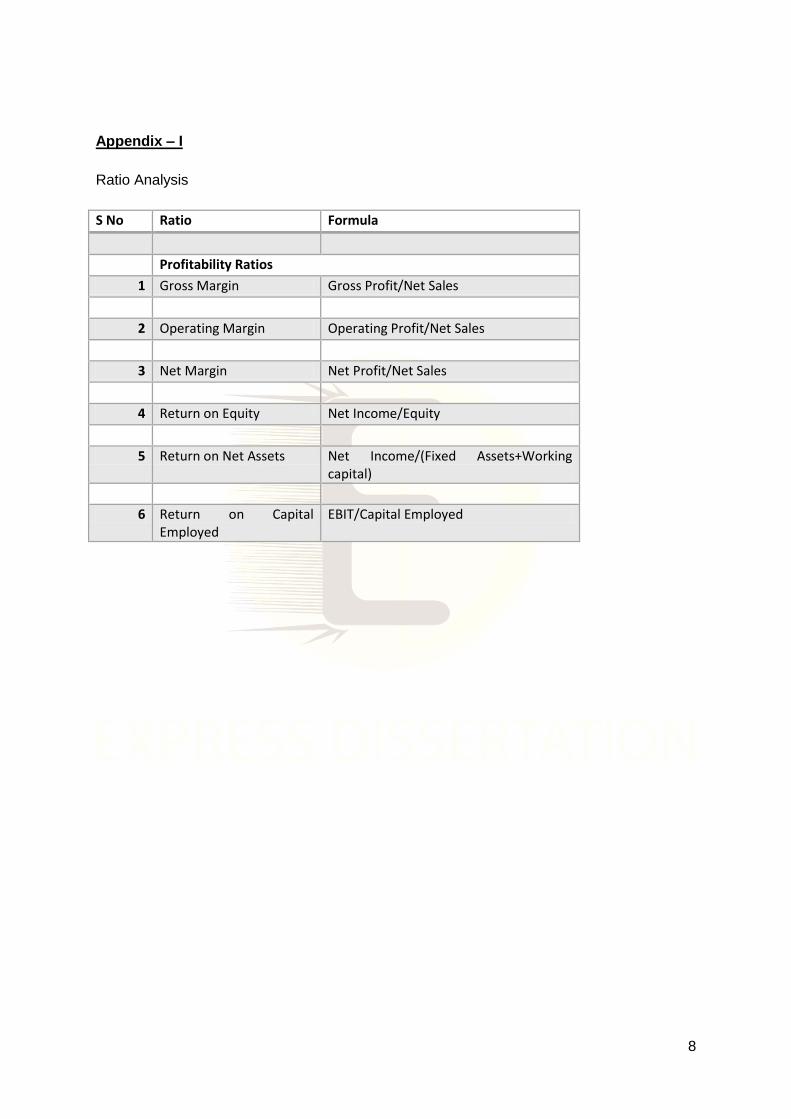
Appendix – I
Ratio Analysis
S No Ratio Formula
Profitability Ratios
1 Gross Margin Gross Profit/Net Sales
2 Operating Margin Operating Profit/Net Sales
3 Net Margin Net Profit/Net Sales
4 Return on Equity Net Income/Equity
5 Return on Net Assets Net Income/(Fixed Assets+Working capital)
6 Return on Capital Employed
EBIT/Capital Employed

9
Appendix II
Calculated ratios
Ratio Result
2010 2011 2012 2013 2014
Profitability Ratios
Gross Margin 10.22% 8.16% 6.84% 11.97% 13.52%
Operating Margin 10.11% 7.99% 6.68% 6.33% 6.86%
Net Margin 6.37% 3.89% 2.75% 3.22% 4.52%
Return on Equity 14.21% 9.10% 6.43% 7.45% 10.54%
Return on Net Assets 5.99% 3.67% 2.67% 3.04% 4.28%
Return on Capital Employed 13.27% 10.38% 9.53% 8.58% 10.92%
Liquidity Ratios 2010 2011 2012 2013 2014
Current Ratio 0.938538 1.054419 0.882148 1.039448 0.938618
Quick ratio 0.703422 0.820154 0.676056 0.831808 0.74999
Cash Ratio 0.153117 0.242321 0.214281 0.363971 0.315501
Efficiency Ratio 2010 2011 2012 2013 2014
Average Collection Period 60.31893 59.06369 53.16957 51.32495 53.49263
Average Payment Period 120.9497 109.4371 120.9391 116.0139 130.3443
Efficiency ratio 2010 2011 2012 2013 2014
Asset Turnover Ratio 0.941073 0.942128 0.971669 0.944906 0.946388
Stock Turnover Ratio 12.8353 13.59903 14.59487 14.89888 14.07178
Gearing Ratio 2010 2011 2012 2013 2014
Net gearing 0.700538 0.826041 0.672308 0.755369 0.67787
Interest coverage ratio 9.014916 5.816147 5.282355 4.883059 7.014045

10