Cob: A Sustainable Building Material
57
Santa Clara University Scholar Commons Civil Engineering Senior eses Engineering Senior eses Spring 2018 Cob: A Sustainable Building Material Daniel Eberhard Santa Clara University Joseph Novara Santa Clara University Brandon Popovec Santa Clara University Follow this and additional works at: hps://scholarcommons.scu.edu/ceng_senior Part of the Civil and Environmental Engineering Commons is esis is brought to you for free and open access by the Engineering Senior eses at Scholar Commons. It has been accepted for inclusion in Civil Engineering Senior eses by an authorized administrator of Scholar Commons. For more information, please contact [email protected]. Recommended Citation Eberhard, Daniel; Novara, Joseph; and Popovec, Brandon, "Cob: A Sustainable Building Material" (2018). Civil Engineering Senior eses. 66. hps://scholarcommons.scu.edu/ceng_senior/66
Transcript of Cob: A Sustainable Building Material

Santa Clara UniversityScholar Commons
Civil Engineering Senior Theses Engineering Senior Theses
Spring 2018
Cob: A Sustainable Building MaterialDaniel EberhardSanta Clara University
Joseph NovaraSanta Clara University
Brandon PopovecSanta Clara University
Follow this and additional works at: https://scholarcommons.scu.edu/ceng_senior
Part of the Civil and Environmental Engineering Commons
This Thesis is brought to you for free and open access by the Engineering Senior Theses at Scholar Commons. It has been accepted for inclusion in CivilEngineering Senior Theses by an authorized administrator of Scholar Commons. For more information, please contact [email protected].
Recommended CitationEberhard, Daniel; Novara, Joseph; and Popovec, Brandon, "Cob: A Sustainable Building Material" (2018). Civil Engineering SeniorTheses. 66.https://scholarcommons.scu.edu/ceng_senior/66

D S He b 13.2018

ii
Cob: A Sustainable Building Material
By
Daniel Eberhard, Joseph Novara, and Brandon Popovec
SENIOR DESIGN PROJECT REPORT
Submitted to the Department of Civil Engineering
of
SANTA CLARA UNIVERSITY
in Partial Fulfillment of the Requirements for the degree of
Bachelor of Science in Civil Engineering Santa Clara, California
Spring 2018

iii
Cob: A Sustainable Building Material
Daniel Eberhard, Joseph Novara, and Brandon Popovec
Department of Civil Engineering
Santa Clara University, Spring 2018
ABSTRACT
Cob is a sustainable building material used in residential applications as a replacement for
typical one-story timber or concrete structures. Cob heavily lacks the testing and modern
research required for permissible construction under current residential building codes. Further
tests involving earthquake and lateral loading are required to implement cob into the California
Residential Building Code. In this report, four cob walls, each with different reinforcement
mechanisms, were tested to observe their failure modes and find the maximum deflection and
load of each wall. Through this testing, it was determined that steel reinforcement within cob
walls can provide more ductile behavior and increase both maximum loads and displacement of
the material. Analysis showed the ideal reinforced cob wall had an estimated Response
Modification Factor of 2.5 which reduces design loads significantly when considering lateral
seismic loading. The combination of vertical steel and lateral wire mesh reinforcement
throughout a cob wall proved to be the most efficient way to reinforce the structure. The key to
properly reinforce cob involves using materials that are large enough to transfer load but small
enough to not create large voids within the cob matrix. There is potential for the material to be
used in permitted buildings, yet much more full scale research must be done to solidify its
capabilities.

iv
ACKNOWLEDGEMENTS
We would like to extend a special thank you to Brent Woodcock, Tonya Nilsson, Anthony Dente, John Fordice, Jose Espinoza, Gabi Brunello, Alex Golitz, Verdant Structural Engineers,
the Cob Research Institute, Kita Glass and all of the cob enthusiasts that helped us along our journey.

v
Table of Contents
Certificate of Approval i Title Page ii Abstract iii Acknowledgements iv Table of Contents v List of Figures vi List of Tables vii 1.0.0 Introduction 1
1.1.0 Project History 1 1.2.0 Project Need 1
2.0.0 Project Overview 2 2.1.0 Project Scope 2 2.2.0 Analysis of Alternatives 2
3.0.0 Design Criteria and Standards 3 3.1.0 Constructability of Cob 3 3.2.0 Mix Design 4 3.3.0 Reinforcement Systems 7 3.3.1 Wall 1 (Common Practice) 7 3.3.2 Wall 2 (Heavy Reinforcement) 9
3.3.3 Wall 3 (Medium Reinforcement) 10 3.3.4 Wall 4 (Light Reinforcement) 12 3.4.0 Base Design 13 3.5.0 Top Plate Design 14 3.6.0 Wall Restraint Design 16 3.7.0 Project Challenges 17
4.0.0 Testing Data and Analysis 18 4.1.0 Wall 1 (Common Practice) 19
4.2.0 Wall 2 (Heavy Reinforcement) 20 4.3.0 Wall 3 (Medium Reinforcement) 22
4.4.0 Wall 4 (Light Reinforcement) 24 4.5.0 Discussion 26 4.6.0 Seismic Response Modification Factor 27
5.0.0 Future of Cob 31 6.0.0 Conclusion 32 7.0.0 References 33 8.0.0 Appendix 34
vi
List of Figures
Figure 1: Example of Thumbed Cob 4 Figure 2: Wall 1 Reinforcement System (Common Practice) 8 Figure 3: Wall 1 Base Design (Common Practice) 8 Figure 4: Wall 2 Reinforcement System (Heavy Reinforcement) 10 Figure 5: Wall 3 Reinforcement System (Medium Reinforcement) 11 Figure 6: Wall 4 Reinforcement System (Light Reinforcement) 12 Figure 7: Completed Base for a 1.25:1 Aspect Ratio Cob Wall 14 Figure 8: Top Plate Design Configuration 15 Figure 9: Wall Testing Restraint System 16 Figure 10: Wall 1 (Common Practice) After Testing 19 Figure 11: Wall 1 (Common Practice) Hysteresis Diagram 20 Figure 12: Wall 2 (Heavily Reinforced) After Testing 21 Figure 13: Wall 2 (Heavily Reinforced) Hysteresis Diagram 22 Figure 14: Wall 3 (Medium Reinforced) After Testing 23 Figure 15: Wall 3 (Medium Reinforced) Hysteresis Diagram 24 Figure 16: Wall 4 (Light Reinforced) After Testing 25 Figure 17: Wall 4 (Light Reinforcement) Hysteresis Diagram 26 Figure 18: Wall 4 (Light Reinforced) Maximum Peak Values 28 Figure 19: Stress Strain Curves for All Walls 29 Figure 20: Wall 3 Linear Regression Analysis 30

vii
List of Tables
Table 1: 1:1 Sand to Soil Ratio 5 Table 2: 1:1.5 Sand to Soil Ratio 5 Table 3: 1:2 Sand to Soil Ratio 6 Table 4: Wall Test Results 18 Table 5: Wall Test Results 30

1
1.0.0 Introduction 1.1.0 Project Need With the world’s population rapidly increasing and harmful carbon emissions rising, it is
important to implement sustainable construction materials to help protect the environment.
Typical construction materials such as concrete and steel, have a heavy impact on the
environment, which is why research in alternative, sustainable materials is being brought to the
public eye more and more. Typical construction materials are not only harmful to the
environment, but they also are also expensive to manufacture and construct. Cob is a material
that offers a solution to both problems. It does not take carbon to produce and is a low cost
alternative to steel or timber houses. Cob is cost effective because of its four common
ingredients: high clay content soil, straw, sand and water. Cob does not require technical training
to construct, which reduces the construction costs and enables a variety of people to build
structures from the material. Cob structures are a great option for construction in both eco-
friendly communities and developing nations. Although cob has been around for thousands of
years, modern cob building techniques and mix ratios lack consistency and extensive research.
Since there are many people living in unpermitted cob houses, there is a need for research on
various characteristics of the material.
1.2.0 Project History Cob as a building material is said to have originated in England sometime around the 16th
century. It can be found across the globe in temperate to extreme climates. Many of the oldest
buildings in Afghanistan and England are constructed with cob or cob-like earthen building
materials. Cob has been tested in various settings in the past on both small scale and full scale
levels. Previous tests have typically had high levels of uncertainty due to the varying properties
of the sand soil and straw used to make cob. New Zealand has achieved successful results with
cob and other earthen materials. As a result, cob has been implemented into the New Zealand
code (NZS 4297:1998: Engineering Design of Earthen Buildings). The code has reasonable
starting points for shear and uplift values that are needed for the construction of the walls. In
addition, many small scale tests have been done in universities within the United States.
University of San Francisco’s “Effect of Straw Length and Quantity on Mechanical Properties of
Cob” report yielded results for compression testing that serve as initial base values and

2
expectations for the small scale tests. Although the work has been done before, cob is very
dependent on the specific type of soil, sand, and straw that make up the specific mix. As a result,
it is necessary to acquire values that are ideal for the areas materials.
2.0.0 Project Overview 2.1.0 Project Scope The scope of work for this project was the construction and testing of four different reinforced
cob wall designs. The objective was to create usable experimental data on full sized cob walls to
ultimately determine the effectiveness of the structures during seismic activity. This scope
included initial compression tests of different cob mix designs to determine the desired
percentage of sand, clay, and straw for the full scale walls with varying reinforcement systems
and aspect ratios. Bases, top plates and restraint systems were designed for wall testing. Four full
scale walls were built using these designed components and were tested in the Santa Clara
University Multi Degree of Freedom (MDOF) test frame. Through data collection of
displacement, maximum loading, and failure mechanisms, a Response Modification Factor used
to determine lateral design loads was estimated. This report specifically aimed to provide
evidence to support the inclusion of cob into the California Residential Building code. In
addition, the failure modes of each wall are a vital piece of data that will help analyze how cob
interacts with reinforcement elements. By constructing walls that contain different aspect ratios
or reinforcement systems, predictions and subsequent results of the wall tests can reveal insight
into the nature of the material when interacting with ductile supporting materials and lead future
research in the direction of improved building techniques.
2.2.0 Analysis of Alternatives
In recent years, cob has seen an increase in popularity due to its low cost of materials and
sustainability of construction. There are certainly pros and cons to cob construction when
compared to the various common building practices. One large drawback for cob during
construction compared to wood, concrete, and straw bale construction is the time required to
erect a cob structure. Between the acquisition of materials as well as the batch by batch mixing
and application process, a several hundred square foot structure can take a dozen workers,
working full days, several weeks to complete. Compared to the alternatives, however, cob is a

3
successful material when it comes to sustainability. Concrete requires skilled labor, additional
equipment, and industry wide is responsible for 5% of the world’s carbon dioxide production.
Wood frame structures are not fireproof and can generally be more expensive to maintain in the
long run. Cob structures can be constructed with no release of carbon or greenhouse gases into
the atmosphere if done completely with human power.
The walls built for this project had varying aspect ratios and reinforcement systems. One
alternative to this design would be to have four identical walls, providing iterative tests. Iterative
testing provides data that can be compared together, which gauges the precision of the results.
Studying the results for only one system reduces the amount of information gathered about the
different wall designs. Since there is limited information about full scale cob wall tests, the
information about the different reinforcement systems and failure mechanisms are valuable.
Future projects could implement iterative testing, but for this project, it was decided that it was
more valuable to pursue information about multiple wall systems to set a baseline for future
testing.
3.0.0 Design Criteria & Standards 3.1.0 Constructability of Cob
The greatest challenge of building with cob is that modern building techniques rely heavily on
touch and feel, instead of quantifiable measurements. In the field, sand and soil are mixed
together with various ratios and then water is added until the material “feels right.” During the
first stage of this project, set amounts of high clay content soil, sand, and straw had to be
determined for consistency. The initial mixture of soil, sand, and water was done in a concrete
mixer to increase efficiency. To determine if the mix was at the appropriate moisture level, a
handful of the mix was taken out of the concrete mixer and compacted into a handful sized ball.
The ball was then thrown up two to three feet in the air four times and if the ball was able to hold
together when caught, the mix was ready to have straw added. The mixture of soil, sand, and
water was then placed onto a tarp. The straw was manually integrated by coating the sand and
soil with straw and then stomping the straw into the mix. From there the mix was rolled and
folded. More straw was used to coat the batch, and this process was repeated until the entirety of
the straw was integrated evenly throughout the batch (the exact quantity of straw is discussed in

4
section “3.2.0 Mix Design”. Once the mixture was complete, the cob was then manually formed
onto the walls and integrated into the previous lift with a technique called “thumbing.”
Thumbing involves placing a lump of cob onto the structure and then using a stick or thumb like
object to push the new cob into the previous layer. This technique is done every few inches to
insure the straw was thoroughly integrated into the previous layer. CRI Director, John Fordice,
provided a demonstration for proper thumbing techniques. A visual of a layer of cob that has
been thumbed is shown below in Figure 1.
Figure 1: Example of Thumbed Cob.
Due to the high moisture content of material during construction, lifts were limited to four inches
per session to avoid slump. The cob then had to dry for two to three hours before any additional
lifts could be added. If the cob was allowed to dry for any more than eight hours, water would
have to be applied to the top lift to retain the desirable moisture content so that the cob was well
integrated between layers.
3.2.0 Mix Design
Finding the highest strength mix of sand, straw, and soil involved testing three different types of
cob samples in compression. The samples were created with sand to soil ratios of 1:1, 1: 1.5 and

5
1:2 (straw was kept as a constant) and labeled samples A, B, and C respectively. The
compression tests were performed based on ASTM C 39 (ASTM C39 / C39M. – 15 2015). The
protocol for the testing standard was followed in regards to how the test was performed, however
the cob specimens were rectangular shaped and uncapped as opposed to cylindrical with capping.
The width of the testing cylinders do not allow straw to fully integrate into the cob matrix and
are not representative of the material in a full scale structure. As a result, the larger cob prism
was used to provide ample volume for the straw to interact with the sand and clay, creating a
sample that was more indicative of full scale behavior. The samples were compressed at a rate of
0.030 inches per minute until load peaked. The average maximum peak loads and standard
deviation were recorded for each mix ratio as can be seen in Tables 1-3.
Table 1: 1:1 Sand to Soil Ratio.
Sample Width
(in) Length (in) Height (in) Density (lb/ ) Peak Load (lb)
Peak Stress (lb/ )
A1 8.0 8.0 7.0 95.3 10000+* 160+*
A2 8.0 8.0 7.0 96.8 3860 60.3
A3 8.0 8.0 7.0 90.6 10000+* 160+*
Mean 8120+* 125+*
STD 3690+* 58+*
*machine limit was reached before sample broke
Table 2: 1:1.5 Sand to Soil Ratio.
Sample Width
(in) Length (in) Height (in) Density (lb/ ) Peak Load (lb)
Peak Stress (lb/ )
B1 8.0 8.0 7.0 102.6 4336 67.8
B2 8.0 8.0 7.0 102.2 4611 72.0
B3 8.0 7.5 7.5 97.9 4785 79.8
B4 8.0 8.0 7.5 94.7 4472 69.9
Mean 4551 72.4
STD 192.2 5.2

6
Table 3: 1:2 Sand to Soil Ratio.
Sample Width
(in) Length (in) Height (in) Density (lb/ ) Peak Load (lb)
Peak Stress (lb/ )
C1 8.0 8.0 7.5 99.7 8501 132.8
C2 8.0 8.0 7.0 106.8 9423 147.2
C3 8.0 8.0 7.5 101.9 9377 146.5
Mean 9100.3 142.2
STD 519.55 8.12
The 1:1 mix ratio was selected due to the compressive strength of samples A1 and A3, which
each resisted over 10,000 pounds. Sample A2 did not perform to the same level as the other two,
receiving 3,860 pounds before failing. Sample A2 was damaged prior to testing, which likely
contributed to its reduced strength. Samples A1 and A3 outperformed all other samples. An exact
peak load was not found, because of the limitations of the compression apparatus. Due to the
success of those samples, the 1:1 ratio was selected as the mix design to use for the duration of
the research.
Further small scale testing was conducted on the 1:1 soil to sand ratio, the details of which can
be found in the Santa Clara University Cob Property Analysis 2018 Senior Design Report.
In common practice, straw is added until the product “feels right” so there was a focused effort
on quantifying how much straw was required, with heavy reliance on the expertise of John
Fordice from the Cob Research Institute. Through careful measuring, it was determined that 120
grams of straw was required per 0.71 cubic feet of soil and sand.
The exact amount of water added to the batches of cob varied from day to day. Since the soil was
stored outside, the moisture content of the material was inconsistent, and water was added until
the appropriate consistency was created. This is one area that could be quantified further for
future research, although it would likely require daily moisture tests or storing all materials in a
controlled environment.

7
3.3.0 Reinforcement Systems Cob is traditionally built in the field with no tensile reinforcement (excluding the straw mixed
into the material). Due to its brittle characteristics, four unique reinforcement systems were
selected to observe the ductility of the structure and examine the different failures caused by the
lateral loading from the MDOF test frame.
3.3.1 Wall 1 (Common Practice)
The first wall system was a common practice wall shown in Figure 2. Wall 1 (Common Practice)
has no steel reinforcing structure, apart from the six (6) pieces of #5 threaded rod spaced 12
inches on center at the top of wall. The threaded rods were added to transfer load from the top
plate timber members to the cob wall and were embedded 12 inches into the wall with 2.5x2.5
bearing plates at the bottom. At six feet of height, a scaffolding system was constructed to hold
the rods in place as cob was packed around them. To avoid shearing through the cob, the
threaded rod had a minimum edge spacing of 3 inches. A foundation of rocks protruding five to
six inches out of the concrete base shown in Figure 3 was designed to mimic common cob
practices. The rocks were placed while the concrete was setting at the perimeter of where the cob
was to be placed as well as laterally throughout the wall at 12 inch intervals. The purpose of this
wall was to give insight into how existing cob structures perform when laterally loaded. Wall 1
had a height of seven feet (7’), a length of five feet six inches (5’6”), and a depth of 16 inches
(16”). The wall had a 1.25:1 aspect ratio to encourage a shear failure in the wall.

8
Figure 2: Wall 1 Reinforcement System (Common Practice).
Drawing Courtesy of Verdant Structural Engineers
Figure 3: Wall 1 Base Design (Common Practice).

9
3.3.2 Wall 2 (Heavy Reinforcement)
The reinforcement method for Wall 2 was a rebar matrix, with horizontal #5 rebar installed 12
inches (12”) on center and four vertical pieces running the full seven foot (7’) height. The
configuration can be seen in Figure 4. The #5 rebar was embedded into the concrete base and
secured with scaffolding until the wall could support the rebar cage. Similar to Wall 1, there was
a minimum three inch (3”) coverage between the rebar and outside of the wall. Horizontal pieces
of rebar were placed on top of the wet cob and tied to the vertical rebar with tie wire as
construction progressed. The top two feet (2’) of rebar were replaced with couplers and threaded
rod protruded six inches (6”) out of the top of the wall, allowing for tie in to the top plate. The
purpose of the rebar in this wall was to replicate the kind of reinforcement found in a typical
concrete wall. This wall was constructed and tested to determine how the cob interacts with rebar
and determine its viability to add strength and ductility to a cob structure. Wall 2 had a
reinforcement configuration and aspect ratio different from the previous wall. At a length of
three feet and six inches (3’-6”), Wall 2 had an aspect ratio of 2:1 to induce a flexural failure.

10
Figure 4: Wall 2 Reinforcement System (Heavy Reinforcement).
Drawing Courtesy of Verdant Structural Engineers 3.3.3 Wall 3 (Medium Reinforcement) The reinforcement method for Wall 3 utilized rebar and welded wire mesh, with 14 gauge
welded wire mesh installed horizontally every 18” on center and two (2) vertical pieces of #5
rebar running the full seven foot (7’) height. In addition to the full length rebar, two pieces of #5
threaded rod were placed in between at 12 inches (12”) on center on both the top and bottom of
the wall, penetrating the cob 12 inches (12”). Bearing plates, which were 2.5” x 2.5”, were
placed at the bottom of the all thread rods at the top of the wall to help transfer the load from the
MDOF test frame into the wall. The configuration can be seen in Figure 5. The #5 rebar was
embedded into the concrete base and secured with scaffolding until the wall could support the
rebar cage. Similar to Wall 1, there was a minimum three inch (3”) coverage between the rebar
and outside of the wall. Horizontal pieces of welded wire mesh were placed on top of the wet

11
cob as construction progressed. The top two feet (2’) of rebar within the wall was replaced with
couplers and threaded rod protruding six inches (6”) out of the wall to allow for tie in to the top
plate. The purpose of the rebar and welded wire mesh was to reinforce the wall with materials
that would be easier to use in the field. Welded wire mesh is a lighter material that is easier to
transport and cut compared to rebar. This wall was constructed and tested to determine how the
cob would interact with the welded wire mesh and rebar to see if these materials would help
increase the ductility and strength of the wall. Wall 3 had a different reinforcement
configuration, but the aspect ratio was the same as the previous wall. At a length of three feet and
six inches (3’-6”), Wall 3 had an aspect ratio of 2:1 to induce a flexural failure.
Figure 5: Wall 3 Reinforcement System (Medium Reinforcement).
Drawing Courtesy of Verdant Structural Engineers

12
3.3.4 Wall 4 (Light Reinforcement)
The reinforcement methods used for Wall 4 combined all thread rods and welded wire mesh,
similar to Wall 3. Vertical #5 threaded rods penetrated 12 inches (12”) into the cob at the top
and bottom of the wall. Bearing plates, which were 2.5” x 2.5”, were added to the bottom of the
threaded rods at the top of the wall to help transfer the load from the MDOF test frame into the
cob. The threaded rods were placed 12 inches (12”) on center along the middle of the base and
top of the wall. Welded wire mesh was used for the horizontal reinforcement of Wall 4. The
first layer of welded wire mesh was placed 6 inches above the top of the base and the following
layers of the mesh were placed 18 inches (18”) on center for the remainder of the wall. The
reinforcement of Wall 4 can be seen in Figure 6. Wall 4 was constructed and tested to determine
how the cob would interact with the welded wire mesh if there was no vertical reinforcement that
ran the entire height of the wall. Wall 4 had a height of seven feet (7’), a length of five feet six
inches (5’6”), and a depth of 16 inches (16”). The wall had a 1.25:1 aspect ratio to encourage a
shear failure.
Figure 6: Wall 4 Reinforcement System (Light Reinforcement).
Drawing Courtesy of Verdant Structural Engineers

13
3.4.0 Base Design In order to test the material in the MDOF Testing Frame, a base for the walls had to be designed.
There were a few primary design concerns that dictated the parameters of the bases. The first
concern was the weight of the completed walls bearing on the bases. The walls had to be moved
from the storage locations to the testing machine using a forklift. Deflection of the base between
the forks had to be considered to protect the walls from damage during transportation. To prevent
this deflection, the allowable deflection of the bases were determined using Equation 1, the
allowable concrete floor deflection equation per ACI 318 (ACI 318 2014).
Δ= L/480,
where Δ is the allowable deflection and L is the length of the base between supports (inches).
The forks were assumed to be at the edges of the longest wall (66 inches), as this is the worst
case scenario. It was found the bases would have an allowable deflection of 0.1375 inches.
The bases were over designed so that all failure during testing would occur in the cob and not in
the concrete. One potential failure in the concrete was the rebar pullout due to uplift. Designing
the required embedment of the rebar required an estimate of the expected uplift force during
testing. After discussions with Anthony Dente of Verdant Structural Engineers, some
assumptions were made, with help from the New Zealand Building Code NZS 4297 (Morris
1998), about the expected maximum lateral force before the walls failed. The estimated lateral
force was 1,145 pounds per linear foot of wall and due to the limited research on cob, an
additional factor of safety of three was applied for a final design lateral force of 3,440 pounds per
linear foot, yielding a total of 18,900 pounds in Walls 1 and 4 (1:1.25 ratio) and 12,080 pounds
in Walls 2 and 3 (1:2 ratio).
Using the assumed 18,900 pounds of force for Walls 1 and 4, a maximum uplift force of 22,350
pounds was calculated, resulting in a required a depth of rebar of 12 inches (12”). Four inches of
coverage between the vertical and horizontal rebar and the bottom of the base was decided after
discussion with CRI, resulting in a final base depth of 16 inches (16”).
(Equation 1)

14
To finalize the bases, an outrigger system was designed. The outriggers were included to add
stability to the walls both during construction and for the three months of drying. The system
included two 4x6 timber beams, which were placed underneath the edge of each base and
extended out three feet on each side as shown in Figure 7.
Typeequationhere.
Figure 7: Completed Base for a 1.25:1 Aspect Ratio Cob Wall.
In addition, 4x4 pieces of lumber were placed beneath the wall at six inch (6”) intervals. These
4x4 pieces did not extend beyond the width of the base, supporting the base and preventing
deflection between the 4x6 beams. This design allowed enough space for forks to get underneath
the wall. The limited space in the MDOF test frame required the outriggers to be removable and
the base to sit flush to the ground.
3.5.0 Top Plate Design
Unlike shake tables, the MDOF test frame applies load cyclically through a pin connection at the
top of the wall. The walls require a header that is able to transfer load through the top of the wall
and into the cob matrix. In the initial design phase, timber was chosen as the ideal material for

15
the top plate for both ease of construction and adequate strength. An elevation view of the top
plate can be seen in Figure 8.
Figure 8: Top Plate Design Configuration.
The top plate, as with the base of walls, was designed for 3,440 pounds per linear foot of lateral
load, to ensure that failure occurred in the cob wall system. Immediately after the final lift of cob
was applied, a 4x8 flat piece of Douglas fir north, running the length of the wall, was embedded
into the wet cob. Holes were drilled so that the six pieces of threaded rod in the cob could
penetrate through the embedded 4x8. Threaded rods were then secured with washers and bolts.
After the cob dried, an additional 4x8 flat piece was placed above the original for constructability
of the pin connection to the MDOF test frame. The two pieces of timber were then secured
together using eight three quarter inch (¾”) lag screws to act as one cohesive top plate. In
addition, six one inch (1”) diameter lag screws were used to fasten the steel plate pin connection
to the upper 4x8 member. Shear force in the bottom 4x8 transferred by the threaded rod,
governed the design of the top plate. Shear force through the member was found using Equation
2
2 ,
where represents allowable shear stress in a member, V represents the shear force applied,
represents the embedded distance of the lag screw into the wood member, and the edge
distance represents the minimum spacing between the lag screw and edge of wood. With a
minimum edge distance of three inches (3”) and a minimum allowable shear stress of 170 psi for
(Equation 2)
Grooves on each side

16
Douglas fir north based on 2012 National Design Specifications for Wood Construction (NDS
2012) values, the allowable shear force in the wood was 4170 pounds per threaded rod. The
estimated maximum lateral force of 18,900 pounds, produced a value of 3150 pounds per
threaded rod. Lastly, the lag screws were checked for shear failure and crushing of wood.
Grooves 1.5”-2” deep were cut four to five inches (4”-5”) into the top plate on either end of the
of the upper 4x8 as pictured in Figure 6. T-plates attached to the MDOF test frame shown clearly
in Figure 14 sat within these grooves, reducing any torsional or out of plane movement of the
wall during testing.
3.6.0 Wall Restraint Design
Each wall needed to be restrained in the MDOF testing frame to prevent overturning and sliding.
To resist overturning, a select structural Douglas fir 6x10 beam was placed horizontally across
the concrete base and tied into the strong floor with two one inch (1”) diameter threaded rods at
each end, as shown in Figure 9. Calculations were completed to verify that the timber and rods
were sufficient to resist the estimated maximum lateral force of 18,900 pounds.
Figure 9: Wall Testing Restraint System.

17
Based off of the estimated design load of 18,900 pounds, the maximum moment was 16,000
pound feet. The maximum allowable moment of the timber was 18,000 pound feet. The
estimated forces required each rod to be able to resist a maximum uplift force of 4,560 pounds.
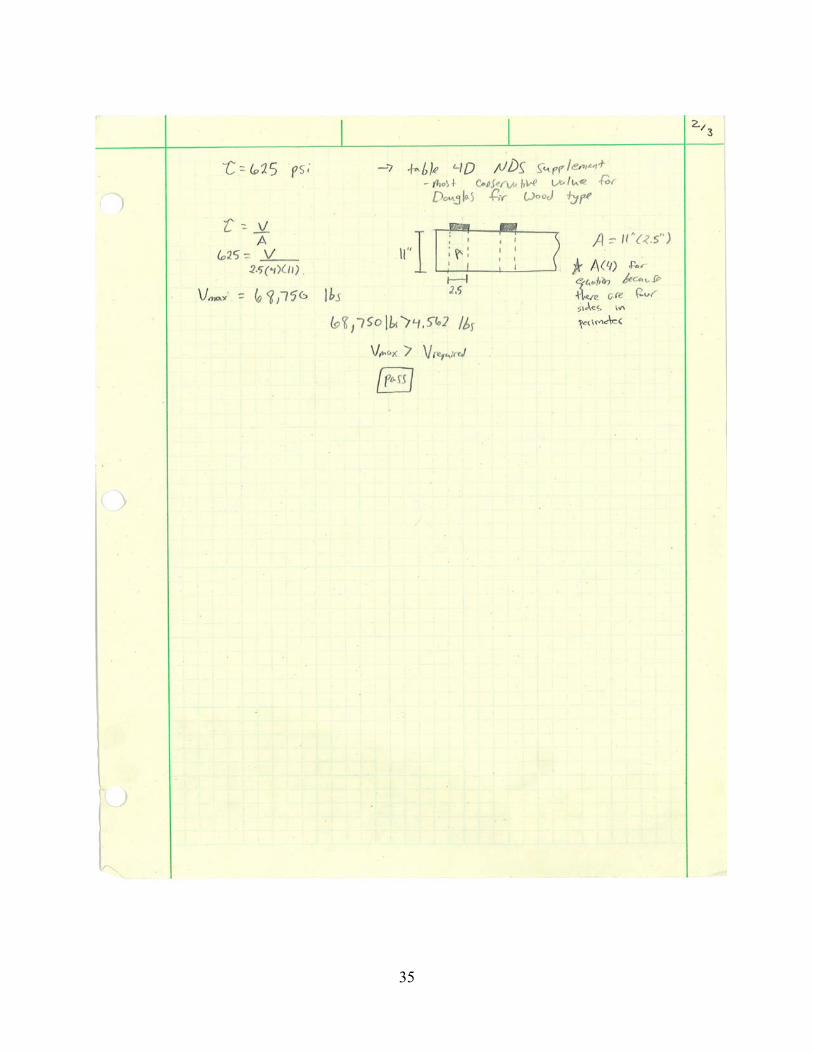
The limiting factor of this system is the wooden beams. To verify that the bearing plate would
not cause the wooden beam to fail, the maximum shear calculation was completed for the metal
plates. Using the NDS (NDS 2012), it was determined that it would require 68,750 pounds for
the metal plate to shear through the 11” height of the timber beam. These calculations showed
that the restraint system would be able to resist the forces produced by the MDOF testing frame,
during the cyclical loading of the four walls.
3.7.0 Project Challenges One of the major challenges of this project was dealing with limited working space. The layout
of the walls was critical because each had to be built inside of the lab and then moved three
months later after they had finished drying. The layout had to provide enough space to construct
the walls and also leave enough room for the forklift to have access to each wall.
The final base design had a depth of 16 inches, a width of 16 inches and a length of either five
feet six inches (5’6”) or seven feet seven inches (7’7”). The bases required 1.2 cubic yards of
concrete, which was donated by Tom Albanese at US Concrete and delivered to the Santa Clara
University campus. The concrete cured for one week before the construction of the walls began.
The soil was stored outside, which affected its moisture content and resulted in slight daily
adjustments to the mix design. Each day, the correct water amount was determined by adding
water incrementally to the first batch until the cob mixture was at the desired consistency. The
same amount of water was used for the remainder of the mixes produced that day. The moisture
content of the mix affects workability of the cob.
There were issues finding threaded rods that were long enough to run the full height of the wall.
Continuous threaded rods were used in the two smaller walls from the base to the top plate.
Since a threaded rod of the required length was expensive, #5 rebar was used with couplers at the
top, which allowed the rebar to transition into the required rod. The couplers caused cracking in
Walls 2 and 3.
18
Using the calculated cob density of 96 pounds per cubic foot, shown in Table 1, the final weight
of the small walls with the base were each roughly 5200 pounds, and the large walls were each
7500 pounds. Santa Clara University has a forklift with a lifting capacity of 5600 pounds. One
of the 7500 pound walls was built in the MDOF testing frame but the other large wall had to be
moved, which a required a rented forklift. There were an abundance of administrative issues to
be resolved before the rented forklift could be ordered, including appropriate signatures and final
confirmation that it was acceptable to place the order for the forklift.
Transporting the walls was an additional challenge because the walls had to be taken out of the
structures lab and driven 150 feet down the road to the MDOF testing frame. To help minimize
risk during moving the walls, the road was closed down with cones, and flaggers were placed on
both ends of the road to redirect pedestrian traffic. The wall was placed on four wooden blocks
so that the forklift could pull its forks out without knocking the wall over. Tubular webbing was
used with rigging hoists to lift half of the wall up off the block. Once the two blocks were
removed, the wall was slowly lowered to the ground. Once secure, the other half of the wall was
then lifted so that the remaining blocks could be removed, and then the wall was placed on the
ground.
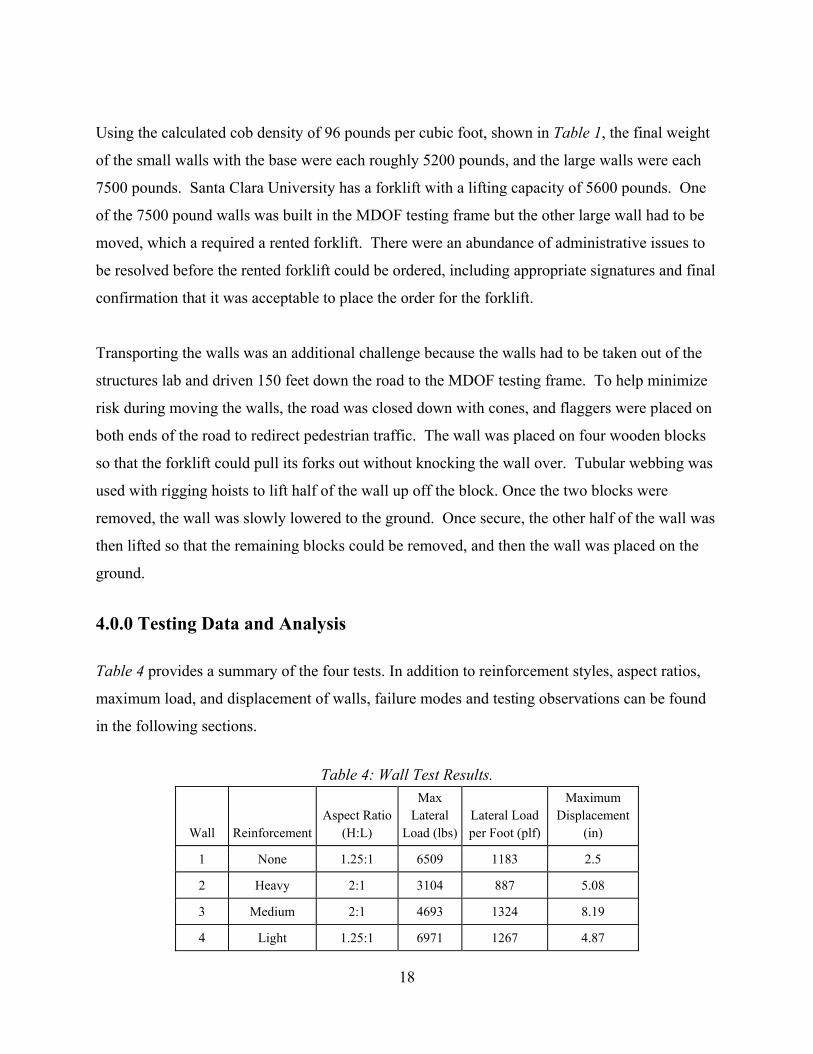
4.0.0 Testing Data and Analysis Table 4 provides a summary of the four tests. In addition to reinforcement styles, aspect ratios,
maximum load, and displacement of walls, failure modes and testing observations can be found
in the following sections.
Table 4: Wall Test Results.
Wall Reinforcement Aspect Ratio
(H:L)
Max Lateral
Load (lbs)Lateral Load per Foot (plf)
Maximum Displacement
(in)
1 None 1.25:1 6509 1183 2.5
2 Heavy 2:1 3104 887 5.08
3 Medium 2:1 4693 1324 8.19
4 Light 1.25:1 6971 1267 4.87

19
4.1.0 Wall 1 (Common Practice) The first wall tested was the common practice wall (1.25:1 ratio). In the cyclic loading machine,
the wall took a lateral force of 1183 pounds per foot or 6509 pounds total. The wall failed prior
to reaching the maximum displacement in the machine (8.4 inches). Wall 1 took more lateral
force than its self-weight of 5,745 pounds. This wall failed in shear, and the diagonal cracks can
be seen below in Figure 10.
Figure 10: Wall 1 (Common Practice) After Testing.
The ultimate failures in the wall developed along a lift, indicating these may be a weak point in
the material. Before failure, the wall had some minor uplift off of the stone connections in the
base, indicating that load was being transferred through all seven feet of the wall.
Unfortunately during this test, the data tracking the stress and displacement of the wall was not
recorded. Some data involving peak loads was able to be extracted from the video data thanks to
Santa Clara University student Jose Espinoza. The hysteresis loops show a maximum
displacement of 2.5 inches, which can be seen in Figure 11.

20
Figure 11: Wall 1 (Common Practice) Hysteresis Diagram.
4.2.0 Wall 2 (Heavily Reinforcement) The heavily reinforced (2:1 aspect ratio) received a maximum lateral force of 887 pounds per
foot or 3104 pounds total. This heavily reinforced wall utilized couplers in the construction of
the rebar cage. A horizontal crack was observed prior to testing Wall 2. The couplers added to
this wall were likely the source of the crack and may have decreased the maximum lateral load
the wall could resist. Failure occurred at the base of the couplers which can be seen in Figure 12.

21
Figure 12: Wall 2 (Heavily Reinforcement) After Testing.
In addition, the rebar did not integrate well with cob. As the test continued, the rebar created
voids in the cob, indicating the steel cage and cob were moving independently. Unlike concrete,
the cob did not bond with the rebar, suggesting a full rebar cage is not the ideal reinforcement
mechanism for cob. The hysteresis loops in Figure 13, show Wall 2 had five inches (5”) of
lateral offset. The hysteresis loops for Wall 2 also show a significant decrease in load as the
lateral displacement increases.
Couplers

22
Figure 13: Wall 2 (Heavily Reinforcement) Hysteresis Diagram.
4.3.0 Wall 3 (Medium Reinforcement)
The medium reinforced wall (2:1 aspect ratio) experienced a peak load of 1342 pounds per foot
and a total force of 4693 pounds. Wall 3 failed in the plane where the couplers were installed, as
can be observed in Figure 14.

23
Figure 14: Wall 3 (Medium Reinforcement) After Testing.
The welded wire mesh offered many different points of contact for the surrounding cob, helping
the two move as one unit. The rebar, which ran the total height, appeared to distribute forces
horizontally to each piece of mesh. The hysteresis loops in Figure 15 show eight inches (8”) of
displacement, completing all cycles on the MDOF test frame without collapsing.
T-plate

24
Figure 15: Wall 3 (Medium Reinforcement) Hysteresis Diagram.
4.4.0 Wall 4 (Light Reinforcement)
The lightly reinforced wall (1.25:1 aspect ratio) reached a maximum load of 6971 pounds of
lateral force before failure, or 1267 pounds per lineal foot of wall. During the test, the metal
plates attached to the testing frame began to bear on the wood top plate. The metal plates can be
seen in Figure 16. As a result of the bearing, the wall was no longer being loaded solely through
the pin. This may have created a higher peak, since the cob wall was not taking all of the load
through the pin connection. Ultimately, it is nearly impossible to determine how the cob would
act if the test frame did not come in contact with the wood member, so the values received must
be analyzed accordingly.

25
Figure 16: Wall 4 (Light Reinforcement) After Testing.
The failure in Wall 4 occurred along a horizontal plane near the bottom of the wall roughly one
hour into the test. The location of the failure was along the same plane as a lift, where
construction was completed for the day. Shortly after cracks began to form, a large crack spread
through the entire length of the wall 2 feet (2’) about the base. The crack divided Wall 4 into two
halves, only transferring load to the top of the wall. The base and bottom two feet (2’) of cob
only received a portion of the load. The portion of the wall above the crack was moving
independently of the bottom for the remainder of the test. As a result, the hysteresis curve shows
a drop of in load as the displacements grows. Had the test been concluded immediately after the
failure of the wall, the maximum displacement of the system would be substantially less. As
shown in the hysteresis loops in Figure 17, Wall 4 had a maximum lateral offset of 4.5 inches.

26
Figure 17: Wall 4 (Light Reinforcement) Hysteresis Diagram.
4.5.0 Discussion Looking at an overview of all tested wall systems, Wall 3 produced the highest displacement and
load per linear foot. The high performance was likely due to the welded wire mesh and its
interaction with the vertical rebar. Compared to Wall 4, which only had welded wire mesh, Wall
3’s vertical rebar only added 57 pounds per linear foot. Wall 3 however, had 3.32 inches more
maximum lateral offset, a 68% increase over Wall 4.
Wall 3 had the highest performance, although there are other factors to consider. First, this wall
only had two couplers installed, while Wall 2 had four total. This fact may have adversely
affected Wall 2, skewing the results. Although Wall 2 had a reduction of 437 pounds per linear
foot compared to Wall 3, the rebar did add a significant amount of ductility to the cob, with the
second highest lateral displacement of the walls. The added ductility in Wall 2 was the desired
effect of the added reinforcement, although the reduction of the peak lateral force adds a
significant trade-off.
Based on the hysteresis loops (Figures 11, 13, 15, 17), Wall 1 was the most brittle with a
maximum lateral displacement of 2.5 inches. Compared to Wall 3’s maximum lateral

27
displacement of 8.19 inches, Wall 1 had a reduction of 228 %. The brittleness of Wall 1 indicates
the steel reinforcement added a significant amount of ductility to the walls where it was
implemented. Wall 1’s peak lateral load per linear foot was 141 pounds less than Wall 3’s. This
suggests the steel reinforcement did not add a significant amount of strength to each wall.
A common failure mechanism observed across multiple walls was horizontal failure along a lift.
The lift locations throughout the walls do not have the same level of integration of straw that the
general cob matrix would have. Time must be allotted to allow the walls to dry and gain strength
before another layer of cob is added. Wet cob that is applied to dryer cob from the day before
does not integrate as well, resulting in a reduction in lateral strength along that plane. The
locations of the lifts were weak spots for the walls, but different construction techniques could be
used to strengthen these planes, such as staggering the lifts at the end of each day.
The couplers were a potential point of weakness in the walls. The couplers were bulky, and the
smaller walls developed cracks along the bottom of the couplers. The couplers did not fail during
testing, but their effect on the smaller walls is a complication that needs to be looked into further.
The MDOF test frame induced uplift in each of the walls due to rocking shear. In an actual cob
structure this reaction would be mitigated by the added weight and stiffness of the entire
structure. Each wall’s lateral resistance was likely conservatively measured because of the test
frames method of loading. In the field an earthquake load would be evenly distributed through
the wall’s base, rather than through four to six points of contact through the top plate.
4.6.0 Seismic Response Modification Factor Using the hysteresis graphs found from the testing, approximations of the seismic response
modification factors could be found. Before analyzing the data, bare frame corrections had to be
accounted for to remove error in the data, created by friction in the testing frame. After
completing these adjustments, envelope curves for each wall’s graph could be determined. The
maximum peak values and the envelope curves for Wall 4 can be seen below in Figure 18.

28
Figure 18: Wall 4 (Light Reinforced) Maximum Peak Values.
By taking the absolute value of each of the data points graphed, two stress strain curves for the
wall were created, shown in red and green on Figure 18, which were averaged to find a final load
vs. displacement plot for each wall. Each wall’s stress strain curve was then plotted together as
shown on Figure 19.

29
Figure 19: Stress Strain Curves for All Walls.
It is important to note that the data for Wall 1 was recovered using the video data and may
contain more error than the others.
The above figure compares how each wall performed, as well as provides a means to estimate
the Seismic Response Modification Factor, or R value. The method used to calculate the R value
for each wall was the APA Report 158 Method (Rose 1998), using
R = 2 1 0. where =Δ ,
where is the force at the peak load and st is the maximum displacement ( values can be
seen in Figure 20). and Δ are the force and displacement at the yield point, respectively. This
method was used for each wall. The main difficulty in calculating these values came from
determining where the yield point is on the graphs. The yield point exists where the graph
becomes non-linear. These points were found using both visual inspection, and by using linear
(Equation 3)

30
regressions lines to determine values for each wall’s graph. Each line was considered linear
until the value dropped below 0.98. Any portions beyond the 0.98 value were considered to
no longer be yielding. These values were averaged with a visual inspection of where the non-
linear portion begins, to find the final values.
Figure 20: Wall 3 Linear Regression Analysis.
This process was used for all walls, and the results were recorded as shown in Table 5.
Table 5: Wall Test Results.
Wall ReinforcementSeismic Response
Modification Factor
1 None N/A
2 Heavy 2
3 Medium 2.5
4 Light 1.5
The test data shows that Wall 3 had the highest R value of 2.5. This is expected, as Wall 3 had
the highest lateral displacement and load per linear foot. Due to the data loss for Wall 1, only a
fraction of the data points were collected from the hysteresis diagrams. The R value was not

31
calculated because of the higher uncertainty. Wall 2 and Wall 4 received an R value of 2 and 1.5
respectively.
5.0.0 The Future of Cob Currently, cob structures are not a permitted building material in the United States, but groups
such the Cob Research Institute are making strides to get the material into the California
Residential Code. More research and iterative testing has to be done before cob will be able to
make it into the Residential Code but the results from these tests have helped lay a solid
foundation for future testing. The political aspects that this material will have to overcome
revolve around the inconsistency of the material. Since all soil sources are slightly different,
there is always going to be a concern about the consistency of the soil used in cob construction.
Verifying the clay content of different soil sources requires testing that some people will not be
able complete in rural areas. The main point of using cob as a building material is that it is
inexpensive to use, and the materials needed to construct the structure are accessible in most
places on the globe. It is important that more research is done with different types of soil to see
how the different sources affect the properties of the cob wall. The main concerns of the
material revolve around the safety of cob structures. If people construct cob incorrectly or are
inconsistent with their mixes, the structure could be compromised and the occupants of the
structure could be in danger. Iterative testing would help minimize these risks because it would
show how the material properties react under different circumstances. It is also extremely
important that very detailed guidelines for constructing with cob are written and distributed to
anyone who wants to build a cob structure. These guidelines will help make sure that people
construct the cob structure properly. The other aspect that needs to be looked into is how the
structural integrity of the walls is affected by different environments. Even though a solid
foundation and roof structure will protect the cob from most rainfall, some more humid
environments may prevent drying which would in turn weaken the cob.
Cob research draws many people in because there is a huge push for sustainable building
practices in today’s society. Construction is an environmentally unsustainable industry due to
the large carbon footprint from the production of steel and concrete. Even though the use of steel
and concrete is unavoidable with the building materials that we currently have access too, it is

32
still essential that engineers research materials such as cob, which can provide a sustainable
alternative for certain types of structures. Cob could become a great building material for small
residential structures, and the production of these structures is much less harmful to the
environment than traditional building materials. Cob could also have a huge social impact on
certain societies because the structures can be produced for a fraction of the price of current
homes. A fully operational three bedroom cob house can be construction for roughly $26,000.
The cob walls act as a great insulating material and can be finished with plaster and painted over
to conceal the earthen building material. Since cob is not currently in the California Building
Code, people are currently building unpermitted structures or are forced to undergo a very
expensive and lengthy design process to build a cob structure. If cob is approved for the
Residential or Building Code someday, more people will be able to legally construct cob houses
without spending extra money to prove that their house design is safe.
6.0.0 Conclusion Cob is a great alternative to current materials being used in residential communities. The lack of
testing done on this material, however, is currently preventing cob from becoming a part of the
California Residential Code. The testing done for this project helped lay the foundation for
getting cob into the Residential Code but further testing is needed to see the true values of the
material. The results from this research show some of the ways to improve the properties of cob,
such as internal reinforcement and using specific sand to soil ratios, but iterative testing needs to
still be completed to verify the results discussed in this report. Being able to maximize the peak
load and displacement allows designers to use a higher “R” value when designing structures for
earthquake loads. The resulting “R” value given from the data of these wall tests was roughly
2.5. This “R” value was higher than originally anticipated but with further testing and
innovation, the “R” value could increase. The use of horizontal and vertical reinforcement inside
of the cob walls helped increase the ductility of the structure, but further testing would help
narrow down the most efficient way of reinforcing cob walls. There is a chance that cob will be
able to make it into the California Residential Building Code, but iterative testing will be needed
to verify the data provided in the report.

33
7.0.0 References
ACI 318. (2014). “Building Code Requirements for Structural Concrete and Commentary.”
American Concrete Institute.
ASTM C39 / C39M. - 15. (2015). “Standard Test Method for Compressive Strength of
Cylindrical Concrete Specimens.” American Society for Testing and Materials.
Morris, Hugh and Miles, Allen. (1998). “NZS 4297:1998 Engineering Design of Earth
Buildings.” Standards New Zealand, section 7.3.1.1.
Rizza, Michael S. and Bottger, Hana M. (2013) “Effect of Straw Length and Quantity on
Mechanical Properties of Cob.” University of San Francisco Press.
Rose, John D. (1998). “Report 158: Preliminary Testing of Wood Structural Panel Shear Walls
Under Cyclic (Reversed) Loading.” APA: The Engineered Wood Association.
NDS. (2012). “ASD/LRDF NDS: National Design Specification for Wood Construction.”
American Wood Council.

34
Appendix Structural Calculations:
35

36

37

38

39

40

41

42

43
44
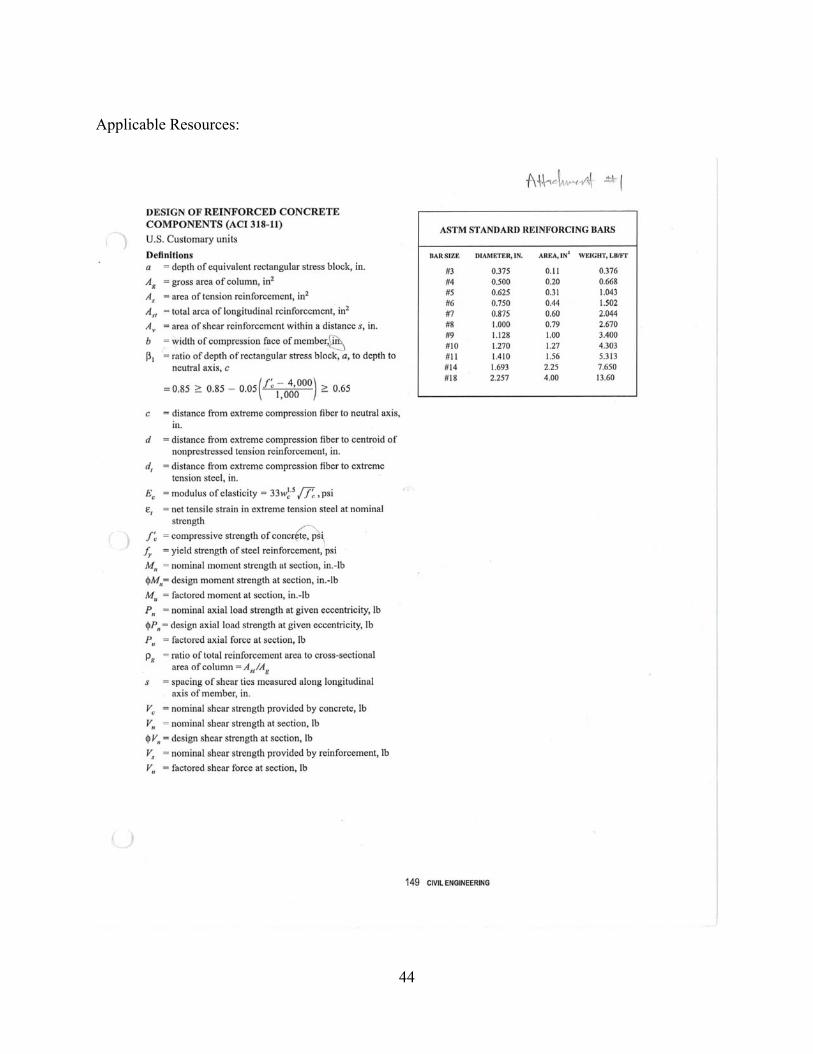
Applicable Resources:

45

46

47

48

49