Coastwatch Marine Litter Survey Results and Action to ...
26
Coastwatch Marine Litter Survey Results and Action to Tackle Marine litter for Ireland May 2019 Coastwatch volunteer citizen science autumn survey 2018 and previous litter data (1889 -2017) Recommendations are based on survey data trends, surveyor ideas and action in other EU member states and relevant to EU policy and legislation. Final draft by Karin Dubsky and Angel Duarte Campos in association with Antoine Warrant, Michael Walsh, Roslyn Shaw, Rory Keatinge, Trevor Orr and Bernie Connolly. Coastwatch Coordination, Department of Civil, Structural and Environmental Engineering, This publication may be reproduced in whole or in part and in any form for educational and non-profit, non- commercial purposes without special permission from Coastwatch, provided acknowledgement of the source is made. Coastwatch would appreciate receiving a link to, or copy of any publication that uses this publication as a source.
Transcript of Coastwatch Marine Litter Survey Results and Action to ...

Coastwatch Marine Litter Survey Results
and Action to Tackle Marine litter
for Ireland
May 2019
Coastwatch volunteer citizen science autumn survey 2018 and previous litter data (1889 -2017)
Recommendations are based on survey data trends, surveyor ideas and action in other EU member states and relevant to EU policy and legislation.
Final draft by Karin Dubsky and Angel Duarte Campos in association with Antoine Warrant, Michael Walsh, Roslyn Shaw, Rory Keatinge, Trevor Orr and Bernie Connolly.
Coastwatch Coordination, Department of Civil, Structural and Environmental Engineering,
This publication may be reproduced in whole or in part and in any form for educational and non-profit, non-commercial purposes without special permission from Coastwatch, provided acknowledgement of the source is made. Coastwatch would appreciate receiving a link to, or copy of any publication that uses this publication as a source.


Content
Introduction ............................................................................................................................................... 1
A - OVERARCHING RECOMMENDATIONS .................................................................................................. 2
Prevention ............................................................................................................................................. 2
Knowledge and Avoiding New Problems ............................................................................................... 2
B – Select Marine Litter Types and Key Actions Recommendations .......................................................... 5
B.1. LARGE ISSUES .................................................................................................................................. 5
B.1.1. Land Fill Materials and Erosion Control ................................................................................... 5
B.1.2. Fly tipping ................................................................................................................................ 6
B.1.3. Dumps built into Coastal and transitional water landfill sites - Recent, Old and Historic ........ 7
B.2 Work Related ................................................................................................................................... 8
B 2.1 Used tyres ................................................................................................................................. 8
B 2.2 Farm film/net wrap plastics ...................................................................................................... 9
B 2.3 Ropes and dollies .................................................................................................................... 10
B 2.4 Fishing Pots and traps ............................................................................................................. 11
B 2.5 Aquaculture gear .................................................................................................................... 12
B.3 CONSUMER WASTE ....................................................................................................................... 13
B.3.1 Sanitary Waste: ....................................................................................................................... 14
B.3.2 Drinks containers .................................................................................................................... 15
B.2.5 Balloons .................................................................................................................................. 19
B 3 MICRO LITTER (and particularly troublesome materials) .............................................................. 20
B.3.1 General ................................................................................................................................... 20
B.3.2 Polystyrene as specific micro litter source and problem ........................................................ 21
B 3.3 Fibres - Geotextile ................................................................................................................... 22

1
Introduction
From Coastwatch surveyor comments, marine litter results are most frustrating for those involved in clean ups. Individuals, community groups and local authorities make the effort, but the marine litter just keeps on coming. Bottle lids, rope and polystyrene have even increased lately around Ireland. With slow degrading plastics dominating, the amount of marine litter in our oceans is predicted to continue to increase unless a platter of measures are taken across the world. The EU plastic strategy and action proposed on foot of it, is the most welcome recent EU development. We can turn the tide on litter and the recommendations here are to help achieve that.
Source and Sink
Coastwatch survey results including surveyor comments suggest that most of the time, litter we see on our shores has its origin in the region, whether coming from immediate land, down a waterway, or arising in the local marine area. Additionally, there are hydrological and weather effects, where tides, currents and winds move litter around as between the US and Europe, Scotland and N Ireland, or in an estuary like the Boyne, where Louth surveyors note Meath waste deposited on their shores at Baltray.
Change in Litter
Where significant reduction in a type of litter has been recorded the cause is usually clear: provide sewage treatment and sanitary waste disappears off the shores in that area; the RoI plastic bag tax caused a drop in shopping bag litter from a peak 34 to 4 bags/km in 3 annual surveys and since then it has stayed low. Other smaller but still noticeable changes for better or worse are also worth noting: – an increase in waste collection charges is considered the key cause for a sudden spike in fly tipping. Depending on shore type and source, a greater &/or well targeted cleaning effort can generate a reduction in marine litter locally.
Over the thirty years of Coastwatch surveying we have also seen change in litter reflecting changes in what we use - baler twine loops for hey and straw bales were common in rural areas. As farmers changed to large round bales in net wrap and silage in plastic film the twine loops became rare while the new net and sheet farm plastics started to be reported.
Twenty years ago, nobody talked about micro litter. While some was there, we have no quantitative data. The inclusion of micro litter in Coastwatch surveys only started in 2013. Our new app to record micro litter location and images with date/time should help us find local sources and information on sinks. It opens options to spill incident alerts when a spike of nurdles is first noted on a tide line.
The waste and litter recommendations in this booklet start with overarching points on prevention at source and a proposal for a more systematic prevention and targeted clean up action approach ‘SCALP’. Specific waste material and litter prevention fand mitigation measures are then presented. This list is not exhaustive, but reflects the materials and items selected as troublesome by Coastwatchers. Most but not all of these are going to be covered in EC legislative proposals in coming months and in the EU plastic strategy.
Figure 1. Senator Grace O Sullivan; Coastwather, legislator and educator.

2
A - OVERARCHING RECOMMENDATIONS
Prevention
Hugh effort and cost go into staying on top of age-old problems like fly tipping and making bathing beaches look clean. Occasionally there is action to target the source of a particular type of litter like the RoI plastic bag tax. The NI Marine litter strategy with action planning, regular review of progress with a wide range of stakeholders and published updates is considered a good example of keeping everyone informed and motivated. Now the EU plastic strategy going through consultation and European Parliament debate in 2018 is to put plastic waste prevention and strategic marine litter management to the fore.
Knowledge and Avoiding New Problems
Man is inventive and it is predictable that we will continue to invent new materials, gadgets and find novel ways to use established goods and materials. It can be subtle like a new additive to improve the character of a product for the user, without thinking of the waste, just like plastic microbeads were added to our toothpaste and body scrubs. Addressing unintended side effects as they arise and battling with industry which has invested in the product can be avoided by better early apt impact assessments.
Coastwatch urges the adoption of a mandatory assessment process to screen out potential new marine litter materials and objects as a horizontal measure for MSFD implementation and as an explicit part of the plastic strategy. This can be split into many sub-measures:
- EIA Directive clarification and added guidance to ensure any screening and EIS of plans and
projects includes assessment of marine litter risk.
- New products, materials and novel use of objects to be audited for potential micro litter and
marine litter impact
- and existing ISO and other standards (e.g. the ISO standards for building materials, erosion
control geotextile and children’s toys) reviewed for marine litter risk.
Law enforcement with restoration needs to become the norm. If someone places tyres or demolition waste on the coast, then that must be reversed. Ignoring it or taking court action which ends in a nominal fine without addressing the problem is supporting bad practise. For waste removal in sensitive habitats expert guidance is needed to minimise collateral damage.
Law enforcement must be seen to be fair and extend to authorities. Fishermen argue that inadequate waste reception facilities are the reason why some burn waste including plastic nets and leave empty oil containers around. Harbour waste management plans are not the issue. There are many which look good on paper. But drafting them with public participation and ensuring full implementation and enforcement is a major challenge which needs careful planning, enough staff to maintain and adjust facilities, monitor and give feedback. A harbour reward scheme as piloted by Coastwatch and Tidy Britain may be particularly useful in small fishing and recreational harbours.
Micro litter is now a major concern. We know from surveyor comments and Coastwatch results that as the citizen eye gets used to looking for it, micro litter becomes noticeable on the tideline, in the spashzone, in seaweed. Studies are mounting on micro litter ingestion by marine biota. Agreed methodologies for monitoring are beginning to emerge. Once food standards develop for maximum or even guide levels of plastic contamination of sea vegetables, shrimp and shellfish, it may change our fisheries and especially filter feeder aquaculture industry and effect marine spatial planning.

3
A comprehensive Marine litter reduction policy is needed and the EC waste policy and draft plastics policy should lead in that.
After prevention and reduction of waste at source – we still need to tackle what does make its way to the sea. Below is a first outline of a new way to approach marine litter clean-ups.
Shore Litter and Litter Profiles - SCALPs - Shore Character and Litter Profiles by Karin Dubsky
Litter reduction is like leading an army against waste and litter – it requires strategic thinking with sufficient knowledge and understanding of our coastline, sources of litter and those who produce and handle it. The OSPAR litter count method focussing on open shores should provide trend data (if enough shores are included in the monitoring) for widespread litter like drinks containers, rope or polystyrene. In the context of Marine law (MSFD) we may be able to see are these items becoming less frequent as action is taken. However, this OSPAR data is not adequate to inform us about local fly tipping or landfill, or any bay or estuarine litter, which is where most aquaculture and farm litter was found. The concern then is that if not reported, it will not be addressed either.
This is one advantage of Coastwatch volunteers travelling to all types of shores, providing a more rounded picture of marine litter sources, sinks and hence looking at a wider range of actions to bring us to Good Environmental Status. Our island coast is complex and has many different local sources of litter. Here just two examples where knowledge of a problem and tailor-made action is required:
Example 1: We have over 40 historic coastal landfill sites which aren’t that obvious, as many are not even marked in county development plans (e.g. the Bray dump just south of Bray harbour). Risk informed monitoring needs to be put in place to ensure the sea doesn’t quietly come in and mine them. Reinforcement of seaward side may be needed and where a dump is clearly giving rise to pollution as in Bray, it needs to be acted on swiftly – in this case we propose - removed.
Example 2: A natural coastal rock alignment set like teeth in the way of the prevailing winds can create a perfect natural shredder of large plastics into micro plastics as seen in Oranmore Co Galway, where the shore is even locally known as ‘the shredder’1*. Unless we apply ourselves to catch macro litter before the sea shreds it here, we will not be able to tackle micro litter and indeed are likely to have inedible seafood in this area.
In an attempt to address marine litter arising out of coastal character and human behaviour in a more structured way, Coastwatch results and surveyor comments were set out in a more structured frame as Shore Character And Litter Profiles (SCALP) - see table overleaf. The draft Coastwatch SCALPs are to help us efficiently describe shores and litter profile or problems, to better formulate risk, prevention, monitoring, and management, as well as appropriate law enforcement actions. If this proposed system is tried and found to work well for authorities and general public, it could be presented as a SCALP map layer for CZM and inform action as well as monitoring and assessment.
1 Coined by Brian MacSuibhne describing his Mayo beach

4
Clean Shores typically
due to erosion or scour
Most of our shores ...
are somewhere on a sliding scale between Naturally Clean and Deposit hotspots. This is determined by geography, hydrology and local coastal weather patterns. Drift wood and other natural material would be washed up on the D shores even if there is no litter. Whether D stands for Dirty or rich Deposit of high value to natureds on us!
Deposition Hotspots
C Shore
‘Surprisingly little litter throughout the year in contrast to other areas, incl. some remote areas I known elsewhere’. (23-3-6-8)
D shore
Very densely littered unit - possibly an accumulation point for Belfast Lough, as direct littering is very unlikely to be a problem here’.23-2-20-2
SHORE LITTER PROFILES SURVEYOR QUOTES FROM SUCH SHORES ACTIONS
1. Seasonally/event littered (usually by visitors)
‘Summer tourist debris buried or swept away. Looks pristine compared to summer.’
(8-18-134-7)
Shore actions being pursued by authorities, Tidy Towns and Communities working well to clean up, but need more prevention.
2. Accessible shores
(i) which attract fly
tippers like flies,
(ii) waste brought
here to burn
’Lots of fly tipping from seawall - litter then gets lodged and becomes inaccessible’ (23-2-20-2)
‘Behind the clean harbour front’
‘after burning, a plastic veneer on the rocks’. (8-10-125-2)
Catch the culprit, give serious penalties! Good information on harmful and hazardous plastic fumes and micro litter creation. Ensure waste disposal alternatives are adequate (e.g. for small harbours)
3. Shores where the
sea ‘empties her
hoover bag’ *
as macro waste
as micro litter
‘A lot of mixed rubbish and micro-plastics on the upper shore, in the storm tide mark’
‘ locally known as ‘ the shredder’ as waste is bounced around and around between rocks
until broken down into micro litter’
Surveillance, reporting and organised clean ups to tackle the litter load and avoid micro litter formation on all such shores. Design schemes for inaccessible coast - fishermen key participants
(i) Fingerprint shores
where a litter point
source can be
identified. (or a
group/sector source)
‘Bags of Gigas Oysters washing up after every storm’ (8-18-232-2)
‘This ‘closed’ landfill site is still open to the sea to take what it wants’, (8-5-6-6)
‘Fertiliser sacks from farm above the shore’
Detective work to ID source where necessary and clear responsibilities for enforcement agencies. Replace authority ‘may’ act by ‘shall’ act in law to ensure sources are addressed.
(ii) Discharge pipe or
inflow brings litter
from land source
‘baby wipe strings from storm water overflow pipe’
Inflow needs to be monitored, offending material addressed at source and as shore clean action.
(iii) Waste to Shore for a
purpose.
‘Tyres and PVC pipes used as peeler crab traps’ (8-7-41-4)
Demolition waste used as erosion control.
This requires clear policy, public information and well publicised enforcement
(iv) OTHER Did we miss one?
Figure 2. Shore Character And Littering Problems (SCALP) key to aid shore description, litter monitoring, follow up actions and recognition. A given shore is first described by general character, like wind directions C, CD, CCD, etc. followed litter problem(s) e.g. C2i is a naturally scoured clean shore, but for fly tipping. Design Karin Dubsky (2017)

5
B – Select Marine Litter Types and Key Actions Recommendations
Now follows a selection of waste types and sector generated items found and highlighted during our survey, where at least partial solutions are available and put forward. In some cases, the solution is proven – like a deposit on return system for drinks containers, in other cases the action includes a research element.
B.1. LARGE ISSUES
In Coastwatch survey questionnaire and prevalence order from large to small waste and litter. Recommendations set for items arising mainly from land, followed by mixed and arising at sea.
B.1.1. Land Fill Materials and Erosion Control
With sea level rise and more threats of flooding people will seek to protect land and use a wide variety
of means and materials. We have no national erosion management policy in Ireland and legislation is grey
once one reaches the seashore – foreshore interphase. Law enforcement also runs very thin in this area.
This creates the perfect environment for all kinds of everything to be thrown at the shore – demolition
material, or earth and stone, mixed with plastic sheets and garden waste are common. Even where there
is a permit to create a larger dyke like the embankment in Arklow, Co Wicklow, or Drivers Dyke in
Tramore, some loads of the material used to fill the dyke can be riddled with waste.
Figure 3. Presence of ‘Landfill materials’ (percentage of survey units where found) from 1989 to 2018.
Figure 4. Erosion and flooding threats perceived by surveyors (percentage of s.u. where noted) from 1989 to 2018
ACTIONS:
1. Clarify legislation and update the Foreshore Act.
32
,2
21
,1 23
,0 26
,9
27
,2
24
,1
22
,5
32
,8
26
,1
18
,4
19
,0
20
,3
18
,5
19
,6
19
,6
24
,9
23
,2
0
5
10
15
20
25
30
35
% o
f su
rvey
un
its
13
,8
14
,9
21
,0
17
,7 21
,1
21
,3
29
,3
27
,3
17
,0
16
,4
17
,2
26
,7
17
,2
22
,8
23
,7
29
,1 31
,2
29
,9
0
5
10
15
20
25
30
35
% o
f su
rvey
un
its
Erosion Flooding

6
2. Bring in an erosion management policy as part of climate change adaptation
3. Ensure erosion control measures are free from plastics as most erosion control is temporary and
plastic leakage as well as hazardous materials needs to be prevented (see B.1.4.)
4. Set up a ‘coastal information and enforcement unit’ between departments and staff it well to
produce information, monitor and enforce legislation in the coastal zone.
B.1.2. Fly tipping
Household waste dumping is now less common than at peak level when waste collection charges were first introduced and this year’s Coastwatch results show a reduction to 7% of shores where fly tipping was reported, which may in part be due to quicker clean up action. Further research carried out by the Kerry Coastwatch coordinator highlights it is persistent problem which will need a number of actions to see a significant reduction.
Figure 6. Presence of “Household furnishings” (percentage of survey units where found) from 1989 to 2018.
ACTIONS:
Fly tipping: Added to the huge effort which local authorities have rolled out over the years including cameras in key spots, waste reporting app, litter wardens and clean ups we suggest:
1. a quarterly local authority organised free ‘large waste collection service’,
2. easy to find clear website information where large difficult to store items - like matrasses - can
be taken, if these are not accepted in recycling centres
23
,8
19
,6
23
,6
21
,1
21
,5
19
,6
17
,0
24
,1
20
,5
13
,0
7,7 8,4 8,7
14
,3
12
,8
11
,1
8,6
0
5
10
15
20
25
30
% o
f su
rvey
un
its
Figure 5. Demolition waste and landfill materials to protect the land against erosion in Bannow Bay and Cork- by Noel Leahy (left) and Anna Aherne (right)
7
3. Court deterrent - a new approach: Fly tipping offenders brought to court should as a rule be
responsible for cleaning up own or nearby fly tipping in a set time with correct disposal and a
return to court to confirm it is done. Additionally, a fine could be imposed at this second stage,
informed by the speed and quality of clean up compliance.
The just announced government 2 million anti-illegal dumping initiative and the scope including surveillance is warmly welcomed. If now we could also increase and smarten up the penalties as proposed in Action 3 above.
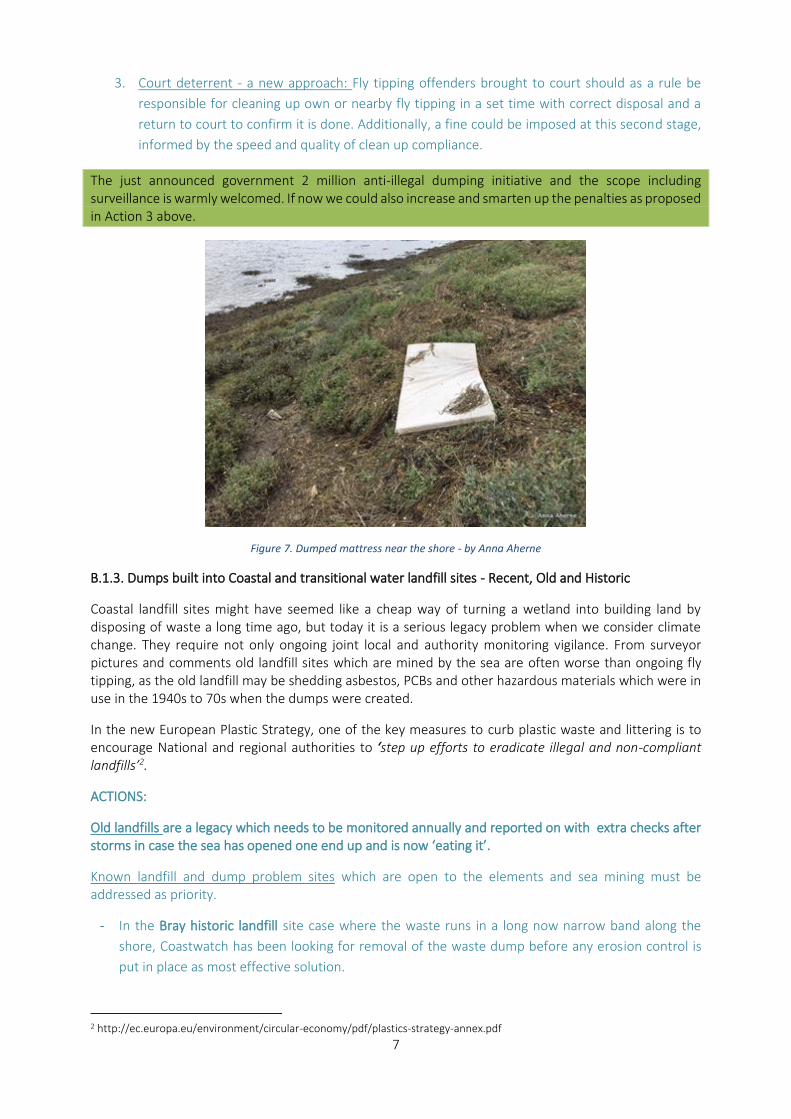
Figure 7. Dumped mattress near the shore - by Anna Aherne
B.1.3. Dumps built into Coastal and transitional water landfill sites - Recent, Old and Historic
Coastal landfill sites might have seemed like a cheap way of turning a wetland into building land by disposing of waste a long time ago, but today it is a serious legacy problem when we consider climate change. They require not only ongoing joint local and authority monitoring vigilance. From surveyor pictures and comments old landfill sites which are mined by the sea are often worse than ongoing fly tipping, as the old landfill may be shedding asbestos, PCBs and other hazardous materials which were in use in the 1940s to 70s when the dumps were created.
In the new European Plastic Strategy, one of the key measures to curb plastic waste and littering is to encourage National and regional authorities to ‘step up efforts to eradicate illegal and non-compliant landfills’2.
ACTIONS:
Old landfills are a legacy which needs to be monitored annually and reported on with extra checks after storms in case the sea has opened one end up and is now ‘eating it’.
Known landfill and dump problem sites which are open to the elements and sea mining must be addressed as priority.
- In the Bray historic landfill site case where the waste runs in a long now narrow band along the
shore, Coastwatch has been looking for removal of the waste dump before any erosion control is
put in place as most effective solution.
2 http://ec.europa.eu/environment/circular-economy/pdf/plastics-strategy-annex.pdf

8
- In Dublin city landfill site where the Ringsend dump is far too large to move and the edges are less
erosion prone, the vulnerable spots should be fitted with a dual purpose erosion control and nature
enhancing/supporting project.
NB -Follow up work on the Dublin Ringsend site has commenced and Dublin city Council’s approach with joint Coastwatch and council staff fieldtrip to scope the issues was exemplary.
Figure 8. Mystery item and cliff erosion in Bray Dump - By Roslyn Shaw
B.2 Work Related
B 2.1 Used tyres
Our survey results indicate an increase in used tyre spread on the shore and numbers counted. Tyres brought to the shore for a secondary use are in contravention of tyre waste regulations. In some areas – e.g. Wexford Harbour and Cork Harbour - the several hundred tyres are periodically added to by ‘persons unknown’ as the old ones silt up. The ‘persons unknown’ only claim ownership when meeting a rival crab collector, at other times they have ‘no idea’ of ownership. Due to Coastwatch surveyor and local farmer labour and county council support the tyres were removed in Cobh (see main report 2016 and 2017). Apart from being an unsightly waste which arrives covered in road dirt and garage oil, anecdotal evidence suggests that tyres are a preferred hiding place for peeler crabs and large scale trapping can reduce the crab numbers to such an extent that the crab collectors do not find it cost effective to drive out and check their trap lines. The majority of crab tyre traps are in Natura 2000 protected sites.
Figure 9. Presence of “Tyres” (percentage of survey units where found) from 1993 to 2018
ACTIONS:
21
,1
19
,4 21
,4 25
,7
21
,3
20
,3 23
,0 27
,4
21
,5
21
,3
0
5
10
15
20
25
30
% o
f su
rvey
un
its

9
1. Better enforcement of tyre waste legislation by local authorities to prevent diversion into the
marine environment
2. Foreshore Act enforcement by government as tyre traps are placed on the foreshore without
foreshore license.
3. Production of guidance document to minimise collateral damage when removing tyres and then
removal of all tyre traps found on the shore either by authorities or locals and authorities as joint
action by autumn 2018 in Natura 2000 sites and end of 2018 in all others, unless they are
licensed.
Figure 10. Several tyres lying in Bannow Bay – By Antoine Warrant
B 2.2 Farm film/net wrap plastics
This is a waste type is only recorded as ‘other’ but its use as both early crop protection and silage wrap and surveyor notice as ‘other waste’ are increasing. The material may also be changing in quality. Silage and heylage wrap film typically has a variety of additives to give it strength, make it UV light resistant etc. These qualities were developed to help contractors apply the wrap and farmers have a good transportable product. But typically there is no information as to what the film contains on the manufacturers website and we do not know how different makes behave when burnt, or break down when blown or left on the shore.
The European Plastic Strategy is encouraging the authorities to consider introducing an Extended Producer Responsibility, in particular to provide incentives for recycling agricultural plastics.3
ACTIONS:
Make plastic fodder wrapper return cost free for farmers in the RoI as it is in NI, to remove the incentive to forget wrappers in the field/on the shore. Farmers already pay a waste management fee in the film purchase price.
Figure 11. Farm plastic covered by gravels and wood pieces - by Darach O Murchu (left) and Anna Aherne (right)
3 http://ec.europa.eu/environment/circular-economy/pdf/plastics-strategy-annex.pdf

10
B 2.3 Ropes and dollies
This marine litter category is becoming more widespread in every survey and was recorded in 72% of survey sites in 2017. Apart from entanglement risk in larger knotted ropes and nets, modern nylon and polypropylene materials shed fibres in normal wear during use and as waste. There is rapidly growing evidence that the fibres are ingested by a range of marine life and don’t just create entanglement problems when lost or discarded. There are many rope users including fisheries, aquaculture, shipping and marine recreational uses. One perplexingly awful source is from ‘dolly rope’ where rope ends are purposely tied to the bottom of nets used for bottom trawling. As the dollies disintegrate on the sea floor in mussel and prawn fishing grounds, marine litter is created, ready for those not caught to ingest the fibre.
Figure 12. Presence of “Rope and string” (percentage of survey units where found) from 2014 to 2018.
The European Plastic Strategy will also encourage the authorities to consider introducing an Extended Producer Responsibility to provide incentives for collecting discarded fishing.
59,164,3
68,272,3 69,7
0
10
20
30
40
50
60
70
80
2014 2015 2016 2017 2018
% o
f su
rvey
un
its
Figure 13. Ropes and strings similar to seaweed or stuck on the rocks - by Shane O'Reilly (left and top) and Mick Berry (right-bottom).

11
ACTIONS:
1. Ban plastic dolly rope now.
2. A systematic substitution of materials which create plastic fibre micro litter is needed urgently
for the sake of our ocean’s nature and human health reasons. This requires research on options
with field trials (which could be suitable for EMFF project funding)
3. Introduce economic instruments in the next budget to make conversion to natural materials
affordable – e.g. weigh VAT to favour environmentally friendly options in rope mussel culture, to
encourage conversion from plastic to cotton which is available but considered too expensive.
4. Plan support for growing hemp in the next CAP so that enough local produce is available to supply
at least some of the rope and string we need and create rural jobs.
B 2.4 Fishing Pots and traps
Modern traps are made of plastic/metal nylon which can ghost fish for a long time when lost or dumped. There are no limits on number of pots in an area or per boat, except for recreational fishermen and so there are no official lobster and crab pot figures are available. A rough estimate provided by two lobster men independently one in Dublin area and one in Donegal suggested that there are over half a million pots in use at any given time in the RoI alone and that lobster and crab men with > 1000 pots would have difficulty hauling these out and finding storage space before winter storms. It may be cheaper and easier to risk loss and then buy new ones.
ACTIONS:
As with many other waste issues, a coherent set of actions are needed. To derive at those, a wider range of options should be considered, as set out here in a matrix. Those considering actions then discuss each and scope out how best to address the problem or test combinations in pilots.
Lobster, crab and whelk pots
Macro material Meso or Micro
Material
Source/ Key
Stakeholder Comment
ISSUE Fishing litter pots and traps are now made in Plastic/ metal nylon which can ghost fish if lost.
Lost pots and rope eventually break into meso/micro plastic/metal /nylon
Irish lobster industry
EMFF funding to trial traditional natural material pots and work out pot making requirements
Prevention Make pots from hazel or willow
Substitute manmade materials with natural ones which don’t cause harm if lost or discarded
Fishermen and land owners who grow the raw material
Also: There are a few operators with disproportionally large number of pots. Ensure they switch.
Reduction Reduce number of plastic pots by fisheries management and max pot number
Set a rope or chain standard which reduces loss and fibre loss
Government incentive and license control. Industry agree
Publish all relevant information and put key points into marketing materials
Figure 14. Broken fishing pot – by Louise Bailey

12
less pots and material qualities.
Speedy Clean up
Tag pots with license number
Pot and rope search and finder return reward
Enforcement anti litter action plastic litter pots
Will encourage Industry lead search after storms
Other consideration
Regulate quality and quantity via lobster fishing licenses in a fair transparent process.
More pot, catch and litter data is essential for both stock and litter management.
Government provide Legal base Reward for lost pots returned?
Set up one marine info office which logs and relays all information whether bird rings or pot tags
Figure 15. Options table to inform discussion and decision making on minimizing or eliminating plastic waste and ghost fishing arising from pot fisheries.
B 2.5 Aquaculture gear
Aquaculture is set to grow substantially in Ireland. While waste and litter conditions are standard in aquaculture licenses, apart from waste under fish cages, there is no published waste or litter data on compliance monitoring. When we sought official monitoring protocols and litter/waste results to overlay on our Coastwatch data we received nothing. We therefore have reason to believe that there isn’t actually a coherent inspection or monitoring system in place for shellfish farms on their marine litter license condition. Given that the sector is set to grow and produces a distinct type of litter there is an obvious gap here.
Farms can be monitored for defunct oyster trestles, which are a common problem, as they can be assumed to belong to the farm in whose licensed area they are, but we know of no case where an oyster or clam farmer was fined for littering. BIM have organised clean ups after Coastwatchers report problems, but while this is positive for the environment at that spot, we would be surprised if we saw organise farm clean ups instigated with tax payers money. Lost plastic gear can occupy a large area as tides and storms can carry it for miles. Even the most diligent inspector would have difficulty on enforcement action as equipment is generic and litter source could not be proven in court. So a new approach is needed.
Figure 16. Presence of small aquaculture waste (percentage of sites where found) from 2012 to 2018.
8,5
10,4
6,8 7,2
12,8 12,6
16,9
0
2
4
6
8
10
12
14
16
18
2012 2013 2014 2015 2016 2017 2018
% o
f su
rvey
un
its

13
ACTIONS:
1. A baseline survey and status of aquaculture farm litter should be commissioned and published
by August 2018. Observations should be set against license conditions.
2. A review of best practise on aquaculture waste prevention and management to be carried out as
short study to inform a new well-run aquaculture waste management approach on the island of
Ireland including the border areas. This should also cover the county council litter warden’s job
on the foreshore and seashore.
3. Building on 1 and 2, a stakeholder workshop in autumn 2018 should set out waste prevention,
monitoring and reporting of compliance with waste conditions from January 2019. From then on
annual reports will show the improvements which we must see!
4. A marking system 4for aquaculture gear should be introduced. It should be mandatory within 12
months for new plastic gear and by 2020 for all gear. This can be a seal, or sheep ear tag type, or
a stamp depending on item and put onto oyster netlon bags, clam nets, mussel stockings, trestles
and the bands to close bags. It needs to be clear so citizens can easily identify it and help track
and return lost gear after storms. It would also help identify the operators who either have poor
practise or are on an unsuitable site with too much gear loss.
Figure 17. Abandoned aquaculture gears and ropes
B.3 CONSUMER WASTE
The Single use plastic Directive ( ) has introduced significant improvements i
In the Coastwatch survey this is a grouped category for sanitary waste which has reduced dramatically over 3 decades, but now has shown three years of increases.
Irish water has a programme of building and upgrading treatment plants, but or so pe raw sewage discharges which bring every tupe of waste especially micro litter directly into some Natura 2000 sites and areas where shellfish are gathered. Photo below shows a new discharge pipe beside the old as Doldrom bay, Howth Head. The raw sewage content of pipes is the same, but the micro litter content will have increased when cotton buds, but from surveyor observations and OSPAR method more detailed surveys we prioritise flushable wipes and cotton buds.
4 This last recommendation was strongly favoured by surveyors and extra effort should be made in the review (action 2) of best practise to see if there are examples to learn from in the aquaculture industry abroad, or if Ireland could spear head this.

14
B.3.1 Sanitary Waste:
B.3.1.1 Wet wipes
A plastic product which doesn’t look like plastic and is growing rapidly, going by shelf space devoted to it. In a recent UK study5, the majority of the sewer blockage material recovered comprised of non-flushable wipes that were not designed to be flushed and should not have been disposed of via the WC. Baby wipes accounted for over 75% by weight of identifiable products.
Northern Irish authorities and surveyors highlighted the lack of impact assessment standards for a manufacturer promise of ‘flushable’. Such information leads to consumers to thinking it is safe to drop used wipes into the toilet.
Figure 18. Presence of “Sanitary waste” in the shore (percentage of survey units where found) from 1991 to 2018.
Figure 19. Presence of sewage fungus, visible sewage and sanitary litter in inflows (percentage of inflows where found) from 1989 to 2018.
ACTIONS:
1. One EU to legal definition of ‘flushable’ is needed to enable drafting controls for manufacturers
2. Government to fund a consumer sanitary material information campaign
3. Consumers must be educated to choose alternatives to fit the occasion - sea or tap water, a
cotton or paper product instead of plastic wet wipes.
5 https://www.dropbox.com/s/4d5wdcumvmgvzvs/Wipes%20in%20sewer%20blockage%20study.pdf?dl=0
18
,4
15
,2
20
,1
15
,1 17
,6
23
,6
18
,2 21
,0
21
,3
20
,6
19
,8
13
,9
12
,2
11
,9
17
,0
14
,8 17
,4
17
,9
0
5
10
15
20
25
% o
f su
rvey
un
its
0
2
4
6
8
10
12
14
16
% o
f in
flo
ws
Sewage or sewage fungus Sewage, sew. Fungus or sewage/sanitary litter
Sewage/sanitary litter &/or visible sewage Sewage fungus filamentous algae

15
B.3.1.2 Cotton buds
Cotton buds were first created over 90 years ago from wood or rolled paper with cotton wool ends. Only
in the last 2 decades manufacturers changed to plastic tube sticks, which may be more colourful and
cheaper, but pass through the sewage treatment process. On release the sticks stay in the water column
or wash up on our shores, adding to the plastic marine litter load and making beach users in areas well
away from sewage outfalls distrust water quality.
ACTIONS:
Partial Success: After significant lobby campaign by environmental groups, all large manufacturers agreed
to switch back to paper (or wood) based alternatives by end of 2017 in the UK and some other countries.
While no such commitment exists for RoI, a welcome switch to cotton on rolled paper by Johnson and
Johnson was noted in August 2017. However, in parallel the plastic stick cotton buds are still sold for less
and consumers don’t know the difference.
New Action: Coastwatch urges that:
1. As part of the EU plastic strategy cotton buds on plastic sticks should be on a ban or heavy tax
list. Affordable alternative exist which consumers accept.
2. Ireland lead with a plastic tax on the plastic stick cotton buds
3. Coastwatchers ask for the environment friendly buds next time they need them and share their
experience - where a shop has switched to the environmentally friendly version or is not doing
so.
B.3.2 Drinks containers
Drinks container litter is still the most widespread marine macro litter on Irish shores. A massive increase in shore cleaning and anti-litter campaigns reduced plastic bottle counts, but now the counts have stayed stubbornly around 18 plastic bottles/500 m of shore for several years. We need to try a new trick to reduce plastic drinks bottle litter to 1 or 2 per 500m of shore, as is recorded in countries which have a good deposit on return system - like most of the Baltic sea states and many others reviewed here https://ipfs.io/ipfs/QmXoypizjW3WknFiJnKLwHCnL72vedxjQkDDP1mXWo6uco/wiki/Container_deposit_legislation.html.
While industry and REPAK acknowledged the excellent litter control attributes in the recent Dail Committee debate, they argued it would be too costly, as most drinks containers are already recycled in Ireland. However how much is recycled, rather than down-cycled into mixed plastics objects or fed into the county Meath or Dublin city incinerators is not easy to establish. The figures we sought have not been made available yet.
A deposit on return is an incentive where consumers first pay a deposit and then redeem it when they bring back empty containers to shops which sell drinks containers. If drinks containers are dropped or lost, others are ready to pick the litter up to get the reward in shops or return machines.
According to the European Plastic Strategy: ‘Targeted deposit schemes can help reduce littering and boost recycling, and have already helped several countries6 achieve high collection rates for beverage containers.’. For Danish example see http://www.dansk-retursystem.dk/en/
In countries where that law is in place – like Germany - the marine litter load is near zero. Coastwatch Europe survey results already showed that from in 1990 onward!
If we continue with just words and litter picking then to quote from the EC7
6 The five best performing Member States with deposit schemes for PET bottles (Germany, Denmark, Finland, the Netherlands and Estonia) reached an average collection rate for PET of 94% in 2014. 7 http://ec.europa.eu/environment/marine/good-environmental-status/descriptor-10/index_en.htm

16
Figure 20. Average number of plastic bottles counter per 500m from 1991 to 2018.
‘Marine litter is also one of the clearest symbols of a resource inefficient economy. Valuable materials are polluting our beaches and damaging our environment instead of being pumped back into our economy. Therefore, a circular economy approach which puts the emphasis on preventing waste and on recycling and reuse of materials and products in the first place, is the best solution to the marine litter problem’.
While NI is ahead of the RoI with its Marine litter strategy and active wide sector engagement, neither government has really tackled the prevention of drinks container litter.
ACTIONS:
We are calling on governments to introduce a deposit on return system for all drinks containers and caps, as a proven method of reducing this particularly stubborn widespread litter load to near zero. A deposit on return system would be a win win action, creating jobs and supports for refill and recycling, rather than down cycling or incineration which is the standard fate of a mixed rubbish litter bag picked from the shore.
After discussing with Dutch Coastwatch partners we are proposing their target of 90% less plastic bottles on the shore by 2020 (from Coastwatch survey results 2016 to survey 2020 a 3 year time frame to get from 36 bottles/km to 3.6! ) The Dutch government has now endorsed this target.
1. Coastwatch is calling on the EU and MS to introduce a deposit on return system for all drinks
containers AND caps, as a proven method of reducing this particularly stubborn widespread litter
load to near zero.
2. A deposit on return system would be a ‘win win’ action, creating jobs and supports for refill and
recycling, rather than down cycling or incineration which is the standard fate of a mixed rubbish
litter bag picked from the shore
3. We also need easy access to drinking water quality tap water on the streets of Europe and more
well maintained public drinking fountains to reduce the need for single use ‘On the Go’ plastic
bottles and caps. Linked food container washing stations to overcome health risks of unclear
keep containers would add to authority costs and pilot studies on best practise are needed.
4. Model EU Clear and consistent labelling of plastic drinks containers and lids and public guidance
for re-cycling of caps is needed to replace the forest of icons which are almost invisible on some
items.
15
,8
11
,5
24
,5
20
,5
33
,5 36
,2
30
,7 35
,3
44
,6
27
,5
38
,2
24
,4
50
,9
27
,0 29
,9
14
,4
19
,4
18
,1
18
,1
12
,9
0
10
20
30
40
50
60
aver
age
no
of
item
s p
er s
.u.
17
5. Models and economic benefits realised in some European countries (e.g. Belgium and France)
where charities specialise in the collection of plastic bottle caps for specialised re-cycling should
be disseminated.
6. New port reception facilities for re-cycling would reduce the volume of plastic litter dumped at
sea including bottles and cap waste. Stepped up waste collection particularly near coasts is
recommended along with more harmonisation between local authorities and waste
management authorities. Improved measures to eradicate illegal and non-compliant landfills are
required.
Timing: We need to see a deposit on return system costed and introduced in the next budget by governments on both parts of this island. In the RoI such a move could be made without having to draw up new primary legislation. Hence we are asking for an SI under the Waste Act to be produced by end of 2018. A slick deposit on return system for all drinks containers and caps could be up and running by 2020 nd as a result our drinks container litter load would drop magically in 2020 – the target year for Good Environmental Status. At least on this top count and spread litter category Ireland can deliver if government acts now.
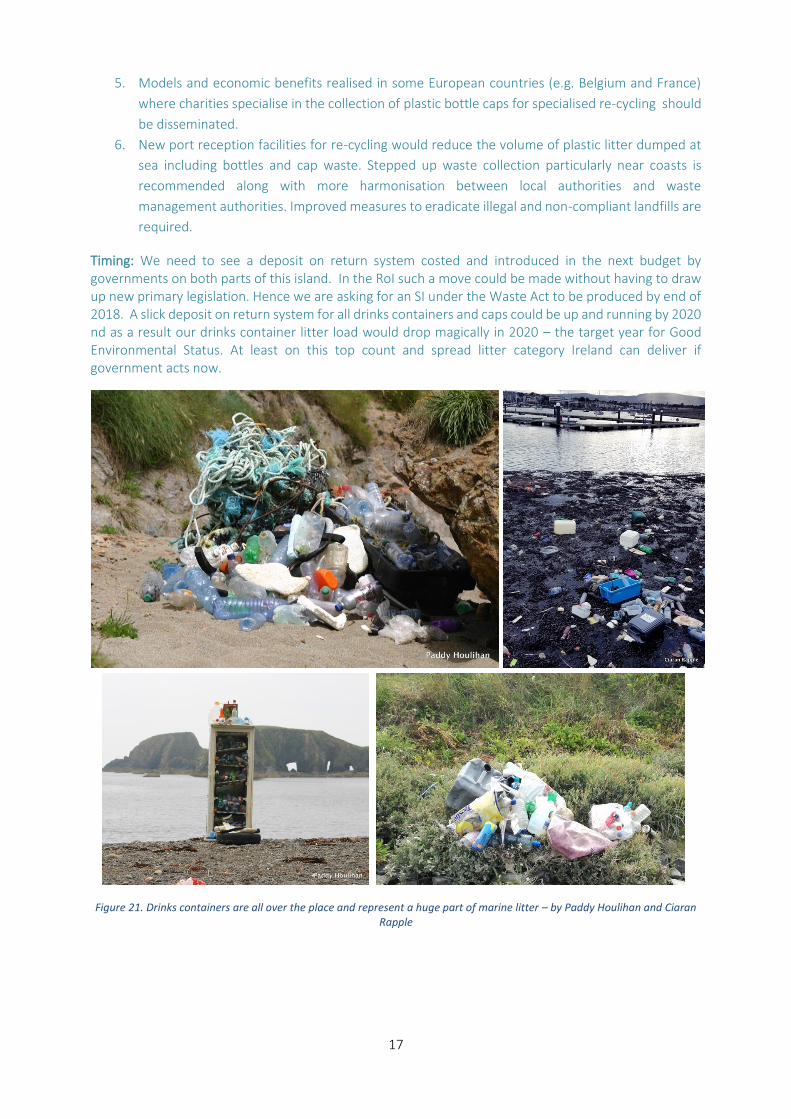
Figure 21. Drinks containers are all over the place and represent a huge part of marine litter – by Paddy Houlihan and Ciaran Rapple

18
Figure 22. Bottles lids - by Roslyn Shaw and Annie Brazier
B.3.2.2 Cans and tetrapack containers TO BE UPDATED
B.3.2.3 Single use coffee cups
Disposable cups present a growing environmental issue, including the cup and lid litter reported by Coastwatch surveyors on the shores around Ireland. The use is associated with a change of life style in urban areas, with ‘coffee on the go’ as visible sign and a new coffee culture at the seashore and events.
• After only a few minutes of use, the consumer is holding an empty container to put into a general
waste or recycling bin.
• Single use coffee cups are hard to recycle because most are composite material of paper outer
and an inner layer of plastic. (Picture 1)
• Compostable cups may seem attractive, but conditions8 needed to compost these are onerous.
Added to that -while both compostable and non-compostable cups are in use, both are thrown
into the same bins, thus blocking composting.
• Starbucks use disposable cups. Ireland has the largest number of Starbucks per inhabitant9 in
Europe (15.3 Starbucks per 1 million)
• There is a lack of data on single use drinks packaging waste in Ireland. The ‘2 million disposable
coffee cups sent to landfill sites in Ireland every day’10 is widely used but the base is unclear and
one would assume that much of it is sent to the new incinerators. Requests for information on
disposal yielded little information.
In a Coastwatch survey of drink container use, a total of 4290 people were observed over 5 days (5th-9th of February 2018) in Dublin. Of these 236 (5.5%) were carrying a disposable cup, 217 (5.1%) were seen carrying single use plastic bottles or cans and only 124 (2.9 %) were seen carrying reusable cups or flasks.
8 They need >60°C, the right humidity (>80%), the right micro-organisms not standard compost heap biota. 9 https://www.silverdoorapartments.com/blog/which-country-has-the-most-starbucks-per-1000000-inhabitants/ 10 https://www.irishtimes.com/news/ireland/irish-news/cork-city-becomes-first-council-to-stop-using-disposable-cups-1.3351827

19
So more than 2/3rd of people seen carrying a drinks container had a disposable one - see fig 1.
Figure 23.Photo showing that after soaking the single use cup which looked papery one can rub off the paper and see the plastic and chart showing the number of people carrying different drink containers (N=4290)
Recommendations and Measuring Progress:
• Government: introduce a ‘latte levy’ this year- i.e. a charge on single use cups and lids which the
consumer pays when buying a beverage in one. The money collected goes into the Environment
Fund like the plastic bag levy. The tax encourages the consumer to bring their own reusable cup and
supports shops which offer their drinks in traditional long life cups.
• Shops/cafes use traditional cups and/or offer a discount to those bringing their own mugs.
Conscious cup campaign11 lists where discount is offered. In TCD ‘the Perch’ offers the best discount
40c/cup.
• You and people you can persuade, get and show off your reusable cup/flask if you need coffee on
the go. There is a super selection out. Think of material, function and design - including leak proof.
• Set Goals and Measure Progress: e.g. can the TCD community invert its cup use ratio over 2 months:
5 single use cups: 3 reusable cups/flasks ➔ 3 single use cups : 5 reusable cups/flasks .
B.2.5 Balloons
Balloons are avoidable marine litter which may have a place as a party product indoors but not outside as it causes serious injury when ingested by wildlife and/or plastic balloon string commonly used entangles animals. While marketed as biodegradable, latex balloons stick in guts of animals which have ingested them. For Coastwatch briefing paper see appendix 2. Coastwatch coordinators who have studied this problem are happy to help with alternatives to mass balloon releases. In this context we commend Trinity College Dublin for first supporting research and then introducing this ban as part of the college management code in 2016.
Figure 24. Abandonned balloon found by Julie Kendall
11 https://consciouscup.ie/map/
Single-use cup; 236
single use Plastic bottle, 217
Reusable cup or flask; 124

20
ACTIONS:
1. We urge government to add a balloon release control sub measure under the MSFD.
2. We ask local authorities and schools/colleges not to permit mass balloon releases in their area
and set this out in agreed policy.
3. We ask individuals not to buy gas balloons for charity releases and speak up for good alternatives.
Figure 25. Picture 15: How much marine litter do the organisms contain, which are then eaten by the Chough and the Oyster catcher? By Nuala Freeman
B 3 MICRO LITTER (and particularly troublesome materials)
B.3.1 General
Surveyors found that most micro litter they saw was produced by larger objects disintegrating: - in first position was filament from rope and string, then flakes of plastic and then polystyrene objects turning into polystyrene beads. Hard plastic pellets or ‘nurdles’ which enter the marine environment in that form as raw or recycled plastic sources were also widespread. These and the micro beads highlight that we have no idea how much micro litter is out there, cannot or do not see most of it and are dealing with a huge range of micro litter sources.
ACTIONS:
1. Reduce and where possible eliminate known sources of micro litter. (An EPA funded review of
micro litter is expected and more detailed action will be discussed then).
2. Introduce interim green grants, incentives &/or taxes to aid conversion where plastic alternatives
are known but now too expensive - like the mussel long line cotton stocking versus the plastic
one.
3. Where a plastic product, or packaging is not substituted in the short term, insist clear content
information including additives are on the product (or with link to website) by end of 2018.
4. We recommend a range of urgent research followed by a micro litter summit in one year’s time
to prioritise action. Studies to feed into that to include:
• a field study of possible nurdle sources including plastic shredder/pellet production
facilities, coupled with a targeted citizen science micro litter campaign to map pellet litter
occurrence and density against any uses and spillages reported.

21
• study of micro litter levels – ambient shore sediments, sewage sludge and receiving
organism including seafood, so we rapidly gain better insight into this problem and best
ways of tacking it.
• plan and start drafting micro litter standards for sea food – starting with filter feeders
like mussels where research has shown a range of contamination levels.
• review/ revise ISO standards for products and materials used in coastal and river
environments such as geotextile and moorings, regarding plastic micro plastic leakage.
Figure 26. Micro litter on the sand - by Manuela Dei Grandi
B.3.2 Polystyrene as specific micro litter source and problem
Polystyrene beads rank second after rope filaments as visible micro litter observed by surveyors in the 2016 survey. Large pieces were recorded most frequently i them and lab experiments have shown they then lose fertility. Waders and flat fish feed on sand hoppers so the polystyrene and other micro litter is also likely to pass up the food chain. Despite of this we can observe ever new applications for this blown plastic material, which is rarely recycled. The most likely to contribute to marine litter include moorings in marinas which can be several meter large blocks, floats, fish boxes, single use packaging and water sports gear like surf boards and cups.
ACTIONS:
Either legislation halting, or severely taxing polystyrene use for objects, like fish boxes and single use cups
is needed. If taxing then the funds raised could be directed to support testing and marketing substitution
materials and objects with acceptable environmental impact.
The time frame will have to be determined by product category but the conversion should be complete
with sale prohibited by 2020, unless a specific timed derogation allows a longer phase out.

22
Figure 27. Polystyrene in all its forms: big blocks and small pieces - by Louise Bailey, Manuela Dei Grandi, Anna Aherne and Rory Keatinge
B 3.3 Fibres - Geotextile
There is a booming use of geotextiles as erosion control rock armour or cement block underlay. It is also used as road and path underlay.
Geotextile was then added as a separate litter item in the 2017 survey form and in this first survey was recorded in 4.3% of survey sites. Bearing in mind that smaller pieces may look like old rags and pieces which are fouled by seafloor biota and sand are very difficult to see, this is likely to be an under estimate of larger items. Fibres would be very unlikely to be noticed in field observations, as in contrast to the brightly coloured rope fibres, geotextile fibres tend to come in neutral tones. All geotextile sent to us or where surveyors sent photos were made of synthetic fibres - generally plastic.
We could not find any published study of geotextile marine impact, but use as described above is booming. The potential impact is huge as there is geotextile ‘leakage’ into water ways and sea . Plastic fibres rub off when erosion works are being worked by wind and waves (see fig 2) Once these enter the coastal rim a range of biota can take it up as we have seen in a growing number of studies ( see rope fibre references above).
Larger pieces have been recorded ‘forgotten’ when erosion works are finished and torn off in storms and when the rocks in erosion control schemes move. They get washed out to sea, settle on the seafloor where they act as temporary substrate for bryozoans and other seafloor inhabitants. However based on Cosastwatcher findings on the shore, these pieces seem to be easily moved in storms and either swept up or relocate, potentially smothering other biota as they settle on a new area of seafloor. Both large plastic pieces and fibres have the potential to attract and concentrate background pollutants which once eaten by a wide range of important species at the bottom of the food chain. Consequently concerns are being raised about their potential to provide a means for these harmful chemicals to enter the human food chain and thereby impact not only on the marine life but also on the overall health of humans.

23
Figure 28. Geotextile are all over the places – Photos by Karin and Paul Dubsky
ACTIONS
1. Produce information and guidance for local authorities on risks of plastic base geotextile & alternatives.
2. Stipulate environmentally sound, non plastic erosion control use in planning permissions and
foreshore permits by end of 2018.
3. Provide support for local authorities to lead by example and trial different natural solutions which
can act as demonstration sites.
4. Review and revise ISO standards for geotextiles to eliminate the risk of plastic micro plastic
filament leakage into water ways and the marine environment.
Natural fibres as an alternative to geotextiles for coastal protection - by Dr Trevor Orr TCD
Natural fibres offer a benign alternative to synthetic fibres that can be used to protect beaches from erosion or as path underlay. One natural fibre that can be used is jute geotechnical fibre (JGF). Jute is a fibrous plant, see Figure 2, which is mostly grown in India, China and Bangladesh. Another natural fibre that can be used is coir, which is coconut fibre material found between the hard, internal shell and the outer coat of a coconut. Coir is one of the strongest and most robust erosion control options available and is used in products such as mattresses, blocks and logs as shown in Figure 3.
Inappropriate coastal stabilization methods, such as hard structures, can do more harm than good by exacerbating beach erosion, damaging neighbouring properties, impacting marine habitats, and diminishing the capacity of beaches, dunes, and other natural landforms to protect inland areas from storm damage and flooding. Natural fibres provide soft structures that can stabilize an eroding coast in an effective and sympathetic manner. The level of protection provided by a stabilisation method depends on the option chosen, the design details and site-specific site conditions such as the exposure to storms. All options require maintenance and many also require mitigation measures to address possible adverse impacts on the coastal system.
Figure 29. Coastal protection materials left to right: Plastic Geotextile underlay for rock armour and concrete blocks , : Jute plants, Coir logs used in coastal protection.