Coastal erosion investigation and management options...
31
Coastal erosion investigation and management options for South Mission Beach, Cardwell Shire
-
Upload
hoangduong -
Category
Documents
-
view
220 -
download
0
Transcript of Coastal erosion investigation and management options...

Coastal erosion investigation and management options for South Mission Beach, Cardwell Shire

Disclaimer:
While this document has been prepared with care it contains general information and does not profess to offer legal, professional or commercial advice. The Queensland Government accepts no liability for any external decisions or actions taken on the basis of this document. Persons external to the Environmental Protection Agency should satisfy themselves independently and by consulting their own professional advisors before embarking on any proposed course of action.
© Environmental Protection Agency RE508 August05Visit us online at www.epa.qld.gov.au

�Coastal erosion investigation and management options for South Mission Beach, Cardwell Shire.
Contents�.0 Introduction ........................................................................................................................ 22.0 Study area and site description ........................................................................................... 33.0 Coastal erosion issue .......................................................................................................... 54.0 Data collection and analysis ................................................................................................ 7 4.1 Investigationoflocalcoastalgeomorphologyandimplicationsforpresentday coastalprocesses...................................................................................................... 7 4.2 Comparisonofhistoricalshorelinepositions............................................................10 4.3 Waterlevels.............................................................................................................13 4.4 Waveclimate............................................................................................................13 4.5 Sedimenttransport..................................................................................................13 4.6 Beachprofileanalysisandchanges..........................................................................15 4.6.1 Comparisonofsurveyprofiles..................................................................................15 4.6.2 Potentialshorelinerecessionfromfuturestormerosion............................................ 17 4.7 Effectsofstormwaterdischargeonbeacherosion....................................................185.0 Key findings on erosion ......................................................................................................�96.0 Erosion management options for South Mission Beach .......................................................�9 6.1 Managedretreat.......................................................................................................19 6.2 Beachnourishment................................................................................................. 20 6.3 Localsandrelocation.............................................................................................. 23 6.4 Revetments............................................................................................................. 24 6.5 Groynesandartificialreefs...................................................................................... 257.0 Conclusions ...................................................................................................................... 268.0 Recommendations ............................................................................................................ 269.0 Additional information ...................................................................................................... 27 9.1 Statutoryobligations............................................................................................... 27 9.2 Stateassistancewithfunding.................................................................................. 27�0.0 References ........................................................................................................................28
List of figuresFigure 1. Locality plan of South Mission Beach including marine park and other protected areas. ........................................................................................................... 4Figure 2. Morphostratigraphic units of the dune areas from the Hull River to WongalingBeach–1951photography.(source:EPA) .................................................... 8Figure3. SoilprofilesoftheTamO’ShanterPointdunefield.(source:EPA) ..................................9Figure4.HistoricalaerialphotosofSouthMissionBeach1951to2002.(source:EPA) ................. 11Figure5. Changesinshorelineposition1951to2002. ................................................................12Figure 6. Location and number of survey lines. ...........................................................................14Figure7. Beachprofileateachsurveylinerecordedon22September2002 ................................15Figure8. Typicalbeachprofiles..................................................................................................16Figure9. Distanceofthehighestastronomicaltideleveltothe-1.0mcontour atSeptember2002. ....................................................................................................16Figure10.Estimatedshort-termbeachprofileresponsetoa1in100ARIstormevent basedonVellinga1995). .............................................................................................18Figure11.Indicativedesignnourishmentprofilesbasedonsandnourishmentvolumes providedintable3tofillerosionalloss. ..................................................................... 22
List of photosPhoto1. KennedyEsplanadeshowingtherelativelynarrowwidthofundevelopedesplanade seawardoftheroad.(source:EPA) ............................................................................... 3Photo2. PoorlyconstructedrockwallatthesouthernendofSouthMissionBeach. (source:EPA) ............................................................................................................... 5Photo3. BeachconditioninJune2001followingseaerosion.(source:EPA) ................................ 6Photo4. BeachconditioninNovember2003followingseaerosion.(source:EPA) ....................... 6Photo5. BeachconditioninMay2004followingseaerosioninMarch2004.(source:EPA) ......... 6Photo6. NorthernendofSouthMissionBeachfollowingerosioninMarch2004. Notethebroadintertidalzoneandhigh-tidebar.Itwouldbeexpectedthatthisbar willmoveuptheprofileincalmweatherandrebuildthedunes.(source:EPA) ............. 10Photo7. Scourchannelthroughtheforedunecausedbystormwateroverflow,May2004. (source:EPA) ..............................................................................................................18Photo8. Rockandsoilfillmaterialontheesplanadeexposedbyduneerosion.(source:EPA)....20

Coastal erosion investigation and management options for South Mission Beach, Cardwell Shire.2
�.0 Introduction Since1971beacherosionhasbeenreportedattheverysouthernendofSouthMissionBeachinthevicinityoftheboatramp.Theerosionhasprogressivelyextendednorthandnowvisiblyaffectsthecoastlineforsome800mtothenorth.Theerosionisaffectingthenarrowstripofparklandandthescarpfaceisclosetothesealedroadway,whichistheonlylegalaccesstomanyresidentialproperties.
SouthMissionBeachhasbeenidentifiedintheCardwellHinchinbrookRegionalCoastalManagementPlan(EnvironmentalProtectionAgency,2003)asapriorityareaforerosionmanagement(seePolicy2.2.2Erosionproneareas).Thisinvolvesinvestigatingthecauseoftheerosionanddeterminingaschemeofworksthatcanbeimplementedwithinenvironmental,economicandsocialconstraints.
TheEnvironmentalProtectionAgencyEPA(andpreviouslytheBeachProtectionAuthority)andCardwellShireCouncilhavediscussedtheerosionissueonanumberofoccasionsovertheyears.In1999,theEPApreparedareportentitledManagementoftheDune/BeachRidgesystematSouthMissionBeachforCouncil.Thisreportrecommendedoptionsforthemanagementofthedunalareas,butbeacherosionwasonlydiscussedgenerally,anddidnotquantifytheproblemorgivespecificsolutions.
AsaresultofdiscussionswithofficersoftheCardwellShireCouncil,theEPAagreedtoundertakeastudyofthebeacherosionatSouthMissionBeachtoassistCouncilinmanagingtheerosionproblemalongthissectionofcoast.
Theaimsofthestudyareto:
• examineanddescribethecoastalprocesses occurringinthevicinityofSouthMissionBeach;
• identifythecauseandmagnitudeoftheerosion problem;
• discussthevariousstrategiesformanagingthe erosionproblem;and
• providerecommendationsonaspecificprogramfor addressingtheerosionproblemforconsiderationby CardwellShireCouncil.
3Coastal erosion investigation and management options for South Mission Beach, Cardwell Shire.
2.0 Study area and site description
SouthMissionBeachisthesouthern-mostsectionofacoastalplainextendingfromTamO’ShanterPointinthesouthtoClumpPointinthenorth.ThisbeachcompartmentalsoincludesWongalingBeachandMissionBeachand,forthisstudy,iscalledtheMissionBeachcompartment.SouthMissionBeachisalowlying2kmsectionofcoastlocatedbetweenarockyoutcropatitssouthernendandWheatley’sCreektothenorth.InthevicinityofWheatleysCreeksandhasaccumulatedinabroad,moderatelyconvexsalientcausedbytheshelteringeffectsofDunkIslandtothesoutheast.Thisactsasacontrollingfeatureonthecoast,andSouthMissionBeachhasformedasaslightlyindentedembaymentbetweenthispointandtherockyoutcropatthesouthernend.Alocalityplanofthesiteispresentedasfigure1(nextpage).
Thebeachprofileconsistsofabroadgentlyslopingintertidalareaofabout100minwidthbackedbya
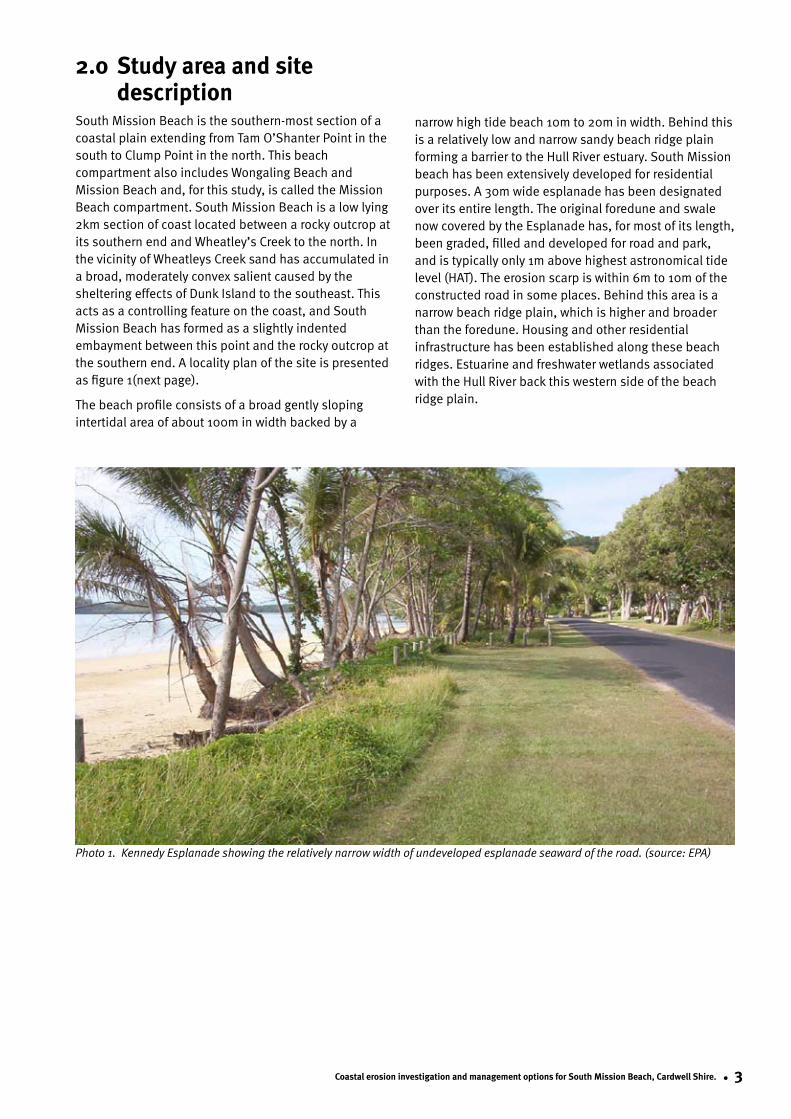
narrowhightidebeach10mto20minwidth.BehindthisisarelativelylowandnarrowsandybeachridgeplainformingabarriertotheHullRiverestuary.SouthMissionbeachhasbeenextensivelydevelopedforresidentialpurposes.A30mwideesplanadehasbeendesignatedoveritsentirelength.TheoriginalforeduneandswalenowcoveredbytheEsplanadehas,formostofitslength,beengraded,filledanddevelopedforroadandpark,andistypicallyonly1mabovehighestastronomicaltidelevel(HAT).Theerosionscarpiswithin6mto10moftheconstructedroadinsomeplaces.Behindthisareaisanarrowbeachridgeplain,whichishigherandbroaderthantheforedune.Housingandotherresidentialinfrastructurehasbeenestablishedalongthesebeachridges.EstuarineandfreshwaterwetlandsassociatedwiththeHullRiverbackthiswesternsideofthebeachridgeplain.
Photo1.KennedyEsplanadeshowingtherelativelynarrowwidthofundevelopedesplanadeseawardoftheroad.(source:EPA)

Coastal erosion investigation and management options for South Mission Beach, Cardwell Shire.4
Figure 1. Locality plan of South Mission Beach including marine park and other protected areas.
5Coastal erosion investigation and management options for South Mission Beach, Cardwell Shire.
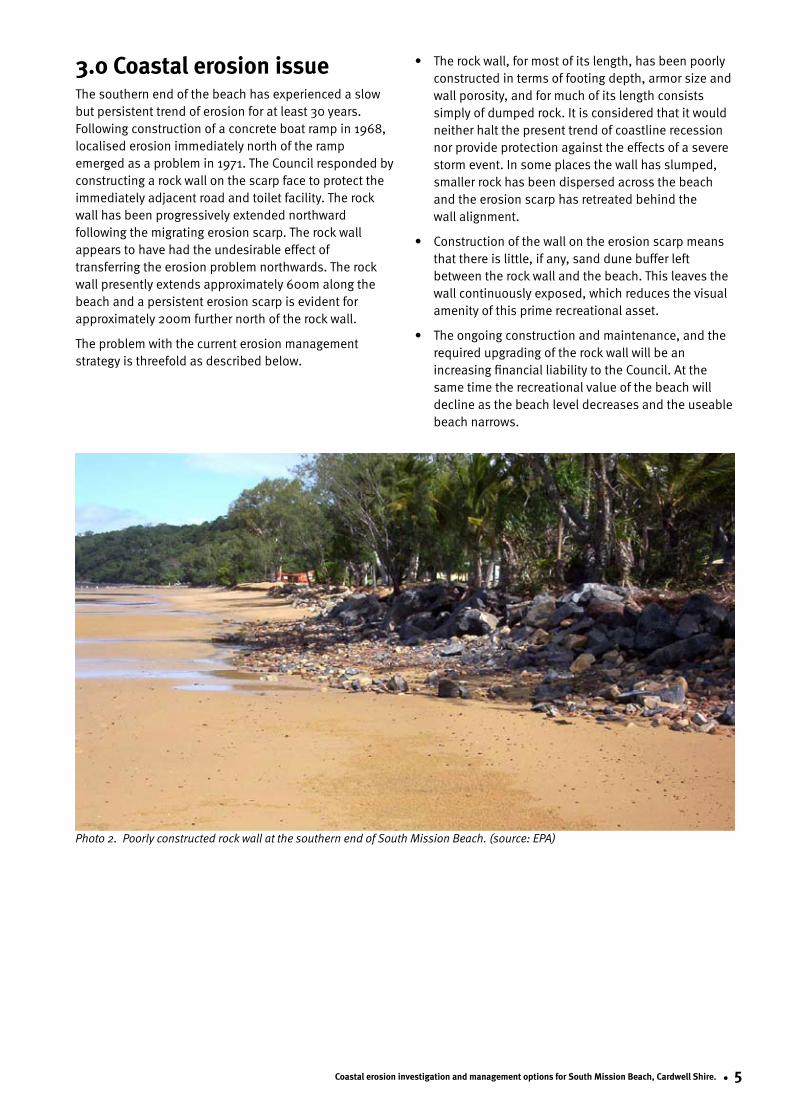
3.0 Coastal erosion issueThesouthernendofthebeachhasexperiencedaslowbutpersistenttrendoferosionforatleast30years.Followingconstructionofaconcreteboatrampin1968,localisederosionimmediatelynorthoftherampemergedasaproblemin1971.TheCouncilrespondedbyconstructingarockwallonthescarpfacetoprotecttheimmediatelyadjacentroadandtoiletfacility.Therockwallhasbeenprogressivelyextendednorthwardfollowingthemigratingerosionscarp.Therockwallappearstohavehadtheundesirableeffectoftransferringtheerosionproblemnorthwards.Therockwallpresentlyextendsapproximately600malongthebeachandapersistenterosionscarpisevidentforapproximately200mfurthernorthoftherockwall.
Theproblemwiththecurrenterosionmanagementstrategyisthreefoldasdescribedbelow.
• Therockwall,formostofitslength,hasbeenpoorlyconstructedintermsoffootingdepth,armorsizeandwallporosity,andformuchofitslengthconsistssimplyofdumpedrock.Itisconsideredthatitwouldneitherhaltthepresenttrendofcoastlinerecessionnorprovideprotectionagainsttheeffectsofaseverestormevent.Insomeplacesthewallhasslumped,smallerrockhasbeendispersedacrossthebeachandtheerosionscarphasretreatedbehindthewallalignment.
• Constructionofthewallontheerosionscarpmeansthatthereislittle,ifany,sanddunebufferleftbetweentherockwallandthebeach.Thisleavesthewallcontinuouslyexposed,whichreducesthevisualamenityofthisprimerecreationalasset.
• Theongoingconstructionandmaintenance,andtherequiredupgradingoftherockwallwillbeanincreasingfinancialliabilitytotheCouncil.Atthesametimetherecreationalvalueofthebeachwilldeclineasthebeachleveldecreasesandtheuseablebeachnarrows.
Photo2.PoorlyconstructedrockwallatthesouthernendofSouthMissionBeach.(source:EPA)

Coastal erosion investigation and management options for South Mission Beach, Cardwell Shire.6
Photo3.BeachconditioninJune2001followingseaerosion.(source:EPA)
Photo4.BeachconditioninNovember2003followingseaerosion.(source:EPA)
Photo5.BeachconditioninMay2004followingseaerosioninMarch2004.(source:EPA)

7Coastal erosion investigation and management options for South Mission Beach, Cardwell Shire.
4.0 Data collection and analysis
4.� Investigation of local coastal geomorphology and implications for present day coastal processes
TounderstandtheerosionproblematSouthMissionBeach,anoverviewofthegeomorphologyandthelarge-scalesedimenttransportpathwaysandcoastalprocessesintheregionwereinvestigated.
Holmes(1993)assessedthegeomorphologyanderosionvulnerabilityoftheMissionBeachcoastaspartofalargerregionalstudy.ThiscoastconsistsofanarrowsandplainextendingfromtheboatrampatSouthMissionBeachtoClumpPoint.ThiscoastalplainconsistsofbothPleistocenesandsdepositedduringaprevioussealevelhigh>100,000yearsbeforepresent(BP),andHolocenebeachridges,depositedupto6000yearsBP.Theselandformsaredetailedinfigure2.TheHolocenebeachridgesdirectlyonlapthePleistoceneridges.ThecoastalplainisnarrowestatSouthMissionBeachandwidestatWongalingBeach.SouthofTamO’ShanterPointisawideHolocenebeachridgebarrier.TheHolocenebarrierisbetween350mand460minwidthandextendsfromTamO’ShanterPointtotheHullRivermouthasacontinuousseriesofridges.Threemajorridgesoccuralongthelengthofthebarrier.TheHolocenebarrieronlapsPleistocenebeachridgeswhichextendsouthfromTamO’ShanterPoint.
Holmes(1993)indicatedthattheMissionBeachembaymentdidnothaveanexternalsourceofsandandcouldessentiallybeconsideredapocketbeachwithafinitesandresource.ThiswasbasedonthefactthattheTullyRiveristheonlypossibleexternalsourceofsedimentandthatnotransportpathwaycouldbefoundaroundTamO’ShanterPoint.ItwasalsodeterminedthattheMissionBeachsandhadalowerPotassium-feldsparcontentthanTullyRiversandindicatingthattheMissionBeachsandhasundergonesomeformofweatheringandisnotrecentlyderivedfromtheTullyRiver.HeconcludedthatmostlikelysourceofsandalongMissionBeachwasfromthecontinentalshelf.Thissandwasprobablytransportedonshoreduringthemarinetransgression(10,000to6000yearsBP)andearlystillstand(post6000yearsBP).
FurtherinvestigationofthestratigraphyandgeomorphologyoftheareawasundertakeninDecember2002todeterminethehistoryandageofgeomorphicunitsofthesite.Thisinvestigationincludedananalysis
ofaerialphotographsandasoilprofileexaminationbybackhoetrenching.ThepurposeoftheworkwastoconfirmwhetherasedimentsupplyfromsouthofTamO’ShanterPointtoSouthMissionBeachonceexistedinrelativelyrecentgeologicaltimesandifso,atwhattimeovertheHolocenehadtheformationoftheTamO’Shantertombolocutoffthesandsupply,resultingintheobservedtrendoferosion.ThiswouldassistindeterminingwhethererosionatSouthMissionBeachiscausedbyageologicallyrecentdisruptioninsandsupplyfromtheTullyRiver/HullRiverscompartmenttoSouthMissionBeachcausingalong-termrealignmentofthecoast,whetheritiscausedbyanepisodicredistributionofsandwithintheMissionBeachcompartment,orbysomeothercause.
Fourtrenchesupto5mdeepwereexcavatedonthetombolowestandsouthofTamO’ShanterPoint,andarecentseptictankexcavationandsoiltestborelogonaseawardresidentiallotatSouthMissionBeachwereexamined.Thelocationoftheseisindicatedonfigure2(nextpage).Unfortunately,noshellmaterialthatcouldbeusedfordatingtheduneemplacementswasrecoveredfromanyofthetrenches.Thiswasprobablyduetotheageandextensiveweatheringofthesesoilsinatropicalclimate.Adescriptionofthesoilprofilesisgiveninfigure3(followingpage).
Theageofthedunesandscouldonlybeinferredfromthecharacteristicsofthesoilprofileandbarriermorphology.Thedunesoilsexaminedhadwelldevelopedprofilesindicativeofextensiveweathering,exceptfortheSouthMissionBeachprofile.ThesoilprofilecharacteristicsofanincreasingwidthoftheorganicallyenrichedA-horizonanddevelopmentofanorangebrownB-horizondeepeningwithdepthareconsistentwithincreasingageofthebarriersequencelandward.Pye(1981)hasindicatedthatinhumidtropicalconditionstheobservedreddeningofdunesandsmayoccurwithin10,000to100,000years,butwithadiversenatureofcontrolsonreddening,timealoneisnotthedeterminingfactor.
Soilprofilecharacteristicsasshowninfigure3indicatetheHolocenebarrierformedrapidlyaftertheendofthepostglacialmarinetransgression(estimatedat5600-6100yearsBP).ThesoilprofileofthetomboloimmediatelywestofTamO’ShanterPoint(locationno.2)indicatedthatitisprobablyPleistocene,butmaybeHoloceneinpart.Inanyevent,itisinferredthatthetomboloclosedthesandtransportpathwaybehindthePointtoSouthMissionBeachfromatleastthemidHolocene.

Coastal erosion investigation and management options for South Mission Beach, Cardwell Shire.8
Figure2.MorphostratigraphicunitsoftheduneareasfromtheHullRivertoWongalingBeach–1951photography.(source:EPA)

9Coastal erosion investigation and management options for South Mission Beach, Cardwell Shire.
AninterestingfeatureofthedunemorphologyinthevicinityofTamO’ShanterPointwastheincreasingelevationofthedunecrestsandswaletroughslandward.ThisisconsistentwithfindingsfromotherresearchonmorphostratigraphyofbarriersystemsinnorthQueensland(MasselinkandLessa,1995)whichindicatesealevelattheendofthepostglacialmarinetransgressionwas1.5to2mhigherthanatpresent,probablyduetoisostaticrebound,wherethelandlevelisraisedandthereisarelativedropinsealevel.
TheundifferentiatedsoilprofilefromSouthMissionBeachindicatesarelativelyshortperiodofweatheringduetoitsyoungage.However,ifthisbarrierwasformedinthemidHolocenebytheonshoremigrationofshelfsands,theapparentyoungagecanonlybeinterpretedasreworkingoftheexistingsandbyseaerosionanddunereconstruction.
Thefindingsfromthiscomponentoftheinvestigationwere:i) ThegapbetweenthemainlandandTamO’ShanterPointhasbeenclosedbyatombolosinceatleastthemidHolocene,andthereislittlelikelihoodofanysignificantlongshoretransportofsandaroundTamO’ShanterPoint.ThereforethereisnosignificantmoderndaysandsupplytotheMissionBeachcompartmentfromtheHullorTullyRivers.
ii) TheMissionBeachcompartmentisalargepocketbeachwithafinitesandresourceheldbetweenTamO’ShanterPointandClumpPoint.SandinthecompartmentwasprobablyderivedfromoffshoremarinedepositsandemplacedduringtheearlyHolocene.
iii)TheSouthMissionBeachHolocenebeachridgesarerelativelyuniformandintactovermostofthecompartmentwithnoevidenceoflong-termreworkingorerosion,suchasbarriertruncation.However,evidencesuggestsarecent(50to500years)reworkingofthemostseawardbeachridge.Thiswasthoughttoresultfromcycloneactivity,wheresandfromthebeachridgeiserodedandstoredinanoff-shorebar.Duringsubsequentcalmweatherthesandistransportedonshoreandabeachridgerebuilt(TaylorandStone,1996).• Thelong-termnetlittoraldriftforthiscoastal sectorisassessedtobeclosetozero.
• Thelargemostseawardbeachridgethatoccurs alongthelengthoftheEsplanadeofSouth MissionBeachappearstoberelativelyyoungand wasprobablyformedbyamajoreventreworking existingdepositsintherecentpast(<500years BP).
Figure3.SoilprofilesoftheTamO’ShanterPointdunefield.(source:EPA)

Coastal erosion investigation and management options for South Mission Beach, Cardwell Shire.�0
4.2 Comparison of historical shoreline positionsHistoricalaerialphotographyoftheregioncapturedin1951(figure2)wassourcedfromtheDepartmentofNaturalResourcesandMinestodeterminethestateofthecoastlineatSouthMissionBeachbeforesignificantresidentialdevelopmentoccurred,asshownonthemostrecentaerialphotographytakenin2002(figure4).
High-resolutionaerialphotographyoftheSouthMissionBeachareatakenin1974,1991and2002wererectifiedusingpermanentfeaturessuchashousesandroadscommontoeachtimeseries,andcomparedtoquantifythehorizontalchangesinshorelinepositionoverthis28-yearperiod.Aerialphotographyfrom1951wasalsoassessedbutaccuratecomparisonsofshorelinepositioncouldnotbemadeduetothelownumberofpermanentfeaturesfromwhichtorectifytheimages.ThesehistoricalviewsofSouthMissionBeachareshowninfigure4.Thespatiallyreferencedshorelinepositionsobtainedfromeachdatewereoverlaidonthe2002rectifiedimageandmeasurementsofshorelinechangearepresentedinfigure5.Somelimitedcomparisonshavebeenincludedfromthe1951aerialphotographywherepermanentfeatureswereidentified,butaccuracyisreduced.
Shorelinecomparisonsover28yearsfrom1974to2002indicatedthatthebeachbehaviourhasbeencomplex,asdescribedbelow:• inthesouthernsectionshorelineretreathasbeen
minorandintheorderof3m.Progressiveconstructionofarockwallonthescarpfacehaslimitedfurtherretreat;
• inthesoutherntocentralsectionshorelineretreathasbeenmorerapid,particularlyinthepast10years,withtypicalretreatof4mto7mandthegreatestretreatof13matanareaofstormwaterdischargenearDouglasStreet;and
• inthecentraltonorthernsection,minoraccretionofapproximately7mhasoccurred,mainlyasalowlightlyvegetatedduneterracethatprobablycomesandgoesovertime.
AtthecentralpartofSouthMissionBeachtherateofshorelineretreatincreasedbetween1991and2002upto0.88mperyear.Erosionhasprobablybeenacceleratedbyconstructionoftherockwalltothesouth,whichhasconcentratederosioninthisarea.
Photo6.NorthernendofSouthMissionBeachfollowingerosioninMarch2004.Notethebroadintertidalzoneandhigh-tidebar. Itwouldbeexpectedthatthisbarwillmoveuptheprofileincalmweatherandrebuildthedunes.(source:EPA)

��Coastal erosion investigation and management options for South Mission Beach, Cardwell Shire.
Figure4.HistoricalaerialphotosofSouthMissionBeach1951to2002.(source:EPA)

Coastal erosion investigation and management options for South Mission Beach, Cardwell Shire.�2
Figure5.Changesinshorelineposition1951to2002.

�3Coastal erosion investigation and management options for South Mission Beach, Cardwell Shire.
Shorelinechangesbetween1951and1974couldnotaccuratelybedeterminedduetothepoorqualityoftheearliestphotographyavailableandlackofpermanentfeaturestoreferencethephotosatvariousdates.Theonlyobvioustrendwassignificantaccretiononthenorthernpartofthebeach.ThisisbasedontheassumptionthatthecentrelineofKennedyEsplanadewasconstantbetween1951and1974.
Whilehorizontalrecessionalongthiscoastisonlyminor,therecessionrelativetotheparkwidthbacktotheedgeofthesealedroadhasbeensignificant,with25to50percentofthevegetatedparkseawardoftheroadhavingbeenlostatsomelocations.
4.3 Water levelsTable1providesthetidalplanesfortheregion,basedonpublisheddataforClumpPoint.Table1alsoprovidesestimatedstormtidelevels(RustPPK,1995).
Level relative to AHD
1:500yearAverageRecurranceInterval(ARI)stormtide*
3.20m
1:100yearARIstormtide* 2.64mHighestAstronomicalTide(HAT) 1.91mMeanHighWaterSprings(MHWS) 0.93mMeanLowWaterSprings(MLWS) -1.00mLowestAstronomicalTide(LAT) -1.68m
4.4 Wave climateOnlongsandybeachessuchasSouthMissionBeach,theoverallwaveclimatehasastronginfluenceonthealignmentofthecoast.Ingeneral,thebeachalignmentrespondstothe“average”wavedirectionandsignificantlocalchangesmaybecausedbyvariationsinthewaveclimate.
Thesiteisexposedtorelativelylowtomediumwaveconditions.Thesearelocallygeneratedwindwavesdrivenmainlybypredominantsoutheasterlytradewindsandtheseabreeze.Theoffshoreislands(particularlyDunkIsland)andTamO’ShanterPointprovideadegreeofshelteringthatreducestheenergyoftheinshorewaveclimate.Theoccasionalimpactoftropicalcyclonescanresultinthegenerationofextremewaves.Theseareintheformofswellwaves,propagatingfromnearthecentreofthecyclone,andlocallygeneratedwindwaves.AdirectassessmentofthewaveclimateaffectingSouthMissionBeachhasnotbeenmadeaspartofthepresentstudy.
TheJamesCookUniversityMarineModelingUnit(JCU,2003)hasundertakenaprogramofnumericalmodelingandassociatedstatisticalanalysisoftropicalcyclone
Table1StormTideStatistics–CardwellRegion*Note:EstimatesforTullyHeads-doesnotincludeanallowanceforwavesetup.
wavesforthemajorityoftheGreatBarrierReefarea.ThisworkwasfundedthroughtheCooperativeResearchCentrefortheGreatBarrierReefWorldHeritageArea.Foralocationapproximately35kmeastofDunkIsland,thesignificantwaveheightcorrespondingtoa50yearaveragerecurrenceintervalisestimatedas4.5m.TheresultsdonotallowanaccurateestimationoflikelyextremewaveconditionsintheleeofDunkIsland,howeveranindicativeestimateisintheorderof3.5m.
4.5 Sediment transportSedimenttransportonthecoastatSouthMissionBeachoccursbytwoprincipalmechanisms.
Longshore sediment transport:Thisisaresponseofabeachtoincomingwaveenergyreachingtheshallowwaterneartheshoreatanangletothebeach.Thewaveswillmovesandalongthebeachastheystirupsedimentonthebottom.Overagivenperiodanddependingonwaveenergyanddirectionthetotal(orgross)longshoresedimenttransportmaybesignificantassandismovedonbothdirectionsalongthecoast.However,thenetlongshoresedimenttransportmaybesmall.OverrelativelylongtimescalesthisislikelytobethecaseatSouthMissionBeach,basedontheassessmentofgeologicalcontrols.
Cross-shore sediment transport:Themostimportantformofcross-shoresedimenttransportistheresponseofabeachtoelevatedwaterlevels(stormtides)andstormwaves.Duringstormconditionsthebeachprofileflattenscausingarecessionoftheupperbeach.Generallythesanderodedfromtheupperbeachisdepositedinthenear-shoreareaandisslowlyreturnedduringcalmerwaveconditions.
AdirectassessmentofthelongshoresedimenttransportratesaffectingSouthMissionBeachhasnotbeenmadeaspartofthepresentstudy.Contributionstolongshoretransportaremadeby:
• southeasterlytradewinds;
• thedailyseabreeze.Thishastheeffectofrotatingthewind-wavedirectiontowardstheperpendiculartothecoastline;
• seasonalnorth-easterlywinds;and
• theeffectofseaandswellwavesgeneratedbytheoccasionaltropicalcyclone.
TheanalysisofthelongshoresedimenttransportatSouthMissionBeachiscomplicatedbythelackofrepresentativewindrecordsfortheregionthatarerequiredtoassessthelocallygeneratedwind-waveclimate.Applicablerecordedwinddata,fromapreliminaryreview,appeartobeinfluencedbytopographicfactors.

Coastal erosion investigation and management options for South Mission Beach, Cardwell Shire.�4
Smallchangestothelongshoresedimenttransportmaybecausedbyrelativelysubtleclimatevariations(fore.g.atypicalyear-to-yearvariabilityofthestrengthandnetaveragedirectionofthetradewindsmaycausechangestotheequilibriumalignmentofthebeach).Overalongsectionofbeachthiscancausemarkedeffectsonthecoastalalignmentneareachend.InthecaseofSouthMissionBeachthisislikelytobenoticeableatthesouthernendofthebeach.
Figure 6. Location and number of survey lines.
Duringyearswhenthesouth-easterlywindsarefrequent,thenetannuallongshoretransportwouldbetothenorth.Thisisprobablybalancedbyyearswhenstrongnorth-easterlywindsoccuroratropicalcycloneoccursnorthoftheregion,whennetannuallongshoretransportwouldbetothesouth.

�5Coastal erosion investigation and management options for South Mission Beach, Cardwell Shire.
-10 0 10 20 30 40 50 60 70 80 90 100Distance (metres)
-2
-1
0
1
2
3
4
Hei
gh
tab
ove
AH
D(m
etre
s)
Survey LinesLine 1Line 2Line 3Line 4Line 5Line 6Line 7Line 8Line 9Line 10Line 11Line 12Line 13Line 14
HAT level (1.19m)
MHWS level (0.93m)
MLWS level (-1.0m)
4.6 Beach profile analysis and changesAspartofthepresentstudy,CardwellShireCouncilcompletedaninitialsetof16beachprofilesurveysforthelengthofSouthMissionBeachinSeptember2002.Thesurveysextendfromthebackshoreareaouttoapproximatelythelowestastronomicaltidelevel(figure6).
Beachprofilesrecordedateachsurveylinearepresentedinfigure7.Profiles1to3arewithinthebeginningofthesalientfeature,andprofiles4to5displayasmallnearshorebar.Profiles6to9indicateanactivelyerodingsectionofcoastandprofiles.Profiles10to14areonthesectionofthecoastwherearockwallhasbeenconstructed.Profiles15and16arewithinanareamodifiedbyconstructionofaboatramp.Typicalprofilesforeachoftheseareasareshowninfigure8.
4.6.1 Comparison of survey profilesNohistoricalbeachprofileorhydrographicsurveydataareavailablefortheSouthMissionBeacharea.Intheabsenceofhistoricalsurveydata,someinformationonsandvolumelostovertimefromthebeachbyerosionmaybederivedbyacomparisonofcurrentsurveylines.Asanapproximation,itcanbeassumedthattheprofilesatthenorthernendofthebeachrepresenttheun-eroded,“natural”stateofthebeach.Therelativelossofvolumefromthebeachprofilesatthesouthernendofthebeachcanbedeterminedbycomparingtheprofiledata,takingprofile4asthebase.
Figure7showsallthesurveydataoverlaidtoacommonunderwaterpoint(-1mAHD).Itcanbenotedthat,apart
fromprofiles1and3,thereislittlechangebetweenprofileshapesparticularlyinthelowerbeachsections.Differencesarenoticeableataroundthe+1mlevel,whichisapproximatelymeanhighwaterspringstidallevel.
Toinvestigatethisfurthertherelativepositionofthe+2mcontour(approximatelyHATorthelevelofthetoeofthefrontaldune)relativetothe–1mcontour(MLWS)hasbeenderived(figure9)andprovidesasimplemeasureoftheoverallerosionandretreatoftheupperbeach.Themostlandwardpositionofthe+2mcontouroccursatprofile9,600mnorthoftheboatramp.Thisistheprofileimmediatelynorthoftheendoftherockwall.
Thisfindingillustratesthemodeoferosionoccurringatthesouthernendofthebeach.Theupperbeach(representedbythe+2mcontour)showsrecessionofupto7mcomparedtoprofilesfurthernorth,butthelowersectionofthebeachisrelativelyunaffected.Thebeachinfrontoftherockwallhasconstrainedlandwardretreatandtheforeshoreimmediatelyseawardexhibitsaloweredlevel.Therefore,erosionoccursprimarilyontheupperbeachaboveMHWS,butwhererecessionispreventedbytheconstructionofarockwall,erosioncontinuesseawardofthewallresultinginaloweringofthebeachlevel.
Thevolumeofsanderodedovertimecanbeestimatedbycomparingprofile4,representingatypicalequilibriumbeachprofile,andallotherprofiles.Sandvolumedifferencesbetweenthe-1mcontourandapoint80mlandwardofthe–1mcontourisshownintable2.
Figure7.Beachprofileateachsurveylinerecordedon22September2002

Coastal erosion investigation and management options for South Mission Beach, Cardwell Shire.�6
2100
2000
1900
1800
1700
1600
1500
1400
1300
1200
1100
1000 900
800
700
600
500
400
300
200
100
Distance along beach north of boat ramp (metres)
80
75
70
65
60
Dis
tan
cefr
om
HA
Tto
-1.0
met
reco
nto
ur
(m)
1
3
4
56
7 8
9
10
1112
1314
Figure8.Typicalbeachprofile
Figure9.Distanceofthehighestastronomicaltideleveltothe-1.0mcontouratSeptember2002.
Thetotalvolumedeterminedthroughsummationofsandlostovertheentirebeachisestimatedat14,639m3,withthebulkofthiscomingfromthesoutherntocentralsectionofthisbeach.Themosterodedsectionofthisbeachhasexperiencedasandlossof14m3/mofcoast.
Itshouldbenotedthattheaboveestimationofsandlossassumesthatthebeachprofileatthe–1mcontourisstableandhasnotchangedovertime.Asnoprevioussurveydatatothislevelisavailable,thisassumptioncannotbetested.Therefore,itwouldbeprudenttoincludeasafetyfactorof40percentinanycalculationof
sandlosstominimizetheriskofanunderestimationofsandloss.Sandlossisthereforerecalculatedat20,494m3andforconvenienceisroundedto20,000m3.
Assumingthatthiserosionhasoccurredovera28yeartimeperiod,theaverageannuallossfromerosioniscalculatedatabout700m3peryear.ThisisarelativelysmallamountcomparedtoothersitesalongtheQueenslandcoast(e.g.WooriminCabooltureShireisasimilarmoderatewaveenergycoastandislosingabout30,000m3ofsandperyear).
-10 0 10 20 30 40 50 60 70 80 90 100Distance (metres)
-2
-1
0
1
2
3
4
Hei
ghta
bove
AH
D(m
etre
s)
Survey LinesLine 4 - Uneroded profileLine 9 - eroded profileLine 11 - eroded profile with rock wall
HAT = 1.91m
MLWS = -1.00m
MHWS = 0.93m

�7Coastal erosion investigation and management options for South Mission Beach, Cardwell Shire.
Survey line (profile) number
Chainage north from boat ramp
Sand volume difference between each profile and
profile 4
Section length Sand volume change per 100m of beach
(m) (m3/m) (m) (m3) 1 2100 2.3 200 230
2000 230 2 1900 -1.95 200 -195*
1800 -195* 3 1700 -6.21 200 -621#
1600 -621# 4 1500 0 200 0
1400 0 5 1300 -7.65 200 -765
1200 -765 6 1100 -9.22 200 -922
1000 -922 7 900 -14.07 200 -1407
800 -1407 8 700 -11.16 100 -1116 9 600 -15.35 100 -1535 10 500 -15.35 100 -1535 11 400 -7.65 100 -765 12 300 -6.08 100 -608 13 200 -6.37 100 -637 14 100 -6.23 100 -623
Total of losses (-) -13,628
Table2Sandlossfrombeachsectionscomparedtoanunerodedbeachsectionrepresentedbysurveyline4.*Profiledataofpoorqualityhencecalculatedvolumesmaybeinaccurate#ProfileaffectedbycreekmouthhencecalculatedvolumesmaybeinaccurateNote1.Profiles15and16werenoincludedduetodistortionsinthebeachprofileintroducedbyconstructionoftheboatramp.
4.6.2 Potential shoreline recession from future storm erosion Anestimateofshort-termbeacherosionfromastormeventmaybedeterminedbythemethodofVellinga(1983).Thismethodassumesanequilibriumbeachprofilethatdevelopsinresponsetoelevatedwaterlevelsandwaveaction.Thecomputedprofileisafunctionofwaveheightandbeachsedimentproperties.TheVellingamethodislimited,asitdoesn’ttakeintoaccounttimevaryingconditionsduringastormanddescribestheresponseoftheupperbeachonly.Despiteitsshortcomings,itisanacceptedempiricalmethodwidelyusedforestimationoferosionpotentialonothersectionsoftheQueenslandcoast.
AVellingaanalysishasbeenundertakenonprofile13,whichrepresentsthebeachatthesouthernendofthestudyarea.Keyparametersusedintheanalysiswere:
• averagerecurrenceintervalforstormevent= 100years(extremecyclonicevent);
• peakstormwaterlevel=2.99mAHD;
• peaksignificantwaveheight=3.5m;and
• mediansedimentdiameterD50=0.21mm.
Theanalysisresultsshowarecessionatthetoeofthefrontalduneintheorderof45misrequiredtoachieveanequilibriumbeachprofileattheelevatedwaterlevel(figure10).Theactualamountofrecessionwilldependonthedurationoftheelevatedwaterlevelandthetidalinfluenceatthetime.Sucharecessioneventmaynotoccurasasingleeventandcouldresultfromthecumulativeeffectofaseriesofeventsoverashorttimeperiod.Thiswouldprovidetheopportunityforshort-termremedialactions,suchassandpushingfromtheintertidalzonetotheupperbeach.

Coastal erosion investigation and management options for South Mission Beach, Cardwell Shire.�8
Figure10.Estimatedshort-termbeachprofileresponsetoa1in100ARIstormeventbasedonVellinga1995).
4.7 Effects of storm water discharge on beach erosionStormwaterfromtheroadwayalongSouthMissionBeachisdischargedtosumpsorsoakagepitsontheforeduneseawardoftheroadwayandallowedtopercolateintothesand.Beacherosionalongthiscoastappearstobeworsenedgenerallyseawardofstormwaterdisposalsumps.
Thesumptypedisposalsystemdoesnotappeartohavethecapacitytohandleintenserainfalleventswhichcausesystemoverflows.Thisisobservedtoresultinpondingofwaterbehindthedunecrest,andlocallyconcentratedsurfaceflow.Thissystemmayalsohavealimitationinthatthesumpwilllocallyelevategroundwaterlevelsandwherethisisneartheerosionscarpface,thesandbecomesfluidisedandismoresusceptibletoerosion.Aspondedwaterbreachesthedunecrestsignificantscourholesareformed,whichcanfurtherconcentratewaveerosion(seephoto7).
Photo7.Scourchannelthroughtheforedunecausedbystormwateroverflow,May2004.(source:EPA)
0 20 40 60 80 100 120 140 160Distance (metres)
-2
-1
0
1
2
3
4
Hei
ghtA
bove
AH
D(m
etre
s)
Existing profile at survey line 13Predicted post storm profile (Vellinga)
HAT 1.91m
MHWS 0.93
MLWS -1.0
Potentialerosion loss

�9Coastal erosion investigation and management options for South Mission Beach, Cardwell Shire.
Thedirectdischargeofstormwatertotheoceanacrossthebeachappearstobetheonlyviablealternativeatthislocationtominimisethisimpact.However,unlessmanagedcorrectly,disposalofstormwatertotheupperbeachhasthepotentialtocauseextensivelocalscour.Suitablydesignedoutletstructureswouldberequiredtominimiseproblems.
Councilwillneedtoseekfurtherdesignadviceregardingthismatter.Itisnotedthatanumberofnewproductshavebeendevelopedutilizinggeotextilematerialsthatmaybeofuseincludingsandfilledcontainers,andscouraprons.
5.0 Key findings on erosioni) ThecoastlineatthesouthernendofSouthMission
Beachisexperiencingarelativelysmallbutpersistenttrendoferosion.Theerosiontrendappearstohavestartedatthesouthernendandhassteadilyprogressednorthward.Arockwallhasstoppedthecoastlinerecessionatthesouthernendofthebeachbuthaseffectivelytransferredtheerosiontothenorth.Activebeacherosionisnowapparentnearthecenteroftheembaymentadjacenttotheendofthewall.ThenortherncoastofSouthMissionBeachhasexperiencedsandaccretionandcoastlineprogradation.
ii) Themosterodedsectionofcoastaroundprofile9(figure6)hasexperiencedshorelinerecessionintheorderof4mto7mwhichisaannualiserateof0.24m.Themaximumpointofrecessionattheendoftherockwallwas13.4mwhichisanannualisedrateof0.9m.
iii) Basedonacomparisonofbeachprofiles,atotallossof20,000m3ofsandisestimatedalongthesouthernandcentralsectionofthisbeachoverthelast28years.
iv) AreviewofthegeomorphologicalfactorsaffectingsedimentsupplytoSouthMissionBeachhasdeterminedthattheTamO’ShantertoClumpPointcompartmentisaclosedsystemwithnolongshoresupplyofsandfromtheHullorTullyRivers.Theonlysignificantsandsupplywasoffshoremarinedepositsinthemid-Holoceneassociatedwiththeendingofthepostglacialmarinetransgression.Thepresentbeachhasformedinresponsetozeronetsedimentsupplyandthereforethelong-termaveragelongshoresedimenttransportrateatanypointalongthebeachisnegligible.
v) Themostprobablecauseofthepresentbeacherosionproblemsisthereforeanepisodicresponsetoachangeintheprevailingwaveclimate,whichhasresultedfromasubtleshiftinthebalancebetweenthevariousclimaticfactorsthatdrivelongshoresedimenttransport.Itislikelythatthe
erosionatthesouthernendofthebeachhasresultedinanassociatedaccretionofthesalientfeatureatthenorthernendofthebeachnearWheatley’sCreek.
vi) Thefactorsthatcancausechangestotheprevailingwaveclimateincludeinter-annualvariabilityofthesouth-easterlytradewindsandtheeffectsofoccasionaltropicalcycloneevents.
vii) Theesplanade,constructedontheforeduneandclosetotheerosionscarp,isvulnerabletostormerosion.Astormevent,producingwaterlevelscorrespondingtoa100yearaveragerecurrenceintervalmaypotentiallycauseupto45mofrecession.Thiswouldpotentiallydestroymostoftheroadandmaythreatenadjacenthouses.
viii) Thepresentrockwallisgenerallypoorlyconstructedandhasbeendamagedbysmalltomoderateerosionevents.Forthemostpart,itwouldofferlittleprotectionagainstaseverestormevent.
ix) Erosionhasbeenlocallyaggravatedbythedischargeofstormwatertosoakagepitsonthefrontalduneandtheoverlandflowofpondedstormwaterovertoppingthedunecrest.
6.0 Erosion management options for South Mission BeachTherearearangeofoptionsavailabletotheCounciltomanagetheerosionatSouthMissionBeach.Thesearedetailedbelowwiththeprosandconsofeachprovided.Specificrecommendationsonthefavorederosionmanagementoptionsareprovidedinsection8.0.
6.1 Managed retreat Managedretreatallowscoastalerosiontocontinueunhindered,byrelocatingassetsfurtherlandwardaserosionprogresses,toavoidloss.Itiscommonlyreferredtoasthebufferzoneconcept,wheresanderodedfromthedunesduringstormsismovedoffshoreandreturnstobuildthedunesduringcalmweather.Thisisalow-coststrategybutrequiresthedunalbufferareastobeofadequatewidth,andismostapplicablewhenerosioniscyclical.
AtSouthMissionBeach,theslowerosionalongsectionsofcoastisexpectedtocontinueintheshorttomediumterm,andatthecurrentrate,theexistingdunalareacanonlyaccommodateerosionforthenext5to10yearsbeforetheroadisdirectlyaffected.Thereisalsoinsufficientlandbetweentheroadandtheforeshoretoaccommodateshort-termcyclicalerosionwithoutdirectlythreateningtotheroadandotherpublicinfrastructure,andthereisinsufficientspaceforthesetoberelocated.Furthermore,thesuspectedpresenceoffillmaterialintheduneswaleunderminesthevalueofthisareaasasourceofsandfornaturalbeachreplenishment.

Coastal erosion investigation and management options for South Mission Beach, Cardwell Shire.20
ThelossofparklandamenityisalsoofconcerntotheCouncilassomeresidentshaveidentifiedthisparklandamenityasanimportantfeatureofSouthMissionBeach.Managedretreatthereforeisnotconsideredaviableoptionformostoftheactivelyerodingsectionsofthestudyarea.
6.2 Beach nourishmentBeachnourishmentisthereplenishmentofbeacheswithimportedsandandisoneofthebestavailablemeansofrestoringbeacheswhereerosionhasbecomeaproblem.Itwidensthebeachanddunestherebypreservingexistingbeachamenityandincreasesthebufferingcapacityofthedunesagainststormattacktoprotectdevelopment.Sandnourishmentincreasesthewidthoflandavailabletoaccommodateerosion,whileatthesametimeallowingthebeachtocontinuetobehavenaturally.
Sandplacedinonlyafewselectedareasofagenerallyerodingcoastlineorplacedtoformonlytheupper(visible)partofthebeachwillusuallybedispersedquicklythroughthebeachsystem.Thesandisnotlostbutremainsintheactivebeachsystem,resultinginsomegainoverallbutaless-than-desiredgainforindividualbeaches.Toachievesuccessfulbeachrestoration,expectationsoftheresultmustbeclearly
articulatedandsandrequirementsmustbecarefullycalculatedtoachievethese.
Theonedisadvantageofbeachnourishmentisthatthesandwillcontinuetobeerodedandongoingtop-upnourishmentmayberequiredtomaintainthedesiredbeachprofile.Thismaybeseenbysomeasatemporarysolutionandawasteofmoney.
Animportantaspectofbeachnourishmentisthatanysandaddedtothebeachcomesfromasourceoutsideoftheactivebeachsystem.Theactivebeachsystemincludestheareasofpresentdaysandmovementsincludingthedunes,beachandoffshoresandbars.Thesandintroducedtherebyrepresentsagaininthequantityofsandcontainedwithinthebeachsystemratherthanjustatransferfromonepartofthesystemtoanother.
Itisalsoimportantthatthegrainsizeofnourishmentsandissimilartothatoftheexistingsand.Thisensuresthattheslopeofthebeachprofileremainscompatiblewiththepre-nourishmentprofile,andthatsandmovementsasaresultofnaturalprofileadjustmentsareminimised.
Alow-costalternativetopurchasingsandfromanoutsidesourceistousecleansandsurplustorequirementsfromCouncilprojectssuchasroadworksorpipelineinstallations,orfromprivatedevelopment
Photo8.Rockandsoilfillmaterialontheesplanadeexposedbyduneerosion.(source:EPA)

2�Coastal erosion investigation and management options for South Mission Beach, Cardwell Shire.
sitesormaintenancedredging.Councilcanalsoimposearequirementoncertaindevelopmentapprovalsthatallsurpluscleansandfromsuchsitesisplacedonbeachesanddunes.Withinthedesignatederosionpronearea,buildingworksinvolvingtheexcavationofcleansandcanberequiredtoplacethismaterialelsewherewithintheerosionpronearea.
Beachnourishmentworksmayattracta25percentStatesubsidythroughtheLocalGoverningBodies’CapitalWorksLoanSubsidySchemeadministeredthroughtheDepartmentofLocalGovernmentandPlanning
Application to South Mission BeachBeachnourishmentcanbeusedatSouthMissionBeachto:
i) replaceerosionallossesandrestorethebeachtothepreexistingprofile.SouthMissionBeachisexperiencingmoderateerosionovermorethan1000mofcoastlinewithacalculatedannualsandlossof700m3,andalong-termlosssince1974of20,000m3(table2).Thesequantitiesareconsideredrelativelysmallcomparedtootherareasofthecoastandarethereforeamenabletoremediationbybeachnourishment.Thesandvolumesrequiredtooffsetthehistoricalerosionallossesispresentedintable3,andtherequiredpostnourishmentbeachprofilesarepresentedinfigure11.
ii) increasethewidthofthedunestocreateawiderbufferzoneseawardoftheroad.Figure10demonstratesthatanextremecyclonicevent(1in100ARI)maycauseerosionofthedunesandalandwardrecessionofthecoastbyupto45m.Ananalysisoftheexistingdunewidthindicatesthattheduneswouldhavetobeincreasedinwidthseawardoftheroadbyupto35msothatthiserosionallosscouldbeaccommodatedwithinthedunalzone.Thesandvolumetoconstructthisbufferzoneisestimatedat180,000m3forthelengthofSouthMissionBeach.Alessersandvolumecouldbeconsideredtoincreasethelevelofprotectionagainstlowerintensitystormevents,andwouldalsoassistinprotectingtheremainingtreesontheEsplanade.Anincreaseindunewidthto20mseawardoftheroadedgeisconsideredtobeareasonablyfunctionalwidthincrease.Thiswouldrequireanadditional20,500m3ofsandplacedonthesouthernandcentralsectionofthebeach.Adetaileddescriptionofsandquantitiesrequiredandplacementlocationforanincreaseindunewidthisgivenintable3.
Theproblemwillbeinfindingasupplyofsuitablesandandatareasonablecost.Foursandsourceshavebeenidentifiedandarebrieflydescribedbelow.
i) Offshoresandeitherfromtheriverdeltastothesouthorshelfsandseveralkilometresoffshore.ThemostprospectivesourceofthissandisconsideredtobethenearshoreareasbetweentheHullRivermouthandTamO’ShanterPoint,duetoitsaccessibility,modernaccumulativehistory,minimaladverseimpactonlocalcoastalprocessesandexpectedlowfinescontent.Thissourceofsandmaynotbeeconomicallyviableforobtainingsmallquantities(<20,000m3)duetothehighcostsofresourceidentification,approvalprocessing,dredgecommissioningandenvironmentalmanagementintheGreatBarrierReefMarinePark.Theeconomicsofusingnearshoresandmayimproveiflargerquantitiesofsandwereneededforbotherosionmitigationandwideningofthedunalbuffer.PreliminarydiscussionswillberequiredwiththeGreatBarrierReefMarineParkAuthorityandtheQueenslandParksandWildlifeServicetodetermineifaccesstothissandispossible.Followingonfromthis,ageotechnicalinvestigationofpotentialsandsourceswouldberequiredtoconfirmthesuitablilityofthesandintheborrowareas,anddiscussionsheldwithdredgeoperatorstoevaluatepracticalityandcost.
ii) OnshoresandfrombeachridgeplainssuchasthatbehindTamO’ShanterPoint.Muchofthissandisonfreeholdlandandextractionthereforerequirestheconsentoftheowner.ArecenttrialbeachnourishmentprojectatSouthMissionBeachusingsuchsanddemonstratedtheviabilityofthisoptionintermsofcostandpracticality.
iii)RiversanddredgedfromtheTullyRiver.WhilethisisaviableoptionastheCouncilcurrentlyholdsdredginglicensesfortheTullyRiver,orcouldobtainsandfromcommercialoperators,thecostoftransporttoSouthMissionBeachcouldproveprohibitive.
iv) Surplussandfromprivateorlocalgovernmentprojects,includinginstallationofseweragepipes,roadupgrading,excavationforprivatedevelopmentsuchasbuildingsorprawnfarmponds.
Anysandsourceneedstobeofasimilarormoderatelylargersizegradingandtohaveafinescontentoflessthan5percenttobesuitable.
Adisadvantageofbeachnourishmentistheperceptionofitshighcostanditstemporarynature,thatis,itisnotseenasapermanentsolution.However,inthepresent

Coastal erosion investigation and management options for South Mission Beach, Cardwell Shire.22
case,arelativelysmallvolumeofsandimportedtotheaffectedsectionofthebeachwouldprovidesignificantbenefits.AnynourishmentsanderodedfromtheplacementareaatthesouthernendofSouthMissionBeachwouldbetransportednorthandthereforeofbenefittothebeachestothenorthoftheexistingrockwall.
Artificiallyplacedsandisgenerallynotasstableasanaturalbeachduetoitstendencytoberedistributedacrosstheintertidalzoneandalongshore.Anourishedbeachhasanabnormalalignment(thehighwatermarkisformedseawardofthepre-existingcoastline)andanover-steepprofile.Duetothesefactors,thereistypicallyanadvantagetoslightlyoverfillanourishedbeachandtoplacesomeormostofthesandintheintertidalzone.
Beachnourishmentworkscouldbecompletedinstages.Thismayhaveadvantagesintermsofresourcesand
funding,andthemonitoringoftheinitialstageswouldprovidevaluableinformationtoassistinimprovingthedesignoffurtherstages.
Thenourishmentsandwillbevulnerabletowinderosionandmaybeblownlandwardsontotheparkorroad.Thesandsurfaceshouldbevegetativelystabilisedwithnativedunegrassesandrunnerssoonafterbeingplaced.A5mwide“starterstrip”ofplantsincludingsandspinifexgrassandgoatsfootshouldbeestablishedonthelandwardedgeofthenewsand.Plantsshouldbeestablishedat1mto1.5mcentres.Thiscanbecombinedwithfertilizingtheexistingnativedunevegetationwithanitrogenousfertiliseratarateof50kgofnitrogenperhaperapplication,repeatedeverytwotothreemonthsasrequired.
-10 0 10 20 30 40 50 60Distance (m)
-1
0
1
2
3
4
Hei
ghta
bove
AH
D(m
)
Profile 14
-10 0 10 20 30 40 50 60Distance (m)
-1
0
1
2
3
4
Hei
ghta
bove
AH
D(m
)
Profile 13
-10 0 10 20 30 40 50 60Distance (m)
-1
0
1
2
3
4
Hei
ghta
bove
AH
D(m
)
Profile 12
-10 0 10 20 30 40 50 60Distance (m)
-1
0
1
2
3
4
Hei
ghta
bove
AH
D(m
)
Profile 11
-10 0 10 20 30 40 50 60Distance (m)
-1
0
1
2
3
4
Hei
ghta
bove
AH
D(m
)
LEGENDProfileatSeptember2002Designnourishedprofile
Profile 5
-10 0 10 20 30 40 50 60Distance (m)
-1
0
1
2
3
4
Hei
ghta
bove
AH
D(m
)
Profile 6
-10 0 10 20 30 40 50 60Distance (m)
-1
0
1
2
3
4
Hei
ghta
bove
AH
D(m
)
Profile 7
-10 0 10 20 30 40 50 60Distance (m)
-1
0
1
2
3
4
Hei
ghta
bove
AH
D(m
)
Profile 8
-10 0 10 20 30 40 50 60Distance (m)
-1
0
1
2
3
4
Hei
ghta
bove
AH
D(m
)
Profile 9
-10 0 10 20 30 40 50 60Distance (m)
-1
0
1
2
3
4
Hei
ghta
bove
AH
D(m
)Profile 10
Figure11.Indicativedesignnourishmentprofilesbasedonsandnourishmentvolumesprovidedintable3tofillerosionalloss.

23Coastal erosion investigation and management options for South Mission Beach, Cardwell Shire.
Survey line/profile
number
Chainage north from boat ramp
Current distance
from road edge to HAT
Nourishment sand
required to fill erosion
loss
Estimated HAT
extension Seaward
New distance
from road edge
Additional sand
required to extend
distance from road
edge to HAT to 20m
Additional sand
required to extend
distance from road
edge to HAT to 45m
(m) (m) (m3) (m) (m) (m3) (m)
1 2100
2000 >45
2 1900 >45
1800 >45
3 1700 43 43 1000
1600 31 31 7000
4 1500 37 37 4000
1400 35 35 5000
5 1300 33 500 0 33 6000
1200 29 500 <2 29 8000
6 1100 25 500 <2 25 10,000
1000 25 1000 4 29 8000
7 900 15 1500 5 20 12,500
800 15 2000 5 20 12,500
8 700 12 2500 5 17 1500 14,000
9 600 11 3000 7 18 1000 13,500
10 500 10 3000 5 15 2500 15,000
11 400 14 2000 0 14 3000 15,500
12 300 11 2000 0 11 4500 17,000
13 200 14 1000 0 14 3000 15,500
14 100 10 500 0 10 5000 15,500
Total sand volume
20,000 20,500 180,000
Table3Effectsofsandnourishmentvolumesonincreasingthewidthofthedunesystem(HATextensionseaward)
6.3 Local sand relocationWhereerosionisconsideredaslocalised,wherethesandismovedonlyarelativelyshortdistanceoffshoreoralongthecoast,somerelieffromerosioncanbegainedfrommechanicallyrelocatingthesandbacktowhereitwaserodedfrom.Inthesimplestexample,sandcanbescrapedfromtheintertidalareaoradjacentsandbarsimmediatelyoffshoreandmovedtotheupperbeach.Thisusuallyhasonlyshorttomedium-termbenefitsastheplacedsandwillberedistributedbywaveandtidalactiontoreformtheoriginalequilibriumprofile.Thatis,itwillwanttogetbacktoitsoriginalshape.Thefurtheroffshorethesandistakenfromandtheshallowerthematerialisskimmed,theslowertheredistributionprocesswillbe.
Sandcanalsobemovedfromaccumulationareasupcoastordowncoastfromtheerodedarea,usuallyatspitsorcreekmouths.Thismayinvolvelongerandmorecomplextransportarrangements.
Localsandrelocationisusuallymoreusefulformanagingshort-termerosioneventsassociatedwithstormsorextremetides,andpocketsoferosionassociatedwithstormwaterwashouts.

Coastal erosion investigation and management options for South Mission Beach, Cardwell Shire.24
Application to South Mission BeachAtSouthMissionBeachsandissometimespushedfromtheupperbeachtoerosionscarpsoraroundthebaseoftreestoprotectagainstkingtidesorothershort-termevents.Thistechniqueprovidesonlyshort-termbenefit.
ThisstudyhasindicatedthatsanderodedfromthesouthernendofSouthMissionBeachtendstoaccumulatetothenorthinthevicinityofWheatleysCreek.Thereforethisareacouldpotentiallybeusedasasourceofsandtoreplenishthesouthernbeach.Thisisconsideredaslocalsandrelocationratherthanbeachnourishment,asthesandborrowareaisstillpartoftheactivebeachsystem.Twooptionsforremovingsandareidentifiedbelow:
i) WheatleysCreekmouthisoccasionallyopenedtothesouthtoovercomechannelmigrationtothenorth,whichaffectsfreeholdproperties.Theremaybeanopportunityforsandremovedtoberelocatedsouthatthesametime.
ii) Thebeachareafor500mimmediatelysouthofWheatleysCreekcouldbeconsideredasasourceofnourishmentsand,asthisareaisslowlybuildingup.However,itissuggestedthattheborrowquantitybelimitedto5000m3andberemovedfromtheupperintertidalzonetolimitbeachrecessionadjacenttotheborrowarea.Beachrecessionshouldbelessthan1mandasthissiteiswellnorthofresidentialdevelopment,theerosionshouldnotbeofconcern.Observationofthebeachresponsewouldberequiredbeforefurthersandremovalisconsidered.Thissourcewillthereforeonlyprovideaportionofthenourishmentsandrequirement.
Relocationofsandisusuallyachievedusingscrapersandortrucktransport.ArelativenewdredgingtechniqueknownastheSandShiftermayalsobeworthconsideringatthissite.Thisisarelativelylowcost,methodwheresandisextractedusingasubmergedsuctionheadandpumpedasasandslurrytothereplenishmentarea.Significantinvestigationwouldberequiredtoestablishtheapplicabilityofthistechniquetothissite,includingcoresamplingtoidentifyanadequateresourceofsuitablesandatdepthsofupto6m.
Theuseofsandfromthislocationwouldbesubjecttoanassessmentofenvironmentalimpacts.
6.4 RevetmentsRevetmentwallsaregenerallysuccessfulatcontrollingshorelinerecession.However,revetmentscantransfererosionoftheadjoiningbeachbylockingupsandreservesinthedunes,andpreventanewbeachfrombuildingup.Byconstructingarevetmentwallalongtheexistingerosionescarpment,sandlandwardofthewallisisolatedfromtheactivebeachsystemandthevolume
ofsandavailablefornormalbeachmovementsislimitedtothatseawardofthewall.Duringastormeventwhensandiswashedoffshore,limitedsandsupplycanbequicklyeroded,resultinginthereductionofbeachlevels.Whenwavesbreakagainstthewall,thelossofsandisfurtherhastenedaswaveenergyispartiallyreflectedfromthewallandtherateofsandtransportalongthebeachisincreasedasthewallsinduceorincreasenearshorecurrents.
Revetmentwallsdonotnecessarilypreventtheaccumulationofsandontothebeachduringperiodsofaccretion.However,revetmentsalmostalwaysleadtoincreasederosioneffectsatthedowndriftendofthewall.Accordingly,revetmentsshouldonlybeconsideredwhenprivatepropertyorpublicinfrastructurethatcannotberelocatedisunderdirectthreat,andshouldbelocatedasfarlandwardaspracticabletomaintainadunalbufferzoneandbeachamenity.
Application to South Mission BeachIndiscussingtheapplicabilityofrevetmentwallstoaddresstheerosionproblematSouthMissionBeachtwomattersneedtobeconsidered:
• Whetherrockwallsareanappropriatesolutiontostoperosion;and
• Anappropriatedesignandalignmentofanysuchrevetment.
Itisconsideredthatthecontinueduseofrockwallprotectiontomitigatethelong-termtrendoferosionisnotaneffectiveoption.Asalreadyevident,thissimplyresultsinthetransferoftheproblemfurthernorthward,thusleadingtoaneedtofurtherextendthewall.Thisapproachalsolowersthebeachprofileseawardofthewallcausingprogressivelossoftheusablebeach.Furthermore,awallconstructedonthescarpfaceislikelytobecomeapermanentvisualfeatureonthebeach,degradingtheamenityvalueofthearea.
ItisrecognisedthatthepresentconfigurationofthebeachfrontareaofSouthMissionBeachisvulnerabletodamagefromextremewavesandelevatedwaterlevelsassociatedwithaseveretropicalcyclone.TheroadandotherinfrastructuresuchastheCounciltoiletblocknearJackeyJackeyStreetareatriskofdamage.
TheexistingrevetmentwallsatSouthMissionBeachhavebeenconstructedbyenddumpingrockoverthescarpfaceinresponsetolocalisederosionevents.Thewallshavenotbeendesignedtowithstandaspecificevent,whichdeterminesarmorsize,anddonotincludetoescourprotection,orafilterlayerandsignificantcrestelevationtopreventcollapsefromthewashingofsedimentsfrombehindthewall.Theexistingrevetmentwall,initspresentcondition,wouldprobablyprovideonlylimitedprotection.

25Coastal erosion investigation and management options for South Mission Beach, Cardwell Shire.
Anupgradedrevetmentwallwouldberequiredtoreducethepresenterosionrisk,andiftheCouncildecidedtoproceed,theEPAwouldrecommendthatthewallbedesignedtowithstandaminimumonein50yearaveragerecurrenceintervalstormevent(seeTable1).TheCouncilwouldneedfurtherstructuraldesignadvicebeforeproceedingtoactualconstructionofawall.Asacostindicatorofanadequatelydesignedrevetment,arecentlyconstructedrockrevetmentwallatHollowaysBeachatCairnscostapproximately$3000/m.Optimizingthisdesigntolocalconditionsasdetailedbelowmayreducethiscosttounder$2000/m.
Itmaybecostprohibitivetoconstructawallovertheentire1600mlengthofKennedyEsplanadeatanindicativecostof$3.2million.Duetothepresenttrendoferosion,itmaynotbefeasibletomaintainaduneandbeachalongthesouthernmostsectionofSouthMissionBeachatalltimes.Accordingly,thesectionofwall(e.g.southfromJackeyJackeyStreet)shouldberetainedandupgraded.
IfconstructionofarockrevetmentwallalongthelengthofKennedyEsplanadeiscontemplated,thewallshouldbedesignedsothatitremainsburiedasfarbehindtheactivebeachprofileaspossible.Thewallwouldthereforefunctionprincipallyasabackstoptolimitcoastalrecessiononlyduringseverestormevents.Ingeneralterms,thealignmentofarockrevetmentwallshouldbelocatedasfarlandwardaspossible.Theintentionistoencouragethemaintenanceofasandybeachseawardofthewallandthereforereducetheexposureofthewalltodirectwaveaction.Thisincreasestheeffectivenessofthewallduringstorms,minimisesadverseimpactstotheadjacentbeachandavoidsexcessiveongoingmaintenancecosts.
Inthisscenario,thedesignofanupgradedrevetmentwallcouldbeoptimisedbyacceptingalimitedamountofdamagetothewallduringasevereevent.Thiswouldreducetheinitialcostswhilestillprovidinganacceptablelevelofprotection,asfollows:
• Thewallisintendedtoprotecttheroadfromwaveattackonly,andnotadjacentprivatedevelopmentfromstormsurge.
• Thewallcrestlevelwouldbesetatabouttheroadsurfaceheight.Thewallmaybeovertoppedduringdesignconditions,andthereforesomeinundationanddamagetotheroadsurfacemaybeexpected.
• Thearmorsizecouldbereducedsuchthatthewallwouldpartially“fail”duringtheworstofthestormconditionsalthoughthebulkofthewallwillremaininplacetolimittheamountofsubsequenterosion.(Thelikelyfailuremodeofthistypeofseawallisthedislodgementofarmorunitsbywaveactionfollowedbyslumping).Atypicalarmorsizerangeis500-2000kgwithamediansizeof1500kgisindicated.In
thepresentcasethemedianarmorsizecouldbereducedtosay1000kg,althoughtheminimumsizeof500kgshouldberetained.Thiscouldalsoreducecostsofsourcingmaterialandsubsequenthandling.
• Thedepthofthetoeofthewallshouldbesettoalevelthatwouldwithstandunderminingduringthedesignstormconditions.Typicallythetoeofaseawallwouldbeconstructedtoatleastthelowestastronomicaltidelevel.However,assumingthevolumeofsandonthebeachseawardofthestructurehasbeenmaintainedviaanourishmentprogram,ahighertoelevel(saymeanlowwaterspringstidallevel)couldbeused.
ItshouldbenotedthattheaboveremarksarepreliminaryadviceonlyandtheCouncilshouldseekdetailedstructuraldesignadvice.
6.5 Groynes and artificial reefsGroynesconstructedperpendiculartothecoastlinecanbeusedtotraplongshoresedimenttransport,producinganaccumulationofsandontheupdriftsideofthegroyne.However,thedowndriftbeachiscorrespondinglystarvedofsand,resultinginanerosionproblembeingtransferredtoandconcentratedinthisarea.Unlessthisdowndrifterosionisacceptable,theconstructionofgroyneswithoutassociatedbeachnourishmentwillnotsolveerosionproblems.Accordingly,theconstructionofgroyneswithoutassociatedbeachnourishmentshouldnotbeconsidered,astheerosionproblemwillbetransferredfurtheralongthebeach.AtSouthMissionBeachwherethereisnonewsandenteringthebeachcompartmentfromthesouth,virtuallyallsandwouldhavetobeimportedtoreconstructthebeach.
Groynesareoftenbuiltinconjunctionwithbeachnourishmentprogramswherethegroyneactsasanendstructuretoretainthenourishmentsandandextendthelifeoftheworks.However,thereisnonaturalendpointforsuchastructureonthisbeach.Intheabovesituationsgroyneswithbeachnourishmentwillhaveasignificantlyhighercostthanbeachnourishmentalone.
GroynesarenotconsideredanacceptablesolutionfortheerosionatSouthMissionBeachforthereasonslistedabove,andforthesignificantchangestheywouldcausetothevisualamenityandusabilityofthebeach.
Artificialreefscanmodifythelocalwaveclimateandextendthelifeofbeachnourishment.Buttheymayhavesimilardisadvantagestogroynes,anditisexpectedthattheywouldhaveasignificantlyhigherinvestigationandestablishmentcost.

Coastal erosion investigation and management options for South Mission Beach, Cardwell Shire.26
7.0 ConclusionsItisconcludedthat:
i) ThesouthernendofSouthMissionBeachisexperiencingslowbutchroniclong-termerosion,wheresandisbeingtransportedfromthesouthernandcentralendsofthebeachanddepositedonthenorthernend.Thisisconsideredtobeanaturalcoastalprocessredistributingsedimentwithinthisbeachcompartment,withtransportcurrentlytothenorth.
ii) KennedyEsplanadefrontingSouthMissionBeach,isrelativelynarrowandhasbeendevelopedforroadandparkuse.Thisroadandassociatedinfrastructurearevulnerabletolossordamagefromseaerosionandshorelinerecessionthatmayoccurduringaseveretropicalcycloneduetothelimiteddunalbufferzoneseawardoftheroadandparkfacilities.
iii) Therevetmentwallconstructedalongthesouthernsectionofthiscoastisconsideredinadequatetopreventerosionduringaseveretropicalcyclone,andinsomesectionsthewallhasbeencompletelyineffectiveagainsterosion,withthescarpfaceretreatingbehindthewall,andmaterialfromthecollapsedwallbeingspreadoverthebeach.
iv) TherevetmentwallhasledtoanaccelerationoferosionandshorelineretreatinthesouthernpartofSouthMissionBeach,andcontinuationofthewallnorthwillacceleratetheprogressionoftheerosionproblemfurthernorth.Furthermore,constructionofthewallhasisolatedsandbehinditfromactivecoastalprocesses.Astheerosionprocesscontinuesandsedimentcontinuestoberemoved,theupperbeachinfrontofthewallwillnarrowandthebeachlevelwillgenerallydrop,affectingbeachamenityandusability.Itisconsideredthatthecontinueduseofarevetmentwallalonetoprovideprotectionandmitigatethelong-termtrendoferosionisnotaneffectivestrategyifbeachamenityistoberetained.
v) Therelativelyslowrateoferosionofthissectionofcoastmakesbeachnourishmentanattractiveerosionmanagementstrategyifasourceofsandatreasonablecostcanbeidentified.Beachnourishmentcanbothincreasethewidthofthedunalbufferzone,increasingthelevelofprotectiontoinfrastructureontheEsplanade,andmaintainorimprovebeachamenity.
vi) Infrastructurebehindthebeachisvulnerabletolossbyerosionduringextremecyclonicevents.Beachnourishment,inadditiontothatrequiredforthereplacementoferosionallosses,couldbeusedtowidenthebeachanddunesystemtoincreasethebufferingcapacityofthedunesystemagainstseaerosionduringstormevents.
vii) RockrevetmentprotectionworksfortheentirelengthofKennedyEsplanade(constructedtoanadequatestandard)wouldbeexpensive.Basedonanindicativecostof$2,000-$3,000/m,totalcostscouldexceed$3M.Thecostcouldprobablyonlybejustifiedifthepresentlevelofriskofstormerosiondamagetotheroadwasconsideredunacceptable.ThesectionofwallfromtheboatramptoJackeyJackeyStreetisofasignificantsizeandclosetotheroad,andshouldbeupgradedtoanappropriatestandard.Rubblerevetmentwallsfurthernorthshouldberemovedpriortotheplacementofnourishmentsand.ItshouldbenotedthatarockrevetmentwalleastoftheEsplanadeshouldonlybeconsideredfortheprotectionofCouncilassets.Worksfortheprotectionofprivatepropertyshouldbeconstructedwithinoradjacenttothefreeholdpropertyboundary.
viii) Thecurrentmethodofdisposingofstormwaterintosoakagepitsintheforedunehashadtheeffectofraisinggroundwaterlevels,fluidizingthesandandlocallyacceleratingtheerosionoftheupperbeach.Analternativestormwaterdisposalmethod,whichdischargesstormwaterdirectlytothebeach,isrequiredtoovercomethisproblem.
8.0 RecommendationsProvidedbelowarerecommendationsonpreferredactionsformanagingseaerosionatSouthMissionBeachforconsiderationbyCardwellShireCouncil:
i) Beachnourishmentshouldbeundertakenonthecentralandsouthernsectionsofthebeachtoreplacehistoricalseaerosionlosses,therebyre-establishingadunalzoneandraisingthebeachlevel.Thiswilloffsetthepresentsandlossfromthisareaandincreasetheprotectionfromfuturestormeventsprovidedbytheforedune.Aminimum20,000m3ofimportedsandisrequiredtorestorethebeachtothestatethatexistedsome30yearsago,andwouldprovideforthewideningoftheupperbeachbyupto7minthemosterodedsectionofthiscoast.
ii) Averageannualbeachrenourishmentatanannualisedrateof700m3shouldbeundertakentomatchongoinglosses.Thiscanbeachievedbyinclusionintheinitialnourishmentprogramofa10-yearlossprovision,orbyperiodictopups.
iii) Wideningofthedunalzonebybeachnourishmentinadditiontoi)andii)aboveshouldbeconsideredasameansofminimizingtheimpactoffutureerosioneventsoninfrastructureontheesplanade.Aminimumof20,000m3ofsandwouldberequired,dependingonthelevelofprotectionrequired.

27Coastal erosion investigation and management options for South Mission Beach, Cardwell Shire.
iv) ThesouthernsectionofrockrevetmentwallfromtheboatramptoJackeyJackeyStshouldbeupgradedtoastandardappropriatetowithstanddamagefromaseverestormeventwithanARIof50yearsminimum.Rubblewallstothenorthshouldberemovedandthereconstructeddunerelieduponastheprimaryprotectionagainstwaveattackandseaerosion.
v) Theuseofsoakagepitsontheforeduneforstormwaterdissipationshouldbediscontinued,withstormwaterbeingdischargeddirectlyacrossthebeach.Thenumberofstormwateroutletsshouldbeminimisedasispracticalandstormwaterflowimpactsmanagedbytheuseofenergydissipaters,andwaterqualitymanagedthroughtheuseoflittertraps.DueregardshouldbegiventotherequirementoftheEnvironmentalProtection(Water)Policy1997forurbanstormwaterqualitymanagement.
vi) TheplacementofpermanentdevelopmentontheEsplanadeshouldbeavoided,butwherethisisnotpossible,locatedasfarlandwardasispractical.
vii) Allpublicinfrastructure,includingpower,waterandsewerageshouldbelocatedonthelandwardsideoftheroadtominimiseriskoflossduringfutureerosionevents.
viii) Parkfacilitiesshouldbelocatedasclosetotheroadedgeasispractical,ordesignedtoberelocatableintheeventofanerosionthreat.
ix) Monitoringofbeachprofilesshouldbeundertakenannuallytomonitormovementofthenourishmentsandandimproveestimatesofrenourishmentvolumes.
x) Anysandnourishmentprogramshouldincluderevegetationworkstoreinstatethesandtrappingdunevegetationtostabilisethedunesandpreventwinderosion.Thiswouldalsoneedtoincludecontrolofpedestrianaccesstothebeachandreplacementoftreespreviouslylosttoerosion.
9.0 Additional information9.1 Statutory obligationsAnyworksundertakenatSouthMissionBeachmayrequireanapprovalundertheCoastalProtectionandManagementAct1995,IntegratedPlanningAct1997andapermitundertheMarineParksAct1982administeredbytheEnvironmentalProtectionAgency.TheuseofoffshoresourcesofsandmaybeconstrainedbybeinglocatedintheGreatBarrierReefMarineParkworldheritageareaandaStateMarinePark,asdescribedintherelevantMarineParkZoningPlan.
9.2 State assistance with fundingCertainworksforbeachprotectionpurposes,includingbeachnourishmentandrevegetation,maybeeligibleforaStateGovernmentsubsidyof25percentofthecostoftheworksundertheLocalGoverningBodies’CapitalWorksLoanSubsidySchemeadministeredbytheDepartmentofLocalGovernmentandPlanning.Othertypesofworksmaybeeligibleforalowerlevelofsubsidy.

Coastal erosion investigation and management options for South Mission Beach, Cardwell Shire.28
�0.0 ReferencesBeachProtectionAuthority(1997).StormTideStatistics–CardwellRegion,ConservationStormTideDataReportNo1.DepartmentofEnvironment,Queensland.
CoastalManagementBranch(1997).Management of the Dune/BeachRidgeSystematSouthMissionBeach.Internalreport.DepartmentofEnvironment,Queensland.
EnvironmentalProtectionAgency(2003).Cardwell-HinchinbrookRegionalCoastalManagementPlan.QueenslandGovernment.
Holmes,K.H.(1993).TullyRiverCoastalSector.MarineandCoastalGeologyUnitProjectReportMA50/4,DepartmentofMineralsandEnergy,Queensland.
JamesCookUniversity(2003)http://tsunami.jcu.edu.au/atlas/wave_atlas.shtml
Masslink,G.andG.Lessa.(1995).Barrier Stratigraphy on theMacrotidalCentralQueenslandCosatline,Australia.JournalofCoastalResearch,Vol11No2,pp454-477.
Pye,K.(1981).RateofDuneReddeninginaHumidTropicalClimate.MacmillianJournalsLtd.
Rust,PPK(1995)StormTideStatistics–Cardwellregion.
Taylor,M.andG.W.Stone,(1996).BeachRidges: AReview.JournalofCoastalResearch,Vol.12No3,pp612-621.
Vellinga,P.(1983).PredictiveComputationalModelforBeachandDuneErosionDuringStormSurges.Proceedings,AmericanSocietyofCivilEngineersSpecialtyConferenceonCoastalStructures,1983,pp806-819.