Geotextiles in Coastal Revetments Geotechnical Considerations Lex Nielsen September 2009
Coastal Engineering Considerations in Bridge Design
Mark Gosselin, Ph.D., P.E.INTERA Incorporated

Coastal Infrastructure
• 29% of the nation’s population within the country’s coastline counties, 76% in Florida
• 60,000 coastal road miles nationwide with approximately 18,000 road miles in Florida – 30%
• 31% of Florida’s ~6,600 bridges tidally influenced
• 55% of total bridge length tidally influenced

Let’s begin…

Outline
• Tides• Sea Level Rise• Hurricane Storm Surge• Waves and Wave Forces• FEMA• Shoreline/Abutment Protection

Tides
• Tides are the rise and fall of sea levels caused by the combined effects of the gravitational forces exerted by the Moon and the Sun and the rotation of the Earth.
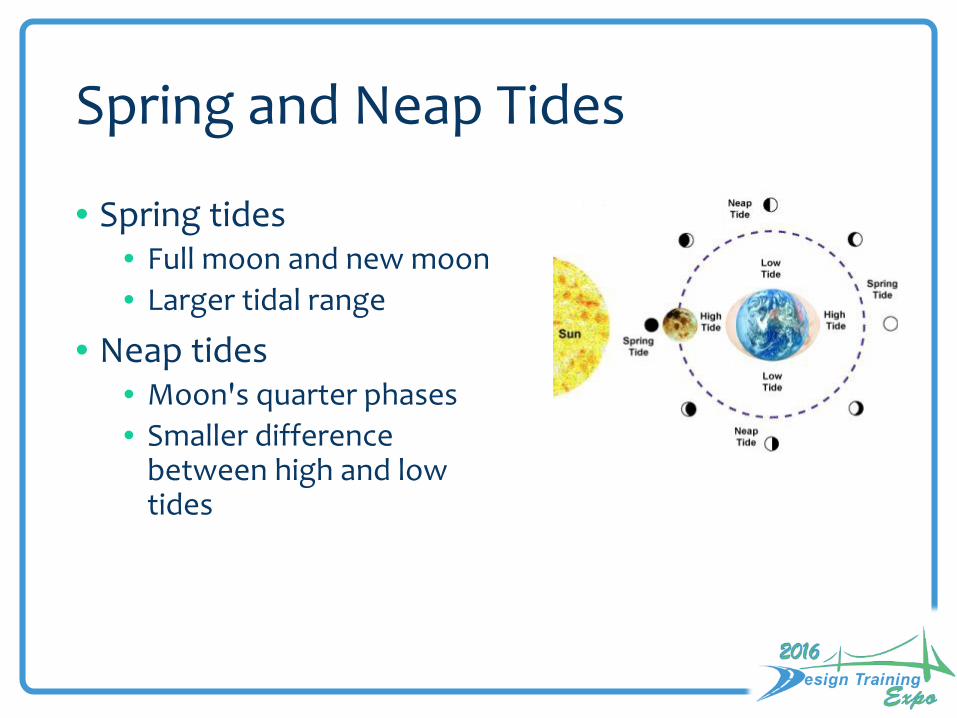
Spring and Neap Tides
• Spring tides • Full moon and new moon• Larger tidal range
• Neap tides• Moon's quarter phases • Smaller difference
between high and low tides

Types of Tides
• Diurnal – one high tide and one low tide per day
• Semidiurnal - two high tides and two low tides per day
• Mixed - two unequal high tides and two unequal low tides per tidal day
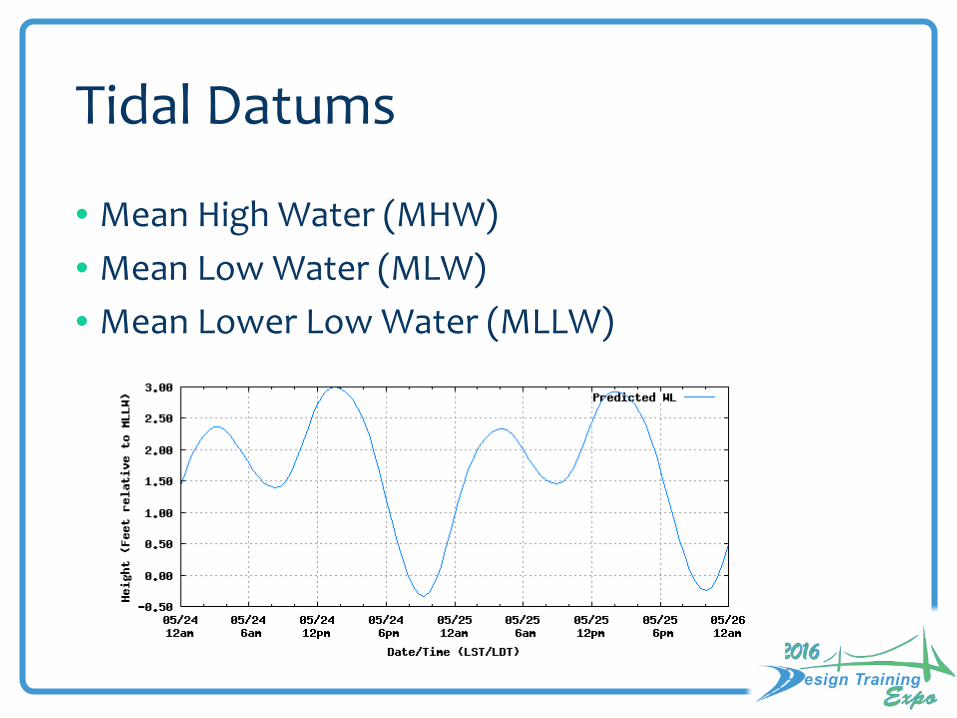
Tidal Datums
• Mean High Water (MHW)• Mean Low Water (MLW)• Mean Lower Low Water (MLLW)


Tidal Datums
• MHW – clearances• Navigation• Aggressive waterways
• Sources• NOAA: http://co-ops.nos.noaa.gov/map/• FDEP: http://labins.org/map/index.html


Sea Level Rise
• The design of coastal projects (including new construction, reconstruction and projects rebuilding drainage systems) must include a sea level rise analysis to assess impacts to design.
• The sea level rise data based on historical tidal records:
• Gathered by National Water Level Observation Network (NWLON)
• Managed by the National Oceanic and Atmospheric Administration (NOAA)


Hurricane Storm Surge
• The rise in water level above the normal astronomical tide level due to the action of a storm
• Components: • Wind set-up• Atmospheric pressure
Reduction• Wave set-up
• Storm Tide

Storm Tide Hydrograph

Storm Tide Hydrograph

Storm Tide Hydrograph
-1
0
1
2
3
4
5
6
7
8
9
9/17 9/18 9/19 9/20
Wat
er S
urfa
ce E
leva
tion
(ft-N
AVD
)
Date
Hurricane Isabel (2003) at Duck, NC
PredictedMeasuredResidual

Hydrodynamic Modeling
• Storm surge boundary conditions• Measured at tide gages• Synthetic hydrographs
• FEMA BFE
• Florida DEP hydrographs


Pensacola
I-10 Bridge
US-98 Bridge

Hurricane Ivan – Case Study
Ivan Wind D
irection @ Landfall

Hurricane Ivan – Case StudyWind Set-up
Wind Set-down
Ivan Wind D
irection @ Landfall

Hurricane Ivan Hindcast
• ADCIRC• SWAN• Boundary conditions
• Tidal potentials• Hurricane Ivan meteorological hindcast
• Spatially and temporally varying• Wind and pressure fields
• “Blanked” the wind for interior waterways

Hurricane Ivan Hindcast
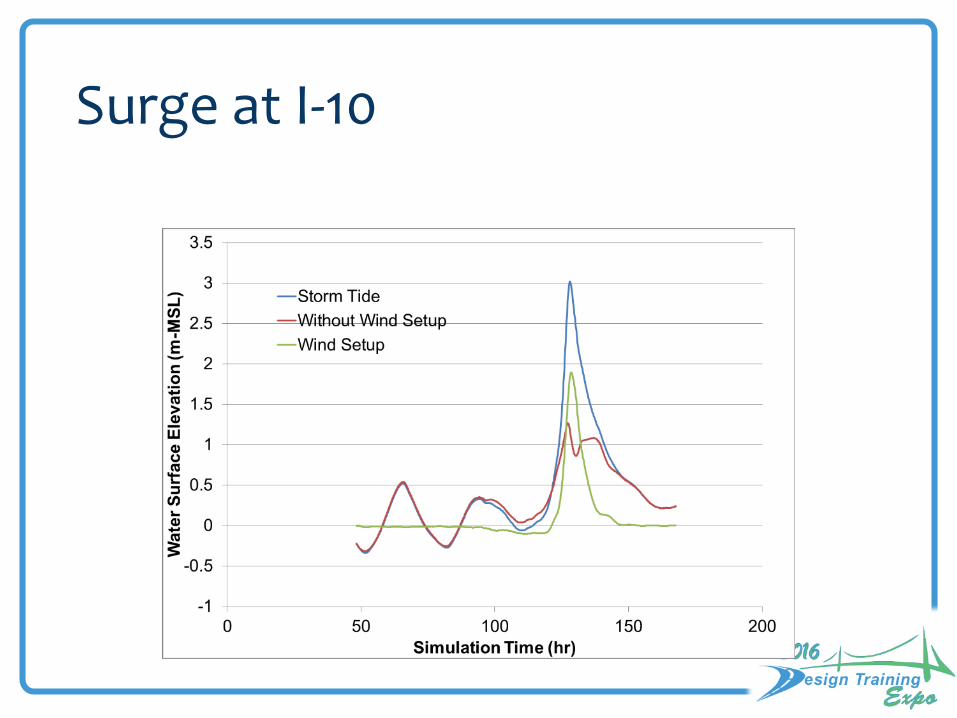
Surge at I-10

Indian River Lagoon - Case Study
Ponce de Leon Inlet
A. Max Brewer Bridge
Sebastian Inlet

Indian River Lagoon - Case Study
~30 mi.
57 mi.


Design Simulation
• ADCIRC• Boundary conditions
• Open coast - FDEP storm surge• Temporally varying spatially constant wind boundary
condition• Magnitude and direction from Hurricane Frances (2004)• Amplified to match 100- and 500-year wind speeds• Very conservative!

Surge at A. Max Brewer Bridge

Velocities at A. Max Brewer Bridge

Wave Climate and Forces
• Design waves generated by hurricane winds
• Open coast• Interior waterways
• Wave loading• Superstructures• Substructures
• Erosion• Shorelines – coastal roadways• Abutments

Wave Induced Damage• Storm surge and wave damage in Gulf of Mexico
states• I-10, Escambia Bay (Pensacola, FL)• US-90, Biloxi Bay (Biloxi, MS)• US-90, Saint Louis Bay (Bay Saint Louis, MS)• I-10, Lake Pontchartrain (New Orleans, LA)

Bridge Failures I10 Bridges over Lake PontchartrainNew Orleans, LA

Bridge Failures
Pensacola, FL Bay Saint Louis, MS
Biloxi, MS Biloxi, MS

Bridge Failures
• Bridge failures attributed to storm surge and wave loading on bridge superstructures
• FHWA-AASHTO study to develop methods for predicting surge/wave forces and moments on bridge superstructures
• Resulted in AASHTO Guide Specifications for Bridges Vulnerable to Coastal Storms

Information Needed for Surge/Wave Force Prediction
• Met/Ocean Conditions• Water elevation• Water depth• Wave parameters
• Significant wave height• Peak period• Maximum wave height
• Structure parameters• Bridge dimensions• Span low chord elevation

Met/Ocean Conditions
• Three levels of analysis identified in the AASHTO Guide Specifications for Bridges Vulnerable to Coastal Storms:

Met/Ocean Conditions
• Three levels of analysis:• Level I – Use existing information, FEMA/other storm
surge elevation, empirical equations for computing wave heights and periods
• Level II – Use improved methods to refine storm surge and wave conditions (may employ computer models for surge and/or waves)
• Level III – More detailed analysis that typically includes hurricane hindcasting

Level of Analyses Comparisons
0
500
1000
1500
2000
2500
3000
3500
1 2 3 4 5 6 7 8 9 10 11 12 13 14 15 16 17 18 19 20 21 22 23 24
Vert
ical
For
ce (k
ips)
Case Number
Level ILevel III
Example Florida Pilot Study Results

Wave ModelingNDBC Gage 42042 During Hurricane Ivan

Definition Sketch

Wave Forces
• Quasi Static Force• Buoyancy• Added mass• Change in added mass• Drag force
• Slamming force• Different for slab and
beam bridges• Load Factors
• Extremely critical -strength limit state -1.75
• Critical - extreme event limit state 1.0

Wave Force Takeaways
• What’s critical?• Owner decides criticality of the bridge
• Get High!• One foot above maximum wave crest elevation• The higher the better (in general)
• Don’t Float!• Flat slabs reduce buoyancy forces• Venting – height of diaphragm

FEMA
• Flood maps and FIS are resources for determining surge or riverine dominance for stage
• Surge may dominate design stage, but runoff may dictate scour conditions
• Storage
• Regulated Floodways - No-rise Certification• In areas subject to storm surge, “normal”
construction will not increase BFE’s• Surge vs. riverine flood thinking
• Still need to check backwater effects for riverine flooding

• Cedar River


Shoreline/Abutment Protection
• Shoreline erosion• Coastal highways
• Abutment protection• Bank and Shore riprap• Coastal riprap
• Designing protection for waves
• Height, Period, Slope• USACE Coastal
Engineering Manual• Take a regional view

Baker’s Haulover Bridge


Questions/Comments?