Coase and Car Repair: Who Should Be Responsible … Coase and Car Repair: Who Should Be Responsible...
41
Coase and Car Repair: Who Should Be Responsible for Emissions of Vehicles in Use? Winston Harrington Virginia D. McConnell Discussion Paper 99-22 February 1999 1616 P Street, NW Washington, DC 20036 Telephone 202-328-5000 Fax 202-939-3460 Internet: http://www.rff.org © 1999 Resources for the Future. All rights reserved. No portion of this paper may be reproduced without permission of the authors. Discussion papers are research materials circulated by their authors for purposes of information and discussion. They have not undergone formal peer review or the editorial treatment accorded RFF books and other publications.
-
Upload
doannguyet -
Category
Documents
-
view
215 -
download
1
Transcript of Coase and Car Repair: Who Should Be Responsible … Coase and Car Repair: Who Should Be Responsible...
Coase and Car Repair: Who ShouldBe Responsible for Emissions ofVehicles in Use?
Winston HarringtonVirginia D. McConnell
Discussion Paper 99-22
February 1999
1616 P Street, NWWashington, DC 20036Telephone 202-328-5000Fax 202-939-3460Internet: http://www.rff.org
© 1999 Resources for the Future. All rights reserved.No portion of this paper may be reproduced withoutpermission of the authors.
Discussion papers are research materials circulated by theirauthors for purposes of information and discussion. Theyhave not undergone formal peer review or the editorialtreatment accorded RFF books and other publications.

ii
Coase and Car Repair: Who Should Be Responsiblefor Emissions of Vehicles in Use?
Winston Harrington and Virginia D. McConnell
Abstract
This paper examines the current assignment of liability for in-use vehicle emissionsand suggests some alternative policies that may reduce the cost and increase theeffectiveness. We first discuss the cost, performance and incentives under current Inspectionand Maintenance (I/M) programs, using the recently implemented Arizona "Enhanced I/M"program as an example. These programs were designed to identify and repair vehicles withmalfunctioning emission control systems. Since their inception, however, I/M programs havebeen plagued by transaction costs that have drastically raised the cost of I/M as well as limitedits effectiveness. These transaction costs fall into three categories: emission monitoring,repair avoidance, and non-transferability of emission reductions. We argue that most of thesetransaction costs can be attributed to the current assignment of liability for I/M to motorists,and we examine the potential for other liability assignments to reduce transaction costs andimprove program efficiency. Among the alternative institutional arrangements discussed aregreater imposition of liability on manufacturers, emission repair subsidies, repair liabilityauctions, and vehicle leasing.
Key Words: mobile sources, emissions, Coase, liability, I/M
JEL Classification Numbers: Q25, Q28, R48

iii
Acknowledgments
This research was partially sponsored by a grant from the Office of Policy, Planningand Evaluation, EPA. It would not have been possible without previous and ongoing researchon vehicle repair by our colleague Amy Ando of RFF. We would like to thank Bob Slott forsharing with us his ideas about vehicle leasing, and we would also like to thank Jim Boyd forilluminating conversations on the economics of extended product liability. Any errors ofcourse remain our own.
iv
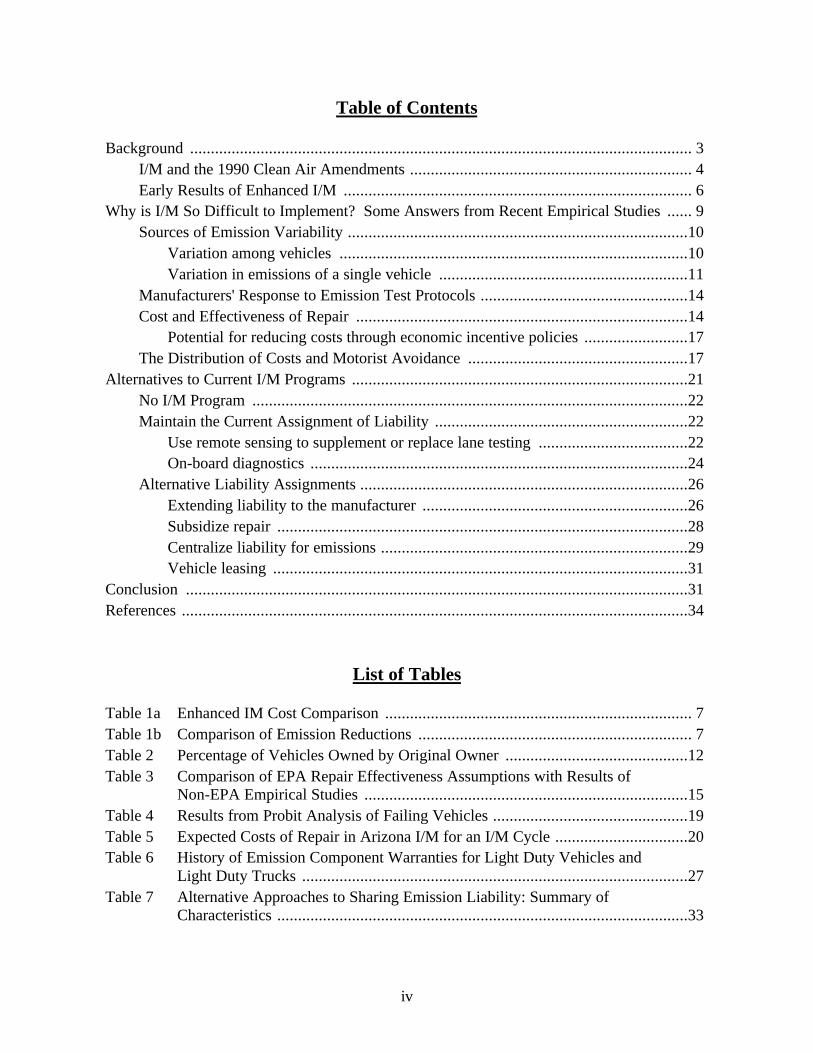
Table of Contents
Background ......................................................................................................................... 3I/M and the 1990 Clean Air Amendments .................................................................... 4Early Results of Enhanced I/M .................................................................................... 6
Why is I/M So Difficult to Implement? Some Answers from Recent Empirical Studies ...... 9Sources of Emission Variability ..................................................................................10
Variation among vehicles ....................................................................................10Variation in emissions of a single vehicle ............................................................11
Manufacturers' Response to Emission Test Protocols ..................................................14Cost and Effectiveness of Repair ................................................................................14
Potential for reducing costs through economic incentive policies .........................17The Distribution of Costs and Motorist Avoidance .....................................................17
Alternatives to Current I/M Programs .................................................................................21No I/M Program .........................................................................................................22Maintain the Current Assignment of Liability .............................................................22
Use remote sensing to supplement or replace lane testing ....................................22On-board diagnostics ...........................................................................................24
Alternative Liability Assignments ...............................................................................26Extending liability to the manufacturer ................................................................26Subsidize repair ...................................................................................................28Centralize liability for emissions ..........................................................................29Vehicle leasing ....................................................................................................31
Conclusion .........................................................................................................................31References ..........................................................................................................................34
List of Tables
Table 1a Enhanced IM Cost Comparison .......................................................................... 7Table 1b Comparison of Emission Reductions .................................................................. 7Table 2 Percentage of Vehicles Owned by Original Owner ............................................12Table 3 Comparison of EPA Repair Effectiveness Assumptions with Results of
Non-EPA Empirical Studies ..............................................................................15Table 4 Results from Probit Analysis of Failing Vehicles ...............................................19Table 5 Expected Costs of Repair in Arizona I/M for an I/M Cycle ................................20Table 6 History of Emission Component Warranties for Light Duty Vehicles and
Light Duty Trucks .............................................................................................27Table 7 Alternative Approaches to Sharing Emission Liability: Summary of
Characteristics ...................................................................................................33
1
COASE AND CAR REPAIR: WHO SHOULD BE RESPONSIBLE
FOR EMISSIONS OF VEHICLES IN USE?
Winston Harrington and Virginia D. McConnell*
Soon after the Federal emission standards for new motor vehicles went into effect in1977,1 it became clear that there was often a great difference between the expectedperformance of the new emission abatement equipment and the actual performance on thehighway. Something else besides new vehicle standards was going to be needed to achievethe ambitious vehicle emission-reduction goals envisioned by Act. The EnvironmentalProtection Agency (EPA)2 therefore encouraged the states to establish vehicle "Inspection andMaintenance" (I/M) programs to conduct periodic emission tests on all vehicles and to requireowners to repair failing vehicles. EPA predicted that these programs would produce majorreductions in emissions of hydrocarbons (HC) and carbon monoxide (CO) at very modestcost. But although the potential of I/M programs to reduce emissions was--and remains--veryhigh, the available evidence suggested that the actual emission reductions attributable to theseearly programs was very small.
In response, Congress established in the 1990 Clean Air Act much more stringentrequirements for state I/M programs. After much delay and vociferous opposition in manystates, these "Enhanced I/M" programs began to be implemented in 1995. Based on earlyevidence in five states, the Enhanced I/M programs are doing a marginally better job ofrepairing dirty cars, but emission reductions are still only a fraction of what had beenexpected from the new program.
Why are the results from these programs so disappointing? Can--and should--anything be done about it? In this paper we will examine alternative approaches to theproblem of reducing emissions of vehicles in use. We take a Coasian perspective, drawing onthat author's insight on the fundamental importance of transaction costs to efficient resourceallocation (Coase, 1961). Each assignment of legal rights and duties entails transaction costs.If those transaction costs are high enough, then transfers of rights and responsibilities will bedisrupted and the efficient outcome may not be achievable. In that case, the preferred initialassignment is the one that minimizes the overall costs, including both the additionaltransactions costs themselves as well as the added cost of the inefficient choices.
* Senior Fellows, Quality of the Environment Division, Resources for the Future.1 The 1977 standards were the first to require catalytic converters. The first federal emission standards for motorvehicles went into effect with the 1974 model year.2 Since its inception the I/M program has been administered by EPA's Office of Mobile Sources. In the paper,whenever we mention EPA, we are almost always referring to OMS.

Harrington and McConnell RFF 99-22
2
Certainly, the current assignment of liabilities in I/M programs--primarily to motoristsfor the emissions of individual vehicles3--causes very high transaction costs. Most of theefforts are devoted to finding dirty cars rather than repairing them. Our recent study(described briefly below) of the Enhanced I/M program in Arizona indicates that only 29 to36 percent of the total costs of the I/M program is devoted to the repair of vehicle emissionsystems; the rest is used for vehicle emission testing. The Arizona experience is typical:failure rates in I/M programs are 5 to 15 percent, so that about ten vehicles need to be testedto find one in need of repair.
Transaction costs also arise because motorists have ample opportunities for evadingthe responsibilities that are imposed on them. Motorists can fail to take emission tests; theymay opt for incomplete repair; they may register their vehicles outside the I/M jurisdictionwhile continuing to use it there, or sell to someone who does so; or they may fail to registertheir vehicles at all. Moreover, those with the biggest incentive to avoid I/M tend to be thosewith the dirtiest vehicles. Even when gross-emitting vehicles are found, many never pass asubsequent retest. In Arizona, for example, 22 percent of vehicles that fail the initial emissiontest never pass any retest. While some of these vehicles may have been removed from thearea or scrapped--both satisfactory outcomes from the standpoint of air quality--it is likelythat a large number are still in local use.
Finally, the current policy prevents the transfer of liability for emission reduction fromone vehicle to another. All vehicles subject to I/M are required to meet emission testsappropriate to their age and vehicle class; those that don't must be repaired until they do.Repair costs are quite heterogeneous, and expenditures bear little relationship to emissionreductions, so that costs could be substantially reduced by shifting resources towards vehiclesthat promise large emission reductions per dollar spent. This may sound like the economist'sstandard argument for economic incentive approaches over command and control. And so itis, but with a twist: Under the current liability assignment, the monitoring methods do notgive results that are sufficiently precise and replicable for individual cars. However, suchprecision is unnecessary to meet the environmental objectives of I/M, for what isenvironmentally important is the sum of emissions of all vehicles in the program area. Ifliability were assigned elsewhere, it would be possible to judge performance on average ortotal emissions for groups of vehicles, which, thanks to the Law of Large Numbers, is muchmore replicable and precise.
The goals of this paper are to describe the current assignment of cost and liability forin-use emissions, explore alternative liability assignments, examine the kinds of policies thatwould be necessary to change those assignments, and inquire into whether the gains fromthese policies would justify those changes.
3 Except for warranty repairs, for which the manufacturers are responsible. This is discussed further below.
Harrington and McConnell RFF 99-22
3
BACKGROUND
I/M programs were first introduced in the U.S. in the late 1970s, enabled by aprovision in the 1977 Clean Air Amendments specifying that approval of StateImplementation Plans would only be granted when "to the extent necessary and practicable"there will be "periodic inspection and testing of motor vehicles to enforce compliance withapplicable emission standards."4 Congress was reacting to accumulating evidence ofdiscrepancies between new vehicle emission certification and actual in-use emissions.
The states responded by establishing programs that differed in detail but were similarin many important respects. Most importantly for present purposes, all the programs put theonus of bringing the vehicle in for testing, as well as the cost of any repairs that might benecessary, on the motorist (except for warranty repairs). This is certainly the simplest andmost natural assignment, and apparently no alternative assignments of responsibility werediscussed. After all, motorists were already responsible for the maintenance of their vehiclesand they were responsible for repairs required to meet mandatory safety inspections.Emission repair does differ in one important respect from ordinary maintenance and safetyrepairs, in that the motorist receives no direct benefit from reduced emissions. Still, makingthe motorist responsible was sensible for at least two reasons. First, some repairs that reducedemissions had other effects that motorists actually cared about, including better driveabilityand better fuel economy. Second, making motorists responsible seemed to be consistent withthe "polluter pay" principle, which by this time had been generally accepted as both an ethicalprinciple and policy prescription.
In most I/M programs the emission test of choice was the "idle" test, performed underno-load conditions by inserting a probe in the tailpipe. Some programs also had visual tests tolook for tampered vehicles. All programs put the onus of bringing the vehicle testing andrepair primarily on the owners. Any vehicle failing the test was required to return withinsome period of time (usually about a month) for a retest. During that period, presumably, theowner would repair the vehicle himself or bear the cost of having it done at a repair shop. (Ifthe vehicle was new enough, then the manufacturer's warranty would cover the repair cost.)To mitigate the financial impact of I/M on individual motorists, however, most programs alsohad "waiver" provisions that put an upper limit on what motorists had to spend on repair.Once this amount was exceeded, motorists were excused from further expense regardless ofthe final emissions of the vehicle.
These state programs fell into two classes: "centralized" ("test-only") programs, whereinspections were conducted at a relatively small number of large specialized facilitiesoperated by the state or by its franchisee; and "decentralized" ("test-and-repair") programs, inwhich motorists took their vehicles to any of a large number of privately-owned repair shops,
4 1977 Clean Air Act Amendments, Title 1, section 110, 2(g).

Harrington and McConnell RFF 99-22
4
garages and auto dealerships certified to conduct emission inspections.5 In decentralizedprograms the I/M tests were often simply added on to the existing safety inspection.
The apparent success of the safety inspection programs6 caused federal policymakersto predict, indeed assume, similar success for I/M. Inventory models for mobile sourceemissions, using optimistic assumptions about high emitter identification rates and repairrates, predicted large emission reductions at relatively low costs from I/M programs. In fact,EPA SIP regulations assumed that simply having a program in place was sufficient for a Stateto get credit for reducing vehicle emissions by 25 percent. Furthermore, an early analysis bythe EPA estimated the cost-effectiveness of I/M programs at less than $650 per ton of VOCemissions reduced (USEPA, 1981).
I/M and the 1990 Clean Air Amendments
By the late 1980s, it had become clear that many of the initial state programs, onwhich the EPA had placed such high expectations, were not very effective. EPA concludedthat certain features of state programs were causing some state programs to fail and advisedCongress to make it difficult for states to continue those features. When the Clean Air Actwas amended in 1990, Congress drastically centralized the program, directing the EPA todetermine where state programs had failed and to come up with stringent program guidelinesfor avoiding or overcoming those failures. The new "Enhanced I/M" regulations were toapply to areas designated as "serious" nonattainment areas and had to be in place withineighteen months.
Working under this tight deadline, EPA's Office of Mobile Sources promulgated newregulations in November 1992.7 Like the old I/M program, the new regulation gave stateswith I/M programs emission "credits" toward the meeting of the SIPs. Instead of a blanket25 percent credit, however, the new regulations gave out credits based on a much moredetailed breakdown of program features. Thus states received reduction credits forimplementing an annual rather than a biennial program, a program that discouragedtampering, etc. These credits made it difficult for the major metropolitan areas in most statesto achieve the emission reductions required to meet SIP requirements without adopting mostof the provisions of the Enhanced I/M rule. Despite the greater sensitivity of the emissioncredits to program design, they were still to be based on program features rather than onmeasured performance in reducing emissions.
The new Enhanced I/M regulation contained three important innovations designed tostrengthen the program and make the state programs more effective at finding and repairingvehicles with excess emissions. These features were aimed at three problems that were
5 In principle, one could have decentralized programs that are test-only and centralized programs that both testand repair, but in practice no such programs developed.6 However, more recent research on safety inspections has called into question the effectiveness of the safetyprogram also. See Leigh, 1994.7 "Inspection /Maintenance Program Requirements: Final Rule." 57 F.R. no. 215, November 5, 1992.
Harrington and McConnell RFF 99-22
5
thought to be the principal problems limiting the effectiveness of state programs. Listed herein order of increasing controversy, they were (i) excessive use of "waivers," (ii) the scope andaccuracy of the emission tests used in the states, and (iii) the combination of test and repair indecentralized programs.
Waivers. The waiver limits in most state programs (typically $50-$75, but as low as$15) were below the cost of many repairs that were likely to be needed to achieve compliance.In response to a specific provision of the 1990 CAAA, the new regulations required thiswaiver limit to be at least $450.
Mandatory dynamometer tests. Research in the early 1980s suggested that the idleemission test in use in most programs was not very effective at identifying high-emittingvehicles, especially among vehicles equipped with the newly-developed electronic fuelinjection. Emissions during idle were not well correlated to emissions when the vehicle wasaccelerating, and worse, a mechanic could often reduce a vehicle's high emissions during idlewithout materially affecting emissions when the vehicle was under load. The idle test wasalso unable to measure emissions of oxides of nitrogen (NOx), a pollutant growing inimportance and concern. EPA developed a technically sophisticated emission test protocolthat included use of expensive automatic analyzers and a dynamometer.8 This dynamometertest, the "IM-240" test, simulated vehicle operation under a variety of speed and accelerationconditions.
Separation of test and repair. Finally, EPA concluded that decentralized test-and-repair programs were less effective than centralized, test-only programs. The new regulationstherefore included a provision limiting the emission credits granted a decentralized, test-and-repair program to 50 percent of the credits available to a centralized program. The reasoningwas that mechanics in test-and-repair stations may have incentives that differ from those ofthe motorist and those of the enforcement agency. On the one hand, they may have anincentive to fail clean vehicles to make repairs that are not really needed. Or, the mechanicmay have incentives to pass vehicles that should fail, as a way of ingratiating themselves tocustomers and assuring repeat business. This was by far the most controversial aspect of thenew regulations, because in the states with decentralized programs there were many in theauto repair industry who had become accustomed to and even dependent on the income fromthose programs and who became a strong and vocal constituency against EPA attempts atcentralization.
The new regulation aroused a great deal of opposition, especially in the states withdecentralized programs. At first the disputants consisted primarily of state politicians andmembers of the independent repair industry, for whom the emission tests and repairs were arevenue source and who had made investment decisions on the assumption that the existingprogram would continue. In California, for example, many garages banned together in anorganization called "Clean Air Performance Professionals" in order to lobby the state
8 A dynamometer is a device for simulating the operation of the vehicle under load.

Harrington and McConnell RFF 99-22
6
legislature. The legislature formed an I/M Review Commission to study California's existingSmog Check program and to make the case that a (possibly revised) Smog Check programcould achieve emission reductions comparable to those projected for the Enhanced I/Mprogram.
The opposition spread to the public at large after a couple of states--Maine andMaryland--actually attempted to implement the Enhanced I/M program. Each was doomed bysevere startup problems involving computer crashes and long queues, and amid claims ofpoorly trained operators causing false positives and damage to vehicles, both programs weresuspended after a short time. As the news of these disasters spread to other states, oppositiongrew. Enhanced I/M became a prime example of "unfunded mandates" and unwarrantedfederal intrusion into matters better left to the states. After the 1994 election the newRepublican-dominated Congress attached a rider to a highway bill9 to prevent the EPA fromautomatically discounting I/M credits in a decentralized program by 50 percent. As a result ofthat and other concessions by the EPA, the states were given much wider flexibility in thedesign of I/M programs.
Early Results of Enhanced I/M
Notwithstanding the teething problems of the early Enhanced I/M programs, severalstates have decided to go forward with a program resembling EPA's Enhanced I/M program,including the use of the IM-240 test: Arizona, Colorado, Maryland, Ohio and Wisconsin.
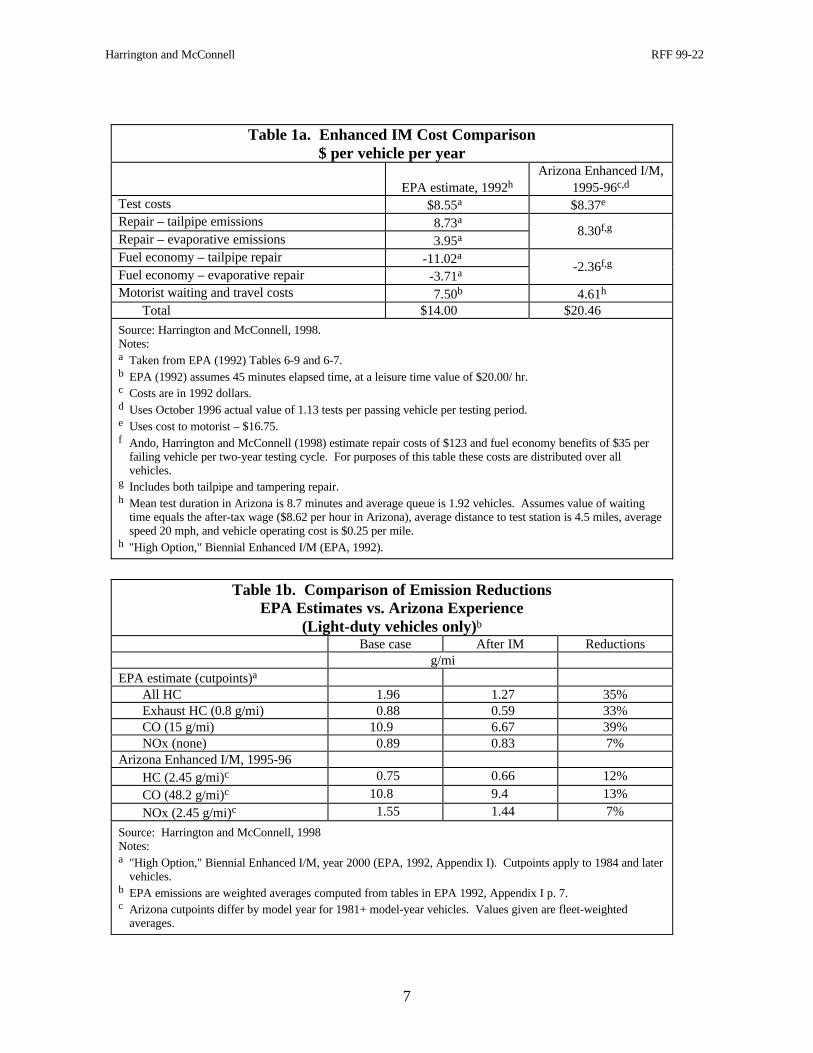
Arizona was the first state to implement an Enhanced I/M, initiating the program in1995. Data from this program has provided the first opportunity to examine how well theperformance of an actual program compared to expectations (Harrington and McConnell,1999). Table 1a compares the costs and emission reductions of the Arizona program to theresults predicted of the "High Option" Enhanced I/M program described by EPA's Office ofMobile Sources in its 1992 Regulatory Impact Analysis (USEPA, 1992). Overall, EPA's totalcost estimates are about 30 percent below our estimates for Arizona, and the main discrepancyis in the very large fuel economy improvements claimed by the EPA compared to our muchmore modest estimates based on the actual results in Arizona. EPA's estimates of the cost ofother components, however, were much closer to the actual estimated outcomes. As shown,the per-vehicle tailpipe repair cost assumed by the RIA is very close to the average repair costper vehicle in Arizona. (The Arizona program does not require evaporative emission tests;however, many of the so-called "tampering" failures in Arizona were due to missing or faultygascaps, which tend to increase evaporative emissions.) The repair cost per registered vehicleis the product of the average cost of an emission repair and the fraction of vehicles that failthe test (i.e. that undergo repair). Compared to EPA estimates, repair costs in Arizona were
9 The National Highway System Designation Act of 1995 (P.L. 104-59).
Harrington and McConnell RFF 99-22
7
Table 1a. Enhanced IM Cost Comparison$ per vehicle per year
EPA estimate, 1992hArizona Enhanced I/M,
1995-96c,d
Test costs $8.55a $8.37e
Repair – tailpipe emissions 8.73a
Repair – evaporative emissions 3.95a 8.30f,g
Fuel economy – tailpipe repair -11.02a
Fuel economy – evaporative repair -3.71a -2.36f,g
Motorist waiting and travel costs 7.50b 4.61h
Total $14.00 $20.46
Source: Harrington and McConnell, 1998.Notes:a Taken from EPA (1992) Tables 6-9 and 6-7.b EPA (1992) assumes 45 minutes elapsed time, at a leisure time value of $20.00/ hr.c Costs are in 1992 dollars.d Uses October 1996 actual value of 1.13 tests per passing vehicle per testing period.e Uses cost to motorist – $16.75.f Ando, Harrington and McConnell (1998) estimate repair costs of $123 and fuel economy benefits of $35 per
failing vehicle per two-year testing cycle. For purposes of this table these costs are distributed over allvehicles.
g Includes both tailpipe and tampering repair.h Mean test duration in Arizona is 8.7 minutes and average queue is 1.92 vehicles. Assumes value of waiting
time equals the after-tax wage ($8.62 per hour in Arizona), average distance to test station is 4.5 miles, averagespeed 20 mph, and vehicle operating cost is $0.25 per mile.
h "High Option," Biennial Enhanced I/M (EPA, 1992).
Table 1b. Comparison of Emission ReductionsEPA Estimates vs. Arizona Experience
(Light-duty vehicles only)b
Base case After IM Reductionsg/mi
EPA estimate (cutpoints)a
All HC 1.96 1.27 35%Exhaust HC (0.8 g/mi) 0.88 0.59 33%CO (15 g/mi) 10.9 6.67 39%NOx (none) 0.89 0.83 7%
Arizona Enhanced I/M, 1995-96HC (2.45 g/mi)c 0.75 0.66 12%
CO (48.2 g/mi)c 10.8 9.4 13%
NOx (2.45 g/mi)c 1.55 1.44 7%
Source: Harrington and McConnell, 1998Notes:a "High Option," Biennial Enhanced I/M, year 2000 (EPA, 1992, Appendix I). Cutpoints apply to 1984 and later
vehicles.b EPA emissions are weighted averages computed from tables in EPA 1992, Appendix I p. 7.c Arizona cutpoints differ by model year for 1981+ model-year vehicles. Values given are fleet-weighted
averages.
Harrington and McConnell RFF 99-22
8
higher but failure rates were lower.10 Our empirical estimates of motorist waiting and travelcost in Arizona actually turned out to be somewhat lower than the EPA assumptions.
The EPA originally forecast that this new generation of I/M programs would besubstantially more effective at reducing emissions than the earlier I/M programs. Using theMOBILE inventory model to estimate vehicle emission reductions,11 EPA predicted thatEnhanced I/M would reduce exhaust HC emissions by 33 percent, and total HC emissions(exhaust plus evaporative) by 35 percent. Reductions in CO emissions of 39 percent and NOxof 7 percent were also predicted. All these predictions were based on assumptions that almostall eligible vehicles would be tested, and that, under relatively strict emissions standards, thosethat needed repair would be fully repaired to the standard. These predictions did not takeaccount of potential implementation issues and, as a result, appear to have been too optimistic.
Table 1b compares the EPA forecasts with the actual emission reductions found forArizona. The Arizona I/M data used are based on failed vehicles that received repair duringall of 1995 and the first half of 1996.12 The measured emissions reductions in Arizona are 12percent for HC, 13 percent for CO and 7 percent for NOx. Although the percentage reductionin NOx emissions are similar in Arizona and the EPA forecast, the initial NOx emissions inArizona are much higher than the EPA estimate. The HC and CO emissions are similar forthe two cases, but the HC and CO reductions are much lower in Arizona. In addition, earlydesigns of Enhanced I/M assumed that evaporative emissions tests for HC would be animportant component of the test procedure, but none of the evaporative tests have proven tobe workable and cost-effective, so no evaporative tests are currently being used in any I/Mprogram. These data provide some evidence that the EPA projections greatly overstated thepotential for emission reduction for HC and CO, and were optimistic about the NOxemissions level in fleet both before and after I/M testing and repair.
Not only did the Enhanced I/M regulation arouse much more opposition than EPAexpected, it also has had a much smaller effect on emissions than anticipated. Evidently thechanges made by EPA had some effect on vehicle emissions, but not enough to produce majorimprovements.
10 EPA assumed the average costs (1992 $) of "transient failures" to be $120 in 1992. NOx repairs wereassumed to be $100, and pressure and purge tests were $38 and $70, respectively (EPA, 1992, p. 84). We foundrepair costs to be about $180 for vehicles that have emission test results that exceed cutpoints, and about $50 forvehicles that that have acceptable emission test results but fail the test anyway. We infer that these vehicles failthe tampering portion of the test.11 Emissions reductions that will occur from I/M programs are estimated from a computer model developed bythe EPA's Office of Mobile Sources in Ann Arbor, Michigan. The results cited here are made using the mostrecent version of this model, Mobile 5B. For a description of the how the model was used to develop theeffectiveness estimates of Enhanced I/M see USEPA (1992).12 The data used are the 2% random sample of vehicles that were given the full 240 second tailpipe test bothbefore and after repair. Arizona has both a fast pass and a fast fail algorithm to shorten the test waiting time.
Harrington and McConnell RFF 99-22
9
WHY IS I/M SO DIFFICULT TO IMPLEMENT?SOME ANSWERS FROM RECENT EMPIRICAL STUDIES
Since 1990 a large number of studies have been carried out that examine I/Mperformance and other aspects of on-road emissions, only some of which had been completedat the time the I/M regulation had been completed. Collectively these results have called intoquestion important aspects of the current approach to in-use emission reductions as embodiedin the I/M program. The data have come largely from three sources: remote sensing studies,repair/scrappage studies, and the newly-implemented I/M programs.
Before reviewing this evidence, we briefly describe remote sensing, an emissionmonitoring technology that allows large number of emission measurements of vehicles in useto be taken quite inexpensively. A remote sensor works by transmitting an infrared beam to areceptor on the other side of a roadway about a foot above the surface. When a vehicle passesthe sensor and its exhaust plume cuts the beam, the device determines concentration of COand of particular species of hydrocarbons relative to that of CO2. Through the use ofstoichiometric principles and by making assumptions about the composition of the fuel, theseratios are then converted to grams of pollutant per gallon of fuel burned. If the vehicle's fueleconomy is known, the emission reading can be further converted to grams per mile, which isthe unit used in emission regulations. At the same time the sensor is making an emissionmeasurement, a camera is taking a snapshot of the vehicle's license plate, so that the emissionreading can be linked to other vehicle characteristics in the database maintained by theDepartment of Motor Vehicles.
Invented by Donald Stedman of the University of Denver, RSD has proven to be quiteuseful in the estimation of average emissions of vehicle populations and subpopulations.Below we consider some ways that RSD might play a more active role in policyimplementation, but so far it has only been accepted for generating data to characterize fleets.For example, in 1991 Stedman and Gary Bishop of the University of Denver and their co-workers used remote sensors to collect emission data vehicles in use in Southern California(see Stedman et al., 1994, for a description). Stedman et al. (1994) were able to assemble acomplete data base on over 90,000 vehicles and using the license plate identification, link toinformation in the California DMV data base. The DMV data base includes vehiclemanufacturer, model year, and vehicle identification number (VIN), which encodes sometechnical information about the vehicle (such as engine and transmission type) as well asowner's address.
Compared to the scheduled lane tests of I/M programs, RSD has advantages anddisadvantages. On the positive side, they are very inexpensive, with costs per measurementbelow 50 cents per test, compared to IM240 costs of $15-20 per test. In addition, RSD trulytests vehicles as they are used--on the road. Among the disadvantages, RSD is thought to beinaccurate, since the measurement is based on less than a second's worth of data, compared toseveral minutes in the IM240 test. RSD is also somewhat constrained by the number ofsuitable sites on the road, and does not measure NOx very well. Nonetheless, the low cost of
Harrington and McConnell RFF 99-22
10
remote sensing studies have enabled extensive data sets for fleet characterization to beperformed, and RSD studies have now been completed in many states and foreign countries.
Now we turn to three areas where recent empirical studies have put I/M in a new andless favorable light: emission variability, cost and effectiveness of emission repair, andmotorist and manufacturer compliance with I/M measures.
Sources of Emission Variability
As is well known, there is substantial emission variability, both among vehicles--variation in average emissions from one vehicle to another--and within vehicles--variation ininstantaneous emissions of the same vehicle at different times. The former is of course whywe have I/M programs in the first place; the object of I/M being to find the vehicles with thegreatest excess emissions and get them repaired. This task is made more difficult by thevariation in emissions within vehicles. In both cases a great deal of the variation is systematicand therefore can be explained by observable vehicle characteristics or operating conditions.However, a good deal has been learned recently about variation in emissions among vehiclesin use that is at odds with the assumptions of I/M programs.
Variation among vehicles
It has long been known that emissions vary by the age and mileage of the vehicle, bymodel year and by vehicle type (i.e. whether car or light truck). The model-year variation is theproduct of the gradual tightening of emission standards between 1973 and the present, so thatemissions from new vehicles in 1995 were less than five percent of the average emissions ofuncontrolled vehicles from the early 1970s. Likewise, the differences between cars and trucks areat least in part attributable to the fact that cars are subject to more exacting emission standards.As vehicles are driven, emission rates increase, probably a consequence of the gradualdeterioration of the emission control equipment and other systems on the vehicle that affectemissions. In the past EPA also distinguished between engine type; otherwise similar vehicleswould have lower emissions if they used electronic fuel injection rather than carburetors. Thisfactor is diminishing in importance as carburetor vehicles are gradually being retired.
Recently other systematic variations in emissions among vehicles in use have beenobserved. For one thing, emissions appear to vary by manufacturer (Ross, 1994; Ross et al.,1995; Bishop et al., 1996). This research has shown that as a rule, an imported vehicle fromEurope have the lower emissions than either a domestic or Asian vehicle of the same age.Certain Asian manufacturers score better than domestic U.S. manufacturers, while others areworse. For some manufacturers, moreover, emission rates of certain (usually more expensive)models are higher on average than others. Variation in emission certification standardscannot explain these outcomes, since vehicles of the same age and class (i.e. whether car ortruck) have to meet the same emission standards. Systematic differences in owners and ownerbehavior could explain part of the differences, at least of vehicles of different quality. Onemight expect, for example, that owners of more expensive vehicles might be more inclined to

Harrington and McConnell RFF 99-22
11
invest in vehicle maintenance. It is more likely, however, that these differences are due to thedurability of the emission control equipment and other engine components that affect theperformance of the emission control system.
While emissions of vehicles gradually increase from normal use, there can be great variationeven in vehicles that were identical when new. The causes of these differences in emissions arelargely unobserved. In part the observed differences are no doubt attributable to random variation inthe quality of parts and assembly, but probably a greater portion are due to differences in vehicleoperation, fueling and maintenance, especially maintenance (Beaton et al., 1995).
Differences in maintenance probably account for the apparent correlations between avehicle's emissions and the owners socioeconomic status, even when correcting for vehicleage (Harrington, 1997).13 Maybe this correlation arises because lower-income individualstend to spend less on vehicle maintenance. Another possible explanation is the tendency of"lemons" and poorly maintained vehicles to enter the used car market to be bought by low-income purchasers. Some support for this idea has emerged from a recent in-use emissionstudy finding that vehicles with transferred ownership had substantially higher emissions thanvehicles still owned by the original owner (Slott, 1997). As shown in Table 2, higher-incomehouseholds are far more likely to be the original owners of vehicles regardless of age.
Some of these findings call into question the invocation of the "polluter pay" principle tojustify making motorists responsible for in use emissions. Is the polluter the current owner? Orperhaps the manufacturer whose emission control system failed to last? Or is it a previous ownerwho failed to maintain the vehicle properly and then unloaded it? In either case it is far fromclear that inferiority of the emission control system was reflected in the price of the vehicle.
Variation in emissions of a single vehicle
Profiles of emissions of a single vehicle over time show enormous variation anddepend on many variables, including vehicle speed, acceleration and whether the vehicle is ina "cold start" mode. To allow for this variation and to obtain emission estimates with somecorrespondence to real-world outcomes, EPA has developed the Federal Test Procedure(FTP), an emission test administered to new vehicles to certify compliance with new vehiclestandards. The FTP has also come to be the "gold standard" against which all other emissiontests are measured. In developing a new emission test for I/M programs, EPA strove to makethe test correlate as closely as possible to the FTP, and in fact the IM240 test developed byEPA consists of the first four minutes of the FTP trace.14
13 This study used an RSD data set collected in California in 1991. The correlation observed was actuallybetween emissions and average income in the owner's zip code, extracted from vehicle registration database. Zipcode income is a far from perfect proxy for household income; it may in fact be a better proxy for education.But in either case it suggests that owners' socioeconomic status can strongly affect vehicle emissions.14 The test trace is the pattern of speed and acceleration that the vehicle must follow during the test. Aside fromtest length, the major difference between the two test is that the FTP is designed to measure both cold-start and hot-running emissions, but the IM240 is only designed to measure the latter. Regressions of the relevant portion of anFTP test against an IM240 test on the same vehicle have R-squares of about 0.7 for NOx, and 0.8 for HC and CO.

Harrington and McConnell RFF 99-22
12
Table 2. Percentage of Vehicles Owned by Original Owner,by household income and vintage
Household income 1981-85 1986-89 1990-93 1994-98
0-$5000 11 16 41 59
$5000-10000 13 27 41 42
$10000-15000 15 29 46 58
$15000-20000 16 28 50 68
$20000-25000 20 30 52 68
$25000-30000 18 33 51 74
$30000-35000 21 35 53 73
$35000-40000 21 35 55 75
$40000-45000 26 40 57 77
$45000-50000 23 42 57 79
$50000-55000 26 39 57 78
$55000-$60000 29 44 61 82
$60000-65000 26 45 66 85
$65000-70000 32 48 65 82
$70000-75000 34 53 63 83
$75000-80000 31 51 66 85
$80000-100000 39 55 68 89
$100000 or greater 41 58 76 91
Source: 1995 Nationwide Personal Transportation Survey
To be useful for this purpose the FTP must be representative of the speeds andaccelerations found in ordinary urban driving and replicable (i.e. successive tests on the samevehicle must give virtually identical results unless the vehicle has been altered). It may beneither. Today neither the FTP nor the IM240 test include the highest acceleration rates foundin everyday driving. Emission inventories based on FTP and IM240 test results can thereforemis-estimate fleet emissions if emission rates are different during high-emission episodes.
While the EPA is aware that the FTP is not totally representative of modern urbandriving and has done research on alternative test traces, it tacitly assumes the FTP isreplicable. (Replicability is after all implied by the use of the FTP as a gold standard.)However, it is not clear that FTP results are replicable for all vehicles, or even that replicable

Harrington and McConnell RFF 99-22
13
results are possible. For emission test results to be replicable, all the variation in successivetests must be due to measurement error, or more precisely, that the emission test controls forall the variables capable of affecting vehicle emissions. The limited evidence provided byrepeated tests on the same vehicle at approximately the same time shows that emissionvariation--on some cars, at any rate--cannot be explained by test variation alone. If emissiontest variation were attributable only to measurement error, then the error variance would beindependent of mean emissions. However, when Bishop, Stedman and Ashbaugh (1996)examined emission test results from several sources, including FTP tests done as part of theAuto-Oil Program,15 they found that successive FTP tests on the same vehicles can havedrastically different results. In general, the greater the mean emission rate, the greater thevariation as well. Clearly, vehicles with the greatest mean emissions are the ones it is mostimportant to identify in an I/M program, and it is precisely these vehicles for which testreplicability is in doubt.
If the test variation is large relative to the mean test result, i.e. a high signal-to-noiseratio, then motorists have a simple strategy for avoiding repair of high-emitting vehicles:Repeat the test until you pass. Given current practice in many states of not charging for aretest, motorists may repeat the test indefinitely; there is no way of determining at each visitto the testing station whether any serious repair attempts have been made. Obviously thisstrategy will not work for all vehicles, but in fact it is not known how often it will work.Examination of IM240 data for Arizona suggests that it is being employed on occasion, sincethere are vehicles that have appeared for testing more than five times. What is not known isthe number of ordinarily high-emitting vehicles that got lucky and passed the emission test on,say, their third or fourth try. Again, more precise emission tests may reduce the instance ofthis phenomenon, but it cannot eliminate it as long as vehicle emissions are themselvesinherently variable.
Inherent vehicle variability also has implications for how the emission reductionsattributable to I/M are calculated. Emission improvements are determined by taking the differencein emissions between the vehicle's initial test result and its final result. Since the improvements aredetermined only by examining the emissions of the vehicles that fail, a bias is introduced. To seethis most clearly, suppose that all vehicles have the same underlying emission distribution, so thatany vehicle that fails the emission test does so only because of random error. Suppose also thatvehicles receive no repair but are simply tested repeatedly until an emission test is passed. Clearly,measurement of emission reductions in the customary way would show positive emissionreductions, even though no emission reductions have been achieved.
Few critics claim that all the emission reductions claimed by I/M are spurious in thisfashion, but the fact is that no one knows how extensive this problem of "regression to themean" is. As long as there is unexplained emission variability, it can only be determined by
15 This was the popular name of the Air Quality Improvement Research Program, a research effort undertakenin 1990 by a consortium of automobile and oil companies to examine the emission implications of fuelmodifications specified in the 1990 Clean Air Act Amendments.
Harrington and McConnell RFF 99-22
14
repeated tests on the same vehicle. The EPA has largely ignored the issue, holding implicitlythat intra-vehicle variation accounts for only a small part of the total.
Manufacturers' Response to Emission Test Protocols
But the fact that EPA uses a predetermined driving cycle for the FTP and, to a lesserextent, the IM240 test to preserve test replicability causes a more serious problem.Replicability is of course an important component of the scientific method, but there is acrucial difference between monitoring for enforcement purposes and measurement in ascientific experiment. In an experiment, Nature has no interest in how the experiment comesout. But when the object of the measurement is an actor--a motorist or a manufacturer, say--who has an interest in the outcome of the measurement, there is the possibility that the actorwill change his behavior so as to affect the outcome.
Since emissions during high-acceleration are never tested, vehicle emissions duringthese events are subject to no emission standards. Thus, manufacturers have the opportunityand incentive to optimize their engines and emission control systems with respect to thatparticular driving cycle. Engines are now designed to burn an enriched fuel mixture whenunder high acceleration, which improves performance and is said to prevent engine damage.As a result, though, a great deal of unburned fuel is sent to the catalyst and only partiallyoxidized there , and the result is very high emissions, perhaps a hundred times the currentstandard for CO and ten times for HC (Ross, 1994). Certainly part of the reason thatenrichment events are now such a major cause of high emissions in new vehicles is thatmanufactures knew that they could design vehicles to a particular test cycle, and that high-acceleration events were not part of that cycle.
Cost and Effectiveness of Repair
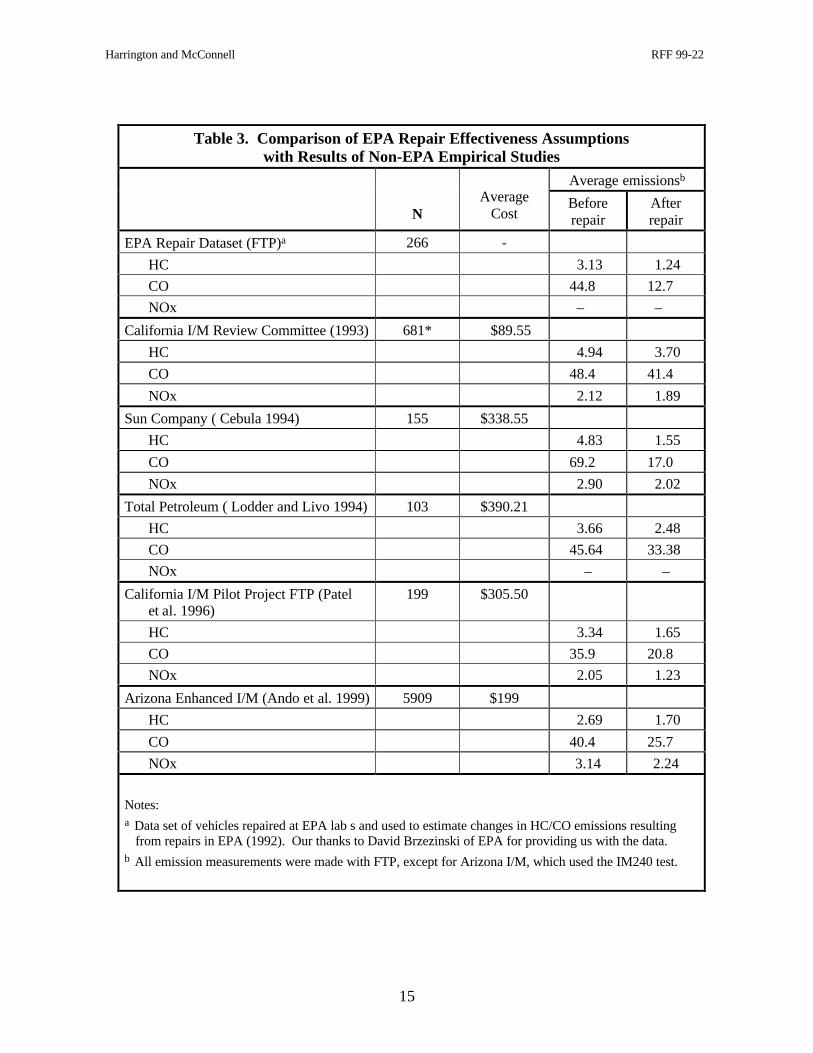
The EPA had originally forecast that the repair of emissions equipment would berelatively easy and inexpensive. However, the difficulty of repair for a relatively smallnumber of vehicles is emerging as one of the biggest challenges facing current I/M programs.A comparison of EPA assumptions with empirical studies of repair is shown in Table 3.
The Enhanced I/M RIA assumed that repair costs for tailpipe emissions would beabout $120 per repaired vehicle.16 However, these costs were based on estimates of parts andlabor costs from a small sample of vehicles, repaired not in actual repair shops but in EPAlaboratories. The average emissions reductions for the vehicles repaired in these laboratories,upon which the EPA estimates of I/M program effectiveness are based are shown in Table 3.Emissions changes are substantial for HC and CO, but after repair emissions were often stillabove the standards the EPA wanted to use in I/M programs. The EPA went further then toassume that all vehicles would have to be brought into compliance in real world programs.
16 Table 1a earlier in this paper reports repair costs per vehicle in the inspection program which includes thosevehicles which fail and those that do not. The early EPA estimates of cost assumed a much higher failure ratebecause it was assumed that emissions tests would be much stricter than they been in practice.
Harrington and McConnell RFF 99-22
15
Table 3. Comparison of EPA Repair Effectiveness Assumptionswith Results of Non-EPA Empirical Studies
Average emissionsb
NAverage
CostBeforerepair
Afterrepair
EPA Repair Dataset (FTP)a 266 -
HC 3.13 1.24
CO 44.8 12.7
NOx – –
California I/M Review Committee (1993) 681* $89.55
HC 4.94 3.70
CO 48.4 41.4
NOx 2.12 1.89
Sun Company ( Cebula 1994) 155 $338.55
HC 4.83 1.55
CO 69.2 17.0
NOx 2.90 2.02
Total Petroleum ( Lodder and Livo 1994) 103 $390.21
HC 3.66 2.48
CO 45.64 33.38
NOx – –
California I/M Pilot Project FTP (Patelet al. 1996)
199 $305.50
HC 3.34 1.65
CO 35.9 20.8
NOx 2.05 1.23
Arizona Enhanced I/M (Ando et al. 1999) 5909 $199
HC 2.69 1.70
CO 40.4 25.7
NOx 3.14 2.24
Notes:a Data set of vehicles repaired at EPA lab s and used to estimate changes in HC/CO emissions resulting
from repairs in EPA (1992). Our thanks to David Brzezinski of EPA for providing us with the data.b All emission measurements were made with FTP, except for Arizona I/M, which used the IM240 test.

Harrington and McConnell RFF 99-22
16
These assumptions were not seriously challenged until a few studies reporting costsand effectiveness of repair in the real world emerged, including California I/M ReviewCommittee (1993), Cebula (1994), Lodder and Livo (1994), and analysis of the Arizona I/Mprogram. Emission reductions and costs from these programs are shown in Table 3. Until theadvent of Enhanced I/M programs (such as Arizona's), studies of repair effectiveness weredifficult to do largely because of sampling difficulties. By necessity recruitment in the otherstudies was voluntary, and there is a stronger-than-usual reason to suspect selection bias whenthose motorists who choose not to participate because they fear that previous tampering mightbe discovered or that efforts to avoid repair costs might be inhibited. In addition, the repaircost data were suspect, because they were reported by the owner and usually the specificrepairs were not itemized.
The studies by Cebula (1994) and Lodder and Livo (1994) were not connected withI/M at all. They were evaluations of scrap-or-repair programs initiated by major oilcompanies in search of emission offsets. RSD was used in both studies to identify gross-emitting vehicles, whose owners were then offered an opportunity either to sell the vehicle fora fixed price or a free repair of the emission system. The results of these studies suggestedthat EPA's repair assumptions were optimistic, at least for the dirtiest vehicles in the fleet.While repairs did substantially reduce the emissions of these vehicles, the average repair costwas very high and regardless of cost some vehicles could not be brought into compliance withthe emission standards assumed by the EPA for Enhanced I/M.
The repair study commissioned by the California I/M Review Committee was part of alarger project, an "undercover car" investigation that sent a sample17 of nearly 5,000 vehiclesto random inspection stations in various California cities in order to evaluate the Smog Checkprogram in its entirety. The nearly 700 vehicles failing the initial test were then followedthrough the program until they received a Smog Check certificate. Improvements in thesevehicles was compared against before-and-after FTP tests on each vehicle. The resultsshowed that over half the vehicles actually had higher emissions after repair than before. Forthe most part these perverse results occurred in vehicles with borderline emissions. The sumof emission reductions in all vehicles was positive for all pollutants, but as shown in Table 3,those reductions were modest.
The Arizona program provides the first opportunity to examine the costs andemissions reductions from repair for a large number of vehicles in a setting where issues ofselection bias are largely eliminated. Motorists with failing vehicles are required to completea repair form before each retest. Compiling data from these reports, Ando, Harrington andMcConnell (1998) find that the cost of a tailpipe repair in the Arizona program range fromzero to over $1000, with an average of about $199. This includes only the cost of the repair
17 Not random. In fact, the sampling methodology of the study was never made clear. One of the problems thatbedevils research of I/M programs is at once the importance and impossibility of finding a random sample of in-use vehicles. Participation is necessarily voluntary, but the vehicles whose owners most fear the outcome of I/Mwould be the least willing to be in the sample.

Harrington and McConnell RFF 99-22
17
itself, not the cost of driver inconvenience. This latter cost can be quite high for somevehicles, with 22 percent of failing vehicles having more than one retest, and some havingover 10 retests. Also, emission reductions in Arizona are not as high as expected. Emissionreduction of both HC and CO were modest compared to what the EPA data were predicting.
All of the studies shown in Table 318 find costs of repair to be higher than predictedby EPA, and the emissions after repair to be higher than EPA's estimates. It has turned out tobe more difficult to find and repair vehicles than early proponents of I/M had hoped. Next weexamine one way to reduce those costs.
Potential for reducing costs through economic incentive policies
Given that repair costs in Arizona are so much greater than expected relative toemission reductions, it is naturally of interest to consider the potential cost savings availablefrom the use of economic incentives, which in effect allow the transfer of emission reductionsfrom one vehicle to another. We used the Arizona IM240 test results and repair data toconstruct a simple simulation model to compare a simulated emission fee policy withsimulated CAC policies (Ando et al., 1998).19
The results of the simulation showed that the EI program could achieve emissionreductions comparable to those achieved in the simulated CAC program at only 60 to 70percent of the repair cost. These results indicate the potential of a policy of economicincentives, in reducing repair costs, but it is also important to keep in mind the fact that repaircost in Arizona is only about 35 percent of the total cost, most of the rest consisting of thevarious costs associated with emission monitoring. This sort of EI policy, where motoristshave to pay and where all monitoring is done by lane tests, will not do anything to reducemonitoring costs. Thus, the emission fee analyzed here only results in a reduction in totalcosts of around 14 percent.
The Distribution of Costs and Motorist Avoidance
The use of emission fees for motorists would not deal with one other unfortunatecharacteristic of I/M programs that emerged as researchers began to look closely at the IM240
18 Except the California I/M Review Committee Study. However, the costs of about $90 per repaired vehicleinclude evaporative and tailpipe repairs. This is estimate is close to the average of EPA's tailpipe andevaporative repair cost estimates.19 The simulated CAC policies simply kept track of which repairs would have been done under less stringentcutpoints. The emission fee policy allowed each motorist failing the emission test a choice of repairing thevehicle or paying a fee proportional to the excess emissions for each pollutant. In making the choice themotorist compared the fee calculated on the known emission test results and the sum of the repair cost and thefee based on the predicted emission reductions from repair. The predictions derived from a statistical model ofemission test results, in which the independent variables consisted only of those pieces of information availableto the motorist after receiving a diagnosis of the cause of excess emissions. For various fee levels, we comparedfee results to the cost and results of CAC programs less stringent than the existing program. For each vehicle thesimulation used the actual repairs and emission reductions actually observed, It was impossible to examine morestringent EI and CAC policies, since they would involve repairs that we did not observe.
Harrington and McConnell RFF 99-22
18
data from Arizona and Colorado. There are a large number of vehicles that fail their I/M test,but apparently are never repaired to pass. Estimates are that their share is as high as 25% ofthe failing vehicles (Ando et al., 1999). These vehicles may not complete the testing processfor a number of reasons. They could simply be still in the process of being repaired, or, theycould have received a waiver (about 4 percent of failed vehicles in Arizona).20 Theremaining non-passing vehicles are sometimes referred to as "disappearing vehicles" becauseit is not clear why they never show up as passing the test. They may have been scrapped, orsold outside of the region. Or, more troublesome to the I/M program, they may be improperlyregistered or registered outside the region but still driven in it.
Actually, there was considerable indirect and anecdotal evidence of motorist avoidanceunder the state programs prior to the 1990 Amendments. In California, for example, a studythat relied on random roadside emission tests found that vehicles had very similar failure ratesboth ninety days before their I/M test and 90 days after the test (Lawson, 1993). Thisphenomenon became known as "Clean for a Day" (Glazer et al., 1993). Avoidance of I/M mayhave become more difficult with the implementation of Enhanced I/M, but there is littleevidence that it has been eliminated.
To look more closely at the differences between failing vehicles that are eventuallyobserved to pass and those that are not (the so-called disappearing vehicles), we estimated aprobit equation, in which the dummy dependent variable equals 1 if and only if the vehiclepasses the test.21 Explanatory variables are those vehicle characteristics we can observe suchas age, type of vehicle (car or truck), and initial emissions of the vehicle.
The results of estimation of this equation for the Arizona data from January 1, 1995 toJune 1, 1996 are shown in Table 4. A positive coefficient for a variable indicates that a highervalue of the variable is associated with a greater probability a vehicle will pass the test. If theinitial test was too recent, an owner may be less likely to have had time to successfully repairand retest the vehicle during the data-collection period. Trucks are more likely to be passingthan cars in Arizona, which fits with expectations since cars face tighter standards or test"cutpoints" than trucks. If some of the disappearing vehicle problem is that the I/M programcauses some people to avoid the program by not repairing, then we would expect tightercutpoints to induce more of this behavior. Table 4 also shows that for HC and NOx, vehiclesfailing by a wide margin are more likely to have final observed tests that are failures, eitherbecause the repairs are more time-consuming (and not complete by the end of our samplingperiod), or because the costs of bringing such a vehicle into compliance is high enough to 20 Personal communication, Rick Day, Arizona Department of Environmental Quality, April 1, 1998. We havenot yet learned which vehicles in our sample received waivers.
21 The probit model posits a latent variable *Z , which is a score representing the tendency of the vehicle to be
repaired successfully. *Z is specified as a linear combination of the effects of observable characteristics W,plus a disturbance term reflecting the influence of the unobserved variables:
Z W* = +γ µwhere µ is distributed standard normal. The variable Z is observed if and only if Z* > 0.

Harrington and McConnell RFF 99-22
19
induce the owner to drive illegally, scrap the car, or sell it out of the area. Finally, older carsare more likely to linger without being fixed; this may reflect the fact that older cars are bettercandidates for scrappage anyway, and thus are more commonly pushed into the junkyard byimpending IM240 repairs.
Table 4: Results from Probit Analysis of Failing Vehicles
Explanatory Variable CoefficientStandard
Error Significance
Date of initial test -.00010 .000043 *
Light truck .036 .017 *
Medium-duty truck .23 .027 *
FAIL HC ONLY -.48 .028 *
Fail CO only -.26 .035 *
Fail NOx only -.11 .029 *
Fail HC and CO -.54 .032 *
Fail CO and NOx -.29 .11 *
Fail HC and NOx -.51 .035 *
Fail HC, CO, and NOx -.63 .056 *
(HC g/m, initial – standard)*(failed HC) -.12 .0057 *
(CO g/m, initial – standard)*(failed CO) -.00062 .00035
(NOx g/m, initial – stand.)*(failed NOx) -.15 .0073 *
Age at initial test -.067 .0023 *
Length of initial test (seconds) -.014 .00011 *
Constant 5.1 .56 *
Source: Ando, Harrington and McConnell (1999)Notes:
The dependent variable = 1 if vehicle is observed to be repaired to pass, 0 otherwise.There were 82,786 observations, and the log-likelihood value is 25,833.849* indicates significantly different from zero at the 5% level.
There is additional evidence from Colorado that the I/M program may induce driversto remove vehicles from the I/M region. Stedman, Bishop and Slott (1998) find, throughremote sensing, that vehicle emissions in adjacent counties outside the I/M region rise formodel year vehicles that are subject to testing in the I/M region, but not for untested vehiclemodel years. The implication is that high-emitting vehicles are moving outside the region toavoid the cost and inconvenience of repair.
Motorists incentives under the current liability assignment are also influenced by themanner in which the burden of compliance is distributed among income groups. Under

Harrington and McConnell RFF 99-22
20
current I/M programs, the distribution of compliance costs among motorists varies a greatdeal. As we mentioned above, the Arizona program results show that repair costs for a singlevehicle can vary from a few dollars for a gas cap replacement to several thousand dollars for avariety of control system problems from the catalyst to the air injection system.22 TheArizona results also show that the anticipated repair costs differ substantially by age ofvehicle, primarily because the probability of failure increases as vehicles age. The first twocolumns of Table 5 show first the probability of failure by model year, and then the averagecost of repair by model year. Combining these two, column (3) shows that the expected costsby model year are 10 times higher for a fifteen year old vehicle compared to a four or fiveyear old vehicle.
Table 5. Expected Costs of Repair in Arizona I/M For an I/M Cycle
ModelYear
(1)Probability thatvehicle will fail
initial test(percent)
(2)Average Costsof Repair for
failing vehicles($/vehicle)a
(3)Expected costs ofrepair, all vehicles
($/vehicle)(1)×(2)
(4)Probability that afailed vehicle will
never pass(percent)
(5)Average income
of owner(in national
sample)1981 45.4 132 60 43.7 $38,4001982 41.2 140 58 38.1 35,5001983 38.5 148 57 38.9 39,0001984 35.9 153 55 37.2 40,8001985 28.8 155 45 32.8 41,7001986 19.8 145 29 27.6 44,1001987 14.2 142 20 25.1 46,0001988 12.2 150 18 22.9 47,3001989 8.1 144 12 18.5 48,0001990 5.6 134 7 15.8 51,2001991 6.8 152 10 18.6 52,0001992 4.4 138 6 13.1 53,6001993 2.6 130 3 8.1 54,9001994 1.2 80 1 1.8 57,4001995 1.0 62 0.59 1.1 $61,000
Sources: Columns 1,2,3,4: Arizona Enhanced I/M Data Base, 1995-1996Column 5. 1995 Nationwide Personal Transportation Survey
Notes:a. Includes both the expenditures reported by motorists and our imputations of costs when repairs are made but costs
are not reported. For late-model vehicles these imputations include warranty repairs and therefore overstate theburden on the motorist.
22 Most of the vehicles with high repair costs in the Arizona I/M program

Harrington and McConnell RFF 99-22
21
In addition, Table 5 provides further evidence that older vehicles are much less likelyto eventually pass the emissions test than newer vehicles. Of fifteen year old vehicles that failthe test (1981 model year), almost half never show up as passing. We don't know exactlywhat is happening to these vehicles, but they clearly face relatively higher costs of complyingwith I/M requirements.
How do the costs of repair fall on different income groups in society? This is adifficult question to answer because there is no data linking income directly with vehicles inan I/M program. We can shed some light on this issue by looking at car ownership byvintage. The last column of Table 5 links model year holdings to average income of vehicleowners.23 It is clear that older vehicles are owned by households with lower average income,and these are also the vehicles with the highest expected repair costs. Assigning motorists theliability for repairs means that those least able to pay are likely to be paying the highest costs.This represents both a political and economic dilemma for the current liability structure.Politically, it has been difficult to enforce a regulation with such a regressive incidence.States have responded by allowing waivers for vehicle owners who have paid up to somerepair cost minimum. However, the economic literature has argued that those with "shallowpockets" should, for efficiency reasons, be required to demonstrate financial responsibility exante (Boyd, 1997). Applied to motor vehicles, this would require potentially large up-frontpayments from motorists and would no doubt arouse intense public opposition. We talk aboutthis in more detail below.
There is evidence that motorists have found many other ways of avoiding I/Mcompliance. We have already discussed how the stochastic nature of emissions from a singlevehicle can mean that motorists have an opportunity to subvert the test by retesting a failingvehicle without repair. Decentralized programs have come under particular scrutiny because,it is argued, they present many opportunities for avoidance. For example, Hubbard (1998)found evidence of moral hazard problems in California's decentralized I/M program. Hisstudy finds that consumers are able to provide incentives to station mechanics that allow themto pass, and therefore consumers will shop around to find stations most likely to respond tothese incentives. Monitoring and enforcement costs are likely to be higher in a decentralizedprogram with thousands of different test stations.
ALTERNATIVES TO CURRENT I/M PROGRAMS
The empirical evidence on the performance of I/M is disappointing, at best. The largenumber of vehicles, the emission characteristics of individual vehicles, and the behavior ofdrivers who have an incentive to avoid the regulation together conspire to make the currentI/M program with its assignment of liability to individual motorists so difficult to implementeffectively. In this section we consider policies that assign liability elsewhere.
23 The data used to estimate these averages are from the National Personal Transportation Survey. See U.S.Department of Transportation, NPTS (1995).
Harrington and McConnell RFF 99-22
22
No I/M Program
Some observers now believe that the best I/M program is no program. They argue thatnearly two decades of failure of I/M programs is itself a pretty good indication that aneffective and economical I/M program simply cannot be devised. For example, Coninx(1998) concludes:
I/M programs have never been proven to perform according to the optimisticpredictions of their supporters. Even when only the direct costs are considered,I/M programs are much less cost-effective than alternative strategies. When allthe other social, environmental, and financial costs of IM programs are taken intoaccount, there are strong indications that the programs do more harm than good toboth society and the environment. (p. 32)
Coninx's critique refers specifically to Canadian I/M programs in British Columbia andOntario, but by implications includes all U.S. programs since the Canadian programs arelargely modeled on U.S. efforts.
Besides, rapid improvement in new vehicle emission rates and emission durabilityhave caused some to question whether I/M is even necessary. As noted above, vehicleemissions are gradually declining not only for vehicles when they are new, but throughout theproduct life cycle. In other words, the average emissions of, say, a 1993 vehicle today (in1998) are much lower than the average emissions of a 1988 vehicle were in 1993. Thus, theabsence of I/M programs does not necessarily mean that air quality goals in urban areascannot be met. However, other factors are critically important for reducing overall fleetemissions such as growth in the vehicle fleet, the change in fleet composition toward truckswhich have to meet less stringent emissions standards, and average vehicle age.
Maintain the Current Assignment of Liability
Inasmuch as they account for well over half the costs of the current I/M program,finding a way to reduce monitoring costs is the essential component of any program to reducethe transactions cost of in-use emission programs. Two recently-developed technologies offerpromise in reducing those costs: remote sensing, which was mentioned earlier, and on-boarddiagnostic (OBD) equipment. To be effective, both OBD and RSD would have to besupported by electronic vehicle-identification, another technology that has been a product ofthe revolution in electronics and microprocessors.
Use remote sensing to supplement or replace lane testing
Ever since its commercial development in the late eighties remote sensing has beenput forward by critics of I/M as an alternative to the expensive and inconvenient lane test thatall programs now require. The great advantage of RSD is the very low cost of testing, madepossible by the nearly unbelievable productivity of RSD. RSD only requires a second's

Harrington and McConnell RFF 99-22
23
headway between vehicles, which means in principle that thousands of vehicles per hour canbe monitored. In most cases the practical limitation is imposed by the number of vehiclespassing the sensor. Thus, the estimated cost to operate a two-man team of remote sensors isabout $200,000 per year. If we make a conservative estimate of 5,000 vehicles per twelve-hour day (about three per minute) the cost of RSD is only about 15 cents per reading.
Although inexpensive, RSD also suffers from a number of limitations. The mostimportant one is the mirror image of its productivity: the very short vehicle exposure to thesensor. Since RSD only senses emissions for an instant, it cannot possibly provide, in a singletest, the performance of the vehicle over the full range of driving cycles in normal use. Also,the requirements of the technology can limit the number of suitable sites. Multiple lanes ortwo-way traffic is acceptable, but readings are invalid if the sensor beam is cut by more thanone vehicle simultaneously. Slight acceleration is acceptable, but if the vehicle is deceleratingor coasting, then the sensor gives no reading. The most common locations are freeway on-ramps or uphill off-ramps that require some acceleration. RSD is also limited by the nature ofthe measurement taken. What is reported is the ratio of the pollutant concentration in theexhaust plume to the concentration of carbon dioxide. To convert this ratio to a measure ingrams of pollutant discharged per mile of travel, which is how the emission standards arewritten, one must know the fuel economy of the vehicle when the measurement is taken.
RSD also provides better results for some pollutants than others. It works best for CO.Estimates of HC are difficult because unlike CO, HC is not a chemical species but the sum ofmany hydrocarbons, the composition of which in exhaust can be affected by the compositionof the gasoline. Typically an RSD unit is "tuned" to recognize the three or four chemicalhydrocarbon compounds most likely to be found in vehicle exhaust, perhaps adjusted at thesite to reflect the local fuel composition. Until recently RSD units did not measure NOx atall, and there is still some question about its accuracy for this purpose.
Ever since RSD was first developed, critics of the existing I/M policy have proposedways to use it to replace all or part of the customary lane testing regime (see Spencer, 1992;Glazer et al., 1993).The most radical would have replaced lane tests altogether with remotesensors. Not only is remote sensing cheaper; it is so cheap that it is quite feasible to allowmultiple tests of the same vehicle. A network of sensors would be used, which would allowthe average vehicle to pass a sensor several times each year. As noted above, multiple testson the same vehicle are necessary to separate emission test error from vehicle-specificemission variation. At each station both the emission estimates and the vehicle identificationwould be recorded and transmitted to some central location. After some number ofexcessively high emission readings, the owner of a vehicle would be notified by mail andordered to take some action. For example, the vehicle could be ordered to appear at acertified repair shop within a certain time, and the repair shop could notify the authoritieswhen the repair was complete. A variant of this proposal has the offending vehicle beingdirected to report to an I/M testing station for an IM240 test. Either would cut the cost ofmonitoring by using RSD as a screen. An economic examination of these proposals shows

Harrington and McConnell RFF 99-22
24
that these proposals can reduce the cost of finding high-emitting vehicles by about 30 percent,compared to the cost of Enhanced I/M (Harrington and McConnell, 1993).
However, using RSD for monitoring purposes to identify high-emitting vehicles posessome problems of its own, or at least there are some unknowns about how it would perform inan enforcement environment. Certainly RSD has proven itself capable of providing usefulestimates of aggregate emissions. When it is used in this way, however, no motorist has anincentive to attempt to avoid the sensors or camouflage emissions. If the sensor network isfixed, then motorists would be able to avoid them with some ease. A mobile network wouldbe more difficult to avoid, but probably more costly to administer. Also, limitations on wheresensors can be placed might allow knowledgeable motorists to avoid sensors entirely (and anymotorist with a gross-emitting vehicle that is difficult to repair would have the incentive tobecome knowledgeable). Motorists might also be able to practice avoidance even if they mustpass a sensor. As noted above, taking the foot off the throttle essentially eliminates emissionsfrom the tailpipe, so coasting past the sensor might be a way for a gross emitter to avoiddetection. Under these circumstances the reading recorded for the vehicle is likely to be theemissions as the vehicle that preceded it through the sensor, which, for a gross emitter, almostalways has lower emissions.24
Whether these problems would severely affect the performance of RSD based I/Mprograms is unknown. The fact is we know little of whether RSD can easily be avoidable byowners of gross-emitting vehicles.
There must also be an effective procedure for what to do after a noncompliant vehiclehas been identified. Notifying motorists by letter, as suggested above, requires the linking ofthe emission testing system to the vehicle registration system maintained by the Departmentof Motor Vehicles. Even then, not all motorists can be identified in this way; peoplefrequently move and fail to notify the DMV. Presumably motorists who are not contacted orwho ignore notices to obtain emission test or repair could face registration denial, but thatcould be difficult to enforce.
Yet another problem is the public acceptance of a monitoring system based on RSD.While RSD can accurately characterize emissions in the aggregate, there are concerns aboutwhether it would be able to estimate emissions of a single vehicle with enough accuracy to belegally enforceable. (TRC, 1994).25
On-Board Diagnostics
On-board devices that continuously check emissions systems and signal motorists ifcontrols are not working properly have been touted as the best hope for the future of vehicleemissions control. Some have even argued that OBD will obviate the need for any formal I/M
24 See TRC Environmental (1994) for further discussion of problems with RSD.25 Some observers have also questioned whether an extensive RSD network would also raise questions of BigBrother.
Harrington and McConnell RFF 99-22
25
program: those motorists whose OBD lights are on, signaling problems with the emissionscontrol equipment, will take steps to repair their vehicles. However, what OBD more

Harrington and McConnell RFF 99-22
26
realistically provides is the potential for improved diagnostic and repair information, and, atbest, the potential to lower the cost of enforcing the liability for vehicle repair.
If current OBD systems are working properly, the light-on will convey to motoriststhat emissions systems need to be checked. But, if motorists continue to have primaryliability for repair, at least after warranty periods are over, there must still be some way ofensuring that repairs are actually carried out. Most emissions control failures, especially onrecent model year vehicles, are not evident to the driver. Some repairs to the emissionscontrol systems do result in improved fuel economy,26 but some do not, and motorists areunlikely to know about potential benefits. Under these circumstances, owners are unlikely tovoluntarily undertake repairs that may involve high costs and minimal or unknown benefit.
OBD may still have the potential to yield lower costs than traditional I/M because theyallow for the possibility of new methods for identifying high emitters. The use of drive-bymonitors or transponders have been suggested for finding the vehicles that are likely to needemissions repair. Transponders on the vehicle would convey the information from the OBDsystem to another party, either at a service station or at roadside.
In addition, OBD systems have been touted for their ability to allow for easierdiagnosis of emissions problems, and for improving chance of repair. To the extent this istrue, it would lower the cost of repair to motorists and would therefore result in greatercompliance in a system in which motorists have liability for emissions. In fact, whoever hasliability for maintaining emissions control equipment, to the extent OBD lowers the cost ofrepair by providing better information, compliance is likely to be improved.
History of OBD. Initially, the car companies implemented simple OBD systems in theearly 1990s as a way to identify and diagnose when there were failures in the newly evolvingElectronic Control Units (ECUs) that controlled emissions. However, California began to useOBD to regulate emissions in the 1994 model year vehicles and the Federal governmentfollowed suit for all vehicles sold nationally beginning with the 1996 model year. Under thissecond generation of OBD, so-called OBDII, EPA required that the light come on ifemissions exceeded 1.5 times the new car certification level.27 This rule creates a newdifficult regulatory issue for motorist liability. This trigger point is very tight, especiallycompared with cutpoints used in current I/M programs which are more like 3-4 times the newcar standards.28 After the warranty period has expired, motorists will have sole liability forrepairing vehicles whose light has come on, and some of those repairs may be very cost-ineffective. For example, some of the repairs in Arizona that involved only the improvementof HC emissions cost more than $1million per ton removed.
26 Ando, Harrington, and McConnell (1999).27 OBD devices do not measure emissions directly, but only infer emissions from the general performance of theemissions control equipment.28 For example, the cutpoints for 1991 and later model year cars in Arizona's current I/M 240 program are asfollows: 1.2 g/mi HC, 20 g/mi CO, 2.5 g/mi NOx. By comparison, "Tier 1" standards for new 1994-96 modelyear vehicles are 0.25 g/mi HC, 3.4 g/mi CO and 0.4 g/mi NOx.
Harrington and McConnell RFF 99-22
27
So, although OBD systems have the potential to reduce monitoring costs whenmotorists are liable for repairs, they may actually increase the incentives for avoidancebecause of the stringency of the light-on cutpoints. In addition, only new vehicles areequipped with OBD systems; to the extent these systems can reduce monitoring costs andimprove repair effectiveness, it will happen slowly as the fleet turns over. There are otherliability assignments for reducing vehicle emissions that may have the promise to reduce costsand be more effective even in the near term.
Alternative Liability Assignments
Empirical studies of I/M programs provide plenty of room to doubt that Enhanced I/Mprograms are achieving anything more than modest results. An important part of the reason isthat in the current institutional arrangements motorist have both the opportunities and theincentives to avoid compliance. The past strategy of reducing the motorist's opportunities toavoid I/M has not worked. These same empirical studies have also raised questions about theoriginal ethical justification of assigning liability to motorists, since they provide evidencethat is consistent with the possibilities that the relatively poor emission performance of somevehicles is attributable to defects of design or durability that originate with the manufacturersor to the poor maintenance by the vehicle's previous owner.
Perhaps, then, it is time to think about changing the incentives, and that means findingother ways to assign liability, and other parties to assign it to. Below we examine four newapproaches to I/M, beginning with one that only involves a modest change from currentpractices and is in fact underway, and proceeding to a solution that involves a quite drasticchange, namely the separation of vehicle possession and vehicle ownership.
Extending liability to the manufacturer
Because of the high costs and modest success of the current I/M system that assignsliability to the motorist, there is a movement already underway to shift the liability ofmaintaining emissions controls through the life of the vehicle more toward manufacturers. Tosome extent, there has always been a shared responsibility between motorists andmanufacturers because of the warranty coverage requirements on emissions controlequipment. Both the state of California and the Federal government are currently consideringextension of these warranty requirements as a way of increasing manufacturer liability. Inaddition, motorist liability itself creates incentives for manufacturers to improve the lifetimeperformance of emissions control equipment. Manufacturers do not want to be swamped withwarranty-covered repairs or with complaints by motorists whose vehicles have failed I/M.
And there is persuasive and growing evidence that the burden of cleaner in-usevehicles has been shifted toward the manufacturers as cars have become cleaner andemissions controls more durable. Vehicles produced after 1991 appear to have much loweremissions at 50,000 miles than did vehicles of earlier vintages. We outline briefly here whythis has been happening.

Harrington and McConnell RFF 99-22
28
Emissions equipment warranties. Warranties on emission control systems and partsplace liability with the manufacturer through the period of the warranty. Table 6 shows thepast and current warranty provisions by the EPA for U.S. vehicles (California has its ownwarranty requirements). Warranties cover defective parts and the performance of theequipment to meet I/M requirements. The performance requirement means that if a vehiclefails an I/M test and is under the warranty period, the manufacturer is liable for the repaireven if there is no defect in the equipment.
Table 6. History of Emission Component Warranties For Light Duty Vehiclesand Light Duty Trucks
VehicleModel Year
Section 207 (a) of the Clean AirAct (Defects)
Section 207(b) of the Clean Air Act(Performance)
1994 andEarlier
5 years/50,000 miles 1) 2 years/24,000 miles on components2) 5 years/50,000 miles on emissioncontrol devices or systems
1995 andLater
2 years/24,000 miles 2 years/24,000 miles
Certain specified components(Catalyst, ECU, OBD)8 years/80,000 miles
Certain specified components (Catalyst,ECU, OBD)8 years/80,000 miles
Until the 1990 Amendments to the Clean Air Act, manufacturers were responsible fordefects in all emission control equipment and for the performance in use of major emissioncontrol devices or systems for 5 years or 50,000 miles, whichever came first. Minorcomponent problems had only a 2 year or 24,000 mile warranty. These warrantyrequirements continued through the 1994 model year, but the Amendments actually reducedthe warranty period for most components and systems for 1995 and later model years. AsTable 6 shows, the 1995 and more recent model year vehicles only have to meet the 2 years,24,000 mile standards for almost all parts and components. It is only the major componentssuch as the catalyst, the Electronic Control Unit and the OBD system that have the longer 8years or 80,000 mile requirement.
It is unclear what impact warranty requirements have had on manufacturers. Thepresence of the 5 year/50,000 mile warranty through the early 1990s may have pushedmanufacturers to build cleaner cars. The change in warranty requirements after 1994 providea mixed message--some components face stricter warranty requirements, others more lenient.It is clear, however, that the EPA is moving in the direction of requiring stricter warrantyrequirements for federal "Tier 2" vehicles (those which have to meet the next round of stricterfederal new car standards). It is likely that the warranty period on these cars will be 120,000miles for major parts--California has already made this requirement and is extending thiswarranty period to trucks as well. Longer warranty period mean higher costs for

Harrington and McConnell RFF 99-22
29
manufacturers in repair and replacement costs and give them a clear incentive to improve theemissions performance of vehicles, at least through the warranty period.
Concern about customer satisfaction. Even after the warranty period is over,manufacturers do not want to deal with motorist complaints about I/M failures. There arereputation effects associated with vehicles makes that are known to have high failure rates.This provides some incentive to improve emissions control technology so that it is longerlasting. For example, the fuel injection technology implemented in the 1980s allowedcontrols to last longer. Currently, some manufacturers are trying to develop an air-fuel sensorinstead of O2 sensor to improve the life time performance of vehicle emissions.
New car certification also extends liability to the manufacturer. Recent changes in thenew car certification process have also begun to shift the responsibility for in use emissionsmore to the manufacturer. In the past, new car emissions certification had to be completedbefore cars were sold. Prototypes were driven for 100,000 simulated miles in the laboratoryin order certify an engine family. Under the new rules, manufacturers with a good trackrecord on emissions compliance can sell cars and certify that they meet the emissionsstandards by testing samples of in use vehicles. This regulatory change is likely to givemanufacturers even more incentive to maintain performance of vehicles in use.
Subsidize repair
In California a vehicle subsidy program that would transfer a small part of theresponsibility away from motorists has already been debated in the state legislature. Underthe proposed program, vehicles facing high repair bills could qualify for a "co-pay" from thestate to complete repairs. Motorists would have to qualify for the repair assistance, witheligibility determined by income at or below 175 percent of the federal poverty level (about$27,000 for a family of four). The eligible motorist would have to pay $250 and then couldqualify for a subsidy of the remainder of the repair bill. The funds for the subsidy wouldcome from a smog impact fee levied on vehicles brought into and registered in Californiafrom other states.29 The California program would be grafted onto the existing I/M program,and therefore would not effectively address the main transactions costs problems identifiedhere. Since periodic lane tests will still be required of all vehicles, monitoring costs will bevery high. Likewise no discretion is allowed in choosing which vehicles to repair; that isdetermined entirely by the I/M test results.
It is possible, however, to use a more extensive repair subsidy program to reduce thehigh transactions costs of I/M programs by shifting the financial responsibility for vehiclerepair and maintenance away from individual motorists.
One way such a program could work would be to use a RSD network to identify highemitters, who would be notified immediately by billboard of their emission status and advisedto report to a repair facility. Most likely these facilities would consist of privately-owned
29 These vehicles don't meet the stricter California emission standards, which are generally more strict than theFederal standards in effect in the other 49 states.
Harrington and McConnell RFF 99-22
30
repair shops that have been certified by some authorizing body as being qualified to doemission repair. At the repair shop a diagnostician or mechanic would examine the vehicleand make a decision whether the repairs are cost-effective.
The revenues to support the program could come of out general tax funds or, morelikely, from a tax or fee associated with vehicle ownership and use, such as a supplementalregistration fee or an increment to the gasoline tax. Repair subsidies thus would shift some orall of the cost of I/M away from the drivers of dirty vehicles and onto motorists of allvehicles, or onto taxpayers in general.
Repair subsidies would thus reduce or eliminate avoidance incentives and wouldprobably make it possible to use less costly monitoring methods to identify repair candidates.The greatest potential weakness of this sort of subsidy program is that it doesn't subject repairdecisions to a market test. At the repair shop, that is, who decides whether repairs are cost-effective? It would be awkward and inefficient to assign this responsibility to governmentemployees, who would be required to visit repair shops to approve each repair. But if thegarage is to make the determination of which vehicles to repair, what contractual mechanismwould guarantee that the most cost-effective vehicles would be repaired? If repair shops arereimbursed for all vehicles repaired, then they have an incentive to repair all vehicles and notnecessarily in a least-cost manner.
One of the virtues of a subsidy program is that it allows a great deal of flexibility indesigning mixed systems, in which the responsibility for I/M would be shared between themotorist and the government. For example, a subsidy program could be an insurance programthat limits motorist responsibility to some upper limit. That is, it could accomplish the sameobjectives of the current waiver provisions without actually requiring the costly, oftenineffective repairs that are part of the current waiver program. It could also be means-tested,giving preference to vehicles belonging to low-income motorists. However, as motoristresponsibility grows, so does the incentive to avoid that responsibility.
Centralize liability for emissions
A more drastic approach would separate vehicle ownership from emission liability andremove the latter from motorists. Liability for emissions would be assigned to other parties,presumably firms with expertise in vehicle emission repair, each of whom would beresponsible for the emissions of a large number of vehicles. As above, economic incentiveswould be applied to the sum of emissions from all vehicles in the firm's subfleet, and the firmwould be responsible for bringing in vehicles in need of repair.
The trouble with the current emission warranty system--at least as a solution to the in-use emission problem--is that only affects new vehicles, which is not where the seriousemission problems are. The current program is also potentially inefficient, since warrantiesare enforced against individual vehicles, which is less efficient than enforcing them againstaggregate emissions. Moreover, most of the really gross-emitting vehicles are now out ofwarranty, and any plans to extend warranties of new vehicles would necessarily ignore thesevehicles.
Harrington and McConnell RFF 99-22
31
Suppose, however, that the responsibility for vehicle emissions were divided among aset of firms, each of whom were responsible for the emissions of a group of vehicles. Theperformance measure is no longer the emission rates of individual vehicles, but the totalemissions of all vehicles controlled by each firm, as determined by a remote sensing networkmaintained by the air quality authorities. As noted above, RSD measurements of the totalemissions of large numbers of vehicles can be quite accurate, especially if, as in this case,motorists no longer have any incentive to avoid the sensors. The conditions are ideal for theuse of economic incentives; for example, the firm would pay emission fees if the totalemissions of all its vehicles exceed some predetermined level.30 This approach is especiallyattractive since it automatically takes into account not only the emission rates of the vehiclesin the subfleet, but how much they are driven, since the more vehicles are driven the morelikely they are to pass a sensor.
But how would a state or local metropolitan air quality agency arrange for otherparties to take over responsibility for the emission control of all vehicles, and who wouldthese parties be? One obvious candidate would be the vehicle manufacturers, especially sincethey already have some responsibility for in-use emissions under warranty provisions.However, I/M program implementation is now delegated to state and local authorities, whowould not have much leverage over vehicle manufacturers except, perhaps, through theirdealers. This suggests that either I/M should become a federal responsibility or that the policyshould be directed at dealers rather than manufacturers. In any case, one can imaginepractical and political difficulties if one were to require a group of firms to take overresponsibility for I/M.
Suppose, instead, that these responsibilities were voluntary. For example, the vehiclesin the fleet could be partitioned into subfleets, and then the responsibility for total emissionsin each subfleet could be auctioned off to the lowest bidder, just as public works contracts arenow. As in the case of subsidies, the necessary revenues to pay the contracts would comefrom a vehicle registration fee surcharge or new vehicle sales tax. A firm with a winning bidfor a group of vehicles whose emissions were above a specified level would then pay anannual fee based on the amount by which the emissions of the subfleet exceeded the agreedupon limit.
This proposal would reduce monitoring costs and motorists' incentives for avoidance,and put the incentives for proper vehicle maintenance on the right party. What it would not dois to provide manufacturers with an incentive to design inherently reliable and easy-to-repairemission systems, because the party buying the vehicle is not necessarily the same as the partyresponsible for emission repair. To take care of this problem requires yet another step.
30 It would also be possible to devise a marketable permits scheme if desired, but we only discuss the feeapproach here.

Harrington and McConnell RFF 99-22
32
Vehicle leasing
In the past few years three- or four-year leases of new vehicles have become a popularalternative to installment purchase, especially at the high end of the market. A vastlyexpanded system of vehicle leasing could become the basis for a new system of in-useemission management. The responsibility for maintaining the vehicle, emission controlsystem included, would rest not with the motorist but with the owner of the vehicle, whetherthe manufacturer or some other party. As in the preceding case, each leasing firm would payfees based on the sum of emissions by its lessees, as determined by remote sensing. Sinceleasing companies are buying the vehicles, they would be able, in their purchase decisions, togive manufacturers the proper durability incentives.
Motorists could be encouraged to choose leasing arrangements over outrightownership by changes in income tax policy to favor leasing even more than now, and so as toencourage leasing even of older vehicles by low-income households. The vehicle emissioncontrol policy would now be directed at the lessor firm, who would presumably hold leases ona large subfleet of vehicles.31
The authorities would also regularly pass on to each firm, along with its bill foremissions, the readings for the individual vehicles. These individual readings may be tooinaccurate and unrepresentative to use for regulatory purposes, but they would be valuableindicators to the firm of individual vehicles in need of repair. Each firm could adopt its owndecision rules for how to use these individual RSD readings, as well as the additionalconditions to be placed on lessees to ensure that malfunctioning vehicles are repaired intimely fashion.
Such a momentous change in vehicle ownership institutions would have many otherconsequences, the totality of which would be impossible to estimate before the fact. Theadditional control of vehicles and vehicle use would probably make it easier to deal with someother externalities and enforcement problems concerning vehicle use, including uninsuredmotorists, prevention of unlicensed or delicensed drivers, and possibly car theft. However, itwould also be likely to make it more difficult for low-income households to obtain vehicles,reducing their mobility. It is questionable whether such vast changes in the current way oflife can be justified solely on the basis of air quality improvements; other justifications wouldbe needed.32
CONCLUSION
I/M has been a disappointment. Our review of the existing in-use emission reductionprograms persuades us that I/M will continue to disappoint as long as motorists are heldresponsible for the emissions of their own vehicles. To a considerable degree this
31 Robert Slott has proposed vehicle leasing as one of a number of options that could be offered to motoristswhich would shift responsibility for emissions reductions to other parties (personal correspondence, December15, 1998).32 See Washington Post, Sunday, December 13, 1998.
Harrington and McConnell RFF 99-22
33
conclusion is shared by the EPA and other air quality authorities, who have responded byforcing manufacturers to extend warranty provisions on new vehicles, in effect pressuringmanufacturers to reduce emission rates in new vehicles and make emission systems in newcars more durable and impervious to poor maintenance by the owners. This approach ispiecemeal and inefficient. It requires manufacturers to ensure the emission integrity of eachvehicle, even though all that is required for air quality purposes is to control the totalemissions. It is not likely to be very effective, at least in the short run, because it does not doanything about the emissions of existing vehicles. Given the long life expectancy of vehiclesnow being manufactured, it will take a very long time for an extension of manufacturerwarranty on new cars to have an appreciable effect on fleet emissions.
If more rapid reductions of in-use emissions are desired, we will have to rethink theallocation of responsibility for in-use emissions in a more fundamental way. We believe thatalternative assignments of liability can reduce the cost of monitoring and enforcement of I/M,reduce the incentives of motorists to avoid maintenance and repair, and, by providing moreflexibility about which vehicles to repair, increase the efficiency of I/M as well. We havediscussed a variety of policy instruments for shifting liability from motorists, and in Table 7we compare how they affect the transaction costs associated with existing I/M programs.
As shown, each of these instruments address at least some of the transactions costcategories characteristic of I/M. In particular, by shifting responsibility from motorists, allremove the motorists' incentive to avoid emission repair. However, they only remove apositive incentive; they do not put any incentive for motorists in its place. Under any of theseapproaches, the utility-maximizing motorist would be indifferent to emission repair.Therefore, motorist goodwill would very likely be a valuable, perhaps even essential,component of all these approaches. It would be useful to accompany the introduction of anysuch policy by a media campaign to inform motorists of the importance of clean cars. Ifmotorists would embrace regular vehicle maintenance as beneficial to the environment, just ashomeowners have largely embraced recycling, it could have a major effect on in-useemissions. That sort of motorist cooperation would seem to be impossible in the currentcoercive environment of I/M, but it might be quite feasible if the costs of voluntarism werelimited to the occasional inconvenience of bring vehicles to a repair shop, and did not includeemission repair costs.
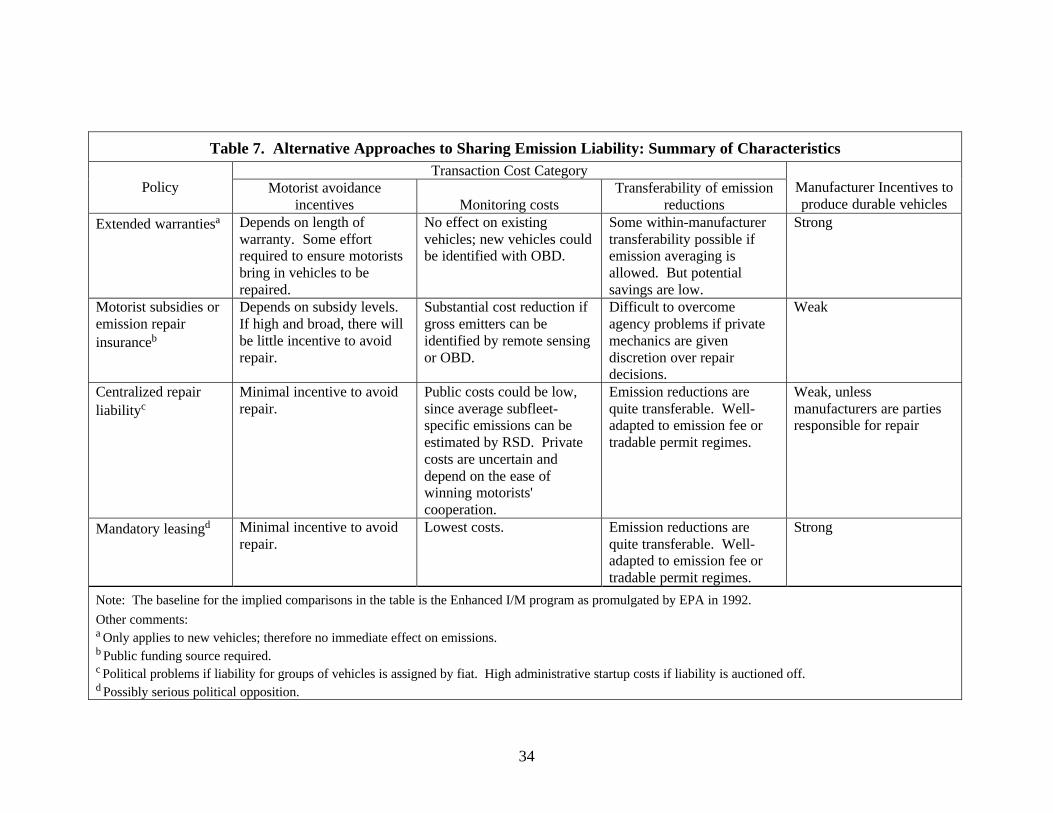
34
Table 7. Alternative Approaches to Sharing Emission Liability: Summary of CharacteristicsTransaction Cost Category
Policy Motorist avoidanceincentives Monitoring costs
Transferability of emissionreductions
Manufacturer Incentives toproduce durable vehicles
Extended warrantiesa Depends on length ofwarranty. Some effortrequired to ensure motoristsbring in vehicles to berepaired.
No effect on existingvehicles; new vehicles couldbe identified with OBD.
Some within-manufacturertransferability possible ifemission averaging isallowed. But potentialsavings are low.
Strong
Motorist subsidies oremission repairinsuranceb
Depends on subsidy levels.If high and broad, there willbe little incentive to avoidrepair.
Substantial cost reduction ifgross emitters can beidentified by remote sensingor OBD.
Difficult to overcomeagency problems if privatemechanics are givendiscretion over repairdecisions.
Weak
Centralized repairliabilityc
Minimal incentive to avoidrepair.
Public costs could be low,since average subfleet-specific emissions can beestimated by RSD. Privatecosts are uncertain anddepend on the ease ofwinning motorists'cooperation.
Emission reductions arequite transferable. Well-adapted to emission fee ortradable permit regimes.
Weak, unlessmanufacturers are partiesresponsible for repair
Mandatory leasingd Minimal incentive to avoidrepair.
Lowest costs. Emission reductions arequite transferable. Well-adapted to emission fee ortradable permit regimes.
Strong
Note: The baseline for the implied comparisons in the table is the Enhanced I/M program as promulgated by EPA in 1992.
Other comments:a Only applies to new vehicles; therefore no immediate effect on emissions.b Public funding source required.c Political problems if liability for groups of vehicles is assigned by fiat. High administrative startup costs if liability is auctioned off.d Possibly serious political opposition.
Harrington and McConnell RFF 99-22
35
REFERENCES
Ando, Amy, Winston Harrington, Virginia McConnell. 1998. "The Economics of VehicleEmission Repair" paper presented at the World Congress of Environmental Economists,Venice, June.
Ando, Amy, Winston Harrington, Virginia McConnell. 1999. Costs, Emissions Reduction,and Vehicle Repair: Evidence from Arizona, Discussion Paper 99-23, Resources for theFuture, Washington, D.C. (February).
Aroesty, Jerry, L. Galway, L. Parker, M. Kamins, P. Wicinas, G. Farnsworth, and D.Rubenson. 1994. "Restructuring Smog Check: A Policy Synthesis," Report No. DRU-885-CSTC, RAND (October).
Beaton, Stuart P., Gary A. Bishop, Yi Zhang, Lowell L. Ashbaugh, Douglas R. Lawson, andDonald H. Stedman. 1995. "On-road Vehicle Emissions: Regulations, Costs, andBenefits," Science, vol. 268, pp. 991-993.
Bishop, Gary A., Donald H. Stedman, and Lowell Ashbaugh. 1996. "Motor VehicleEmissions Variability," Journal of the Air & Waste Management Association , vol. 46,pp. 667-675.
Boyd, James. 1997. " 'Green Money' in the Bank: Firm Responses to EnvironmentalFinancial Responsibility Rules," Managerial and Decision Economics, 18, pp. 491-506.
California I/M Review Committee. 1993. "Evaluation of the California Smog Check Programand Recommendations for Program Improvements: Fourth Report to the Legislature."
Cebula, Francis J. 1994. Report on the Sunoco Emissions Systems Repair Program.Prepared for Sun Oil Co., Philadelphia.
Coase, Ronald N. 1960. "The Problem of Social Cost," Journal of Law and Economics,vol. 3 (October), pp. 1-44.
Coninx, Paul. 1998. Vehicle Emissions Testing: Air Care, Drive Clean, and the Future ofInspection and Maintenance Programs, The Fraser Institute, Vancouver, BC.
Glazer, Amihai, Daniel Klein, Charles Lave, Richard Crepeau, and Maria Koskenoja. 1993.Clean for a Day: Troubles with California's Smog Check, Working Paper UCTCNo. 163, University of California Transportation Center, Berkeley, California.
Harrington, Winston and Virginia D. McConnell. 1993. "Cost Effectiveness of RemoteSensing of Vehicle Emissions," in Richard Kosobud, ed., Cost-Effective Approaches toControl of Urban Smog (Chicago, Ill.: Federal Reserve Bank of Chicago).
Harrington, Winston and Virginia D. McConnell. 1994. "Modeling In-Use VehicleEmissions and the Effects of Inspection and Maintenance Programs," Journal of the Airand Waste Management, vol. 44 (June).
Harrington, Winston, Virginia D. McConnell, and Anna Alberini. 1998. "EconomicIncentive Policies under Uncertainty: The Case of Vehicle Emission Fees," in Ken Small
Harrington and McConnell RFF 99-22
36
and Roberto Roson, eds., Environment and Transport in Economic Modelling(Amsterdam: Kluwer Academic Publishing).
Harrington, Winston. 1997. "Fuel Economy and Motor Vehicle Emissions," Journal ofEnvironmental Economics and Management, vol. 33, no. 3 (July).
Henderson, Rick. 1992. "Dirty Driving: Donald Stedman and the EPA's Sins of Emission,"Policy Review, no. 60, pp. 56-60 (Spring).
Hubbard, Thomas. 1997. "Using Inspection and Maintenance Programs to Regulate VehicleEmissions," Contemporary Economic Policy, vol. 15, no. 2, pp. 52-62.
Hubbard, Thomas. 1998. "An Empirical Examination of Moral Hazard in the VehicleInspection Market," RAND Journal of Economics, vol. 29, no. 2, pp. 406-426.
Lawson, Douglas R. 1993. " 'Passing the Test'--Human Behavior and California's SmogCheck Program," J. Air and Waste Management, vol. 43 (December), pp. 1567-1575.
Lawson, Douglas R. 1995. "The Cost of 'M' in I/M: Reflections on Inspections andMaintenance Programs," J. Air and Waste Management.
Lawson, Douglas R., P. J. Groblicki, D. H. Stedman, G. A. Bishop, and P. L. Guenther. 19??."Emissions from In-Use Motor Vehicles in Los Angeles: A Pilot Study of RemoteSensing and the Inspection and Maintenance Program," Journal of the Air and WasteManagement Association, vol. 40, no. 8, pp. 1096-1105.
Leigh, J. Paul. 1994. "Non-random Assignment: Vehicle Safety Inspection Laws andHighway Assignment," Public Choice, vol. 28, no. 3-4, pp. 373-387.
Lodder, Tymon and Kim Bruce Livo. 1994. "Review and Analysis of the TOTAL CleanCars Program," Regional Air Quality Council and the Colorado Department of PublicHealth and Environment, Denver, Colorado (December).
Ross, Marc, Rob Goodwin, Rick Watkins, M. Q. Wang, and Tom Wenzel. 1995. Real-WorldEmissions from Model Year 1993, 2000 and 2010 Passenger Cars (Washington, D.C.:American Council for an Energy-Efficient Economy).
Ross, Marc. 1994. "Automobile Fuel Consumption Emissions: Effects of Vehicle andDriving Characteristics," Annual Review of Energy and Environment, vol. 19, pp. 75-112.
Scherrer, Huel C. 1996. "Methodological Flaws in I/M Program Self-Evaluation Studies,"Testimony to the State of Colorado, Denver.
Scherrer, Huel C. and D. B. Kittelson. 1994. "I/M Effectiveness as Directly Measured byAmbient CO Data," SAE Technical Paper No. 940302.
Schwartz, Joel. 1995. "An Analysis of the USEPA's 50 Percent Discount for DecentralizedI/M Programs," Report prepared for the California Inspection and Maintenance ReviewCommittee (February).
Spencer, Leslie. 1992. "Not Invented Here," Forbes (October 12), p. 44.

Harrington and McConnell RFF 99-22
37
Stedman, D. H., G. A. Bishop, P. Aldrete, and R. S. Slott. 1997. "On-Road Evaluation of anAutomobile Emission Test Program", Environmental Science and Technology, vol. 31,pp. 927-931.
Stedman, Donald H., G. A. Bishop, and R. S. Slott. 1998. "Repair Avoidance and EvaluatingInspection and Maintenance Programs," Environmental Science and Technology ,vol. 32,no. 10, pp. 1544-1545.
Stedman, Donald H., G. A. Bishop, S. P. Beaton, J. E. Peterson, P. L. Guenther, I. F. McVey,and Y. Zhang. 1994. "On-Road Remote Sensing of CO and HC Emissions inCalifornia," Final Report to Research Division California Air Resources Board,Department of Chemistry, University of Denver, Denver, Colorado.
TRC Environmental Corp. 1994. Feasibility Study of Use of Remote Sensing Technology forReduction of Highway Mobile Source Emissions, Report prepared for U.S. EPA Region8, Denver Colorado.
U.S. Department of Transportation. 1995. National Personal Transportation Survey, FederalHighway Administration, Washington, D.C.
U.S. Environmental Protection Agency. 1992. I/M Costs, Benefits, and Impacts, Office ofMobile Sources, Ann Arbor, Mich. (November).


![Théories des couts de transactions [Coase & williamson]](https://static.fdocuments.us/doc/165x107/5572000e49795991699eb517/theories-des-couts-de-transactions-coase-williamson.jpg)