
Classification of Torbanite and Cannel Coal. I. Insights ...
Upload
mjunction-services-ltdCategory
view
287download
13description


Coal Insights, September 2012 3
EDITORIAL
Copyright: All rights reserved. No part of Steel Insights can be reproduced or copied in any form or by any means without the prior permission of mjunction services limited. Please inform us if any copyright has been inadvertently infringed.
Disclaimer: This document is for information purpose only. Certain information herein has been acquired from various external sources believed to be reliable. While we have taken reasonable care to compile this report, we in no way assume any responsibility for any error or discrepancy in regards to information contained herein. Readers are requested to make appropriate judgment without any prejudice or compulsion.
Registered Officemjunction services limited, Tata Centre, 43 J L Nehru Rd, Kolkata 700 071
Website: www.mjunction.inCorporate Head Quarters: Godrej Waterside, 3rd Floor, Tower 1, Plot V, Block DP, Sector V, Salt Lake, Kolkata 700091, Tel: +91 33 6610 6100, Fax: +91 33 6610 6187 Bhilai: Room 321, 3rd Floor, Ispat Bhavan, Bhilai Steel Plant, Bhilai 490001, Tel: +91 788 6451066, Tele/Fax: +91 788 2221071 Bokaro: Room 19, Old Admin Bldg., Bokaro Steel Plant, Bokaro 827001, Tel/Fax: +91 654 2226132 Burnpur: SAIL - IISCO Steel Plant, Materials Building, Order Department, Ground Floor, Burnpur 713325, Telfax: +91 341 2240107 Chennai: Basement, Begum Ispahani Complex, New No 91, Old No 44, Armenian Street, Chennai 600 001, Tel: +91 44 64624733-35, Fax: +91 44 25216536 Durgapur: Room 618, Ispat Bhavan, Durgapur Steel Plant, Durgapur 713203, Tel: +91 343 6510185, Tele/Fax: +91 343 2586946 Jamshedpur: Kashi Kunj, Ground Floor, Road No. 02, Contractors Area, Bistupur, Jamshedpur 831001, Tel: +91 657 6519985/86/90/91, Fax: +91 657 2230040 Mumbai: Jolly Bhavan II, 403, 4th Floor, 7 New Marine Lines, Mumbai 400020, Tel: +91 22 66510663, Tele/Fax: +91 22 66510662 New Delhi: C127, 2nd Floor, A One Plaza, Naraina Industrial Area, Phase I, New Delhi 110028, Tel: +91 11 65661774/65413288, Tele/Fax: +91 11 25897000 Noamundi: C/o TATA Steel Limited, Mines Purchase Cell, PO: Noamundi, Singbhum (West), Jharkhand 833 217, Tel: +91 9204791638/9234368606 Rourkela: Administrative Bldg., Room 624, 6th Flr, Rourkela Steel Plant, Rourkela 769011, Tel: +91 661 6514142/6511412
Chief EditorRakesh Dubey, Tel: +91 91633 48159, Email: [email protected]
Executive EditorArindam Bandyopadhyay, Tel: +91 91633 48016Email: [email protected]
Editorial BoardAlok Srivastava, General Manager, MMTC LtdAmitabh Panda, Group Director (Shipping & Logistics Operations), Tata Steel GroupAnirudha Gupta, Director, P&H JoyMining Equipment India LtdAshok Jain, Managing Director, Saumya Mining LtdDeepak Bhattacharyya, Head – coaljunction, mjunction services ltdGanesan Natarajan, WT Director, President & CEO, Ennore Coke LtdLawrence Metzroth, Vice President – Analysis & Strategy, Arch Coal IncM K Palanivel, President – All India Bulk, Samsara GroupP S Bhattacharyya, former Chairman, Coal India LtdS N Choubey, Head – Commercial, ABG Cement LtdSandeep Kumar, Managing Director, S & T Mining Co Pvt LtdShyamji Agrawal, AVP-Central Procurement Cell, Ultratech Cement LtdSuresh Thawani, Managing Director, Tata Sponge Iron LtdAdvertisingSoumitra Bose, Tel: +91 92310 00232, Email: [email protected] Jalan, Tel: +91 91633 48243, Email: [email protected] Das, Tel: +91 91633 48045, Email: [email protected] Free No.: 1800 4192 000 1. Press 8 for publicationEmail: [email protected] Ray, Sobhan JasFor suggestions, feedback and queries, please write to [email protected]
mjunction believes that all junctionites, customers, suppliers, partners, etc should practice the highest ethical standards in their daily operations.
Report a concern to [email protected]
Dear Readers,
“No man undertakes a trade he has not learned,” said Socrates, “yet everyone thinks himself sufficiently qualified for the hardest of all trades – that of government.”
Wise saying, isn’t it? How aptly it describes the modern democracy, the world’s largest democracy, to be more specific. At present there is not one government, but numerous governments ruling this country. But even one government was too many, if you consider the warring ministries and departments. Coal versus Environment, Power versus Coal, Finance versus RBI, Rail versus Finance, States versus Centre, States versus States, and now Centre plus States versus Comptroller & Auditor General (CAG).
The whole thing seems pretty long-drawn. The government is busy proving itself innocent (and de-allocating blocks, at the same time). CAG is busy trying to prove that the government is at fault. The Central Bureau of Investigation (CBI) is busy implicating black-listed allocattees – the root of all chaos. And then there is a new entrant into the ring, the Central Vigilance Commission (CVC), busy demanding that all captive allocations since 1993 be brought under the CBI scanner. Let the country know the truth…full and final.
So be it. Let the truth be out, of course. And till such time as it’s not, let production be lost, de-allocattees move court, and growth be stalled.
Now what if the truth eludes, just as it has eluded in numerous other cases of grafts and scams? Will the truth-seekers be brought to book for the lost production? Because the truth is that the country is losing on production and growth, every passing day.
Enough on the governance part. Now let’s take a look into the fallout of lost production; i.e. ever growing imports. India’s coal imports are projected to touch nearly 50 percent of the country’s consumption by 2025-30. At this rate of development, that scenario may surface even earlier. What will that imply? Well, the thermal power sector will become critically dependent on foreign resources. Now consider the economy’s current dependence on international crude market. Consider the impact of any spike in international crude prices and the vulnerability of economy to periodic shocks.
Why make the economy vulnerable on another front? Why make the country susceptible to external shocks in yet another energy vertical? Consider the huge forex outgo and the impact of crude import bill on India’s balance of payments? Why go for the last option when you actually have some others?
Happy reading,
(Rakesh Dubey)

4 Coal Insights, September 2012
COnTEnTs
18 CIL board approves import plan 20 Thermal coal import prices remain flat 22 Imported spot coking coal prices ease 28 Delayed delivery defeating purpose of
coal e-auction: ICMA 30 SPU loan restructuring to reach `1.5
trillion: CRISIL 32 India’s August power generation falls
m-o-m: CEA 38 MoC axes allocation of 10 captive coal
blocks 40 Coal crisis spares paper industry 46 MBE CMT India bags order for
Pakistan’s first coal washery 48 JSPL gears up to slash DRI production
cost 50 Anupam wins `130 crore order from
SAIL 51 MoC blamed for messing up coal block
allocations 52 US coal production to drop 6.1% 53 Will China’s decision on export tax
further soften coke? 54‑ Traffic handling by major ports down
3.5% in April-August 56 Railway commodity freight revenue
down in August 58 Updated data on captive coal blocks
44 | In FoCuSBiocoal: the new fuel on the blockThis cheap, renewable fuel developed from agro-wastes deserves a closer look
42 | TECHnoLoGYCIMFR offers technology support for environment managementThe institute develops fly ash soil amendment technology for environmental preservation
36 | FEATuRETime to wind up standalone DRI plants?Only forward or backward integration can save the day for ailing sponge iron industry
26 | FEATuRECIL scraps JV route for mine revivalThe coal behemoth opts for mine developers and operators (MDOs) route to revive UG mines
6 | CoVER SToRYGrowing coal imports may leave India vulnerableExcessive reliance may make India susceptible to external shocks as seen in crude oil


COvER sTORy
6 Coal Insights, August 2012
When India joined WTO way back in the 1990s, the major plank of the protagonists of free trade was the Ricardian theory of comparative advantage. This classical theory, in simple parlance, proposes that the world would be a better place to live
in if individual economies are allowed to hinge on their areas of core competence. For example, if China can produce better peanuts at lower cost, let it produce excess of it so that the rest of the world can be fed better peanuts at cheaper rates. This way the land (and labour and capital etc.) occupied in growing peanuts elsewhere could be released to grow other things, better and cheaper, the theory says. This way the global economy will operate at the peak of its competitiveness and efficiency.
While this may work well in case of peanuts, the theory falls flat when it comes to coal, especially steam coal, where India is an extreme example of indulgence and lassitude. In at least this case, the comparative advantage of one country, say Indonesia, is actually making another (India) less competitive in every other field.
Growing coal imports may leave India vulnerable
Growing coal imports may leave India vulnerable Arindam Bandyopadhyay & Tamajit Pain

8 Coal Insights, September 2012
185, 250, 400…?
It may look like a series of Geometric Progression, but is actually the estimates of coal tonnage that India will be importing five years from now. The presence of multiple numbers indicates the multitude of estimates that keep flowing in ever so often.
Only recently, the Plan Panel projected that imports will rise to a “whopping” 185 million tons (mt) by 2017, the terminal year of the current (Twelfth) Five Year Plan. At about the same time last year, the then coal secretary Alok Perti had put this estimate at 250 mt. Two years ago (at about the same time of the year, again) a top functionary of Coal India projected an import volume of 250 mt by 2020. Then again, a globally renowned research consultant estimated (in March 2012) that the country’s thermal coal imports will go up to 400 mt by 2030.
While these numbers look pretty impressive, considering that global coal import volume is around 900 mt, some Indian importers go a few steps ahead. The country’s coal imports, according to a trader who sought anonymity, has already crossed 200 mt a year. “If you want to know the ground reality, talk to big importers, check out their figures…! Import was 250 mt in (calendar year) 2011. This year (2012) it is going to be 300 mt,” he claimed.
But don’t talk these numbers, a top coal ministry (MoC) official once said. If India started projecting coal import requirements, it would give an indication of the country’s
huge appetite to its suppliers in sourcing countries (Australia, Indonesia, South Africa and the US) who may take advantage of the situation.
“There will be a race to see who can emerge as the potential supplier. We are already paying huge prices and it is expected to get worse with these projections,” he warned.
Coal imports flat in Q1
Contrary to industry expectations and “ground realities”, coal imports into India remained somewhat flat during the first quarter (April-June) of 2012-13 (Q1) and first half of 2012 (H1 2012). According to data available with Coal Insights, coal imports through 12 major ports of the country in Q1 stood at around 19 mt, showing flat growth over the same period last year. Trading sources, however, claimed that the import
volume was larger than the figure estimated.Of the total import in Q1, over 10 mt was
non-coking coal and 7 mt coking coal. The remaining part comprised pet coal, anthracite coal and pulverized coal injection (PCI) coal.
Till August 2012, coal imports through these major ports were estimated at around 27 mt, which included 14.5 mt of non-coking coal and 10.5 mt coking coal. This was significantly lower than around 45 mt imported during April-August 2011. Earlier, overall coal imports in 2012-13 were expected to jump to around 150 mt from around 110 mt in 2011-12. However, as of now, coal imports in the current fiscal seem to fall short of than the volume expected.
“The official figures may be on the down side, as our estimates show import volume is rising all through. Even the figures estimated for last year (FY12) was below our estimates. The domestic supply constraints are leading to huge imports by the consuming sectors. Lately, the drop in international prices has made imports all the more attractive,” a coal trader said.
However, another estimate by Barclays shows India’s coal imports during H1 2012 (January-June) grew only moderately at 3 percent year-on-year. Imports during the half year stood at around 48.5 mt and lagged expectations, the report said.
Stockpile, currency restrict import
Although there remains doubt over the authenticity of various estimates, the coal industry at large agrees that a host of factors have restricted imports during the early months of the current fiscal year.
High domestic productionFirstly, the higher growth in domestic production during the first quarter was a
COvER sTORy
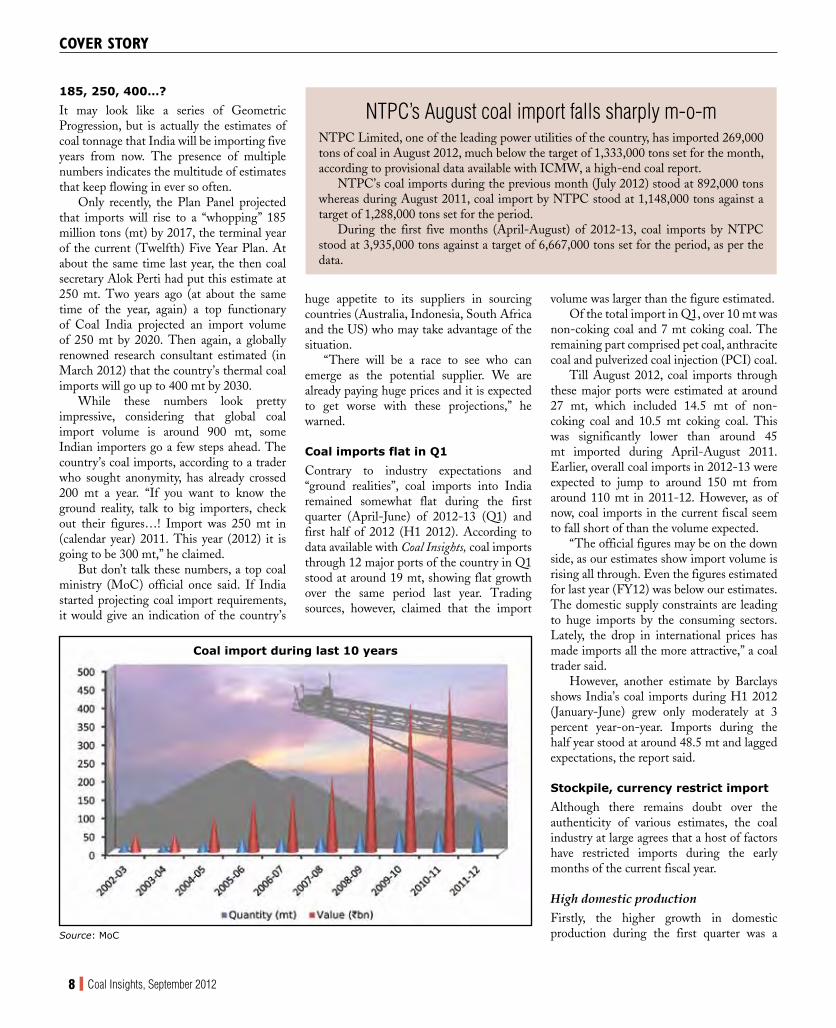
Coal import during last 10 years
Source: MoC
NTPC’s August coal import falls sharply m-o-mNTPC Limited, one of the leading power utilities of the country, has imported 269,000 tons of coal in August 2012, much below the target of 1,333,000 tons set for the month, according to provisional data available with ICMW, a high-end coal report.
NTPC’s coal imports during the previous month (July 2012) stood at 892,000 tons whereas during August 2011, coal import by NTPC stood at 1,148,000 tons against a target of 1,288,000 tons set for the period.
During the first five months (April-August) of 2012-13, coal imports by NTPC stood at 3,935,000 tons against a target of 6,667,000 tons set for the period, as per the data.

GIVE CYCLE TIMES THE CHOP. cHOP. CHOP.
The new G-Series L180G and L220G wheel loader with 20% more lifting power and 10% better breakout force, are the latest workhorses of Volvo’s wheel loader range. New engines and drivelines offer improved productivity, lower emissions, greater smoothness, serviceability and operator comfort. The improvements ensure full buckets, faster cycle times - all day, every day.
Volvo’s G Series wheel loaders: more lift, more shift.
Corporate Office:
Volvo India Pvt. Ltd. Volvo Construction Equipment #65/1, Parin Building, Bagmane Tech Park, C V Raman Nagar, Bangalore 560 093 Tel: +91 80 6691 2000 Fax: +91 80 6691 2287
volvo construction equipment
Authorized Dealers:
Infra Equip Pvt. Ltd., Dhanbad
Pollutech Engineering, Bhubaneshwar
Suchita Earthmoving Solutions, Guwahati
Suchita Millenium Projects Pvt. Ltd., Kolkata
For details contact:
Toll Free No. 1800 108 6586 E-mail: [email protected] www.volvoce.com

10 Coal Insights, September 2012
positive development that the domestic industry was looking forward to for quite some time now. In the first quarter of 2012-13, Coal India Ltd (CIL) achieved a growth of about 6.5 percent in offtake, a record high in recent past. Also, production growth hovered around 6 percent in the April-June 2012 period. This came as a major relief to the consumers after stagnant growth in the past two-three years.
Although this growth in production and offtake declined in the months of monsoon, the consumers were hopeful that CIL would make up for the lost production in the third quarter.
According to CIL chairman S. Narsing Rao, the company is expected to register an overall growth of 6-7 percent during 2012-13.
The company plans to produce 464 mt of coal in 2012-13 and despatch about 470 mt as per Annual Action Plan (AAP) compared with actual production of 435.84 mt and despatch of 433.08 mt in 2011-12. This implies an incremental production of about 30 mt in 2012-13, which Rao is confident of achieving. This growth in production and offtake would actually help restrict the growth in imports during the current year, industry sources believe.
Stockpile at portsAlong with a renewed growth in production, the high stockpile Indian ports posed a major hurdle for imports during the first quarter.
The stock of imported coal for supply to power utilities at various ports of the country
rose by 39.36 percent to 0.524 mt as on August 31, 2012 as compared to 0.376 mt as on July 31, 2012, according to data released by Central Electricity Authority (CEA). This however was lower than the stock of 1.5 mt reported on August 31 last year.
The stock had been rising consistently from March 2012 from a level of 0.390 mt to 0.679 mt as on April 30, 2012 while on May 31, 2012 it stood at 0.705 mt but after witnessing a rise for four consecutive months, it had experienced a fall in July. However, the stock level again moved up in the month of August, according to data available with Coal Insights.
Overall, the total stockpiles of both unsold and contracted coal for (all user
segments) are reported to be around 5-6 mt at various ports, sources said.
Logistics lagsThe high stockpile at ports is primarily caused by lack of handling capacity and inadequate inland transport facility. This problem becomes acute during the monsoon. According to port sources, handling of coal in the monsoon months takes place only in all-weather ports/terminals. As a result, the stockpile increases.
In some cases, environmental factors also restrict handling of the commodity. This was the case with Chennai port, where the High Court had stopped handling of coal on the ground of pollution. During the first five months (April-August) of the current financial year (2012-13), total imports of coking coal via Chennai port stood at 771 tons as compared to 107,717 tons imported during the corresponding period of previous year (2011-12). However, recently the court has reportedly agreed to relax the order.
Besides port congestion, shortage of railway rakes was also a factor inhibiting growth of offtake from CIL mines in July-August.
“It’s not only rains, but also the wagon availability which brought down the offtake rate lately. It is not as per expectation,” said Rao. In July, the wagon availability was around 177 wagons per day against expectations of around 190 wagons per day. There was a shortfall of 13 rakes a day which had a huge impact.
COvER sTORy
*coal imported for power utilities
Source: CEA
Stockpile at ports* in 2012 (in mt)
Bulging coal stock at ports restricts import


12 Coal Insights, September 2012
COvER sTORy
Slack demand Another factor that inhibited growth in import was lukewarm demand from the domestic industries, which are going through a lean patch. Industrial growth stood at a three-year low of minus 0.1 percent in the first quarter (April-June 2012), against 6.9 percent in the corresponding period of last year. Manufacturing sector witnessed a 3.5 percent de-growth in June 2012. Within manufacturing, capital goods production dropped by more than 20 percent in close succession – October 2011 (25.48 percent), March 2012 (21.3 percent) and June 2012 (27.9 percent).
Almost all the coal consuming sectors except power – steel, cement, paper, sponge iron – are facing a demand glut for different reasons. While the steel sector is witnessing slack demand, the cement makers received a severe blow from the Competition Commission of India (CCI) allegedly on earning excessive profit through cartelisation. The sponge iron makers are suffering heavy pressure on margins due to softening demand for steel and increase in raw material prices. All these factors are leading to reduced demand for fuel from these sectors.
Rupee’s depreciationLastly, the recent depreciation of Indian rupee (INR) against the US dollar has to some extent restricted import of the commodity. In fact, the currency’s depreciation nullified the impact of a fall in international coal prices. The rupee’s weakness resulted from an adverse
trade balance and high inflationary pressure. Together these factors pushed the currency down to `56 per US dollar in recent weeks.
A sharp rise in dollar often leads to increased risk of default by domestic importers. The current scenario reminded a short spell of rupee’s depreciation in 2011 which stoked fears of default by some large importers.
Although there has been a little gain in the rupee lately, economic forecasters predict sustained pressure on the local currency in the coming months. This, if comes true, may restrict coal imports going forward.
Prices offset currency pressure
While stockpile and depreciation in the rupee are believed to have restricted India’s import
of coal during the early months of 2012-13, the steep decline in international coal prices has had a contrary effect. This was true for both thermal and coking coal import by the country.
Prices of thermal coal imports from Indonesia dipped 23 percent in the January-September period as ample supplies and continued weak demand from India and other buyers weighed, market sources told Coal Insights.
Indonesian coal of 5,900 kCal GAR was quoted at $72.8 per ton on September 20, 2012 as compared to $95 per ton on January 3, 2012. Similarly, Indonesian coal of 5,000 kCal GAR is quoted at $56.8 per ton on September 20, 2012 as compared to $74 per ton on January 3, 2012.
Simultaneously, imported coal prices from South Africa declined by about 19 percent in the January-September period because of the weak demand. South African coal of 6,000 kCal NAR is quoted at $86.2 per ton on September 20, 2012, down from $106 per ton on January 3, 2012.
Imported (thermal) coal prices from Australia dipped by around 20 percent in the January-September period owing to the weak demand conditions prevailing in the market. Australian coal of 6,300 GAR is quoted at $89.5 per ton on September 20, 2012 compared to $112 per ton on January 3, 2012.
In the coking coal segment, prices of premium hard coking coal from Australia dipped 36 percent to $140.5 per ton on September 20, 2012 from $219 per ton
53.0
53.5
54.0
54.5
55.0
55.5
56.0
56.5
57.0INR movement against USD
50.00
60.00
70.00
80.00
90.00
100.00
110.00
120.00
130.00
PRIC
E ($
/TO
N)
South African Coal (6,000 kcal/kg NAR) Australian Coal (6,300 kcal/kg GAR)Indonesian Coal (5,900 kcal/kg GAR) Indonesian Coal (5,000 kcal/kg GAR)
International steam coal price trends in 2012 (FOB)


14 Coal Insights, September 2012
COvER sTORy
on January 3, 2012, mainly because of ample supplies from the miners and low demand from steel mills in India and other countries.
The semi soft variety also dropped 37 percent to $94.5 per ton on September 20, 2012 compared to $150 per ton on January 3, 2012. As a result of this, prices of imported met coke from Australia also fell 10 percent to $324 per ton CFR India from $363 per ton on January 3, 2012.
Sources said there is too much supply for the fourth quarter. The supply overhang is expected to continue unless there is a significant pick-up in global economic growth.
Analysts still expect the increase in global thermal coal export capacity in 2012-13 to slightly outpace demand growth, causing the market to remain in a state of slack.
There were reports of buying interest in lower-grade coal with a heating value of 5,500 kCal/kg.
News of further production and job cuts by Australian coal producers also added bearish sentiment to the thermal coal market. Reports said the world’s biggest miner, BHP Billiton, announced that it would stop production at its Gregory coking coal mine in Queensland.
Xstrata, the world’s largest producer of seaborne thermal coal, said in a statement that a significant portion of the Australian thermal and coking coal industry is losing money at current prices.
Although coking coal, which is used for steelmaking, and thermal coal, used for power
generation, are largely separate markets, low-grade coking coal and high-grade thermal coal are sometimes substituted for each other and supply and demand impacts can flow from one market to the other.
Power sector most vulnerable
The import boom was started by the sudden increase in coal requirement of the power utilities. While coking coal import remained more or less steady over the years, there was an abrupt increase in thermal coal import since 2002-03. Over the years, what started
as a stop-gap arrangement has become the mainstay of the sector’s expansion strategy.
Amid the ongoing debate over Fuel Supply Agreements (FSA) and price-pooling for imported coal, the power utilities becoming critically dependent on imported coal.
According to an estimate by the Ministry of Coal and Planning Commission, the demand for coal in the country for power utilities during 2012-13 would be 512 mt. Against this projected demand, supply from indigenous sources for power utilities has been estimated at 409 mt, leaving a shortfall of 103 mt.
It is estimated that CIL will supply 347 mt coal to power utilities while SCCL will supply another 37 mt. A total of 25 mt of coal is likely to come from other sources, including captive coal blocks, during the year.
The demand-supply gap during 2012-13 has been envisaged to be met through imports of about 68 mt of coal, equivalent to 103 mt of indigenous coal, according to the estimate.
As per the new FSA norms, the power sector may need to procure a substantial chunk of its coal requirements from overseas sources. Even for a non-coastal plant, this share may go up to 35 percent. Overall, the sector’s exposure to imported coal may rise to 30 percent of total consumption from current 13 percent over the next five years.
115.00
135.00
155.00
175.00
195.00
215.00
235.00
FOB
($/T
ON
)
HCC Peak Down Region Premium Low Vol HCC 64 Mid Vol
International coking coal price trends in 2012
Growing dependence on imported coal makes power sector vulnerable


16 Coal Insights, September 2012
Forex outgo raises concern
Apart from the power sector’s growing dependence on imports, the large forex outgo also poses a serious concern.
At the current rate, coal imports by India costs more than $10 billion, which is a sizeable part of the country’s total import bill. At current exchange rate, India’s coal import bill moved up 10 times in the last eight years. In Rupee terms, coal import bill increased from `50.1 billion (bn) in 2003-04 to a massive `415 bn in 2010-11. During April-October 2011, the value of coal imports shot up further to `457.3 bn. Overall, the country has spent over `250,000 crore on coal imports in the last 10 years.
The huge outgo on imports calls for attention in view of the rising current account deficit (CAD) of the country. CAD hit a record 4.2 percent of GDP in 2011-12 and rose further to 4.5 percent in January-March 2012. Only recently, Reserve Bank of India (RBI) has expressed grave concern over the rising CAD. Former RBI governor Y.V. Reddy has said that the government viewed a CAD of 2.5 percent of GDP as a safe average.
Captive chaos may boost import
The surge in coal imports, trading sources
said, has just begun, and may assume immense proportions in the coming years. While factors like logistics lags, currency depreciation and increasing stockpiles would restrict inflows to some extent, the current fiasco over captive block allocation by the government may s i n g l e - h a n d e d l y open the floodgate for increased flow of the dry fuel into the country.
There, however, may not be any drastic impact in the short term. “I don’t think there will be any significant impact of this controversy on
current production by CIL or others. So there will not be any near-term impact, good or bad, on import too,” said an industry veteran.
In the short term, the coal trading circle believes, the international prices will remain soft and Indian imports will witness a healthy growth in 2012-13 over last year. “The prices are likely to remain subdued this year. This is so because demand scenario is not so good. The US economy is not in a good shape and industries dependent on the US market are not doing well. The Euro Zone too is facing a slowdown. Australia is facing weakness in
industrial growth; so is Japan. Only South America, China and India have some demand,” the expert informed.
As a result, prices will continue to remain soft for some time. “It is to be seen how long they can hold on to these prices. Prices may take a beating,” he added.
According to Barclays, India’s imports could pick up in the second half of 2012 (July-December) and reach around 62 mt. This would take the annual import volume to over 110 mt in the calendar year, the report said.
In the medium term, however, the current controversy over block allocation may actually worsen the domestic supply scenario. If not anything else, the alleged coal scam report released by the Comptroller & Auditor General (CAG) and the subsequent enquiries initiated by the Central Bureau of Investigation (CBI) has put the captive production plans in a quandary.
The MoC can do little at the moment to pep up captive block owners to increase production. The only tool in hand is de-allocation of blocks. Already, a number of blocks have been de-allocated and some others are in the pipeline. Apparently, nobody is not sure about the fate of these de-allocated blocks. Even if these blocks are handed over to CIL – that again would be a lengthy process – the development and production from the same would be postponed for an indefinite period. All these would lead to increased requirement for imports, not only by the power sector but other consumers as well.
At this point, it is to be noted that the ministry’s medium-term goal placed highest importance to the captive production segment. While CIL and SCCL are likely to continue with a moderate rate of growth in production, the captive blocks were banked on for a significant spurt in volume. In the absence of this spurt, India’s dependence on coal imports will only accentuate further, bringing the growth engines of the economy critically dependent on foreign supplies.
Moreover, such a scenario would only replicate the country’s vulnerability to crude price movements in the international market. This would open yet another front of assault. The twin impacts of crude price hike on domestic inflation rates and also on the current account deficit and trade imbalance could be witnessed in case of coal as well. “Not the best of options,” said a coal industry veteran, “given that you have an option to avoid that.”
COvER sTORy
India’s coal import value (in `bn)
Year Coking coal
Non-coking coal
Total import
2003-04 36.7 13.4 50.1
2004-05 72.4 30.2 102.6
2005-06 95.4 53.7 149.1
2006-07 101.8 65.1 166.9
2007-08 121.0 86.4 207.4
2008-09 226.1 187.3 413.4
2009-10 201.3 190.5 391.8
2010-11 208.6 206.9 415.5
2011-12* 241.7 215.6 457.3
*up to October Source: MoC
Indian power utilities’ August import up 2.24% m-o-m
The import of steam coal by Indian power utilities, including imported coal based plants, in August 2012 stood at 4.1 million tons (mt), up marginally by 2.24 percent from 4.01 mt in July, as per provisional data of Central Electricity Authority (CEA) available with Coal Insights.
The import in August was lower than the target of 5.83 mt set by CEA for the month, but 0.91 mt higher than 3.19 mt imported in August 2011, the data revealed.
During August 2012, imported coal based plants had brought in 2.17 mt of coal whereas during the previous month, the figure stood at 1.87 mt.
The import during the first five months of 2012-13 stood at 21.99 mt, 24.61% lower than the target of 29.17 mt set for the period. However, imports during the first five months of current financial year were up 22.58 percent compared with 17.94 mt imported during the corresponding period of 2011-12, according to the data.
CEA has set a target of 70 mt for coal import by power utilities, including 24 mt by imported coal based plants, for 2012-13.


18 Coal Insights, September 2012
COvER sTORy
Coal Insights Bureau
Months after the government asked Coal India Ltd (CIL) to consider imports, the board of directors
of the coal monolith has finally given a go ahead. In a recent development, the board has approved import of coal for power producers that are ready to accept it on a cost-plus basis. This arrangement, however, will be in vogue until there is a consensus on the price-pooling mechanism under which customers will be charged a uniform average price for domestic and foreign fuel.
This stamp of approval brings to end an impasse over the proposal to import coal to meet the miner’s obligatory fuel supply requirements. As of today, CIL is committed to meet 80 percent of the power producers’ coal requirements, 15 percent of which can be met through imports. As per media reports, CIL may consider going for an import volume of around 15 to 18 million tons (mt) of coal per year.
It is, however, still not clear how the company plans to go about the task. CIL chairman S. Narsing Rao had earlier said
that the company would not go for adding another layer in the supply chain, nor will it take any hit to its bottomline. The scenario has become complicated after many consumers raised objections over the price-pooling mechanism.
Meanwhile, CIL’s plan to import coal has faced opposition from expected quarters. The workers’ unions which see the proposed move as a step towards privatisation have raised their objections to the plan.
“We will oppose the plan to import coal by CIL as we oppose any move to privatise the coal sector,” union sources said.
Even the board of CIL is still undecided about the diktat from the government. As per the new fuel supply agreement (FSA) proposed by the ministry, CIL needs to sign agreements for 80 percent of fuel supply requirements of power plants, 15 percent of which may be met by imports. However, with the board failing to take any conclusive stance on the issue, the matter is hanging fire.
Incidentally, the proposal of CIL importing coal was not received well by the market and experts. Shares of the company dipped on concerns that any decision to
CIL board approves import plan, traders unperturbed
import coal by CIL would add to its cost burden.
“The company does not have any exposure to coal import. Also, it will not like to just add another layer in the supply chain and the consumers would not like to source imports by paying a higher price,” said an industry source.
Importers not perturbed
Meanwhile, the pure play traders are not perturbed by CIL’s proposed move to import coal and pool prices to make imports less pricey.
Commenting on the issue, a leading south-based importer said, “First, you have to see how much will they import. I don’t think CIL will import much. Secondly, their operating cost will be high. They will give the coal primarily to government power companies. Private power companies will not take it from them.”
Also, the government organisations are not very flexible in operations and will perhaps not be able to change their operations to take advantage of price movements, he said. Thus, the proposal may not look very lucrative to them after a while.
“Government agencies like MMTC and State Trading Corporation (STC) have high operating costs. There is hardly any accountability on loss. They have a high cost structure as compared to the private players. Also, their transport cost is at par. And they keep 10-12 percent margin. The only advantage they enjoy is that they play on volumes. For instance, these companies can take a few panamax vessels (100,000 tons capacity) at a time. Thus, the law of average helps them manage the operations. But then, their distribution is not good,” the trader said.
In comparison, private players who have integrated systems to import, can have proper supervision and have well-managed stocking facility. “Such players will continue to do well, no matter who comes into the trade. The market is huge and it will continue to grow.”
He however proposed that “a good model could be to involve small traders who can source and trade.” The ministry could consider outsourcing the activity to these players. The large PSUs, in turn, could bring those sources under one umbrella and do the distribution part, he added.


20 Coal Insights, September 2012
In the international market, Australian thermal coal of heating value of 6,300 kcal GAR is being offered at around $89.55 per ton in September against $90 per ton in August. Offers of South African thermal coal of heating value of 6,000 kcal NAR fell marginally to $86.55 per ton in September from $87.65 per ton in August. Offers of Indonesian coal of 5,900 kcal GAR is hovering around $72.8 per ton in September, while coal of heating value 5,000 kcal/kg GAR is quoted at $56.8 per ton.
Traders said deals are struck only if the
commodity is required urgently. No one is buying to stock coal and small power projects are also buying low grade coal with high ash.
Outlook
Analysts feel India’s coal imports are expected to rise in the financial year through March 2013 as more end-users turn overseas. Excess supply has hammered international thermal coal prices in recent months, with top exporter Indonesia cutting its output forecast to around 360 million tons (mt) from 390 mt to 400 mt for 2012.
According to analysts, based on the current global supply and demand picture, end users expect thermal coal prices to remain well below $100 per ton for the next 10-12 months.
COAL mARkET funDAmEnTALs
Coal Insights Bureau
Imported thermal coal prices remained flat in September even as inquiries from India increased as the monsoon season is
almost over. However, the rise in inquiries is not translating into business due to a wide gap between bids and offers.
Inquiries for low calorific value 3,600 kcal/kg to 4,200 kcal/kg GAR coal have risen, but there is a $2-4 per ton difference between bids and offers. Participants added that Indian buying demand is almost negligible as the country grapples with a sluggish industrial economy and high stockpiles at ports.
The stockpiles of both unsold and contracted coal are reported to be around 5 million-6 million tons at various ports, sources said. Some sources said a couple of large power utilities are renegotiating their contracts or finding loopholes to wriggle out of old coal contracts.
Meanwhile, the softening of Richards Bay FOB prices has reignited the interest of Indian buyers and inquiries have started coming in for South African coal.
Ultratech Cement, for example, is in the market for 170,000 tons of South African coal, according to reports. Sources said that
several cement producers are more interested in cheaper US coal than South African coal.
Analysts also expect imports to take place with appreciation of rupee to `53.54 per dollar from levels of ̀ 55 per dollar in August.
Thermal coal import prices remain flat in Sept
Steam coal CFR India ($/ton)
Date West (6,300 kcal/kg GAR)
West (5,900 kcal/kg GAR)
West (5,000 kcal/kg GAR)
East (6,300 kcal/kg GAR)
East (5,900 kcal/kg GAR)
East (5,000 kcal/kg GAR)
5-Jul 107.05 83.40 66.65 108.65 82.90 66.15 11-Jul 101.15 82.00 64.75 102.55 81.40 64.25 18-Jul 102.65 81.40 64.35 104.10 80.70 64.00 24-Jul 101.60 80.90 64.35 103.05 80.00 63.70 25-Jul 101.70 80.75 64.30 103.15 79.80 63.60 26-Jul 102.00 80.55 64.20 103.50 79.60 63.50 31-Jul 104.55 79.50 63.40 106.05 78.55 62.70 2-Aug 104.25 79.05 62.90 105.75 78.10 62.20 3-Aug 103.75 79.05 62.90 105.25 78.10 62.20 17-Aug 104.10 79.70 63.75 105.60 78.70 63.05 20-Aug 103.90 79.70 63.75 105.40 78.70 63.05 23-Aug 103.90 80.15 64.25 105.40 79.15 63.55 28-Aug 101.30 80.40 64.65 102.80 79.40 63.95 4-Sep 102.70 80.75 65.30 104.30 79.75 64.60 10-Sep 100.15 80.75 64.95 101.65 79.85 64.25 11-Sep 99.45 80.85 65.10 100.95 79.95 64.45 12-Sep 99.15 80.85 65.10 100.65 79.95 64.45 13-Sep 96.80 80.55 64.70 98.10 79.65 64.05 14-Sep 98.35 80.35 64.50 99.65 79.65 64.05 20-Sep 99.60 80.55 64.40 100.80 79.95 64.05
50.00
60.00
70.00
80.00
90.00
100.00
110.00
120.00
130.00
7-Ju
n
13-Ju
n
19-Ju
n
25-Ju
n
1-Ju
l
7-Ju
l
13-Ju
l
19-Ju
l
25-Ju
l
31-Ju
l
6-Au
g
12-A
ug
18-A
ug
24-A
ug
30-A
ug
5-Se
p
11-S
ep
17-S
ep
PRIC
E ($
/TO
N)
East (6,300 kcal/kg GAR) East (5,900 kcal/kg GAR) East (5,000 kcal/kg GAR)
Steam coal price trends CFR India


22 Coal Insights, September 2012
COAL mARkET funDAmEnTALs
Coal Insights Bureau
Imported spot coking coal prices eased 12 percent in September, compared to August, on back of plentiful supply and
lean buying interest. Premium low-volatile hard coking coal dipped further, while the price for second-tier PCI was supported by Chinese buying.
Premium low-vol HCCs traded at around $141 per ton FOB Australia, down from levels of $160 per ton in August end. Low vol PCI prices recovered to $103 per ton from a low $101 per ton with some buying
Imported spot coking coal prices ease 12% in Sept
interest. However, the semi soft variety was quoted at $94 per ton, down from $101 per ton in August.
Major miners of Australia were reported to have given relatively lower offers to China, India and Europe, implying increased pressure on producers to get their coal moved. Some indicative bids found from
Coking coal expected to remain weak till Dec: Coke makerCoal Insights Bureau
The spot prices of premium coking coal may continue to weaken further till December despite BHP
having recently decided to close down operations at two of its mines, an official of a leading coke maker told Coal Insights.
“The current weak trend in spot coking coal prices, which is being quoted at around $145 per ton, has forced miners to cut the contract price for the October-December quarter to around $170 per ton from a high of $221-$225 per ton for the July-September quarter. This weak trend is likely to continue till December and thereafter it will depend on the global economic situation,” the official said.
BHP Billiton had in May decided to shut its Norwich Park mine and on September 9 announced to cease production at Gregory mine, both in Australia, citing steep fall in coking coal prices that made its operations unprofitable.
“In any case, the quality of coal from these two mines was not that good and thus there were hardly any buyers. The
material from these two mines was being sold by BHP at much lower rates. Norwich Park coal was of ultra-low volatile category whereas Gregory mines coal was of high volatile category,” the official said.
Miners generally opt for planned shutdowns whenever the prices of coking coal come down in an attempt to reduce supplies to keep price firm. However, this year till now, this strategy does not seem to have worked.
According to industry experts, there is abundant availability of coking coal in the market at present while demand from steel makers is not that encouraging due to weak market conditions in most part of the world, including China and India.
“It is expected that steel demand will pick up in the fourth quarter of 2012 and that will pave the way for an increase in steel price and consequently an increase in coking coal prices may be from the beginning of 2013 ,” he said.
Asked why he feels that coking coal prices would start firming up from January 2013, the official explained that at present miners in the US and Canada are continuing
operations despite not making profits due to sharp fall in prices consequent to decline in natural gas prices and this is maintaining a healthy coal supply situation in the global market.
In fact, they are storing the middlings and rejects and exporting the prime material to maintain cash flow, he said. They are storing the material in the hope that prices would revive soon and they would be able to dispose those materials at better prices later on.
The same thing is happening in Mozambique from where coking coal is now being exported. They too are storing the middling and rejects as there is no outlet for such material.
But there is a limit to which they can continue storing the material, because it amounts to blocking the capital and a stage will surely come when they have to shut operations. Once that happens, probably by December-end, there will be sharp reduction in coking coal supplies world over and then prices would start firming up, the official said.
130.00140.00150.00160.00170.00180.00190.00200.00210.00220.00230.00240.00
FOB
($/T
ON
)
HCC Peak Down Region Premium Low Vol HCC 64 Mid Vol
Coking coal price assessment (FOB)


24 Coal Insights, September 2012
China and Europe were at around $140 per ton FOB; however, no immediate purchase was observed.
Elsewhere, Australian coal miner Anglo American and South Korean steelmaker Posco settled their PCI coal contract price at $125 per ton FOB for the fourth quarter, 22.8 percent lower than $162 per ton FOB in the third quarter.
The two companies also followed the
Q4 premium low-volatile hard coking coal price settled earlier by Japan’s Nippon Steel, and BHP Billiton-Mitsubishi Alliance, and signed German Creek premium HCC at $170 per ton FOB. This is down $55 per ton, or 24 percent, from $225 per ton in Q3.
The settlement of BHP Mitsubishi Alliance labour unrest has proven to be detrimental to the interests of Australian miners. This has resulted in rebound in
supply, thereby hurting price sentiment. Sources said the major purchasers from India and China have been reticent owing to monsoon and cheaper availability from domestic and Mongolian sources.
However, the reticence in the market is not expected to last long. Indian majors cannot postpone buying for more than a month with inventory levels depleting fast. Moreover, with the end of monsoons in September, construction activity is expected to pick up resulting in more demand for steel.
According to Indian coke maker Gujarat NRE Coke Ltd, India’s coking coal import requirement might rise to over 50 million tons per annum (mtpa) from the present 35 mtpa by 2015-16 in line with steel industry production of 120 mtpa by that time.
Met coke
Lack of buying appetite continued to characterise the metallurgical coke market. Coke with 12.5 percent ash was quoted at $324 per ton, down from $343 per ton cfr east India a month earlier.
In India, met coke prices hovered around `19,500 per ton in the eastern region, sources said.
According to Gujarat NRE Coke, only organisations owning large met coke production capacities with strong linkages for raw material sourcing can withstand the competition in the global met coke market with huge opportunities to expand their business.
The demand supply gap across the globe for met coke is significantly attracting more players to enter this segment to reap the benefits. However, shortage in availability of crucial raw material i.e coking coal has restricted the entry of new suppliers, making the market skewed in favour of the suppliers, the company said.
The future of the met coke industry relies heavily on the future of the steel industry, with majority of steel still being produced through blast furnace route. Therefore, any slump in steel industry would adversely affect the met coke industry.
The met coke industry has also been impacted by availability of crucial raw material i.e coking coal with its global supply generally determining the prices of both coking coal and met coke, the company said.
Coking coal FOB Australia ($/ton)
Date HCC Peak Down Region
Premium Low Vol
HCC 64 Mid Vol Low Vol PCI Low Vol 12
Ash PCI Semi Soft
5-Jul 219.00 219.50 175.50 145.00 127.50 109.50
11-Jul 215.50 216.00 171.00 143.00 128.00 105.50
18-Jul 210.00 210.50 170.50 139.50 126.50 104.50
24-Jul 190.50 191.00 165.00 138.00 116.00 102.50
25-Jul 187.50 188.00 163.50 136.50 113.00 102.50
26-Jul 181.50 182.00 158.00 132.50 109.00 95.50
31-Jul 181.00 181.50 157.50 128.50 104.50 95.50
2-Aug 180.00 180.50 157.50 128.00 104.50 96.00
3-Aug 180.00 180.50 157.00 128.00 104.50 96.00
17-Aug 166.50 167.00 146.50 116.00 99.00 108.00
20-Aug NA NA NA NA NA NA
23-Aug 162.00 162.55 139.00 114.50 96.50 104.00
28-Aug 159.50 160.00 139.00 114.00 98.50 101.50
4-Sep 157.50 158.00 133.50 111.00 92.50 98.50
10-Sep 147.50 147.50 131.00 106.50 94.00 98.00
11-Sep 147.00 147.00 131.00 105.00 94.00 98.00
12-Sep 145.50 145.50 130.50 105.00 94.00 98.00
13-Sep 144.00 144.00 128.50 104.00 93.50 98.00
14-Sep 140.50 140.50 124.50 103.50 93.00 97.50
20-Sep 140.50 140.50 124.50 103.00 94.00 94.50
80.00
90.00
100.00
110.00
120.00
130.00
140.00
150.00
160.00
170.00
1-M
ay
7-M
ay
13-M
ay
19-M
ay
25-M
ay
31-M
ay
6-Ju
n
12-Ju
n
18-Ju
n
24-Ju
n
30-Ju
n
6-Ju
l
12-Ju
l
18-Ju
l
24-Ju
l
30-Ju
l
5-Au
g
11-A
ug
17-A
ug
FOB
($/T
ON
)
Low Vol PCI Low Vol 12 Ash PCI Semi Soft
Coking coal price assessment (FOB)
COAL mARkET funDAmEnTALs


26 Coal Insights, September 2012
Coal Insights Bureau
Coal India Ltd (CIL) has scrapped its earlier plan to revive 18 underground (UG) abandoned mines through
selection of joint venture partners due to lack of satisfactory response and the company has now decided to revive these mines by appointing the Mine Developer & Operator (MDO) route, an official of the ministry of coal has said.
Initially 18 UG abandoned mines, each having more than 10 million tons (mt) of reserves were identified for revival by inviting expression of interest (EoI) for selection of JV partners.
“As the response was not satisfactory, CIL had decided to revive these mines by appointing the MDO,” the official said.
Of the 18 mines, Bharat Coking Coal Ltd (BCCL) had the maximum number of eight mines, while Eastern Coalfields Ltd
(ECL) and Central Coalfields Ltd (CCL) had six and four mines respectively.
The move was in line with new CIL chairman S. Narsing Rao’s expressed intention to focus on MDO route for increasing production. Days after assuming office in April, Rao had said that CIL would appoint MDOs to develop and mine new blocks as well as old blocks in difficult terrains.
The issue of reopening abandoned mines has been hanging fire for some time now. Industry sources welcomed the move to opt for MDO route, but expressed doubt about the viability of operations in some of them.
Earlier, CIL in 2008 had planned to open 18 abandoned mines with total reserves of around 1.6 billion tons. The company had completed the bidding process in 2009. Although the bidding process was apparently successful and production was expected to start in 2010, the projects failed to take off as
CIL scraps JV route for mine revival, opts for MDO
bidders did not find them economically viable. The companies shortlisted in the first round of bidding included ArcelorMittal India, Rio Tinto, Titan Mining, JSW Steel, JSW Energy, Monnet Ispat, Essar Mineral Reserves and Sunflag Iron & Steel. The primary reason of the mines not being remunerative was the poor quality of coal available in them, according to industry sources.
SCCL to revive mines
Meanwhile, Singareni Collieries Company Ltd (SCCL) has proposed to revive at least three closed opencast (OC) mines during the 12th Plan period, the coal ministry official said. The mines to be revived are MNG opencast at Manuguru, RKP opencast at Mandamarri and RG opencast III phase 2 at Godavari Khani, he said.
SCCL has currently a total of 174 functional and non-functional coal mines.
The assessed geological coal reserves in the command area of SCCL stand at about 9,877 mt, of which 2,064 mt stand consumed on account of the production from the mines since inception of the company.
About 2,344 mt of reserves are available in the operating mines and about 5,469 mt of reserves are untapped.
However, of these untapped reserves, the reserves that can be projectised are assessed to be 2,959 mt and the balance 2,510 mt are difficult to mine and cannot be projectised due to geological disturbances and adverse geo-mining conditions.
At the current level of production of about 52 mt, the currently assessed extractable reserves in the command area of SCCL are expected to last for over 60 years.
During the 12th Plan (2012-17), an Exploration Programme for Drilling of 650,000 metres in virgin blocks of SCCL command areas is envisaged. It is also planned to carry out 16,500 metres of drilling under Regional Exploration Programme of Geological Survey of India (GSI) and 80,000 meters drilling under the Ministry of Coal’s Plan Scheme of Promotional Exploration during the 12th Plan period in the command area of SCCL.
Further, SCCL envisages increasing the current level of production of about 52 mt achieved in 2011-12, the terminal year of the 11th Plan to 57 mt in 2016-17, the terminal year of the 12th Plan and to 63 mt in 2021-22, the terminal year of the 13th Plan.
fEATuRE


28 Coal Insights, September 2012
fEATuRE
growth in coal production by CIL last year after a period of stagnated growth.
“After near-stagnation in the country’s coal production for two consecutive years 2009-10 and 2010-11 at 533 million tons (mt), the year 2011-12 saw a 12-mt rise at 545 mt. Of this, exactly 80 percent (i.e. 436 mt) came from the main producer, Coal India Ltd, as against its achieving 431 mt in the previous two years,” Arora said.
He said that: “In a situation of restricted activity with imposition of CEPI (comprehensive environmental pollution index) and ‘go-no-go’ hurdle that continued till March 2012, CIL’s building-up a 5-mt increase is a reasonable achievement”.
Arora, however, expressed concern at the lack of growth in production from underground mines.
“From 75 mt of country’s underground raising witnessed two decades ago, the situation in UG production has not improved at all and has rather deteriorated. Hardly 60 mt yearly is now produced from UG mines,” he said.
On the positive side, Arora noted that S. Narsing Rao, currently the chairman of CIL, had put in serious efforts to bring in modernisation in underground technology at Singareni Colliery Company Ltd (SCCL). This effort had helped significantly improve SCCL’s performance in underground mining.
“We are hopeful that under Rao’s stewardship, CIL will soon be able to turn the tables,” he added.
Commenting on the ongoing discussions about fuel supply agreement (FSA), he said, “For the power plants, besides the 80 percent trigger level (a precise percentage of annual contract quantity that coal company will supply and consumer will lift), it has now been decided that Coal India will bear penalties on a slab basis – from 1.5 to as high as 40 percent depending on the extent of supplies.”
While such penalties are being considered for supplies to the power sector, Arora said similar provisions could be thought of for other coal consuming industries. “It is our request to CIL that the interest of a large number of consumers in non-power group where supplies are never made on quality or quantity terms nor even on time and whose contribution is nonetheless significant in the country’s economy, should not be ignored,” he added.
Delayed delivery defeating the purpose of coal e-auction: ICMA
Coal Insights Bureau
Delayed delivery of coal purchased through e-auction is defeating the very purpose of this route and
leading to loss of interest among a section of buyers, the Indian Coal Merchants Association (ICMA) has alleged.
“E-auction has been of mutual interest for the companies and the consumers who earlier had less opportunity to buy fuel directly from the coal companies, but it has been found that after paying the full price in advance, the supplies from Coal India Ltd (CIL) remained stalled for months with large sums remaining blocked with the coal companies,” ICMA president V.K. Arora said.
In fact, a large number of rakes taken in e-auction remain in arrears and consumers are denied timely supplies, he alleged.
Arora, who was addressing the 81st Annual General Meeting of ICMA in Kolkata, further said, “In a way, the very spirit of e-auction is lost due to considerable delay in deliveries. We request CIL and Ministry of Coal to seriously look into the matter,”
About the likely cause of this problem, he said, “We find a trading of charge going between Railways and the collieries. While
Railways put the onus on collieries’ poor loading performance, collieries hold the Railways responsible for their short supply of rakes and heavy left-behinds.”
Besides, ICMA was also concerned about the high prices of coal sold through e-auction route. An “ever-widening” gap between the notified price and the e-auction price by `1,500 and more per ton is a huge problem and at times prevents customers from bidding, Arora said.
Earlier, some of the ICMA members had expressed their dissatisfaction about the alleged mismatch in coal quality announced and delivered (grade slippage) through e-auction. CIL, on its part, however has claimed that such instances were few and far between. In case of specific complaints, CIL sources said, prompt action is taken to redress the problem.
According to data provided by CIL, total revenue from e-auction of coal increased from `1,480.78 crore in 2007-08 to `13,826.88 crore in 2011-12. The total volume of coal sold through e-auction by CIL also increased from 28.79 mt in 2007-08 to 49.70 mt in 2011-12.
Non-power sectors
Meanwhile, ICMA has welcomed the
(Inset) V K Arora, President, ICMA


30 Coal Insights, September 2012
fEATuRE
Power sector feels the heat
SPU loan restructuring to reach `1.5 trillion: CRISIL
Coal Insights Bureau
Restructuring of bank loans taken by state power utilities (SPUs) may reach a staggering `1.5 trillion for
the period 2011-12 to 2012-13, according to a report released by CRISIL.
“In recent months, availability of unsecured short-term loans from Indian banks has diminished. This is exacerbating refinancing and liquidity pressure, especially for the SPUs.
This will lead to a significant increase in restructuring of SPU loans to nearly `1.5 trillion. So far, SPU loans of `0.6 trillion have been restructured,” says Pawan Agrawal, senior director, CRISIL Ratings.
The total volume of loans restructured by Indian banks may increase sharply to `3.25 trillion between 2011-12 and 2012-13,
against the earlier estimate of `2.0 trillion, the report says.
The majority of restructuring will be in loans to SPUs, construction and infrastructure sectors. The rise is a result of significantly higher funding challenges being faced by companies with large debt.
A significant part of the restructured loans may also slip into non-performing assets (NPAs). However, this will depend on the terms of restructuring and fundamental viability of the projects and the companies, the report says.
Loans of `1.6 trillion have already been restructured in 2011-12 and in the first quarter of 2012-13. The majority of restructuring will be in loans to the state power utilities (SPUs), and the construction and infrastructure sectors. The rise is a result of significantly higher funding challenges being faced by companies with large debt.
It is most likely SPU-loan restructuring will happen through a centralised scheme coordinated by the government of India (GoI).
“Furthermore, inability to raise adequate equity in a timely manner is straining the balance sheets and financial flexibility of developers in infrastructure and construction sectors, resulting in an increased likelihood of restructuring”, adds Agrawal. Other vulnerable sectors include iron and steel, textiles, and engineering.
The proportion of restructured loans in this period will be high at around 5.7 percent of banks’ advances as on March 31, 2013. Adds Agrawal, “Around `0.50 trillion of these restructured loans may slip into NPAs, though this will depend on the terms of restructuring and fundamental viability of the projects and the companies. These slippages can aggravate the already stressed asset quality of banks by further increasing NPAs by 50 to 75 basis points beyond March 2013.”
The loans to SPUs are unlikely to slip into NPAs, given the support expected from state and central governments.
Despite continued weak growth and profitability in the corporate sector, the large restructuring will help limit the increase in the banks’ NPAs in the near term. According to CRISIL’s estimates, the lower GDP growth of 5.5 percent expected in 2012-13 may result in increase in banks’ gross NPAs to 3.5 percent by end-March 2013 from around 3.0 percent at the end of June 2012. The increase will be driven largely by delinquencies in the micro, small and medium enterprises, and agriculture and allied sectors.
CRISIL Ratings director, Suman Chowdhury, says, “The banks have sought to arrest the deterioration in asset quality through measures such as strong senior management focus on recovery, setting up dedicated teams for collections, and tightening of underwriting norms. While the banks’ adequate capitalisation, expected support from GoI for public sector banks, and stable resource profiles will continue to support their credit risk profiles, any significant and sustained deterioration in asset quality and earnings may lead to weakening in the banks’ credit quality.”


32 Coal Insights, September 2012
fEATuRE
Capacity addition
A total of 550 MW of power generation capacity was added in India during the month of August 2012, taking the total installed generation of the country to 207,006.04 MW, a provisional data prepared by CEA revealed.
The capacity addition in July was 950 MW. With this total power generation capacity added during the first five months of 2012-13 (April-August) stood at 6,766 MW, as per CEA’s revised data.
The capacity addition of 550 MW in August was in thermal power sector where private sector companies – BPSCL (250 MW) at Bina TPP Unit 1 in Madhya Pradesh and Vidharba Ind. Power Ltd (300 MW) at Butibori TPP Unit 1 in Maharashtra.
In July 2012 also, the entire capacity of 950 MW was added in the thermal sector of which 150 MW came in Andhra Pradesh at Simhapuri Phase-I while the remaining 800 MW was added in Gujarat at Mundra Ultra Mega thermal power project of Tata Power.
Critical coal stock
Inadequate coal supplies by domestic coal companies and lower imports by power utilities have led to critical coal stock position at a number of Indian power plants.
According to data available with Coal Insights, a total of 31 plants of the total 89 in the country were faced with critical coal stock position of less than seven days as on August 30.
Sanjukta Ganguly
India’s power generation in August 2012 fell to 74,338.11 million units (MU) from 76,035.74 MU generated in July,
according to provisional statistics of the Central Electricity Authority (CEA).
The generation in August was significantly lower than the target of 77,794.00 MU, the data showed.
Power generation in August 2011 or the corresponding month of previous financial year was 73,101.19 MU against the target of 72,760.64 MU, which implies that year-on-year generation was up slightly.
The country’s power generation during the first five months (April-August) of 2012-13 stood at 382,305.76 MU, up 1.58 percent compared with the target of 376,363.00 MU for the period and up 4.95 percent compared with 364,281.02 MU generated during the corresponding period of 2011-12.
Of the total generation in August 2012, 56,687.72 MU (53,353.32 MU in August 2011) was from thermal sector, 2,579.08 MU (2,719.71 MU) from nuclear sector, 14,036.04 MU (16,004.07 MU) from Hydro sector and Bhutan imports was 1,035.27 MU (1,024.09 MU).
The actual generation was lower than the target of 58,573 MU for thermal sector and 15,818 MU for hydro sector but higher than 2,527 MU target for nuclear and 876 MU for Bhutan import.
In July 2012, 60,533.85 MU was generated by thermal sector, 2,709.35 MU by nuclear sector and 11,868.66 MU by hydro sector. Imports from Bhutan stood lower at 923.88 MU.
India’s August power generation falls m-o-m: CEA
Source: Central Electricity Authority
0
200
400
600
800
1000
1200
1400
1600
1800
2000
Thermal Hydro Nuclear
Target
Achievement
Achievement vs target in capacity addition (in MW)
Source: Central Electricity Authority
76%
4%
19%1%
Thermal
Nuclear
Hydro
Bhutan Import
Categorywise energy generation in August 2012 (in %)


34 Coal Insights, September 2012
fEATuRE
The data further shows that out of the 31 plants facing ‘critical coal stock’ position, 19 were facing ‘super critical’ coal stock position of less than four days.
On August 15, out of the 31 plants (out of 89 plants) facing critical coal stock position of less than seven days, 20 were facing ‘super critical’ coal stock position of less than four days. Plants in Uttar Pradesh, Bihar, Andhra
Pradesh and West Bengal were the worst sufferers.
Plant load factor
The Plant Load Factor (PLF), a measure of the output of a power plant compared to the maximum output it could produce, for the country for the month of August 2012 stood at 61.47 percent against the planned 65.33 percent. The PLF was 66.84 percent, 72.05 percent and 73.89 percent for July 2012, June 2012 and May 2012, respectively.
The PLF of power plants of central sector run companies such as NTPC and DVC in August 2012 stood at 69.65 percent whereas the figure achieved in July 2012 was at 78.26 percent. In August 2012, the plants in the private sector recorded a PLF of 56.82 percent against the planned 60.03 percent.
The worst performers were Muzaffarpur TPS and Koderma TPS both of which recorded nil PLF against a target of 16.5 percent and 39.78 percent, respectively. Farakka STPS which recorded a PLF of 46.33 percent against a target of 72.45 percent continued to be a poor performer.
Power supply position
In the month of August 2012, the country’s peak power demand was estimated at 82,690 MU, but actual availability was only 75,077 MU, reflecting a shortfall of 7,613 MU or 9.2 percent.
Earlier, in the month of July 2012, the country’s peak power demand was estimated
at 85,504 MU, but actual availability was only 77,731 MU, representing a shortfall of 7,773 MU or 9.1 percent.
An interesting observation is that despite overall peak shortage of power in the country in August 2012, Chandigarh, Lakshadweep and Sikkim did not have any peak power shortage, according to CEA data. Andhra Pradesh faced the highest shortfall among all states during peak period with a total shortfall of 1,723 MU.
Uttar Pradesh recorded the second highest shortfall during the month under review. The state recorded total shortfall of 1,392 MU in August 2012, against 1,377 MU in July 2012. Tamil Nadu was a poor performer recording a shortfall of 1,078 MU against 710 MU in July 2012. Maharashtra recorded a shortfall of 361 MU against 439 MU during July 2012 whereas Bihar faced a shortfall of 161 MU which also stood at the same figure in July.
DPSC welcomes FDI in power exchanges
DPSC Ltd, a power utility and a promoter entity in the National Power Exchange Limited, has
welcomed the government’s decision permitting foreign investment in power exchanges in the country.
“The government’s decision to permit foreign investment up to 49% in power exchanges is a welcome move for the sector. The decision opens the opportunity for many foreign players to be part of India’s growth story. India has a huge opportunity in the infrastructure sector that includes power,” Anup Bhargava, managing director of DPSC, said in a statement. He said the foreign partnerships would bring in efficiency and technological enhancement for the exchanges.
Further, “the partnership would also be helpful in getting financial support from foreign partner. For foreign investors too, the move opens opportunities to become a partner in India’s emerging growth story in the power sector,” he added.Capacity addition (in MW)
Months 2012-13 2011-12
April 1,760 735
May 1,070# 550
June 2,376 2,224
July 950 1,660
August 550 1,200
September 786.5
October 345
November 2,807
December 1,158
January 895
February 972
March 5,482*
Total (Apr-Aug) 6,706 6,369
Total (Apr-March) 6,766# 18,814.5*
*As reported by CEA, capacity addition in March was 5,482 MW, but the total figure for 2011-12 was increased to 20,501.70 MW instead of 18,814.50 MW following revision in March 2012 figures. # CEA had earlier reported that capacity addition in May (2012-13) was 1,070 MW, but it appears that the figures have been revised to 1,130 MW.
Source: Central Electricity Authority
0
10
20
30
40
50
60
70
80
Central State Sector Pvt. Utl.Sector
All India
Program
Achivement
All India PLF factor in August 2012 (in % )


36 Coal Insights, September 2012
fEATuRE
Coal Insights Bureau
The pure-play sponge iron makers are facing extinction. According to an estimate, about 20 percent of the
sponge iron units in the country have shut down operations in the last one year, almost all of them being standalone plants. A good number of them have already been sold. For the remaining units, industry sources say, they may not be able to open shop ever again.
Over the last few years, the number of major operating sponge iron or direct reduced iron (DRI) plants has nearly halved from 150 in 2005 to around 80 in 2012. Periodic closures are nothing new to this industry. In the past too, there were mass closures of smaller units during severe power outages or crackdown by pollution control boards or slackness in steel demand.
But this time round, the sources feel, their basic viability is in peril. Even larger units which run on standalone basis are facing survival woes, and may not survive unless they go for forward or backward integration.
“In the current scenario, standalone sponge iron units are no more viable. The market dynamics will not let these plants
survive the current downturn. In fact, almost all such units have been sold,” said an industry expert.
A short haul
Although the first DRI plant in India was set up in 1979, the sector saw some real action only in the recent past. The emergence of this industry was primarily driven by the shortage of coking coal in the country and relative abundance of non-coking coal and iron ore. Also the scarce supply of scrap for steelmaking played a catalyst.
It was not until the late 1990s that production really picked up. According to a Joint Plant Committee (JPC) survey, the number of operational units in 2000-01 was 23 with total production capacity of 6.97 million tons (mt). This number witnessed a prolific growth in the following years. As of 2005, the total number of working DRI plants was 150 and the capacity around 17 mt. Besides, 58 more coal based units were reported as under-commissioning greenfield projects with total capacity of 6 mt. Moreover, another 7 mt of capacity was in the process of being added through brownfield expansion.
A salient feature of this expansion drive
Time to wind up standalone DRI plants?
was that almost all the new plants were set up as coal-fired units. Of the 150 operating plants in 2005, only three large plants were put up as gas-based units by Essar Steel, Vikram Ispat and Ispat Industries. This was against the global trend and was mainly driven by easy availability of cheap coal.
The factors that led to the growth of the DRI plants were steady growth in domestic steel demand, a robust increase in domestic steel production led by the secondary steelmaking sector, low investment requirement for DRI, availability of mineral resources and lower availability of scrap, among others.
However, within a short period, the scenario changed altogether. Growth in coal production came to a halt as Coal India Ltd (CIL) faced serious hurdles in obtaining statutory clearances from the environment ministry. Iron ore mining was banned by the Supreme Court in Karnataka due to rampant illegal mining. The increasing demand-supply gap led to a rise in raw material prices. Additionally, the scarcity in power supply and strict pollution norms led to the temporary shutdown of a large number of units.
Finally, the sagging demand for steel in the domestic market put price pressure on sponge iron, making small plants unviable altogether. Interestingly, the same factors that helped the sponge iron industry to thrive over the last decade proved their undoing.
Poor economics
Commenting on the viability of the standalone units, industry sources said the market condition for sponge iron is currently in a bad shape. “The DRI plants mainly cater to induction furnaces which in turn produce ingots. From ingot, TMT and structural are made, which are long products used in the construction sector. Since the construction industry is down, demand for TMT and structurals is also subdued.”
Elaborating on the question of viability, the sources said the current cost structure facing the standalone units makes it clear that these projects are facing worst margin pressure.
A rough calculation shows that to produce 1 ton of sponge iron, 1.6 tons of iron ore is required. Currently, the price of iron ore is hovering around `8,000 per ton. Accordingly, the cost of ore (including

Coal Insights, September 2012 37
fEATuRE
freight) comes to around `15,000 per ton. The cost of coal accounts for another `5,000 per ton of DRI. Adding working capital and other miscellaneous cost components, the
total cost of production is arrived at around `21,000-22,000 per ton.
In addition, the sponge iron industry is faced with ongoing problems of high power prices in Maharashtra and power cuts in Andhra Pradesh and Tamil Nadu. Sources said demand has been weak on power issues and most sponge iron plants have reduced production. This further adds to the production costs.
Against this, the current price of sponge iron (ex-works) is around `22,000 per ton, which leaves hardly any margin for the plants to recover the fixed costs or loans taken for the plant. Unless the raw material prices dip, which is quite unlikely, or the sponge iron prices rise, the viability of these plants would remain doubtful, a market expert informed.
“Only if ore price reduces or sponge iron price increases, they can become viable. But now steel demand is low and therefore sponge iron price is low. In September-October, steel demand increases. Sponge iron price may go up to `25,000-26,000 per ton. But when demand increases, ore price will also increase. So on the whole, standalone units will not be viable,” he added.
United they stand
The problem, the sources said, is not so much for units that are either forwardly or backwardly integrated.
Since sponge iron finds its end use in TMT or structural, plants that have forward integration can survive the current onslaught. This is so because the steel mills, though facing low demand, are still earning margins.
Similarly, companies that are backwardly integrated (having own captive mines) also have some breathing space.
“These companies will survive because of the captive mines. Their mining cost is minimal, if compared with the market price of the minerals. For instance, the mining cost for ore is around `1,000 per ton, compared to the market price of `8,000 per ton. This cost advantage will help them survive tough patches.”
Some of the larger firms are now striving to adopt advanced technologies to reduce costs further and also to deal with pollution problems. In the face of severe coal scarcity in the country, some steelmakers are also trying to substitute coal by underground coal gasification (UCG) for their DRI units.
DRI exports up inApril-July period
Even though the domestic market is facing severe survival woes, sponge iron exports from India
rose sharply during the April-July 2012 period, latest provisional steel ministry data showed.
DRI exports during April-July 2012 stood at 22,590 tons, compared to 880 tons in the same period last year, the data showed. Bar and rod exports from India rose 87 percent year-on-year, while structural exports rose 78 percent year-on-year during the April-July period. GP/GC sheet/coil exports rose 22 percent year-on-year, while ferro alloy exports were up 23 percent year-on-year.

38 Coal Insights, September 2012
Sanjukta Ganguly
At a time when coal scarcity has hit expansion plans in almost all consuming sectors, the Indian
paper industry has remained by and large untouched by the supply shortage.
The paper industry accounts for about 1.6 percent of the world’s production of paper and paperboard has an estimated turnover of `25,000 crore ($5.95 billion). Its contribution to the exchequer is around `2,918 crore ($0.69 billion). Despite having such encouraging figures to look up to, the industry as a whole is faced with a number of challenges which have started putting pressure on the margins. Among these challenges, the strongest is perhaps the ever escalating fuel costs. Against this background, it is surprising enough to find that fuel supply to the sector has been quite adequate, according to some sources.
In fact, India’s paper sector has received 4-6 percent higher coal supplies than the Fuel Supply Agreement (FSA) quantities from Coal India Ltd (CIL) during the past three financial years, a coal ministry official said recently.
Under the provisions of New Coal Distribution Policy of October 2007, coal is supplied to the paper sector as per the terms of bilateral FSA at 75 percent of normative quantity.
A total of 45 paper manufacturing plants have signed FSAs with subsidiary companies of CIL for their coal supply and actual supplies were 79 percent, 86 percent and 81 percent of the annual contract quantity (ACQ) in 2009-10, 2010-11 and 2011-12 respectively, the official said.
The official, however, could not provide the details of plant-wise ACQ vis-à-vis coal supplies during the last three years.
Coal supply
The government has recently withdrawn the
Coal crisis spares paper industry
core sector status of the industry, thereby affecting the industry’s prospects in the face of increasing energy prices. For leading companies such as Tamil Nadu Newsprint Limited (TNPL) and JK Paper, the impact of rising energy costs is substantial.
Also, the supply situation with Coal India Limited is a major concern area at present. Although the Indian paper industry’s receipt of coal has been more than the FSA quantity, it is not sufficient when
pitted against the actual requirement of the sector. Since paper companies require power to run their factories, increasing coal costs and/or power cost further add to the woes of the industry.
According to a source at TNPL, “Paper manufacturers usually enter into coal linkages with CIL to meet their requirement for coal.
However, due to the unavailability of coal domestically they have to import higher
fEATuRE

Coal Insights, September 2012 39
priced coal from overseas or buy it from open market at higher prices. This adversely impacts the paper companies’ earnings to a great extent.”
Growth prospects
According to K.S. Kasi Viswanathan, chairman of PaperTech 2012 and deputy managing director of Seshasayee Paper and Boards Limited, the outlook for the paper industry looks positive, and is expected to double and reach 20 million tons (mt) over the next eight years, media reports said.
“However, as of now, the concern has shifted to becoming more-environmentally viable and sustainable. Adopting clean technology and practicing energy conservation measures is the acute need of the hour to save the environment and to make the Indian industry world-class and globally-competitive,” said R. Karikal Valaven, commissioner of industries, Andhra Pradesh Government, recently.
The Bureau of Energy Efficiency (BEE) has identified the pulp and paper industry as one of the sectors to reduce energy
consumption by 3-8 percent by March 2015 under the PAT (perform, achieve, trade) scheme.
“Pulp and paper industry is very complex, and there are more than 100 different
product varieties unlike the cement industry. Under the PAT scheme, 31 units have been identified to reduce between 3-8 percent of their current energy consumption,” Valaven added.
fEATuRE
Paper rolling out of a mill

40 Coal Insights, September 2012
Coal Insights Bureau
Even as the government continues to be in denial mode, the coal ministry (MoC) has swung into action to pull
up ‘errant’ captive coal block allocattees who had allegedly brought the government a bad name from the federal auditor, Comptroller & Auditor General of India (CAG). In a recent development, the ministry has decided to de-allocate at least 10 captive coal blocks that failed to keep up to the ministry’s expectations.
The recommendations for de-allocation and deduction of Bank Guarantee (BG) of block allocattees came from the Inter-Ministerial Group (IMG) on coal which is entrusted with the job of inspecting the progress at these blocks. All of these recommendations are likely to be accepted by the government as coal minister Sriprakash Jaiswal has already said that his ministry will accept all the recommendations of the IMG.
The IMG recommendations have come in three separate lots, the last of which was received on September 19, according to an official communiqué from the ministry.
On September 19, the IMG
recommended de-allocation of three captive coal blocks and deduction of BG of four blocks for their inability in developing the blocks as per schedule. With this, the IMG recommended de-allocation of a total of 10 blocks, of which seven have already been approved by the government, and deduction of BG of 11 blocks, of which three have been accepted.
Earlier, the CAG report had listed 57 captive coal blocks which allegedly brought hefty potential gains to the allocattees due to free allocation (instead of auction) by the government. The total loss to exchequer was estimated at around `186,000 crore.
Face the facts
The IMG on September 19 recommended de-allocation of North Dhadhu, Choritand Tailaya and Gondkhari blocks and deduction of BG in respect of Moitra, Dumri, Durgapur-II/Sariya and Seregraha blocks.
On September 17, the government had approved de-allocation of Gourangdih ABC, Rawanwara North and New Patrapara coal blocks while deduction of BG was recommended in the cases of Nerad Malegaon, Lohari, Radhikapur East and Bijahan blocks.
On September 13, IMG had recommended de-allocation of Bramhadih, Chinora and Warora (Southern Part) and Lalgarh (North) block and deduction of BG in case of Marki Mangli-II, III and IV blocks.
North Dhadhu block, which was recommended for de-allocation on September 19, was allotted jointly to Kolkata-based Electrosteel Castings Limited, Pawanjay Steel & Power Ltd and Jharkhand Ispat Pvt Ltd. Choritand Tailaya was allotted to Rungta Mines Ltd whereas Gondkhari block was allotted jointly to Kesoram Industries Ltd, Maharashtra Seamless Ltd and Dhariwal Infrastructure Pvt Ltd.
GOvERnmEnT
The CAG effect
MoC axes allocation of 10 captive coal blocks
According to information available with Coal Insights, only `29 crore was spent on Gondkhari block post the allotment in November 2008. The block has estimated reserve of 98.7 million tons of coal and the allocatees had paid a BG of `11.871 crore.
The progress on the development of the block was delayed due to lack of forest and environmental clearances.
Electrosteel Castings Ltd and others had spent a total of `19.72 crore on development of North Dhadu block, including `6.3 crore on land acquisition. The block has estimated reserve of 923.945 million tons and a BG of `56.03 crore was provided by them.
North Dhadhu block had fallen into “No Go” area initially, which was subsequently modified in October 2011. Mining lease proposal for obtaining prior approval under section 5(1) of MMDR Act is lying with the Director (Mines) of Government of Jharkhand for last almost two years.
Purchase of land and compensatory afforestation land against North Dhadu block was delayed due to the order of Jharkhand High Court wherein it was stated that purchase of land belonging to schedule cast, schedule tribe and other backward class people without the approval of the state government would not be allowed.
Choritan Tailaya block was allotted to Rungta Mines in May 2008 and the company had till June 2012 spent `7.62 crore on the project, excluding a BG of `15.38 crore. The block has estimated reserve of 97 million tons.
Captive blocks that face punitive action
Timeline De-allocation Deduction of BG
September 19
(Recommended) North Dhadhu, Choritand Tailaya and Gondkhari
Moitra, Dumri, Durgapur-II/Sariya and Seregraha
September 17
Gourangdih ABC, Rawanwara North and New Patrapara
Nerad Malegaon, Lohari, Radhikapur East and Bijahan
September 13
Bramhadih, Chinora and Warora (Southern Part) and Lalgarh (North)
Marki Mangli-II, III and IV

Coal Insights, September 2012 41
GOvERnmEnT
Huge delay in the grant of forest clearance for Choritan block in West Bokaro area of Jharkhand and Mining Lease was attributed as main reason for delay in development of the block.
Of the blocks for which deduction of BG was recommended on September 19, Moitra coking block was allotted to Jayaswal Neco Industries Ltd in May 2005. It has estimated reserve of 215.78 million tons.
Jayaswal Neco Industries Ltd has already invested around `119 crore on developing Moitra block and had provided a BG of `12.5 crore. The development was affected due to delay in granting proposal approvals by Jharkhand government and the Ministry of Environment and Forest (MoEF).
Dumri block was allotted jointly to Nilachal Iron and Steel Ltd and Bajrang Ispat Pvt Ltd. A total of `22.50 crore has already been invested on development of the block while another `6.5 crore has been provided as BG.
The allocatees – Bajrang Ispat and Nilachal Iron – according to information available with Coal Insights, had assured in June 2012 that they will start mining by December 2012 as they have already acquired
around 200 hectares of land out of the total land requirement of 280 hectares.
DB Power Ltd has so far invested around `11.50 crore on development of Durgapur-II/Sariya block, which has an estimated reserve of 91.6 million tons besides providing a BG of `17.6 crore.
The development of the block was delayed allegedly due to delay in getting EMP clearance even as land acquisition has been completed to great extent, a source said.
Saregraha block was allotted jointed to Arcelor Mittal India Ltd and GVK Power (Govindwal Sahib) Ltd in January 2008. The block has estimated reserve of 150 million tons. The two companies have so far spent `7.50 crore on development of the block besides providing a BG of `32.4 crore.
The legal angle
The recent decisions taken by the government to de-allocate captive coal blocks on alleged delay in development of the blocks might by challenged in appropriate courts, industry sources told Coal Insights.
As mentioned above, the government has already de-allocated 7 captive coal blocks and will de-allocate three more blocks soon
and has decided to deduct BG provided by owners of eight other blocks.
“The decision of the government might be legally challenged as it has been found that in majority of the cases de-allocation was done on the ground of delay in development of the blocks. These delays, in some cases, were largely on account of delays in getting appropriate clearances from the respective state government and central government offices and not because of the deliberate delays by the allocattees of the blocks,” an industry official said.
“The development of some of the blocks was also delayed because these were classified under “No Go Area” identified by the Ministry of Environment and Forest (MoEF) and in such cases, the holder of the blocks cannot be blamed,” the official said.
However, a section of the industry feels that the aggrieved parties may not immediately move the court challenging government’s order, but might wait for some time till the recent political uncertainty in the country is settled.
For latest update on captive blocks see Annexure on Pg 58
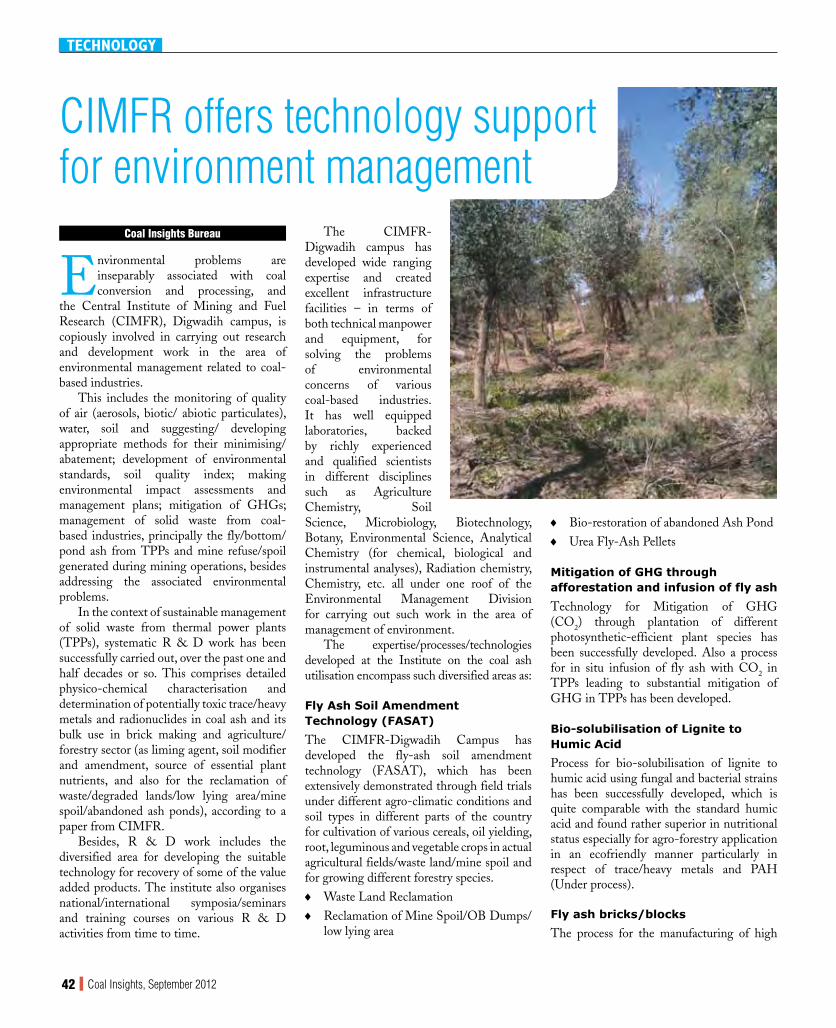
42 Coal Insights, September 2012
Coal Insights Bureau
Environmental problems are inseparably associated with coal conversion and processing, and
the Central Institute of Mining and Fuel Research (CIMFR), Digwadih campus, is copiously involved in carrying out research and development work in the area of environmental management related to coal-based industries.
This includes the monitoring of quality of air (aerosols, biotic/ abiotic particulates), water, soil and suggesting/ developing appropriate methods for their minimising/ abatement; development of environmental standards, soil quality index; making environmental impact assessments and management plans; mitigation of GHGs; management of solid waste from coal-based industries, principally the fly/bottom/pond ash from TPPs and mine refuse/spoil generated during mining operations, besides addressing the associated environmental problems.
In the context of sustainable management of solid waste from thermal power plants (TPPs), systematic R & D work has been successfully carried out, over the past one and half decades or so. This comprises detailed physico-chemical characterisation and determination of potentially toxic trace/heavy metals and radionuclides in coal ash and its bulk use in brick making and agriculture/forestry sector (as liming agent, soil modifier and amendment, source of essential plant nutrients, and also for the reclamation of waste/degraded lands/low lying area/mine spoil/abandoned ash ponds), according to a paper from CIMFR.
Besides, R & D work includes the diversified area for developing the suitable technology for recovery of some of the value added products. The institute also organises national/international symposia/seminars and training courses on various R & D activities from time to time.
The CIMFR-Digwadih campus has developed wide ranging expertise and created excellent infrastructure facilities – in terms of both technical manpower and equipment, for solving the problems of environmental concerns of various coal-based industries. It has well equipped laboratories, backed by richly experienced and qualified scientists in different disciplines such as Agriculture Chemistry, Soil Science, Microbiology, Biotechnology, Botany, Environmental Science, Analytical Chemistry (for chemical, biological and instrumental analyses), Radiation chemistry, Chemistry, etc. all under one roof of the Environmental Management Division for carrying out such work in the area of management of environment.
The expertise/processes/technologies developed at the Institute on the coal ash utilisation encompass such diversified areas as:
Fly Ash Soil Amendment Technology (FASAT)
The CIMFR-Digwadih Campus has developed the fly-ash soil amendment technology (FASAT), which has been extensively demonstrated through field trials under different agro-climatic conditions and soil types in different parts of the country for cultivation of various cereals, oil yielding, root, leguminous and vegetable crops in actual agricultural fields/waste land/mine spoil and for growing different forestry species.
♦ Waste Land Reclamation ♦ Reclamation of Mine Spoil/OB Dumps/
low lying area
TEChnOLOGy
CIMFR offers technology support for environment management
♦ Bio-restoration of abandoned Ash Pond ♦ Urea Fly-Ash Pellets
Mitigation of GHG through afforestation and infusion of fly ash
Technology for Mitigation of GHG (CO2) through plantation of different photosynthetic-efficient plant species has been successfully developed. Also a process for in situ infusion of fly ash with CO2 in TPPs leading to substantial mitigation of GHG in TPPs has been developed.
Bio-solubilisation of Lignite to Humic Acid
Process for bio-solubilisation of lignite to humic acid using fungal and bacterial strains has been successfully developed, which is quite comparable with the standard humic acid and found rather superior in nutritional status especially for agro-forestry application in an ecofriendly manner particularly in respect of trace/heavy metals and PAH (Under process).
Fly ash bricks/blocks
The process for the manufacturing of high

Coal Insights, September 2012 43
strength fly ash bricks using a high percentage of fly ash along with other ingredients like lime, sand, etc. by steam curing process has already been patented and commercialised at Jaggadhatri Brick Works, Barrackpore, Pulver ash Projects, W.B. (IP No. 128684, 1970)
Value added products from fly ash
The process for the extraction of different value added materials including hard scouring powder on a commercial scale has been developed. (US Patent No.10/107, 613 US dt.28.03.2002; PCT Patent No.PCT/IB02/011 : WO 26-03-2002)
Other activities
Other activities include:• Assessment of Aerosols/Abiotic and
Biotic particulates, their periodical variations in and around coal fields and other coal-based industries; correlation between such particulates and prevailing seasonality; find out associated allergenic disorders; preparation of pollen and fungal spore calendar.
• Insects as Biosensor, Identification of insects and evaluation of their risk to human and ecological health with reference to coal mining and processing industry; suggesting of remediation, developing an index of biological integrity.
• Rapid and Comprehensive Environmental Impact Assessment studies have been made at the industrial sites of TALOJA & TARAPUR of MIDC, Mumbai for selection of integrated hazardous waste management sites.
Specialised services ♦ Leaching characteristics of solid wastes ♦ Consultancy Services for Safe Disposal
and Gainful Utilisation of Coal Ash ♦ Monitoring of different pollutants of air
(aerosols, abiotic and biotic particulates) and water, preparation of pollutant calendars and suggesting the abatement strategies
♦ Environmental Impact Assessment and management Projects
♦ Soil Quality and Human Health ♦ Development of Nano-pesticides ♦ Soil-C sequestration through Bio-Char ♦ Testing Facilities
CFRI has been conducting various programmes, i.e. organising of seminars,
refresher courses, training and extension programme for popularisation of bulk use of fly ash through demonstration trials in the fields of farmer of the local villages in the vicinity of different TPPs, apart from organisation of Kisan gosthis and Kisan mela from time to time.
Improving waste land
CFRI has developed fly-ash soil amendment technology (FASAT), which has been extensively demonstrated through field trials under different agro-climatic conditions and soil types in different parts of the country for cultivation of various cereals, oil yielding, root, leguminous and vegetable crops in actual agricultural fields/waste land and/mine spoil and for growing different plant species and established the following advantages:• Improvement in physico-chemical
properties of the soils• Substantial increase in crop yield (20-
60%)• Early maturity of crops• Higher nutritional value of the crops• Less pest incidence• No carry over of the trace/heavy metals/
radioactivity beyond permissible limits and without any other adverse effect
• Encouraging growth performance of various plant species including the timber, oil yielding, fruit bearing and ornamental and medicinal plants.
This technology covers the following areas:
Waste land reclamation
Waste/degraded land/low lying areas near in the vicinity of different TPPs viz. Farakka STPP, Bhusawal TPS, Chandrapur STPP, Harduaganj/ Obra/ Anpara TPPs of UPRVUNL, NLC and in Jharkhand have been reclaimed and made suitable for crop farming /social forestry through bulk use of fly-ash. Fly-Ash has been established to act as excellent soil conditioner/ modifier.
Reclamation of mine spoil/OB dumps
Mine spoil/refuge in the vicinity of different mines such as BCCL, NLC, MCL have been successfully reclaimed using the FASAT and other amendments depending on the fertility of the mine spoil/refuge and various crops and plant species including timber, oil yielding, fruit bearing and ornamental, and medicinal plants have been grown with encouraging growth performance and established the suitability of the technology for crop farming/social forestry through bulk use of fly-ash.
Bio-restoration of abandoned Ash Pond/low lying area
Technology for restoration of biological system in abandoned ash pond and make it productive and suitable for agro-forestry purpose via biotechnological methods in eco-friendly manner has been successfully developed.
The approximate cost of the FASAT package is `25,000 per acre, including transportation of pond-ash up to 25 km @ 50 t/ha.
TEChnOLOGy
Paddy cultivation in mine spoil at NLC Neyveli (TN)
20002001
2002
Bio-restoration of over burden dump

44 Coal Insights, September 2012
Bio-coal: The new fuel on the block
wastes used for briquetting include rice husk, sugarcane bagasse, groundnut shell, mustard stalks, cotton stalks, saw dust, caster seed shells/stalk, wood chips, bamboo dust, tobacco waste, tea waste, paddy straw, wheat straw, sunflower stalk, palm husk, soya-bean husk, veneer residues, barks & straws, forestry waste, seeds cases etc.
Bio-coal made from bagasse and saw dust is a viable energy option suitable for widespread application. It requires an efficient, economical, and convenient energy transformation pathway to meet consumers’ energy needs. The appliances like boilers and furnaces are capable of burning moderately high ash briquetted agricultural fuels at better efficiency.
Although still not widespread in its use in India, bio-coal briquettes find application in a number of industries. According to industry sources, bio-coal can be used as a fuel source in textiles, power plants, ceramic tiles, chemical plants, paper mills, pharmaceutical manufacturing units, and food and liquor industries, among others.
As already mentioned, briquettes of bio-coal directly substitutes coal, lignite or any other fuel, and can be utilised on a large scale without significant air pollution.
Benefits
There are a number of benefits which bio-coal offers as an alternative source of energy.Firstly, bio-coal is cheaper than coal. The average price of bio-coal is significantly lower than that of equivalent grade of thermal coal.
Coal Insights Bureau
Bio-coal (or white coal) is a solid eco-friendly fuel manufactured by compressing biomass (agricultural
waste). It is mainly processed by using groundnut shell waste, mustard stalk, saw dust, bagasse and other agricultural wastes which are converted into solid fuel.
Bio-coal is generally manufactured in the form of briquettes of various sizes such as 60, 70 or 90 mm. The briquettes have high specific density (1,200 Kg/m3) and bulk density (800 Kg/m3) compared to 60 to 180 Kg/m3 of loose biomass.
The calorific value of the bio-coal depends on the raw material (biomass) from which it is manufactured. The average heating capacity ranges from 3,700 kCal/kg to 4,500 kCal/kg. Due to its numerous advantages over traditional fuel sources such as coal and wooden logs, bio-coal is fast emerging as an alternative source of fuel and
tasting great success in some parts of the country, especially in western Indian states like Gujarat.
However, this product is yet to get large scale penetration in the Indian market. Given the ongoing crisis faced in coal and frequent price hikes in imported fuels, bio-coal could be one of the next generation fuels for the energy guzzling Indian industry. According to industry sources, this source can play a significant supplementary role to the primary fuel sources in coming years.
Bio-coal briquetting
Bio-coal briquetting is the process of converting agricultural waste into high density and energy concentrated fuel briquettes. Bio-coal briquetting plants can be of various sizes. These briquettes are ready substitutes of coal/wood in industrial boiler and brick kiln for thermal application.
The fuel briquettes are manufactured from numerous sources. The biodegradable
In fOCus
Technical specifications
Calorific Value: 3,700 kCal/kg to 4,500 kCal/kgAsh content: 5-15%Moisture content: less than 10%Briquette Dia: around 90 mmBriquette length: 100 mm to 200 mmChemical details: VM% 60.30, FC% 20.00

Coal Insights, September 2012 45
Secondly, the biomass briquettes are eco-friendly renewable energy in our country. It causes no pollution to the environment; no toxic gas is released. There is no sulphur emission and even no odor. In contrast, the high sulfur content of oil and coal, when burnt, pollutes the environment.
There is no fly ash produced as a by-product. Bio-coal leaves only white ash without any fixed carbon.
The ash content generally ranges from 5 percent to 15 percent as compared to over 20-40 percent in black coal. The moisture content is also low, less than 10 percent.
A major benefit is that bio-coal offers high purity (99 percent). It scores over domestic coal in terms of quality or grade slippage.
It is also easy to burn. Bio-coal has lower ignition temperature compared to coal. There is smokeless burning and sustained combustion and the temperature requirement is achieved due to very efficient combustion. Overall, the full heat value is utilised.
Bio-coal is easy to handle and 1,000 kgs of briquettes per cubic meter can be stored and transported against 50 kgs of agro-waste.
No binder is used in this fuel. The natural polymer lignin acts as a binder and provides
mechanical support and also provides resistance to decay and repels water.
Bio-coal is very well suited to gasify which can run any engine because of the combustion efficiency and solid form. A typical usage of briquettes made out of paper mill sludge mixed with iron sludge power is made in big furnaces to keep the temperature alive for easy start up.
Bio Coal Briquettes have consistent quality, have high burning efficiency, and are ideally sized for complete combustion. It doesn’t have any Ignition Problem.
Combustion is more uniform compared to coal and boiler response to changes in steam requirements is faster due to higher quantity of volatile matter in bio-coal briquettes.
Bio-coal briquettes are usually produced near the consumption centers and supplies do not depend on erratic transport from long distances. Due to low ash content, material handling cost would be an added advantage. Also, high density of bio-coal provides easy handling, preservation and low shortage/wastage during transportation against conventional fuels.
Heavy consumers can avail carbon credit benefits also.
Industry
Although not having widespread use in India, bio-coal has gained acceptance and witnesses growing demand from across the world. This form of fuel is preferred in many advanced countries main because of three major roles:
♦ Creating a safe and hygienic way of disposing waste
♦ Containing pollution
♦ Meeting energy demand
Little wonder then, that bio-coal is gaining popularity in advanced countries which are focusing on renewables and alternative sources of energy to reduce their carbon footprint and release of greenhouse gases.
Post Kyoto Protocol, the need to find alternatives to fossil fuels has raised interest in bio-coal around the world. The use of bio-coal can significantly reduce greenhouse gases and heating costs and sustainably assist the development of rural communities.
In India, most of the manufacturers are concentrated in the western region. The industry is fragmented with small manufacturers operating on a small scale and offering, in many cases, customised products.
In fOCus
Applications
♦ Gasify System ♦ Food Process Industries ♦ Lamination Industries ♦ Chemical Units ♦ Brick Kilns ♦ Leather Industries ♦ Solvent Extraction Plant ♦ Textile Units ♦ Pharmaceutical Manufacturers ♦ Ceramic Industries ♦ Vegetable Plants ♦ Paper mills ♦ Dyeing Plants ♦ Milk Plants ♦ All industries having Gasify system ♦ Steam boilers, furnaces, roasters,
hot air or water generators
A bio-coal briquetting plant

46 Coal Insights, September 2012
MBE CMT India bags order for Pakistan’s first coal washery
$2.5-3 million. MBE CMT will provide the engineering design, critical process equipment and supervisory services for the project.
The work for the TSI washery will commence shortly. The first shipment of equipment from India is expected to be sent out soon. The design and construction work is likely to be completed by end of 2013. Coal supply to the plant would be sourced locally.
Asked about the selection of an Indian entity for the project, Mustafi said the credit goes to MBE CMT group, which has a high brand value globally. Also, the design expertise of the Indian subsidiary was a big advantage.
Global engineering hub
Meanwhile, the MBE CMT Group is mulling to make India its global engineering hub for the design and engineering part of both Coal & Mineral beneficiation and its growing centrifuge business. The MBE CMT group (formerly Coal & Mineral division of Humboldt Wedag) is trying to expand its presence in the Indian market and is also finding it cost effective as a technology centre.
“The group wants to grow in the Indian market and also build it as an engineering hub. This is very cost effective for MBE CMT operations across the globe,” Mustafi informed.
Already a large chunk of global projects in coal and mineral beneficiation as well as centrifuge are being provided engineering support from the country. This includes plant design and project consultancy, among others, he said.
Currently, the Indian subsidiary is providing the entire engineering back-up
Arindam Bandyopadhyay
Amidst speculations over Indo-Pak business relations, an Indian company has quietly broken new
ground as Kolkata-based MBE Coal and Mining Technology (CMT) India Pvt Ltd bagged the order for Pakistan’s first coal washery coming up near Islamabad.
“This is a very positive development. It is not just a new project for us. We see it as a breakthrough in bilateral industrial relations,” said company CEO and director, Gurudas Mustafi.
Pakistan’s first coal washery will be set up by Karachi-based Trade Serve International (Pvt) Ltd, which has chosen the Indian outfit of the MBE CMT group from among a number of international competitors. MBE CMT India is the Indian subsidiary of McNally Bharat Engineering Company Limited, a part of the Williamson Magor Group.
While this will be a pioneering project for
CORpORATE
the Pakistani trading group (TSE), for MBE CMT India, “it will give us a foothold in that country. In future, as the country’s coal sector grows, there will be more number of washery projects coming up. We will be happy to lend our expertise to such ventures.”
Elaborating on the project, Mustafi said the BATAC® Jigging washery will have a capacity of 1 million tons per annum (mtpa) and involve total investments of around
A coal washery set up by MBE CMT in West Bengal

Coal Insights, September 2012 47
CORpORATE
for projects in Brazil, Indonesia, Mongolia, Chile and others to name a few. The design and engineering services, however, are offered as part of the group’s offerings.
MBE CMT India is also carrying out projects in collaboration with their global partners in other countries where MBE CMT group does not have an office. “Across the globe we have built plants for coal and mineral beneficiation, even in countries where we don’t have offices.”
However, Cologne, Germany, continues to remain the group’s technical knowledge centre, backed by a strong R&D unit, he said, “and we are trying to jointly take up projects with CMT Cologne, especially in southeast Asian markets.”
As for plant operations in India, MBE CMT, which was formed after MBE took over the Coal and Mineral technology division of Humboldt Wedag in 2009, had its own factory at Kharagpur. This unit was started in 1984. With the acquisition of the coal and mineral division of Humboldt, MBE CMT India now can also avail the manufacturing facilities another four factories of the holding company located in Kumardubi, Baroda, Asansol and Bangalore.
Centrifuge business
While the mineral beneficiation business (of formerly Humboldt Wedag’s CMT division)
is more than a century old, MBE CMT India is witnessing fast growth in its centrifuge business, Mustafi said.
“We also have a centrifuge division. We received a record number of orders and achieved highest despatch of centrifuge machines last year,” he said.
The company caters to various industries like pharmaceuticals, waste water treatment, refineries, sewage treatment plant, chemical industries and food processing industry. Lately, it is trying to further expand the reach of this market and tap new segments such as grain distilleries, instant tea and textiles.
Geographically, MBE CMT India is trying to expand its reach to southeast Asian markets like Indonesia and Malayasia where centrifuge machines are for extraction of oil by the local palm oil industry.
Interestingly, there is a typical complementary relationship between the beneficiation and centrifuge businesses, Mustafi said. “We have found that when mineral industry is in bad shape, centrifuge does well. Last financial year, we sold more than 125 centrifuge machines in India. This was a record.”
With various environment issues coming up, requirement of this centrifuge machines is increasing by the day. Even in big realty projects, the need for segregating Sludge from
water is leading to increased requirement of this machine, he said.
Growing competition
Meanwhile, the competition in coal and mineral beneficiation is intensifying with global players in the Indian market. In coal beneficiation, Schenck Process of China has started its operations in the country.
Also, Metso Minerals is now also in the India coal Beneficiation market though globally they have a larger presence in the Iron ore. Other major competitors include Allmineral and Bateman of South Africa.
But MBE CMT group is not perturbed. “We are confident of taking on
competition in India or globally,” averred Mustafi, “a long history, superior process technology and customer focus are the mainstay of our business. We hope to maintain our stronghold in the Indian beneficiation industry in years to come.”
A time span of more than 155 years is enough to create and develop a brand, but also a long time to maintain the claim established, Mustafi concluded.
Pak coal sector at a glance ♦ Total coal reserves of around 185.5
billion tons, sixth largest in the world;
♦ Coal belts are spread over Sindh, Punjab and Baluchistan provinces; Largest coal reserves in Sindh, approximately 184.623 billion tons;
♦ Proven reserves are around 600 million tons;
♦ Average annual coal production is 4.5 million tons;
♦ More than 90 percent of production is consumed in the brick and cement industry.
MBE CMT’s environmental centrifuge

48 Coal Insights, September 2012
CORpORATE
JSPL gears up to slash DRI production cost
Sanjukta Ganguly
Jindal Steel & Power Ltd (JSPL), which boasts of having the world's largest coal-based sponge iron manufacturing facility
and is one of the market leaders in coal-based sponge iron making within India, has pulled up its socks to reduce costs involved in production of sponge iron. The company, along with others involved in DRI making, has been facing tough challenges in recent times.
In the current scenario where input costs are escalating exponentially, the company has explored all avenues of keeping cost under check and has also found out multiple opportunities for cost reduction, senior general manager & head of DRI activities at JSPL (Raigarh), Vivek Agarwal, told Coal Insights.
“At a time when the entire industry is reeling under pressure, improving the bottomline of the company by cost reduction has become increasingly important,” he said.
According to Agarwal, JSPL has devised and started to implement a number of measures to reduce the company’s DRI production cost which have already started to reap benefits for the company.
Cost reduction
As a primary measure for cost reduction, JSPL has resorted to using pellets instead of iron ore fines for DRI production and this is being done through proper process optimisation combined with improved quality standards. This, along with use of better improved technology, has in turn helped in reduction of coal consumption by about 10 percent for the company. In addition to this, consumption of refractories has been brought down significantly from about 2 kg per ton to 1 kg per ton for DRI production which has also impacted the cost structure.
JSPL, currently on the path of ‘optimisation of resources’, has decided to use the best maintenance practices which has led to up to 99.5 percent availability. In
order to align the production activities, the company is using laser technology currently which has slashed maintenance cost by 20-22 percent. Value engineering in maintenance practices implemented by JSPL’s employees has also resulted in significant reduction in outsourcing activities. Along with this, many
JSPL arm acquires Canada’s CIC Energy
Jindal BVI, a subsidiary of Jindal Steel and Power Limited (JSPL), has acquired Canada’s coal company
CIC Energy for about $115 million (about `600 crore) by merging Jindal BVI with the foreign company, JSPL said in a statement.
The Minister of Minerals, Energy and Water Resources of Botswana where CIC has its coal mines, has already approved the change of control from CIC to JBVI and all other approvals for the merger have already been granted. The merger certificate will be issued in the next few days, marking the completion of the acquisition, the statement said.
The deal will provide JSPL access to CIC’s high quality thermal coal in Greater Mmamabula coalfield in SE Botswana which is estimated to be in excess of 6 billion tons (approx) (including Measured and Indicated resource of 2.4 billion tons).
“This is another step in the direction of backward integration as the coal assets will give the company self-sufficiency when it comes to dependence on natural resources. This will enable JSPL to become a more self-reliant and fuel secure enterprise,” JSPL’s Director and Group CFO, Sushil Maroo said while speaking on the occasion.
The deal will provide JSPL the opportunity to tap the highly lucrative and power deficient South African Development Community (SADC) countries and given the huge resource, will also provide an opportunity to set up a coal to hydrocarbons project, the statement added.

Coal Insights, September 2012 49
CORpORATE
other such activities which were earlier being outsourced by JSPL to other companies, are now being executed by JSPL’s own employees.
Inventory control techniques have also played an important role in significantly reducing the wastage of resources, and have helped to bring down the inventory control cost from about `11 crore to about `7 crore, Agarwal said.
Minimisation of breakdown time has been possible by introduction of value engineering as well as accretion generation from DRI has been reduced simultaneously.
“Along with curtailing cost, we have also initiated waste utilisation which includes selling of char and castables from kiln which are being sold at `1,600 per ton. However, with the use of the right technology, dust
generation has been reduced,” Agarwal said. According to company sources, these
measures have helped the company to save `500 per ton (approx.) leading to a total saving of about `66 crore annually, excluding the cost of coal and iron ore. However, keeping cost under control, how much the company can pull up their revenue figures during the current fiscal is to be watched.
As many as 236 proposals of Coal India Ltd (CIL), which are expected to contribute around
231 million tons per annum (mtpa) of coal during the 12th Plan, are awaiting forestry and environmental clearances, CIL chairman S. Narsing Rao has said.
Of the total, 179 proposals are awaiting forestry clearances and 57 are awaiting environmental clearances, Rao said.
Of the total 179 proposals awaiting forestry clearances, 130 proposals involving a total area of 15,656 hectares are awaiting Stage-I clearance and 49 proposals involving 13,115 hectares are awaiting Stage–II clearances, he said.
Further, of the 179 proposals, 45 are awaiting approvals at MoEF level (26 Stage-I proposals and 19 Stage-II proposals).
The 26 forestry proposals awaiting clearances at MoEF Stage–I are expected to contribute around 25 million tons (mt) and 19 proposals awaiting clearances at MoEF Stage-II level are expected to contribute around 69 mt during the terminal year of 12th Plan (2016-17).
Regarding the 57 proposals awaiting environmental clearance at different levels, Rao said these have potential for an incremental capacity of 137 mtpa.
“Out of these 57 proposals, 8 proposals with an incremental capacity of 14.44 mt are awaiting TOR approval, 3 proposals with an incremental capacity of 21.86 mt are awaiting dates for EAC meeting and 29 proposals, with an incremental capacity of
77.26 mt are awaiting final clearances. Out of the total 57 proposals, 15 require forestry clearance at Stage – 1 level,” he added.
Commenting on the growth profile of the company, Rao said a total of 72 projects with an estimated capacity of 257.26 mt have been identified to be taken up during the 12th Plan period.
In addition to these projects, 59 projects identified in 11th Plan with an ultimate estimated capacity of 156.29 mt and two projects of 10th Plan would also be taken up during 12th Plan, he said.
“With this it can be said that a total of 133 projects with an estimated capacity of 420.85 mt are being planned to be taken up during 12th Plan of which 88 projects will contribute about 86 mt during the terminal year i.e. 2016-17,” Rao said.
He said that there are 147 on-going projects in different stages of implementation with an ultimate capacity of 437.08 mtpa.
“In 2011-12, 85 of the on-going projects contributed 211.39 mt and 100 projects are planned to contribute 228.67 mt during the current financial year (2012-13). In addition, 136 ongoing projects have been planned to contribute 333.83 mt during the terminal year of Twelfth Plan i.e 2016-17,” Rao said.
He said of the 147 ongoing proejcts, 80 have acquired forestry and environmental clearances, whereas environmental and forestry clearances are awaited for 13 and 34 proejcts respectively. For 20 projects, both forestry and environmental clearances are awaited, he added.
CIL’s 236 projects await forestry, environmental clearances

50 Coal Insights, September 2012
CORpORATE
Coal Insights Bureau
India’s largest EOT crane manufacturing company Anupam Industries Ltd has been awarded an order worth more than
`130 crore by SAIL’s Rourkela Steel Plant (RSP) to supply 22 cranes and hoists of various capacities. These cranes will be used for various applications at RSP’s plate mill modernisation plant based at Rourkela in Odisha.
As per a communication from the company, the scope of work would involve
design, engineering, supply, installation, commissioning and training. The project is scheduled for completion in June 2014.
RSP presently has the capacity to produce 2 million tons (mt) of hot metal, 1.9 mt of crude steel and 1.67 mt of saleable steel. It is SAIL’s only plant that produces silicon steels for the power sector, high quality pipes for the oil and gas sector and tinplates for the packaging industry. Its wide and sophisticated product range includes various flat, tubular and coated products.
Anupam wins `130-cr order from SAIL
The cranes will be supplied in various capacities ranging from 15 tons to 175 tons capacity with different applications for RSP’s slab yard, slab charging bay, furnace entry, mill aisle, roll shop, heavy plate area, motor bay, finished plate despatch bay and cross bay.
These cranes are customised to carry out specialised operations at the steel plant. One of the cranes supplied for the slab yard is the 75 ton duplex motorised scissor type tong with maximum grip, 360 degree swivelling facility and adjustable stools for lifting the slabs. The 175+175t EOT crane has lifting beam with motorised central hook of 200 ton capacity at the beam centre.
Anupam will also design and manufacture special 60 ton magnet cranes with telescopic spreader beam for handing of steel plates. These cranes are packed with high end features such as anti-collision device, travel restriction and load control, DSL system, twin motor drive via planetary gear box for main hoist motion, emergency brake, and rope oil lubrication system.
Anupam has been supplying customised cranes to SAIL for the past few years and this large order reinforces SAIL’s trust in Anupam as the best lifting solutions provider to the integrated steel industry, managing director of Anupam Industries. Mehul Patel, said.
With this order, Anupam will continue its endeavour to supply high quality customised cranes at competitive price to the steel sector globally.
Anupam has a formidable presence in the Indian steel industry for supplying ladle/forging/ charging cranes and steel mill duty cranes. Anupam cranes handle more than 21 mt of liquid/hot metal and finished products annually at various steel plants in India and abroad.
Anupam’s cranes and components are specially customised and designed to meet the challenging requirements of critical applications at integrated steel plants. The company provides international standard cranes for various applications to meet the requirements of core sectors in India and abroad in the sectors of steel, power, heavy & general engineering, construction, ports, cement, shipyard, fertilisers and petrochemicals, the communication said. It added that within a span of 40 years, it has supplied and commissioned more than 5,000 cranes up to 500 ton capacity.

Coal Insights, September 2012 51
sOCIAL buzz
Steel Insights Bureau
As the government continues to defend its positions in the alleged coal block allocation scam, the members of
ICMW group on LinkedIn put the blame on the coal ministry, if not for indulging in a “loot”, for mismanagement of the blocks under review. While it was generally agreed that the government didn’t do anything wrong in sticking to a well laid down process of allocation, the fringe benefits given to select block holders called for attention. There could be little to talk in defence of the companies found guilty, but that does not make the entire process faulty, they said. Post scam, the decision to de-allocate blocks and possibly re-allocate them in a hurry would again lead to further complications, the members maintained.
It was also noted that Comptroller & Auditor General (CAG), the federal auditor, is under pressure to prove its “findings” and refute the government’s claims of “zero loss” from the allocation.
Coming to the defence of the government’s procedure of allocation, Jaganath Prasad Panda, Chief Operating Officer at MJSJ Coal Ltd, said, “Most of the coal blocks were not prospected. How could they be auctioned? Prospecting would take 3-5 years in many cases. Neither CMPDIL nor MEC have enough drilling rigs and infrastructure to do prospecting of all. How can auction be done without knowing the coal available in quantity and quality and the depth? How would be the minimum price of bid fixed without knowledge about the geology? If blocks (except those already prospected) were not allocated it would
MoC blamed for messing up coal block allocations
have taken another five years for going for competitive bidding.”
CAG doubts coal reserves
Another topic that caught the attention of members was CAG’s doubts over the authenticity of India’s coal reserves, as estimated by Geological Survey of India (GSI) and CMPDI. In its draft report, CAG hinted that the proven, economic reserves of the country would be less than the quantity estimated. This was due to differences between the measurement techniques followed by GSI and the one followed in some other countries.
Commenting on the issue, Syed Khadry, Sr. General Manager (Mines) at Utkal Coal Limited (IMFA), said, “The estimation of reserves by GSI and CMPDI are correct generally; there are not many cases where the error has crossed 5%.”
Tanay Duttagupta, Sr. Geologist at Geological Survey of India, said, “It would be interesting to know the points CAG considered to doubt GSI’s estimate of coal reserve.”
Blame game over power outage
With the memory of the two-day power outage across north Indian states still fresh in memory, the members of ICMW discussed possible ways to avert such incidents in future. The members scoffed at the blame game that followed the chaos. Incidentally, the head of India’s national grid, facing a backlash for the worst-ever power outage in July, acknowledged transmission infrastructure failures played a role in the crisis.
Along with that, the loss of generation due to shortage of coal grabbed attention of the forum. Indian power utilities reported a generation loss of about 2.9 billion unit (BU) between April and June 2012 owing to coal crisis. Such a situation may recur if the government did not clear the mess and take immediate steps to augment supply, the members averred.
Coal Insights has recently started a group on LinkedIn called India Coal Market Watch (ICMW). The readers are welcome to join the group and participate in daily conversations and surveys conducted by ICMW on the online forum. Coal Insights may, at its discretion, publish the result of such surveys and discussions for the benefit of a larger audience.

52 Coal Insights, September 2012
US coal production to drop 6.1% on consumption decline
electric power industry have increased steadily over the last 10 years and this trend continued in 2011, with an average delivered coal price at $2.40 per MMBtu (a 6 percent increase from 2010).
However, EIA expects the decline in demand for coal, combined with the large coal inventories, will begin to put downward pressure on coal prices and contribute to the shut-in of higher-cost production. This leads to a forecast that the delivered coal price in 2012 will average $2.39 per MMBtu, and remain at that level in 2013.
US electricity consumption & generation
Recent power generation and fuel cost data indicate that over the last few quarters the generation fuel mix has been much more responsive to changes in relative fossil fuel prices than it has been in past years.
The share of total generation fueled by natural gas during the first half of 2012 averaged 30.4 percent compared with 22.3 percent during the same period last year. This increase in fuel share was driven by a cost of natural gas that was very low relative to the cost of coal.
However, in June, the average Henry Hub natural gas spot price surpassed the average spot price for Central Appalachian coal for the first time since October 2011, indicating that the recent trend of substituting coal-fired generation with natural-gas-fired generation may be slowing and is likely to reverse.
In light of the data indicating that power generators have recently been more responsive to changes in relative fuel costs, EIA has revised its projections for the generation fuel mix during 2013.
EIA now expects that the higher natural gas prices next year will lead to a 9.5 percent decline in natural gas-fired generation while coal-fired generation increases by 9.3 percent.
EIA expects the nominal US residential electricity price will rise by 1.0 percent during 2012 to an average of 11.91 cents per kilowatthour.
During 2013, US residential retail electricity prices increase 0.9 percent over the average 2012 price. When measured in real terms, the US residential electricity price declines by an annual average of 0.8 percent in both 2012 and 2013.
Coal Insights bureau
Coal consumption in the electric power sector, which averaged over 1 billion short tons annually from
2003 through 2008, might not reach that threshold for the fourth consecutive year in 2012. According to a forecast made by US Energy Information Administration (EIA), coal consumption in the electric power sector is about to reach 829 million short tons (MMst) in 2012.
Lower electric power sector natural gas prices have led to a significant increase in the share of natural gas-fired generation. EIA projects power sector coal consumption is to grow by 7.8 percent to 894 MMst in 2013 as electricity consumption increases and higher natural gas prices lead to a reduction in natural gas-fired generation.
US coal supply
Coal production will decline by 6.1 percent in 2012 as domestic consumption falls, according to an analysis by EIA. Production for the first seven months of 2012 was 33 MMst (5 percent) below last year’s level for
the same period. EIA expects that production will total 1,028 MMst in 2012, 66 MMst below the 2011 total.
The agency further estimates production to grow by 1.4 percent (14 MMst) in 2013 to meet the increase in consumption. Electric power sector stocks, which ended 2011 at 175 MMst, are forecast to total 192 MMst at the end of the 2012. Inventories are expected to decline slightly in 2013, but they will remain at elevated levels.
Coal trade
According to EIA, US coal exports would remain strong in 2012 and exceed the level of 107 MMst exported in 2011. The US exported 12.7 MMst of coal in June, topping April’s record-setting amount, and it was the third consecutive month with exports exceeding 12 MMst. EIA projects coal exports to total a record 124 MMst in 2012. Coal exports will decline in 2013 but remain above 100 MMst.
The primary reasons for the export decline include China’s slower economic growth and increased exports from major coal-exporting countries, particularly Indonesia
and Australia. US exports could be higher if there are supply disruptions from any of the major coa l - expo r t ing countries. US coal exports averaged 56 MMst in the decade preceding 2011.
US coal prices
Delivered coal prices to the
InTERnATIOnAL
US coal consumption
Source: Short-Term Energy Outlook, September 2012

Coal Insights, September 2012 53
InTERnATIOnAL
Coal Insights Bureau
Amidst speculation that China will soon withdraw the 40 percent export tax on coke that will increase
availability of the material in the world market, questions are being raised on whether this will lead to a further softness in global coke prices.
The prices of coke in the world market is down from a high of around $355 per ton in June to current level of around $325 per ton due to sharp fall in spot coking coal prices and a weak demand from steel makers.
A few players contacted by Coal Insights believe that a clear picture on whether the prices will soften will emerge only after the Chinese price opens. Till then, there is possibility of wide fluctuation in prices as contracted price of coking coal, as per initial report, of $170 per ton for October-December quarter is significantly higher compared with current spot price of around $145 per ton.
“Currently, the basic coke price in China comes to around $230 per ton and if 40 percent export tax is added, the cost should go up to $325 per ton, but coke prices from North China is currently being quoted at around $390 per ton,” an industry source said.
Another source, however, said, “If Chinese material starts arriving, there will be a sharp fall in coke prices globally and it will hamper overall sentiment.”
“My expectation is that met coke prices will not fall as China will not reduce export price despite cut in export duty because overall availability of coke in the world market is not that high,” an official said.
“Today Japan is exporting its rejected coke whereas the quality of Columbian, Russian and Ukrainian coke is very bad. In such a situation, China may not reduce prices, considering the fact their coke quality is comparatively better,” he added.
WTO ruling
Although China has indicated that it might withdraw the export tax on met coke to adhere to World Trade Organisation (WTO) ruling of July 2011, steel industry sources in India feel that some other issues might have forced China to change its earlier decision.
“Earlier they (China) were saying that they will not pollute the environment and had imposed the tax in order to discourage production of coke, which ultimately led to sharp reduction in global supplies of coke and consequent firmness in prices. So why is it that China is now thinking of withdrawing
the tax?” an official of a leading coke maker said.
Recently it had been reported, quoting Director in the Department of Foreign Trade, Ministry of Commerce, Huang Xin, that China’s central government is working on removing all barriers to coke exports by the end of this year.
The decision was believed to be in response to the WTO ruling in July last year that export restrictions, including the 40 percent tax imposed since 2008 and the licence and quota system that has been in place since 1995 were a violation of WTO bylaws.
“The change in Chinese thinking may be due to their intention to stop diversion of Mongolian coking coal to world market as currently only China is buying Mongolian coal. My feeling is that China does not want to allow Mongolian coal to go out,” the Indian official argued.
“Today China is largely taking Indonesian coal and making coke, but going forward the supply of Mongolian coal is likely to increase significantly and unless China increases its coke production capacity, Mongolian miners will have to look at alternative buyers,” he said.
“China does not want Mongolian coal to go out of the region. But it wants to ensure that it increases its consumption of Mongolian coal and one way to do that is by increasing its own coke production as additional output can easily be exported,” the official felt.
However, the export of coke from China will not be feasible if there is 40 percent tax because that makes Chines coke unviable in the world market. “So by withdrawing export tax, China can create a situation wherein its coke will find a market and at the same time it will ensure that it can have control over Mongolian coal,” the official added.
He pointed out that Mongolian coal production is growing gradually, but right now it is largely being consumed by Chinese companies.
“If China is unable to procure the entire material mined in Mongolia, the miners there will have to look at alternate sources and they might start considering exporting their material either though Vladi Vostok port in Russia or the Shanghai port. In a way it is now in the interest of China to withdraw export tax,” the official said.
China’s decision on export tax may soften coke prices

54 Coal Insights, September 2012
Coal Insights Bureau
The 12 major Indian ports have handled 229.01 million tons (mt) of traffic during the first five months
(April-August) of 2012-13, 3.51 percent lower than 237.33 mt recorded during the same period last year.
According to data released by the Indian Ports Association (IPA), the country’s major ports handled a total of 13.04 mt of coking coal in April-August period, up 1.73 percent as compared with 12.82 mt handled in the same period last year.
However, the movement of thermal coal through the major ports was up 2.11 percent
Traffic handled at major ports(During Apr-Aug, 2012* vis-a-vis Apr-Aug, 2011)
(*) Tentative (in '000 tons)
PortsApril to august traffic % Variation against
prev. year traffic2012* 2011
KOLKATA
Kolkata Dock System 4835 5140 -5.93
Haldia Dock Complex 12232 14282 -14.35
TOTAL: KOLKATA 17067 19422 -12.13
PARADIP 21079 24244 -13.05
VISAKHAPATNAM 25766 30539 -15.63
ENNORE 6794 5264 29.07
CHENNAI 22829 24713 -7.62
V.O. CHIDAMBARANAR 11945 11772 1.47
COCHIN 8636 8131 6.21
NEW MANGALORE 14043 13973 0.50
MORMUGAO 11661 14726 -20.81
MUMBAI 24164 21969 9.99
JNPT 27599 26721 3.29
KANDLA 37435 35864 4.38
TOTAL 229018 237338 -3.51
Source: IPA
LOGIsTICs
Traffic handling by major ports down 3.5% in April-Aug
to 21.39 mt during April-August, compared to 20.95 mt achieved in the same period last year.
Movement of iron ore through the major ports showed a significant drop of 38 percent
in April-August due to restrictions imposed on mining and a hike in export duty on iron ore. The major ports together handled 17.03 mt of iron ore in the April-August period compared to 27.46 mt handled in the same period last year.
Mormugao port handled the highest volume of 7.42 mt of iron ore in April-August. This volume, however, was about 20.81 percent lower than the iron ore traffic moved through the port in the same period last year.
Movement of container traffic in terms of tonnage and TEUs showed
an increase in the April-August period. The major ports handled 51.37 mt of tonnage and 3.30 million TEUs in April-August period compared to 49.40 mt of tonnage and 3.23 mt of TEU in the same period last year.
Among the major ports, Paradip port had the distinction of handling the highest volume of thermal coal of around 7.03 mt in April-August period. Visakhapatnam port handled the highest quantity of 2.94 mt of coking coal during the period.
Movement of coking coal through Paradip, Kolkata, Visakhapatnam, Chennai, Cochin and Mormugao ports declined during the period when compared to the corresponding period last year.
Seven major ports showed positive growth in traffic handling during the April-August period of the current fiscal, while the remaining five showed negative growth on a year-on-year basis.
In terms of growth, Ennore port topped the list with a 29.07 percent increase in cargo throughput. New Mangalore port’s growth was lowest at about 0.50 percent during the period. In terms of traffic volume, Kandla port clinched the top rank with a cargo volume of 37.43 mt recorded for the period.
The Mormugao port registered the highest decline of 20.81 percent in traffic handling during the period due to fall in iron ore export.


56 Coal Insights, September 2012
LOGIsTICs
Railways commodity freight revenue down in Aug m-o-m
Coal Insights Bureau
The Indian Railways’ revenue earnings from commodity-wise freight traffic fell month-on-month in August due
to lower transportation of coal and cement.Revenue earnings from commodity-wise
freight traffic during August 2012 stood at `6,328.28 crore, down 2.46 percent compared with `6,487.94 earned in July, according to information available with Coal Insights.
The Railway’s revenue from transportation of coal fell to `2,537.7 crore in August from `2,702.17 crore in July. The Railways transported 36.69 million tons (mt) of coal in August compared with 39.36 mt transported a month ago.
Revenue from transportation of iron
Commodity-wise revenue
CommodityQuantity (in mt) Earning (`cr)
August 2011 August 2012 August 2011 August 2012
Coal
i) for steel plants 3.95 4.24 158.28 223.18
ii) for washeries 0.12 0.1 1.11 0.94
iii) for thermal power houses 22.23 22.99 1455.21 1733.52
iv)for public use 7.9 9.36 421.65 580.06
v) Total 34.2 36.69 2036.25 2537.7
Raw material for steel plants except ore 1.15 1.26 75.83 111.55
Pig iron and finished steel
i) from steel plants 2.4 2.4 269.94 361.33
ii) from other points 0.62 0.55 47.02 36.57
iii) Total 3.02 2.95 316.96 397.9
Iron ore
i) for export 1.49 0.68 373.85 150.77
ii) for steel plants 4.74 5.4 189.59 223.11
iii) for other domestic users 2.71 3.13 176.71 246.96
iv) Total 8.94 9.21 740.15 620.84
Cement 8.53 7.52 492.58 551.57
Foodgrains 3.58 4.22 325.49 597.09
Fertilizers 4.43 4.29 322.47 427.08
Mineral Oil (POL) 3.3 3.83 256.45 409.31
Container Service
i) Domestic containers 0.8 0.75 79.65 74.45
ii) EXIM containers 2.33 2.56 195.3 218.87
iii) Total 3.13 3.31 274.95 293.32
Balance other goods 5.51 5.15 364.04 381.92
Total revenue earning traffic 75.79 78.43 5205.17 6328.28
ore for exports, steel plants and for other domestic user in August fell to `620.84 crore, down 7.53 percent from `671.39 crore in July. The quantity of iron ore transported fell to 9.21 mt in August from 9.83 mt in the previous month.
Revenue from transportation of cement in August stood at `551.57crore (7.52 mt) from `587.09 crore (8.18 mt) in July, while
that from foodgrains transportation rose to `597.09 crore (4.22 mt) in August from `499.83 crore (3.83 mt) in the previous month.
The Railways revenue from transportation of fertilisers in August rose sharply to `427.08 crore (4.29 mt) from `374.18 crore (4.09 mt) in July.
Revenue from transportation of petroleum oil and lubricant (POL) in August stood at `409.31 crore (3.83 mt), while the same from pig iron and finished steel from steel plants and other points was ̀ 397.9 crore (2.95 mt). Revenue from container services was `293.32 crore (3.31 mt) and from transportation of other goods was `381.92 crore (5.15 mt).


58 Coal Insights, September 2012
AnnExuRE
I. ThefollowingcoalblockshavebeenallottedinpursuanceofrecommendationsofScreeningCommitteemeetingsheldfrom14/7/93to18/10/05asindicatedagainsteachblock,afterobtainingapprovalofthecompetentauthority.
Sl. No. Block allocated Name of the
CompanyDate of
Allotment State Private / Government End -Use
Geological Reserves
(in MT)Current Status
No. of ScreeningCommittee Meeting
(Date of the Meeting)
1 SarisatolliRPG Industries/CESC Ltd.
10.08.1993 West Bengal P Power 140.47 Producing 1st (14/7/93)
2 Talabira-I Hindalco Industries 25.02.1994 Orissa P Power 22.55 Producing 4th (12/1/94)
3 Tara (East) WBSEB 14.07.1995 West Bengal G Power 84.47 Producing 7th (6/6/95)
4 TasraSteel Authority of India Ltd.
26.02.1996 Jharkhand G Sponge Iron 285 Producing 8th (4/10/95)
5 Tara (West) WBPDCL 17.04.1996 West G Power 125.71 Producing 5th (20/12/95)
6 Gare-Palma-IV/1Jindal Steel & Power Ltd
20.06.1996 Chhattisgarh P Sponge Iron 124 Producing 3rd (27/9/93)
7 Gotitoria (East) BLA Industries 21.06.1996Madhya Pradesh
PUnder S.3(3) (c) (i ) small isolated
dispensation5.15 Producing 10th (3/4/96)
8 Gotitoria (West) BLA Industries 21.06.1996Madhya Pradesh
PUnder S.3(3 (c) (i) small isolated
dispensation4.19 Producing 10th (3/4/96)
9 Gare-Palma-IV/5Monet Ispat and Energy Ltd
21.06.1996 Chhattisgarh P Sponge Iron 126 Producing 12th (3/4/98)
10 Takli-Jena-Bellora
Central Collieries Ltd. (cancelled) .
29.05.1998 Maharastra P Power 40Deallocated on
23.06.200312th (3/4/98)
Lloyd Metals & Engineering Ltd
29.05.1998 Sponge Iron
11 Utkal-CUtkal Coal Ltd.(formerly ICCL)
29.05.1998 Orissa P Power 208.77 Non Producing 12th (3/4/98)
12 Gare-Palma-IV/2 Jindal Power Ltd 01.07.1998 Chhattisgarh P Power 123 Producing 12th (3/4/98)
13 Gare-Palma-IV/3 Jindal Power Ltd 01.07.1998 Chhattisgarh P Power 123 Producing 12th (3/4/98)
14 Gare-Palma- IV/4 Jayaswal Neco Ltd 16.08.1999 Chhattisgarh P Sponge Iron 125 Producing 14th (18/6/99)
15 Utkal-B2Monet Ispat and Energy Ltd
16.08.1999 Orissa P Sponge Iron 106 Non-Producing 14th (18/6/99)
16 BrahmadihaCastron Techologies Ltd
01.09.1999 Jharkhand P Iron & Steel Non-Producing 14th (18/6/99)
17 Gare-Palma-IV/7Raipur Alloys & Steel Ltd
25.04.2000 Chhattisgarh P Sponge Iron 156 Producing 15th (6/3/2000)
18 Marki Mangli-I B.S. Ispat 25.04.2001 Maharastra P Sponge Iron 34.34 Producing 15th (6/3/2000)
19 Pachwara CentralPunjab State Electricity Board
28.12.2001 Jharkhand G Power 562 Producing 16th (31/5/2001)
20 Tokisud NorthGVK Power (Govindwal Sahib) Ltd
07.01.2002 Jharkhand P Power 92.3 Non- Producing 17th (28/4/2001)
21 Gangaramchak WBPDCL 23.06.2003 West Bengal G Power 10 Non- Producing 18th (5/5/2003)
22 Barjora WBPDCL 23.06.2003 West Bengal G Power 8 Producing 18th (5/5/2003)
23Gangaramchak-Bhadulia
WBPDCL 23.06.2003 West Bengal G Power 4 Non- Producing 18th (5/5/2003)
24 Chinora Fieldmining & Ispat Ltd 08.10.2003 Maharastra P Sponge Iron 20 Non- Producing 19th (26/5/03)
25Warora (West) Southern Part
Fieldmining & Ispat Ltd.
08.10.2003 Maharastra P Sponge Iron 18 Non- Producing 19th (26/5/03)
26 Chotia Prakash Industries Ltd 04.09.2003 Chhattisgarh P Sponge Iron 34.48 Producing 19th (26/5/03)
Details of coal blocks allocated so far with current status


60 Coal Insights, September 2012
AnnExuRE
27 Utkal B 1Jindal Steel & Power Ltd
29.09.2003 Orissa P Sponge Iron 228.4 Non- Producing 20th (6/6/2003)
28 Kathautia Usha Martin Ltd 29.09.2003 Jharkhand P Sponge Iron 29.76 Producing 20th (6/6/2003)
29 Majra Gondwana Ispat Ltd 29.10.2003 Maharastra P Sponge Iron 31.5 Non- Producing 20th (6/6/2003)
30 BadamTenughat Vidyut Nigam Limited
03.11.2003 Jharkhand G Power 144.63 Non- Producing 20th (6/6/2003)
31 Baranj - I KPCL 10.11.2003 Maharastra G Power 68.31 Producing 21st (19/8/2003)
32 Baranj - II KPCL 10.11.2003 Maharastra G Power Producing 21st (19/8/2003)
33 Baranj - III KPCL 10.11.2003 Maharastra G Power Producing 21st (19/8/2003)
34 Baranj - IV KPCL 10.11.2003 Maharastra G Power Producing 21st (19/8/2003)
35 Kiloni KPCL 10.11.2003 Maharastra G Power 39.51 Producing 21st (19/8/2003)
36 Manora Deep KPCL 10.11.2003 Maharastra G Power 44.7 Producing 21st (19/8/2003)
37 Jamkhani Bhushan Ltd. 12.11.2003 Orissa P Sponge Iron 80 Non- Producing 21st (19/8/2003)
38 Bhandak WestShree Baidyanath Ayurved Bhawan Ltd.
27.11.2003 Maharastra P Power 36.18Deallocated on
31.05.201119th (26/5/2003)
39 Utkal-DOrissa Mining Corporation
19.12.2003 Orissa G Commercial 153.31 Non- Producing 16th (31/5/2001)
40 West of Umaria Garuda Clays Ltd 24.05.2004 Chhattisgarh P Cement 7Deallocated in
September 200619th (26/5/03)
41 Utkal 'E' NALCO 27.08.2004 Orissa G Power 194 Non- Producing 17th (28/11/2001)
42 Gidhmuri CSEB 23.09.2004 Chhattisgarh G Power 80.27 Non- Producing 22nd (4/11/03)
43 Patoria CSEB 23.09.2004 Chhattisgarh G Power 269.25 Non- Producing 22nd (4/11/03)
44 Belgaon Sunflag Iron Steel Ltd 28.03.2005 Maharastra P Sponge Iron 15.3 Producing 23rd (29/11/2004)
45 Pachvara North WBPDCL 26.04.2005 Jharkhand G Power 125.71 Non- Producing 18th (5/5/2003)
46 Moitra Jayaswal Neco Ltd 13.05.2005 Jharkhand P Sponge Iron 215.78 Non- Producing 24th (9/12/04)
47 BrindaAbhijeet Infrastructure P. Ltd.
26.05.2005 Jharkhand P Sponge Iron 34.72 Non- Producing 24th (9/12/04)
48 SasaiAbhijeet Infrastructure P. Ltd.
26.05.2005 Jharkhand P Sponge Iron 26.35 Non- Producing 24th (9/12/04)
49 MeralAbhijeet Infrastructure P. Ltd.
26.05.2005 Jharkhand P Sponge Iron 17.05 Non- Producing 24th (9/12/04)
50 Parbatpur-CentralElectrosteel castings Ltd
07.07.2005 Jharkhand P Pig Iron 231.22 Producing 27th (1/3/2005)
51 Lalgarh (North)Domco Smokeless Fuel Pvt. Ltd
8.07.2005 Jharkhand P Pig Iron 30 Non- Producing 23rd (29/11/2004)
52 Kotre -Basantpur TISCO 11.08.2005 Jharkhand P Pig Iron 148.4 Non- Producing 24th (9/12/04)
53 Pachmo TISCO 11.08.2005 Jharkhand P Pig Iron 101.99 Non- Producing 24th (9/12/04)
54 Lohari Usha Martin 24.08.2005 Jharkhand P Sponge Iron 9.99 Non- Producing 24th (9/12/04)
55 Chitarpur Corporate Ispat Ldt 02.09.2005 Jharkhand P Sponge Iron 212.0 1 Non- Producing 20th (6/6/03)
56 PanchbahaniShree Radhe Industries
06.09.2005 Chhattisgarh P Sponge Iron 11Deallocated in
September 200628th (15/4/2005)
57 Marki Mangli-IIVeerangana Steel Limited
06.09.2005 Maharastra P Sponge Iron 19 Non- Producing 28th (15/4/2005)
58 Marki Mangli-IIIVeerangana Steel Limited
06.09.2005 Maharastra P Sponge Iron Producing 28th (15/4/2005)
59 Marki Mangli-IVVeerangana Steel Limited
06.09.2005 Maharastra P Sponge Iron Non Producing 28th (15/4/2005)
Sl. No. Block allocated Name of the
CompanyDate of
Allotment State Private / Government End -Use
Geological Reserves
(in MT)Current Status
No. of ScreeningCommittee Meeting
(Date of the Meeting)

Coal Insights, September 2012 61
AnnExuRE
60 Talabira II
MCL 10.11.2005 Orissa G Power
152.33
Non Producing 25th (10/1/2005)
NLC 10.11.2005 Orissa G Power
Hindalco Industries 10.11.2005 Orissa P Power
61 Utkal-A
MCL 29.11.2005 Orissa G Power Non Producing 25th (10/1/2005)
JSW Steels Ltd./ Jindal Thermal Power Ltd.
29.11.2005 Orissa P Power
333.4Jindal Stainless Steel Ltd.
29.11.2005 Orissa P Power
Shyam DRI Ltd. 29.11.2005 Orissa P Power
62 North Dhadu
Jharkhand Ispat Pvt. Ltd
13.01.2006 Jharkhand P Sponge Iron
923.94
Non Producing 27th (1/3/2005)
Pavanjay Steel & Power Generation Pvt. Ltd
13.01.2006 Jharkhand P Sponge Iron
Electrosteel castings Ltd
13.01.2006 Jharkhand P Sponge Iron
Adhunik Alloys & Power Ltd.
13.01.2006 Jharkhand P Sponge Iron
63 BijahanBhusan Ltd. 13.01.2006 Orissa P Sponge Iron
130Non Producing 25th (10/1/2005)
Mahaveer Ferro 13.01.2006 Orissa P Sponge Iron
Sl. No. Block allocated Name of the
CompanyDate of
Allotment State Private / Government End -Use
Geological Reserves
(in MT)Current Status
No. of ScreeningCommittee Meeting
(Date of the Meeting)

62 Coal Insights, September 2012
64 Madanpur South
Hindustan Zinc Ltd. 13.01.2006 Chhattisgarh P Sponge Iron
175.65
Non Producing 30th (18/10/2005)
Akshya Investment Pvt. Ltd
13.01.2006 Chhattisgarh P Sponge Iron
Chhattisgarh Steel & Power Ltd.
13.01.2006 Chhattisgarh P Sponge Iron
Chhattisgarh Electricity Corporation Ltd.
13.01.2006 Chhattisgarh P Sponge Iron
MSP Steel & Power Ltd.
13.01.2006 Chhattisgarh P Sponge Iron
Chhattisgarh Captive Coal Mining Ltd. (Consortium of five Co. )
13.01.2006 Chhattisgarh P Sponge Iron
65-66
Nakia I + Nakia II
Ispat Godavari 13.01.2006 Chhattisgarh P Sponge Iron
399
Non Producing 30th (18/10/2005)
Ind Agro Synergy 13.01.2006 Chhattisgarh P Sponge Iron
Shri Nakoda Ispat 13.01.2006 Chhattisgarh P Sponge Iron
Vandana Gobal Ltd. 13.01.2006 Chhattisgarh P Sponge Iron
Shree Bajrang Power & Ispat Ltd
13.01.2006 Chhattisgarh P Sponge Iron
67 New Patrapara
Bhusan Steel & Strips Ltd.
13.01.2006 Orissa P Sponge Iron
1042
Non Producing 28th (15/4/2005)
Adhunik Metaliks Ltd. 13.01.2006 Orissa P Sponge Iron
Deepak Steel & Power Ltd.
13.01.2006 Orissa P Sponge Iron
Adhunik Corp. Ltd. 13.01.2006 Orissa P Sponge Iron
Orissa Sponge Iron Ltd.
13.01.2006 Orissa P Sponge Iron
SMC Power Generation Ltd.
13.01.2006 Orissa P Sponge Iron
Sree Metaliks Ltd. 13.01.2006 Orissa P Sponge Iron
Visa Steel Ltd. 13.01.2006 Orissa P Sponge Iron
68 Gare Palma IV/6
Jindal Steel & Power Ltd
13.01.2006 Chhattisgarh P Sponge Iron156
Non Producing 30th (18/10/05)
Nalwa Sponge Iron Ltd.
13.01.2006 Chhattisgarh P Sponge Iron
69 Gare Palma IV/8 Jayaswal Neco Ltd 13.01.2006 Chhattisgarh P Sponge Iron 107.2 Non Producing 30th (18/10/05)
70 Madanpur (North)
Ultratech Ltd. 13.01.2006 Chhattisgarh P Sponge Iron
241.61
Non Producing 30th (18/10/05)
Singhal Enterprises 13.01.2006 Chhattisgarh P Sponge Iron
Nav Bharat Coalfield Ltd
13.01.2006 Chhattisgarh P Sponge Iron
Vandana Energy & Steel Pvt. Ltd.
13.01.2006 Chhattisgarh P Sponge Iron
Prakash Industries Ltd 13.01.2006 Chhattisgarh P Sponge Iron
Anjani Steel Pvt. Ltd. 13.01.2006 Chhattisgarh P Sponge Iron
Chhattisgarh Captive Coal Mining Ltd. (Consortium of five Co.)
13.01.2006 Chhattisgarh P Sponge Iron
AnnExuRE
Sl. No. Block allocated Name of the
CompanyDate of
Allotment State Private / Government End -Use
Geological Reserves
(in MT)Current Status
No. of ScreeningCommittee Meeting
(Date of the Meeting)
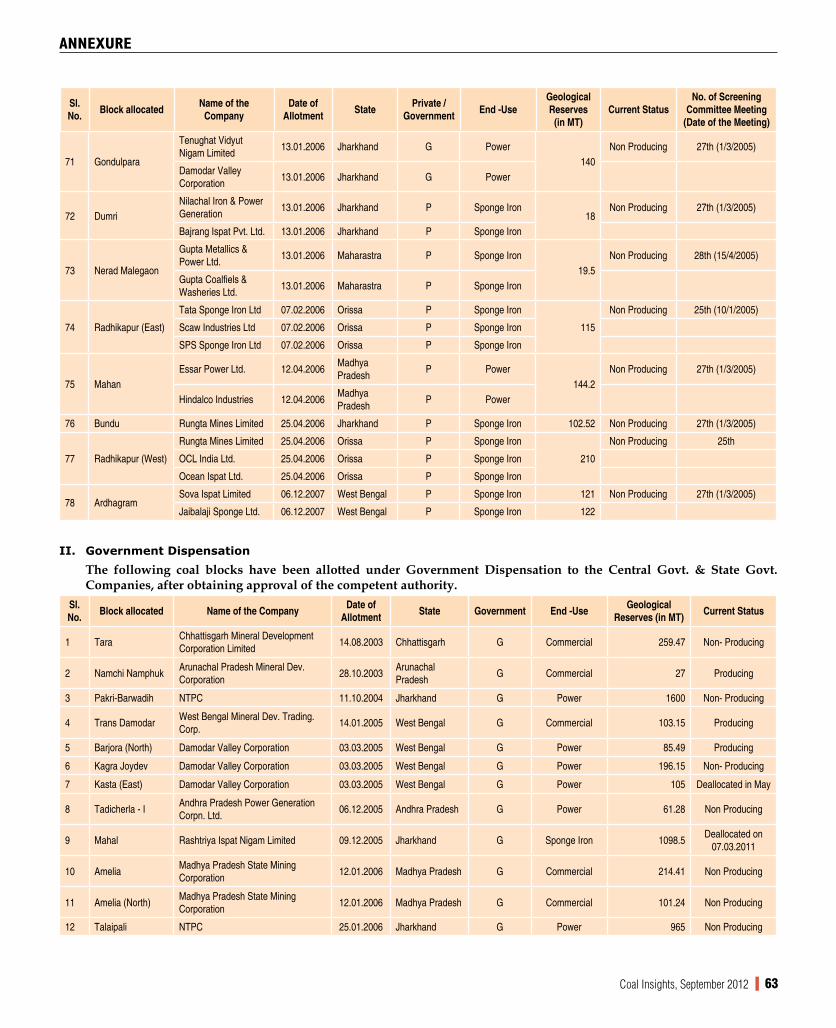
Coal Insights, September 2012 63
71 Gondulpara
Tenughat Vidyut Nigam Limited
13.01.2006 Jharkhand G Power140
Non Producing 27th (1/3/2005)
Damodar Valley Corporation
13.01.2006 Jharkhand G Power
72 DumriNilachal Iron & Power Generation
13.01.2006 Jharkhand P Sponge Iron18
Non Producing 27th (1/3/2005)
Bajrang Ispat Pvt. Ltd. 13.01.2006 Jharkhand P Sponge Iron
73 Nerad Malegaon
Gupta Metallics & Power Ltd.
13.01.2006 Maharastra P Sponge Iron19.5
Non Producing 28th (15/4/2005)
Gupta Coalfiels & Washeries Ltd.
13.01.2006 Maharastra P Sponge Iron
74 Radhikapur (East)
Tata Sponge Iron Ltd 07.02.2006 Orissa P Sponge Iron
115
Non Producing 25th (10/1/2005)
Scaw Industries Ltd 07.02.2006 Orissa P Sponge Iron
SPS Sponge Iron Ltd 07.02.2006 Orissa P Sponge Iron
75 MahanEssar Power Ltd. 12.04.2006
Madhya Pradesh
P Power144.2
Non Producing 27th (1/3/2005)
Hindalco Industries 12.04.2006Madhya Pradesh
P Power
76 Bundu Rungta Mines Limited 25.04.2006 Jharkhand P Sponge Iron 102.52 Non Producing 27th (1/3/2005)
77 Radhikapur (West)
Rungta Mines Limited 25.04.2006 Orissa P Sponge Iron
210
Non Producing 25th
OCL India Ltd. 25.04.2006 Orissa P Sponge Iron
Ocean Ispat Ltd. 25.04.2006 Orissa P Sponge Iron
78 ArdhagramSova Ispat Limited 06.12.2007 West Bengal P Sponge Iron 121 Non Producing 27th (1/3/2005)
Jaibalaji Sponge Ltd. 06.12.2007 West Bengal P Sponge Iron 122
II. Government Dispensation
The following coal blocks have been allotted under Government Dispensation to the Central Govt. & State Govt.Companies,afterobtainingapprovalofthecompetentauthority.
Sl. No. Block allocated Name of the Company Date of
Allotment State Government End -Use Geological Reserves (in MT) Current Status
1 TaraChhattisgarh Mineral Development Corporation Limited
14.08.2003 Chhattisgarh G Commercial 259.47 Non- Producing
2 Namchi NamphukArunachal Pradesh Mineral Dev. Corporation
28.10.2003Arunachal Pradesh
G Commercial 27 Producing
3 Pakri-Barwadih NTPC 11.10.2004 Jharkhand G Power 1600 Non- Producing
4 Trans DamodarWest Bengal Mineral Dev. Trading. Corp.
14.01.2005 West Bengal G Commercial 103.15 Producing
5 Barjora (North) Damodar Valley Corporation 03.03.2005 West Bengal G Power 85.49 Producing
6 Kagra Joydev Damodar Valley Corporation 03.03.2005 West Bengal G Power 196.15 Non- Producing
7 Kasta (East) Damodar Valley Corporation 03.03.2005 West Bengal G Power 105 Deallocated in May
8 Tadicherla - IAndhra Pradesh Power Generation Corpn. Ltd.
06.12.2005 Andhra Pradesh G Power 61.28 Non Producing
9 Mahal Rashtriya Ispat Nigam Limited 09.12.2005 Jharkhand G Sponge Iron 1098.5Deallocated on
07.03.2011
10 AmeliaMadhya Pradesh State Mining Corporation
12.01.2006 Madhya Pradesh G Commercial 214.41 Non Producing
11 Amelia (North)Madhya Pradesh State Mining Corporation
12.01.2006 Madhya Pradesh G Commercial 101.24 Non Producing
12 Talaipali NTPC 25.01.2006 Jharkhand G Power 965 Non Producing
AnnExuRE
Sl. No. Block allocated Name of the
CompanyDate of
Allotment State Private / Government End -Use
Geological Reserves
(in MT)Current Status
No. of ScreeningCommittee Meeting
(Date of the Meeting)

64 Coal Insights, September 2012
13 Kerandari NTPC 25.01.2006 Jharkhand G Power 229Deallocated on
14.06.2011
14 Chatti Bariatu NTPC 25.01.2006 Jharkhand G Power 243Deallocated on
14.06.2011
15 Dulanga NTPC 25.01.2006 Orissa G Power 260 Non Producing
16 Brahmini NTPC +CIL JV 25.01.2006 Jharkhand G Power 1900Deallocated on
14.06.2011
17 Chichro Patsimal NTPC +CIL JV 25.01.2006 Jharkhand G Power 356Deallocated on
14.06.2011
18 Sugia Closed mineJharkhand State Mineral Development Corporation
30.01.2006 Jharkhand G Commercial 2 Non Producing
19 Rauta Closed mineJharkhand State Mineral Development Corporation
30.01.2006 Jharkhand G Commercial 1 Non Producing
20Burakhap small patch
Jharkhand State Mineral Development Corporation
30.01.2006 Jharkhand G Commercial 2.5 Non Producing
21-22
Mahanadi Machhakata
GSECL 06.02.2006 Orissa G Power 480 Non Producing
MSEB 06.02.2006 Orissa G Power 720
23 Parsa Chhattisgarh State Electricity Board 02.08.2006 Chhattisgarh G Power 150 Non Producing
24Gare Pelma, Sector I
Chhattisgarh Mineral Development Corporation Limited
02.08.2006 Chhattisgarh G Commercial 900 Non Producing
25Gare Pelma, Sector II
Maharastra State Mining Corpn. 02.08.2006 Chhattisgarh G Power 768 Non Producing
Tamil Nadu State Electricity Board 02.08.2006 Chhattisgarh G Power
26 Morga-IMadhya Pradesh State Mining Corporation Limited
02.08.2006 Chhattisgarh G Commercial 250 Non Producing
27 Morga II GMDC 02.08.2006 Chhattisgarh G Commercial 350 Non Producing
28 Gomia MMTC 02.08.2006 Jharkhand G Commercial 355 Non Producing
29Pindra- Debipur-Khaowatand
Jharkhand State Mineral Development Corporation
02.08.2006 Jharkhand G Commercial 110 Non Producing
30 Saria KoiyatandBihar Rajya Khanij Vikas Nigam (BRKVN) Patna.
02.08.2006 Jharkhand G Commercial 202 Non Producing
31 JainagarGujarat Mineral Development Corporation (GMDC)
02.08.2006 Jharkhand G Commercial 100Deallocated in
2008
32 Rajbar E&D Tenughat Vidyut Nigam Limited 02.08.2006 Jharkhand G Power 385 Non Producing
33 Banhardih Jharkhand State Electricity Board 02.08.2006 Jharkhand G Power 400Deallocated on
14.06.2011
34 LateharJharkhand State Mineral Development Corporation
02.08.2006 Jharkhand G Commercial 220 Non Producing
35 Dongeri Tal-IIMadhya Pradesh State Mining Corporation (MPSMC)
02.08.2006 Madhya Pradesh G Commercial 175 Non Producing
36Marki-Zari-Jamani-Adkoli
Maharastra State Mining Corpn. 02.08.2006 Maharastra G Commercial 11 Non Producing
37 Mara II MahanNCT of Delhi, Delhi 02.08.2006 Madhya Pradesh G Power 477.5 Non Producing
Haryana Power Generation Generation Corp Ltd (HPGCL)
02.08.2006 G Power 477.5
38 Nuagaon TelisahiOrissa Mining Corporation 02.08.2006 Orissa G Commercial 733 Non Producing
Andhra Pradesh Mineral Development (APMDC) Hyderabad
02.08.2006 Orissa G Commercial
39 IchhapurWest Bangal Mineral Dev. Trading. Corp.
02.08.2006 West Bengal G Commercial 335 Non Producing
40 KultiWest Bangal Mineral Dev. Trading. Corp.
02.08.2006 West Bengal G Commercial 210 Non Producing
41-42
Chendipada, Chendi II
UPRVUNL 25.07.2007 Orissa G Power 794.5 Non Producing
CMDC 25.07.2007 Orissa G Power 500
MAHAGENCO 25.07.2007 Orissa G Power 294.5
Sl. No. Block allocated Name of the Company Date of
Allotment State Government End -Use Geological Reserves (in MT) Current Status
AnnExuRE

Coal Insights, September 2012 65
43 Baitarni West
Kerala State Elec. Board 25.07.2007 Orissa G Power 200.66 Non Producing
Orissa Hydro Power Generation Cor 25.07.2007 Orissa G Power 200.66
Gujarat Power Generation Corp 25.07.2007 Orissa G Power 200.66
44 Mandakini B
Assam Mineral Dev. Cor 25.07.2007 Orissa G Power 300 Non Producing
Meghalaya Mineral Dev. Corp 25.07.2007 Orissa G Power 300
Tamil Nadu State Electricity Board 25.07.2007 Orissa G Power 300
Orissa Mining Corporation 25.07.2007 Orissa G Power 300
45Chhati Bariatu South
NTPC 25.07.2007 Jharkhand G Power 354Deallocated on
14.06.2011
46Saharpur Jamarpani
Damodar Valley Corporation 25.07.2007 Jharkhand G Power 600Deallocated on
14.06.2011
47 Manoharp ur Orissa Power Generation Corporation 25.07.2007 Orissa G Power 181.68 Non Producing
48Dipside Manoharpur
Orissa Power Generation Corporation 25.07.2007 Orissa G Power 350 Non Producing
49 NainiGMDC 25.07.2007 Orissa G Power 500 Non Producing
PIPDICL 25.07.2007 Orissa G Power
50Urma Paharitora JSEB 25.07.2007 Jharkhand G Power 437 Non Producing
BSMDCL 25.07.2007 Jharkhand G Power 263
51 PatratuJharkhand State Mineral Development Corporation
25.07.2007 Jharkhand G Commercial 450 Non Producing
52 Rabodih OCPJharkhand State Mineral Development Corporation
25.07.2007 Jharkhand G Commercial 133 Non Producing
53 Jaganathpur AWest Bangal Mineral Dev. Trading. Corp.
25.07.2007 West Bengal G Commercial 273 Non Producing
54 Jaganathpur BWest Bangal Mineral Dev. Trading. Corp.
25.07.2007 West Bengal G Commercial 176 Non Producing
55 Suliyari APMDC 25.07.2007 Madhya Pradesh G Commercial 75 Non Producing
56 Marki BarkaMadhya Pradesh State Mining Corporation (MPSMC)
25.07.2007 Madhya Pradesh G Commercial 80 Non Producing
57 Shankarpur Bht IIChhattisgarh Mineral Development Corporation Limited
25.07.2007 Chhattisgarh G Commercial 80.13 Non Producing
58 Morga III Madhya PradeshSMCL 25.07.2007 Chhattisgarh G Commercial 35 Non Producing
59 Morga IV Madhya PradeshSMCL 25.07.2007 Chhattisgarh G Commercial 35 Non Producing
60 SondhiaChhattisgarh Mineral Development Corporation Limited
25.07.2007 Chhattisgarh G Commercial 70 Non Producing
61 Semaria/PipariaMadhya Pradesh State Mining Corporation (MPSMC)
25.07.2007 Madhya Pradesh G Commercial 38.62 Non Producing
62 Sahapur East National Mineral Dev. Corp 25.07.2007 Madhya Pradesh G Commercial 42 Non Producing
63 Sahapur West National Mineral Dev. Corp 25.07.2007 Madhya Pradesh G Commercial 42 Non Producing
64 BicharpurMadhya Pradesh State Mining Corporation (MPSMC)
25.07.2007 Madhya Pradesh G Commercial 36 Non Producing
65 Mandla SouthMadhya Pradesh State Mining Corporation
25.07.2007 Madhya Pradesh G Commercial 72 Non Producing
66 Agarzari MSMCL 25.07.2007 Maharastra G Commercial 137Deallocated on
28.06.2010
67 Warora MSMCL 25.07.2007 Maharastra G Commercial 73 Non Producing
68 Parsa East RRVUNL 25.06.2007 Chhattisgarh G Power 180 Non Producing
69 Kanta Basan RRVUNL 25.06.2007 Chhattisgarh G Power 180 Non Producing
AnnExuRE
Sl. No. Block allocated Name of the Company Date of
Allotment State Government End -Use Geological Reserves (in MT) Current Status

66 Coal Insights, September 2012
70 SitarampurWest Bengal Mineral Dev. Trading Corp.
27.12.2007 West Bengal G Commercial 210 Non Producing
71Gare Pelma Sector III
Goa Industrial Development Corporation
12.11.2008 Chhattisgarh G Power 210.2 Non Producing
72East of Damogoria (Kalyaneshwari)
West Bengal Power Development Corporation Limited (WBPDCL)
27.02.2009 West Bengal G Power 337Deallocated on
21.10.2011
III. 33rd / 34th Screening Committee
Thefollowingcoalblocksareallottedinpursuanceoftherecommendationsofthe33rdScreeningCommitteemeetingheldon31stAugust - 2ndSeptember, 2006and34thScreeningmeetingheldon7th -8thSeptember, 2006and in themeetingheldon22ndSeptember,2006,afterobtainingapprovalofthecompetentauthority.
Sl. No. Block allocated Name of the Company Date of
Allotment State Private / Government End -Use Geological
Reserves (in MT) Current Status
1 Kosar Dongergaon Chaman Metaliks Ltd. 20.02.2007 Maharastra P Sponge Iron 22.51 Non Producing
2 BiharinathBankura DRI Mining Manufacturers Co. Pvt. Ltd.
20.02.2007 West Bengal P Sponge Iron 95.16 Non Producing
3 Chakla Essar Power Generation Ltd. 20.02.2007 Jharkhand P Power 83.05 Non Producing
4 Jitpur Jindal Steel & Power Ltd. 20.02.2007 Jharkhand P Power 81.09 Non Producing
5Warora West (North)
Bhatia International Ltd. 20.02.2007 Maharastra P Sponge Iron 10Deallocated on
30.05.2011
6 AnesttipaliAndhra Pradesh Power Generation Corpn. Ltd.
20.02.2007 Andhra Pradesh G Power 26.89Deallocated on
30.05.2011
7 Punkula-ChilkaAndhra Pradesh Power Generation Corpn. Ltd.
20.02.2007 Andhra Pradesh G Power 38.11Deallocated on
30.05.2011
8 Sitanala Steel Authority of India Ltd. 11.04.2007 Jharkhand G Steel 108.8 Non Producing
9 PenagaddppaAndhra Pradesh Power Generation Corpn. Ltd.
29.05.2007 Andhra Pradesh G Power 110.87Deallcoated on
30.05.2011
10 Sial Ghoghri Prism Cement Limited 29.05.2007 Madhya Pradesh P Cement 30.38 Non Producing
11 Ravanwara Noth SKS Ispat Limited 29.05.2007 Madhya Pradesh P Sponge Iron 174.07 Non Producing
12 Brahampuri Pushp Steel and Minining Ltd. 16.07.2007 Madhya Pradesh P Sponge Iron 55.05 Non Producing
13 TubedHindalco 01.08.2007 Jharkhand P Power 189 Non Producing
Tata Power Ltd 01.08.2007 Jharkhand P Power
14 Mandla North Jaipraskash Associates Ltd 17.09.2007 Madhya Pradesh P cement 194.96 Non Producing
15.*Jogeshwar & Khas Jogeshwar
Jharkhand State Mineral Development Corporation Ltd.
11.04.2008 Jharkhand G Commercial 84.03 Non Producing
16 Choritand TailiayaRungta Mines Limited 14.05.2008 Jharkhand P Sponge Iron 18.7 Non Producing
Sunflag Iron Steel Ltd 14.05.2008 Jharkhand P Sponge Iron 8.72
17 Rohne
JSW Steel Ltd. 05.06.2008 Jharkhand P Sponge Iron 172.53 Non Producing
Bhushan Power & Steel Ltd. 05.06.2008 Jharkhand P Sponge Iron 60.23
Jai Balaji Industries Ltd 05.06.2008 Jharkhand P Sponge Iron 17.23
18 Lohara (East)Murli Industries Ltd. 27.06.2008 Maharashtra P Cement 11.96
Deallocated on 17.05.2010
Grace Industries Ltd. 27.06.2008 Maharashtra P Sponge Iron 16.14
19 Tenughat-Jhirki Rashtriya Ispat Nigam Limited 10.09.2008 Jharkhand G Steel 215.756Deallocated on
07.03.2011
20 MedniraiRungta Mines Limited 28.05.2009 Jharkhand P Power 80.83 Non Producing
Kohinoor Steel (P) Ltd. 28.05.2009 Jharkhand P Sponge Iron
* Initially not recommended by the Screening Committee, but allotted subsequently to JSMDCL in pursuance of orders of Hon’ble Supreme Court.
AnnExuRE
Sl. No. Block allocated Name of the Company Date of
Allotment State Government End -Use Geological Reserves (in MT) Current Status

Coal Insights, September 2012 67
IV. 35th Screening Committee
The following coalblocks are allotted inpursuanceof the recommendationsof the 35thScreeningCommittee in itsmeetingsheldon20th-23rdJune,2007,30thJuly,2007and13thSeptember,2007,afterobtainingapprovalofthecompetentauthority.
Sl. No. Block allocated Name of the Company Date of
Allotment State Private /Government End -Use Geological
Reserves (in MT) Current Status
1 Ashok Karkatta Central Essar Power Ltd. 06.11.2007 Jharkhand P Power 110 Non Producing
2 Patal EastBhushan Power and Steel Ltd.
06.11.2007 Jharkhand P Power 200 Non Producing
3 SayangAES Chhattisgarh Energy Pvt. Ltd
06.11.2007 Chhattisgarh P Power 150 Non Producing
4 DurgapurI I/Sarya DB Power Ltd. 06.11.2007 Chhattisgarh P Power 91.67 Non Producing
5 DurgapurI I/Taraimar Balco 06.11.2007 Chhattisgarh P Power 211.37 Non Producing
6 Lohara West Extn. Adani Power Ltd 06.11.2007 MaharastraP Power 169.832 Non Producing
7 Mandakini
Monet Ispat and Energy Ltd
09.01.2008 Orissa P Power 96.84 Non Producing
Jindal Photo Ltd 09.01.2008 Orissa P Power 96.84
Tata Power Company Ltd 09.01.2008 Orissa P Power 96.84
8 SeregarhaArcelor Mittal India Ltd 09.01.2008 Jharkhand P Power 83.33 Non Producing
GVK Power (Govindwal Sahib) Ltd
09.01.2008 Jharkhand P Power 66.67
9 MahuagarhiCESC Ltd 09.01.2008 Jharkhand P Power 110 Non Producing
Jas Infracture Capital Pvt Ltd
09.01.2008 Jharkhand P Power
10 Amarkonda Murgadangal
Jindal Steel and Power Ltd
17.01.2008 Jharkhand P Power 205 Non Producing
Gagan Sponge Iron Pvt. Ltd
17.01.2008 Jharkhand P Power 205
11-12Rampia & Dip Side of Rampia
Sterlite Energy Ltd. (IPP) 17.01.2008 Orissa P Power 112.22 Non Producing
GMR Energy (IPP) 17.01.2008 Orissa P Power 112.22
Arcelor Mittal India Ltd.. (CPP)
17.01.2008 Orissa P Power 84.16
Lanco Group Ltd. (IPP) 17.01.2008 Orissa P Power 112.22
Navbharat Power Pvt. Ltd. (IPP)
17.01.2008 Orissa P Power 112.22
Reliance Energy Ltd. (IPP)
17.01.2008 Orissa P Power 112.22
13 Fatehpur East
JLD Yavatmal Energy Ltd 23.01.2008 Chhattisgarh P Power 99.12 Non Producing
R.K.M. Powergen Pvt. Ltd 23.01.2008 Chhattisgarh P Power 99.12
Visa Power Ltd 23.01.2008 Chhattisgarh P Power 99.12
Green Infrastructure Pvt Ltd
23.01.2008 Chhattisgarh P Power 99.12
Vandana Vidyut Ltd 23.01.2008 Chhattisgarh P Power 53.52
14 FatehpurSKS Ispat and Power Ltd 06.02.2008 Chhattisgarh P Power 73.85 Non Producing
Prakash Industries Ltd 06.02.2008 Chhattisgarh P Power 46.15
15 GaneshpurTata Steel Ltd. 28.05.2009 Jharkhand P Power 137.88 Non Producing
Adhunik Thermal Energy Ltd.
28.05.2009 Jharkhand P Power
16 Gourangdih ABCHimachal EMTA Power Ltd.
10.07.2009 West Bengal P Power 68.85 Non Producing
JSW Steel Ltd. 10.07.2009 West Bengal P Power 68.85
AnnExuRE

68 Coal Insights, September 2012
V. 36th Screening Committee
ThefollowingCoalBlocksareallottedinpursuanceoftherecommendationsof36thScreeningCommitteeinitsmeetingsheldon7th-8thDecember,2007,7th-8thFebruary,2008and3rdJuly,2008,afterobtainingapprovalofthecompetentauthority.
Sl. No. Block allocated Name of the Company Date of
Allotment State Private / Government End -Use Geological
Reserves (in MT) Current Status
1 Kesla North Rathi Udyog Ltd. 05.08.2008 Chhattisgarh P Sponge Iron 36.15 Non Producing
2 Macherkunda Bihar Sponge Iron Ltd. 05.08.2008 Jharkhand P Sponge Iron 23.86 Non Producing
3Tandsi III & Tandsi III (Extn.)
Mideast Intergrated Steels Ltd.
05.08.2008 Madhya Pradesh P Steel 17.39 Non Producing
4 Bikram Birla Corporation Ltd. 12.08.2008 Madhya Pradesh P Cement 20.98 Non Producing
5 Datima Binani Cement Ltd. 05.09.2008 Chhattisgarh P Cement 13.3Deallocated on
27.04.2010
6Rajhara North (Central & Eastern)
Mukund Limited 20.11.2008 Jharkhand P Steel 10.05 Non Producing
Vini Iron & Steel Udyog Limited
20.11.2008 Jharkhand P Steel 7.04
7 Gondkhari
Maharashtra Seamless Limited
21.11.2008 Maharashtra P Sponge Iron 29.91 Non Producing
Dhariwal Infrastructure (P) Ltd.
21.11.2008 Maharashtra P Sponge Iron 23.93
Kesoram Industries Ltd. 21.11.2008 Maharashtra P Cement 44.87
8 Thesgora B/ RudrapuriKamal Sponge Steel & Power Limited
21.11.2008 Madhya Pradesh P Sponge Iron 30.67 Non Producing
Revati Cement P. Ltd. 21.11.2008 Madhya Pradesh P Cement 14.37
9Bhaskarpara Electrotherm (India) Ltd. 21.11.2008 Chhattisgarh P Sponge Iron 24.69 Non Producing
Grasim Industries Ltd. 21.11.2008 Chhattisgarh P Sponge Iron 22.22
10 Bander
AMR Iron & Steels Pvt. Ltd.
29.05.2009 Maharashtra P Steel 31.53 Non Producing
Century Textiles & Industries Ltd.
29.05.2009 Maharashtra P Cement 47.29
J.K.Cement Ltd. 29.05.2009 Maharashtra P Cement 47.29
11 Khappa & Extn.Sunflag Iron Steel Ltd 29.05.2009 Maharashtra P Steel 53.6 Non Producing
Dalmia Cement (Bharat) Ltd.
29.05.2009 Maharashtra P Cement 31.12
12Rajgamar Dipside (South of Phulakdih Nala)
Monet Ispat and Energy Ltd
03.06.2009 Chhattisgarh P Steel 49.93 Non Producing
Topworth Steel Pvt. Ltd. 03.06.2009 Chhattisgarh P Sponge Iron 11.77
13Dahegaon/ Makardhokra IV
IST Steel & Power Ltd 17.06.2009 Maharashtra PSteel & Sponge
Iron70.74 Non Producing
Gujarat Ambuja Cement Ltd.
17.06.2009 Maharashtra P Cement 36
Lafarge India Pvt. Ltd. 17.06.2009 Maharashtra P cement 25.26
14 Andal East
Bhushan Steel Ltd. 03.07.2009 West Bengal P Steel 237.23 Non Producing
Jai Balaji Industries Ltd. 03.07.2009 West Bengal P Sponge Iron 229.5
Rashmi Cement Ltd. 03.07.2009 West Bengal P Sponge Iron 233.27
15 Moira-Madhujore
Ramswarup Lohh Udyog Ltd.
06.10.2009 West Bengal PSteel & Sponge
Iron685.39 Non Producing
Adhunik Corporation Ltd 06.10.2009 West Bengal P Sponge Iron
Uttam Galva Steels Ltd. 06.10.2009 West Bengal PSteel & Sponge
Iron
Howrah Gases Ltd. 06.10.2009 West Bengal P Sponge Iron
AnnExuRE

Coal Insights, September 2012 69
15 Moira-MadhujoreVikas Metal & Power Ltd. 06.10.2009 West Bengal P
Steel & Sponge Iron
ACC Ltd. 06.10.2009 West Bengal P Cement
16 Urtan NorthJindal Steel & Power Ltd 12.10.2009 Madhya Pradesh P Sponge Iron 46.55 Non Producing
Monet Ispat and Energy Ltd
12.10.2009 Madhya Pradesh P Sponge Iron 23.27
17Rajgamar Dipside (Deavnara )*
API Ispat & Powertech Pvt. Ltd.
14.10.2011 Chhattisgarh P Sponge Iron 20.34 Non Producing
CG Sponge Manufacturers Consortium Coalfield Pvt. Ltd.
14.10.2011 Chhattisgarh P Sponge Iron 58.12
18 Vijay Central **Coal India Limited 01.11.2011 Chhattisgarh G - 40.67 Non Producing
SKS Ispat & Power Ltd. 01.11.2011 Chhattisgarh P Sponge Iron 16.08
* A letter contemplating allocation of above block calling for options regarding the mining by the joint allocatees was issued on 22.02.2010. However, on account of change in the constituents of M/s CG Sponge Manufacturers Consortium Coalfields Pvt Ltd., the final allocation was issued on 14.10.2011 after examination of the issues arising therefrom.
** The Screening Committee has recommended for allotment of this coal block to M/s Prakash Industries Ltd and M/s SKS Ispat & Power Ltd. However, due to litigation in the Hon’ble High Court of Delhi, the coal block could not be allotted. The coal block was finally allotted to Coal India Limited as leader who would provide the share of coal to M/s SKS Ispat & Power Ltd. The Screening Committee meeting was held on 29/6/2011 in pursuance of the orders of Hon’ble Delhi High Court in Contempt case (c) No. 420 of 2011 of W.P. No. 6449/2006. The Screening Committee met again on 4.10.2011 in pursuance of orders of Hon’ble High Court of Delhi on 28.9.2011 in the above case.
Sl. No. Block allocated Name of the Company Date of
Allotment State Private / Government End -Use Geological
Reserves (in MT) Current Status
VI. UMPP
ThefollowingcoalblocksareallottedforUltraMegaPowerProjectsontherecommendationsoftheMinistryofPower,afterobtainingapprovalofthecompetentauthority.
Sl. No. Block allocated Name of the Company Date of
Allotment State Private / Government/ UMPP End -Use Geological
Reserves (in MT) Current Status
1 MeenakshiPower Finance Corporation Orissa UMPP
13.09.2006 Orissa UMPP Power 285.24 Non Producing
2 Meenakshi BPower Finance Corporation Orissa UMPP
13.09.2006 Orissa UMPP Power 250 Non Producing
3Dip side of Meenakshi
Power Finance Corporation Orissa UMPP
13.09.2006 Orissa UMPP Power 350 Non Producing
4 MoherPower Finance Corporation Sasan UMPP
13.09.2006 Madhya Pradesh UMPP Power 402 Non Producing
5Moher- Amlori Extn
Power Finance Corporation Sasan UMPP
13.09.2006 Madhya Pradesh UMPP Power 198 Non Producing
6 ChhatrasalPower Finance Corporation Sasan UMPP
26.10.2006 Madhya Pradesh UMPP Power 150 Non Producing
7 Kerandari BCPower Finance Corporation Tilaiya UMPP Jharkhand
20.07.2007 Jharkhand UMPP Power 972 Non Producing
8 BhivkundMAHAGENCO (M/s Aurangabad Co.Ltd., SPV)
17.07.2008 Maharashtra UMPP Power 100 Non Producing
9 MouryaKaranpura Energy Ltd. (SPV of JSEB)
26.06.2009 Jharkhand UMPP Power 225.35 Non Producing
10 Puta ParogiaAkaltara Power Ltd. (SPV of Chhattisgarh UMPP)
09.09.2009 Chhattisgarh UMPP Power 692.16 Non Producing
11 PindrakhiAkaltara Power Ltd. (SPV of Chhattisgarh UMPP)
09.09.2009 Chhattisgarh UMPP Power 421.51 Non Producing
12 BankhuiSakhigopal Integrated Power Company Ltd. (SPV of first additional Orissa UMPP)
21.06.2010 Orissa UMPP Power 800 Non Producing
AnnExuRE

Name: .......................................................................................................................................................................................................................
Designation: .............................................................................................................................................................................................................
Company Name: ......................................................................................................................................................................................................
Company Address: ...................................................................................................................................................................................................
City: ...................................................................................................... Pin: .........................................................................................................
State: .................................................................................................... Country: .................................................................................................
Telephone (O): ..................................................................................... Mobile: ...................................................................................................
Telephone (R): ..................................................................................... Fax: ........................................................................................................
Email: ................................................................................................... URL: .......................................................................................................
Briefly describe your company/organization: ............................................................................................................................................................
. ..................................................................................................................................................................................................................................
. ..................................................................................................................................................................................................................................
SUBSCRIPTION FORM
Please use photocopy of this form for multiple subscriptions
Please tick off the applicable boxes
Please allow 4 weeks for your subscription to commence. All disputes are subject to jurisdiction of competent courts in Kolkata only.
Yes I would like to subscribe to
INDIAN SUBSCRIPTION (One Year = 12 Issues)
Coal Insights ` 1200 1 00
Steel Insights ` 1200 ` ` 1 00
Grand Total
Publication Print Tick Digital Combo Offer No. of (Print + Digital) Copies
Tick Tick
�750 �6 �
�750 �6 �
` `
INTERNATIONAL SUBSCRIPTION (One Year = 12 Issues)
Coal Insights USD 500
Steel Insights USD 500
Grand Total
Publication Tick No. of CopiesDigital
�
�
Enclosed please find Cheque/DD drawn in favour of mjunction services ltd A/c Insights payable at Kolkata.
Cheque/DD No: ....................................................... Date: .................................... Drawn on: ...........................................................................
Amount: ......................................... (in words) ........................................................................................................................................................
Send completed order form to:mjunction services ltd., Godrej Waterside, 3rd Floor, Tower 1, Plot 5, Block DP, Sector V, Kolkata 700 091, West Bengal, IndiaPhone: +91 33 6610 6003, Mobile : +91 91633 48045, E-mail: [email protected] Free No.: 1800 4192 000 1. Press 8 for publication, Email: [email protected]
Subscribe
70 Coal Insights, September 2012 Tear
alo
ng th
e do
tted
line
Tear
alo
ng th
e do
tted
line


