Coal based oxy-combustion for carbon capture and storage ... · capture and storage: status,...
52
Coal based oxy-combustion for carbon capture and storage: status, prospects, research needs and roadmap to commercialisation Purdue University Energy Center Invited Lecture on Coal Based Energy May 28, 2009 Professor Terry Wall Chemical Engineering, University of Newcastle, Australia
Transcript of Coal based oxy-combustion for carbon capture and storage ... · capture and storage: status,...

Coal based oxy-combustion for carbon capture and storage:
status, prospects, research needs and roadmap to commercialisation
Purdue University Energy Center Invited Lectureon Coal Based Energy
May 28, 2009
Professor Terry Wall
Chemical Engineering, University of Newcastle, Australia

Content
Technology status
Underpinning science
Technology prospects

Technology status and demonstration outlines

Low Emission Coal Technologies (or CCTs) ….

Oxy- fuel
Boiler or Gas Turbine
Ash removal / cooler /
condenser / FGD
Steam Turbine
Purification / compression
Steam
Oxygen
Fuel
Power
CO2 (SO2)
CO2 –rich Flue Gas
Air Separation unit (ASU)
Air
Recycled Flue Gas (RFG)
Nitrogen
Conc. Stream of CO2
Vent
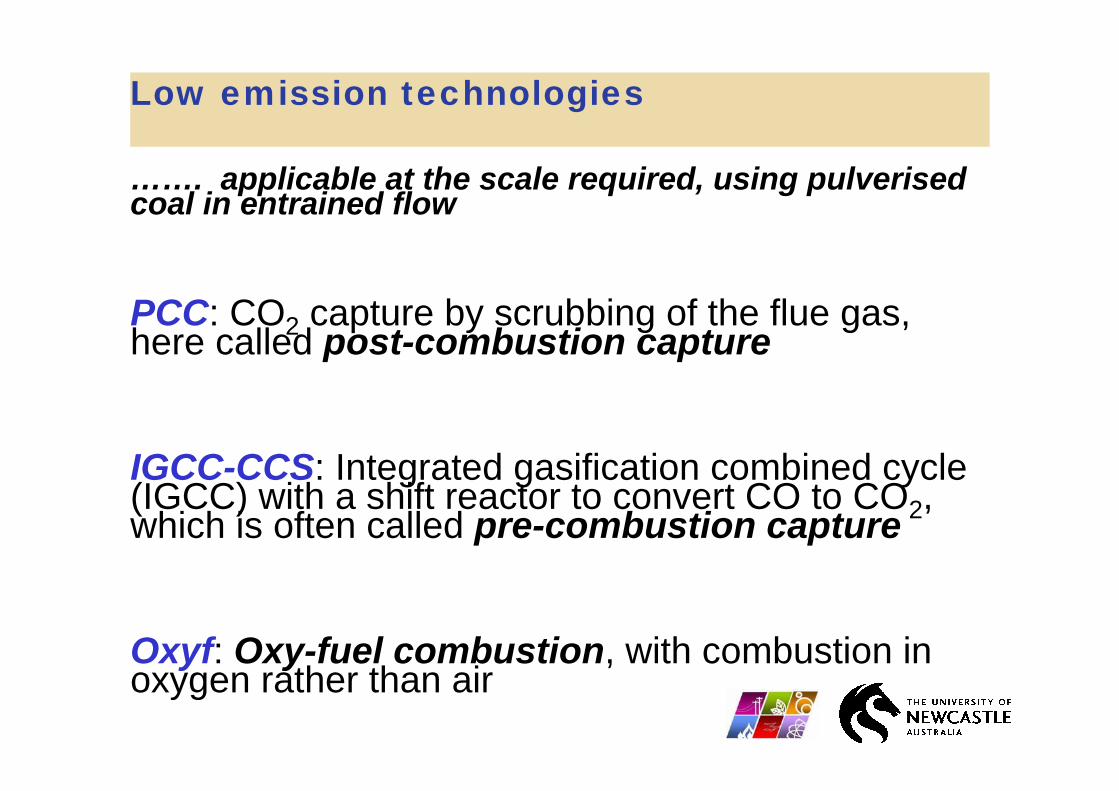
Low emission technologies
……. applicable at the scale required, using pulverisedcoal in entrained flow
PCC: CO2 capture by scrubbing of the flue gas, here called post-combustion capture
IGCC-CCS: Integrated gasification combined cycle (IGCC) with a shift reactor to convert CO to CO2, which is often called pre-combustion capture
Oxyf: Oxy-fuel combustion, with combustion in oxygen rather than air

Technology comparisons
0
5
10
15
20
25
30
35
40
45
50
PCC
IGCC-CCSslurry
IGCC-CCSdry
Oxyf
Technology
Effic
ienc
y, %
LH
V
“At the current level of development, our analysis indicates that the choice of a specific technology (eg pre-combustion, post-combustion, or oxy-fuel) does not significantly affect the cost of a “reference” large-scale plant, even though the relative shares of capex, opex and fuel costs within the total may vary markedly”.
McKinsey&Company, CCS: Assessing the economics, 2008
Data from IEA studies, 2005-7
With CCS

CCS options, with desirable characteristics indicated X
Demonstrated
XXOxyf
XIGCC-CCS
XXXPCC
Gives H2
No CO2capture
No O2supply *
Can be applied to
slip-stream
For retrofit
Option
* IGCC-CCS can be air fired

Historical development of oxyfuel technology
Pearl Plant 22
ANL/BHP 0.2
ANL/EERC 1.0
IHI 0.5
IFRF / Doosan Babcock 1.0
International Comb 11.7
CANMET 0.1
B&W/AL 0.4
JSIM/NEDO(Oil) 4.0
IVD-Stuttgart 0.2
EON 0.3
Jupiter 6.7
0.2 RWE-NPOWER
ENEL 1.0
B&W 10
Callide A 30
Vattenfall 10
TOTAL(NG)10
Oxy-coal UK 13.3
CIUDEN 6.7CIUDEN 10
Jamestown 50
Vattenfall 250
Youngdong 100
Demonstration with CCS
Industrial scale without CCS
Pilot scale
0
1
10
100
1000
1980 1990 2000 2010 2020Year
MW
e (o
r MW
t/3)

Current demonstrations

Vattenfall flowsheet
ESP FGD COOLER/CONDENSER
COMPRESSION
PURIFICATION
PRECRUSHEDCOAL
Pre-powdered CaCO3
NH3
Cool Primary RecirculationHot Secondary Recirculation
AIR
Liquid CO215-20bar-15-50°C
ASUO2
N2
de-NOx

Callide flowsheet
DUSTREMOVAL
H2OREMOVAL
COMPRESSION
COOLER/CONDENSER
PURIFICATION(H2O, Hg, inerts removed)
PRE-HEATER
OnlineCOALMILL
O2
Liquid CO2
inerts

Demonstration contributions
The Vattenfall 30 MWt pilot plant – this is the first comprehensive project and it involves evaluation of burner operation, with key testing of boiler impacts , emissions and impacts on CO2 compression. The plant also allows evaluation of possible operations such as limestone addition for sulfur capture, and ammonia addition for NOx reduction.
The Callide 30 MWe oxy-fuel demonstration project – will be the first integrated plant, having power generation, carbon capture and CO2 sequestration
The Doosan Babcock Oxy-coal UK project and B&W USA plants–these demonstrations have comprehensive burner testing, with burner operational envelopes, stability, turndown, start-up and shut-down, with transition between air and oxyfuel firing
The CIUDEN and Jamestown plants- these evaluate CFB oxy-fuel technology, which is suited to coal/biomass cofiring and to direct sulphur removal using sorbents.
The TOTAL, Pearl and Youngdong plants – evaluate the technology in a commercial context

Recently announced oxyfuel project prospects
B&W Black Hills Oxyfuel project, Wyoming, USA
A project has now been submitted to DOE Restructured FutureGen to build a 100MWe oxyfuel plant with CCS as a greenfield plant for the Black Hills Corporation in Wyoming, with the plant commencing in 2015.
Plant simulations for a SC unit have included thermal integration to reduce the efficiency penalty for the ASU and CO2 compression to less than 6%
FORTUM Meri-Pori Oxyfuel Project, Finland
Fortum aims to start a CCS demonstration project jointly with TeollisuudenVoima (TVO) at the Finnish Meri-Pori power plant, a 565MW plant. Due to lack of suitable storage locations in Finland, the CO2 from Meri-Pori will be shipped abroad.
ENEL Oxyfuel CCS2 Demonstration, Italy
The project goal of the CCS2 project is to build by 2012 a 50MWe zero emission coal fired power plant based on a pressurized oxy-combustion technology which has been developed at pilot scale.

Pathway to implementation

Oxyfuel technology implementation pathway
Implementation should be progressed at several levels:
1. Retrofit to existing units – generally as the 1st phase of implementation
2. Construction of new plants - generally as the 2nd phase of implementation, with application of new burners
3. 2nd generation oxyfuel plants could involve higher levels of thermal integration, new furnace designs, optimised gas cleaning ……
4. Parallel development of more efficient and lower cost oxygen plants – will be a key factor in the success of oxyfuel technology
5. Development of CO2 storage regulations, CO2 transport infrastructure and proving up of large CO2 storage reservoirs –necessary to underpin large projects

Oxy-fuel combustion – Underpinning science

B. J. P. Buhre et al, Oxy-Fuel Combustion Technology For Coal-Fired Power Generation, Prog. Energy Comb. Sci. 31 (2005) 283-307
T. F. Wall, Combustion processes for carbon capture, Proceedings of The Combustion Institute, 31, 31-47, 2007
Terry Wall et al, An overview on oxyfuel coal combustion—state of the art research and technology development, Chemical Engineering Research and Development, in press, 2009
Boiler or Gas Turbine
Ash removal / cooler /
condenser / FGD
Steam T bi
Purification / compression
Steam
Oxygen
Fuel
Power
CO2
CO2 –rich Flue Gas
Air Separation unit (ASU)
Air
Recycled Flue Gas (RFG)
Nitrogen
Conc. Stream of CO2
Vent
……. and detailed here by comparison with air firing
Recycled flue gas

Gas property ratios for CO2 and N2 at 1200 KProperties from Shaddix, 2006
Impact for air to oxyfuel retrofitHigher O2 thru burner
Lower burner velocity, higher coal residence time in furnace
Slower flame propagation velocity
Property/ratio Gas property differences

Emissivity
AIR FIRED OXYFUEL

Oxy-fuel: differences of combustion in O2/CO2compared to air firing
•To attain a similar AFT the O2 proportion of the gases through the burner is 30%
•The high proportions of CO2 and H2O in the furnace gases result in higher gas emissivities
•The volume of gases flowing through the furnace is reduced
•The volume of flue gas (after recycling) is reduced by about 80%.
•Recycle gases have higher concentrations in the furnace

Oxy-fuel: furnace heat transfer comparisons, 30 MWe, with predicted absorbed wall heat flux, by cfd
Air firing Oxy-firing, with different O2 proportions thru’ the burners, wet recycle
30% O2 - AFT basis
26%O2 – HT basis
IHI, personal communication, 2005

Oxy-fuel: Triatomic gas (H2O+CO2) emissivity ~ beam length comparisons
Gupta et al (2006)
0
0.2
0.4
0.6
0.8
1
0 10 20 30 40 50 60 70 80 90
Beam Length (L) (m)
Gas
Em
issi
vity
(-)
Oxy-fuel fired furnace
Air fired furnace
30 500 1050 MWe

0.2
0.3
0.4
0.5
0.6
0.7
0.8
0 10 20 30 40 50 60Beam length (L) (m)
Emis
sivi
ty (-
)
4 grey gas model, Gupta et al, (2006)
3 grey gas model, Smith et al, (1982)
Oxy-fuel fired furnace
Oxy-fuel: CFD radiative transfer inputs
]1[)( )(
0,
22 Lppk
ii
OHCOieTa +−
=
−= ∑ εε

Emissivity in oxy-wet combustion
0.0
0.2
0.4
0.6
0.8
1.0
0 5 10 15 20
Pathlength, m
Emis
sivi
ty
Leckner72
Smith1982
Hottel's charts
Sameer08
1600K 1atm
Pw+Pc=0.96
But gas emissivity predictions are uncertain for large oxy-fired furnaces
Hottelchart limit
Wide band model basis -Edwards
Narrow band model basis -Leckner

Oxyfuel: Pilot-scale measurements for oxy-fuel when furnace heat transfer is matched
Yamada et al (2006)
Flame
FEGT
Air
Oxy

Oxy-fuel: Combustion developments, ignition, burner operation, burner and furnace development
Pilot-scale tests reveal flame ignition is delayed in oxyfuelenvironments
Suda et al (2006) report measured laminar pf flame propagation velocities in O2/CO2 to be 1/3 ~ 1/5 of those in air
Shaddix (2006) has quantified differences in ignition and devolatilisationtimes in O2/N2 and O2/CO2
0
2
4
6
8
10
12
14
N2_12 N2_24 N2_36 CO2_12 CO2_24 CO2_36
τi (m
s)
0
2
4
6
8
10
12
14
N2_12 N2_24 N2_36 CO2_12 CO2_24 CO2_36
τd (
ms)
O2/N2O2/CO2
% O2
12 24 36 12 24 36
Devolatilisation
Ignition time

Fixed velocity
27 % v/v fixed for same HT
Fixed for same HT
Therefore secondary RFG reduced
~3% v/v
Burner
Burner flow comparisons for a retrofit
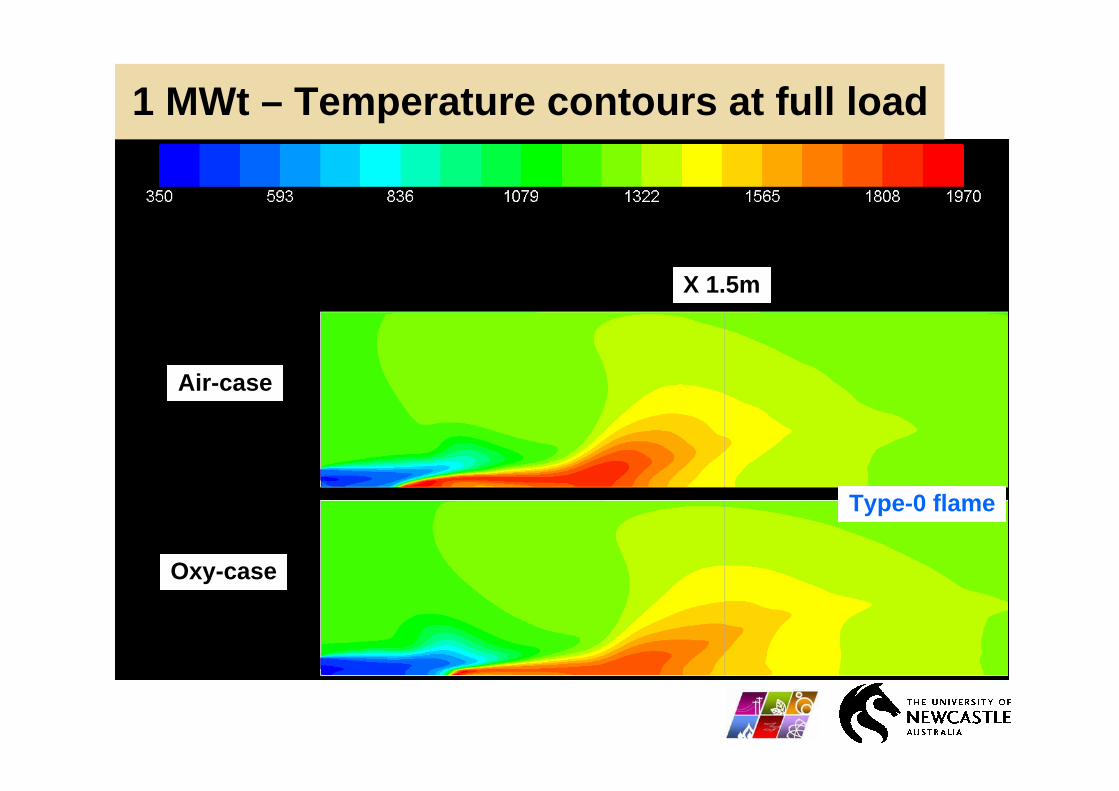
Air-case
X 1.5m
Type-0 flame
Oxy-case
1 MWt – Temperature contours at full load

Air case
Oxy case
w/ m2
w/ m2
Burner wall
Side wall-1
Side wall-2
Oppositewall
30 MWe Heat flux contours

Summary plot relating gas emissivity changes to burner oxygen ……
1.2
1.4
1.6
1.8
2.0
0.20 0.25 0.30 0.35 0.40Oxygen fraction at burner inlet (-)
Rat
io o
f gas
em
issi
vity
(oxy
to a
ir)
425 MWe
30 MWe
30 MWe
425 MWe
1.2 MWt
1.2 MWt
wet recycle dry recycle
0
0.2
0.4
0.6
0.8
1
0 10 20 30 40 50 60 70 80 90
Beam Length (L) (m)
Gas
Em
issi
vity
(-)

Illustrative differences in air and oxyfuel which influence burnout
For matched furnace heat transfer:
Oxyfuel has longer furnace residence time, ~20%
Oxyfuel has lower temperatures, ~ 50 oC
In oxyfuel, coal experiences an environment with higher O2
Good
Bad
Good

Pyrolysis and oxidation reactivities of Coal A & Coal B in heating TGA experiments
0
0.02
0.04
0.06
0.08
0.1
0.12
0 200 400 600 800 1000 1200Temperature (oC)
Rea
ctiv
ity (m
in-1
)
Coal A N2Coal A CO2Coal A AirCoal A OxyCoal B N2Coal B CO2Coal B AirCoal B Oxy
Coal BOxidation
Coal AOxidation
Coal APyrolysis
Coal BPyrolysis

Volatile yields in DTF at 1400 oC
….. Estimated by pyrolysis in N2 and CO2
2.181.491.79Q factor (CO2)
66.232.243.3V* (CO2)
1.761.431.52Q factor (N2)
53.530.936.7V* (N2)Coal DCoal CCoal B
V* - Volatile yield at 1400 oCQ factor – Ratio of V* and volatile yield obtained by proximate analysis

Char burnout in DTF taking V*(N2) to estimate char yield
40
50
60
70
80
90
100
0 0.05 0.1 0.15 0.2 0.25 0.3 0.35Oxygen concentration (atm)
Cha
r bur
nout
daf
bas
is (%
)
AirOxy
Coal B

Char reactivity comparison for air and oxyfuelconditions at the same O2 level
1/Tp (K-1)
Low temperatures Reaction kinetics controlled (Regime I)
Moderately high temperatures Reaction kinetics & internal diffusion limited (Regime II)
Very high temperatures Bulk diffusion controlled (Regime III)
Oxy-fuel (O2/CO2) combustion
Air (O2/N2) combustion
Rea
ctio
n ra
te

Oxyfuel: Pilot-scale emission comparisons for three coals
Yamada et al (2006)
NOx, mg/MJ
SO2, mg/MJ
SO3, ppm
Air
Oxy
Parity

Oxyfuel: Simulation of recycled CO2 and NO and fuel-N conversion to NO – the “system” effect
Okazaki and Ando (1997)
Con
vers
ion
of fu
el-N
to N
O, %
10
20
30 Thermal NO reduction
Reburning NO reduction
Char-N ~ NO reaction redn

Roadmap development

Scales for deployment
Laboratory Scale:
Research that investigates and aims to discover fundamental relationships or test new ideas through experiments and measurements at a small scale.
Pilot Scale
Research undertaken to optimise processes and provide design, process and cost related scale-up rules for application at commercial scale.
Pre-Commercial Demonstration
First-of-a-Kind (FOAK) plant deployed at Commercial or near Commercial scale where design, process and cost models can be validated for future application in commercial markets.
Commercial Scale
Deployment that is motivated by commercial investment and operates competitively in a fully commercial market

Pathway and drivers of technological development of oxyfuel combustion technology
R&D
Applied Engineering
Research
Scientific Understanding
Concept development
Laboratory testing
Concept validation
Pilot testing
scaling , commercial understanding,
Demonstration
Commercial Validation
Technical validation
Performance assessment
Commercial deployment
Issue/driver
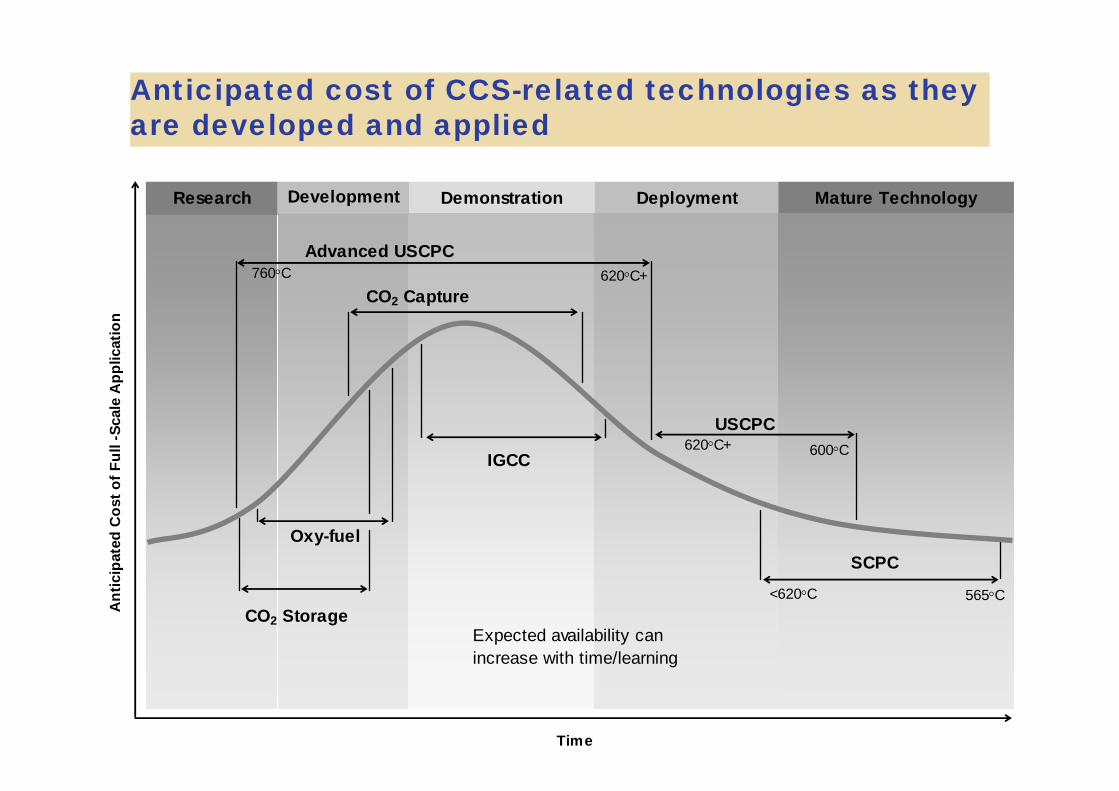
Anticipated cost of CCS-related technologies as they are developed and applied
Research Development Demonstration Deployment Mature Technology
Time
Ant
icip
ated
Cos
t of F
ull -
Scal
e A
pplic
atio
n
CO2 Storage
Oxy-fuel
IGCC
SCPC
USCPC
Advanced USCPC760°C 620°C+
620°C+
<620°C
600°C
565°C
Expected availability can increase with time/learning
CO2 Capture

Indicative CO2 costs to drive development: McKinsey&Company, CCS: Assessing the economics, 2008

IEA and G8 Workshop recommendation
“The G8 must act now to commit by 2010, to a diverse portfolio of at least 20 fully integrated industrial-scale demonstration projects (>1 Mtpa), with the expectation of supporting
technology learning and cost reduction, for the broad deployment of CCS by 2020”.
http://ccsassociation.org.uk/docs/2007/Press release on G8 workshop 29 Nov 2007.pdf

Project components and sequence: Low emission coal power plant with geosequestration, based on a 500MW plant, time halved for 50 MW demonstration
Storage site and injection licence
confirmed
Financial close, construction and commissioning - 95%
Phase 33-4
Environmental impact statement. Permitting
process and times very location dependant
Site validation and feasibility- <$250M
Feasibility and FEED (Front-End Engineering and Design) -
5%
Phase 22-3
Access to land, exploration licence
Basin scoping, exploration and
appraisal-<$100M
Concept, pre-feasibility and site selection – cost 1% of PP
project
Phase 11-2
PermittingCO2 disposal geology
Power plant, PPTime, yrs
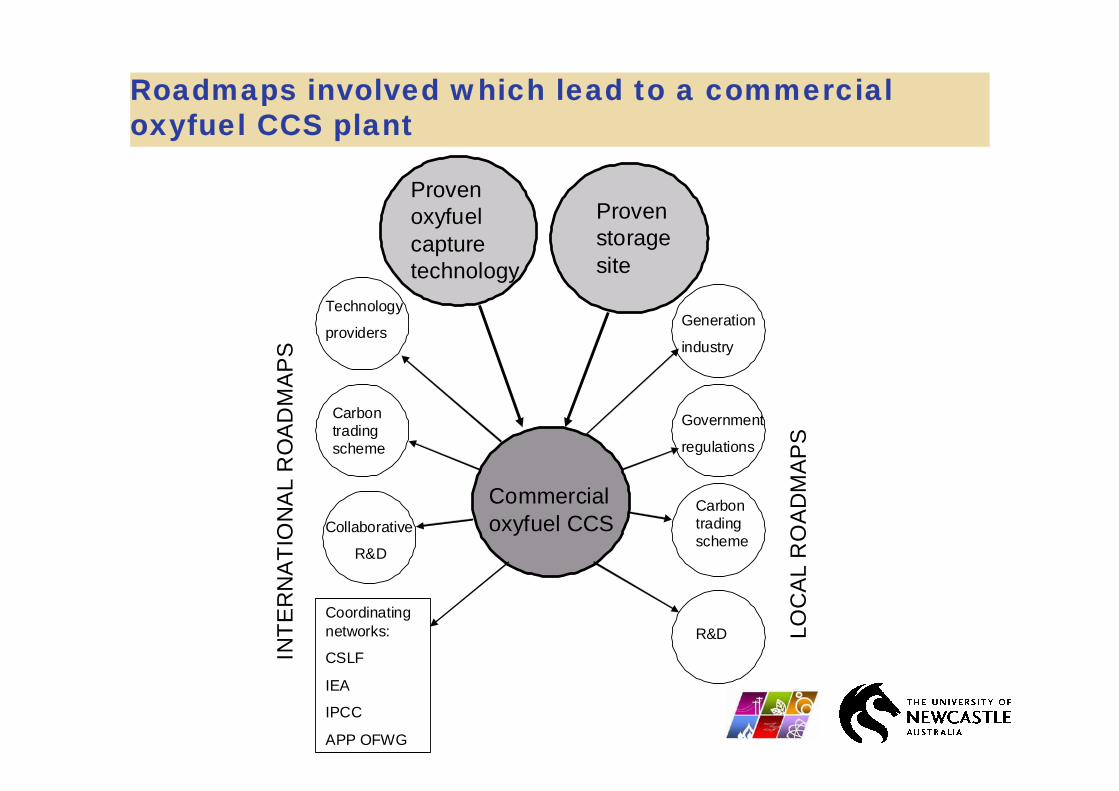
Roadmaps involved which lead to a commercial oxyfuel CCS plant
Commercial oxyfuel CCS
LOC
AL
RO
AD
MA
PS
INTE
RN
ATI
ON
AL
RO
AD
MA
PS
Generation
industry
Government
regulations
Carbon trading scheme
R&D
Technology
providers
Carbon trading scheme
Coordinating networks:
CSLF
IEA
IPCC
APP OFWG
Collaborative
R&D
Proven oxyfuelcapture technology
Proven storage site
Roadmaps in the literature
Canada’s CO2 Capture and Storage Technology Roadmap
(www.co2trm.gc.ca)
CURC/EPRI Roadmap
(http://www.coal.org/UserFiles/File/Roadmap.pdf)
“Clean Coal Technology Roadmap”, CURC/EPRI/DOE Consensus Roadmap
(http://www.netl.doe.gov/technologies/coalpower/cctc/ccpi/pubs/CCT-Roadmap.pdf)
UK Energy Research Centre, CO2 Capture and Storage Roadmap
(http://ukerc.rl.ac.uk/Roadmaps/CarbonCapture/CCS_road_map_workshop_Aug08.pdf)
Cleaner power in India: Towards a Clean-Coal Technology Roadmap, pp173-193
(http://belfercenter.ksg.harvard.edu/files/Chikkatur_Sagar_India_Coal_Roadmap.pdf)
IEA Greenhouse Gas R&D Programme: Review of CO2 capture technology roadmap for power Generation industry
(http://www.ieagreen.org.uk/presentations/SSRoadmap.pdf)
Australia’s CCS Technology Roadmap
(http://www.cslforum.org/documents/SaudiArabia/T2_3_CSLF_PJC_DVP_Australia_Jan08.pdf

CCS roadmap for US (Parkes, Maxson et al. 2008) (Novak 2007)

Times of targets and milestones
Related deployment targetsBy 2020 - Improved efficiency of PF plants by more severe steam conditions, such that efficiencies for oxyfuel with capture reaches 42-44% HHV, similar to PCC and IGCC
By 2022 – Commercial availability of CO2 storage, with new coal plants capture and storing 90% of CO2
By 2030 – Further improvement in efficiencies with CCS, > 45% HHV
Related regulatory milestonesBy 2014 – Regulatory framework established to allow permitting process toproceed for demonstrations to be operating by 2020
Related research milestonesBy 2014 – Gas cleaning technology to meet regulatory requirements for CO2 transport and storage
After 2016 – Alternative oxygen supply technology to ASU such as membranes and chemical looping demonstrated at scale
After 2020 – Second generation oxyfuel plant applied using learnings from first generation demonstrations

Simplified roadmap to deployment of first-generation oxyfuel technology – to be developed further
2010 2015 2020 2025
- Partial demonstration, without CCS or power generation
- Integrated demonstration
- Integrated and CCS>1Mtpa
First generation technology Second generation
Research- Pilot-scale testing and gas cleaning
-O2 supply - Thermal integration
Regulation- Gas quality, transport and storage
PF USC efficiency target, with CCS, %HHV 40-42% >45%
Oxy
-fuel
tech
nolo
gy
deve
lopm
ent
Effi
cien
cy
mile
ston
es

Fully integrated industrial-scale demonstration projects by 2020?
Pearl Plant 22
ANL/BHP 0.2
ANL/EERC 1.0
IHI 0.5
IFRF / Doosan Babcock 1.0
International Comb 11.7
CANMET 0.1
B&W/AL 0.4
JSIM/NEDO(Oil) 4.0
IVD-Stuttgart 0.2
EON 0.3
Jupiter 6.7
0.2 RWE-NPOWER
ENEL 1.0
B&W 10
Callide A 30
Vattenfall 10
TOTAL(NG)10
Oxy-coal UK 13.3
CIUDEN 6.7CIUDEN 10
Jamestown 50
Vattenfall 250
Youngdong 100
Demonstration with CCS
Industrial scale without CCS
Pilot scale
0
1
10
100
1000
1980 1990 2000 2010 2020Year
MW
e (o
r MW
t/3)
?

Final comments
Oxy-fuel technology is on the path through a development and demonstration phase
….. With 2020 the target for early commercialisation
….. Requiring earlier fully integrated industrial-scale demonstration projects
Current and emerging first generation demonstrations – for retrofits and new plant - will drive future research and technology developments
Second generation technologies – for new plant – will have lower energy penalties and capital costs