Coach
58
Tech Investment Research Group 1 Analysis of Coach Inc. Tech Investment Research Group April 28, 2005 Chris Cotten [email protected] Jordan Butts Heather Stevens Ryan Kosarak Matt March
-
Upload
nisa-bo-lin -
Category
Documents
-
view
68 -
download
0
Transcript of Coach

Tech Investment Research Group
1
Analysis of Coach Inc.
Tech Investment Research Group
April 28, 2005
Chris Cotten
[email protected] Butts
Heather Stevens Ryan Kosarak Matt March

Tech Investment Research Group
2
Table of Contents
Executive Summary 2 Company & Industry Overview 5 Five Forces Model 6 Key Success Factors 9 Competitive Strategy Analysis 12 Accounting Analysis 14 Financial Ratio Analysis 23 Forecasting Methods 33 Valuations 36 Method of Comparables 38 Discounted Cash Flows 39 Residual Income Model 40 Abnormal Earnings Growth 41 Results of Valuations 42 Altman’s Z-Score 43 Final Thoughts on Coach 44 Appendix 45 Resources 58

Tech Investment Research Group
3
Coach Executive Summary
Investment Recommendation : Buy Date of Valuation : April 1, 2005
Exchange: NYSE Symbol: COH EPS ForecastPrice Per Share $55.58 FYE 2004(A) 2005 2006 200752 Week Price Range $35.98 - $59.96 EPS $1.42 $1.96 $2.03 $2.20Revenue (2004) 1.53BMarket Cap 10.45B Valuation Ratio Comparison
Coach IndustryShares Outstanding 189,600,000 Trailing P/E 32.95 15.42
Forward P/E 24.41 14.94Dividend Yield NA Forward PEG 1.31 1.323m Avg Trading Volume 2,459,000 P/B 10.77 2.54% Institutional Ownership 42.67%
Valuation EstimatesBVPS 5.17 Actual Price (April 1, 2005) $55.58
ROE 42.61% Ratio Based ValuationsROA 32.49%Est. 5 year EPS Growth 19.50% P/E Trailing $25.91
P/E Forward $33.77Cost of Capital Estimations M/B $13.15
Beta R^2 Ke PEG Forward $48.15Ke Estimate 7.00% Ford Epic Valuation $54.05Beta Since Oct 04 1.23 17.32% 7.00%3 Year Beta 0.0958 9.02% 3.57% Intrinsic Valuations2 Year Beta 0.0493 0.02% 3.41%Published Beta 1.3 Discounted Cash Flows $60.56
Residual Income $63.78Kd 3.27% Abnormal earnings Growth $63.03WACC BT 6.11% Long Run Residual Income $55.76

Tech Investment Research Group
4
Executive Summary
Recommendation: BUY
Tech Investment Research Group is announcing their coverage of
Coach Inc. After reviewing all aspects of the firm we have decided to give
Coach a BUY rating with high future predictability and a price target of $64 at
year end.
Industry Success
Coach is in the Luxury apparel and accessories industry and considers
themselves a small company with large scales. The apparel and accessories
industry has seen weak returns over the industry as a whole. Coach however
has experienced extreme success over the past several years and seems to
have found a niche in the highly competitive market. Coach has recorded
very high profit margins and has emerged as a leader in the industry. Coach
has achieved these results by selling high end quality products and
establishing a well respected and solid brand image.
Marketing Strategy
Much of Coach’s success comes from their successful marketing
strategy. Coach has been able to avoid becoming the trendy one hit wonder
company by carefully marketing their products. One thing that Coach
deliberately does not do is market to teenagers or younger people. Coach
feels that if they advertise to this group they endanger themselves of
becoming the trendy or one hot item for a season and they fear that if they
market to younger consumers they could begin to lose their large and loyal
older customer base.

Tech Investment Research Group
5
Financial Position & Growth
Coach’s current financial position is very strong and the company still
has room for further growth. Coach is currently accumulating a sizeable cash
base which they plan to reinvest into the company. Coach also has very little
debt on their balance sheet and almost no long-term debt. As a result of this
Coach has a very favorable current ratio of over 3 and a low debt to equity.
Coach also has industry leading profit and selling margins. Coach has also
been expanding their business in Japan where they have seen increasing
success. Currently Japan accounts for about 20% of all of Coach’s business.
Valuations
Coach’s common stock is currently trading at about $56 and has traded as
high as $59 over the past 12 months. Coach’s fiscal year ends on the Saturday
closest to June 30 and for fiscal year 2005 we estimate EPS of $1.93 and EPS of
$2.06 for 2006.
Investment Risks
Although Coach is currently performing very well for their market,
there are some risks for investing in stocks in the apparel and accessories
industry. Since this industry is known to follow trends one must pay close
attention to current news for the industry and the individual stocks. We
currently believe that Coach provides a great buying opportunity but this
could come to an end if Coach is not able to keep up with changing trends in
the market or they could be hurt by emerging competitors. However, Coach
is showing that they can be dominant in this type of market.

Tech Investment Research Group
6
Company & Industry Overview
Company Profile
Coach, Inc. is a leading designer, producer and marketer of classic
leather goods, accessories and furniture which was a spin off of Sara Lee in the
mid 1980’s These products include handbags, men’s and women’s
accessories, business cases, leather outerwear, gloves, scarves, travel
accessories, and personal planning products. Coach also sells home and
office furniture, footwear and watches with its licensing partners. The
products are sold through direct mail catalogs, on-line store, e-commerce
websites, 174 retail stores and its 76 factory stores. Coach focuses on
continuous improvements and anticipating the needs of consumer’s lifestyles
to maintain its stronghold of the market. Key success factors for Coach as a
manufacturer include product quality as well as marketing and design. Coach
has an exceptionally large and loyal customer base mostly due in part to
product quality. Coach takes great pride in using skilled employees, quality
natural materials, exceptional leathers, and only the finest hardware. Through
the years Coach has earned a reputation for producing a product that is
known for its durability, craftsmanship, and incomparable product quality. In
2004 Coach added 19 new stores alone. Coach has become one of the most
well recognized brands in the United States and is rapidly gaining recognition
internationally, especially in Japan.

Tech Investment Research Group
7
Industry Profile
The Apparel and Accessories Industry is very competitive because
companies must find a way to constantly year after year capture market share
in a market that is constantly changing to fit consumers taste. Many of the
company’s that enter this market fail because they come out with a very
popular style for their product on year then they rapidly expand only to have
their product fall quickly out of style. The ability to keep up with changes in
fashion trends and find a niche in the market usually determines which
companies can survive in this highly competitive market.
Five Forces Model
Competitive Force 1: Current Competitors
Currently there are very few competitors for Coach and no major
competitors of their size. Coach currently has a market cap of $10.6B or just
over 22% of the entire Apparel and Accessories Industry.
Coach has done an excellent job of establishing their brand to
consumers. This has enabled Coach to constantly attract new customers while
retaining current customers year after year. Also, unlike its competitors has
been able to drive their sales on rising prices which says that consumers are
generally not concerned with the price of their products but more on product
quality. This is why some of the lower priced brands like Dooney & Bourke
have had little effect on Coach as a direct competitor.
Coach has recently decided to keep their current prices ($229 average
handbag price) after high-priced competitor Louie Vuitton raised prices 5%.

Tech Investment Research Group
8
This increases the spread between Coach and their competitors which gives
Coach more range in the “affordable luxury” segment.
Competitive Force 2: Threat of New Entrants
New entrants into the Apparel/Accessories industry pose an average
risk to a company like Coach. Since brand image in this industry is very
important, companies that have established themselves as leading brand
have a distinct advantage over new companies.
Coach has an even better advantage over new entrants into the
“affordable luxury” because of the higher price range. This is true because
when making expensive purchases people tend to stay with what they know
and trust and are less likely to purchase a product they are unfamiliar with.
Coach also has been able to hold off new entrants because of their
marketing strategy. Coach markets to older consumers and deliberately does
not market to younger consumers because when this happens the older
customers will start moving away from the product if they believe that the
brand has become too trendy to young people. Coach also avoids having the
one hot item or trying to figure out the new trend for teens which is what many
new entrants attempt to provide only to have the product fall out of favor the
next year.
By keeping their strategy of a constant line of quality products
marketed to their more mature core group of customers we believe that
Coach will remain popular and will also continue to strive in their market and
separate themselves from new entrants.

Tech Investment Research Group
9
Competitive Force 3: Threat of Substitute Products
The threat of substitute products to a company such as Coach is
relatively high depending on how you look at the situation at Coach.
There are two types of substitute products that could pose a threat to the
company: alternant brands and counterfeits. As stated earlier, brand name
and product quality are what drive sales in the Apparel/Accessories industry
which is why currently Coach is not threatened by other brand names.
However, a few quarters of lousy product offerings or poor quality products
can drive down the brand equity that Coach has created and alternant brands
could benefit which would cause problems for the company.
The second substitute product that could cause a problem for Coach is
counterfeit products. Coach works very hard to minimize the amount of
counterfeits in the market place by prosecuting individuals that make the
products and they also provide an online form so customers can report
counterfeits if they are found. These products are usually of poor quality and
are manufactured in a way that violates decent labor standards such as child
labor. Coach is very adamant about stopping counterfeiting because they can
reduce sales and brand equity that in turn are detrimental to the company.
Competitive Force 4: Bargaining Power of Buyers
The effect of Coach’s customers bargaining power on the company is
relatively low. Their price sensitivity is low due to the fact that their
customers buy specifically their products because of the brand image that
Coach possesses, the quality of the products and the popular styling of the
products. This has been proven to be true in the past because of Coach’s

Tech Investment Research Group
10
ability to increase sales and customer base while raising prices at the same
time; something that hardly any of their competitors have been able to
accomplish. Coach’s customers also have a low relative bargaining power
because they offer many different products at different prices to a very large,
expanding customer base whose purchase volume is usually very small.
Coach customers do have a few choices when it comes to alternative products
but Coach’s popularity and continued success keep the customers loyal to
their products.
Competitive Force 5: Bargaining Power of Suppliers
A very big positive advantage for Coach is that not only do their
customers have minimal bargaining power but their suppliers also have
limited power at the negotiating table. Coach’s main material used in
manufacture is leather, which can be bought from many different suppliers
around the world which gives the company options when purchasing raw
materials. Coach also buys manufactured products independently from
different countries including China, Costa Rica, Mexico, India, Italy, Spain,
Hungary and Turkey. Because of the large amount of goods Coach buys from
different suppliers they have the ability to negotiate prices with several
different suppliers.
Key Success Factors
Brand Image
The coach brand is one of the most recognized handbag and accessory
brands in the World. Coach is committed to leading the fine accessories
market by designing and producing the finest quality of accessories including

Tech Investment Research Group
11
handbags, luggage, travel accessories, wallets, outerwear, eyewear, gloves,
scarves, and fine jewelry for both men and women. Using a multi-channel
distribution strategy Coach is presently able to have 200 stores in the United
States alone with locations in eighteen countries outside the United States, as
well as a full colored catalogue and an online store at www.coach.com.
Distribution
Coach currently uses a multi-channel distribution strategy. The
products are sold through direct mail catalogs, on-line store, e-commerce
websites, 200 retail stores and its 76 factory stores. The catalog has had
increasingly popularity and has been an important advertising and sales tool
for Coach, both domestically and abroad. In addition, Coach launched its
online store at www.coach.com. Coach has also spread to various retailers
and departments stores to increase sales. To improve and market the brand,
boutiques have been set up in the department stores. Through this
distribution strategy and advertising campaign Coach has become one of the
most well recognized brands in the United States and is rapidly gaining
recognition internationally, especially in Japan.
Foreign Markets
Coach is, “America’s number one accessible luxury accessories brand,
and the fastest growing imported handbag and accessory brand in Japan.”
Without marketing and design it would not be possible for Coach to receive
such distinguished titles. In 2004 marketing and design costs reached 63.5

Tech Investment Research Group
12
million. As a result Coach was able to penetrate new markets such as Japan
and strengthen there position in existing ones. Coach recently announced the
next phase of its growth strategy Japan. It involves capitalization on the
significant growth opportunity that exists with the domestic Japanese
consumers. The company expects sales to more than double during the next
four years to over 80 billion yen by 2009. Furthermore, Coach announced that
it is strengthening its leadership team at Coach Japan, or CJI, later this spring.
Coach will also add two executives who will be responsible for all Coach
retail and factory store strategy and operations. In addition, CJI will shortly
be announcing the appointment of its first Executive Vice President and Chief
Operating Officer, a new position for the company. The Chief Operating
Officer will spearhead logistics initiatives as well as oversee administrative,
finance and information technology functions.
Product Lines & Expansion
Coach, Inc. has consistently fashioned their product line to coexist with
the newest styles and seasons. This Spring Coach is introducing a new
“scribble line” that consists of a poly cotton material and bright colors. These
new products were tested at fifteen stores and were “enormously well
received”, says CEO Lew Frankfort. Coach Inc. is expecting to increase sales
in February thanks to the new “scribble line” and Valentine’s Day.
In an effort to keep up with the broadening competition Coach, Inc. has
is planning to add up to nine more stores in the United States along with two
more in Japan. Coach Inc. sales have been helped by the recent innovative
accessories such as the PDA leather holder.

Tech Investment Research Group
13
Competitive Strategy Analysis
The retail industry is prone to constant changing market trends and
consumer preferences. When selling an existing product to a new market
creativity is the most important factor. That is why in April 2004 Coach hired a
new designer to spruce up its image with fun designs so Coach could continue
to compete in the fast pace industry. Coach piloted each new style in a select
retail store to develop feedback on the new designs. Then, before the styles
were launched they evaluated each ones success in the different stores and
made changes based on the extensive evaluations. Coach’s revamped image
was a success and doubled their sales in a market with slow growth
opportunities.
Impartial customer feedback is the key to spotting changes in trends
before competition. Coach conducts over 10,000 customer interviews a year,
and their extensive study and use of the information gained from the customer
feedback is the
reason why Coach was able to gain market share and change their image.
Back in 2000 Coach selected digital Impact, an internet direct marketing (e-
marketing) firm, to conduct their business services in order to better
communicate with customers. Digital Impact helped Coach gain a better
competitive advantage through mass personalization and conforming to the
unique individual interests of its customers.
Brand identification is another important success factor for Coach.
Coach originally had a market advantage due to the high demand for the few
classic styles of handbags they offered. However, as the market evolved and

Tech Investment Research Group
14
Coach expanded from handbags to a full life style brand. Coach still continues
to embody the original principles of there classic design in each added
shape, style and material. The traditional hangtag on the side of Coach’s
handbags represents the original style and is distinct and recognizable to
Coach’s craftsmanship.
Coach is the leading retailer of premier leather goods for both men and women in
the United States. Even though Coach’s products are expensive and its competitors are
Gucci, Louis Vuitton, Fendi, and many other prestigious designers, Coach’s brand is well
know and distinguishable by its exceptional quality and classic American style. A solid e-
marketing strategy and brand loyalty has given Coach an upper-hand in the hyper
competitive retail environment.

Tech Investment Research Group
15
Accounting Analysis
In order to gain an understanding of Coach we must first analyze their
overall accounting quality. This includes several different types of qualitative
and quantitative measures and indicators. These measures consist of
examining key policies, accounting flexibility, accounting strategy, potential
red flags and several sales and expense manipulation diagnostics.
1. Key Accounting Policies
The fiscal year for Coach Inc. ends on the Saturday nearest to June 30th
of each year instead of the normal Dec, 31st. This is done in part because a
large majority of Coach’s business comes during the closing months of the
calendar year. The fiscal year ending on July 3, 2004 was a 53 week year
while fiscal years 2003 and 2002 were normal 52 week periods. The extra
week of operations in 2004 provided for an additional $19.5 million in sales.
Coach’s inventories which consist of mainly finished products are
valued using two different methods. All U.S. inventories are valued using the
lower of cost or market (determined by FIFO), while all Japanese inventories
are valued by using the lower of cost or market (determined by LIFO)
method. At the conclusion of fiscal 2004, LIFO inventories were $2,409 higher
and 2003 LIFO inventories were $650 higher that if they were valued using the
FIFO method. LIFO inventory totals for the two years were $34,508 and
$23,484 respectively. Coach also reevaluates its inventories quarterly based
on changes in product demand resulting from changes in consumer
purchasing habits which could affect older merchandise that may have gone
out of favor.

Tech Investment Research Group
16
At the beginning of fiscal 2002 the Coach adopted SFAS No.144
“Accounting for the Impairment or Disposal of Long-Lived Assets”. According
to this rule, Coach examines the carrying value of all its long-lived assets for
possible impairment depending on forecasted profitability and cash flows
from the related business. In 2003 and 2004 Coach recorded no impairment
losses but did write down some assets during their reorganizing in 2002.
Coach records all sales at the point when the goods are delivered to
the consumer or shipped to the wholesaler. Coach estimates which
percentage of these sales will be discounts, returns or considered
uncollectible based on extensive historical patterns and current trends in the
marketplace. Coach also collects royalties from several different sources
consisting of license agreements from other companies that produce goods
that contain the Coach brand name.
2. Assess the Degree of Potential Accounting Flexibility
Since Coach is an apparel/accessories company there are a few areas
under GAAP where they can decide between several different accounting
policies to implement. Coach states that two main areas where they have the
greatest flexibility are accounting for inventories and stock options.
There are two methods that can be used when accounting for stock
options: the intrinsic value method and the fair value method. Coach has
adopted the intrinsic value method in their accounting for stock options.
Under this policy there are no compensation costs for stock options and
replacement stock options issued under the employee stock purchase plan.
However, under the fair value method, the costs that are charged against

Tech Investment Research Group
17
income for amortization of restricted stock units can make quite a difference
towards net income.
Coach also has the ability to choose which inventory method they
would like to use when estimating inventories. Coach has chosen in the U.S.
to use the FIFO method that tends to provide a more conservative estimate of
actual inventories. In their Japanese operations they have decided to use the
LIFO method of estimating inventory which tends to puff up or provide a more
aggressive estimate of inventory value.
3. Evaluate Actual Accounting Strategy
Coach and other companies in their industry tend to have a similar
accounting strategy. Coach spends a large amount of money on selling,
design costs and marketing which account for about 35% of net sales. Coach
also manages their inventory very efficiently by reevaluating their aging
products each quarter in case they need to write down inventories that have
become obsolete.
Coach incurred some reorganization costs in 2002 when they closed
their Lares, Puerto Rico manufacturing facility. Coach closed this facility and
terminated 394 jobs and sold off all of their fixed assets at the facility. Coach
closed the facility to take advantage of lower cost third party manufactures
and recorded reorganization costs of $3,373 for the 2002 fiscal year. This cost
included $2,229 for worker separation costs, $659 for lease terminations and
$485 for the write-down of long lived assets to net realizable value.
Coach has many leases that are for their retail, distribution and office
locations. Many of these leases offer renewal options and are depreciated

Tech Investment Research Group
18
over a straight line basis. Currently Sara Lee is a guarantor on many of
Coach’s current leases throughout the United States. Coach has begun to
make efforts to remove Sara Lee from all of their leases. All of Coach’s new or
renewed leases are independent from Sara Lee and Coach has obtained a
letter of credit equal to Sara Lee’s minimum obligation and must maintain this
letter of credit until minimum payments are less than $2 million dollars
annually which should be for about ten more years. Coach’s facilities in Japan
are leased and the leases include covenants that Coach must comply with and
is something that they have done since the beginning of the leases.
As mentioned earlier, Coach uses the intrinsic method of valuing employee stock
based compensations which include no compensation costs. Coach does a sufficient job
of noting the possible change in EPS data if they would have used the fair value method.
4. Evaluation of the Quality of Disclosure
Coach is superior in the way they disclose financial information to
investors. The details included go far beyond the requirements for GAAP.
The large additional amounts of information describe all aspects of Coach’s
accounting quality and clearly portray the nature of their business activities to
the public.
Coach includes a section in its disclosure that lists the financial
highlights for the year. It is a clear comparison of financial data that shows the
increase/decrease from the previous years allowing investors to gain an
overall grasp of the year’s success.
In Coach’s letter to their shareholders many important elements are
discussed such as sales and the percentage increase in gross margin. It also
Tech Investment Research Group
19
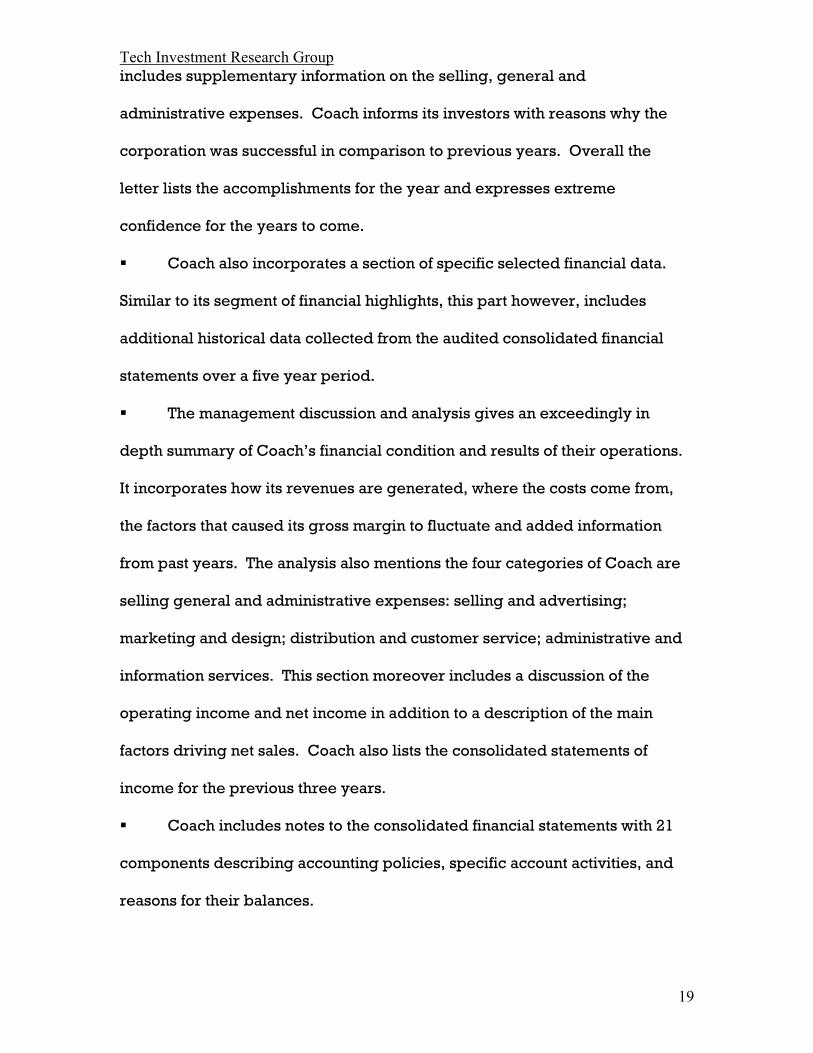
includes supplementary information on the selling, general and
administrative expenses. Coach informs its investors with reasons why the
corporation was successful in comparison to previous years. Overall the
letter lists the accomplishments for the year and expresses extreme
confidence for the years to come.
Coach also incorporates a section of specific selected financial data.
Similar to its segment of financial highlights, this part however, includes
additional historical data collected from the audited consolidated financial
statements over a five year period.
The management discussion and analysis gives an exceedingly in
depth summary of Coach’s financial condition and results of their operations.
It incorporates how its revenues are generated, where the costs come from,
the factors that caused its gross margin to fluctuate and added information
from past years. The analysis also mentions the four categories of Coach are
selling general and administrative expenses: selling and advertising;
marketing and design; distribution and customer service; administrative and
information services. This section moreover includes a discussion of the
operating income and net income in addition to a description of the main
factors driving net sales. Coach also lists the consolidated statements of
income for the previous three years.
Coach includes notes to the consolidated financial statements with 21
components describing accounting policies, specific account activities, and
reasons for their balances.

Tech Investment Research Group
20
Lastly, Coach includes a segment containing information for
stockholders. This section provides general information on owning stock is an
excellent resource of its market divided history.
Coach is extremely informative in its methods of disclosure to the public.
Although the many segments are very long and in-depth the quality of
information displayed is accurate and key to understanding Coach’s business
activities and future expectations.
5. Potential Red Flags
Coach’s financial statements do not reflect many suspect practices.
There was one related party transaction in the past year that could raise a red
flag but the loan was settled and properly disclosed in the notes to financial
statements. Another interesting item we found was the increasingly large gap
between income and cash flows from operations. This probably is not that
suspect since the income has been steadily increasing and it had quite a
significant jump last year. Overall, the company does not put up very many
red flags. Most of their accounting and reporting practices are standard and
do not raise suspicion.
6. Quantitative Measures & Indicators: Explanation
To effectively analyze Coach, quantitative measures and indicators
must be analyzed. By working out several diagnostics on the company’s
financial reports, it is possible to see if they have any flaws in their
accounting. The sales manipulation diagnostics show the behavior of the
sales relative to the cash from sales, inventory, and accounts receivable. The

Tech Investment Research Group
21
core expense manipulation diagnostics show the earnings relative to
expenses.
Sales Manipulation Diagnostics
Year 2004 2003 2002 2001 2000
Net Sales /
Accounts Receivable
23.70 26.874 23.2628 29.1387 34.5406
Net Sales / Inventory 8.159 6.6285 5.2741 5.7102 5.2665
Net Sales / Cash From
Sales
1.044 1.0386 1.045 1.0355 1.0298
Note: There is insignificant information on Coach’s financial statements for other ratios.
The Net Sales / Accounts Receivable is steadily getting smaller,
indicating that people are not buying on a cash basis, or that Coach is not
collecting on their accounts receivable as quickly. However, since the
numbers are still relatively high, Coach shows few bad debts and more
money currently in the budget.
The Net Sales / Inventory is steadily increasing, with the exception of
2002. The relatively low numbers indicate that Coach is holding a big
inventory. However, the rising numbers could be a result of questionable
accounting but after reviewing the statements we believe that this only shows

Tech Investment Research Group
22
efficiency and a lack of over-anticipating sales which also indicates that sales
are growing faster than inventory.
The Net Sales / Cash From Sales would ideally be equal to one, which
Coach is very close to currently and has remained steady over the past five
years. This means that there is little to account for in terms of bad debt.
Core Expense Manipulation Diagnostics
Year 2004 2003 2002 2001 2000
Asset Turnover 1.2843 1.543 1.6329 2.3205 1.8125
Changes in CFFO/OI 1.0009 .9092 .8077 1.2226 1.5166
Accruals / Change in Sales .5696 .3817 .4531 .4189 .5790
Note: There is insignificant information available on Coach’s financial statements to determine a
value for net operating assets, pension expenses, or other employment expenses
Asset Turnover has fairly high numbers which is favorable. However,
the ratios have been decreasing indicating that Coach has a large amount of
money tied up in assets. This could be a potential problem but most of the
money is invested into short term securities that are very liquid.
Changes in CFFO / OI declined from 2000 to 2002 and then steadily
began to steadily increase after completing their restructuring at the end of
2002. This indicates an increase in cash flow from operations.
Total Accruals / Change in Sales is another that has varied over the past
five years. This ratio shows the number of sales made without the exchange of

Tech Investment Research Group
23
inventory and the change in total sales. Coach remains well below 1.0,
indicating quick recognition of sales and related expenses.
After examining all of Coach’s accounting methods we feel very
confident about the quality of Coach’s accounting practices. Coach does a
very good job of explaining which policies they use and disclose the
differences if other accounting methods were employed. Coach also
minimizes potential red flags and also performs well when analyzed using
sales and core expense manipulation diagnostics.

Tech Investment Research Group
24
FINANCIAL RATIO ANALYSIS
In order to properly evaluate a firm’s financial condition and forecast
future performance you have to first gain and understanding of the firms past
financial performance. In this section we will analyze sever key ratios. These
ratios help examine the firms liquidity, profitability, and capital structure. We
will then use these ratios to compare Coach to its competitors in their
industry. We will also forecast Coach’s future performance in the market
place.
Liquidity Analysis
The liquidity ratios make it easier to understand how well a company
meets its current liabilities by analyzing the ability to maintain enough cash on
hand to meet their upcoming debts. The results for Coach have been
improving over the past several years and have become a very liquid
company. Coach has been able recently to build up their current assets while
keeping liabilities at a minimum.
Profitability Analysis
The profitability ratios show how well a company manages its net sales
to convert them into profits. Coach has increased profitability dramatically
over the past several years. Coach has been constantly increasing their gross
profit and net profit margins while achieving a declining operating expense
ratio which is very positive.
Capital Structure Analysis
The capital structure ratios tell how the firm is financing its operations.
Coach’s debt to equity ratio has been gradually declining since their

Tech Investment Research Group
25
restructuring in 2001. Coach is currently comprised of about 75% equity with
most of their debt being short term liabilities. One main reason that Coach
has very little long-term liabilities is because they use operating leases for
most of their store locations.
Industry Competitors
Coach’s main competitors such as Dooney & Bourke, Gucci, Louie
Vitton, and Prada are either privately held or they are traded in foreign
markets. Since we can’t find a direct competitor we have decided to compare
Coach to retailers Ralph Lauren and Liz Claiborne because like Coach, they
offer a more expensive and higher quality product line.
Coach’s ratios compared to that of its competitors are very favorable at
the moment as they have greater liquidity and high selling and profit margins.
Even though Coach is doing very well in the mean time it is expected that
their growth will level off and become more stable. However, if their growth
levels off this does not necessarily mean that Coach will become less efficient
at handling their business.
Current Ratio
0.00
1.00
2.00
3.00
4.00
5.00
2000 2001 2002 2003 2004
YEAR
CR
Coach
Liz Claiborne
Ralph Lauren
Industry

Tech Investment Research Group
26
▪The current ratio of a firm is its ability to cover its current liabilities using
cash flows from its current assets. Coach’s current ratio has previously been
lower than its competition. However, since the middle of 2002 it has
exceeded the competition’s and industry’s current ratio. Since the current
ratio is well over one, Coach can proficiently cover its current liabilities from
the cash gained from its current assets. Having their assets liquid makes it
easier to pay off current liabilities.
Quick Ratio
0.00
0.50
1.00
1.50
2.00
2.50
3.00
2000 2001 2002 2003 2004
YEAR
QR
CoachLiz ClaiborneRalph LaurenIndustry
▪The quick asset ratio examines only highly liquid assets as a percentage of
current liabilities. Coach’s quick asset ratio has exceeded the industry
average since 2002. The quick asset ratio is important because it shows how
much of Coach’s current liabilities can be covered by their quick assets: cash,
accounts receivables, and securities. This solidifies the assumption that coach
can effectively pay off its current liabilities and get cash in case of an
emergency.

Tech Investment Research Group
27
Accounts Recieveable Turnover
0.005.00
10.0015.0020.0025.0030.0035.0040.00
2000 2001 2002 2003 2004
Year
AR
Tur
nove
rCoachLiz ClaibourneRalph LaurenIndustry
▪Over the past five years Coach’s accounts receivable turnover ratio has been
above the industry average considerably. This means they are collecting
their accounts receivable faster than their competitors and industry, which
allows them to reinvest that money more efficiently.
Days Supply of Recieveables
0.0010.0020.0030.0040.0050.0060.0070.00
2000 2001 2002 2003 2004
Year
Day
s Su
pply Coach
Liz ClaibourneRalph LaurenIndustry
▪Coach has maintained well below the industry average in days to receivable.

Tech Investment Research Group
28
Inventory Turnover
0.00
1.00
2.00
3.00
4.00
5.00
6.00
2000 2001 2002 2003 2004
YEAR
Inve
ntor
y Tu
rnov
erCoach
Liz Claiborne
Ralph Lauren
Industry
▪Inventory turnover is a useful ratio in analyzing a firm’s capital management.
This ratio shows how many days it takes for inventory to complete a cycle,
from buying inventory until it leaves the balance sheet. This below average
ratio can be attributed to high acquisitions of assets leaving inventory very
large.
Days Supply of Inventory
0.00
50.00
100.00
150.00
200.00
250.00
2000 2001 2002 2003 2004
YEAR
Day
s
CoachLiz ClaiborneRalph LaurenIndustry
▪Days supply of inventory is determined by the days in a yearly cycle (365)
over the inventory turnover. Since Coach’s inventory turnover is lower than

Tech Investment Research Group
29
the industry average it is no surprise that their days supply of inventory is
higher than the industry average.
Working Capital Turnover
0.001.002.003.004.005.006.007.008.009.00
2000 2001 2002 2003 2004
YEAR
Wor
king
Cap
ital T
urno
ver
CoachLiz ClaiborneRalph LaurenIndustry
▪Working capital turnover is calculated by dividing sales by working capital.
Coach’s working capital average has stayed below the industry and their
competition for the past five years.
Gross Profit Margin
0.00%10.00%20.00%30.00%40.00%50.00%60.00%70.00%80.00%
2000 2001 2002 2003 2004
YEAR
Gro
ss P
rofit
Mar
gin
CoachLiz ClaiborneRalph LaurenIndustry
▪Gross profit margin is determined by two key factors: the price premium that
a firm’s product or service command in the marketplace, the efficiency of a

Tech Investment Research Group
30
firm’s procurement and production process. Coach’s gross profit margin has
steady climbed above and beyond the competitor’s and industry’s average.
This means the company is turning nearly 80% of its sales into gross profit.
The steady increase can be attributed to reducing their cost of goods sold in
relation to their revenue. By having a good profit margin, Coach has been
able to re-invest back into the company to generate future revenues.
Operating Expense Ratio
0.00%
10.00%
20.00%
30.00%
40.00%
50.00%
60.00%
2000 2001 2002 2003 2004
YEAR
O E
Rat
io CoachLiz ClaiborneRalph LaurenIndustry
▪Coach is considerably above the industry average, as well as their main
competitors. This suggests that Coach is not effectively managing its selling,
general, and administrative expenses. This ratio shows how much their
operating expenses are diluting the great sales that they have put together.
Future focus should be directed towards spending less on selling, general,
and administrative expenses in generating each sales dollar.

Tech Investment Research Group
31
Net Profit Margin
0.00%
5.00%
10.00%
15.00%
20.00%
25.00%
2000 2001 2002 2003 2004
YEAR
Net
Pro
fit M
argi
nCoach
Liz Claiborne
Ralph Lauren
Industry
▪Coach’s net profit margin has completely destroyed its competition. This
ratio show that their sales are generating more net income, which leads to the
assumption that less expenses are being used in comparison to sales.
Asset Turnover
0.00
0.50
1.00
1.50
2.00
2.50
3.00
3.50
2000 2001 2002 2003 2004
YEAR
Ass
et T
urno
ver Coach
Liz Claiborne
Ralph Lauren
Industry
▪Asset turnover show how well a company is turning over their assets in
relation to their sales. Inventory management, allocation of goodwill,
accounts receivable policies, and investment in PP&E are all crucial in

Tech Investment Research Group
32
maintaining a desirable asset turnover ratio. Coach has been fairly good in all
of these elements. However, Coach has continued to stay below the industry
average since the beginning of 2002.
Return On Assets
0.00%
5.00%
10.00%
15.00%
20.00%
25.00%
30.00%
2000 2001 2002 2003 2004
YEAR
Ret
urn
On
Ass
ets
Coach
Liz Claiborne
Ralph Lauren
Industry
▪ROA is the largest measure of how much profit a firm is able to generate for
each dollar of assets invested. Coach is well above the industry’s average,
displaying that it is able to generate a higher percentage of profit for each
dollar invested in assets. Their ROA also shows that Coach is using its assets
more efficiently than others in the industry.
Tech Investment Research Group
33
Return On Equity
0.00%
10.00%
20.00%
30.00%
40.00%
50.00%
2000 2001 2002 2003 2004
YEAR
Ret
urn
On
Equi
ty CoachLiz ClaiborneRalph LaurenIndustry
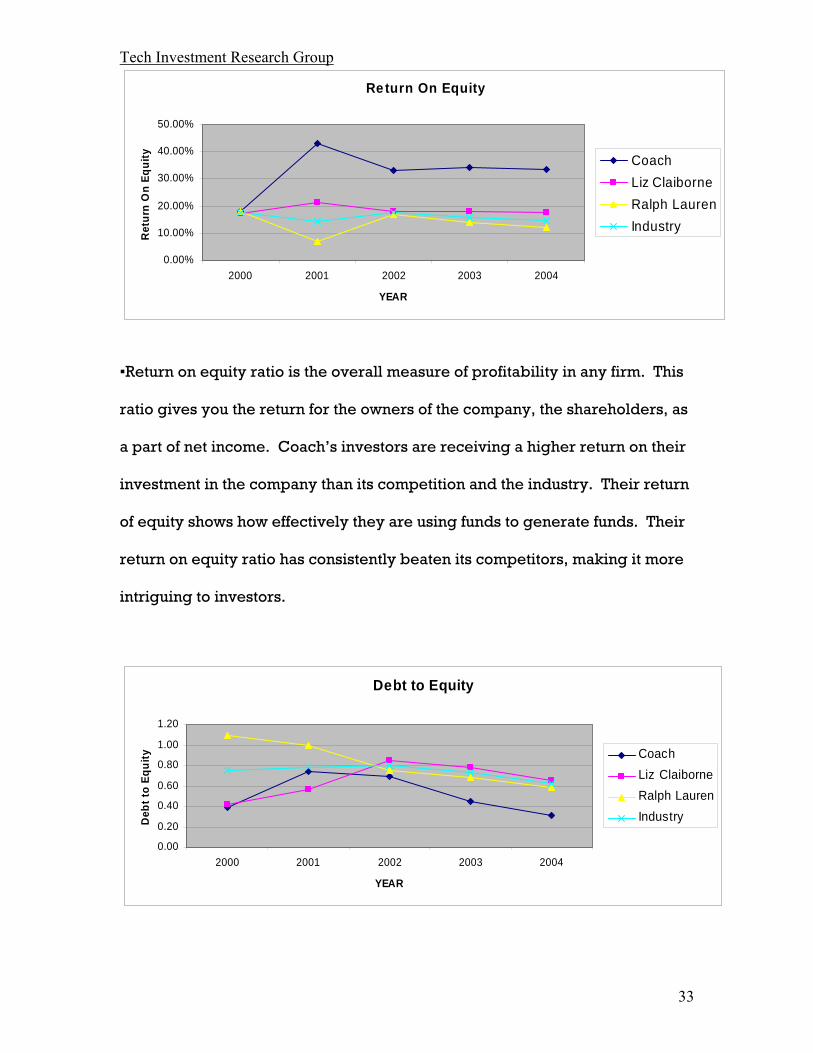
▪Return on equity ratio is the overall measure of profitability in any firm. This
ratio gives you the return for the owners of the company, the shareholders, as
a part of net income. Coach’s investors are receiving a higher return on their
investment in the company than its competition and the industry. Their return
of equity shows how effectively they are using funds to generate funds. Their
return on equity ratio has consistently beaten its competitors, making it more
intriguing to investors.
Debt to Equity
0.00
0.20
0.40
0.60
0.80
1.00
1.20
2000 2001 2002 2003 2004
YEAR
Deb
t to
Equi
ty CoachLiz ClaiborneRalph LaurenIndustry

Tech Investment Research Group
34
▪The Debt to Equity illustrates how much debt a company is carrying
compared to its equity. Since This dropping percentage shows that Coach has
a low credit risk. This gives Coach opportunities to finance other activities
instead of worrying about how they are going to pay off their debt. However,
a low debt to equity ratio can lead to a low sustainable growth rate.
Forecasting Methods
We have also forecast what we believe will be an accurate estimate of
Coach’s future market performance over the next ten years. We have
forecasted the balance sheet, income statement, and the statement of cash
flows. On our statements we had to be careful about forecasting with the use
of the past financial ratios because of the rapid growth that Coach has
experienced over the last several years. On the sales forecast we have
started our estimated future sales growth at 20% and gradually lowered it
down to about 8%, which is much lower than the near 40% sales growth that
Coach has experienced over the past several years. Coach is currently
enjoying a gross margin of 76% and a net profit margin of 22%. We have
forecasted that these ratios will lower to about 60% and 14% over the next ten
years as the company becomes more settled in the market and their growth
levels off. We have also noticed that with Coach’s sales reaching over a
billion dollars in sales last year that their business growth will have to level off
in the near future because these growth rates are near impossible to maintain
over a long period of time. This is in agreement with most financial analysts
but we do not think that Coach’s business will slow faster than we have
estimated over the next two years. We have placed our estimates higher than

Tech Investment Research Group
35
most analysts because of Coach’s history of beating estimates. Coach has out
preformed analyst estimates over the past ten quarters. Coach also has a
current ROE of about 33% which we have lowered to around 22%.
Recently Coach has been investing heavily into short and long term
assets while they are also beginning to accumulate a rather large sum of cash
and many analysts are interested to see what the company will do with the
money. There are several different possibilities for Coach. The most obvious
would be for Coach to begin issuing a cash dividend since that is what their
parent company Sara Lee did but this is currently impossible since Coach’s
revolving credit facility currently prohibits the company from issuing
dividends. In 2001 the board of directors authorized a stock repurchase
program to buy back $80 million of the company’s common stock. In 2003 the
board authorized an additional $100 million towards the program that expires
in 2006. At the end of 2004 the share repurchase program had $65 million left
in the program. Another interesting possibility is that just recently an article
about Tiffany & Co. stated that they could possibly be bought out by another
firm. Coach was main company mentioned in this article as a possible buyer
of Tiffany & Co. which has experienced some management and internal
problems as of late. We believe that this could be a potentially good move for
Coach since Tiffany is in the same industry as Coach and Coach has shown
strong performance as a leading retailer.
We believe that Coach will continue their strong performance in the
market and that the prospects look good for the retailer. Coach’s stock is
currently trading a little high but we believe that due to their strong profit

Tech Investment Research Group
36
margins and accumulating cash pile and possibilities for expansion the stock
will continue to trade higher and see increasing profits.
Valuation of Coach
Valuation Models
In essence our entire report over Coach Bags has been to analyze the
company’s financial statements and to make predictions of future earnings
based on the historical and forecasted data used to predict the firm’s overall
value. We have tried to stay true and honest in our predictions because in
reality so much decision making in corporations relies on what the predictions
say. The purpose of this section of the report is to convert the forecast
predictions into an estimate of the value of our company’s stock. We will then

Tech Investment Research Group
37
compare our calculation of the intrinsic value of the stock to the market price
of the stock to see if it is overvalued or undervalued.
To make a precise valuation of Coach our valuation models took into
account two different time horizons. We have forecasted financial information
over a restricted period of ten years and then considered the terminal value
by making estimates of the firm to infinity. Once these forecasts were made,
we estimated the cost of capital to use as a discount rate for the two different
forecasts. To ensure our estimated value of Coach was precise and free from
error we used many different approaches in the valuation process. This also
allowed us to consider all the external factors that negatively affect forecasted
data.
To apply the various models, we forecasted financial data based on
irregular earnings and book value, in addition to free cash flows. These
particular forecasts were made for a time period that spans the life of the firm.
The non-intrinsic method we used was the Method of Comparables. While the
more intrinsic methods include the Discounted Dividends Model, Discounted
Residual Income, Discounted Free Cash Flows, Long-Term Residual Income
Model, and the Abnormal Earnings Growth Model. The different models
analyze information about Coach and give those analyzing the firm an idea
about how it current market price relates to its estimated price derived from
each of the different models. All preceding discounted models are
discounted using the estimated weighted average cost of capital. When the
models are complete, a sensitivity analysis will be used to test any
discrepancies in our valuation results compared to the market value. The
sensitivity analysis should compare our assumptions made in our valuation

Tech Investment Research Group
38
and the assumptions made by the market and analysts. Depending on the
level of confidence we have in our forecasts and assumptions about the future
business strategy of the firm, we will determine how accurate the valuation
model is. If there is great variation in our valuation of the price and the
market price, we will further examine how the differences transpired. Next,
we will vary the discount rate and growth rate to establish how changes in our
estimates would affect the outcome of our valuation. Then after our
predictions seem truthful and realistic, we will determine if the market value
of our company is overvalued or undervalued. This decision is very important
to analysts, both internal and external, to allow entities to determine the real
value of Coach.
After the valuation models are finished and the exactness of the
estimated value has been considered and looked at more closely, the proper
business strategy decisions can be made. In addition, the evaluation will give
the firm and investors a competitive advantage in influencing the firm in the
right direction for the future. However, the competitive advantage will only
arise if the analysts can determine the basis for the difference in the market
price and the estimated value. Since each model encompasses different
financial data that is forecasted based on certain assumptions about business
strategies, analysts must be cautious in determining what a realistic valuation
of the company is.
Method of Comparables
The Method of Comparables is a non-intrinsic model that is the least
reliable because it takes only the competitions information and neglects all

Tech Investment Research Group
39
firm specific data. This method is especially insignificant to our project
because Coach has outperformed its competition so much in almost every
aspect. Coach’s closest competition is Liz Claiborne, but more than one
competitor is required for the Method of Comparables valuations. The
Method of Comparables is not considered to be one of the most precise
measures, which is seen by the range of values in the table. This range is
caused by a lack of close competitors due to Coach’s superior earnings. The
price to earnings ratio most accurately estimates the actual price of Coach’s
shares. On the other hand, the price to book was the furthest off. The price to
sales multiple depicts a much lower price than Coach’s actual price. All the
competitors have a lower price to sales multiple than Coach. This can be
attributed to them paying out less compared to what they earned. There is no
real intrinsic valuation to these ratios; therefore it fails to support the analysis.
Method Of Comparables Price Trailing P/E Forward P/E P/B P/S
Coach $56.29 32.95 24.41 10.77 7.17
Liz Claibourne $40.08 14.01 11.93 2.41 0.95
Ralph Lauren $38.32 16.16 13.59 2.39 1.24
Tiffany & Co $33.21 16.09 19.31 2.83 2.2
Industry (Excluding Coach) 15.42 14.94 2.54 1.46
Coach Price EPS Forward EPS BPS Sales56.29 1.68 2.26 5.17 7.848
Suggested Price $25.91 $33.77 $13.15 $11.48
Discounted Cash Flow Model
This model uses the weighted average cost of capital (WACC) to
estimate a share price for the firm based on a stream of free cash flows. This
model seems like a fair representation of Coach given the results of the

Tech Investment Research Group
40
industry comparables. The characteristic of the cash flows from operations
and financing is to report these items when the cash moves around rather than
when expenses actually occur or revenues are actually earned. For this
method to reach the estimated share price of $60.56 we estimate that Coach
will need a 3.5% future growth rate. We used a beta of 1.2397 to estimate the
long term WACC of 6.11%, while the short term WACC was estimated at
3.45%. When computing the R-Squared, the beta over the long term better
explains the long term cost of equity of 6.11%. This share price of $60.56 is
about $4.00 over the current market price showing that Coach might be
undervalued.
Sensitivity Analysisg
2.50% 3.50% 4.00% 5.00%WACC 5.00% $67.24 $106.10 $154.67 NA
6.11% $44.63 $60.56 $70.46 126.477.00% $34.62 $42.28 $48.03 68.148.00% $27.29 $31.73 $34.79 $43.95
Residual Income Model
The Residual Income Model is an accounting based model in which we
use data from the past to help determine the values of the firm to see if the
firm is overvalued or undervalued. The Residual Income Model uses the
relationships between earnings per share and the cost of equity to find the
residual income. The residual income is the amount of earnings left over after
stock holders’ cost of equity is met. Next, we took the present value of the
future cash flows and add them together to give us the total present value of
residual income for the ten year forecast. Then we will compute a terminal

Tech Investment Research Group
41
value for the Residual Income Model. To complete this we need to calculate a
perpetuity that is discounted back to the present.
Our Residual Income Valuation Model for Coach had a cost of equity of
6% and with a growth rate of 4% in residual income. We calculated a present
value that is $63.78. The results show that Coach is about $9 undervalued at
these rates and as the growth rate moves closer to 4.5% Coach could
potentially be even more heavily undervalued.
Sensitivity Analysisg
0.035 0.04 0.045 0.05Ke 0.04 $320.30 NA NA NA
0.05 $97.99 $138.61 $260.49 NA0.06 $54.12 $63.78 $79.88 $112.080.07 $35.69 $39.25 $44.24 $51.710.08 $25.70 $27.26 $29.26 $31.92
Abnormal Earnings Growth Valuation
The Abnormal Earnings Growth Model calculates the book value of
equity plus the present valued of expected future abnormal earnings.
Abnormal earnings consists of expected not income less the normalized
income multiplied by the discount rate. Therefore, it applies that if a firm has
no difference in its expected net income and the normalized earnings, then
the amount invested in the stock should not be more than the book value.
Stock is overvalued or undervalued depending on whether a company’s
expected earnings is more or less than the normal income. A low value for
abnormal earnings indicates that a firm shows negative future stock returns,
while a high value for abnormal earnings indicates that a firm shows positive
abnormal future stock returns.

Tech Investment Research Group
42
In our calculation of Coach’s AEG we found that there was an implied
Ke of 7% and once again a growth rate of 4%. This provided us with a share
price of $63.03 or about $7 dollars undervalued.
Sensitivity Analysisg
0.035 0.04 0.045 0.05Ke 0.04 $231.87 NA NA NA
0.05 $109.34 $78.40 $79.40 NA0.06 $82.11 $78.40 $79.40 $88.940.07 $72.04 $63.03 $56.03 $50.430.08 $60.07 $54.15 $49.95 $47.14
Results of Valuations
After performing each of the valuation models you can see that not all of
the models provide a reasonable view of the firm. The method of
comparables was very far off from the results of the other models. We can
conclude that our initial estimate for Coach’s Ke of 7% was relatively accurate
since the implied Ke we found in our valuations was 7% or just a bit lower.
We also found that our growth rate at this Ke is 3.5%-4% which we feel is
appropriate for the Company. The DCF, DRI, and AEG models all seem to be
performing fairly accurately since they all show that Coach is slightly
undervalued. We have also noticed that there are other combinations of Ke
and g that would show that company is even more undervalued. Many other
analysts agree that the stock will continue to climb for some time as Coach has
shown not shown any signs of slowing business.
Currently we are confident that the stock is slightly undervalued but we
believe that further price appreciation will continue due to Coach’s ability to
outperform their industry, maintain higher profit margins and grow their
already accumulating amounts of cash and marketable securities. In addition

Tech Investment Research Group
43
Coach has historically traded at about 34X earnings which would also support
our findings. Coach also just released a report stating that they expect their
Japanese sales to more than double over the next four years to over 80 billion
yen or about 700 million U.S Dollars which gives us further evidence that the
stock price will continue to appreciate.
Z-Score
Z-score=1.2[499,372/1028658]+1.4[430,461]
+3.3[447,657/1,028,658]
+0.6[782,286/246,372]
+1.0[1,321,106/1,028,658]
=7.058
After using Altman’s Method for calculating the Z-Score for Coach, we
found that Coach has a relatively high z-score of 7.058 (see figure above).
Since a value greater than 2.7 is needed for a good credit rating, Coach
demonstrates a high credit rating and reiterates the idea that coach can take
on some debt and not operate with so much on cash on hand. Also, this high
Z-Score indicates that Coach will not face potential trouble regarding
bankruptcy in the future. Coach’s high Z-Score can be attributed to its strong
financial performance throughout the life of their company. In addition, the
availability and cost of financing for Coach is definitely above the
competition.

Tech Investment Research Group
44
Final Thoughts on Coach
Although our valuation of Coach is for April 1, 2005, there have
been recent developments that I believe should be noted and confirm some of
the forecasting that we have done for Coach.
Coach released their third quarter earnings on April 26, 2005 above
analysts’ expectations for the 12th straight quarter. They announced EPS of
$0.23 per share (adjusted for April 15th 2 for 1 stock split) and raised their
estimate for the fourth quarter to $0.23. Coach also said that they expected
sales for FY 2006 to pass $2 billion and EPS of over $1.13 which is over our
forecasted estimates. This positive information could possibly raise our
estimated share price even higher. Coach also announced that they will be
buying the remaining 50% of their Japanese joint venture for $225 million. I
see this as a positive move for the company because they have more than
enough cash on hand for the purchase and the additional earnings from
owning all of their Japanese operations will be shown in 2006 EPS.
This is all positive news for a company that already has lots of momentum
going in the right direction.

Tech Investment Research Group
45
As stated earlier you need to be very careful when investing into this
industry but Coach is beginning to show that they are going to be a company
that is going to be around for a while. They have a very strong management
team, they continue to build their brand image and were added to the S&P 500
in the past year and I believe that Coach will continue their success and be a
good investment for at least the next several years.
Appendix
All of the information on forecasts and evaluations has been recorded in the Appendix.
• Previous and Forecasted Balance Sheets 46 • Previous and Forecasted Income Statements 47 • Common Sized Income Statements 47 • Previous and Forecasted Cash Flow Statements 48 • Ratio Analysis of Coach and Competitors 49 • Cost of Debt Calculation 52 • Computations of WACC & Beta 53 • Valuation Models 54

Tech Investment Research Group
46
COACH FORECASTED BALANCE SHEET (IN THOUSANDS)Year 2000 2001 2002 2003 2004 2005 2006 2007 2008 2009 2010 2011 2012 2013 2014ASSETS Cash and cash equivalents $162 $3,691 $93,962 $229,176 $262,720 $359,536 $494,362 $623,390 $810,408 $976,622 $1,201,245 $1,445,699 $1,734,839 $2,047,109 $2,417,636 Short-term investments $0 $72,388 $90,589 $0 $171,723 $257,585 $378,649 $526,777 $684,810 $797,803 $877,584 $921,463 $974,908 $1,023,653 $1,100,427 Trade accounts receivable, less $15,567 $20,608 $30,925 $35,470 $55,724 $117,578 $128,969 $159,577 $169,052 $203,329 $226,385 $242,232 $258,704 $275,520 $304,582 allowances of $5,456 and $6,095, respectively Inventories $102,097 $105,162 $136,404 $143,807 $161,913 $205,180 $273,414 $335,113 $397,770 $486,465 $530,873 $593,469 $633,825 $662,437 $699,016 Deferred income taxes $8,996 $13,921 $14,123 $21,264 $34,521 $42,116 $52,645 $66,859 $80,230 $100,288 $125,360 $150,432 $180,518 $216,622 $259,946 Prepaid expenses and other current assets $6,866 $8,185 $12,174 $18,821 $19,015 $23,769 $31,018 $40,944 $51,180 $66,534 $86,494 $108,118 $135,147 $168,934 $211,168 Total current assets $133,688 $151,567 $287,588 $448,538 $705,616 $1,005,763 $1,359,057 $1,752,660 $2,193,450 $2,631,042 $3,047,942 $3,461,413 $3,917,941 $4,394,276 $4,992,775 Property and equipment, net $65,184 $72,388 $90,589 $118,547 $148,524 $175,258 $210,310 $238,050 $274,829 $305,060 $347,768 $386,023 $424,625 $462,841 $509,125 Long-term investments $15,809 $0 $0 $0 $130,000 $282,999 $396,199 $511,096 $592,872 $687,731 $795,017 $922,220 $1,060,553 $1,219,636 $1,414,777 Deferred income taxes $18,189 $19,061 $25,031 $9,112 $0 Goodwill $0 $4,924 $13,006 $13,009 $13,605 $14,421 $15,863 $16,657 $17,489 $18,364 $19,282 $20,246 $21,259 $22,321 $23,884 Indefinite life intangibles $0 $9,389 $9,389 $9,389 $9,788 $10,865 $12,060 $13,386 $14,859 $16,493 $18,308 $20,321 $22,557 $25,038 $28,293 Other noncurrent assets $63,783 $1,382 $14,968 $19,057 $21,125 $24,505 $28,181 $32,408 $37,269 $42,859 $49,288 $56,682 $65,184 $74,961 $87,705TOTAL NONCURRENT ASSETS $162,965 $107,144 $152,983 $169,114 $323,042 $508,048 $662,613 $811,597 $937,318 $1,070,507 $1,229,663 $1,405,492 $1,594,177 $1,804,798 $2,063,784 Total assets $296,653 $258,711 $440,571 $617,652 $1,028,658 $1,513,812 $2,021,669 $2,564,257 $3,130,768 $3,701,549 $4,277,605 $4,866,904 $5,512,117 $6,199,073 $7,056,559LIABILITIES AND STOCKHOLDERS EQUITY Accounts payable $7,866 $14,313 $25,819 $26,637 $44,771 $70,846 $94,614 $120,007 $146,520 $173,233 $200,192 $227,771 $257,967 $290,117 $344,007 Accrued liabilities $71,693 $82,390 $99,365 $108,273 $135,353 $209,705 $280,058 $355,221 $433,699 $512,768 $592,568 $674,202 $763,583 $858,745 $1,018,262 Revolving credit facility $0 $7,700 $34,169 $26,471 $1,699 $2,550 $3,406 $4,320 $5,275 $6,236 $7,207 $8,200 $9,287 $10,444 $12,384 Current portion of long-term debt $40 $45 $75 $80 $115 $283 $378 $480 $586 $693 $801 $911 $1,032 $1,160 $1,376 Total current liabilities $79,599 $104,448 $159,428 $161,461 $181,938 $283,386 $378,456 $480,029 $586,080 $692,930 $800,768 $911,084 $1,031,868 $1,160,466 $1,376,029 Deferred income taxes $0 $0 $0 $0 $15,791 $19,183 $25,619 $32,494 $39,673 $46,906 $54,206 $61,673 $69,850 $78,555 $93,147 Long-term debt $3,735 $3,690 $3,615 $3,535 $3,420 $6,394 $8,540 $10,831 $13,224 $15,635 $18,069 $20,558 $23,283 $26,185 $31,049 Other liabilities $511 $2,259 $2,625 $3,572 $5,025 $4,796 $6,405 $8,124 $9,918 $11,727 $13,551 $15,418 $17,462 $19,639 $23,287 Minority interest, net of tax $0 $0 $14,547 $22,155 $40,198 $49,556 $66,181 $83,944 $102,489 $121,174 $140,032 $159,323 $180,445 $202,933 $240,629TOTAL NONCURRENT LIABILITIES $4,246 $5,949 $20,787 $29,262 $64,434 $79,929 $106,744 $135,393 $165,305 $195,442 $225,858 $256,973 $291,040 $327,311 $388,111 Total liabilities $83,845 $110,397 $180,215 $190,723 $246,372 $363,315 $485,201 $615,422 $751,384 $888,372 $1,026,625 $1,168,057 $1,322,908 $1,487,778 $1,764,140 Commitments and contingencies (Note 6) Stockholders equity Preferred stock: (authorized $0 $0 $0 $0 $0 25,000,000 shares; $0.01 par value) none issued Common stock: (authorized $350 $874 $895 $1,830 $1,896 $1,896 $1,896 $1,896 $1,896 $1,896 $1,896 $1,896 $1,896 $1,896 $1,896 500,000,000 shares; $0.01 par value) issued and outstanding - 189,618,201 and 183,009,256 shares, respectively Capital in excess of par value $0 $125,277 $155,403 $214,484 $357,026 $357,026 $357,026 $357,026 $357,026 $357,026 $357,026 $357,026 $357,026 $357,026 $357,026 Retained earnings $212,753 $22,650 $105,509 $217,622 $430,461 $791,575 $1,177,547 $1,589,913 $2,020,462 $2,454,255 $2,892,058 $3,339,925 $3,830,287 $4,352,374 $4,933,497 Accumulated other comprehensive income (loss) ($295) ($487) $215 ($1,359) $2,195 Unearned compensation $0 ($1,666) ($5,648) ($9,292) Total stockholders equity $212,808 $148,314 $260,356 $426,929 $782,286 $1,150,497 $1,536,469 $1,948,835 $2,379,384 $2,813,177 $3,250,980 $3,698,847 $4,189,209 $4,711,296 $5,292,419
$361,180 $385,983 $412,461 $430,534 $433,895 $437,776 $448,047 $490,109 $522,366 $582,578 Total liabilities and stockholders equity $296,653 $258,711 $440,571 $617,652 $1,028,658 $1,513,812 $2,021,669 $2,564,257 $3,130,768 $3,701,549 $4,277,605 $4,866,904 $5,512,117 $6,199,073 $7,056,559

Tech Investment Research Group
47
PREVIOUS INCOME STATEMENTS FORECASTED INCOME STATEMENTS
YEAR 2000 2001 2002 2003 2004 2005 2006 2007 2008 2009 2010 2011 2012 2013 2014Net sales $537,694 $600,491 $719,403 $953,226 $1,321,106 $1,763,677 $2,063,502 $2,393,662 $2,704,838 $2,948,273 $3,169,394 $3,391,251 $3,621,856 $3,857,277 $4,111,857Cost of sales $220,085 $218,507 $236,041 $275,797 $331,024 $414,464 $546,828 $670,225 $811,451 $972,930 $1,061,747 $1,186,938 $1,267,650 $1,350,047 $1,398,031Gross profit $317,609 $381,984 $483,362 $677,429 $990,082 $1,349,213 $1,516,674 $1,723,436 $1,893,386 $1,975,343 $2,107,647 $2,204,313 $2,354,207 $2,507,230 $2,713,826SG&A $261,592 $275,727 $346,354 $433,667 $545,617 $723,107 $846,036 $1,005,338 $1,136,032 $1,208,792 $1,331,145 $1,407,369 $1,484,961 $1,581,484 $1,685,861Reorganization costs $0 $4,569 $3,373 $0 $0 $0 $0 $0 $0 $0 $0 $0 $0 $0 $0OI $56,017 $101,688 $133,635 $243,762 $444,465 $626,105 $670,638 $718,099 $757,355 $766,551 $776,501 $796,944 $869,246 $925,746 $1,027,964Interest income ($33) ($305) ($825) ($1,754) ($4,000) ($13,889) ($16,978) ($20,225) ($22,822) ($24,887) ($26,787) ($28,705) ($30,707) ($32,763) ($34,991)Interest expense $420 $2,563 $1,124 $695 $808 $889 $978 $1,075 $1,183 $1,301 $1,431 $1,575 $1,732 $1,905 $2,096Net interest expense (income) $387 $2,258 $299 ($1,059) ($3,192) ($13,000) ($16,000) ($19,149) ($21,639) ($23,586) ($25,355) ($27,130) ($28,975) ($30,858) ($32,895)EBIT $55,630 $99,430 $133,336 $244,821 $447,657 $613,105 $654,638 $698,949 $735,716 $742,965 $751,146 $769,814 $840,271 $894,888 $995,069Provision for income taxes $17,027 $35,400 $47,325 $90,585 $167,866 $232,980 $248,762 $265,601 $283,251 $286,041 $289,191 $296,378 $323,504 $344,532 $383,102Minority interest, net of tax $0 $0 $184 $7,608 $18,043 $18,945 $19,892 $20,887 $21,931 $23,028 $24,179 $25,388 $26,658 $27,991 $29,390Net income $38,603 $64,030 $85,827 $146,628 $261,748 $361,180 $385,983 $412,461 $430,534 $433,895 $437,776 $448,047 $490,109 $522,366 $582,578
COMMON SIZED INCOME STATEMENTSYEAR 2000 2001 2002 2003 2004 2005 2006 2007 2008 2009 2010 2011 2012 2013 2014
Net sales 100.00% 100.00% 100.00% 100.00% 100.00% 100.00% 100.00% 100.00% 100.00% 100.00% 100.00% 100.00% 100.00% 100.00% 100.00%Cost of sales 40.93% 36.39% 32.81% 28.93% 25.06% 23.50% 26.50% 28.00% 30.00% 33.00% 33.50% 35.00% 35.00% 35.00% 34.00%SG&A 48.65% 45.92% 48.14% 45.49% 41.30% 41.00% 41.00% 42.00% 42.00% 41.00% 42.00% 41.50% 41.00% 41.00% 41.00%Net interest expense (income) 0.07% 0.38% 0.04% -0.11% -0.24% -0.74% -0.78% -0.80% -0.80% -0.80% -0.80% -0.80% -0.80% -0.80% -0.80%Provision for income taxes 3.17% 5.90% 6.58% 9.50% 12.71% 13.21% 12.06% 11.10% 10.47% 9.70% 9.12% 8.74% 8.93% 8.93% 9.32%

ent Research Group
48
Coach's Fore YEAR 2014 CASH FLOW Net incom 616,779 Adjustmen to net cash Depreciati 113,076 Minority int 41,119 Reorganiz Tax benefi Decrease ( $35,979 Other non Changes in cu Increase in Decrease i Increase in Increase in Increase in Increase in $61,678 Net cash fr ,130,761CASH FLOWS U Purchases o ($137,602) Acquisitions Proceeds fr $108 Purchases o ($562,026) Net cash us ($688,012) CASH FLOW Partner contribu Repurchas ($78,943) Repayment ($220) Borrowings Repayment Equity dist Borrowings $303,844 Repayment ($364,377) Proceeds from Net cash (u ($72,222) Increase in $370,527 Cash and ca ,047,109 Cash and c ,417,636
casted Cash Flows (In Thousands)2000 2001 2002 2003 2004 2005 2006 2007 2008 2009 2010 2011 2012 2013
S FROM OPERATING ACTIVITIESe $38,603 $64,030 $85,827 $146,628 $261,748 375,663 402,383 430,859 454,413 459,931 465,901 478,166 521,547 555,448ts to reconcile net income from operating activities:
on and amortization $22,628 $24,131 $25,494 $30,231 $42,854 68,872 73,770 78,991 83,309 84,321 85,415 87,664 95,617 101,832erest $0 $184 $7,608 $18,043 25,044 26,826 28,724 30,294 30,662 31,060 31,878 34,770 37,030
ation costs $4,569 $3,373 $0 $0t from exercise of stock options $0 $1,405 $13,793 $41,503 $106,458increase) in deferred taxes $2,661 ($5,797) ($4,969) $8,778 $11,646 $21,914 $23,472 $25,133 $26,507 $26,829 $27,178 $27,893 $30,424 $32,401 cash credits, net ($1,688) ($192) $1,482 ($969) $3,372
rrent assets and liabilities: trade accounts receivable ($3,751) ($5,041) ($5,855) ($4,545) ($20,254)
n receivable from Sara Lee $22,442 $31,437 $0 $0 $0 inventories $22,442 ($3,065) ($16,638) ($7,403) ($18,106) other assets and liabilities ($90) ($357) ($12,843) ($9,933) ($2,408) accounts payable ($6,279) $6,447 $8,671 $818 $18,134 accrued liabilities $11,154 $6,762 $9,418 $8,908 $27,080 $37,566 $40,238 $43,086 $45,441 $45,993 $46,590 $47,817 $52,155 $55,545
om operating activities $84,955 $124,329 $107,937 $221,624 $448,567 $688,716 $737,702 $789,908 $833,090 $843,206 $854,152 $876,638 $956,170 $1,018,321 $1SED IN INVESTMENT ACTIVITIES
f property and equipment ($26,000) ($31,868) ($42,764) ($57,112) ($67,693) ($107,134) ($109,121) ($119,619) ($116,939) ($122,535) ($113,945) ($114,425) ($120,732) ($127,795) of distributors, net of cash acquired $0 $0 ($14,805) $0 $0
om dispositions of P&E $2,695 $799 $1,592 $27 $58 $84 $86 $94 $92 $96 $89 $90 $95 $100f investments $0 $0 ($301,723) ($437,580) ($445,695) ($488,576) ($477,629) ($500,487) ($465,398) ($467,362) ($493,123) ($521,969)
ed in investment activities ($23,365) ($31,069) ($55,977) ($57,085) ($369,358) ($535,669) ($545,603) ($598,096) ($584,696) ($612,677) ($569,723) ($572,127) ($603,662) ($638,975)S USED IN FINANCING ACTIVITIES
tion to joint venture $0 $0 $14,363 $0 $0e of common stock $0 $0 ($9,848) ($49,947) ($54,954) ($61,463) ($62,603) ($68,626) ($67,089) ($70,299) ($65,371) ($65,647) ($69,265) ($73,317)of long-term debt ($35) ($190,040) ($45) ($75) ($80) ($172) ($175) ($191) ($187) ($196) ($182) ($183) ($193) ($205) from Sara Lee $541,047 $451,534s to Sara Lee ($573,122) ($482,971)ribution ($29,466) $0 on revolving credit facility $0 $68,300 $200,006 $63,164 $168,865 $236,565 $240,952 $264,135 $258,217 $270,574 $251,605 $252,666 $266,593 $282,188s of revolving credit facility $0 ($60,600) ($186,967) ($70,862) ($193,637) ($283,695) ($288,956) ($316,757) ($309,660) ($324,479) ($301,731) ($303,004) ($319,705) ($338,407)
exercise of stock options $0 $2,046 $20,802 $28,395 $34,141sed in) from financing activities ($61,576) ($89,731) $38,311 ($29,325) ($45,665) ($56,230) ($57,273) ($62,784) ($61,377) ($64,314) ($59,805) ($60,058) ($63,368) ($67,075) cash and cash equivalents $14 $3,529 $90,271 $135,214 $33,544 $96,816 $134,826 $129,028 $187,017 $166,215 $224,623 $244,453 $289,140 $312,271sh equivalents at beginning of period $148 $162 $3,691 $93,962 $229,176 $262,720 $359,536 $494,362 $623,390 $810,408 $976,622 $1,201,245 $1,445,699 $1,734,839 $2ash equivalents at end of period $162 $3,691 $93,962 $229,176 $262,720 $359,536 $494,362 $623,390 $810,408 $976,622 $1,201,245 $1,445,699 $1,734,839 $2,047,109 $2
Tech Investm

Tech Investment Research Group 49
Ratio Analysis
YEAR 2000 2001 2002 2003 2004COACHLIQUIDITY ANALYSISCurrent Ratio 1.68 1.45 1.80 2.78 3.88Quick Ratio 0.20 0.93 1.35 1.64 2.69Accounts Receiveable 34.54 29.14 23.26 26.87 23.71turnoverDays Supply of receiveables 10.57 12.53 15.69 13.58 15.40Inventory Turnover 2.16 2.08 1.73 1.92 2.04Days supply of inventory 169.32 175.67 210.93 190.32 178.53Working capital turnover 4.02 3.96 2.50 2.13 1.87
PROFITABILITY ANALYSIS
Gross Profit Margin 59.07% 63.61% 67.19% 71.07% 74.94%Operating Expense Ratio 48.65% 45.92% 48.14% 45.49% 41.30%Net Profit Margin 7.18% 10.66% 11.93% 15.38% 19.81%Asset Turnover 1.81 2.32 1.63 1.54 1.28Return on Assets 13.01% 24.75% 19.48% 23.74% 25.45%Return on Equity 18.14% 43.17% 32.97% 34.34% 33.46%
CAPITAL STRUCTURE ANALYSIS
Debt to Equity Ratio 0.39 0.74 0.69 0.45 0.31Times Interest Earned 133.37 39.68 118.89 350.74 550.08Debt Service Margin 2123.88 2762.87 1439.16 2770.30 3900.58
Coach, Inc. (COH) 49

Tech Investment Research Group 50
YEAR 2000 2001 2002 2003 2004LIZ CLAIBOURNELIQUIDITY ANALYSISCurrent Ratio 2.96 2.44 2.47 2.04 2.56Quick Ratio 1.33 0.96 1.25 1.17 1.48Accounts Receiveable 10.06 9.39 8.63 8.93 9.71turnoverDays Supply of receiveables 36.29 38.88 42.29 40.88 37.57Inventory Turnover 3.24 4.09 4.14 4.55 4.85Days supply of inventory 112.73 89.35 88.11 80.23 73.32Working capital turnover 5.26 8.33 6.51 5.37 5.43
PROFITABILITY ANALYSIS
Gross Profit Margin 39.32% 39.10% 41.38% 43.56% 44.55%Operating Expense Ratio 10.16% 10.68% 9.62% 10.48% 11.10%Net Profit Margin 6.68% 6.85% 5.57% 6.22% 6.59%Asset Turnover 1.82 1.99 3.12 3.09 3.15Return on Assets 12.16% 13.63% 9.84% 10.06% 10.72%Return on Equity 17.26% 21.33% 18.18% 17.97% 17.72%
CAPITAL STRUCTURE ANALYSIS
Debt to Equity Ratio 0.42 0.56 0.85 0.79 0.65Times Interest Earned 20.63 16.35 11.80 15.52 15.43Debt Service Margin N/A 12.31 N/A 19.18 20.73
Coach, Inc. (COH) 50

Tech Investment Research Group 51
Coach, Inc. (COH) 51
YEAR 2000 2001 2002 2003 2004RALPH LAURENLIQUIDITY ANALYSISCurrent Ratio 2.09 2.05 2.57 2.33 2.53Quick Ratio 0.9 0.84 1.55 1.47 1.61Accounts Receiveable 8.4 7.37 6.36 6.23 5.72turnoverDays Supply of receiveables 43.45 49.52 57.38 58.58 63.81Inventory Turnover 2.56 2.73 3.47 3.38 3.64Days supply of inventory 142.57 133.69 105.18 107.98 100.27Working capital turnover 4.65 5.34 3.87 3.
PROFITABILITY ANALYSIS
Gross Profit Margin 55.00% 53.00% 48.00% 49.00Operating Expense Ratio 15.00% 6.00% 12.00% 11.00Net Profit Margin 8.00% 3.00% 7.00% 7.00Asset Turnove
31 3.28
% 49.00%% 10.00%% 6.00%
r 1.06 1.22 1.35 1.Return on Assets 9.00% 3.00% 9.00% 8.00Return on Equity 18.00% 7.00% 17.00% 14.00
CAPITAL STRUCTURE ANALYSIS
Debt to Equity Ratio 1.09 1 0.75 0.Times Interest Earned 17.56 4.66 15.4 21.Debt Service Margin 1.66 0.69 8.9 2
19 1.16% 7.00%% 12.00%
68 0.5936 27.37
.66 N/A

Tech Investment Research Group 52
Cost of Debt Calculation
BALANCE SHEET
2004/05/30
Percent of Total
LiabilitiesComputed Interest
RateValue
Weighted Rate
LIABILITIES FOR COACHCURRENT LIABILITIES: Accounts payable $44,771,000 18.17% 0.00% 0.0000% Accrued liabilities $135,353,000 54.94% 3.50% 1.9228% Revolving credit facility $1,699,000 0.69% 4.00% 0.0276% Current portion of long-term debt $115,000 0.05% 8.77% 0.0041%TOTAL CURRENT LIABILITIES $181,938,000 73.85% Deferred income taxes $15,791,000 6.41% 0.00% 0.0000% Long-term debt $3,420,000 1.39% 8.77% 0.1217% Other liabilities $5,025,000 2.04% 6.50% 0.1326% Minority interest, net of tax $40,198,000 16.32% 6.50% 1.0605%TOTAL NONCURRENT LIABILITIES $64,434,000 26.15%TOTAL LIABILITIES $246,372,000 100.00%
Weighted Average Cost of Debt 3.2694%
Coach, Inc. (COH) 52

Tech Investment Research Group 53
Wacc & Beta Estimations
Beta Estimate R-SquaredAverage Risk
Free RateYahoo
Published Beta
Historical Market Risk Premium
1.23970 17.3218516% 0.03283 1.299 0.03
Estimated Ke 7.003%
Find an implied Ke 6%
Estimated Cost of Debt 3.2694%
Short Horizon Estimated Ke 3.505%0.0739 R^2 0.042%
WACC LONG TERM BT 6.11%
WACC SHORT TERM BT 3.45%
WACC LONG TERM AT 5.81%
WACC SHORT TERM AT 3.15%
Coach, Inc. (COH) 53

Tech Investment Research Group 54
Method of Comparables
Method Of Comparables Price Trailing P/E Forward P/E P/B P/S
Coach $56.29 32.95 24.41 10.77 7.17
Liz Claibourne $40.08 14.01 11.93 2.41 0.95
Ralph Lauren $38.32 16.16 13.59 2.39 1.24
Tiffany & Co $33.21 16.09 19.31 2.83 2.2
Industry (Excluding Coach) 15.42 14.94 2.54 1.46
Coach Price EPS Forward EPS BPS Sales56.29 1.68 2.26 5.17 7.848
Suggested Price $25.91 $33.77 $13.15 $11.48
Coach, Inc. (COH) 54

Tech Investment Research Group 55
Discounted Cash Flows
Coach Free Cash Flows (In Millions Except Per Share Data) YEAR 1 2 3 4 5 6 7 8 9 10 PerpForecast Years
2004 2005 2006 2007 2008 2009 2010 2011 2012 2013 2014Cash Flow From Operations $688 $737 $789 $833 $843 $854 $876 $956 $1,018 $1,130 $1,150Cash Provided (Used) by Investing Activities ($535) ($545) ($598) ($584) ($612) ($569) ($572) ($603) ($638) ($688) ($700)
$153 $192 $191 $249 $231 $285 $304 $353 $380 $442 $450Free Cash Flow to FirmPV Factor BT WACC of 6.11% 6.11% 0.942 0.888 0.837 0.789 0.743 0.701 0.660 0.622 0.586 0.553
Present Value of Free Cash Flows 6.11% $144 $171 $160 $196 $172 $200 $201 $220 $223 $244
Total PV of Annual Cash Flows 6.11% $1,930
Continuing (Terminal) Value 3.5% Growth WACC=6.11%Present Value of Continuing (Terminal) Value 6.11% $9,907.76 Ke = 6.45%Value of Coach (end of 2004) 6.11% $11,838 Kd = .13%Book Value of Debt and Preferred Stock $356Value of Equity (end of 2004) 6.11% $11,482
Estimated Value Per Share 6.11% $60.56Book Value Per Share $4.13EPS $1.57 $1.83 $1.97 $2.06 $1.89 $2.04 $2.19 $2.35 $2.52 $2.71
Actual Price Per Share $56.00
Coach, Inc. (COH) 55

Tech Investment Research Group 56
Residual Income Model
Residual Income Model for Coach YEAR 1 2 3 4 5 6 7 8 9 10 PERPForecast Years
2004 2005 2006 2007 2008 2009 2010 2011 2012 2013 2014Beginning BE (per share) 2.66 4.13 6.06 8.11 10.31 12.61 14.92 17.25 19.64 22.25 25.04Earnings Per Share 1.47 $1.93 $2.06 $2.20 $2.29 $2.31 $2.33 $2.39 $2.61 $2.78 $3.11Dividends per shareEnding BE (per share) 4.13 6.06 8.11 10.31 12.61 14.92 17.25 19.64 22.25 25.04Ke 0.06"Normal" Income 0.25 0.36 0.49 0.62 0.76 0.90 1.04 1.18 1.34 1.50Residual Income (RI) 1.68 1.69 1.71 1.68 1.56 1.44 1.35 1.43 1.45 1.61 1.66
Present Value of RI 1.58 1.51 1.44 1.33 1.16 1.01 0.90 0.90 0.86 0.90BV Equity (per share) end 2004 4.13
Total PV of RI (end 2004) 10.69Continuation (Terminal) Value Implied Ke =6%PV of Terminal Value (end 2004) 46.23 Growth Rate = 4%Estimated Value (end 2004) $61.05Capitalize 9 months value (april 1 2005 price) $63.78
Actual Price per share end 2004Actual Price per share $56.00Growth 4.00%
Coach, Inc. (COH) 56

ent Research Group 57
Coach, Inc. (COH) 57
Abnormal Earnings Growth
Abnormal Earnings Growth YEAR 1 2 3 4 5 6 7 8 9 PerpForecast Years
2004 2005 2006 2007 2008 2009 2010 2011 2012 2013 2014EPS $1.93 $2.06 $2.20 $2.29 $2.31 $2.33 $2.39 $2.61 $2.78 $3.11DPS $0.00 $0.00 $0.00 $0.00 $0.00 $0.00 $0.00 $0.00 $0.00 $0.00Cum-Dividend Earnings $2.06 $2.20 $2.29 $2.31 $2.33 $2.39 $2.61 $2.78 $3.11Normal Earnings $2.06 $2.20 $2.35 $2.46 $2.47 $2.50 $2.56 $2.80 $2.98Abnormal Earning Growth (AEG) ($0.00) ($0.00) ($0.06) ($0.14) ($0.14) ($0.11) $0.06 ($0.01) $0.13 $0.04
PV Factor 0.935 0.873 0.816 0.763 0.713 0.666 0.623 0.582 0.544
PV of AEG ($0.00) ($0.00) ($0.05) ($0.11) ($0.10) ($0.07) $0.04 ($0.01)Core EPS $1.93Total PV of AEG ($0.30)Continuing (Terminal) ValuePV of Terminal Value $0.78Total PV of AEGAverage Perpetuity $2.40Capitalization Rate (perpetuity) 0.04
Value Per Share April 1 2005 $63.03
Ke 0.07g 0.04
Actual Price per share $56.00
Tech Investm

Tech Investment Research Group 58
Resources
UBS.com Yahoo! Finance MSN Money Edgar Scan Wall Street Journal Coach.com
Coach, Inc. (COH) 58