CO2 EMISSIONS FROM STATIONARY COMBUSTION OF FOSSIL FUELS · CO2 Emissions from Stationary...
26
Good Practice Guidance and Uncertainty Management in National Greenhouse Gas Inventories CO 2 Emissions from Stationary Combustion of Fossil Fuels 15 CO 2 EMISSIONS FROM STATIONARY COMBUSTION OF FOSSIL FUELS A CKNOWLEDGEMENTS This paper was written by Tim Simmons (Avonlog Limited, UK). ABSTRACT Good practice in inventory construction constitutes a body of approaches and procedures which facilitate the preparation of inventories which are accurate, comparable and transparent. However, the good practice must be conducted within a framework of a sound appreciation of the sources of data, their strengths and weaknesses and the methods available. This paper sets out the elements of the main methodologies for estimating emissions and discusses the data availability and its consequences for the choice of method. It also describes the checks available within the sources of activity data and reviews the default values available from the Revised 1996 IPCC Guidelines for National Greenhouse Gas Inventories (IPCC Guidelines). At appropriate points within the discussion, estimates are given of the levels of uncertainty to be associated with the main aggregates of activity data, calorific values and emission factors. These are mostly the result of experience and judgement rather than rigorous analysis. The paper closes with a brief discussion of the assessment of inventory quality and the use of the Reference Approach as a check on estimates prepared using other methods.
Transcript of CO2 EMISSIONS FROM STATIONARY COMBUSTION OF FOSSIL FUELS · CO2 Emissions from Stationary...
Good Practice Guidance and Uncertainty Management in National Greenhouse Gas Inventories
CO2 Emissions from Stationary Combustion of Fossil Fuels 15
CO2 EMISSIONS FROM STATIONARY COMBUSTION OF FOSSIL FUELS ACKNOWLEDGEMENTS This paper was written by Tim Simmons (Avonlog Limited, UK).
A B S T R A C T Good practice in inventory construction constitutes a body of approaches and procedures which facilitate the preparation of inventories which are accurate, comparable and transparent. However, the good practice must be conducted within a framework of a sound appreciation of the sources of data, their strengths and weaknesses and the methods available.
This paper sets out the elements of the main methodologies for estimating emissions and discusses the data availability and its consequences for the choice of method. It also describes the checks available within the sources of activity data and reviews the default values available from the Revised 1996 IPCC Guidelines for National Greenhouse Gas Inventories (IPCC Guidelines).
At appropriate points within the discussion, estimates are given of the levels of uncertainty to be associated with the main aggregates of activity data, calorific values and emission factors. These are mostly the result of experience and judgement rather than rigorous analysis.
The paper closes with a brief discussion of the assessment of inventory quality and the use of the Reference Approach as a check on estimates prepared using other methods.
Background Paper
Energy Sector 16
1 I N T R O D U C T I O N Anthropogenic emissions of carbon dioxide (CO2) weighted by global warming potentials, constitute by far, the largest part of the emissions of greenhouse gases. Of these CO2 emissions, those that are produced from fuel combustion make up the great majority and, almost all, may be directly and immediately estimated from the combustion activities. Good quality estimates of CO2 emissions from fuel combustion are not only essential for the construction of inventories and the monitoring of emission control obligations but, because of the potential control measures implicit in the direct link between fuel use and emissions, the estimates are invaluable for the preparation and analysis of emission abatement policies.
Simple methods for estimation of CO2 emissions from the use of fuels assume that the carbon in the fuel used for each activity will enter the atmosphere in the short or long term. Short-term emissions are defined within the IPCC Guidelines as those occurring within twenty years of the fuel use and are almost entirely reported in the fuel combustion module. Long-term CO2 emissions result from the final oxidation of long-life materials manufactured from fuel carbon and are usually emissions from waste destruction. Tier 1 methods comprise the Reference Approach (RA) and the Sectoral Approach (SA) and both estimate the amount of carbon released into the atmosphere and express it as CO2. In fact, whilst the great majority of the emissions are CO2 others are carbon monoxide (CO), methane (CH4) and non-methane volatile organic compounds (NMVOCs). The two approaches are termed “top-down” because they estimate the eventual carbon emissions from the supply of fuels to the economy or the main economic sectors rather than from the fuel consumption or actual emissions at combustion plant.
More detailed (“bottom-up”) methods do not depart from the principle of estimating emissions from the carbon content of the fuel but, as far as possible, use figures for the amounts of fuel consumed at individual large combustion plants together with details of fuel supplies to other sources of emissions.
1 . 1 S o u r c e s o f e mi s s i o n s a n d r e l a t e d d a t a Carbon and hydrogen in fossil fuels are used widely for heat raising and as raw materials for the manufacture of other products. Carbon may also be used as a reducing agent and a few fuel products are used for their physical properties. The heat raising activity generates immediate emissions of CO2 as do the majority of activities which use carbon as a reducing agent. Carbon used directly in the manufacture of other products and fuel products used for their physical properties contribute mainly to the long-term emissions although some part of the fuel products may be oxidised in use (for example, lubricants).
This paper is limited to the estimation of emissions from activities using stationary combustion plant. The emissions form part of the total from fuel combustion reported under the activities classified under section 1A of the Source/Sink categories given in Vol 1 of the IPCC Guidelines. By definition, emissions from mobile sources should be excluded. However, this is not always possible because mobile sources cannot be excluded when using the Reference Approach (RA) and may be only partly excluded when using the Sectoral Approach (SA) as the activity data may conceal some fuel use in mobile plant.
The widespread use of fuel combustion in all human activities means that all sectors of economic activity and households are involved. The magnitude of the number of individual emission sources prevents any direct assessment of the emissions from each source. However, the distribution of the number of sources with a given quantity of emissions is very skewed with a large number of small emitters and relatively few large emitters. The few large emitters account for the majority of the emissions. This permits a separation of the estimation problem into a census or near census of the large emitters and sampling or indirect methods for the rest.
2 M E T H O D S A V A I L A B L E The extent to which the problem of estimation of emissions can, in practice, be separated into the two groups mentioned above is very dependent on the data available and, in particular, the activity data. If few activity data are available, then simple Tier 1 methods must be used. The RA is based on relatively few fossil fuel supply data whilst the SA uses figures for deliveries to the main consuming sectors (main source categories). Where a country has detailed information on the consumption of fuels in the main consuming activities or sectors then detailed, “bottom
Good Practice Guidance and Uncertainty Management in National Greenhouse Gas Inventories
CO2 Emissions from Stationary Combustion of Fossil Fuels 17
up” calculation can be made. Figures for the consumption of fuels by an enterprise will, in general, differ from the deliveries to it by the extent to which the enterprise builds or draws upon stocks of the fuels.
Whichever method is used the underlying equation is:
EQUATION 1 Cr = Q ● NCV ● EF ● (1-Sf) ● F
Where:
Cr: quantity of carbon released and attributed to fuel combustion (multiply by 44/12 for CO2)
Q: quantity of fuel delivered to or consumed by the activity (sector) expressed in natural units
NCV: net calorific value of fuel (TJ/natural unit)
EF: emission factor (more precisely, the specific carbon content, t C/TJ)
Sf: carbon storage factor, that is the fraction of carbon delivered which remains unoxidised after use of the fuel either in a product manufactured from it or because the use does not involve deliberate oxidation of the carbon content.
F: is the oxidation factor, the fraction of carbon which is oxidised during combustion.
“Bottom up” methods may use emission factors expressed as t C/natural unit and obviate the need for net calorific values.
Tier 1 methods are the simplest to use but less accurate than the more detailed analyses where good and widespread consumption data are available. The Reference Approach makes relatively few demands for data but interpreting its results requires care and an understanding of the carbon flows into and from the country. This is discussed more fully at the close the paper under Inventory Quality.
2 . 1 T h e r e f e r e n c e a p p r o a c h The Reference Approach was introduced to provide simple estimates for CO2 emissions from fuel combustion for countries which have insufficient data for the Sectoral Approach or for methods based on detailed analyses of fuel consumption. The RA may also be useful as check on the completeness of emission estimates obtained by aggregating estimates for many combustion activities. The RA estimates fossil carbon flow into the economy and adjusts it for carbon stored in long-life materials and for any carbon not oxidised during combustion. Carbon in bio-fuels is omitted from the accounting but reported for information. The RA provides estimates of CO2 from all fuel combustion and some fugitive emissions. It also offers a breakdown of emissions by main fuel type but the ways in which fuels are used are not identifiable as stationary combustion, in particular, and emissions from the main source categories cannot be separately estimated. National fuel supply statistics are used to calculate the carbon flows. Both fugitive and combustion emissions resulting from transport and use of these flows are included. Fuel supplies to a country are calculated using the following formula:
(Production) + imports - exports ± stock change
for each fuel in turn. Production is included only for primary fuels (see the IPCC Guidelines Vol. 3).
Since the supply, so defined, should balance consumption this expression is referred to as the “apparent consumption” and may be used in place of Q in the formula above. The figures for carbon release from each of the fuels are summed to form the estimate of total emissions.
The relatively few but not insignificant flows of carbon outside the boundaries of the energy statistics system should be recognised and, where possible, should be taken into account when the RA is used as check against other estimation methods. The most notable flows are fugitive carbon releases from oil, gas and coal extraction activities as these usually occur before the measurement of production and are not, therefore, included in energy statistics but under category 1B, Fugitive Emissions from Fuels. The flows of carbon resulting from imports and exports of basic organic chemicals and closely related intermediates are not part of the energy statistics but contribute to some short-term and long-term carbon release during their use in the petro-chemicals industry and at their final destruction. There are no procedures at present for estimating their contribution through Tier 1 methods but studies of non-energy use of fossil carbon and its eventual fate are taking place in order to improve carbon accounting in this difficult area.
Background Paper
Energy Sector 18
2 . 2 T h e s e c t o r a l a p p r o a c h The RA does not provide estimates of emissions from the main groups of fuel using activities and, as such information is essential for monitoring and abatement of emissions, the identical “top-down” principle has been applied to deliveries of fuels to the main source categories defined in the IPCC Guidelines Vol 1. The method has been introduced into the IPCC Guidelines as the Tier 1 method, Sectoral Approach (SA). CO2 emissions from the sources other than transport may be estimated separately in Tier 1 and considered broadly equivalent to emissions from stationary combustion. However, as transport vehicles are only part of the set of mobile emitters this equivalence is not entirely correct.
The SA method uses the deliveries or consumption of fuels to each of the main source categories together with their carbon content to estimate the emissions of CO2 from them.
2 . 3 D e t a i l e d t e c h n o l o g y - b a s e d me t h o d Commonly known as the “bottom-up” method, this estimates emissions from detailed consumption data at plant level, at least for the larger combustion plant. The estimations are generally very good and are able to discriminate clearly between stationary and mobile combustion sources because of the detailed work involved in identifying and tabulating all main sources of emissions and the resources required to bring together the necessary data from various sources. For smaller sources and those which are spatially distributed over a wide area the method usually uses estimates based on deliveries data. Therefore for these cases, it resembles the Sectoral Approach.
3 D A T A A V A I L A B I L I T Y A N D Q U A L I T Y I S S U E S
3 . 1 A c t i v i t y d a t a 3.1.1 Reference approach National fuel supply statistics, needed for the RA, are usually readily available from the national energy publications. These data are also published by the United Nations, International Energy Agency and Eurostat for most of the countries in the world. However, national statistics should be used wherever possible because those who compile them can explain their provenance and their limitations. Equally, national definitions of production or stocks may differ from those employed by international organisations and these differences may create difficulties when justifying the subsequent inventories. Those persons who prepare a Reference Approach estimate of CO2 should be aware of the basis for measurement of production and external trade figures. For example, natural gas production statistics may be taken from field production measured whilst the gas still contains “liquids” (ethane, propane and butane) which are largely removed before sale and distribution. Some countries will also include gases vented and/or flared although it is more usual to exclude these quantities from production and take account of emissions from them separately. Clearly the nature of the production measurement process has implications for the calorific value and emission factor employed when estimating the emissions.
There are, in general, two sources for figures of imports and exports. These are the national customs service (who collect the data as a by-product of their functions of controlling and taxing traded fuels) and companies who are the importers or exporters of the fuels. One or other of the sources will be better for different fuels. National energy statisticians can advise as they will have based the published data on their assessments of the relative strengths of the available data.
3.1.2 Sectoral approach For countries which have the necessary data, the SA is to be preferred to the RA as it produces estimates of emissions by the main source categories defined in the IPCC Guidelines. With some important exceptions, the SA estimates emissions using the quantities of fuels delivered into the main source categories as the variable Q in equation 1 above. The deliveries data are usually provided by the fuel supply industries. The exceptions concern certain of the large energy conversion industries and major consumers (for example, iron and steel) who report directly their consumption. When deliveries data are used, the estimate encompasses not only CO2 emissions but emissions of other carbon bearing molecules whether from fuel combustion or fugitive release within the enterprises. With only two exceptions (autogeneration and non-energy use) it does not enquire further into the
Good Practice Guidance and Uncertainty Management in National Greenhouse Gas Inventories
CO2 Emissions from Stationary Combustion of Fossil Fuels 19
reasons for fuel use within the source categories. If a country applies the Tier 1 method for fuel combustion and the methods described in the Industrial Processes module of the IPCC Guidelines then the country should take care to avoid double counting certain CO2 emissions. The areas of potential overlap between the methods are described later and also mentioned in the relevant parts of the Industrial Processes module.
Collecting data for the deliveries and/or the consumption of fuels in the energy industries requires data systems which are matched to the types of industry, the processes they undertake and the data they have available. Similarly, the information on deliveries made to other source categories by the energy supply industries will reflect their methods for accounting for sales and classification of customers. Some countries conduct direct surveys of consumption in the larger enterprises on a yearly or longer regular basis and this information is “grossed-up” to national total. A good understanding of the conditions of reporting and subsequent validation and processing by the energy statisticians is essential for intelligent use of the data.
The main source categories used and for which worksheets are provided in the IPCC Guidelines are:
• Energy industries;
• Manufacturing and construction;
• Transport;
• Commercial and Institutional;
• Residential;
• Agriculture, Forestry and Fishing, and
• Other.
The economic activities contained within the main source categories are listed in the annex to this paper.
Countries which rely heavily on statistics of deliveries from suppliers of fuels will be conscious of the possibilities for misallocation of deliveries between main source categories and the weaknesses of identifying final consumers when direct importing of fuels takes place. The problems affect coal and oil in particular and the commercial and household categories. These are often served by wholesalers whose receipts from suppliers represent the last point of reporting (the downstream statistical boundary) for coal and oil in theses sectors. Misallocation of deliveries to categories is revealed only when independent surveys of consumption are undertaken and the extent of the problem can then be estimated.
The fuels covered by the SA method are given on the worksheets for each main source category. The fuels fall naturally into two groups, “traded” and “non-traded” although some fuels may belong to both groups (fuelwood) and the groupings will depend on the country.
In the industrialised countries, total deliveries of the traded fuels is well known and, subject to the reservations expressed in the preceding section, figures for the amounts going to each of the main source categories can usually be determined. In less developed countries, estimates are usually available for bottled gas but both the supply and the consumption of oil products can be difficult to trace and traders difficult to identify. Where these problems are severe the Reference Approach may be the only feasible method of obtaining CO2 estimates.
Figures for the consumption of non-traded fuels require surveys or indirect estimation (for example, for fuelwood by forest management authorities based on forest losses). Unfortunately, there is evidence that indirect estimation of fuelwood consumption can be very inaccurate. Recent direct surveys of households in France and Central and Eastern European countries have revealed levels of consumption three to eight times higher than official estimates. Although one cannot generalise to all forms of solid biomass consumption in households it would be prudent to treat indirect estimates of consumption with caution.
With a few important exceptions, Annex II countries do not conduct annual surveys of fuel consumption in manufacturing, commercial and agricultural enterprises. They obtain figures for deliveries of fuels from suppliers and, by their nature, these cover traded fuels. The use of wastes, renewables and by-products from processes are surveyed only occasionally through special studies and these provide the basis for estimation in non-survey years.
The position in the former centrally planned economies is potentially better because most of them still have a regular survey of consumption in enterprises. These surveys do not collect details of waste and renewables use (with the exception of fuelwood) but with a little adaptation can be made to do so.
The various sources of data for each of the source categories (except transport) are discussed below.
3.1.2.1 Energy industries
Background Paper
Energy Sector 20
The “Energy Industries” source category emissions are estimated from direct combustion of fuels. The throughputs of refineries and solid fuel manufacturing plants are not used. This source category may be divided between the extraction industries and the transformation industries.
Transformation
For the public heat and/or power plants the fuel consumption data are readily available. Also most countries with refineries can obtain the figures for oil fuels used within the refinery for heat raising. In contrast, refinery statistics rarely record the use of methane within the refinery so some investigative work may be needed here. All refineries are autogenerators and may purchase methane to supplement their local fuels for electricity generation. Consumption of coke oven and blast furnace gas at coke ovens can be more difficult to obtain, particularly at independent coke ovens (not sited at steel works). As the coke oven gas, produced during coke manufacture, is used to heat the ovens, there is often little interest in measuring the gas use. Where there are coke ovens at which the consumption for heating is measured, the heat per tonne of coke output can be used to estimate for the ovens where direct consumption has not been measured. The calculation of emissions from the combustion of fuels at blast furnaces is not explicitly covered in the Tier 1 methods (RA or SA), but under metals production in the Industrial Processes module. The CO2 is reported as an industrial process emission under manufacturing industries source category. Nevertheless, the emissions from the combustion of coke and other fuels introduced into blast furnaces will be contained in the estimates of emissions derived using the RA and SA because the quantities of carbon in the fuel supplies which will be emitted from blast furnaces cannot be identified in the supply statistics.. To avoid double counting the blast furnace emissions, their estimated quantities calculated for the Industrial Processes module should be subtracted from the SA estimates
Extraction
Fuel consumption statistics in the coal, oil and gas extraction industries are a mixture of figures for use of own produced fuels and bought-in supplies. The latter are usually readily available from the supplier but the own use consumption is more difficult to obtain because it may not be rigorously measured unless it is a significant use and vital to the economics of the enterprise. The own use may also comprise consumption of products which are not easily marketable and considered as waste (colliery methane) or not yet in a marketable condition (wet natural gas at oil/gas production sites). As remarked earlier, this has implications not only for quantity statistics (activity data) but also calorific value and emission factor data.
3.1.2.2 Manufacturing and construction
Within the manufacturing sector fuels are used:
(i) for heat raising;
(ii) as raw materials;
(iii) as reducing agents, and
(iv) for their physical properties.
Only the first category is considered an energy use. All others are termed non-energy uses although some may involve exothermic reactions from which the heat is recovered for use.
The non-energy uses include the use of fuel as carbon feedstock for incorporation in intermediate and final goods, the use of solvents in paint manufacture and for general purposes, and the industrial process use of oven coke or petroleum coke as reducing agents. There is also a general use of lubricants. The construction industry is also a major consumer of bitumen
The figures for the deliveries of fuels to the manufacturing sector cannot generally provide information on the fuel use and thereby distinguish the energy from non-energy use. Certain oil products (lubricants, solvents and bitumen) are considered as non-energy products but the extent to which the carbon they contain is retained in the used product is difficult to know without additional information from the users. Waste oil recovery for re-use or for heat raising is becoming more common but there are few statistics for the activity other than those obtained through special studies.
Unless steps are taken to avoid it, there will be some double counting in the SA estimates of industrial process emissions from the use of carbon in metals production (other than pig-iron) and in the manufacture of calcium carbide. This is probably most simply handled by subtracting estimates of the CO2 from the relevant industrial processes from the SA estimates of emissions.
The use of fuels for mobile combustion in these source categories varies considerably from one economic activity to another and precise identification of the fuel for mobile sources needs information from each enterprise.
Good Practice Guidance and Uncertainty Management in National Greenhouse Gas Inventories
CO2 Emissions from Stationary Combustion of Fossil Fuels 21
Where transport fuels are heavily taxed then one can reliably infer that their use within the sector will be for vehicles. Equally, consumption of the heavier oils by the fishing industry may be considered to be for mobile combustion and gas/diesel oil delivered to the minerals extraction industry will be used largely for mobile plant. However, identifying the mobile use of gas oils in the construction or in agriculture is usually beyond the normal range of energy statistics. In these, and similar cases, all combustion is treated as stationary combustion.
All other uses are considered to be for heat raising. However, the IPCC Guidelines now require the consumption for and emissions from autogeneration electricity and heat for sale to be identified. This should be done by providing two copies of the worksheet for manufacturing and construction (and any other main source category where autogeneration takes place) containing the consumption and emissions from autogeneration on one sheet and from all uses on the other. Currently, international energy data do not separate fuel use for autogeneration by economic activity of the enterprise and so it is likely that autogeneration by non-manufacturing enterprises is included in the totals published. However, national statisticians collect autogeneration data on an enterprise basis so the detail should be available at the national level.
3.1.2.3 Commercial and institutional; residential; other
Fuel consumption within these categories is almost entirely for stationary combustion. Fuels used for vehicles are allocated to the transport source category on the basis of the sales of vehicle fuels by oil companies through service stations. There may be some mobile combustion where organisations with significant transport needs have direct deliveries of motor fuels but the gasoline and diesel fuel are usually readily identifiable and may be excluded. Deliveries of gas oil for diesel engine use usually carry a significant tax and oil companies separately record the quantities involved.
The “Other” category contains military fuel consumption for all purposes including marine use and aviation. Note that transport covers the transport of goods or people therefore a significant part of the mobile combustion by the military sector will not be for transport use even though it uses “transport” fuels. Unfortunately, the placement of fuel for military uses in the “Other” category differs from that given in the international questionnaires as regards military consumption for marine and aviation movements. This fact, together with the reluctance of many countries to include military fuel use in any clear manner (or at all) make good figures for the “Other” category difficult to obtain.
3.1.3 “Bottom-up Approach” “Bottom-up”methods can proceed effectively where reliable data are obtained from the enterprises which use or consume the fuels. Generally, this means that the approach is most satisfactory in manufacturing enterprises owning large combustion plant and the energy conversion industries. In many of the other source categories the approach uses models of the main activities based upon the stock of the fuel consuming equipment and/or the level of activity directly correlated with fuel consumption. The model results are checked against or constrained by the figures for deliveries of the fuels to the source category or group of source categories containing the activities of interest.
3 . 2 C a l o r i f i c v a l u e s a n d e mi s s i o n f a c t o r s The calorific values and emission factors (or more correctly, the carbon content) of fuels are both intrinsic properties of fuels.
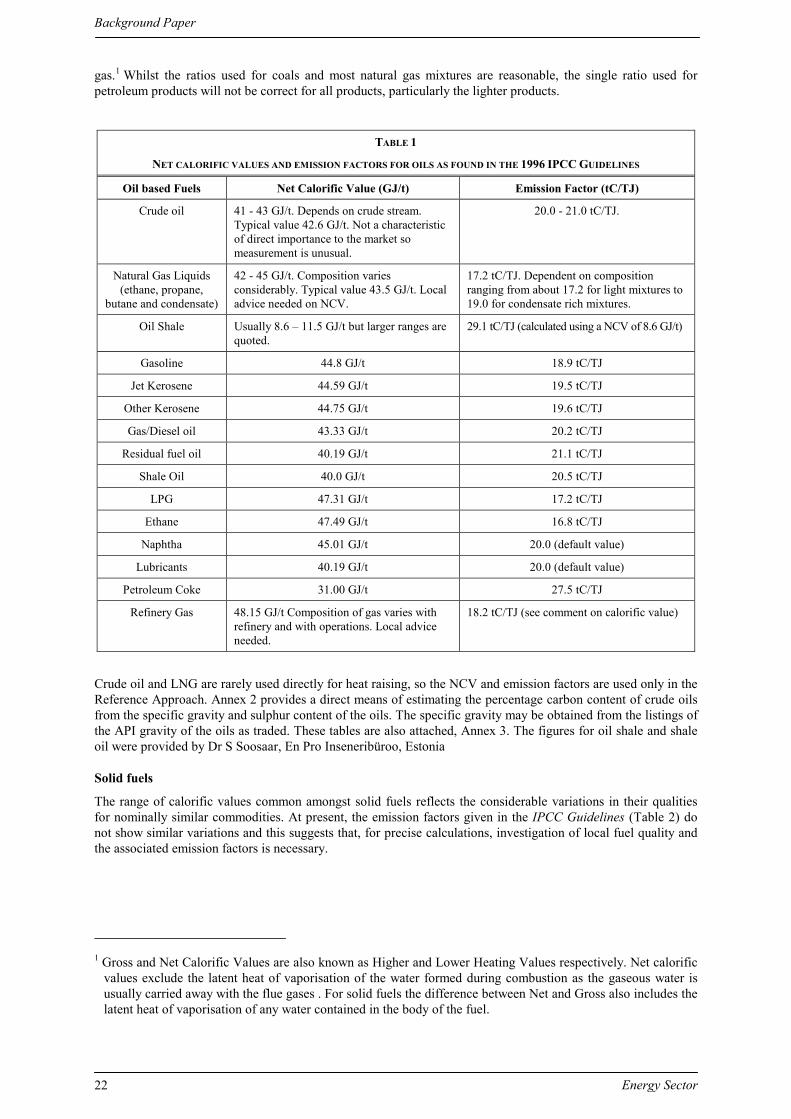
The table below repeats the values for net calorific values and emission factors found in the IPCC Guidelines. Where there is a wide variation reported a range of values is given which encompasses the majority but not the extreme values. It is evident from the IPCC Guidelines that, for a number of countries, default values are used for crude oil and liquefied natural gas (LNG).
For the countries who report to the OECD and Eurostat, net calorific values for energy commodities are contained in the completed questionnaires.
The emission factors shown below are taken from various sources which have derived them from empirical studies or measurement (Table 1). In the source papers, the emission factors have sometimes been expressed as specific carbon content using gross calorific values. The factors have then been converted to a net calorific basis by the IEA using approximate figures for the net/gross ratio. These are 0.95 for coal and oil, and 0.9 for natural
Background Paper
Energy Sector 22
gas.1 Whilst the ratios used for coals and most natural gas mixtures are reasonable, the single ratio used for petroleum products will not be correct for all products, particularly the lighter products.
TABLE 1
NET CALORIFIC VALUES AND EMISSION FACTORS FOR OILS AS FOUND IN THE 1996 IPCC GUIDELINES
Oil based Fuels Net Calorific Value (GJ/t) Emission Factor (tC/TJ)
Crude oil 41 - 43 GJ/t. Depends on crude stream. Typical value 42.6 GJ/t. Not a characteristic of direct importance to the market so measurement is unusual.
20.0 - 21.0 tC/TJ.
Natural Gas Liquids (ethane, propane,
butane and condensate)
42 - 45 GJ/t. Composition varies considerably. Typical value 43.5 GJ/t. Local advice needed on NCV.
17.2 tC/TJ. Dependent on composition ranging from about 17.2 for light mixtures to 19.0 for condensate rich mixtures.
Oil Shale Usually 8.6 – 11.5 GJ/t but larger ranges are quoted.
29.1 tC/TJ (calculated using a NCV of 8.6 GJ/t)
Gasoline 44.8 GJ/t 18.9 tC/TJ
Jet Kerosene 44.59 GJ/t 19.5 tC/TJ
Other Kerosene 44.75 GJ/t 19.6 tC/TJ
Gas/Diesel oil 43.33 GJ/t 20.2 tC/TJ
Residual fuel oil 40.19 GJ/t 21.1 tC/TJ
Shale Oil 40.0 GJ/t 20.5 tC/TJ
LPG 47.31 GJ/t 17.2 tC/TJ
Ethane 47.49 GJ/t 16.8 tC/TJ
Naphtha 45.01 GJ/t 20.0 (default value)
Lubricants 40.19 GJ/t 20.0 (default value)
Petroleum Coke 31.00 GJ/t 27.5 tC/TJ
Refinery Gas 48.15 GJ/t Composition of gas varies with refinery and with operations. Local advice needed.
18.2 tC/TJ (see comment on calorific value)
Crude oil and LNG are rarely used directly for heat raising, so the NCV and emission factors are used only in the Reference Approach. Annex 2 provides a direct means of estimating the percentage carbon content of crude oils from the specific gravity and sulphur content of the oils. The specific gravity may be obtained from the listings of the API gravity of the oils as traded. These tables are also attached, Annex 3. The figures for oil shale and shale oil were provided by Dr S Soosaar, En Pro Inseneribüroo, Estonia
Solid fuels
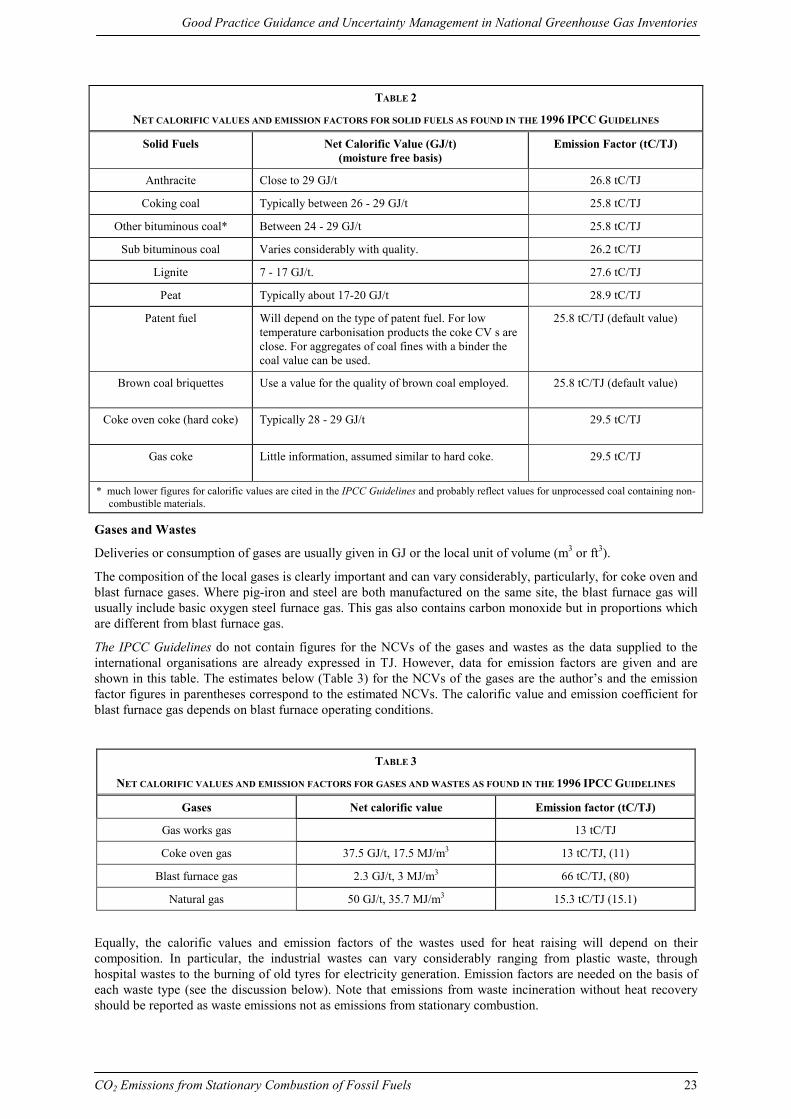
The range of calorific values common amongst solid fuels reflects the considerable variations in their qualities for nominally similar commodities. At present, the emission factors given in the IPCC Guidelines (Table 2) do not show similar variations and this suggests that, for precise calculations, investigation of local fuel quality and the associated emission factors is necessary.
1 Gross and Net Calorific Values are also known as Higher and Lower Heating Values respectively. Net calorific
values exclude the latent heat of vaporisation of the water formed during combustion as the gaseous water is usually carried away with the flue gases . For solid fuels the difference between Net and Gross also includes the latent heat of vaporisation of any water contained in the body of the fuel.
Good Practice Guidance and Uncertainty Management in National Greenhouse Gas Inventories
CO2 Emissions from Stationary Combustion of Fossil Fuels 23
TABLE 2
NET CALORIFIC VALUES AND EMISSION FACTORS FOR SOLID FUELS AS FOUND IN THE 1996 IPCC GUIDELINES
Solid Fuels Net Calorific Value (GJ/t) (moisture free basis)
Emission Factor (tC/TJ)
Anthracite Close to 29 GJ/t 26.8 tC/TJ
Coking coal Typically between 26 - 29 GJ/t 25.8 tC/TJ
Other bituminous coal* Between 24 - 29 GJ/t 25.8 tC/TJ
Sub bituminous coal Varies considerably with quality. 26.2 tC/TJ
Lignite 7 - 17 GJ/t. 27.6 tC/TJ
Peat Typically about 17-20 GJ/t 28.9 tC/TJ
Patent fuel Will depend on the type of patent fuel. For low temperature carbonisation products the coke CV s are close. For aggregates of coal fines with a binder the coal value can be used.
25.8 tC/TJ (default value)
Brown coal briquettes Use a value for the quality of brown coal employed. 25.8 tC/TJ (default value)
Coke oven coke (hard coke) Typically 28 - 29 GJ/t 29.5 tC/TJ
Gas coke Little information, assumed similar to hard coke. 29.5 tC/TJ
* much lower figures for calorific values are cited in the IPCC Guidelines and probably reflect values for unprocessed coal containing non-combustible materials.
Gases and Wastes
Deliveries or consumption of gases are usually given in GJ or the local unit of volume (m3 or ft3).
The composition of the local gases is clearly important and can vary considerably, particularly, for coke oven and blast furnace gases. Where pig-iron and steel are both manufactured on the same site, the blast furnace gas will usually include basic oxygen steel furnace gas. This gas also contains carbon monoxide but in proportions which are different from blast furnace gas.
The IPCC Guidelines do not contain figures for the NCVs of the gases and wastes as the data supplied to the international organisations are already expressed in TJ. However, data for emission factors are given and are shown in this table. The estimates below (Table 3) for the NCVs of the gases are the author’s and the emission factor figures in parentheses correspond to the estimated NCVs. The calorific value and emission coefficient for blast furnace gas depends on blast furnace operating conditions.
TABLE 3
NET CALORIFIC VALUES AND EMISSION FACTORS FOR GASES AND WASTES AS FOUND IN THE 1996 IPCC GUIDELINES
Gases Net calorific value Emission factor (tC/TJ)
Gas works gas 13 tC/TJ
Coke oven gas 37.5 GJ/t, 17.5 MJ/m3 13 tC/TJ, (11)
Blast furnace gas 2.3 GJ/t, 3 MJ/m3 66 tC/TJ, (80)
Natural gas 50 GJ/t, 35.7 MJ/m3 15.3 tC/TJ (15.1)
Equally, the calorific values and emission factors of the wastes used for heat raising will depend on their composition. In particular, the industrial wastes can vary considerably ranging from plastic waste, through hospital wastes to the burning of old tyres for electricity generation. Emission factors are needed on the basis of each waste type (see the discussion below). Note that emissions from waste incineration without heat recovery should be reported as waste emissions not as emissions from stationary combustion.
Background Paper
Energy Sector 24
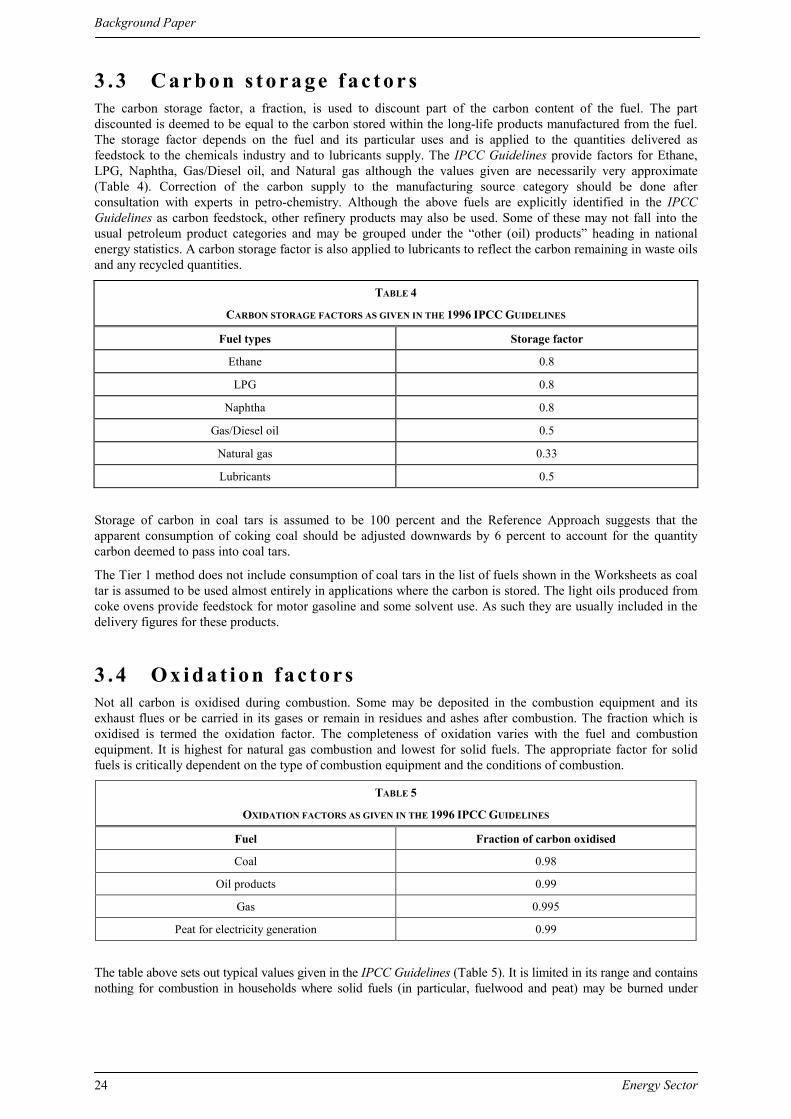
3 . 3 C a r b o n s t o r a g e f a c t o r s The carbon storage factor, a fraction, is used to discount part of the carbon content of the fuel. The part discounted is deemed to be equal to the carbon stored within the long-life products manufactured from the fuel. The storage factor depends on the fuel and its particular uses and is applied to the quantities delivered as feedstock to the chemicals industry and to lubricants supply. The IPCC Guidelines provide factors for Ethane, LPG, Naphtha, Gas/Diesel oil, and Natural gas although the values given are necessarily very approximate (Table 4). Correction of the carbon supply to the manufacturing source category should be done after consultation with experts in petro-chemistry. Although the above fuels are explicitly identified in the IPCC Guidelines as carbon feedstock, other refinery products may also be used. Some of these may not fall into the usual petroleum product categories and may be grouped under the “other (oil) products” heading in national energy statistics. A carbon storage factor is also applied to lubricants to reflect the carbon remaining in waste oils and any recycled quantities.
TABLE 4
CARBON STORAGE FACTORS AS GIVEN IN THE 1996 IPCC GUIDELINES
Fuel types Storage factor
Ethane 0.8
LPG 0.8
Naphtha 0.8
Gas/Diesel oil 0.5
Natural gas 0.33
Lubricants 0.5
Storage of carbon in coal tars is assumed to be 100 percent and the Reference Approach suggests that the apparent consumption of coking coal should be adjusted downwards by 6 percent to account for the quantity carbon deemed to pass into coal tars.
The Tier 1 method does not include consumption of coal tars in the list of fuels shown in the Worksheets as coal tar is assumed to be used almost entirely in applications where the carbon is stored. The light oils produced from coke ovens provide feedstock for motor gasoline and some solvent use. As such they are usually included in the delivery figures for these products.
3 . 4 Ox i d a t i o n f a c t o r s Not all carbon is oxidised during combustion. Some may be deposited in the combustion equipment and its exhaust flues or be carried in its gases or remain in residues and ashes after combustion. The fraction which is oxidised is termed the oxidation factor. The completeness of oxidation varies with the fuel and combustion equipment. It is highest for natural gas combustion and lowest for solid fuels. The appropriate factor for solid fuels is critically dependent on the type of combustion equipment and the conditions of combustion.
TABLE 5
OXIDATION FACTORS AS GIVEN IN THE 1996 IPCC GUIDELINES
Fuel Fraction of carbon oxidised
Coal 0.98
Oil products 0.99
Gas 0.995
Peat for electricity generation 0.99
The table above sets out typical values given in the IPCC Guidelines (Table 5). It is limited in its range and contains nothing for combustion in households where solid fuels (in particular, fuelwood and peat) may be burned under
Good Practice Guidance and Uncertainty Management in National Greenhouse Gas Inventories
CO2 Emissions from Stationary Combustion of Fossil Fuels 25
conditions where combustion is restricted and particulate carbon formed. The Reference Manual (Vo.l 3) of the IPCC Guidelines contains some additional information of the combustion of coal in different types of coal burners.
In the absence of detailed figures for the oxidation factor a value of 0.99 is recommended.
4 G O O D P R A C T I C E I N S E L E C T I O N O F M E T H O D S A N D D A T A
The aim is to prepare accurate, comparable and transparent inventories. Good practice guidance is intended to improve the chances of meeting these objectives. Accuracy is determined by the quality of the data, including its completeness and the comprehensiveness of the methodologies employed. Comparability results from the use of common methodologies and transparency from the completeness of the reporting and documentation in which both the results and the starting point and path to the results is clearly explained.
In the discussion of good practice for the preparation and reporting of greenhouse gas (GHG) inventories, it will be important to distinguish between recommendations concerning choices of methods and values and recommendations for work to improve the quality of data of all types.
Choice of estimation method
The primary decision facing those estimating CO2 emissions from fuel combustion is which method to use. The choice is between the Reference Approach, the Sectoral Approach by main source categories, a combination of the SA for some source categories, detailed estimates based on combustion plant in some sectors, and/or actual emission measurements. The choice is entirely dictated by data availability; both activity data and emission factors. Countries with a good statistical coverage of the main source categories and technical studies of point and area sources may use any of the methods but would be expected to adopt the more detailed and accurate “bottom-up” methods. Countries with fewer data will be obliged to adopt the simpler methods.
Where countries are employing continuous emissions measurement systems (CEMS) for the measurement of non - CO2 gases they can also be used for CO2 measurements. However, the accurate calibration of the measurement system is not a trivial matter and direct measurements of CO2 should not be assumed to lead automatically to the most accurate emission estimates.
Determination of calorific values and emission factors
The calorific values of traded fuels may be obtained from the fuel suppliers. For non-traded fuels, for example, municipal, industrial and specialised wastes, the operators of the combustion plants may be able to provide average calorific values. However, it is usual for the quantity combusted to be expressed in GJ and obtained from the boiler operating conditions. In this case a calorific value is not required.
The emission factors (carbon content, tC/TJ) of fuels are less readily available. The large producer/suppliers can provide estimates based on their own fuel research. The relationship between carbon content and calorific value for bituminous coals is reasonably linear and confirms the IPCC default values. More care is needed in establishing the emission factors for sub-bituminous coals including lignites and the various types solid wastes mentioned above.
If, for commonly traded fuels, the locally available values for either calorific values or emission factors differ by more than two percent from the default values published in the IPCC Guidelines then reasons for the difference should be found. In any continuing cases of doubt the local value should be used.
Obtaining storage factors
Storage factors are applied for petro-chemical feedstock, lubricants and bitumen. Mixtures of propane and butane, naphtha and gas oils may all be used as chemical feedstock. The fraction of the carbon they contain which is eventually stored in long-life products made from them can be determined accurately only through consultation with the manufacturers.2 The default values given in the IPCC Guidelines are, at best, approximate figures. A factor of 0.5 is suggested for lubricants and will depend on the extent to which waste lubricants are 2 See also : “International Network on Non-Energy Use and CO2 emissions. An activity within the European
Commissions’s ENRICH programme, DG RTD, “Environment and Climate”. July 2000. http://www.eu.fhg.de/NENERGY/.
Background Paper
Energy Sector 26
collected and used for other purposes. All of the carbon contained in bitumen may be regarded as entering long-term storage.
Oxidation factor
The default values given in the IPCC Guidelines for natural gas and oil products may be used with confidence. The uncertainties introduced into the emission estimates through the oxidation factor are related to obtaining a reliable factor for solid fuels. The IPCC Guidelines, Vol.3 discusses this point and the variability in oxidation factors for different types of coal combustion equipment. The discussion illustrates how oxidation factors for coal can differ by several percentage points and, for countries where coal is an important fuel for electricity generation and industrial use direct contact is strongly advised with the major companies involved in coal burning.
5 C OM P L E T E N E S S OF T HE E S T I M A T E S The completeness of the estimates depends upon the comprehensiveness of the methodologies used and the coverage of the activity data. When choosing the method for estimating emissions it is important to be confident that all stationary combustion sources are naturally included in the approach adopted. Similarly, when choosing data sources and fuels, their uses and coverage must be well understood so that any potential double counts or omissions can be identified and corrected. It is evident that each of the three approaches discussed in this paper (RA, SA and “bottom-up”) have their strengths and weaknesses. The first two can include emissions which are not from stationary combustion and, where estimates of emissions from stationary combustion are required, adjustment of the total for the mobile contribution is needed. Equally, deliberate steps are necessary to ensure that emissions from non-traded fuels are included. The ‘bottom-up” approach aggregates emissions from each of the many sources and is the most accurate method provided that the compilers can be confident that all sources have been identified and included and the relevant data are of good quality. It is clear that, where countries have the data to prepare estimates using more than one methodology, a comparison of the results can throw light on differences which may be caused by omissions or double counts. Countries that are able to prepare inventories using several methods should do so.
6 U N C E R T A I N T Y O F E S T I M A T E S The uncertainty of the emission estimates reflects both the systematic and the random errors in the data which lead to the estimate. In accordance with IPCC recommendations, uncertainty is expressed as a percentage(s) of the estimate using its 95 percent confidence levels. The confidence levels are not necessarily symmetrical about the estimate. It has to be recognised that it is rarely the case that the uncertainty in the basic data or the final estimates can be established by rigorous means. It is more the result of judgement by those working closely with the underlying data and the inventory preparation.
6 . 1 S y s t e ma t i c e r r o r s Statistics of fuels deliveries and, for electricity and heat generation, consumption are usually collected by regular survey of fuel producers and suppliers and the energy industries’ own fuel use.
Systematic errors may exist in related energy commodities but with opposite sign. For example, crude oil production, as reported, may contain some natural gas liquids which are removed before the use of the crude oil. The supply of natural gas liquids will be understated and that for crude oil overstated but by compensating amounts. Careful inspection of the commodity balances can reveal compensating systematic errors in many related fuels due to misclassification.
Some countries also survey enterprises’ consumption. The regularity of the survey system implies consistency of reporting and good tracking of trends. However, any failure to cover a part of the fuel market or non-traded fuels will underreport deliveries and consumption. Over-reporting, through double counting is less usual. Equally, the capacity of the survey system to identify correctly the economic activities (main source categories) of the consumers depends on the diligence with which the suppliers review the economic activity classification of their customers or, in the case of direct surveys of consumers conducted by national statisticians, the quality of the business registers.
Good Practice Guidance and Uncertainty Management in National Greenhouse Gas Inventories
CO2 Emissions from Stationary Combustion of Fossil Fuels 27
6 . 2 R a n d o m e r r o r s In addition to any systematic bias in the activity data as the result of incomplete coverage of consumption or fuels, the emission estimates will be subject to random errors from mistakes in data collection and inaccuracies in calorific values and emission factors all of which may vary from year to year. Countries with good data collection systems including data quality control may be expected to keep the random error in total recorded energy use to about two to three percent of the annual figure. This figure reflects the implicit confidence limits on total energy demand seen in models using the historical energy data and relating energy demand to economic factors. Percentage errors for individual energy use activities can be much larger. Note that this takes no account of the errors in the emission factors required for the emission calculations.
Uncertainties in calorific values usually reflect the uncertainty in the exact fuel composition. That is, whilst the fuel composition may be changing through the use of slightly different sources of supply monitoring, the corresponding calorific value may be less frequent. Usually, however, where fuels are sold commercially there is a legal obligation to provide fuels (particularly to large consumers) with calorific values within certain ranges. For the commonly traded fuels, a typical uncertainty in the figure provided by the supplier would be ± 3 percent. For non-traded fuels and wastes the uncertainty is much higher, probably reaching 10 to 15 percent.
7 R E P O R T I N G A N D D O C U M E N T A T I O N The worksheets provided in the IPCC Guidelines Vol. 2 provide a good framework for the assembly of the data and the procedure to be followed. Transparency is partly ensured by the rigorous recording of the sources for all of the variables involved in the calculation. A simple means of ensuring this, is to complete a copy of the worksheets with codes indicating the sources of the input data. The references, to which the codes correspond, are then listed separately. Last revision dates for calorific values and emission factors should be given. Where data sources are not available to the public, their use should be justified and the quality stated. The inventory should also be adequately described by explaining any deviations from the methodology as presented in the IPCC Guidelines and any special features of the results or factors affecting them.
The IPCC requires the worksheets for the RA (taken from Vol. 2 of the IPCC Guidelines) from all Parties for the purposes of comparability. It does not require other Vol.2 worksheets to be submitted. However, the IPCC requests worksheets supporting the national estimation method. Unfortunately, they will inevitably vary from one another in format and this lack of uniformity will complicate comparison of country inventories.
8 I N V E N T O R Y Q U A L I T Y
8 . 1 A s s e s s i n g t h e q u a l i t y o f a c t i v i t y d a t a Activity data for the Tier 1 methods are essentially the national energy statistics. Checks on their quality comprise of internal consistency checks using the commodity balances and external consistency checks using other sources of similar data. The balance checks use the conservation of mass and energy at various levels in the flow of an energy commodity from its extraction to its final disappearance as a commodity.
Balances for each fuel should, wherever possible, be constructed in mass units. Volume units are temperature dependent (and pressure dependent for gases) and require correction to standard conditions. If quantities are reported in energy units there is always a doubt whether the correct calorific value has been applied by the reporter(s) at each point of the flow of the fuel from production to final consumption.
Failure to record supply or demand fully will be shown as a consistent annual statistical difference between the total for each in the balance. There is no a priori reason why an excess of supply over demand cannot arise from an over-statement of supply and this sometimes occurs. However, obtaining good supply data involves surveying far fewer activities and reporting units than the number involved in surveys of demand. In addition, the reporting companies on the supply side are larger and better equipped to respond to questions concerning their supply data. Therefore, as a general but not invariable rule, any significant and regularly occurring excess of supply over demand usually implies incomplete (or erroneous) demand data. It is usual, however, for there to be small differences (not greater than ± 1.5 percent for the major fuels).
Background Paper
Energy Sector 28
If, when the commodity balances are expressed in energy units, the statistical differences change considerably in magnitude and/or sign then at least one of the calorific values is suspect. This check applies only when more than one calorific values are applicable to different parts of the balance.
Balances should be checked for compensating statistical differences across related commodities. For example, where balances are prepared for separate types of coal, a positive statistical difference on one coal type which is regularly compensated by a negative difference on another type suggests misclassification of coal types by either supplier or distributor.
There is no simple method of detecting systematic bias or misclassification of consumers in figures for deliveries of commonly used fuels to the main source categories (excluding energy industries). Where bias exists, evidence for it comes from independent surveys of consumption in enterprises or households.
Completeness of data for the fuel conversion processes, in refining, coke manufacture, blast furnace use and patent fuel manufacture can also be assessed through checks on the inputs and outputs expressed in mass, mass of carbon and energy. The quantities entering the conversion processes and those leaving, each expressed in the three types of unit should balance after known losses are taken into account. Heat losses from blast furnaces are considerable and the carbon in the limestone should not be overlooked when constructing the carbon balance. Emissions from blast furnaces are part of Industrial Processes emissions and not fuel combustion. Nevertheless, these checks should be applied to the blast furnace data (activity data, calorific values and emission factors) in order to confirm their completeness or at least, expose major omissions.
External checks on activity data are very dependent on what other sources are available and this depends upon the country approach to national energy supply and use. Where pollution control legislation exists and regulates the activities of large energy users, the reporting it entails can provide independent data on fuel consumption as well as the related emissions. In view of the magnitude of the combustion plants involved, this can be a useful check on the reporting for national energy data and improving the overall balance quality. Independent surveys of consumption may also be conducted for certain consumer groups (for example, households) and also provide the opportunity to check deliveries information.
8 . 2 A s s e s s i n g t h e q u a l i t y o f c a l o r i f i c v a l u e s a n d e mi s s i o n f a c t o r s
The balance checks on activity data when expressed in energy units and carbon content also throw light on the adequacy of the net calorific values and the emission factors. If a balance is achieved in mass and energy terms but not in terms of the mass of carbon then it is likely that one or more of the emission factors is incorrect. Beyond the “internal” checks there are relatively few independent means of checking the values other than access to direct measurement by fuel laboratories or sites with emission measurement equipment using the fuel in question.
8 . 3 U s i n g t h e R A t o c h e c k i n v e n t o r y r e s u l t s The IPCC Guidelines require that inventories prepared using methods other than the RA be compared with the RA and that any significant differences be explained. For this check to be of value, the nature of the RA and the range of emissions covered by it should be appreciated. The basis of the RA is the identification and accounting of carbon flows into the nation from extraction from national reserves, net imports (imports - exports) and net stock draw. The method described in the IPCC Guidelines adjusts the total for any carbon not likely to be released in the short term and (for policy reasons) any carbon delivered in fuels for international transport. It is this principle which constitutes the RA and the estimate of emissions calculated from it should be made using the calorific values, emission factors, storage factors and oxidation factors which are used for the preferred national method. The default factors provided in the IPCC Guidelines are not part of the RA but are offered for use where national factors are not available.
The paragraphs which follow set out the types of emission which are naturally included within the high-level “top-down” RA. In some cases, (explicitly indicated below), most of the emissions arise from the fossil fuel carbon recorded in energy statistics but some are attributable to carbon (of fossil fuel origin) imported in organic chemicals or intermediate products containing organic compounds. Although this contribution to the national carbon flow, for most countries, is very small, those with a large carbon flow from foreign trade in organic chemicals and derived products in primary forms may wish to estimate the effects of the flow when checking
Good Practice Guidance and Uncertainty Management in National Greenhouse Gas Inventories
CO2 Emissions from Stationary Combustion of Fossil Fuels 29
their CO2 inventory against the RA. Similar trade corrections may also be needed if the supply of carbon anodes (principally to the aluminium industry) relies upon their import.
The types of carbon emissions covered by the RA may be grouped as follows:
• All emissions from combustion of fossil fuels including the combustion/oxidation occurring in the industrial processes identified in Chapter 2, Vol. 3 of the IPCC Guidelines, namely:
(i) Production of ammonia;
(ii) Silicon carbide;
(iii) Calcium carbide;
(iv) Soda ash, Solvay process (from calcining), and
(v) Iron and steel, ferroalloys and other metals (however, see remark above on dependence of supply of carbon anodes on imports)
• All fugitive emissions from the transport and use of fossil fuels and derived products. The transport and use occurs after a point at which their production (or import) is measured. Emissions prior to these points are not included in the RA, viz:
(a ) Emissions in the transport and use of gas and oil products as fuels.
(b) Production and use of halocarbons
(c ) Organic chemical and primary plastics manufacture
(d) Asphalt manufacture and use, and
(e) Adipic acid.
• Short-life wastes comprising used oils, used solvents and plastics, and
• There may be some emissions as the result of combustion/oxidation of feedstock used for these production activities.
Reconciliation of the results of an RA inventory with those obtained from other methods will therefore need to take these additional sources into account either by subtracting their estimated contributions from the RA total or by adding their contributions to the estimate of emissions from fuel combustion obtained by alternative methods.
9 C O N C L U S I O N S • Wherever data availability permits the most detailed method for the estimation of emissions should be
adopted for the inventory. However, if possible, several of the methods should be applied as any significant differences will reveal possible errors or omissions.
• The various methods for the estimation of CO2 from stationary combustion differ in their capacity to exclude emissions from mobile sources. The methods using the most detailed activity data are the most successful in this respect.
• The coverage of the source categories for carbon emissions implicit in the Reference Approach should be carefully considered when comparing the results with other methods.
• Energy statisticians should be closely involved in the choice and use of energy data for the estimation of emissions.
• The distinctions made in the IPCC Guidelines (Vol. 3) between emissions from fuel combustion and from Industrial Processes (notably when estimating emissions from metal manufacture) should be carefully observed to avoid double counting.
• Similarly, when hydrocarbons are used for both energy and non-energy purposes in the same enterprise every effort should be made to obtain local expert knowledge rather than use the default carbon storage factors offered in the IPCC Guidelines.
• Further work is required to improve data on the use of waste oils for combustion and the fossil carbon content of wastes, in particular, Municipal Solid Wastes.
Background Paper
Energy Sector 30
• Differences between the classification of military fuel consumption in national energy statistics and that used in the IPCC Guidelines should be examined so that stationary and mobile consumption are not confounded in energy data.
• The simple default figures for the ratios of net to gross calorific values, used in the IPCC Guidelines for converting GCV to NCV, should be re-examined for the light petroleum products.
• Commodity, energy and carbon balances should be employed to check the overall adequacy of the energy data, calorific values and certain emission factors.
R E F E R E N C E S Revised 1996 IPCC GUIDELINES for National Greenhouse Gas Inventories Volumes 1, 2 and 3.
“International Network on Non-Energy Use and CO2 emissions. An activity within the European Commissions’s ENRICH programme, DG RTD, “Environment and Climate”. July 2000. http://www.eu.fhg.de/NENERGY/.
International Standard Industrial Classification of all Economic Activities, Series M No. 4, Rev. 3, United Nations, New York, 1990.
International Standard Industrial Classification of all Economic Activities, Series M No. 4, Rev. 3, United Nations, New York, 1990.
Good Practice Guidance and Uncertainty Management in National Greenhouse Gas Inventories
CO2 Emissions from Stationary Combustion of Fossil Fuels 31
ANNEX 1 UNDERSTANDING THE COMMON REPORTING FRAMEWORK
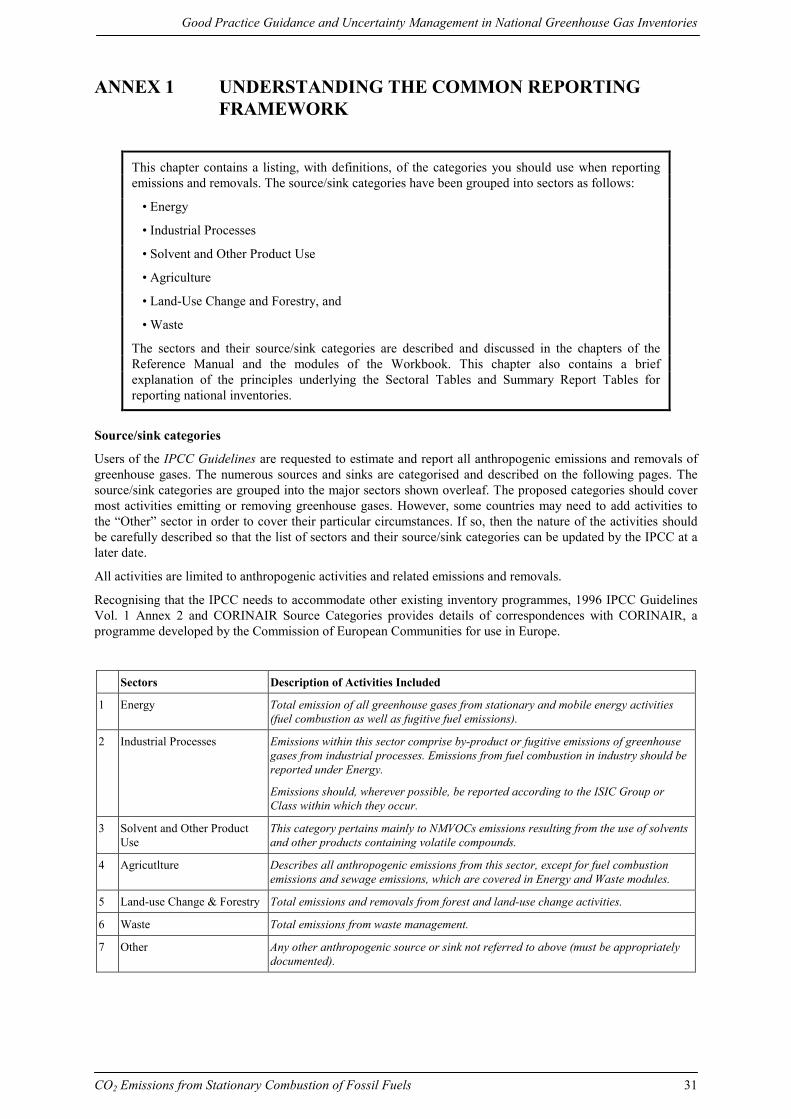
This chapter contains a listing, with definitions, of the categories you should use when reporting emissions and removals. The source/sink categories have been grouped into sectors as follows:
• Energy
• Industrial Processes
• Solvent and Other Product Use
• Agriculture
• Land-Use Change and Forestry, and
• Waste
The sectors and their source/sink categories are described and discussed in the chapters of the Reference Manual and the modules of the Workbook. This chapter also contains a brief explanation of the principles underlying the Sectoral Tables and Summary Report Tables for reporting national inventories.
Source/sink categories
Users of the IPCC Guidelines are requested to estimate and report all anthropogenic emissions and removals of greenhouse gases. The numerous sources and sinks are categorised and described on the following pages. The source/sink categories are grouped into the major sectors shown overleaf. The proposed categories should cover most activities emitting or removing greenhouse gases. However, some countries may need to add activities to the “Other” sector in order to cover their particular circumstances. If so, then the nature of the activities should be carefully described so that the list of sectors and their source/sink categories can be updated by the IPCC at a later date.
All activities are limited to anthropogenic activities and related emissions and removals.
Recognising that the IPCC needs to accommodate other existing inventory programmes, 1996 IPCC Guidelines Vol. 1 Annex 2 and CORINAIR Source Categories provides details of correspondences with CORINAIR, a programme developed by the Commission of European Communities for use in Europe.
Sectors Description of Activities Included
1 Energy Total emission of all greenhouse gases from stationary and mobile energy activities (fuel combustion as well as fugitive fuel emissions).
2 Industrial Processes Emissions within this sector comprise by-product or fugitive emissions of greenhouse gases from industrial processes. Emissions from fuel combustion in industry should be reported under Energy.
Emissions should, wherever possible, be reported according to the ISIC Group or Class within which they occur.
3 Solvent and Other Product Use
This category pertains mainly to NMVOCs emissions resulting from the use of solvents and other products containing volatile compounds.
4 Agricutlture Describes all anthropogenic emissions from this sector, except for fuel combustion emissions and sewage emissions, which are covered in Energy and Waste modules.
5 Land-use Change & Forestry Total emissions and removals from forest and land-use change activities.
6 Waste Total emissions from waste management.
7 Other Any other anthropogenic source or sink not referred to above (must be appropriately documented).
Background Paper
Energy Sector 32
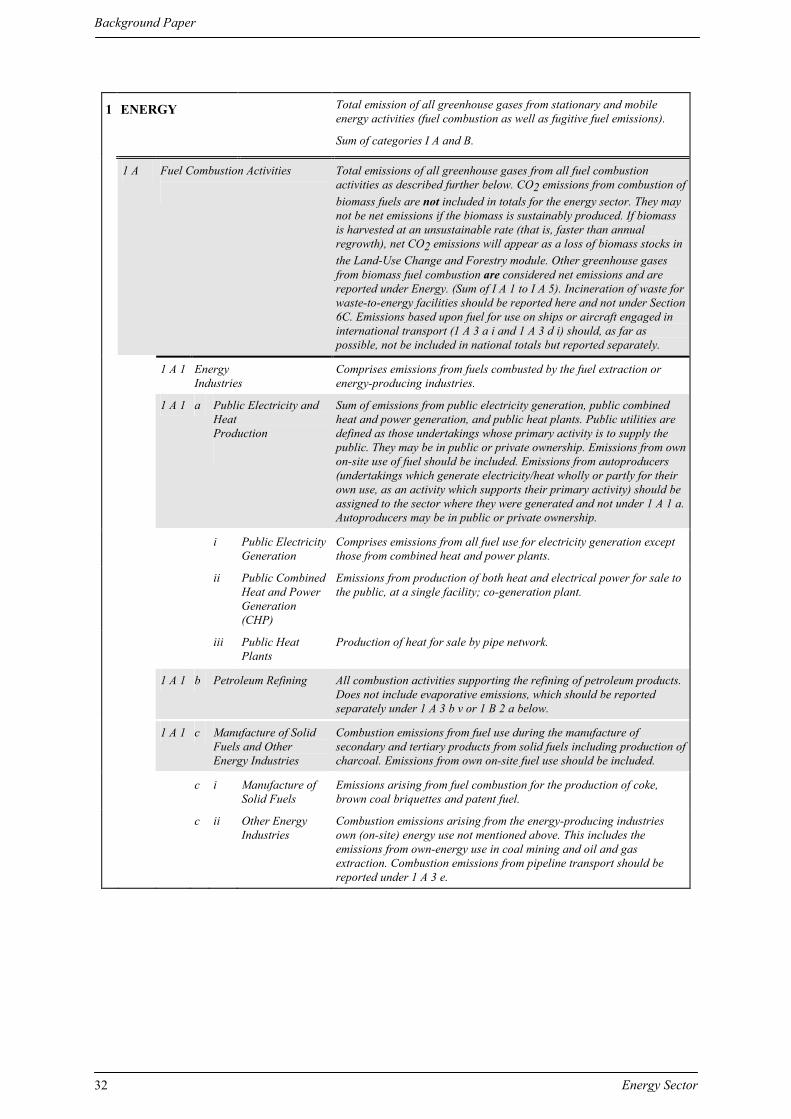
1 ENERGY
Total emission of all greenhouse gases from stationary and mobile energy activities (fuel combustion as well as fugitive fuel emissions).
Sum of categories I A and B.
1 A Fuel Combustion Activities
Total emissions of all greenhouse gases from all fuel combustion activities as described further below. CO2 emissions from combustion of biomass fuels are not included in totals for the energy sector. They may not be net emissions if the biomass is sustainably produced. If biomass is harvested at an unsustainable rate (that is, faster than annual regrowth), net CO2 emissions will appear as a loss of biomass stocks in the Land-Use Change and Forestry module. Other greenhouse gases from biomass fuel combustion are considered net emissions and are reported under Energy. (Sum of I A 1 to I A 5). Incineration of waste for waste-to-energy facilities should be reported here and not under Section 6C. Emissions based upon fuel for use on ships or aircraft engaged in international transport (1 A 3 a i and 1 A 3 d i) should, as far as possible, not be included in national totals but reported separately.
1 A 1 Energy Industries
Comprises emissions from fuels combusted by the fuel extraction or energy-producing industries.
1 A 1 a Public Electricity and Heat Production
Sum of emissions from public electricity generation, public combined heat and power generation, and public heat plants. Public utilities are defined as those undertakings whose primary activity is to supply the public. They may be in public or private ownership. Emissions from own on-site use of fuel should be included. Emissions from autoproducers (undertakings which generate electricity/heat wholly or partly for their own use, as an activity which supports their primary activity) should be assigned to the sector where they were generated and not under 1 A 1 a. Autoproducers may be in public or private ownership.
i Public Electricity Generation
Comprises emissions from all fuel use for electricity generation except those from combined heat and power plants.
ii Public Combined Heat and Power Generation (CHP)
Emissions from production of both heat and electrical power for sale to the public, at a single facility; co-generation plant.
iii Public Heat Plants
Production of heat for sale by pipe network.
1 A 1 b Petroleum Refining All combustion activities supporting the refining of petroleum products. Does not include evaporative emissions, which should be reported separately under 1 A 3 b v or 1 B 2 a below.
1 A 1 c Manufacture of Solid Fuels and Other Energy Industries
Combustion emissions from fuel use during the manufacture of secondary and tertiary products from solid fuels including production of charcoal. Emissions from own on-site fuel use should be included.
c i Manufacture of Solid Fuels
Emissions arising from fuel combustion for the production of coke, brown coal briquettes and patent fuel.
c ii Other Energy Industries
Combustion emissions arising from the energy-producing industries own (on-site) energy use not mentioned above. This includes the emissions from own-energy use in coal mining and oil and gas extraction. Combustion emissions from pipeline transport should be reported under 1 A 3 e.
Good Practice Guidance and Uncertainty Management in National Greenhouse Gas Inventories
CO2 Emissions from Stationary Combustion of Fossil Fuels 33
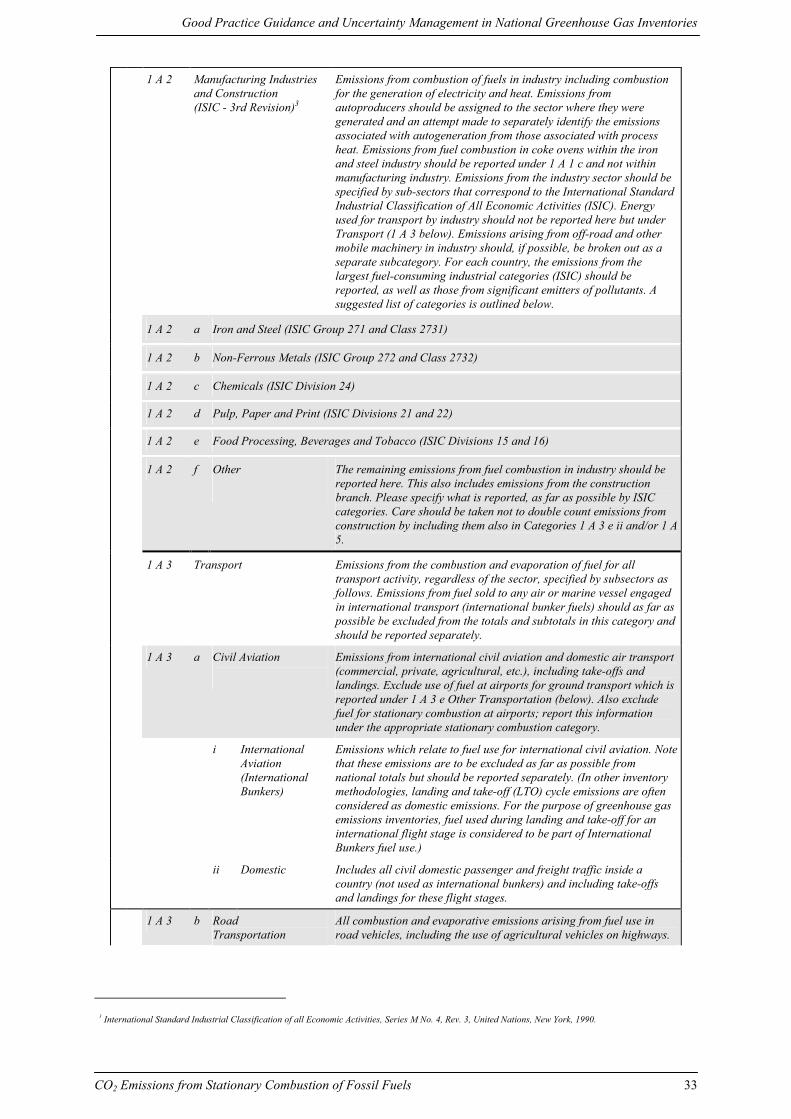
1 A 2 Manufacturing Industries and Construction (ISIC - 3rd Revision)3
Emissions from combustion of fuels in industry including combustion for the generation of electricity and heat. Emissions from autoproducers should be assigned to the sector where they were generated and an attempt made to separately identify the emissions associated with autogeneration from those associated with process heat. Emissions from fuel combustion in coke ovens within the iron and steel industry should be reported under 1 A 1 c and not within manufacturing industry. Emissions from the industry sector should be specified by sub-sectors that correspond to the International Standard Industrial Classification of All Economic Activities (ISIC). Energy used for transport by industry should not be reported here but under Transport (1 A 3 below). Emissions arising from off-road and other mobile machinery in industry should, if possible, be broken out as a separate subcategory. For each country, the emissions from the largest fuel-consuming industrial categories (ISIC) should be reported, as well as those from significant emitters of pollutants. A suggested list of categories is outlined below.
1 A 2 a Iron and Steel (ISIC Group 271 and Class 2731)
1 A 2 b Non-Ferrous Metals (ISIC Group 272 and Class 2732)
1 A 2 c Chemicals (ISIC Division 24)
1 A 2 d Pulp, Paper and Print (ISIC Divisions 21 and 22)
1 A 2 e Food Processing, Beverages and Tobacco (ISIC Divisions 15 and 16)
1 A 2 f Other
The remaining emissions from fuel combustion in industry should be reported here. This also includes emissions from the construction branch. Please specify what is reported, as far as possible by ISIC categories. Care should be taken not to double count emissions from construction by including them also in Categories 1 A 3 e ii and/or 1 A 5.
1 A 3 Transport
Emissions from the combustion and evaporation of fuel for all transport activity, regardless of the sector, specified by subsectors as follows. Emissions from fuel sold to any air or marine vessel engaged in international transport (international bunker fuels) should as far as possible be excluded from the totals and subtotals in this category and should be reported separately.
1 A 3 a Civil Aviation
Emissions from international civil aviation and domestic air transport (commercial, private, agricultural, etc.), including take-offs and landings. Exclude use of fuel at airports for ground transport which is reported under 1 A 3 e Other Transportation (below). Also exclude fuel for stationary combustion at airports; report this information under the appropriate stationary combustion category.
i International Aviation (International Bunkers)
Emissions which relate to fuel use for international civil aviation. Note that these emissions are to be excluded as far as possible from national totals but should be reported separately. (In other inventory methodologies, landing and take-off (LTO) cycle emissions are often considered as domestic emissions. For the purpose of greenhouse gas emissions inventories, fuel used during landing and take-off for an international flight stage is considered to be part of International Bunkers fuel use.)
ii Domestic Includes all civil domestic passenger and freight traffic inside a country (not used as international bunkers) and including take-offs and landings for these flight stages.
1 A 3 b Road Transportation
All combustion and evaporative emissions arising from fuel use in road vehicles, including the use of agricultural vehicles on highways.
3 International Standard Industrial Classification of all Economic Activities, Series M No. 4, Rev. 3, United Nations, New York, 1990.
Background Paper
Energy Sector 34
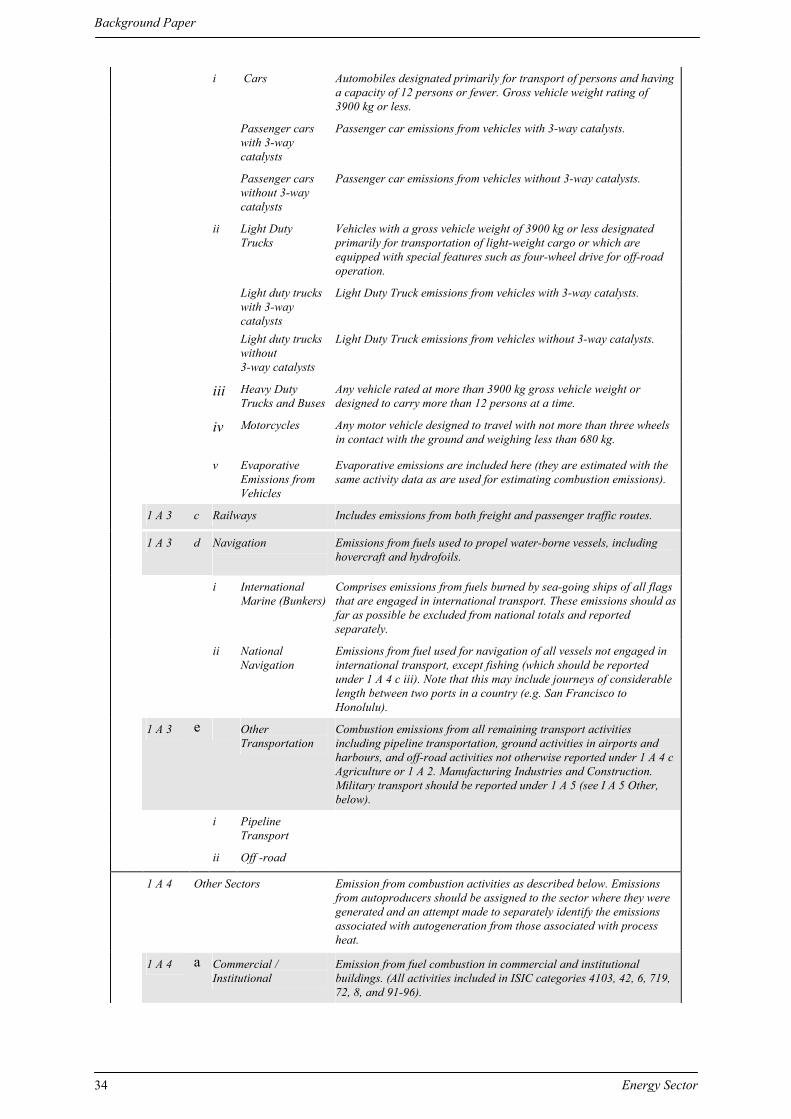
i Cars Automobiles designated primarily for transport of persons and having a capacity of 12 persons or fewer. Gross vehicle weight rating of 3900 kg or less.
Passenger cars with 3-way catalysts
Passenger car emissions from vehicles with 3-way catalysts.
Passenger cars without 3-way catalysts
Passenger car emissions from vehicles without 3-way catalysts.
ii Light Duty Trucks
Vehicles with a gross vehicle weight of 3900 kg or less designated primarily for transportation of light-weight cargo or which are equipped with special features such as four-wheel drive for off-road operation.
Light duty trucks with 3-way catalysts
Light Duty Truck emissions from vehicles with 3-way catalysts.
Light duty trucks without 3-way catalysts
Light Duty Truck emissions from vehicles without 3-way catalysts.
iii Heavy Duty Trucks and Buses
Any vehicle rated at more than 3900 kg gross vehicle weight or designed to carry more than 12 persons at a time.
iv Motorcycles Any motor vehicle designed to travel with not more than three wheels in contact with the ground and weighing less than 680 kg.
v Evaporative Emissions from Vehicles
Evaporative emissions are included here (they are estimated with the same activity data as are used for estimating combustion emissions).
1 A 3 c Railways Includes emissions from both freight and passenger traffic routes.
1 A 3 d Navigation
Emissions from fuels used to propel water-borne vessels, including hovercraft and hydrofoils.
i International Marine (Bunkers)
Comprises emissions from fuels burned by sea-going ships of all flags that are engaged in international transport. These emissions should as far as possible be excluded from national totals and reported separately.
ii National Navigation
Emissions from fuel used for navigation of all vessels not engaged in international transport, except fishing (which should be reported under 1 A 4 c iii). Note that this may include journeys of considerable length between two ports in a country (e.g. San Francisco to Honolulu).
1 A 3 e Other Transportation
Combustion emissions from all remaining transport activities including pipeline transportation, ground activities in airports and harbours, and off-road activities not otherwise reported under 1 A 4 c Agriculture or 1 A 2. Manufacturing Industries and Construction. Military transport should be reported under 1 A 5 (see I A 5 Other, below).
i Pipeline Transport
ii Off -road
1 A 4 Other Sectors
Emission from combustion activities as described below. Emissions from autoproducers should be assigned to the sector where they were generated and an attempt made to separately identify the emissions associated with autogeneration from those associated with process heat.
1 A 4 a Commercial / Institutional
Emission from fuel combustion in commercial and institutional buildings. (All activities included in ISIC categories 4103, 42, 6, 719, 72, 8, and 91-96).
Good Practice Guidance and Uncertainty Management in National Greenhouse Gas Inventories
CO2 Emissions from Stationary Combustion of Fossil Fuels 35
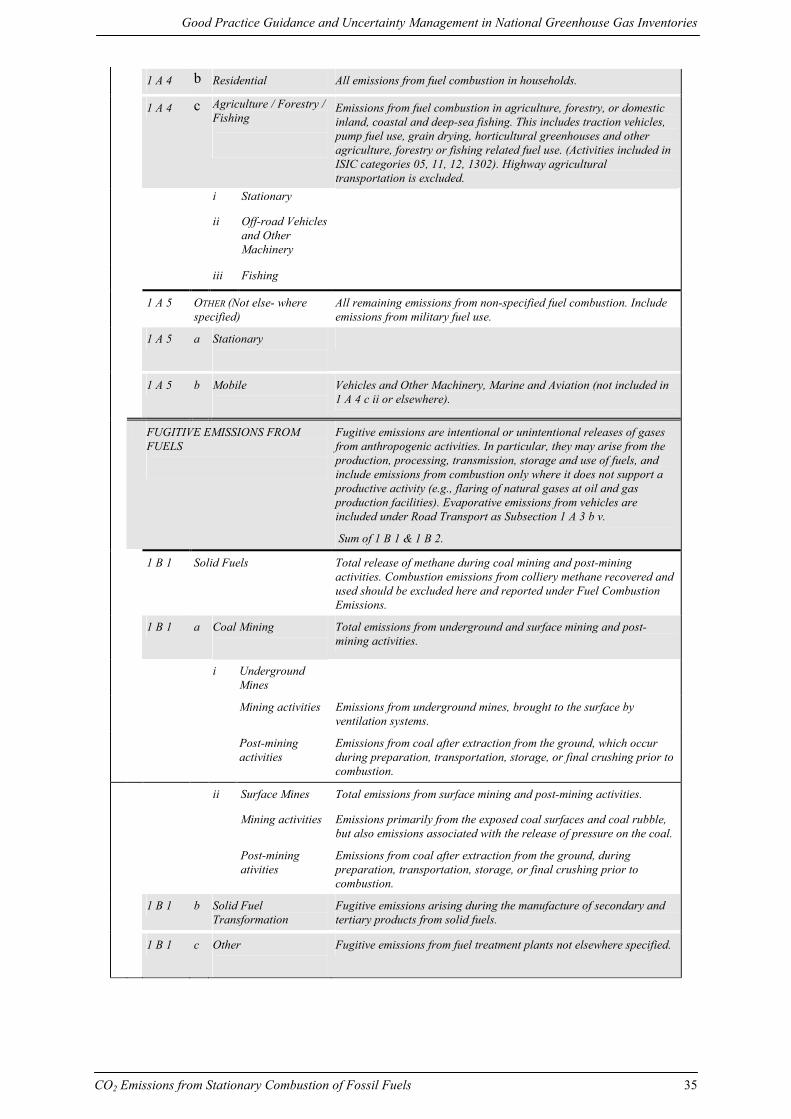
1 A 4 b Residential All emissions from fuel combustion in households.
1 A 4 c Agriculture / Forestry / Fishing
Emissions from fuel combustion in agriculture, forestry, or domestic inland, coastal and deep-sea fishing. This includes traction vehicles, pump fuel use, grain drying, horticultural greenhouses and other agriculture, forestry or fishing related fuel use. (Activities included in ISIC categories 05, 11, 12, 1302). Highway agricultural transportation is excluded.
i Stationary
ii Off-road Vehicles and Other Machinery
iii Fishing
1 A 5 OTHER (Not else- where specified)
All remaining emissions from non-specified fuel combustion. Include emissions from military fuel use.
1 A 5 a Stationary
1 A 5 b Mobile
Vehicles and Other Machinery, Marine and Aviation (not included in 1 A 4 c ii or elsewhere).
FUGITIVE EMISSIONS FROM FUELS
Fugitive emissions are intentional or unintentional releases of gases from anthropogenic activities. In particular, they may arise from the production, processing, transmission, storage and use of fuels, and include emissions from combustion only where it does not support a productive activity (e.g., flaring of natural gases at oil and gas production facilities). Evaporative emissions from vehicles are included under Road Transport as Subsection 1 A 3 b v.
Sum of 1 B 1 & 1 B 2.
1 B 1 Solid Fuels
Total release of methane during coal mining and post-mining activities. Combustion emissions from colliery methane recovered and used should be excluded here and reported under Fuel Combustion Emissions.
1 B 1 a Coal Mining
Total emissions from underground and surface mining and post-mining activities.
i Underground Mines
Mining activities Emissions from underground mines, brought to the surface by ventilation systems.
Post-mining activities
Emissions from coal after extraction from the ground, which occur during preparation, transportation, storage, or final crushing prior to combustion.
ii Surface Mines Total emissions from surface mining and post-mining activities.
Mining activities Emissions primarily from the exposed coal surfaces and coal rubble, but also emissions associated with the release of pressure on the coal.
Post-mining ativities
Emissions from coal after extraction from the ground, during preparation, transportation, storage, or final crushing prior to combustion.
1 B 1 b Solid Fuel Transformation
Fugitive emissions arising during the manufacture of secondary and tertiary products from solid fuels.
1 B 1 c Other
Fugitive emissions from fuel treatment plants not elsewhere specified.
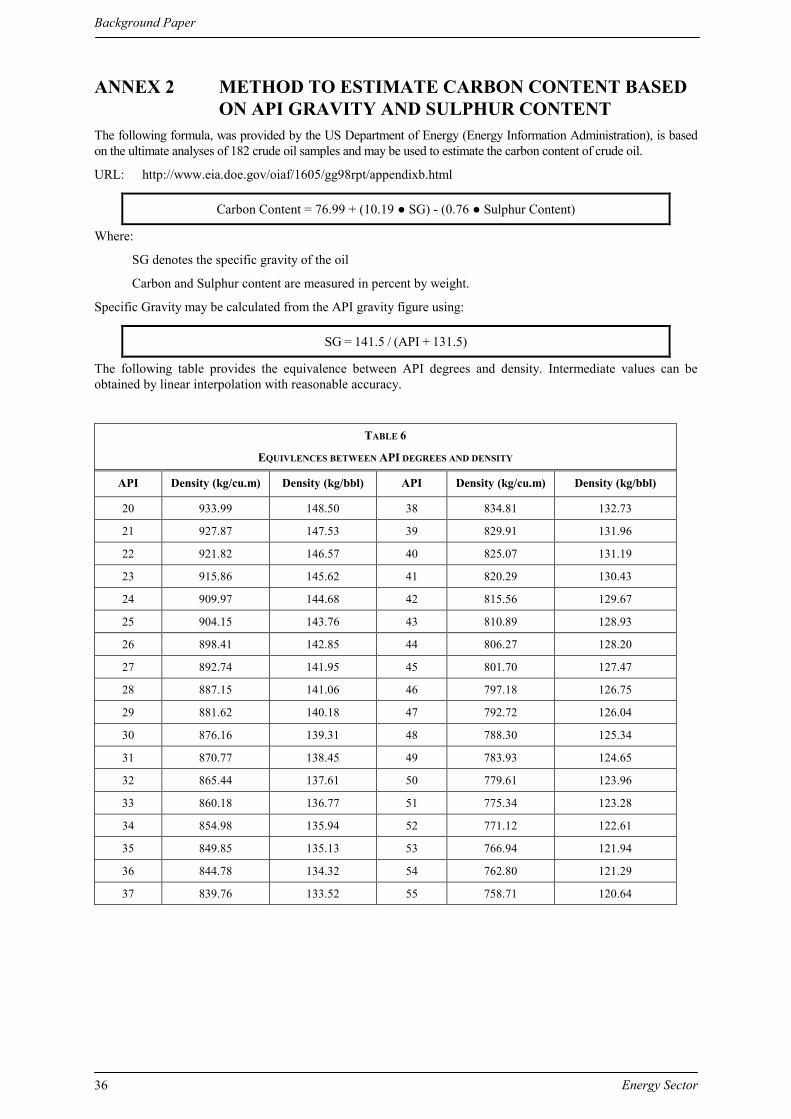
Background Paper
Energy Sector 36
ANNEX 2 METHOD TO ESTIMATE CARBON CONTENT BASED ON API GRAVITY AND SULPHUR CONTENT
The following formula, was provided by the US Department of Energy (Energy Information Administration), is based on the ultimate analyses of 182 crude oil samples and may be used to estimate the carbon content of crude oil.
URL: http://www.eia.doe.gov/oiaf/1605/gg98rpt/appendixb.html
Carbon Content = 76.99 + (10.19 ● SG) - (0.76 ● Sulphur Content)
Where:
SG denotes the specific gravity of the oil
Carbon and Sulphur content are measured in percent by weight.
Specific Gravity may be calculated from the API gravity figure using:
SG = 141.5 / (API + 131.5)
The following table provides the equivalence between API degrees and density. Intermediate values can be obtained by linear interpolation with reasonable accuracy.
TABLE 6
EQUIVLENCES BETWEEN API DEGREES AND DENSITY
API Density (kg/cu.m) Density (kg/bbl) API Density (kg/cu.m) Density (kg/bbl)
20 933.99 148.50 38 834.81 132.73
21 927.87 147.53 39 829.91 131.96
22 921.82 146.57 40 825.07 131.19
23 915.86 145.62 41 820.29 130.43
24 909.97 144.68 42 815.56 129.67
25 904.15 143.76 43 810.89 128.93
26 898.41 142.85 44 806.27 128.20
27 892.74 141.95 45 801.70 127.47
28 887.15 141.06 46 797.18 126.75
29 881.62 140.18 47 792.72 126.04
30 876.16 139.31 48 788.30 125.34
31 870.77 138.45 49 783.93 124.65
32 865.44 137.61 50 779.61 123.96
33 860.18 136.77 51 775.34 123.28
34 854.98 135.94 52 771.12 122.61
35 849.85 135.13 53 766.94 121.94
36 844.78 134.32 54 762.80 121.29
37 839.76 133.52 55 758.71 120.64
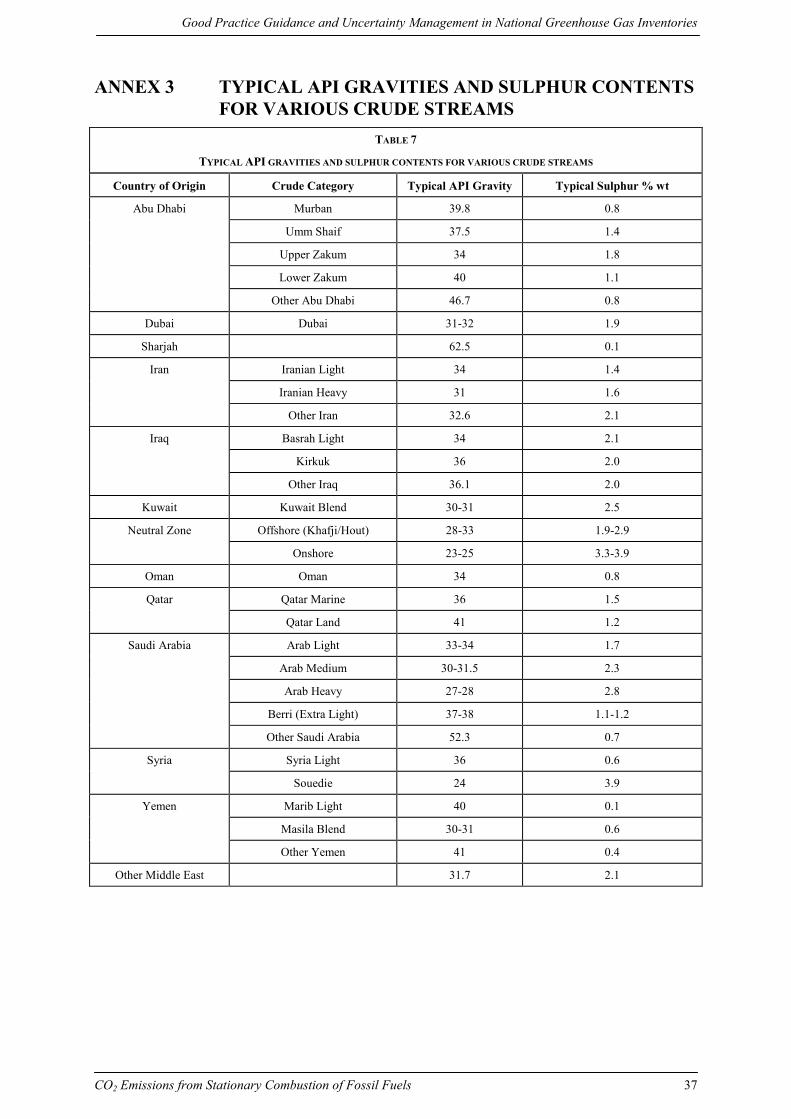
Good Practice Guidance and Uncertainty Management in National Greenhouse Gas Inventories
CO2 Emissions from Stationary Combustion of Fossil Fuels 37
ANNEX 3 TYPICAL API GRAVITIES AND SULPHUR CONTENTS FOR VARIOUS CRUDE STREAMS
TABLE 7
TYPICAL API GRAVITIES AND SULPHUR CONTENTS FOR VARIOUS CRUDE STREAMS
Country of Origin Crude Category Typical API Gravity Typical Sulphur % wt
Abu Dhabi Murban 39.8 0.8
Umm Shaif 37.5 1.4
Upper Zakum 34 1.8
Lower Zakum 40 1.1
Other Abu Dhabi 46.7 0.8
Dubai Dubai 31-32 1.9
Sharjah 62.5 0.1
Iran Iranian Light 34 1.4
Iranian Heavy 31 1.6
Other Iran 32.6 2.1
Iraq Basrah Light 34 2.1
Kirkuk 36 2.0
Other Iraq 36.1 2.0
Kuwait Kuwait Blend 30-31 2.5
Neutral Zone Offshore (Khafji/Hout) 28-33 1.9-2.9
Onshore 23-25 3.3-3.9
Oman Oman 34 0.8
Qatar Qatar Marine 36 1.5
Qatar Land 41 1.2
Saudi Arabia Arab Light 33-34 1.7
Arab Medium 30-31.5 2.3
Arab Heavy 27-28 2.8
Berri (Extra Light) 37-38 1.1-1.2
Other Saudi Arabia 52.3 0.7
Syria Syria Light 36 0.6
Souedie 24 3.9
Yemen Marib Light 40 0.1
Masila Blend 30-31 0.6
Other Yemen 41 0.4
Other Middle East 31.7 2.1
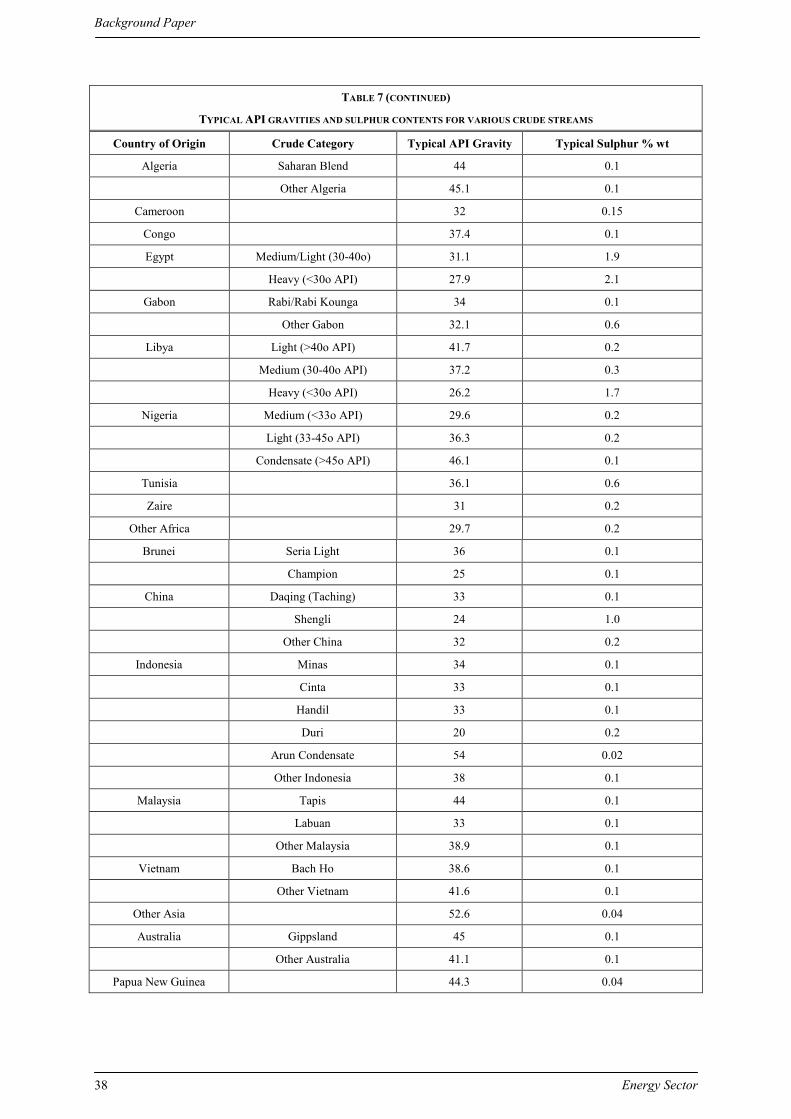
Background Paper
Energy Sector 38
TABLE 7 (CONTINUED)
TYPICAL API GRAVITIES AND SULPHUR CONTENTS FOR VARIOUS CRUDE STREAMS
Country of Origin Crude Category Typical API Gravity Typical Sulphur % wt
Algeria Saharan Blend 44 0.1
Other Algeria 45.1 0.1
Cameroon 32 0.15
Congo 37.4 0.1
Egypt Medium/Light (30-40o) 31.1 1.9
Heavy (<30o API) 27.9 2.1
Gabon Rabi/Rabi Kounga 34 0.1
Other Gabon 32.1 0.6
Libya Light (>40o API) 41.7 0.2
Medium (30-40o API) 37.2 0.3
Heavy (<30o API) 26.2 1.7
Nigeria Medium (<33o API) 29.6 0.2
Light (33-45o API) 36.3 0.2
Condensate (>45o API) 46.1 0.1
Tunisia 36.1 0.6
Zaire 31 0.2
Other Africa 29.7 0.2
Brunei Seria Light 36 0.1
Champion 25 0.1
China Daqing (Taching) 33 0.1
Shengli 24 1.0
Other China 32 0.2
Indonesia Minas 34 0.1
Cinta 33 0.1
Handil 33 0.1
Duri 20 0.2
Arun Condensate 54 0.02
Other Indonesia 38 0.1
Malaysia Tapis 44 0.1
Labuan 33 0.1
Other Malaysia 38.9 0.1
Vietnam Bach Ho 38.6 0.1
Other Vietnam 41.6 0.1
Other Asia 52.6 0.04
Australia Gippsland 45 0.1
Other Australia 41.1 0.1
Papua New Guinea 44.3 0.04
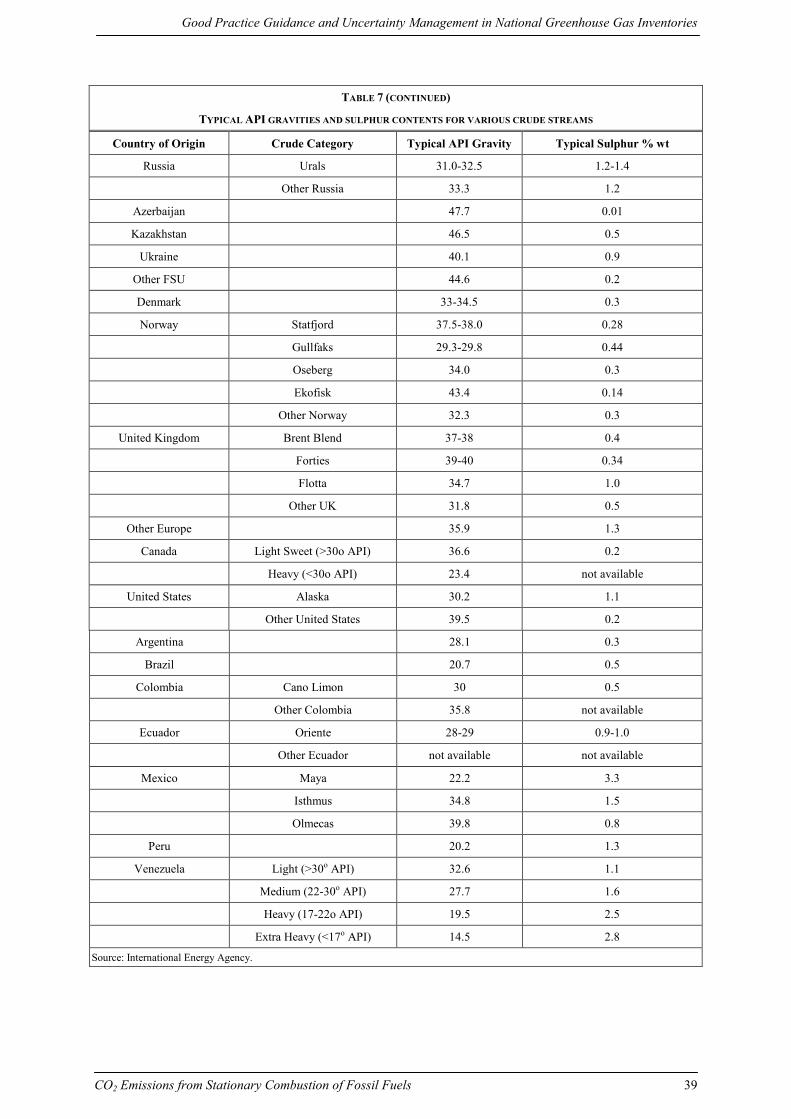
Good Practice Guidance and Uncertainty Management in National Greenhouse Gas Inventories
CO2 Emissions from Stationary Combustion of Fossil Fuels 39
TABLE 7 (CONTINUED)
TYPICAL API GRAVITIES AND SULPHUR CONTENTS FOR VARIOUS CRUDE STREAMS
Country of Origin Crude Category Typical API Gravity Typical Sulphur % wt
Russia Urals 31.0-32.5 1.2-1.4
Other Russia 33.3 1.2
Azerbaijan 47.7 0.01
Kazakhstan 46.5 0.5
Ukraine 40.1 0.9
Other FSU 44.6 0.2
Denmark 33-34.5 0.3
Norway Statfjord 37.5-38.0 0.28
Gullfaks 29.3-29.8 0.44
Oseberg 34.0 0.3
Ekofisk 43.4 0.14
Other Norway 32.3 0.3
United Kingdom Brent Blend 37-38 0.4
Forties 39-40 0.34
Flotta 34.7 1.0
Other UK 31.8 0.5
Other Europe 35.9 1.3
Canada Light Sweet (>30o API) 36.6 0.2
Heavy (<30o API) 23.4 not available
United States Alaska 30.2 1.1
Other United States 39.5 0.2
Argentina 28.1 0.3
Brazil 20.7 0.5
Colombia Cano Limon 30 0.5
Other Colombia 35.8 not available
Ecuador Oriente 28-29 0.9-1.0
Other Ecuador not available not available
Mexico Maya 22.2 3.3
Isthmus 34.8 1.5
Olmecas 39.8 0.8
Peru 20.2 1.3
Venezuela Light (>30o API) 32.6 1.1
Medium (22-30o API) 27.7 1.6
Heavy (17-22o API) 19.5 2.5
Extra Heavy (<17o API) 14.5 2.8
Source: International Energy Agency.
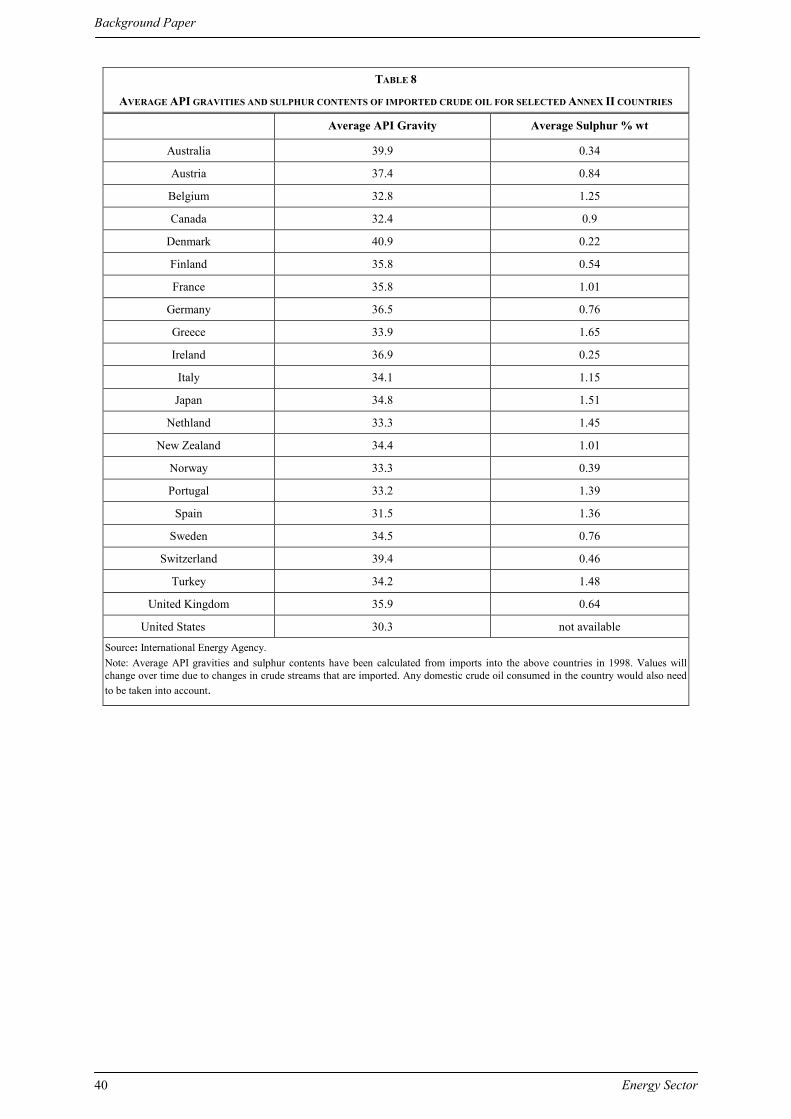
Background Paper
Energy Sector 40
TABLE 8
AVERAGE API GRAVITIES AND SULPHUR CONTENTS OF IMPORTED CRUDE OIL FOR SELECTED ANNEX II COUNTRIES
Average API Gravity Average Sulphur % wt
Australia 39.9 0.34
Austria 37.4 0.84
Belgium 32.8 1.25
Canada 32.4 0.9
Denmark 40.9 0.22
Finland 35.8 0.54
France 35.8 1.01
Germany 36.5 0.76
Greece 33.9 1.65
Ireland 36.9 0.25
Italy 34.1 1.15
Japan 34.8 1.51
Nethland 33.3 1.45
New Zealand 34.4 1.01
Norway 33.3 0.39
Portugal 33.2 1.39
Spain 31.5 1.36
Sweden 34.5 0.76
Switzerland 39.4 0.46
Turkey 34.2 1.48
United Kingdom 35.9 0.64
United States 30.3 not available
Source: International Energy Agency. Note: Average API gravities and sulphur contents have been calculated from imports into the above countries in 1998. Values will change over time due to changes in crude streams that are imported. Any domestic crude oil consumed in the country would also need to be taken into account.