CO2 EMISSIONS FROM FUEL COMBUSTION 2019 EDITION€¦ · 6 - CO2 EMISSIONS FROM FUEL COMBUSTION:...
73
INTERNATIONAL ENERGY AGENCY CO 2 EMISSIONS FROM FUEL COMBUSTION 2019 EDITION DATABASE DOCUMENTATION
Transcript of CO2 EMISSIONS FROM FUEL COMBUSTION 2019 EDITION€¦ · 6 - CO2 EMISSIONS FROM FUEL COMBUSTION:...
INTERNATIONAL ENERGY AGENCY
CO2 EMISSIONS FROM FUEL COMBUSTION
2019 EDITION
DATABASE DOCUMENTATION

2 - CO2 EMISSIONS FROM FUEL COMBUSTION: DATABASE DOCUMENTATION (2019 edition)
INTERNATIONAL ENERGY AGENCY
This document provides information regarding the 2019 edition of the IEA CO2 emissions from fuel combustion database. This document can be found online at: http://wds.iea.org/wds/pdf/WorldCo2_Documentation.pdf.
Please address your inquiries to [email protected].
Please note that all IEA data are subject to the following Terms and Conditions found on the IEA’s website: http://www.iea.org/t&c/termsandconditions/.
CO2 EMISSIONS FROM FUEL COMBUSTION: DATABASE DOCUMENTATION (2019 edition) - 3
INTERNATIONAL ENERGY AGENCY
TABLE OF CONTENTS
1. CHANGES FROM LAST EDITION .............................................................................. 4
2. DATABASE DESCRIPTION ........................................................................................ 6
3. DEFINITIONS ............................................................................................................... 7
4. GEOGRAPHICAL COVERAGE AND COUNTRY NOTES ........................................ 34
5. UNDERSTANDING THE IEA CO2 EMISSIONS ESTIMATES .................................. 55
6. IEA ESTIMATES: CHANGES UNDER THE 2006 IPCC GUIDELINES ..................... 60
7. GHG EMISSIONS: SOURCES AND METHODS ....................................................... 66
8. UNITS AND CONVERSIONS .................................................................................... 71
9. ABBREVIATIONS ...................................................................................................... 73
4 - CO2 EMISSIONS FROM FUEL COMBUSTION: DATABASE DOCUMENTATION (2019 edition)
INTERNATIONAL ENERGY AGENCY
1. CHANGES FROM LAST EDITION
Total emissions for the most recent year With the objective to provide more timely statistical information, the IEA has included provisional 2018 estimates for emissions from fuel combustion for all OECD countries, both in the summary and in the expanded data files of this database. Please check the section on Definitions for more information on the methodology (under the de-scription of the flow CO2FCOMB).
Emissions from electricity and heat for the most recent year With the objective to provide more timely statistical information, the IEA has included 2018 provisional estimates of emissions from electricity and heat production for over fifty countries, both in the summary and in the expand-ed data files of this database. Please check the section on Definitions on for more information on the methodology (under the description of the flow ELECHEAT).
Geographical coverage Lithuania became an OECD Member in July 2018. Accordingly, Lithuania appears in the list of OECD Members and is not included in the non-OECD aggregates for data from 1990, starting with the 2019 edition.
South Africa became an IEA Association country in November 2018. Accordingly, South Africa is now included in the IEA and Accession/Association countries aggregate.
The IEA continues to expand the coverage of its statistics reports and encourages more countries to collaborate on data exchange. This year detailed data have become available for Equatorial Guinea from 1981, for Lao’s People Democratic Republic from 2000 and for the Palestinian Authority from 2001.
A new regional aggregate is added to the database: ASEAN. For the list of countries included in the aggregate, please refer to the section on Geographical coverage.
From 2011 data onwards, France now includes Monaco, and the following overseas departments (Guadeloupe; French Guiana; Martinique; Mayotte; and Réunion); and excludes the overseas collectivities (New Caledonia; French Polynesia; Saint Barthélemy; Saint Martin; Saint Pierre and Miquelon; and Wallis and Futuna). Prior to 2011, France includes Monaco and excludes the following overseas departments and territories: Guadeloupe; French Guiana; Martinique; Mayotte and Réunion; New Caledonia; French Polynesia; Saint Barthélemy; Saint Martin; Saint Pierre and Miquelon; and Wallis and Futuna.
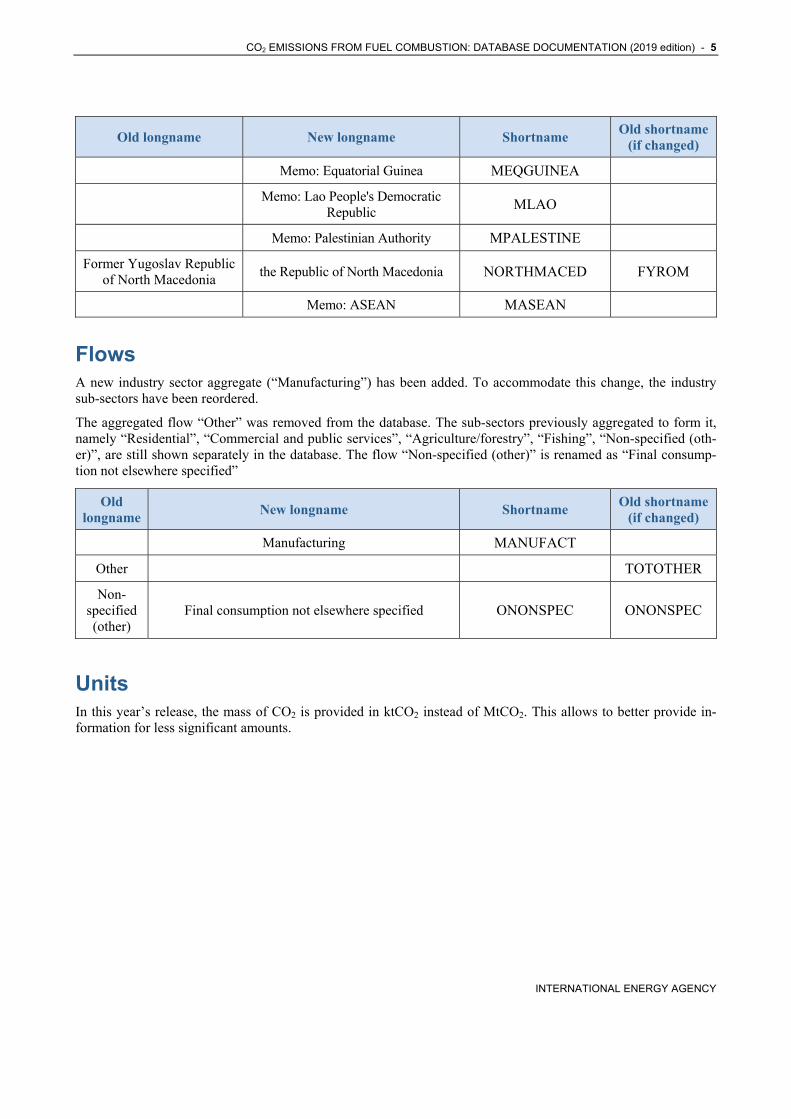
According to UN nomenclature, the previous longname of “Former Yugoslav Republic of North Macedonia” was changed into “the Republic of North Macedonia”. The shortname has been adapted accordingly.
CO2 EMISSIONS FROM FUEL COMBUSTION: DATABASE DOCUMENTATION (2019 edition) - 5
INTERNATIONAL ENERGY AGENCY
Flows
A new industry sector aggregate (“Manufacturing”) has been added. To accommodate this change, the industry sub-sectors have been reordered.
The aggregated flow “Other” was removed from the database. The sub-sectors previously aggregated to form it, namely “Residential”, “Commercial and public services”, “Agriculture/forestry”, “Fishing”, “Non-specified (oth-er)”, are still shown separately in the database. The flow “Non-specified (other)” is renamed as “Final consump-tion not elsewhere specified”
Units
In this year’s release, the mass of CO2 is provided in ktCO2 instead of MtCO2. This allows to better provide in-formation for less significant amounts.
Old longname New longname Shortname Old shortname
(if changed)
Memo: Equatorial Guinea MEQGUINEA
Memo: Lao People's Democratic
Republic MLAO
Memo: Palestinian Authority MPALESTINE
Former Yugoslav Republic of North Macedonia
the Republic of North Macedonia NORTHMACED FYROM
Memo: ASEAN MASEAN
Old longname
New longname Shortname Old shortname
(if changed)
Manufacturing MANUFACT
Other TOTOTHER
Non-specified (other)
Final consumption not elsewhere specified ONONSPEC ONONSPEC
6 - CO2 EMISSIONS FROM FUEL COMBUSTION: DATABASE DOCUMENTATION (2019 edition)
INTERNATIONAL ENERGY AGENCY
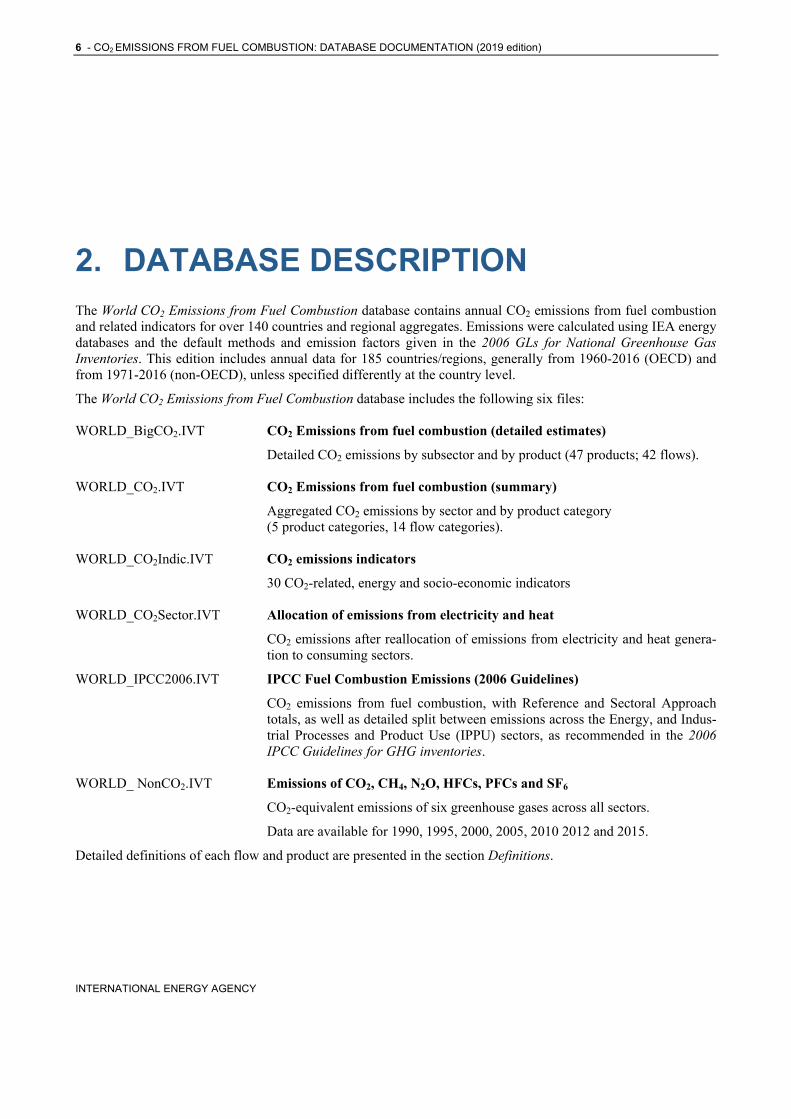
2. DATABASE DESCRIPTION The World CO2 Emissions from Fuel Combustion database contains annual CO2 emissions from fuel combustion and related indicators for over 140 countries and regional aggregates. Emissions were calculated using IEA energy databases and the default methods and emission factors given in the 2006 GLs for National Greenhouse Gas Inventories. This edition includes annual data for 185 countries/regions, generally from 1960-2016 (OECD) and from 1971-2016 (non-OECD), unless specified differently at the country level.
The World CO2 Emissions from Fuel Combustion database includes the following six files:
WORLD_BigCO2.IVT CO2 Emissions from fuel combustion (detailed estimates)
Detailed CO2 emissions by subsector and by product (47 products; 42 flows).
WORLD_CO2.IVT CO2 Emissions from fuel combustion (summary)
Aggregated CO2 emissions by sector and by product category (5 product categories, 14 flow categories).
WORLD_CO2Indic.IVT CO2 emissions indicators
30 CO2-related, energy and socio-economic indicators
WORLD_CO2Sector.IVT Allocation of emissions from electricity and heat
CO2 emissions after reallocation of emissions from electricity and heat genera-tion to consuming sectors.
WORLD_IPCC2006.IVT IPCC Fuel Combustion Emissions (2006 Guidelines)
CO2 emissions from fuel combustion, with Reference and Sectoral Approach totals, as well as detailed split between emissions across the Energy, and Indus-trial Processes and Product Use (IPPU) sectors, as recommended in the 2006 IPCC Guidelines for GHG inventories.
WORLD_ NonCO2.IVT Emissions of CO2, CH4, N2O, HFCs, PFCs and SF6
CO2-equivalent emissions of six greenhouse gases across all sectors.
Data are available for 1990, 1995, 2000, 2005, 2010 2012 and 2015.
Detailed definitions of each flow and product are presented in the section Definitions.
CO2 EMISSIONS FROM FUEL COMBUSTION: DATABASE DOCUMENTATION (2019 edition) - 7
INTERNATIONAL ENERGY AGENCY
3. DEFINITIONS
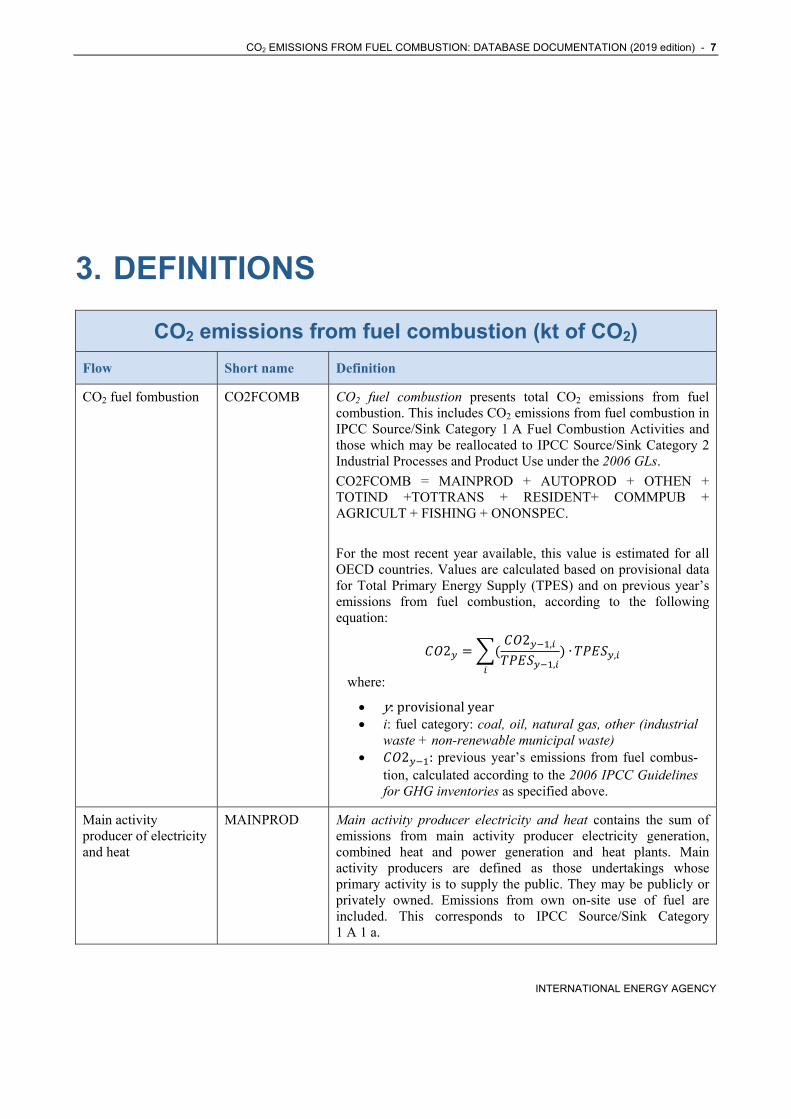
CO2 emissions from fuel combustion (kt of CO2)
Flow Short name Definition
CO2 fuel fombustion CO2FCOMB CO2 fuel combustion presents total CO2 emissions from fuel combustion. This includes CO2 emissions from fuel combustion in IPCC Source/Sink Category 1 A Fuel Combustion Activities and those which may be reallocated to IPCC Source/Sink Category 2 Industrial Processes and Product Use under the 2006 GLs.
CO2FCOMB = MAINPROD + AUTOPROD + OTHEN + TOTIND +TOTTRANS + RESIDENT+ COMMPUB + AGRICULT + FISHING + ONONSPEC.
For the most recent year available, this value is estimated for all OECD countries. Values are calculated based on provisional data for Total Primary Energy Supply (TPES) and on previous year’s emissions from fuel combustion, according to the following equation:
22 ,
,∙ ,
where:
y:provisionalyear i: fuel category: coal, oil, natural gas, other (industrial
waste + non-renewable municipal waste) 2 :previous year’s emissions from fuel combus-
tion, calculated according to the 2006 IPCC Guidelines for GHG inventories as specified above.
Main activity producer of electricity and heat
MAINPROD Main activity producer electricity and heat contains the sum of emissions from main activity producer electricity generation, combined heat and power generation and heat plants. Main activity producers are defined as those undertakings whose primary activity is to supply the public. They may be publicly or privately owned. Emissions from own on-site use of fuel are included. This corresponds to IPCC Source/Sink Category 1 A 1 a.
8 - CO2 EMISSIONS FROM FUEL COMBUSTION: DATABASE DOCUMENTATION (2019 edition)
INTERNATIONAL ENERGY AGENCY
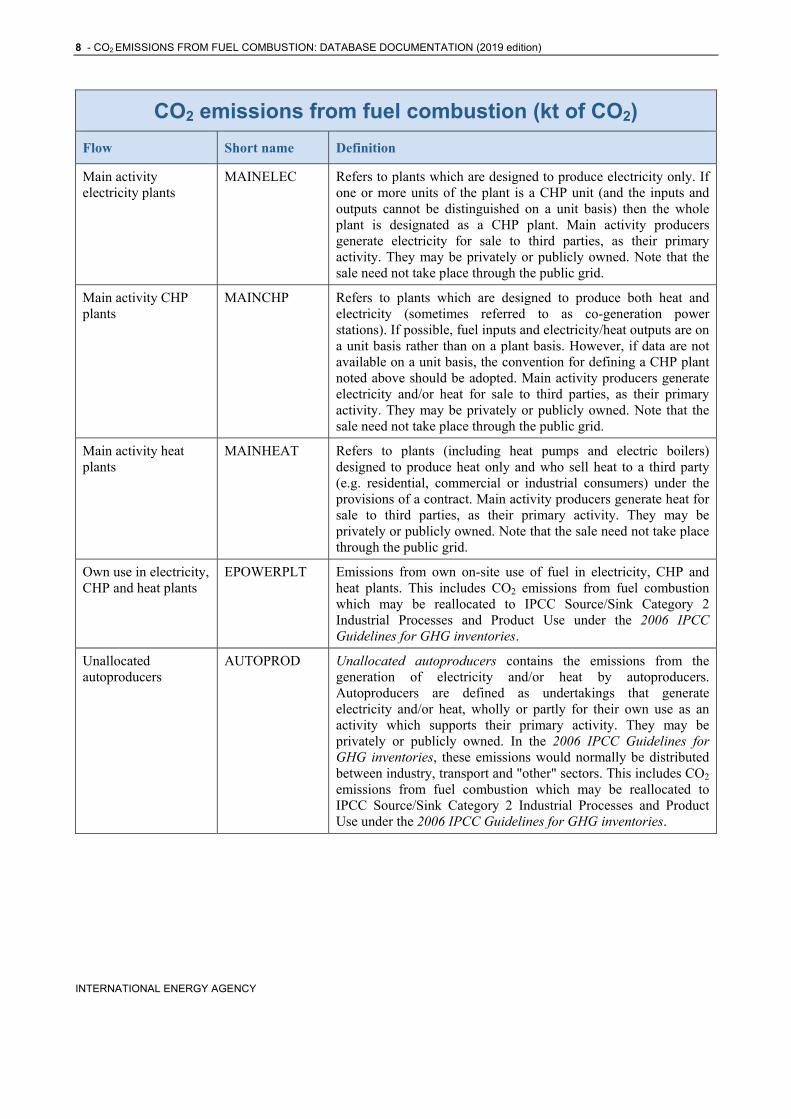
CO2 emissions from fuel combustion (kt of CO2)
Flow Short name Definition
Main activity electricity plants
MAINELEC Refers to plants which are designed to produce electricity only. If one or more units of the plant is a CHP unit (and the inputs and outputs cannot be distinguished on a unit basis) then the whole plant is designated as a CHP plant. Main activity producers generate electricity for sale to third parties, as their primary activity. They may be privately or publicly owned. Note that the sale need not take place through the public grid.
Main activity CHP plants
MAINCHP Refers to plants which are designed to produce both heat and electricity (sometimes referred to as co-generation power stations). If possible, fuel inputs and electricity/heat outputs are on a unit basis rather than on a plant basis. However, if data are not available on a unit basis, the convention for defining a CHP plant noted above should be adopted. Main activity producers generate electricity and/or heat for sale to third parties, as their primary activity. They may be privately or publicly owned. Note that the sale need not take place through the public grid.
Main activity heat plants
MAINHEAT Refers to plants (including heat pumps and electric boilers) designed to produce heat only and who sell heat to a third party (e.g. residential, commercial or industrial consumers) under the provisions of a contract. Main activity producers generate heat for sale to third parties, as their primary activity. They may be privately or publicly owned. Note that the sale need not take place through the public grid.
Own use in electricity, CHP and heat plants
EPOWERPLT Emissions from own on-site use of fuel in electricity, CHP and heat plants. This includes CO2 emissions from fuel combustion which may be reallocated to IPCC Source/Sink Category 2 Industrial Processes and Product Use under the 2006 IPCC Guidelines for GHG inventories.
Unallocated autoproducers
AUTOPROD Unallocated autoproducers contains the emissions from the generation of electricity and/or heat by autoproducers. Autoproducers are defined as undertakings that generate electricity and/or heat, wholly or partly for their own use as an activity which supports their primary activity. They may be privately or publicly owned. In the 2006 IPCC Guidelines for GHG inventories, these emissions would normally be distributed between industry, transport and "other" sectors. This includes CO2 emissions from fuel combustion which may be reallocated to IPCC Source/Sink Category 2 Industrial Processes and Product Use under the 2006 IPCC Guidelines for GHG inventories.
CO2 EMISSIONS FROM FUEL COMBUSTION: DATABASE DOCUMENTATION (2019 edition) - 9
INTERNATIONAL ENERGY AGENCY
CO2 emissions from fuel combustion (kt of CO2)
Flow Short name Definition
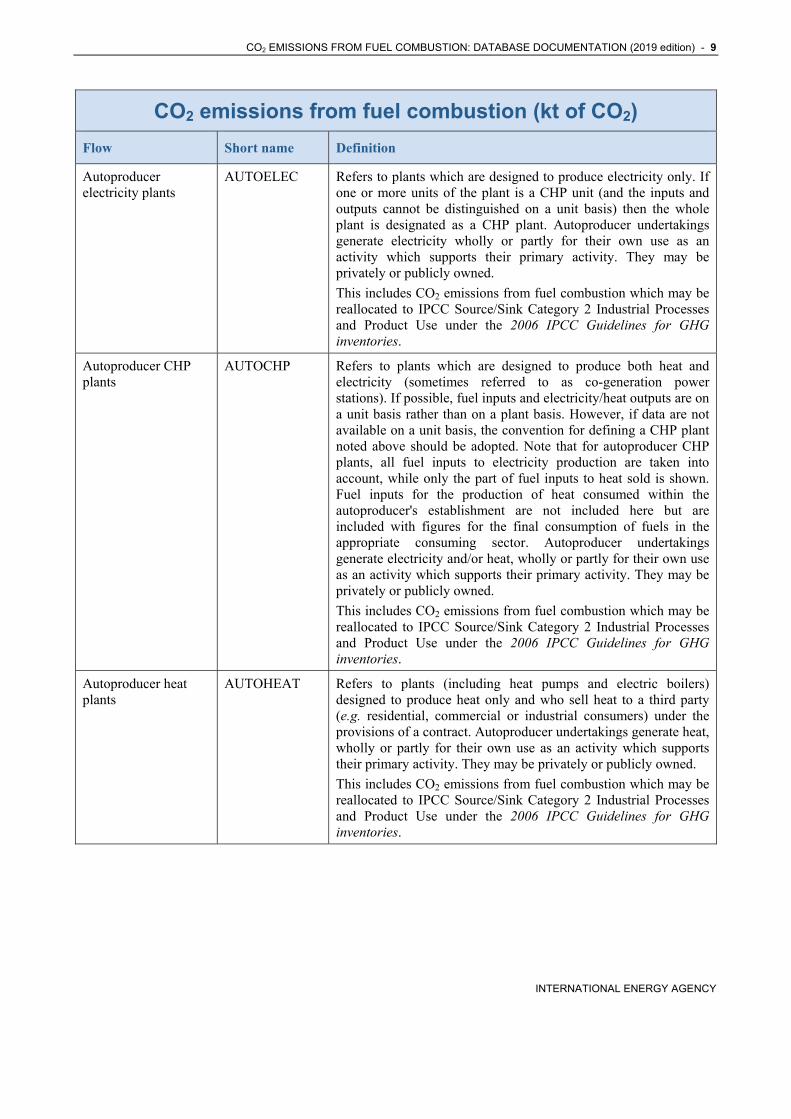
Autoproducer electricity plants
AUTOELEC Refers to plants which are designed to produce electricity only. If one or more units of the plant is a CHP unit (and the inputs and outputs cannot be distinguished on a unit basis) then the whole plant is designated as a CHP plant. Autoproducer undertakings generate electricity wholly or partly for their own use as an activity which supports their primary activity. They may be privately or publicly owned.
This includes CO2 emissions from fuel combustion which may be reallocated to IPCC Source/Sink Category 2 Industrial Processes and Product Use under the 2006 IPCC Guidelines for GHG inventories.
Autoproducer CHP plants
AUTOCHP Refers to plants which are designed to produce both heat and electricity (sometimes referred to as co-generation power stations). If possible, fuel inputs and electricity/heat outputs are on a unit basis rather than on a plant basis. However, if data are not available on a unit basis, the convention for defining a CHP plant noted above should be adopted. Note that for autoproducer CHP plants, all fuel inputs to electricity production are taken into account, while only the part of fuel inputs to heat sold is shown. Fuel inputs for the production of heat consumed within the autoproducer's establishment are not included here but are included with figures for the final consumption of fuels in the appropriate consuming sector. Autoproducer undertakings generate electricity and/or heat, wholly or partly for their own use as an activity which supports their primary activity. They may be privately or publicly owned.
This includes CO2 emissions from fuel combustion which may be reallocated to IPCC Source/Sink Category 2 Industrial Processes and Product Use under the 2006 IPCC Guidelines for GHG inventories.
Autoproducer heat plants
AUTOHEAT Refers to plants (including heat pumps and electric boilers) designed to produce heat only and who sell heat to a third party (e.g. residential, commercial or industrial consumers) under the provisions of a contract. Autoproducer undertakings generate heat, wholly or partly for their own use as an activity which supports their primary activity. They may be privately or publicly owned.
This includes CO2 emissions from fuel combustion which may be reallocated to IPCC Source/Sink Category 2 Industrial Processes and Product Use under the 2006 IPCC Guidelines for GHG inventories.
10 - CO2 EMISSIONS FROM FUEL COMBUSTION: DATABASE DOCUMENTATION (2019 edition)
INTERNATIONAL ENERGY AGENCY
CO2 emissions from fuel combustion (kt of CO2)
Flow Short name Definition
Other energy industry own use
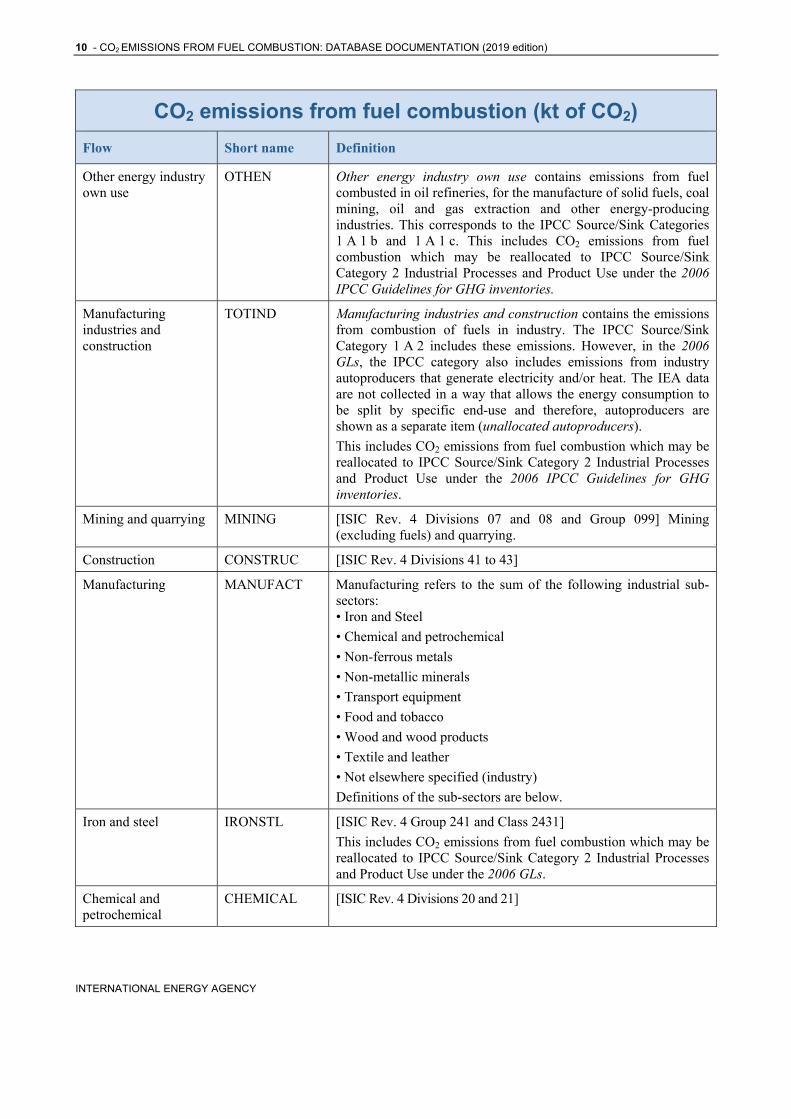
OTHEN Other energy industry own use contains emissions from fuel combusted in oil refineries, for the manufacture of solid fuels, coal mining, oil and gas extraction and other energy-producing industries. This corresponds to the IPCC Source/Sink Categories 1 A 1 b and 1 A 1 c. This includes CO2 emissions from fuel combustion which may be reallocated to IPCC Source/Sink Category 2 Industrial Processes and Product Use under the 2006 IPCC Guidelines for GHG inventories.
Manufacturing industries and construction
TOTIND Manufacturing industries and construction contains the emissions from combustion of fuels in industry. The IPCC Source/Sink Category 1 A 2 includes these emissions. However, in the 2006 GLs, the IPCC category also includes emissions from industry autoproducers that generate electricity and/or heat. The IEA data are not collected in a way that allows the energy consumption to be split by specific end-use and therefore, autoproducers are shown as a separate item (unallocated autoproducers).
This includes CO2 emissions from fuel combustion which may be reallocated to IPCC Source/Sink Category 2 Industrial Processes and Product Use under the 2006 IPCC Guidelines for GHG inventories.
Mining and quarrying MINING [ISIC Rev. 4 Divisions 07 and 08 and Group 099] Mining (excluding fuels) and quarrying.
Construction CONSTRUC [ISIC Rev. 4 Divisions 41 to 43]
Manufacturing MANUFACT Manufacturing refers to the sum of the following industrial sub-sectors: • Iron and Steel
• Chemical and petrochemical
• Non-ferrous metals
• Non-metallic minerals
• Transport equipment
• Food and tobacco
• Wood and wood products
• Textile and leather
• Not elsewhere specified (industry)
Definitions of the sub-sectors are below.
Iron and steel IRONSTL [ISIC Rev. 4 Group 241 and Class 2431]
This includes CO2 emissions from fuel combustion which may be reallocated to IPCC Source/Sink Category 2 Industrial Processes and Product Use under the 2006 GLs.
Chemical and petrochemical
CHEMICAL [ISIC Rev. 4 Divisions 20 and 21]
CO2 EMISSIONS FROM FUEL COMBUSTION: DATABASE DOCUMENTATION (2019 edition) - 11
INTERNATIONAL ENERGY AGENCY
CO2 emissions from fuel combustion (kt of CO2)
Flow Short name Definition
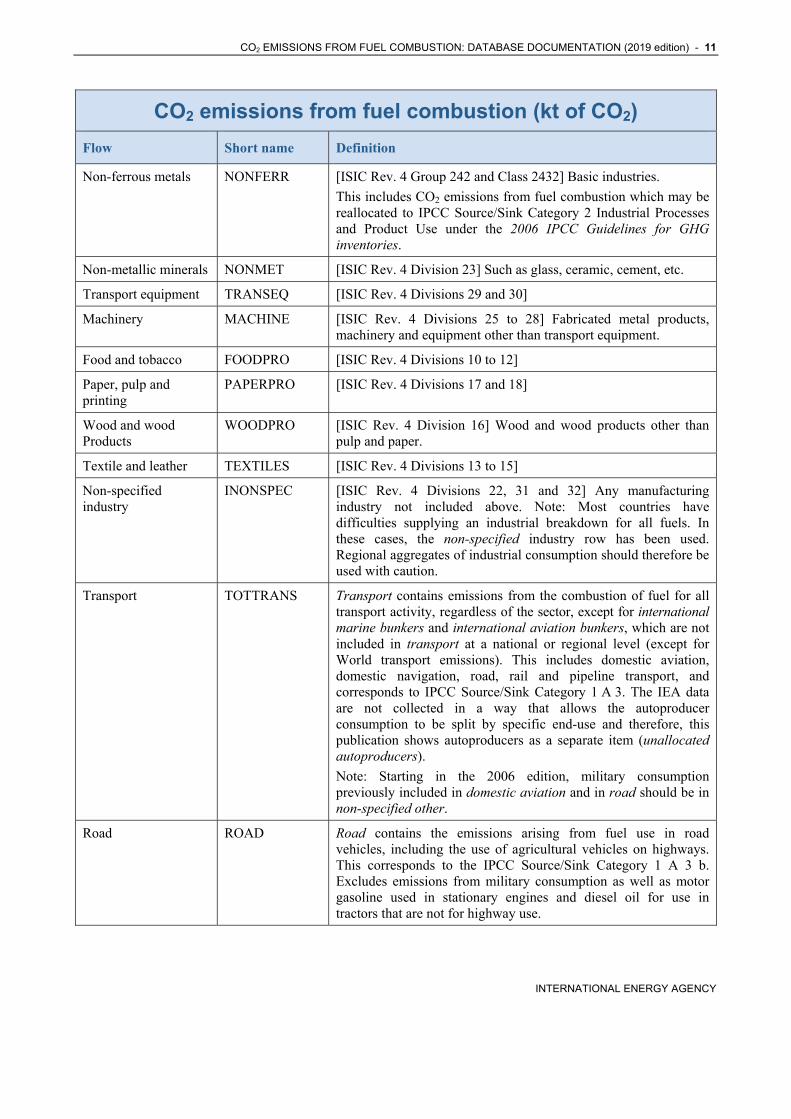
Non-ferrous metals NONFERR [ISIC Rev. 4 Group 242 and Class 2432] Basic industries.
This includes CO2 emissions from fuel combustion which may be reallocated to IPCC Source/Sink Category 2 Industrial Processes and Product Use under the 2006 IPCC Guidelines for GHG inventories.
Non-metallic minerals NONMET [ISIC Rev. 4 Division 23] Such as glass, ceramic, cement, etc.
Transport equipment TRANSEQ [ISIC Rev. 4 Divisions 29 and 30]
Machinery MACHINE [ISIC Rev. 4 Divisions 25 to 28] Fabricated metal products, machinery and equipment other than transport equipment.
Food and tobacco FOODPRO [ISIC Rev. 4 Divisions 10 to 12]
Paper, pulp and printing
PAPERPRO [ISIC Rev. 4 Divisions 17 and 18]
Wood and wood Products
WOODPRO [ISIC Rev. 4 Division 16] Wood and wood products other than pulp and paper.
Textile and leather TEXTILES [ISIC Rev. 4 Divisions 13 to 15]
Non-specified industry
INONSPEC [ISIC Rev. 4 Divisions 22, 31 and 32] Any manufacturing industry not included above. Note: Most countries have difficulties supplying an industrial breakdown for all fuels. In these cases, the non-specified industry row has been used. Regional aggregates of industrial consumption should therefore be used with caution.
Transport TOTTRANS Transport contains emissions from the combustion of fuel for all transport activity, regardless of the sector, except for international marine bunkers and international aviation bunkers, which are not included in transport at a national or regional level (except for World transport emissions). This includes domestic aviation, domestic navigation, road, rail and pipeline transport, and corresponds to IPCC Source/Sink Category 1 A 3. The IEA data are not collected in a way that allows the autoproducer consumption to be split by specific end-use and therefore, this publication shows autoproducers as a separate item (unallocated autoproducers).
Note: Starting in the 2006 edition, military consumption previously included in domestic aviation and in road should be in non-specified other.
Road ROAD Road contains the emissions arising from fuel use in road vehicles, including the use of agricultural vehicles on highways. This corresponds to the IPCC Source/Sink Category 1 A 3 b. Excludes emissions from military consumption as well as motor gasoline used in stationary engines and diesel oil for use in tractors that are not for highway use.
12 - CO2 EMISSIONS FROM FUEL COMBUSTION: DATABASE DOCUMENTATION (2019 edition)
INTERNATIONAL ENERGY AGENCY
CO2 emissions from fuel combustion (kt of CO2)
Flow Short name Definition
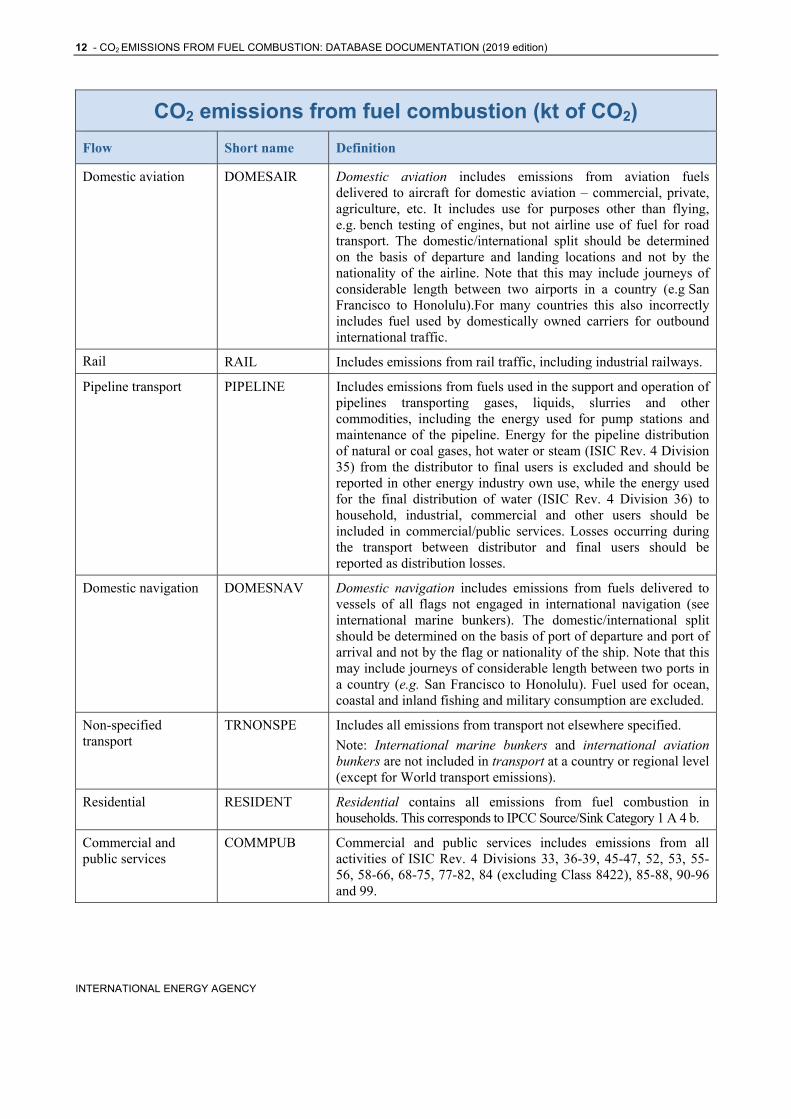
Domestic aviation DOMESAIR Domestic aviation includes emissions from aviation fuels delivered to aircraft for domestic aviation – commercial, private, agriculture, etc. It includes use for purposes other than flying, e.g. bench testing of engines, but not airline use of fuel for road transport. The domestic/international split should be determined on the basis of departure and landing locations and not by the nationality of the airline. Note that this may include journeys of considerable length between two airports in a country (e.g San Francisco to Honolulu).For many countries this also incorrectly includes fuel used by domestically owned carriers for outbound international traffic.
Rail RAIL Includes emissions from rail traffic, including industrial railways.
Pipeline transport PIPELINE Includes emissions from fuels used in the support and operation of pipelines transporting gases, liquids, slurries and other commodities, including the energy used for pump stations and maintenance of the pipeline. Energy for the pipeline distribution of natural or coal gases, hot water or steam (ISIC Rev. 4 Division 35) from the distributor to final users is excluded and should be reported in other energy industry own use, while the energy used for the final distribution of water (ISIC Rev. 4 Division 36) to household, industrial, commercial and other users should be included in commercial/public services. Losses occurring during the transport between distributor and final users should be reported as distribution losses.
Domestic navigation DOMESNAV Domestic navigation includes emissions from fuels delivered to vessels of all flags not engaged in international navigation (see international marine bunkers). The domestic/international split should be determined on the basis of port of departure and port of arrival and not by the flag or nationality of the ship. Note that this may include journeys of considerable length between two ports in a country (e.g. San Francisco to Honolulu). Fuel used for ocean, coastal and inland fishing and military consumption are excluded.
Non-specified transport
TRNONSPE Includes all emissions from transport not elsewhere specified.
Note: International marine bunkers and international aviation bunkers are not included in transport at a country or regional level (except for World transport emissions).
Residential RESIDENT Residential contains all emissions from fuel combustion in households. This corresponds to IPCC Source/Sink Category 1 A 4 b.
Commercial and public services
COMMPUB Commercial and public services includes emissions from all activities of ISIC Rev. 4 Divisions 33, 36-39, 45-47, 52, 53, 55-56, 58-66, 68-75, 77-82, 84 (excluding Class 8422), 85-88, 90-96 and 99.
CO2 EMISSIONS FROM FUEL COMBUSTION: DATABASE DOCUMENTATION (2019 edition) - 13
INTERNATIONAL ENERGY AGENCY
CO2 emissions from fuel combustion (kt of CO2)
Flow Short name Definition
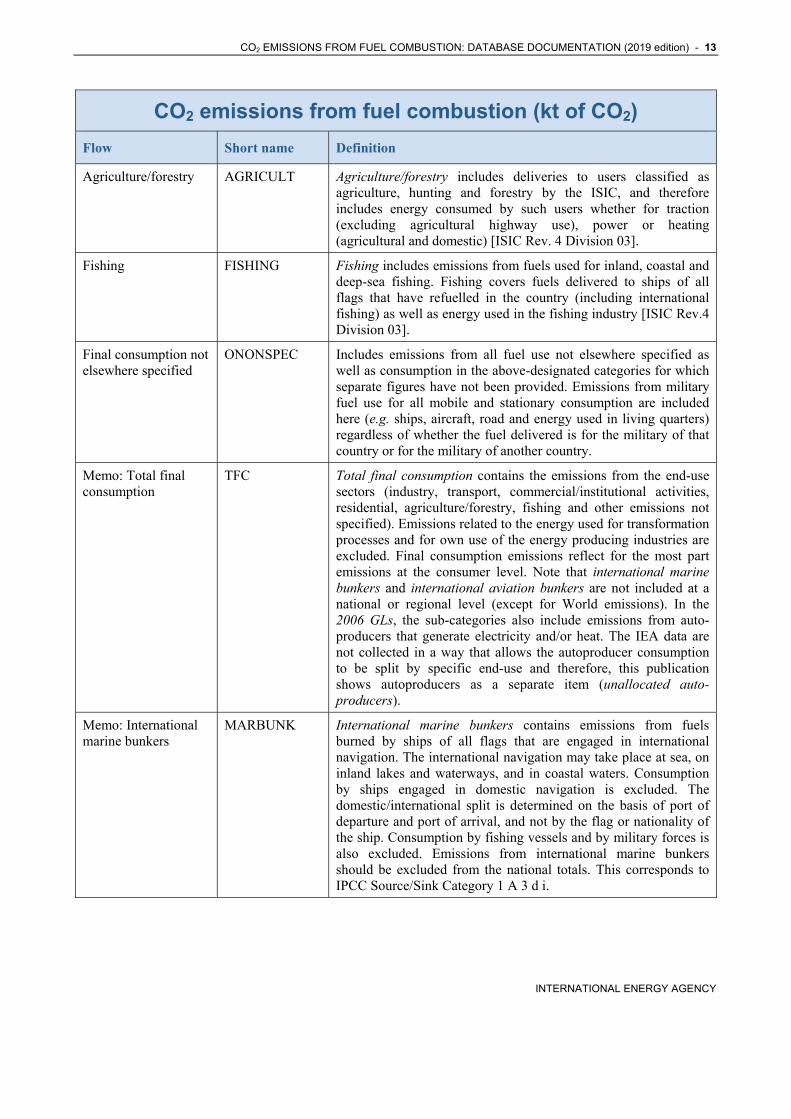
Agriculture/forestry AGRICULT Agriculture/forestry includes deliveries to users classified as agriculture, hunting and forestry by the ISIC, and therefore includes energy consumed by such users whether for traction (excluding agricultural highway use), power or heating (agricultural and domestic) [ISIC Rev. 4 Division 03].
Fishing FISHING Fishing includes emissions from fuels used for inland, coastal and deep-sea fishing. Fishing covers fuels delivered to ships of all flags that have refuelled in the country (including international fishing) as well as energy used in the fishing industry [ISIC Rev.4 Division 03].
Final consumption not elsewhere specified
ONONSPEC Includes emissions from all fuel use not elsewhere specified as well as consumption in the above-designated categories for which separate figures have not been provided. Emissions from military fuel use for all mobile and stationary consumption are included here (e.g. ships, aircraft, road and energy used in living quarters) regardless of whether the fuel delivered is for the military of that country or for the military of another country.
Memo: Total final consumption
TFC Total final consumption contains the emissions from the end-use sectors (industry, transport, commercial/institutional activities, residential, agriculture/forestry, fishing and other emissions not specified). Emissions related to the energy used for transformation processes and for own use of the energy producing industries are excluded. Final consumption emissions reflect for the most part emissions at the consumer level. Note that international marine bunkers and international aviation bunkers are not included at a national or regional level (except for World emissions). In the 2006 GLs, the sub-categories also include emissions from auto-producers that generate electricity and/or heat. The IEA data are not collected in a way that allows the autoproducer consumption to be split by specific end-use and therefore, this publication shows autoproducers as a separate item (unallocated auto-producers).
Memo: International marine bunkers
MARBUNK International marine bunkers contains emissions from fuels burned by ships of all flags that are engaged in international navigation. The international navigation may take place at sea, on inland lakes and waterways, and in coastal waters. Consumption by ships engaged in domestic navigation is excluded. The domestic/international split is determined on the basis of port of departure and port of arrival, and not by the flag or nationality of the ship. Consumption by fishing vessels and by military forces is also excluded. Emissions from international marine bunkers should be excluded from the national totals. This corresponds to IPCC Source/Sink Category 1 A 3 d i.
14 - CO2 EMISSIONS FROM FUEL COMBUSTION: DATABASE DOCUMENTATION (2019 edition)
INTERNATIONAL ENERGY AGENCY
CO2 emissions from fuel combustion (kt of CO2)
Flow Short name Definition
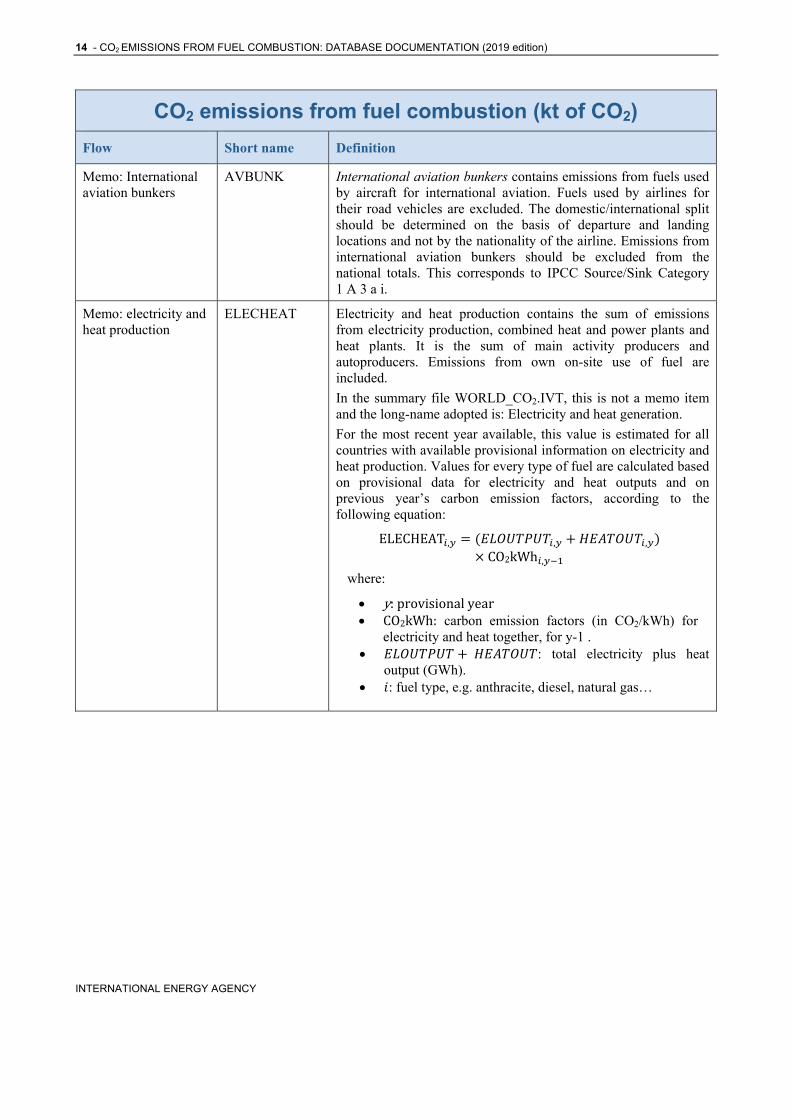
Memo: International aviation bunkers
AVBUNK International aviation bunkers contains emissions from fuels used by aircraft for international aviation. Fuels used by airlines for their road vehicles are excluded. The domestic/international split should be determined on the basis of departure and landing locations and not by the nationality of the airline. Emissions from international aviation bunkers should be excluded from the national totals. This corresponds to IPCC Source/Sink Category 1 A 3 a i.
Memo: electricity and heat production
ELECHEAT Electricity and heat production contains the sum of emissions from electricity production, combined heat and power plants and heat plants. It is the sum of main activity producers and autoproducers. Emissions from own on-site use of fuel are included.
In the summary file WORLD_CO2.IVT, this is not a memo item and the long-name adopted is: Electricity and heat generation.
For the most recent year available, this value is estimated for all countries with available provisional information on electricity and heat production. Values for every type of fuel are calculated based on provisional data for electricity and heat outputs and on previous year’s carbon emission factors, according to the following equation:
ELECHEAT , , , CO2kWh ,
where:
y:provisionalyear CO2kWh: carbon emission factors (in CO2/kWh) for
electricity and heat together, for y-1 . : total electricity plus heat
output (GWh). : fuel type, e.g. anthracite, diesel, natural gas…
CO2 EMISSIONS FROM FUEL COMBUSTION: DATABASE DOCUMENTATION (2019 edition) - 15
INTERNATIONAL ENERGY AGENCY
Indicators
Flow Short name Notes
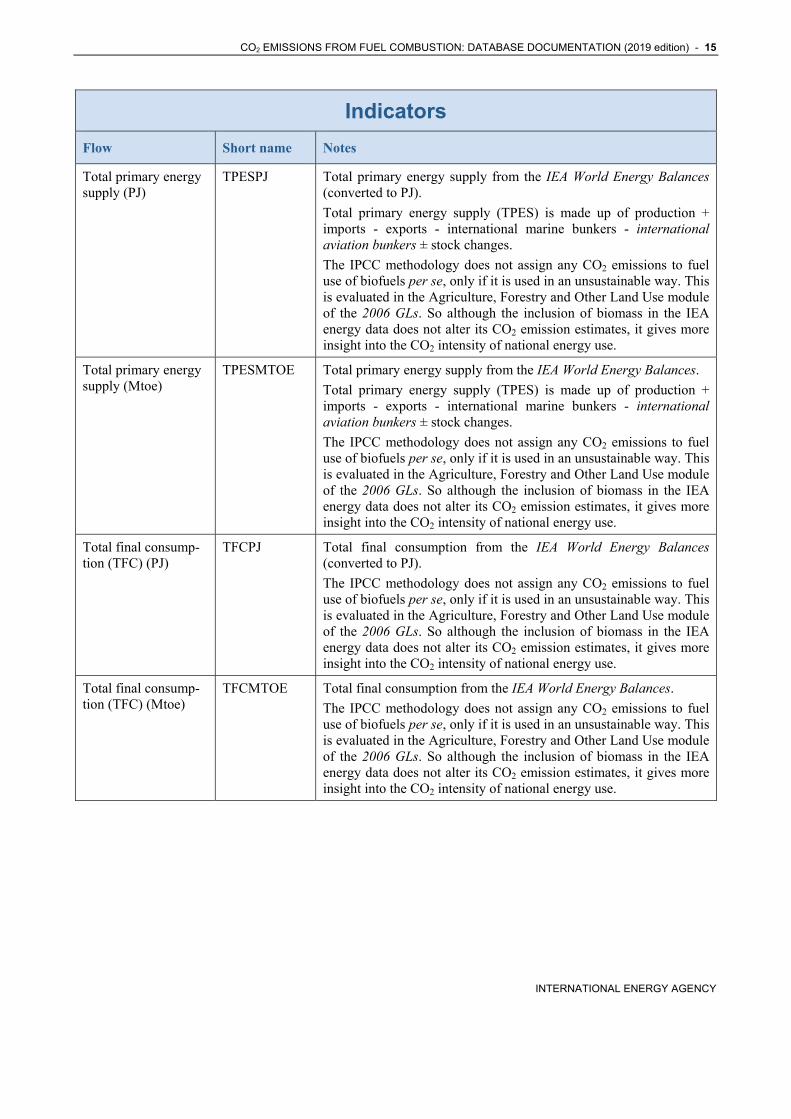
Total primary energy supply (PJ)
TPESPJ Total primary energy supply from the IEA World Energy Balances (converted to PJ).
Total primary energy supply (TPES) is made up of production + imports - exports - international marine bunkers - international aviation bunkers ± stock changes.
The IPCC methodology does not assign any CO2 emissions to fuel use of biofuels per se, only if it is used in an unsustainable way. This is evaluated in the Agriculture, Forestry and Other Land Use module of the 2006 GLs. So although the inclusion of biomass in the IEA energy data does not alter its CO2 emission estimates, it gives more insight into the CO2 intensity of national energy use.
Total primary energy supply (Mtoe)
TPESMTOE Total primary energy supply from the IEA World Energy Balances.
Total primary energy supply (TPES) is made up of production + imports - exports - international marine bunkers - international aviation bunkers ± stock changes.
The IPCC methodology does not assign any CO2 emissions to fuel use of biofuels per se, only if it is used in an unsustainable way. This is evaluated in the Agriculture, Forestry and Other Land Use module of the 2006 GLs. So although the inclusion of biomass in the IEA energy data does not alter its CO2 emission estimates, it gives more insight into the CO2 intensity of national energy use.
Total final consump-tion (TFC) (PJ)
TFCPJ Total final consumption from the IEA World Energy Balances (converted to PJ).
The IPCC methodology does not assign any CO2 emissions to fuel use of biofuels per se, only if it is used in an unsustainable way. This is evaluated in the Agriculture, Forestry and Other Land Use module of the 2006 GLs. So although the inclusion of biomass in the IEA energy data does not alter its CO2 emission estimates, it gives more insight into the CO2 intensity of national energy use.
Total final consump-tion (TFC) (Mtoe)
TFCMTOE Total final consumption from the IEA World Energy Balances.
The IPCC methodology does not assign any CO2 emissions to fuel use of biofuels per se, only if it is used in an unsustainable way. This is evaluated in the Agriculture, Forestry and Other Land Use module of the 2006 GLs. So although the inclusion of biomass in the IEA energy data does not alter its CO2 emission estimates, it gives more insight into the CO2 intensity of national energy use.
16 - CO2 EMISSIONS FROM FUEL COMBUSTION: DATABASE DOCUMENTATION (2019 edition)
INTERNATIONAL ENERGY AGENCY
Indicators
Flow Short name Notes
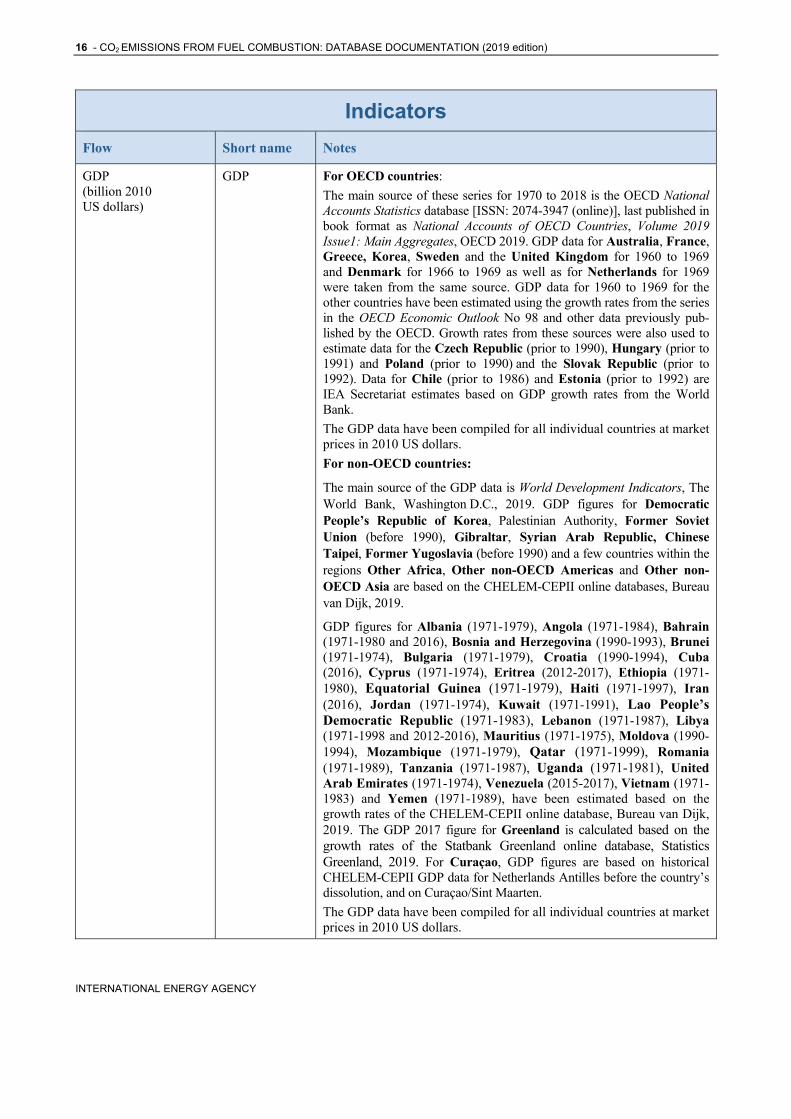
GDP (billion 2010 US dollars)
GDP For OECD countries:
The main source of these series for 1970 to 2018 is the OECD National Accounts Statistics database [ISSN: 2074-3947 (online)], last published in book format as National Accounts of OECD Countries, Volume 2019 Issue1: Main Aggregates, OECD 2019. GDP data for Australia, France, Greece, Korea, Sweden and the United Kingdom for 1960 to 1969 and Denmark for 1966 to 1969 as well as for Netherlands for 1969 were taken from the same source. GDP data for 1960 to 1969 for the other countries have been estimated using the growth rates from the series in the OECD Economic Outlook No 98 and other data previously pub-lished by the OECD. Growth rates from these sources were also used to estimate data for the Czech Republic (prior to 1990), Hungary (prior to 1991) and Poland (prior to 1990) and the Slovak Republic (prior to 1992). Data for Chile (prior to 1986) and Estonia (prior to 1992) are IEA Secretariat estimates based on GDP growth rates from the World Bank.
The GDP data have been compiled for all individual countries at market prices in 2010 US dollars.
For non-OECD countries:
The main source of the GDP data is World Development Indicators, The World Bank, Washington D.C., 2019. GDP figures for Democratic People’s Republic of Korea, Palestinian Authority, Former Soviet Union (before 1990), Gibraltar, Syrian Arab Republic, Chinese Taipei, Former Yugoslavia (before 1990) and a few countries within the regions Other Africa, Other non-OECD Americas and Other non-OECD Asia are based on the CHELEM-CEPII online databases, Bureau van Dijk, 2019.
GDP figures for Albania (1971-1979), Angola (1971-1984), Bahrain (1971-1980 and 2016), Bosnia and Herzegovina (1990-1993), Brunei (1971-1974), Bulgaria (1971-1979), Croatia (1990-1994), Cuba (2016), Cyprus (1971-1974), Eritrea (2012-2017), Ethiopia (1971-1980), Equatorial Guinea (1971-1979), Haiti (1971-1997), Iran (2016), Jordan (1971-1974), Kuwait (1971-1991), Lao People’s Democratic Republic (1971-1983), Lebanon (1971-1987), Libya (1971-1998 and 2012-2016), Mauritius (1971-1975), Moldova (1990-1994), Mozambique (1971-1979), Qatar (1971-1999), Romania (1971-1989), Tanzania (1971-1987), Uganda (1971-1981), United Arab Emirates (1971-1974), Venezuela (2015-2017), Vietnam (1971-1983) and Yemen (1971-1989), have been estimated based on the growth rates of the CHELEM-CEPII online database, Bureau van Dijk, 2019. The GDP 2017 figure for Greenland is calculated based on the growth rates of the Statbank Greenland online database, Statistics Greenland, 2019. For Curaçao, GDP figures are based on historical CHELEM-CEPII GDP data for Netherlands Antilles before the country’s dissolution, and on Curaçao/Sint Maarten.
The GDP data have been compiled for all individual countries at market prices in 2010 US dollars.
CO2 EMISSIONS FROM FUEL COMBUSTION: DATABASE DOCUMENTATION (2019 edition) - 17
INTERNATIONAL ENERGY AGENCY
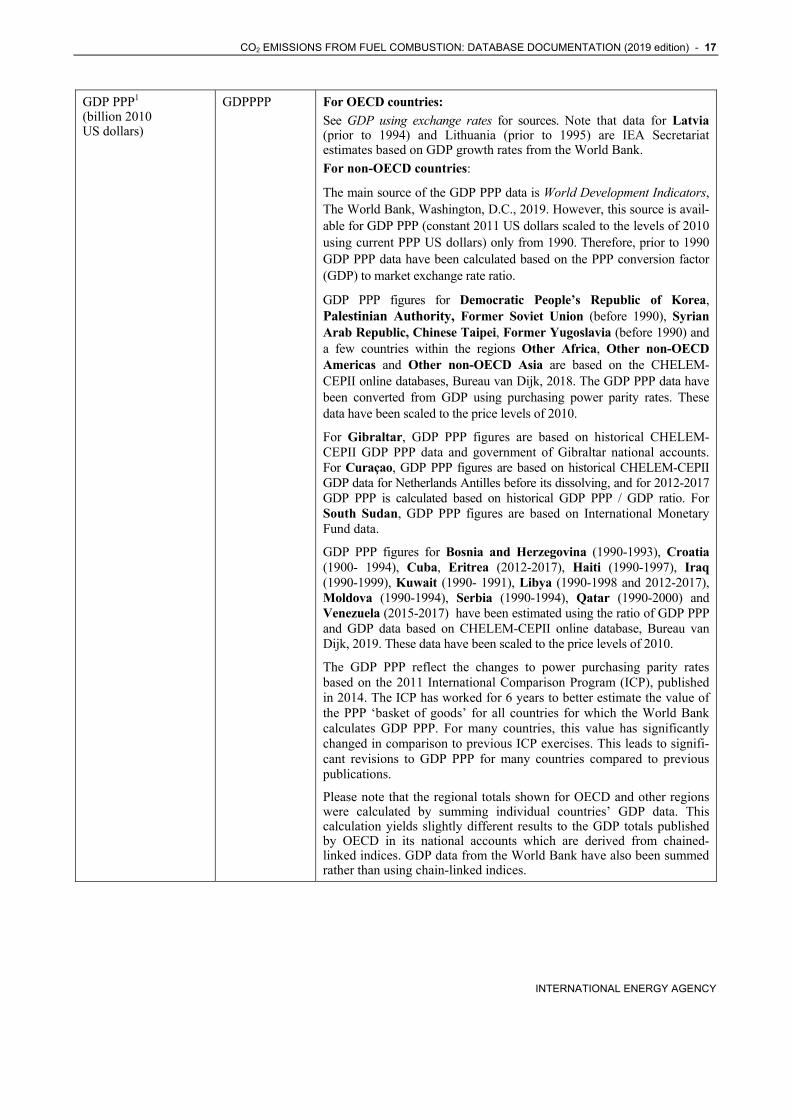
GDP PPP1 (billion 2010 US dollars)
GDPPPP For OECD countries:
See GDP using exchange rates for sources. Note that data for Latvia (prior to 1994) and Lithuania (prior to 1995) are IEA Secretariat estimates based on GDP growth rates from the World Bank.
For non-OECD countries:
The main source of the GDP PPP data is World Development Indicators, The World Bank, Washington, D.C., 2019. However, this source is avail-able for GDP PPP (constant 2011 US dollars scaled to the levels of 2010 using current PPP US dollars) only from 1990. Therefore, prior to 1990 GDP PPP data have been calculated based on the PPP conversion factor (GDP) to market exchange rate ratio.
GDP PPP figures for Democratic People’s Republic of Korea, Palestinian Authority, Former Soviet Union (before 1990), Syrian Arab Republic, Chinese Taipei, Former Yugoslavia (before 1990) and a few countries within the regions Other Africa, Other non-OECD Americas and Other non-OECD Asia are based on the CHELEM-CEPII online databases, Bureau van Dijk, 2018. The GDP PPP data have been converted from GDP using purchasing power parity rates. These data have been scaled to the price levels of 2010.
For Gibraltar, GDP PPP figures are based on historical CHELEM-CEPII GDP PPP data and government of Gibraltar national accounts. For Curaçao, GDP PPP figures are based on historical CHELEM-CEPII GDP data for Netherlands Antilles before its dissolving, and for 2012-2017 GDP PPP is calculated based on historical GDP PPP / GDP ratio. For South Sudan, GDP PPP figures are based on International Monetary Fund data.
GDP PPP figures for Bosnia and Herzegovina (1990-1993), Croatia (1900- 1994), Cuba, Eritrea (2012-2017), Haiti (1990-1997), Iraq (1990-1999), Kuwait (1990- 1991), Libya (1990-1998 and 2012-2017), Moldova (1990-1994), Serbia (1990-1994), Qatar (1990-2000) and Venezuela (2015-2017) have been estimated using the ratio of GDP PPP and GDP data based on CHELEM-CEPII online database, Bureau van Dijk, 2019. These data have been scaled to the price levels of 2010.
The GDP PPP reflect the changes to power purchasing parity rates based on the 2011 International Comparison Program (ICP), published in 2014. The ICP has worked for 6 years to better estimate the value of the PPP ‘basket of goods’ for all countries for which the World Bank calculates GDP PPP. For many countries, this value has significantly changed in comparison to previous ICP exercises. This leads to signifi-cant revisions to GDP PPP for many countries compared to previous publications.
Please note that the regional totals shown for OECD and other regions were calculated by summing individual countries’ GDP data. This calculation yields slightly different results to the GDP totals published by OECD in its national accounts which are derived from chained-linked indices. GDP data from the World Bank have also been summed rather than using chain-linked indices.
18 - CO2 EMISSIONS FROM FUEL COMBUSTION: DATABASE DOCUMENTATION (2019 edition)
INTERNATIONAL ENERGY AGENCY
Indicators
Flow Short name Notes
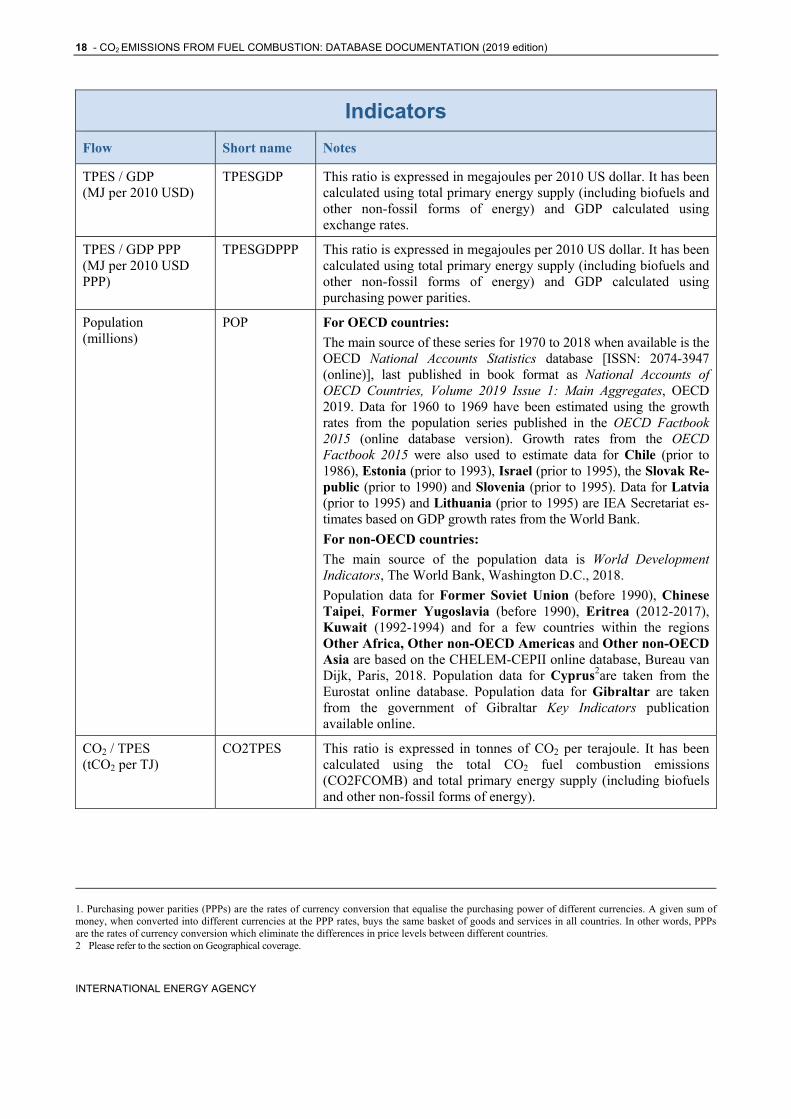
TPES / GDP (MJ per 2010 USD)
TPESGDP This ratio is expressed in megajoules per 2010 US dollar. It has been calculated using total primary energy supply (including biofuels and other non-fossil forms of energy) and GDP calculated using exchange rates.
TPES / GDP PPP (MJ per 2010 USD PPP)
TPESGDPPP This ratio is expressed in megajoules per 2010 US dollar. It has been calculated using total primary energy supply (including biofuels and other non-fossil forms of energy) and GDP calculated using purchasing power parities.
Population (millions)
POP For OECD countries:
The main source of these series for 1970 to 2018 when available is the OECD National Accounts Statistics database [ISSN: 2074-3947 (online)], last published in book format as National Accounts of OECD Countries, Volume 2019 Issue 1: Main Aggregates, OECD 2019. Data for 1960 to 1969 have been estimated using the growth rates from the population series published in the OECD Factbook 2015 (online database version). Growth rates from the OECD Factbook 2015 were also used to estimate data for Chile (prior to 1986), Estonia (prior to 1993), Israel (prior to 1995), the Slovak Re-public (prior to 1990) and Slovenia (prior to 1995). Data for Latvia (prior to 1995) and Lithuania (prior to 1995) are IEA Secretariat es-timates based on GDP growth rates from the World Bank.
For non-OECD countries:
The main source of the population data is World Development Indicators, The World Bank, Washington D.C., 2018.
Population data for Former Soviet Union (before 1990), Chinese Taipei, Former Yugoslavia (before 1990), Eritrea (2012-2017), Kuwait (1992-1994) and for a few countries within the regions Other Africa, Other non-OECD Americas and Other non-OECD Asia are based on the CHELEM-CEPII online database, Bureau van Dijk, Paris, 2018. Population data for Cyprus2are taken from the Eurostat online database. Population data for Gibraltar are taken from the government of Gibraltar Key Indicators publication available online.
CO2 / TPES (tCO2 per TJ)
CO2TPES This ratio is expressed in tonnes of CO2 per terajoule. It has been calculated using the total CO2 fuel combustion emissions (CO2FCOMB) and total primary energy supply (including biofuels and other non-fossil forms of energy).
1. Purchasing power parities (PPPs) are the rates of currency conversion that equalise the purchasing power of different currencies. A given sum of money, when converted into different currencies at the PPP rates, buys the same basket of goods and services in all countries. In other words, PPPs are the rates of currency conversion which eliminate the differences in price levels between different countries. 2 Please refer to the section on Geographical coverage.
CO2 EMISSIONS FROM FUEL COMBUSTION: DATABASE DOCUMENTATION (2019 edition) - 19
INTERNATIONAL ENERGY AGENCY
Indicators
Flow Short name Notes
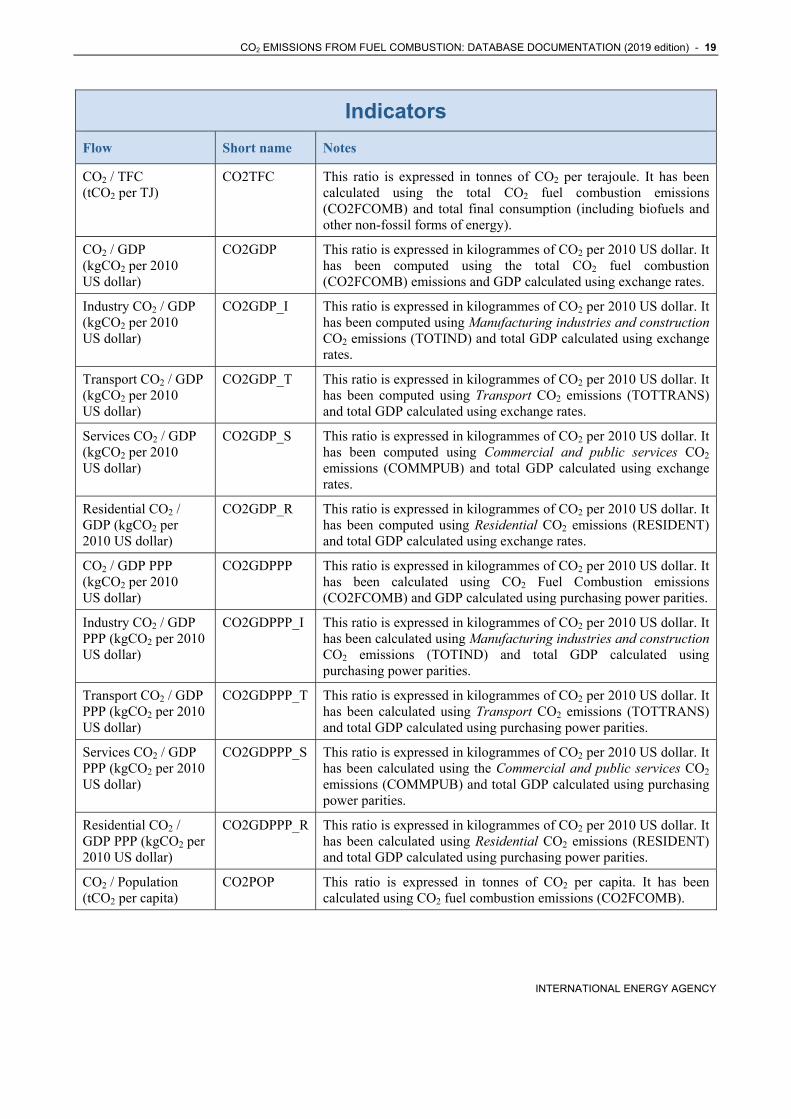
CO2 / TFC (tCO2 per TJ)
CO2TFC This ratio is expressed in tonnes of CO2 per terajoule. It has been calculated using the total CO2 fuel combustion emissions (CO2FCOMB) and total final consumption (including biofuels and other non-fossil forms of energy).
CO2 / GDP (kgCO2 per 2010 US dollar)
CO2GDP This ratio is expressed in kilogrammes of CO2 per 2010 US dollar. It has been computed using the total CO2 fuel combustion (CO2FCOMB) emissions and GDP calculated using exchange rates.
Industry CO2 / GDP (kgCO2 per 2010 US dollar)
CO2GDP_I This ratio is expressed in kilogrammes of CO2 per 2010 US dollar. It has been computed using Manufacturing industries and construction CO2 emissions (TOTIND) and total GDP calculated using exchange rates.
Transport CO2 / GDP (kgCO2 per 2010 US dollar)
CO2GDP_T This ratio is expressed in kilogrammes of CO2 per 2010 US dollar. It has been computed using Transport CO2 emissions (TOTTRANS) and total GDP calculated using exchange rates.
Services CO2 / GDP (kgCO2 per 2010 US dollar)
CO2GDP_S This ratio is expressed in kilogrammes of CO2 per 2010 US dollar. It has been computed using Commercial and public services CO2 emissions (COMMPUB) and total GDP calculated using exchange rates.
Residential CO2 / GDP (kgCO2 per 2010 US dollar)
CO2GDP_R This ratio is expressed in kilogrammes of CO2 per 2010 US dollar. It has been computed using Residential CO2 emissions (RESIDENT) and total GDP calculated using exchange rates.
CO2 / GDP PPP (kgCO2 per 2010 US dollar)
CO2GDPPP This ratio is expressed in kilogrammes of CO2 per 2010 US dollar. It has been calculated using CO2 Fuel Combustion emissions (CO2FCOMB) and GDP calculated using purchasing power parities.
Industry CO2 / GDP PPP (kgCO2 per 2010 US dollar)
CO2GDPPP_I This ratio is expressed in kilogrammes of CO2 per 2010 US dollar. It has been calculated using Manufacturing industries and construction CO2 emissions (TOTIND) and total GDP calculated using purchasing power parities.
Transport CO2 / GDP PPP (kgCO2 per 2010 US dollar)
CO2GDPPP_T This ratio is expressed in kilogrammes of CO2 per 2010 US dollar. It has been calculated using Transport CO2 emissions (TOTTRANS) and total GDP calculated using purchasing power parities.
Services CO2 / GDP PPP (kgCO2 per 2010 US dollar)
CO2GDPPP_S This ratio is expressed in kilogrammes of CO2 per 2010 US dollar. It has been calculated using the Commercial and public services CO2 emissions (COMMPUB) and total GDP calculated using purchasing power parities.
Residential CO2 / GDP PPP (kgCO2 per 2010 US dollar)
CO2GDPPP_R This ratio is expressed in kilogrammes of CO2 per 2010 US dollar. It has been calculated using Residential CO2 emissions (RESIDENT) and total GDP calculated using purchasing power parities.
CO2 / Population (tCO2 per capita)
CO2POP This ratio is expressed in tonnes of CO2 per capita. It has been calculated using CO2 fuel combustion emissions (CO2FCOMB).
20 - CO2 EMISSIONS FROM FUEL COMBUSTION: DATABASE DOCUMENTATION (2019 edition)
INTERNATIONAL ENERGY AGENCY
Indicators
Flow Short name Notes
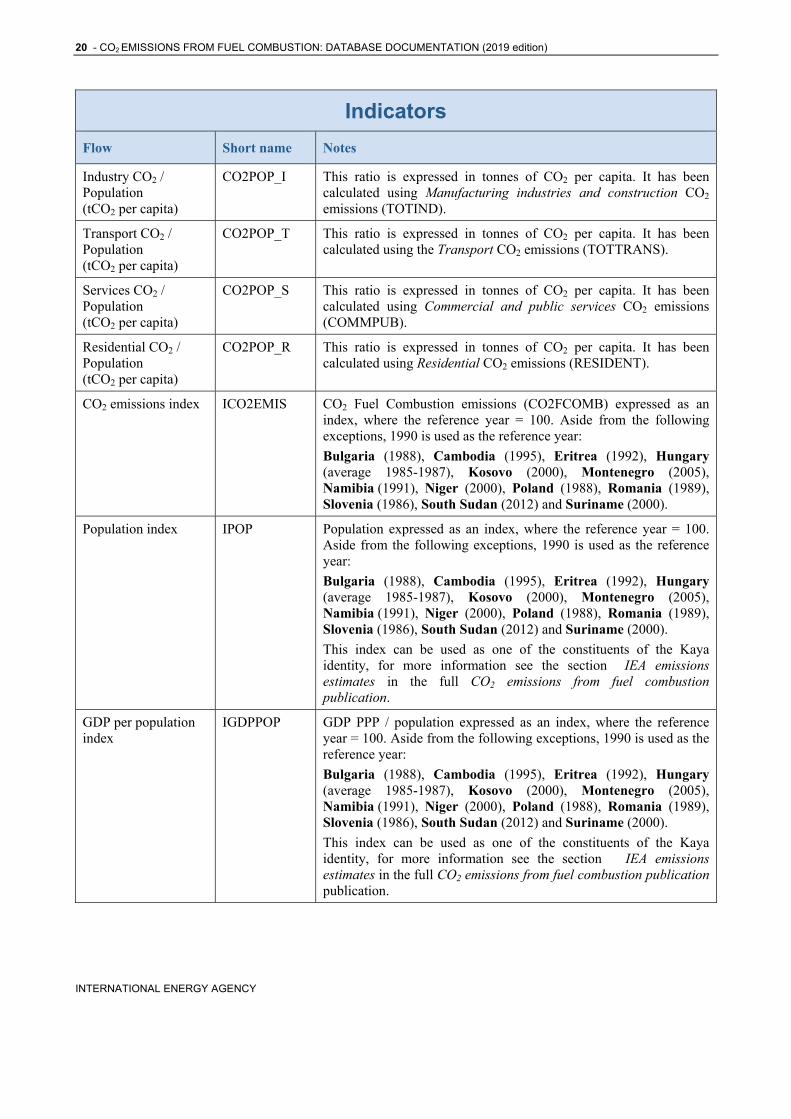
Industry CO2 / Population (tCO2 per capita)
CO2POP_I This ratio is expressed in tonnes of CO2 per capita. It has been calculated using Manufacturing industries and construction CO2 emissions (TOTIND).
Transport CO2 / Population (tCO2 per capita)
CO2POP_T This ratio is expressed in tonnes of CO2 per capita. It has been calculated using the Transport CO2 emissions (TOTTRANS).
Services CO2 / Population (tCO2 per capita)
CO2POP_S This ratio is expressed in tonnes of CO2 per capita. It has been calculated using Commercial and public services CO2 emissions (COMMPUB).
Residential CO2 / Population (tCO2 per capita)
CO2POP_R This ratio is expressed in tonnes of CO2 per capita. It has been calculated using Residential CO2 emissions (RESIDENT).
CO2 emissions index ICO2EMIS CO2 Fuel Combustion emissions (CO2FCOMB) expressed as an index, where the reference year = 100. Aside from the following exceptions, 1990 is used as the reference year:
Bulgaria (1988), Cambodia (1995), Eritrea (1992), Hungary (average 1985-1987), Kosovo (2000), Montenegro (2005), Namibia (1991), Niger (2000), Poland (1988), Romania (1989), Slovenia (1986), South Sudan (2012) and Suriname (2000).
Population index IPOP Population expressed as an index, where the reference year = 100. Aside from the following exceptions, 1990 is used as the reference year:
Bulgaria (1988), Cambodia (1995), Eritrea (1992), Hungary (average 1985-1987), Kosovo (2000), Montenegro (2005), Namibia (1991), Niger (2000), Poland (1988), Romania (1989), Slovenia (1986), South Sudan (2012) and Suriname (2000).
This index can be used as one of the constituents of the Kaya identity, for more information see the section IEA emissions estimates in the full CO2 emissions from fuel combustion publication.
GDP per population index
IGDPPOP GDP PPP / population expressed as an index, where the reference year = 100. Aside from the following exceptions, 1990 is used as the reference year:
Bulgaria (1988), Cambodia (1995), Eritrea (1992), Hungary (average 1985-1987), Kosovo (2000), Montenegro (2005), Namibia (1991), Niger (2000), Poland (1988), Romania (1989), Slovenia (1986), South Sudan (2012) and Suriname (2000).
This index can be used as one of the constituents of the Kaya identity, for more information see the section IEA emissions estimates in the full CO2 emissions from fuel combustion publication publication.
CO2 EMISSIONS FROM FUEL COMBUSTION: DATABASE DOCUMENTATION (2019 edition) - 21
INTERNATIONAL ENERGY AGENCY
Indicators
Flow Short name Notes
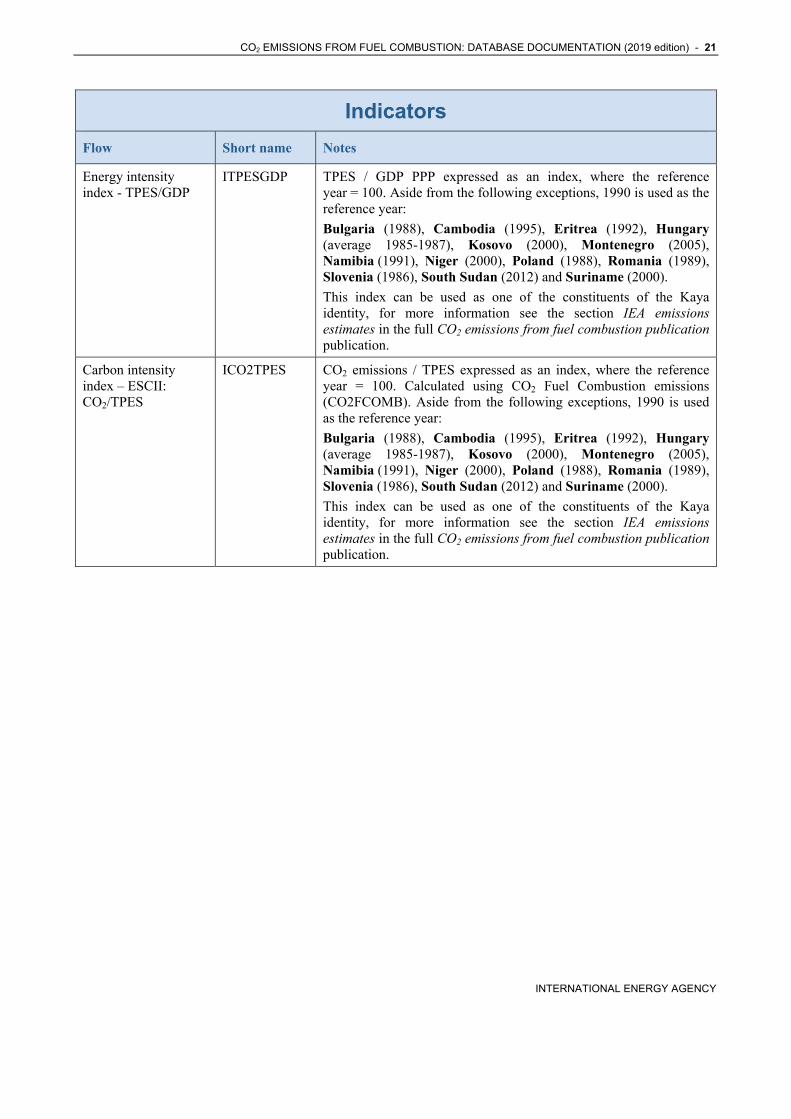
Energy intensity index - TPES/GDP
ITPESGDP TPES / GDP PPP expressed as an index, where the reference year = 100. Aside from the following exceptions, 1990 is used as the reference year:
Bulgaria (1988), Cambodia (1995), Eritrea (1992), Hungary (average 1985-1987), Kosovo (2000), Montenegro (2005), Namibia (1991), Niger (2000), Poland (1988), Romania (1989), Slovenia (1986), South Sudan (2012) and Suriname (2000).
This index can be used as one of the constituents of the Kaya identity, for more information see the section IEA emissions estimates in the full CO2 emissions from fuel combustion publication publication.
Carbon intensity index – ESCII: CO2/TPES
ICO2TPES CO2 emissions / TPES expressed as an index, where the reference year = 100. Calculated using CO2 Fuel Combustion emissions (CO2FCOMB). Aside from the following exceptions, 1990 is used as the reference year:
Bulgaria (1988), Cambodia (1995), Eritrea (1992), Hungary (average 1985-1987), Kosovo (2000), Montenegro (2005), Namibia (1991), Niger (2000), Poland (1988), Romania (1989), Slovenia (1986), South Sudan (2012) and Suriname (2000).
This index can be used as one of the constituents of the Kaya identity, for more information see the section IEA emissions estimates in the full CO2 emissions from fuel combustion publication publication.
22 - CO2 EMISSIONS FROM FUEL COMBUSTION: DATABASE DOCUMENTATION (2019 edition)
INTERNATIONAL ENERGY AGENCY
Allocation of emissions from electricity/heat
Flow Allocation Definition
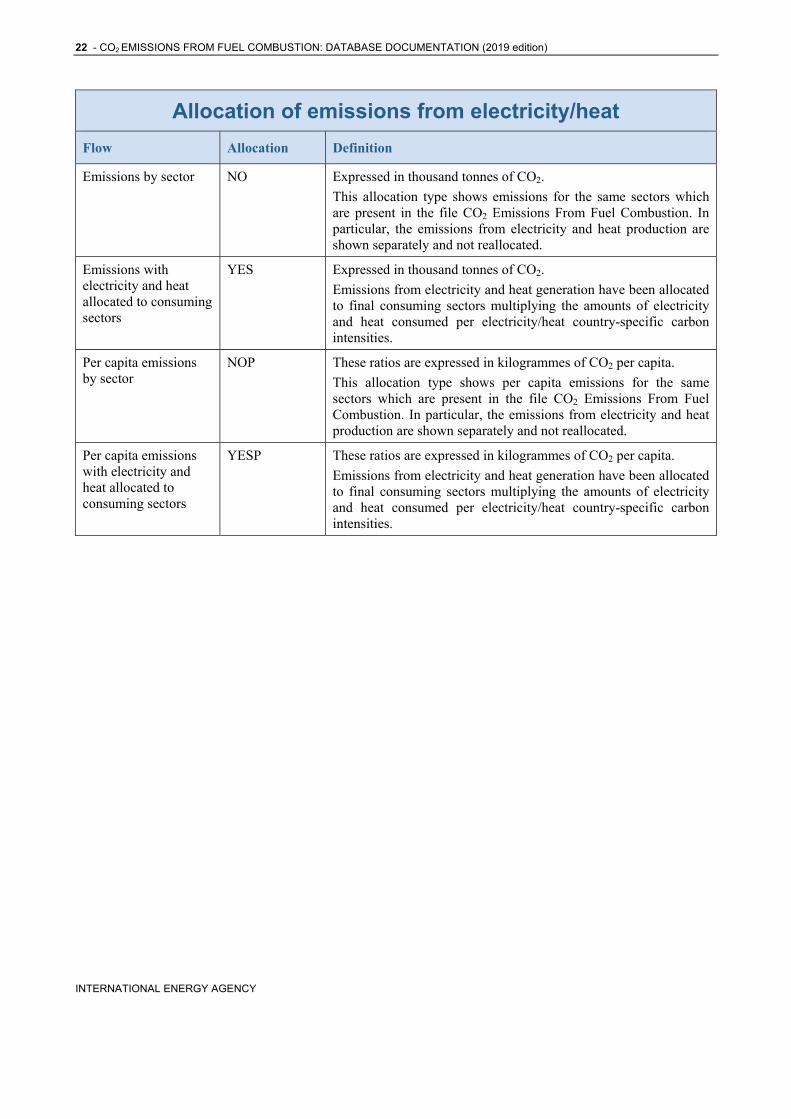
Emissions by sector NO Expressed in thousand tonnes of CO2.
This allocation type shows emissions for the same sectors which are present in the file CO2 Emissions From Fuel Combustion. In particular, the emissions from electricity and heat production are shown separately and not reallocated.
Emissions with electricity and heat allocated to consuming sectors
YES Expressed in thousand tonnes of CO2.
Emissions from electricity and heat generation have been allocated to final consuming sectors multiplying the amounts of electricity and heat consumed per electricity/heat country-specific carbon intensities.
Per capita emissions by sector
NOP These ratios are expressed in kilogrammes of CO2 per capita.
This allocation type shows per capita emissions for the same sectors which are present in the file CO2 Emissions From Fuel Combustion. In particular, the emissions from electricity and heat production are shown separately and not reallocated.
Per capita emissions with electricity and heat allocated to consuming sectors
YESP These ratios are expressed in kilogrammes of CO2 per capita.
Emissions from electricity and heat generation have been allocated to final consuming sectors multiplying the amounts of electricity and heat consumed per electricity/heat country-specific carbon intensities.
CO2 EMISSIONS FROM FUEL COMBUSTION: DATABASE DOCUMENTATION (2019 edition) - 23
INTERNATIONAL ENERGY AGENCY
IPCC Fuel Combustion Emissions (2006 Guidelines)
Flow Short name Definition
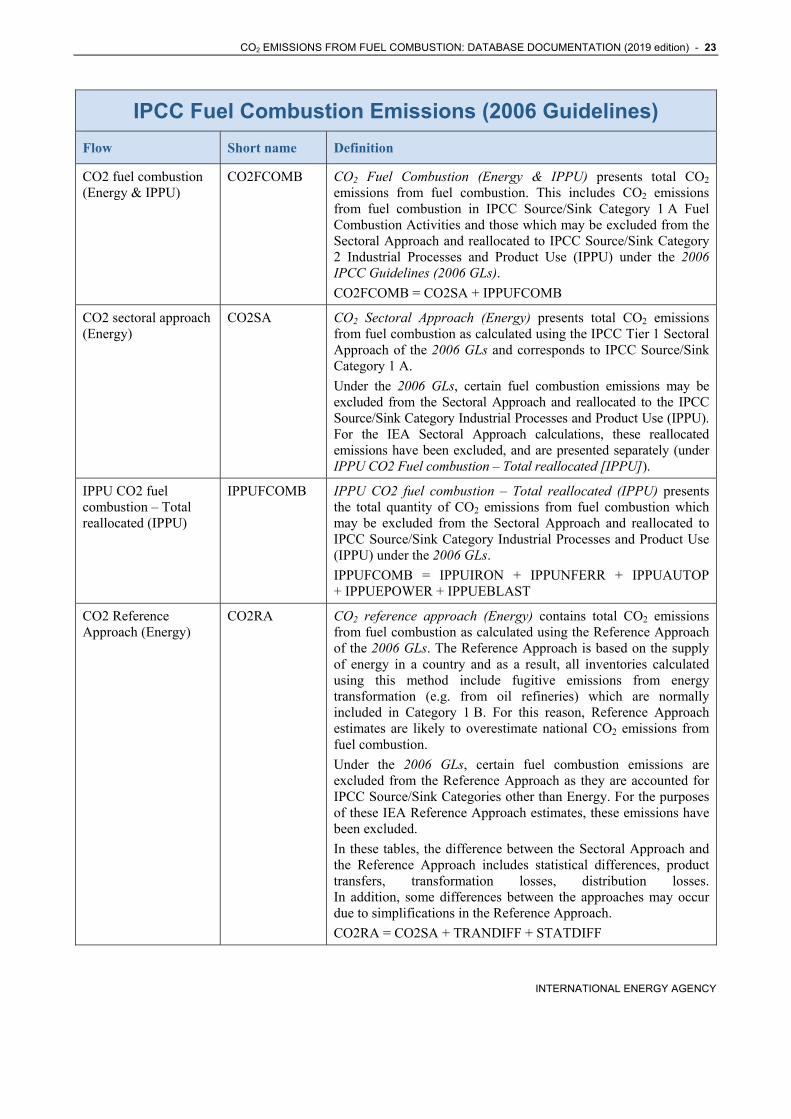
CO2 fuel combustion (Energy & IPPU)
CO2FCOMB CO2 Fuel Combustion (Energy & IPPU) presents total CO2 emissions from fuel combustion. This includes CO2 emissions from fuel combustion in IPCC Source/Sink Category 1 A Fuel Combustion Activities and those which may be excluded from the Sectoral Approach and reallocated to IPCC Source/Sink Category 2 Industrial Processes and Product Use (IPPU) under the 2006 IPCC Guidelines (2006 GLs).
CO2FCOMB = CO2SA + IPPUFCOMB
CO2 sectoral approach (Energy)
CO2SA CO2 Sectoral Approach (Energy) presents total CO2 emissions from fuel combustion as calculated using the IPCC Tier 1 Sectoral Approach of the 2006 GLs and corresponds to IPCC Source/Sink Category 1 A.
Under the 2006 GLs, certain fuel combustion emissions may be excluded from the Sectoral Approach and reallocated to the IPCC Source/Sink Category Industrial Processes and Product Use (IPPU). For the IEA Sectoral Approach calculations, these reallocated emissions have been excluded, and are presented separately (under IPPU CO2 Fuel combustion – Total reallocated [IPPU]).
IPPU CO2 fuel combustion – Total reallocated (IPPU)
IPPUFCOMB IPPU CO2 fuel combustion – Total reallocated (IPPU) presents the total quantity of CO2 emissions from fuel combustion which may be excluded from the Sectoral Approach and reallocated to IPCC Source/Sink Category Industrial Processes and Product Use (IPPU) under the 2006 GLs.
IPPUFCOMB = IPPUIRON + IPPUNFERR + IPPUAUTOP + IPPUEPOWER + IPPUEBLAST
CO2 Reference Approach (Energy)
CO2RA CO2 reference approach (Energy) contains total CO2 emissions from fuel combustion as calculated using the Reference Approach of the 2006 GLs. The Reference Approach is based on the supply of energy in a country and as a result, all inventories calculated using this method include fugitive emissions from energy transformation (e.g. from oil refineries) which are normally included in Category 1 B. For this reason, Reference Approach estimates are likely to overestimate national CO2 emissions from fuel combustion.
Under the 2006 GLs, certain fuel combustion emissions are excluded from the Reference Approach as they are accounted for IPCC Source/Sink Categories other than Energy. For the purposes of these IEA Reference Approach estimates, these emissions have been excluded.
In these tables, the difference between the Sectoral Approach and the Reference Approach includes statistical differences, product transfers, transformation losses, distribution losses. In addition, some differences between the approaches may occur due to simplifications in the Reference Approach.
CO2RA = CO2SA + TRANDIFF + STATDIFF
24 - CO2 EMISSIONS FROM FUEL COMBUSTION: DATABASE DOCUMENTATION (2019 edition)
INTERNATIONAL ENERGY AGENCY
IPCC Fuel Combustion Emissions (2006 Guidelines)
Flow Short name Definition
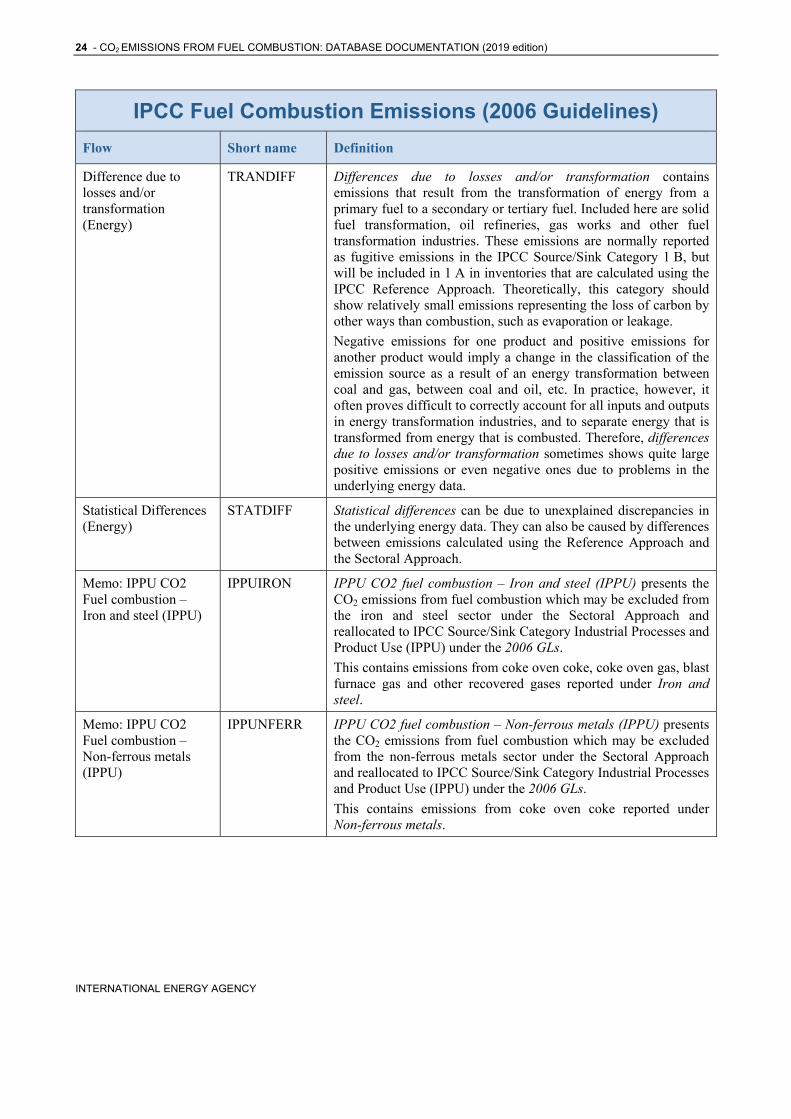
Difference due to losses and/or transformation (Energy)
TRANDIFF Differences due to losses and/or transformation contains emissions that result from the transformation of energy from a primary fuel to a secondary or tertiary fuel. Included here are solid fuel transformation, oil refineries, gas works and other fuel transformation industries. These emissions are normally reported as fugitive emissions in the IPCC Source/Sink Category 1 B, but will be included in 1 A in inventories that are calculated using the IPCC Reference Approach. Theoretically, this category should show relatively small emissions representing the loss of carbon by other ways than combustion, such as evaporation or leakage.
Negative emissions for one product and positive emissions for another product would imply a change in the classification of the emission source as a result of an energy transformation between coal and gas, between coal and oil, etc. In practice, however, it often proves difficult to correctly account for all inputs and outputs in energy transformation industries, and to separate energy that is transformed from energy that is combusted. Therefore, differences due to losses and/or transformation sometimes shows quite large positive emissions or even negative ones due to problems in the underlying energy data.
Statistical Differences (Energy)
STATDIFF Statistical differences can be due to unexplained discrepancies in the underlying energy data. They can also be caused by differences between emissions calculated using the Reference Approach and the Sectoral Approach.
Memo: IPPU CO2 Fuel combustion – Iron and steel (IPPU)
IPPUIRON IPPU CO2 fuel combustion – Iron and steel (IPPU) presents the CO2 emissions from fuel combustion which may be excluded from the iron and steel sector under the Sectoral Approach and reallocated to IPCC Source/Sink Category Industrial Processes and Product Use (IPPU) under the 2006 GLs.
This contains emissions from coke oven coke, coke oven gas, blast furnace gas and other recovered gases reported under Iron and steel.
Memo: IPPU CO2 Fuel combustion – Non-ferrous metals (IPPU)
IPPUNFERR IPPU CO2 fuel combustion – Non-ferrous metals (IPPU) presents the CO2 emissions from fuel combustion which may be excluded from the non-ferrous metals sector under the Sectoral Approach and reallocated to IPCC Source/Sink Category Industrial Processes and Product Use (IPPU) under the 2006 GLs.
This contains emissions from coke oven coke reported under Non-ferrous metals.
CO2 EMISSIONS FROM FUEL COMBUSTION: DATABASE DOCUMENTATION (2019 edition) - 25
INTERNATIONAL ENERGY AGENCY
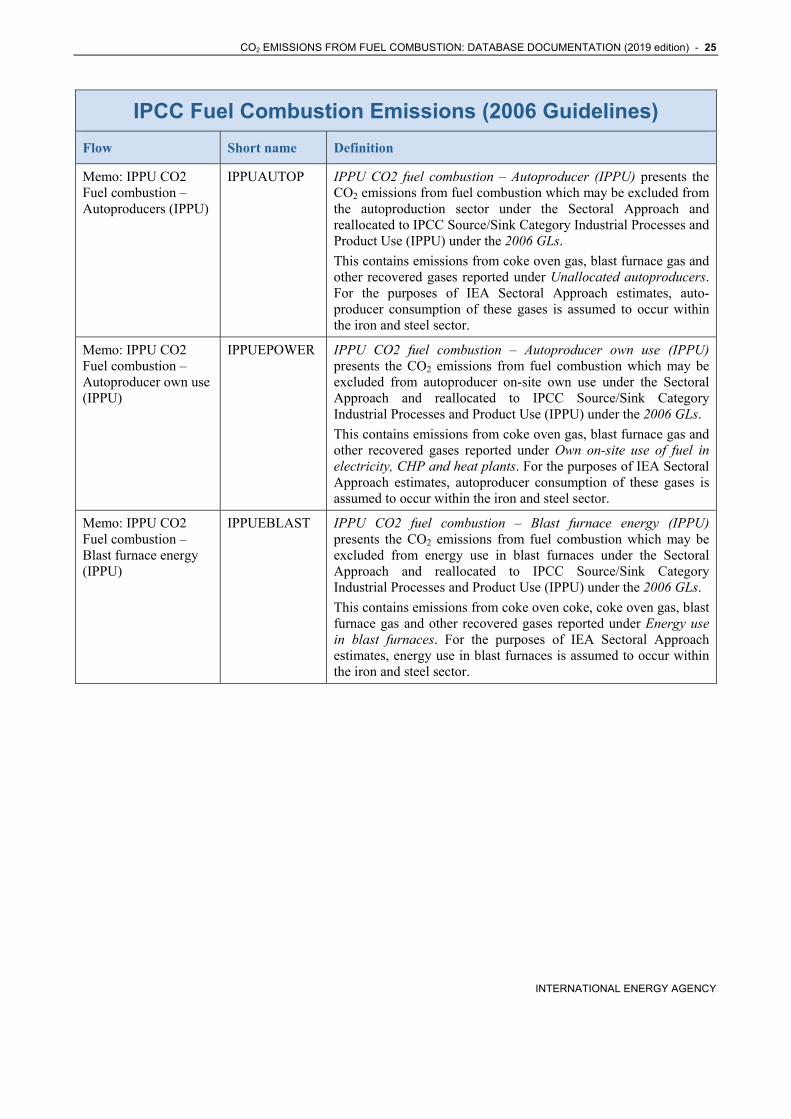
IPCC Fuel Combustion Emissions (2006 Guidelines)
Flow Short name Definition
Memo: IPPU CO2 Fuel combustion – Autoproducers (IPPU)
IPPUAUTOP IPPU CO2 fuel combustion – Autoproducer (IPPU) presents the CO2 emissions from fuel combustion which may be excluded from the autoproduction sector under the Sectoral Approach and reallocated to IPCC Source/Sink Category Industrial Processes and Product Use (IPPU) under the 2006 GLs.
This contains emissions from coke oven gas, blast furnace gas and other recovered gases reported under Unallocated autoproducers. For the purposes of IEA Sectoral Approach estimates, auto-producer consumption of these gases is assumed to occur within the iron and steel sector.
Memo: IPPU CO2 Fuel combustion – Autoproducer own use (IPPU)
IPPUEPOWER IPPU CO2 fuel combustion – Autoproducer own use (IPPU) presents the CO2 emissions from fuel combustion which may be excluded from autoproducer on-site own use under the Sectoral Approach and reallocated to IPCC Source/Sink Category Industrial Processes and Product Use (IPPU) under the 2006 GLs.
This contains emissions from coke oven gas, blast furnace gas and other recovered gases reported under Own on-site use of fuel in electricity, CHP and heat plants. For the purposes of IEA Sectoral Approach estimates, autoproducer consumption of these gases is assumed to occur within the iron and steel sector.
Memo: IPPU CO2 Fuel combustion – Blast furnace energy (IPPU)
IPPUEBLAST IPPU CO2 fuel combustion – Blast furnace energy (IPPU) presents the CO2 emissions from fuel combustion which may be excluded from energy use in blast furnaces under the Sectoral Approach and reallocated to IPCC Source/Sink Category Industrial Processes and Product Use (IPPU) under the 2006 GLs.
This contains emissions from coke oven coke, coke oven gas, blast furnace gas and other recovered gases reported under Energy use in blast furnaces. For the purposes of IEA Sectoral Approach estimates, energy use in blast furnaces is assumed to occur within the iron and steel sector.
26 - CO2 EMISSIONS FROM FUEL COMBUSTION: DATABASE DOCUMENTATION (2019 edition)
INTERNATIONAL ENERGY AGENCY
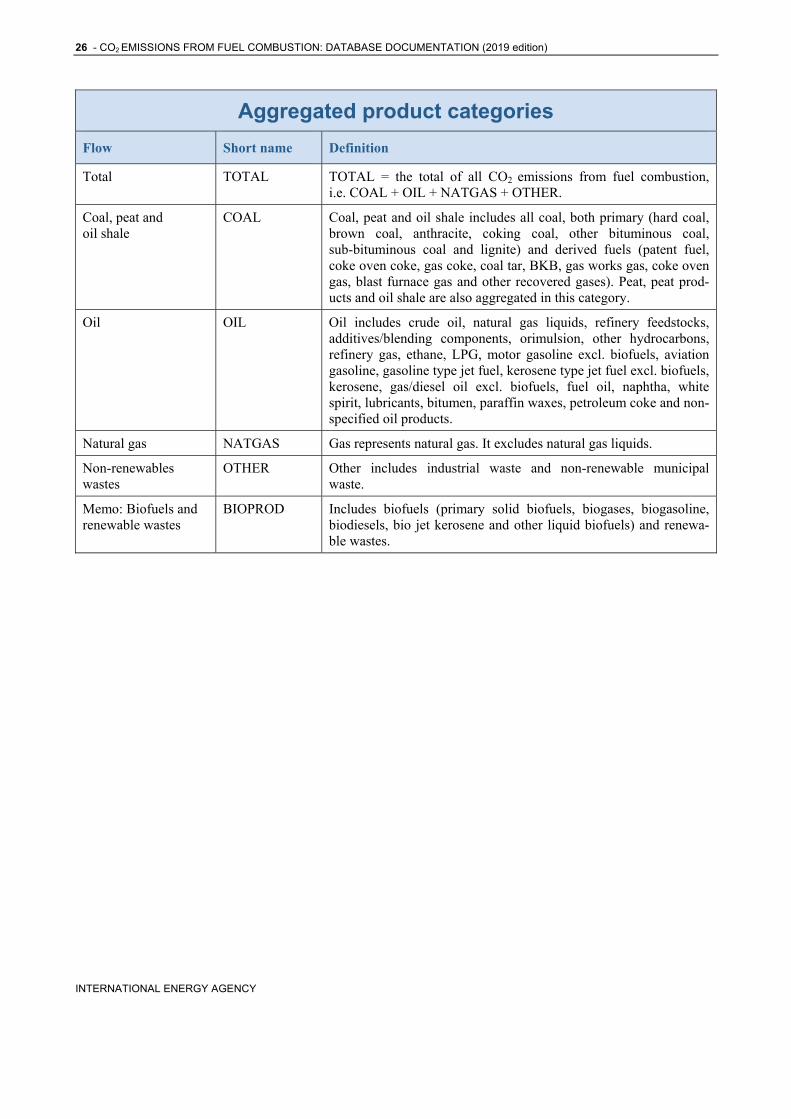
Aggregated product categories
Flow Short name Definition
Total TOTAL TOTAL = the total of all CO2 emissions from fuel combustion, i.e. COAL + OIL + NATGAS + OTHER.
Coal, peat and oil shale
COAL Coal, peat and oil shale includes all coal, both primary (hard coal, brown coal, anthracite, coking coal, other bituminous coal, sub-bituminous coal and lignite) and derived fuels (patent fuel, coke oven coke, gas coke, coal tar, BKB, gas works gas, coke oven gas, blast furnace gas and other recovered gases). Peat, peat prod-ucts and oil shale are also aggregated in this category.
Oil OIL Oil includes crude oil, natural gas liquids, refinery feedstocks, additives/blending components, orimulsion, other hydrocarbons, refinery gas, ethane, LPG, motor gasoline excl. biofuels, aviation gasoline, gasoline type jet fuel, kerosene type jet fuel excl. biofuels, kerosene, gas/diesel oil excl. biofuels, fuel oil, naphtha, white spirit, lubricants, bitumen, paraffin waxes, petroleum coke and non-specified oil products.
Natural gas NATGAS Gas represents natural gas. It excludes natural gas liquids.
Non-renewables wastes
OTHER Other includes industrial waste and non-renewable municipal waste.
Memo: Biofuels and renewable wastes
BIOPROD Includes biofuels (primary solid biofuels, biogases, biogasoline, biodiesels, bio jet kerosene and other liquid biofuels) and renewa-ble wastes.
CO2 EMISSIONS FROM FUEL COMBUSTION: DATABASE DOCUMENTATION (2019 edition) - 27
INTERNATIONAL ENERGY AGENCY
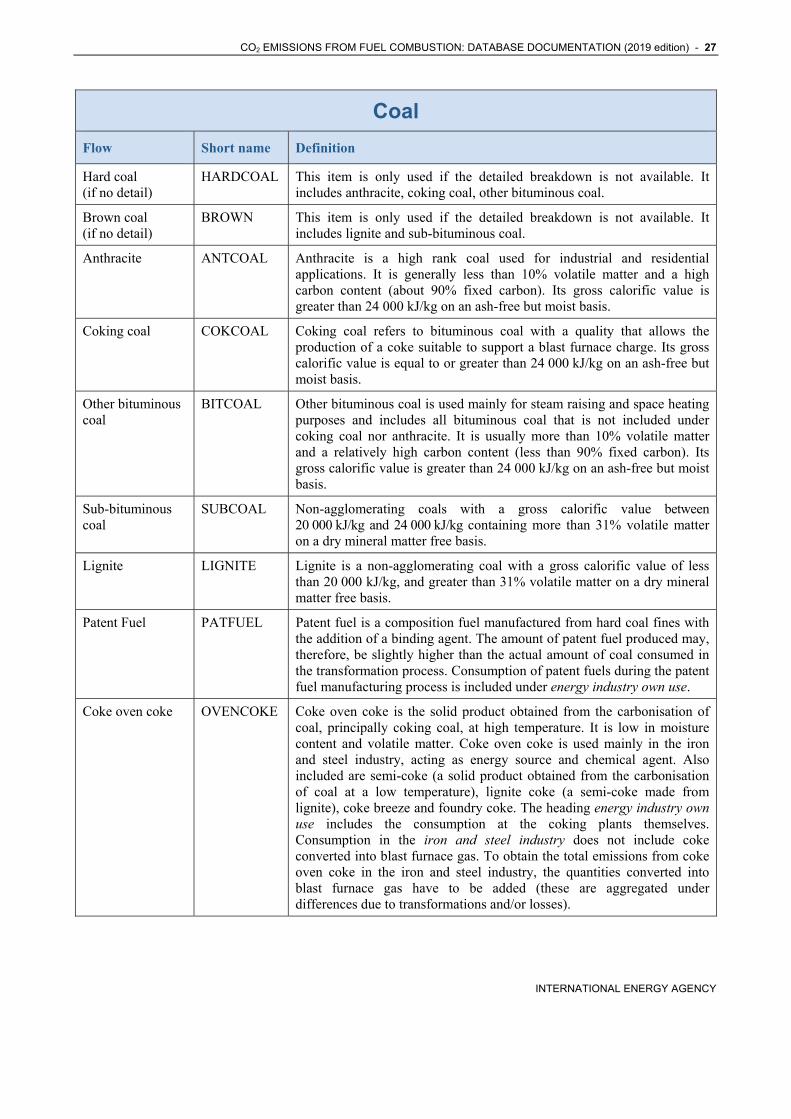
Coal
Flow Short name Definition
Hard coal (if no detail)
HARDCOAL This item is only used if the detailed breakdown is not available. It includes anthracite, coking coal, other bituminous coal.
Brown coal (if no detail)
BROWN This item is only used if the detailed breakdown is not available. It includes lignite and sub-bituminous coal.
Anthracite ANTCOAL Anthracite is a high rank coal used for industrial and residential applications. It is generally less than 10% volatile matter and a high carbon content (about 90% fixed carbon). Its gross calorific value is greater than 24 000 kJ/kg on an ash-free but moist basis.
Coking coal COKCOAL Coking coal refers to bituminous coal with a quality that allows the production of a coke suitable to support a blast furnace charge. Its gross calorific value is equal to or greater than 24 000 kJ/kg on an ash-free but moist basis.
Other bituminous coal
BITCOAL Other bituminous coal is used mainly for steam raising and space heating purposes and includes all bituminous coal that is not included under coking coal nor anthracite. It is usually more than 10% volatile matter and a relatively high carbon content (less than 90% fixed carbon). Its gross calorific value is greater than 24 000 kJ/kg on an ash-free but moist basis.
Sub-bituminous coal
SUBCOAL Non-agglomerating coals with a gross calorific value between 20 000 kJ/kg and 24 000 kJ/kg containing more than 31% volatile matter on a dry mineral matter free basis.
Lignite LIGNITE Lignite is a non-agglomerating coal with a gross calorific value of less than 20 000 kJ/kg, and greater than 31% volatile matter on a dry mineral matter free basis.
Patent Fuel PATFUEL Patent fuel is a composition fuel manufactured from hard coal fines with the addition of a binding agent. The amount of patent fuel produced may, therefore, be slightly higher than the actual amount of coal consumed in the transformation process. Consumption of patent fuels during the patent fuel manufacturing process is included under energy industry own use.
Coke oven coke OVENCOKE Coke oven coke is the solid product obtained from the carbonisation of coal, principally coking coal, at high temperature. It is low in moisture content and volatile matter. Coke oven coke is used mainly in the iron and steel industry, acting as energy source and chemical agent. Also included are semi-coke (a solid product obtained from the carbonisation of coal at a low temperature), lignite coke (a semi-coke made from lignite), coke breeze and foundry coke. The heading energy industry own use includes the consumption at the coking plants themselves. Consumption in the iron and steel industry does not include coke converted into blast furnace gas. To obtain the total emissions from coke oven coke in the iron and steel industry, the quantities converted into blast furnace gas have to be added (these are aggregated under differences due to transformations and/or losses).
28 - CO2 EMISSIONS FROM FUEL COMBUSTION: DATABASE DOCUMENTATION (2019 edition)
INTERNATIONAL ENERGY AGENCY
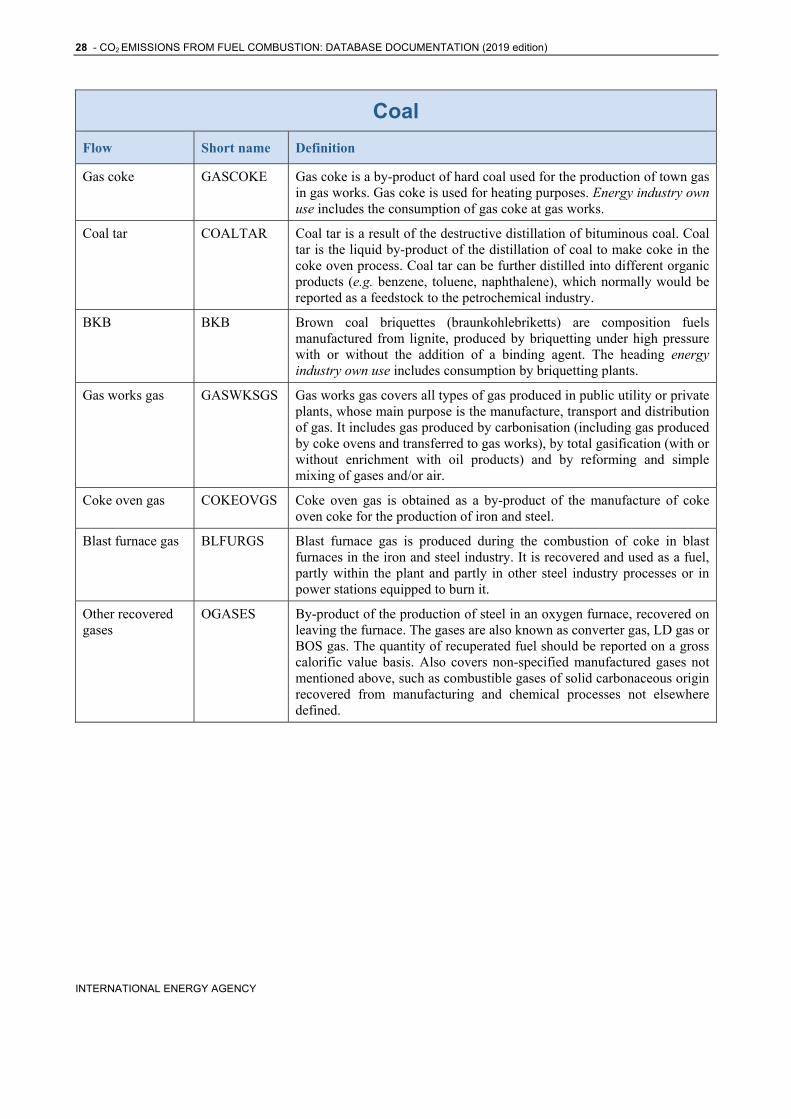
Coal
Flow Short name Definition
Gas coke GASCOKE Gas coke is a by-product of hard coal used for the production of town gas in gas works. Gas coke is used for heating purposes. Energy industry own use includes the consumption of gas coke at gas works.
Coal tar COALTAR Coal tar is a result of the destructive distillation of bituminous coal. Coal tar is the liquid by-product of the distillation of coal to make coke in the coke oven process. Coal tar can be further distilled into different organic products (e.g. benzene, toluene, naphthalene), which normally would be reported as a feedstock to the petrochemical industry.
BKB BKB Brown coal briquettes (braunkohlebriketts) are composition fuels manufactured from lignite, produced by briquetting under high pressure with or without the addition of a binding agent. The heading energy industry own use includes consumption by briquetting plants.
Gas works gas GASWKSGS Gas works gas covers all types of gas produced in public utility or private plants, whose main purpose is the manufacture, transport and distribution of gas. It includes gas produced by carbonisation (including gas produced by coke ovens and transferred to gas works), by total gasification (with or without enrichment with oil products) and by reforming and simple mixing of gases and/or air.
Coke oven gas COKEOVGS Coke oven gas is obtained as a by-product of the manufacture of coke oven coke for the production of iron and steel.
Blast furnace gas BLFURGS Blast furnace gas is produced during the combustion of coke in blast furnaces in the iron and steel industry. It is recovered and used as a fuel, partly within the plant and partly in other steel industry processes or in power stations equipped to burn it.
Other recovered gases
OGASES By-product of the production of steel in an oxygen furnace, recovered on leaving the furnace. The gases are also known as converter gas, LD gas or BOS gas. The quantity of recuperated fuel should be reported on a gross calorific value basis. Also covers non-specified manufactured gases not mentioned above, such as combustible gases of solid carbonaceous origin recovered from manufacturing and chemical processes not elsewhere defined.
CO2 EMISSIONS FROM FUEL COMBUSTION: DATABASE DOCUMENTATION (2019 edition) - 29
INTERNATIONAL ENERGY AGENCY
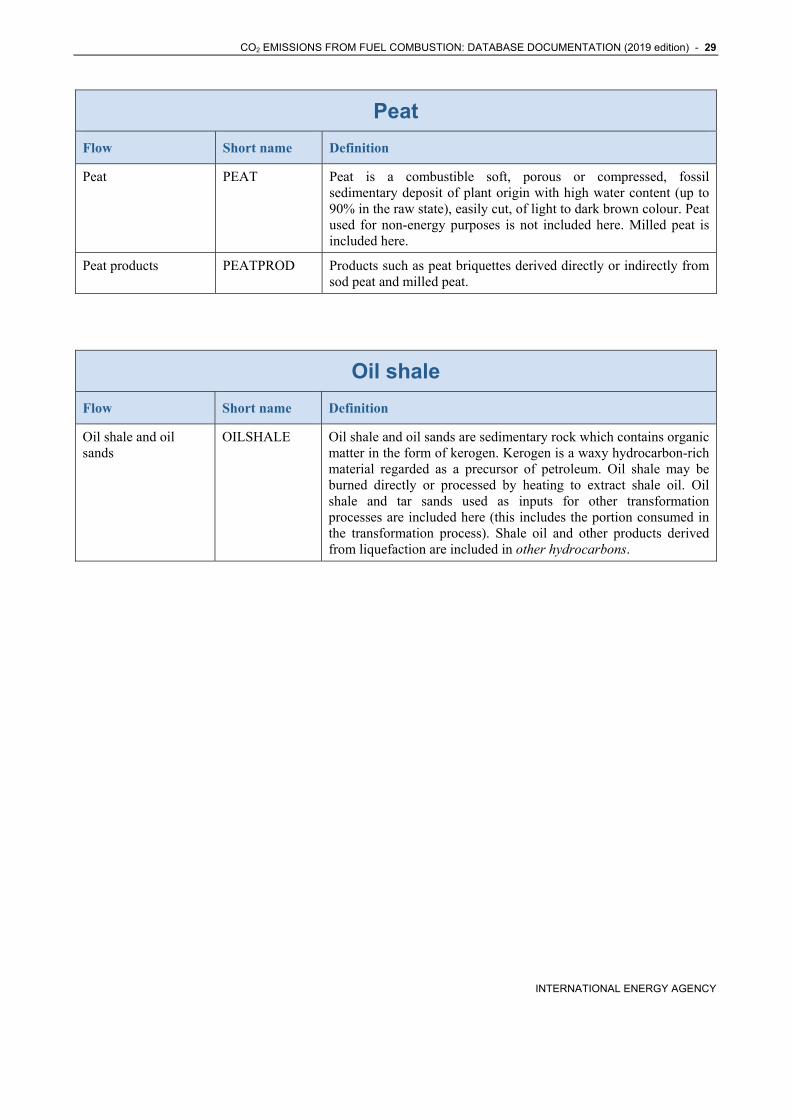
Peat
Flow Short name Definition
Peat PEAT Peat is a combustible soft, porous or compressed, fossil sedimentary deposit of plant origin with high water content (up to 90% in the raw state), easily cut, of light to dark brown colour. Peat used for non-energy purposes is not included here. Milled peat is included here.
Peat products PEATPROD Products such as peat briquettes derived directly or indirectly from sod peat and milled peat.
Oil shale
Flow Short name Definition
Oil shale and oil sands
OILSHALE Oil shale and oil sands are sedimentary rock which contains organic matter in the form of kerogen. Kerogen is a waxy hydrocarbon-rich material regarded as a precursor of petroleum. Oil shale may be burned directly or processed by heating to extract shale oil. Oil shale and tar sands used as inputs for other transformation processes are included here (this includes the portion consumed in the transformation process). Shale oil and other products derived from liquefaction are included in other hydrocarbons.
30 - CO2 EMISSIONS FROM FUEL COMBUSTION: DATABASE DOCUMENTATION (2019 edition)
INTERNATIONAL ENERGY AGENCY
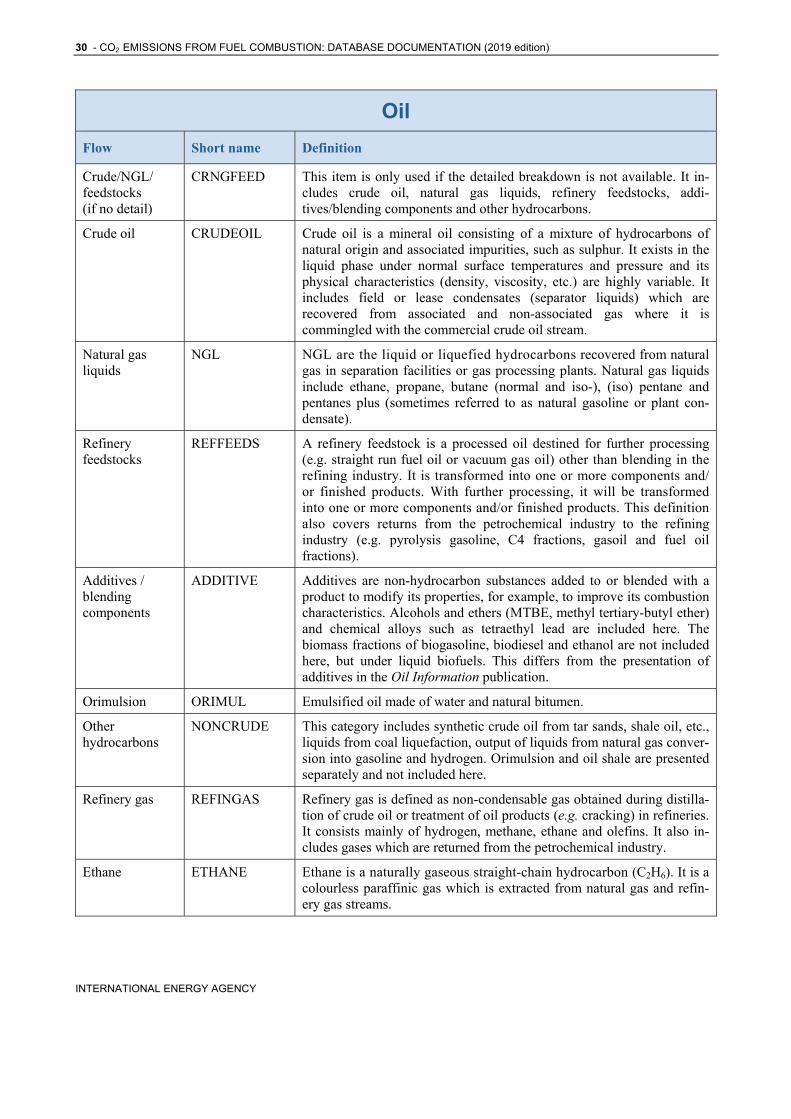
Oil
Flow Short name Definition
Crude/NGL/ feedstocks (if no detail)
CRNGFEED This item is only used if the detailed breakdown is not available. It in-cludes crude oil, natural gas liquids, refinery feedstocks, addi-tives/blending components and other hydrocarbons.
Crude oil CRUDEOIL Crude oil is a mineral oil consisting of a mixture of hydrocarbons of natural origin and associated impurities, such as sulphur. It exists in the liquid phase under normal surface temperatures and pressure and its physical characteristics (density, viscosity, etc.) are highly variable. It includes field or lease condensates (separator liquids) which are recovered from associated and non-associated gas where it is commingled with the commercial crude oil stream.
Natural gas liquids
NGL NGL are the liquid or liquefied hydrocarbons recovered from natural gas in separation facilities or gas processing plants. Natural gas liquids include ethane, propane, butane (normal and iso-), (iso) pentane and pentanes plus (sometimes referred to as natural gasoline or plant con-densate).
Refinery feedstocks
REFFEEDS A refinery feedstock is a processed oil destined for further processing (e.g. straight run fuel oil or vacuum gas oil) other than blending in the refining industry. It is transformed into one or more components and/or finished products. With further processing, it will be transformed into one or more components and/or finished products. This definition also covers returns from the petrochemical industry to the refining industry (e.g. pyrolysis gasoline, C4 fractions, gasoil and fuel oil fractions).
Additives / blending components
ADDITIVE Additives are non-hydrocarbon substances added to or blended with a product to modify its properties, for example, to improve its combustion characteristics. Alcohols and ethers (MTBE, methyl tertiary-butyl ether) and chemical alloys such as tetraethyl lead are included here. The biomass fractions of biogasoline, biodiesel and ethanol are not included here, but under liquid biofuels. This differs from the presentation of additives in the Oil Information publication.
Orimulsion ORIMUL Emulsified oil made of water and natural bitumen.
Other hydrocarbons
NONCRUDE This category includes synthetic crude oil from tar sands, shale oil, etc., liquids from coal liquefaction, output of liquids from natural gas conver-sion into gasoline and hydrogen. Orimulsion and oil shale are presented separately and not included here.
Refinery gas REFINGAS Refinery gas is defined as non-condensable gas obtained during distilla-tion of crude oil or treatment of oil products (e.g. cracking) in refineries. It consists mainly of hydrogen, methane, ethane and olefins. It also in-cludes gases which are returned from the petrochemical industry.
Ethane ETHANE Ethane is a naturally gaseous straight-chain hydrocarbon (C2H6). It is a colourless paraffinic gas which is extracted from natural gas and refin-ery gas streams.
CO2 EMISSIONS FROM FUEL COMBUSTION: DATABASE DOCUMENTATION (2019 edition) - 31
INTERNATIONAL ENERGY AGENCY
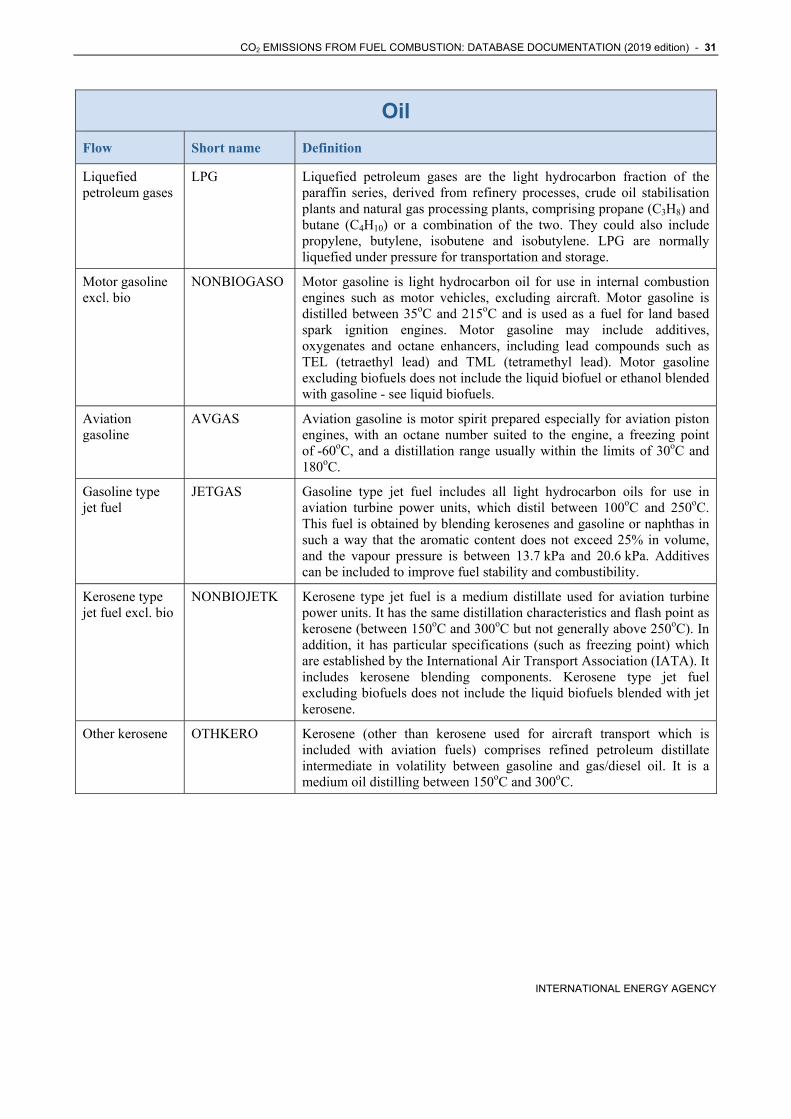
Oil
Flow Short name Definition
Liquefied petroleum gases
LPG Liquefied petroleum gases are the light hydrocarbon fraction of the paraffin series, derived from refinery processes, crude oil stabilisation plants and natural gas processing plants, comprising propane (C3H8) and butane (C4H10) or a combination of the two. They could also include propylene, butylene, isobutene and isobutylene. LPG are normally liquefied under pressure for transportation and storage.
Motor gasoline excl. bio
NONBIOGASO Motor gasoline is light hydrocarbon oil for use in internal combustion engines such as motor vehicles, excluding aircraft. Motor gasoline is distilled between 35oC and 215oC and is used as a fuel for land based spark ignition engines. Motor gasoline may include additives, oxygenates and octane enhancers, including lead compounds such as TEL (tetraethyl lead) and TML (tetramethyl lead). Motor gasoline excluding biofuels does not include the liquid biofuel or ethanol blended with gasoline - see liquid biofuels.
Aviation gasoline
AVGAS Aviation gasoline is motor spirit prepared especially for aviation piston engines, with an octane number suited to the engine, a freezing point of -60oC, and a distillation range usually within the limits of 30oC and 180oC.
Gasoline type jet fuel
JETGAS Gasoline type jet fuel includes all light hydrocarbon oils for use in aviation turbine power units, which distil between 100oC and 250oC. This fuel is obtained by blending kerosenes and gasoline or naphthas in such a way that the aromatic content does not exceed 25% in volume, and the vapour pressure is between 13.7 kPa and 20.6 kPa. Additives can be included to improve fuel stability and combustibility.
Kerosene type jet fuel excl. bio
NONBIOJETK Kerosene type jet fuel is a medium distillate used for aviation turbine power units. It has the same distillation characteristics and flash point as kerosene (between 150oC and 300oC but not generally above 250oC). In addition, it has particular specifications (such as freezing point) which are established by the International Air Transport Association (IATA). It includes kerosene blending components. Kerosene type jet fuel excluding biofuels does not include the liquid biofuels blended with jet kerosene.
Other kerosene OTHKERO Kerosene (other than kerosene used for aircraft transport which is included with aviation fuels) comprises refined petroleum distillate intermediate in volatility between gasoline and gas/diesel oil. It is a medium oil distilling between 150oC and 300oC.
32 - CO2 EMISSIONS FROM FUEL COMBUSTION: DATABASE DOCUMENTATION (2019 edition)
INTERNATIONAL ENERGY AGENCY
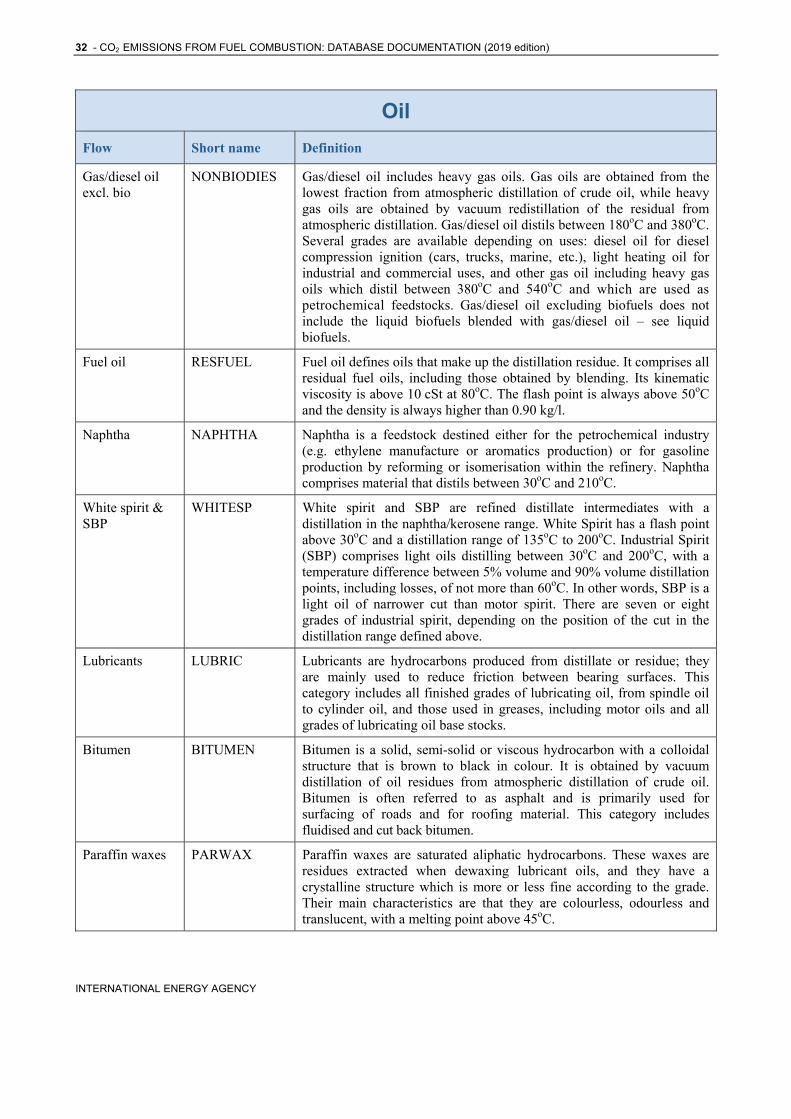
Oil
Flow Short name Definition
Gas/diesel oil excl. bio
NONBIODIES Gas/diesel oil includes heavy gas oils. Gas oils are obtained from the lowest fraction from atmospheric distillation of crude oil, while heavy gas oils are obtained by vacuum redistillation of the residual from atmospheric distillation. Gas/diesel oil distils between 180oC and 380oC. Several grades are available depending on uses: diesel oil for diesel compression ignition (cars, trucks, marine, etc.), light heating oil for industrial and commercial uses, and other gas oil including heavy gas oils which distil between 380oC and 540oC and which are used as petrochemical feedstocks. Gas/diesel oil excluding biofuels does not include the liquid biofuels blended with gas/diesel oil – see liquid biofuels.
Fuel oil RESFUEL Fuel oil defines oils that make up the distillation residue. It comprises all residual fuel oils, including those obtained by blending. Its kinematic viscosity is above 10 cSt at 80oC. The flash point is always above 50oC and the density is always higher than 0.90 kg/l.
Naphtha NAPHTHA Naphtha is a feedstock destined either for the petrochemical industry (e.g. ethylene manufacture or aromatics production) or for gasoline production by reforming or isomerisation within the refinery. Naphtha comprises material that distils between 30oC and 210oC.
White spirit & SBP
WHITESP White spirit and SBP are refined distillate intermediates with a distillation in the naphtha/kerosene range. White Spirit has a flash point above 30oC and a distillation range of 135oC to 200oC. Industrial Spirit (SBP) comprises light oils distilling between 30oC and 200oC, with a temperature difference between 5% volume and 90% volume distillation points, including losses, of not more than 60oC. In other words, SBP is a light oil of narrower cut than motor spirit. There are seven or eight grades of industrial spirit, depending on the position of the cut in the distillation range defined above.
Lubricants LUBRIC Lubricants are hydrocarbons produced from distillate or residue; they are mainly used to reduce friction between bearing surfaces. This category includes all finished grades of lubricating oil, from spindle oil to cylinder oil, and those used in greases, including motor oils and all grades of lubricating oil base stocks.
Bitumen BITUMEN Bitumen is a solid, semi-solid or viscous hydrocarbon with a colloidal structure that is brown to black in colour. It is obtained by vacuum distillation of oil residues from atmospheric distillation of crude oil. Bitumen is often referred to as asphalt and is primarily used for surfacing of roads and for roofing material. This category includes fluidised and cut back bitumen.
Paraffin waxes PARWAX Paraffin waxes are saturated aliphatic hydrocarbons. These waxes are residues extracted when dewaxing lubricant oils, and they have a crystalline structure which is more or less fine according to the grade. Their main characteristics are that they are colourless, odourless and translucent, with a melting point above 45oC.
CO2 EMISSIONS FROM FUEL COMBUSTION: DATABASE DOCUMENTATION (2019 edition) - 33
INTERNATIONAL ENERGY AGENCY
Oil
Flow Short name Definition
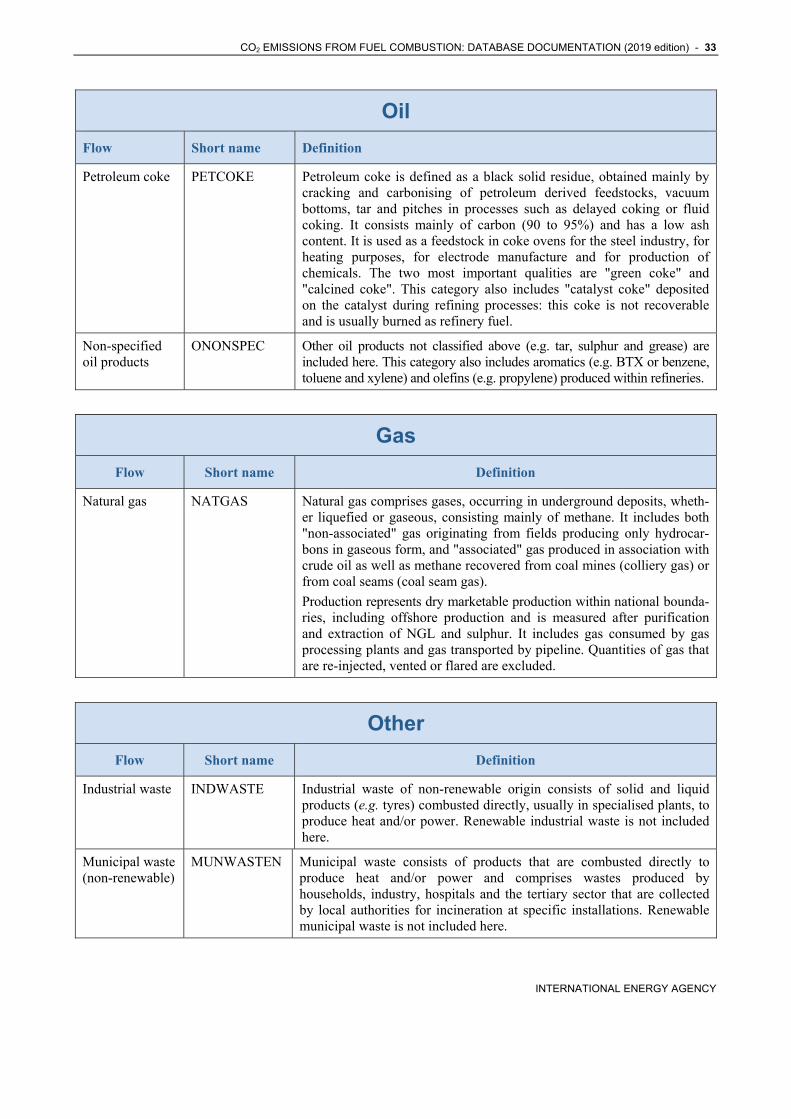
Petroleum coke PETCOKE Petroleum coke is defined as a black solid residue, obtained mainly by cracking and carbonising of petroleum derived feedstocks, vacuum bottoms, tar and pitches in processes such as delayed coking or fluid coking. It consists mainly of carbon (90 to 95%) and has a low ash content. It is used as a feedstock in coke ovens for the steel industry, for heating purposes, for electrode manufacture and for production of chemicals. The two most important qualities are "green coke" and "calcined coke". This category also includes "catalyst coke" deposited on the catalyst during refining processes: this coke is not recoverable and is usually burned as refinery fuel.
Non-specified oil products
ONONSPEC Other oil products not classified above (e.g. tar, sulphur and grease) are included here. This category also includes aromatics (e.g. BTX or benzene, toluene and xylene) and olefins (e.g. propylene) produced within refineries.
Gas
Flow Short name Definition
Natural gas NATGAS Natural gas comprises gases, occurring in underground deposits, wheth-er liquefied or gaseous, consisting mainly of methane. It includes both "non-associated" gas originating from fields producing only hydrocar-bons in gaseous form, and "associated" gas produced in association with crude oil as well as methane recovered from coal mines (colliery gas) or from coal seams (coal seam gas).
Production represents dry marketable production within national bounda-ries, including offshore production and is measured after purification and extraction of NGL and sulphur. It includes gas consumed by gas processing plants and gas transported by pipeline. Quantities of gas that are re-injected, vented or flared are excluded.
Other
Flow Short name Definition
Industrial waste INDWASTE Industrial waste of non-renewable origin consists of solid and liquid products (e.g. tyres) combusted directly, usually in specialised plants, to produce heat and/or power. Renewable industrial waste is not included here.
Municipal waste (non-renewable)
MUNWASTEN Municipal waste consists of products that are combusted directly to produce heat and/or power and comprises wastes produced by households, industry, hospitals and the tertiary sector that are collected by local authorities for incineration at specific installations. Renewable municipal waste is not included here.
34 - CO2 EMISSIONS FROM FUEL COMBUSTION: DATABASE DOCUMENTATION (2019 edition)
INTERNATIONAL ENERGY AGENCY
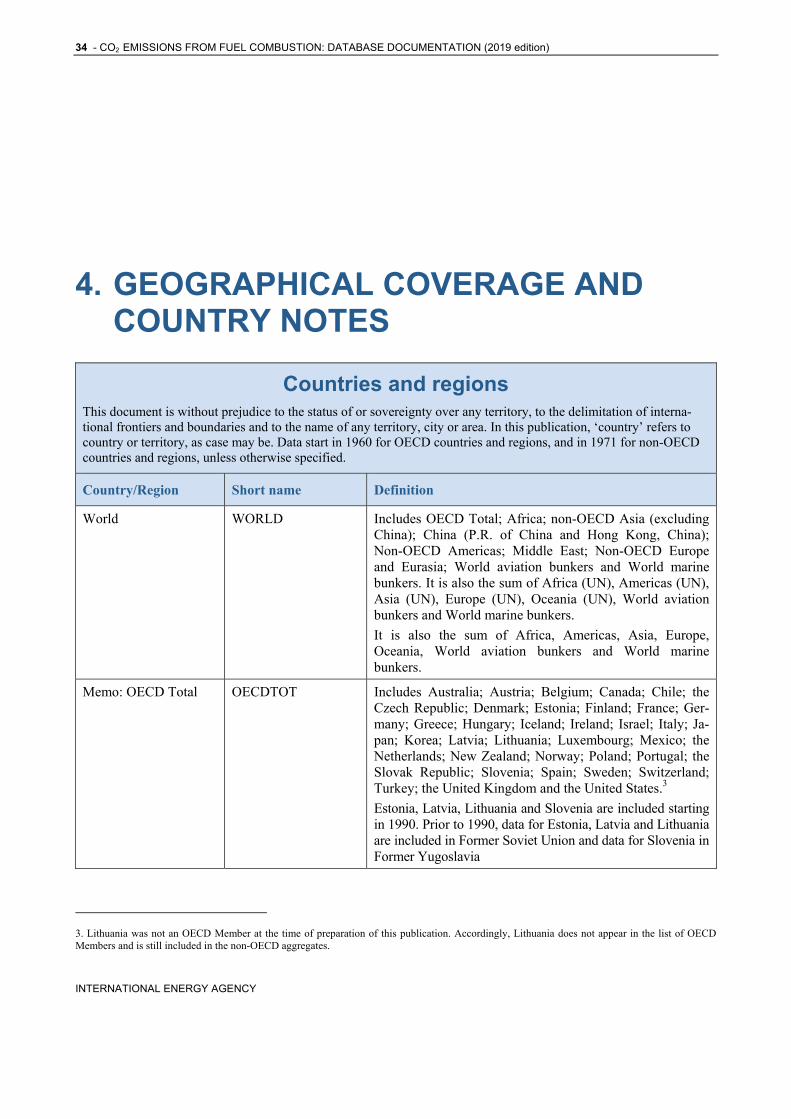
4. GEOGRAPHICAL COVERAGE AND COUNTRY NOTES
Countries and regions This document is without prejudice to the status of or sovereignty over any territory, to the delimitation of interna-tional frontiers and boundaries and to the name of any territory, city or area. In this publication, ‘country’ refers to country or territory, as case may be. Data start in 1960 for OECD countries and regions, and in 1971 for non-OECD countries and regions, unless otherwise specified.
Country/Region Short name Definition
World WORLD Includes OECD Total; Africa; non-OECD Asia (excluding China); China (P.R. of China and Hong Kong, China); Non-OECD Americas; Middle East; Non-OECD Europe and Eurasia; World aviation bunkers and World marine bunkers. It is also the sum of Africa (UN), Americas (UN), Asia (UN), Europe (UN), Oceania (UN), World aviation bunkers and World marine bunkers.
It is also the sum of Africa, Americas, Asia, Europe, Oceania, World aviation bunkers and World marine bunkers.
Memo: OECD Total OECDTOT Includes Australia; Austria; Belgium; Canada; Chile; the Czech Republic; Denmark; Estonia; Finland; France; Ger-many; Greece; Hungary; Iceland; Ireland; Israel; Italy; Ja-pan; Korea; Latvia; Lithuania; Luxembourg; Mexico; the Netherlands; New Zealand; Norway; Poland; Portugal; the Slovak Republic; Slovenia; Spain; Sweden; Switzerland; Turkey; the United Kingdom and the United States.3
Estonia, Latvia, Lithuania and Slovenia are included starting in 1990. Prior to 1990, data for Estonia, Latvia and Lithuania are included in Former Soviet Union and data for Slovenia in Former Yugoslavia
3. Lithuania was not an OECD Member at the time of preparation of this publication. Accordingly, Lithuania does not appear in the list of OECD Members and is still included in the non-OECD aggregates.

CO2 EMISSIONS FROM FUEL COMBUSTION: DATABASE DOCUMENTATION (2019 edition) - 35
INTERNATIONAL ENERGY AGENCY
Countries and regions This document is without prejudice to the status of or sovereignty over any territory, to the delimitation of interna-tional frontiers and boundaries and to the name of any territory, city or area. In this publication, ‘country’ refers to country or territory, as case may be. Data start in 1960 for OECD countries and regions, and in 1971 for non-OECD countries and regions, unless otherwise specified.
Country/Region Short name Definition
OECD Americas OECDAM Includes Canada, Chile, Mexico and the United States.
OECD Asia Oceania OECDAO Includes Australia, Israel4, Japan, Korea and New Zealand.
OECD Europe OECDEUR Includes Austria; Belgium; the Czech Republic; Denmark; Estonia; Finland; France; Germany; Greece; Hungary; Ice-land; Ireland; Italy; Latvia; Lithuania; Luxembourg; the Neth-erlands; Norway; Poland; Portugal; the Slovak Republic; Slovenia; Spain; Sweden; Switzerland; Turkey and the United Kingdom.
Estonia, Latvia, Lithuania and Slovenia are included starting in 1990. Prior to 1990, data for Estonia, Latvia and Lithuania are included in Former Soviet Union and data for Slovenia in Former Yugoslavia.
Africa AFRICA Includes Algeria, Angola, Benin, Botswana (from 1981), Cameroon, Republic of Congo (Congo)5, Côte d'Ivoire, Democratic Republic of Congo (from 1981), Egypt, Eritrea, Ethiopia, Gabon, Ghana, Kenya, Libya, Mauritius, Morocco, Mozambique, Namibia (from 1991), Niger (from 2000), Nigeria, Senegal, South Africa, South Sudan (from 2012), Sudan, United Republic of Tanzania, Togo, Tunisia, Zambia, Zimbabwe and Other Africa.
Note that Africa is identical to Memo: Africa (UN).
Non-OECD Americas LATAMER Includes Argentina; Plurinational State of Bolivia (Bolivia); Brazil; Colombia; Costa Rica; Cuba; Curaçao 6; Dominican Republic; Ecuador; El Salvador; Guatemala; Haiti; Honduras; Jamaica; Nicaragua; Panama; Paraguay; Peru; Suriname (from 2000); Trinidad and Tobago; Uruguay; Bolivarian Republic of Venezuela (Venezuela) and Other non-OECD Americas.
Middle East MIDEAST Includes Bahrain, Islamic Republic of Iran, Iraq, Jordan, Kuwait, Lebanon, Oman, Qatar, Saudi Arabia, Syrian Arab Republic, United Arab Emirates and Yemen.
Non-OECD Europe and EURASIA Includes Albania; Armenia; Azerbaijan; Belarus; Bosnia and Herzegovina; Bulgaria; Croatia; Cyprus7; Georgia;
4. The statistical data for Israel are supplied by and under the responsibility of the relevant Israeli authorities. The use of such data by the OECD is without prejudice to the status of the Golan Heights, East Jerusalem and Israeli settlements in the West Bank under the terms of international law. 5. Country short names are included in parentheses. 6. Netherlands Antilles was dissolved on 10 October 2010, resulting in two new constituent countries, Curaçao and Sint Maarten, with the remaining islands joining the Netherlands as special municipalities. From 2012 onwards, data now account for the energy statistics of Curaçao Island only. Prior to 2012, data remain unchanged and still cover the entire territory of the former Netherlands Antilles. 7. Note byTurkey:
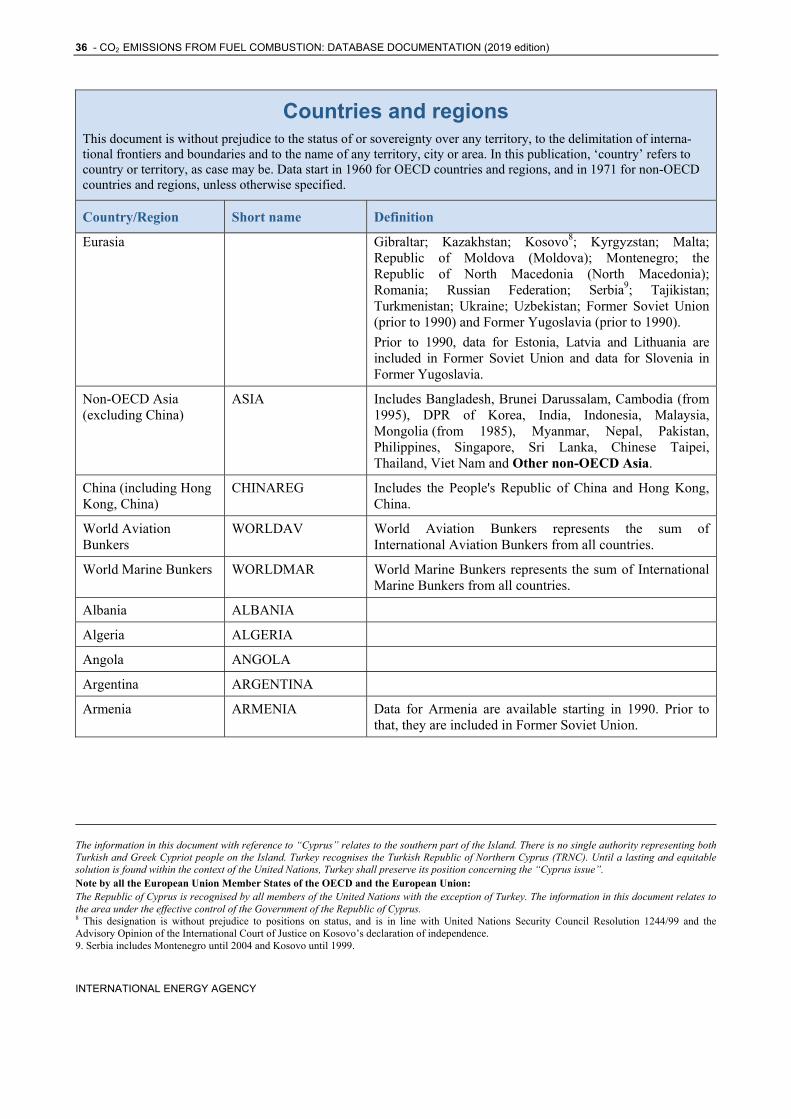
36 - CO2 EMISSIONS FROM FUEL COMBUSTION: DATABASE DOCUMENTATION (2019 edition)
INTERNATIONAL ENERGY AGENCY
Countries and regions This document is without prejudice to the status of or sovereignty over any territory, to the delimitation of interna-tional frontiers and boundaries and to the name of any territory, city or area. In this publication, ‘country’ refers to country or territory, as case may be. Data start in 1960 for OECD countries and regions, and in 1971 for non-OECD countries and regions, unless otherwise specified.
Country/Region Short name Definition
Eurasia Gibraltar; Kazakhstan; Kosovo8; Kyrgyzstan; Malta; Republic of Moldova (Moldova); Montenegro; the Republic of North Macedonia (North Macedonia); Romania; Russian Federation; Serbia9; Tajikistan; Turkmenistan; Ukraine; Uzbekistan; Former Soviet Union (prior to 1990) and Former Yugoslavia (prior to 1990).
Prior to 1990, data for Estonia, Latvia and Lithuania are included in Former Soviet Union and data for Slovenia in Former Yugoslavia.
Non-OECD Asia (excluding China)
ASIA Includes Bangladesh, Brunei Darussalam, Cambodia (from 1995), DPR of Korea, India, Indonesia, Malaysia, Mongolia (from 1985), Myanmar, Nepal, Pakistan, Philippines, Singapore, Sri Lanka, Chinese Taipei, Thailand, Viet Nam and Other non-OECD Asia.
China (including Hong Kong, China)
CHINAREG Includes the People's Republic of China and Hong Kong, China.
World Aviation Bunkers
WORLDAV World Aviation Bunkers represents the sum of International Aviation Bunkers from all countries.
World Marine Bunkers WORLDMAR World Marine Bunkers represents the sum of International Marine Bunkers from all countries.
Albania ALBANIA
Algeria ALGERIA
Angola ANGOLA
Argentina ARGENTINA
Armenia ARMENIA Data for Armenia are available starting in 1990. Prior to that, they are included in Former Soviet Union.
The information in this document with reference to “Cyprus” relates to the southern part of the Island. There is no single authority representing both Turkish and Greek Cypriot people on the Island. Turkey recognises the Turkish Republic of Northern Cyprus (TRNC). Until a lasting and equitable solution is found within the context of the United Nations, Turkey shall preserve its position concerning the “Cyprus issue”. Note by all the European Union Member States of the OECD and the European Union: The Republic of Cyprus is recognised by all members of the United Nations with the exception of Turkey. The information in this document relates to the area under the effective control of the Government of the Republic of Cyprus. 8 This designation is without prejudice to positions on status, and is in line with United Nations Security Council Resolution 1244/99 and the Advisory Opinion of the International Court of Justice on Kosovo’s declaration of independence. 9. Serbia includes Montenegro until 2004 and Kosovo until 1999.
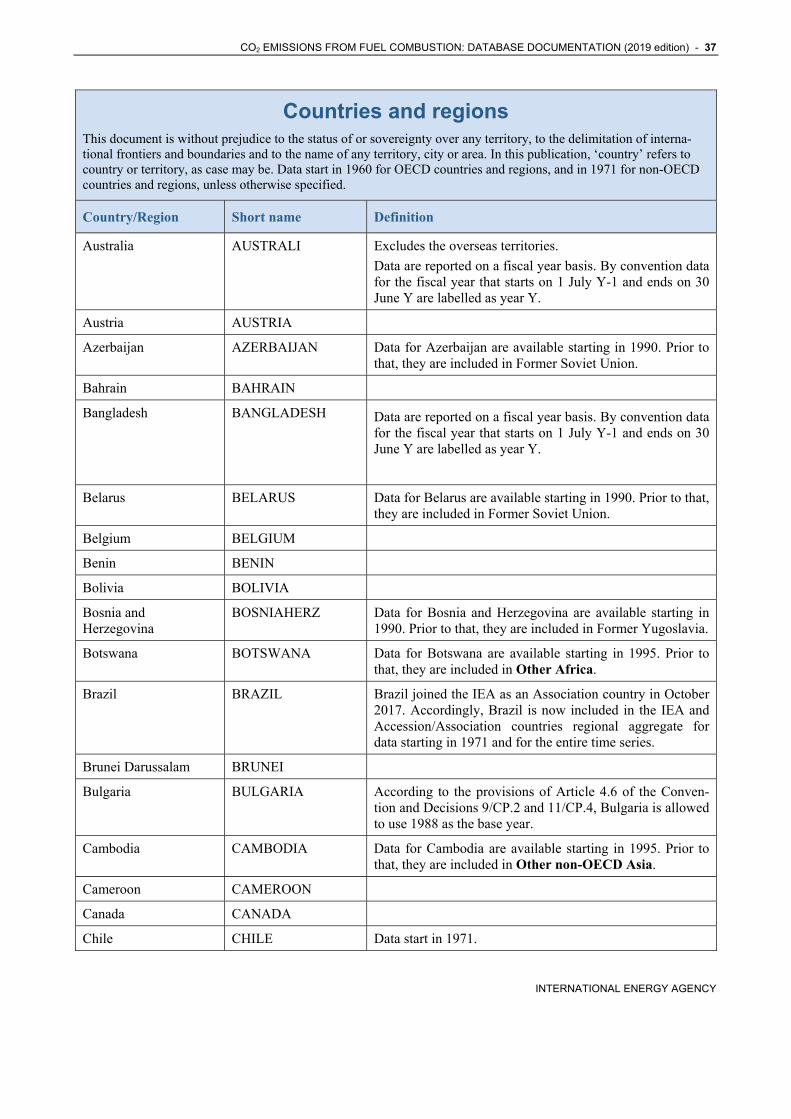
CO2 EMISSIONS FROM FUEL COMBUSTION: DATABASE DOCUMENTATION (2019 edition) - 37
INTERNATIONAL ENERGY AGENCY
Countries and regions This document is without prejudice to the status of or sovereignty over any territory, to the delimitation of interna-tional frontiers and boundaries and to the name of any territory, city or area. In this publication, ‘country’ refers to country or territory, as case may be. Data start in 1960 for OECD countries and regions, and in 1971 for non-OECD countries and regions, unless otherwise specified.
Country/Region Short name Definition
Australia AUSTRALI Excludes the overseas territories.
Data are reported on a fiscal year basis. By convention data for the fiscal year that starts on 1 July Y-1 and ends on 30 June Y are labelled as year Y.
Austria AUSTRIA
Azerbaijan AZERBAIJAN Data for Azerbaijan are available starting in 1990. Prior to that, they are included in Former Soviet Union.
Bahrain BAHRAIN
Bangladesh BANGLADESH Data are reported on a fiscal year basis. By convention data for the fiscal year that starts on 1 July Y-1 and ends on 30 June Y are labelled as year Y.
Belarus BELARUS Data for Belarus are available starting in 1990. Prior to that, they are included in Former Soviet Union.
Belgium BELGIUM
Benin BENIN
Bolivia BOLIVIA
Bosnia and Herzegovina
BOSNIAHERZ Data for Bosnia and Herzegovina are available starting in 1990. Prior to that, they are included in Former Yugoslavia.
Botswana BOTSWANA Data for Botswana are available starting in 1995. Prior to that, they are included in Other Africa.
Brazil BRAZIL Brazil joined the IEA as an Association country in October 2017. Accordingly, Brazil is now included in the IEA and Accession/Association countries regional aggregate for data starting in 1971 and for the entire time series.
Brunei Darussalam BRUNEI
Bulgaria BULGARIA According to the provisions of Article 4.6 of the Conven-tion and Decisions 9/CP.2 and 11/CP.4, Bulgaria is allowed to use 1988 as the base year.
Cambodia CAMBODIA Data for Cambodia are available starting in 1995. Prior to that, they are included in Other non-OECD Asia.
Cameroon CAMEROON
Canada CANADA
Chile CHILE Data start in 1971.
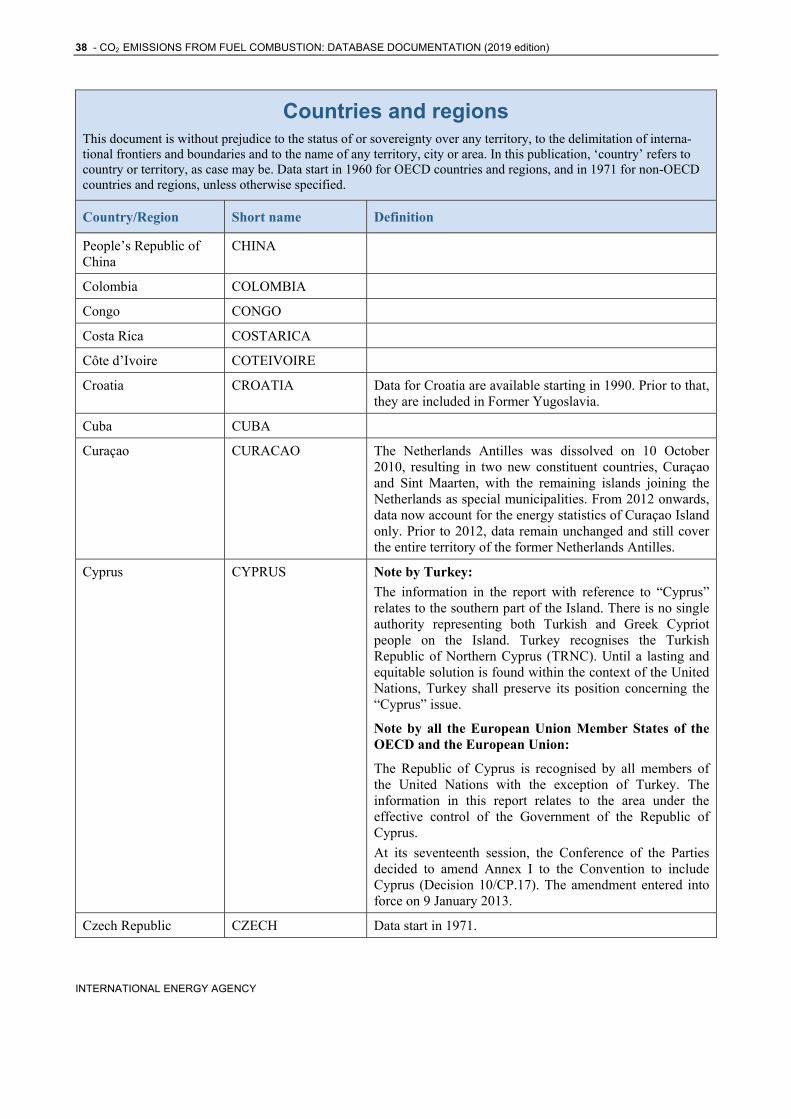
38 - CO2 EMISSIONS FROM FUEL COMBUSTION: DATABASE DOCUMENTATION (2019 edition)
INTERNATIONAL ENERGY AGENCY
Countries and regions This document is without prejudice to the status of or sovereignty over any territory, to the delimitation of interna-tional frontiers and boundaries and to the name of any territory, city or area. In this publication, ‘country’ refers to country or territory, as case may be. Data start in 1960 for OECD countries and regions, and in 1971 for non-OECD countries and regions, unless otherwise specified.
Country/Region Short name Definition
People’s Republic of China
CHINA
Colombia COLOMBIA
Congo CONGO
Costa Rica COSTARICA
Côte d’Ivoire COTEIVOIRE
Croatia CROATIA Data for Croatia are available starting in 1990. Prior to that, they are included in Former Yugoslavia.
Cuba CUBA
Curaçao CURACAO The Netherlands Antilles was dissolved on 10 October 2010, resulting in two new constituent countries, Curaçao and Sint Maarten, with the remaining islands joining the Netherlands as special municipalities. From 2012 onwards, data now account for the energy statistics of Curaçao Island only. Prior to 2012, data remain unchanged and still cover the entire territory of the former Netherlands Antilles.
Cyprus CYPRUS Note by Turkey:
The information in the report with reference to “Cyprus” relates to the southern part of the Island. There is no single authority representing both Turkish and Greek Cypriot people on the Island. Turkey recognises the Turkish Republic of Northern Cyprus (TRNC). Until a lasting and equitable solution is found within the context of the United Nations, Turkey shall preserve its position concerning the “Cyprus” issue.
Note by all the European Union Member States of the OECD and the European Union:
The Republic of Cyprus is recognised by all members of the United Nations with the exception of Turkey. The information in this report relates to the area under the effective control of the Government of the Republic of Cyprus.
At its seventeenth session, the Conference of the Parties decided to amend Annex I to the Convention to include Cyprus (Decision 10/CP.17). The amendment entered into force on 9 January 2013.
Czech Republic CZECH Data start in 1971.
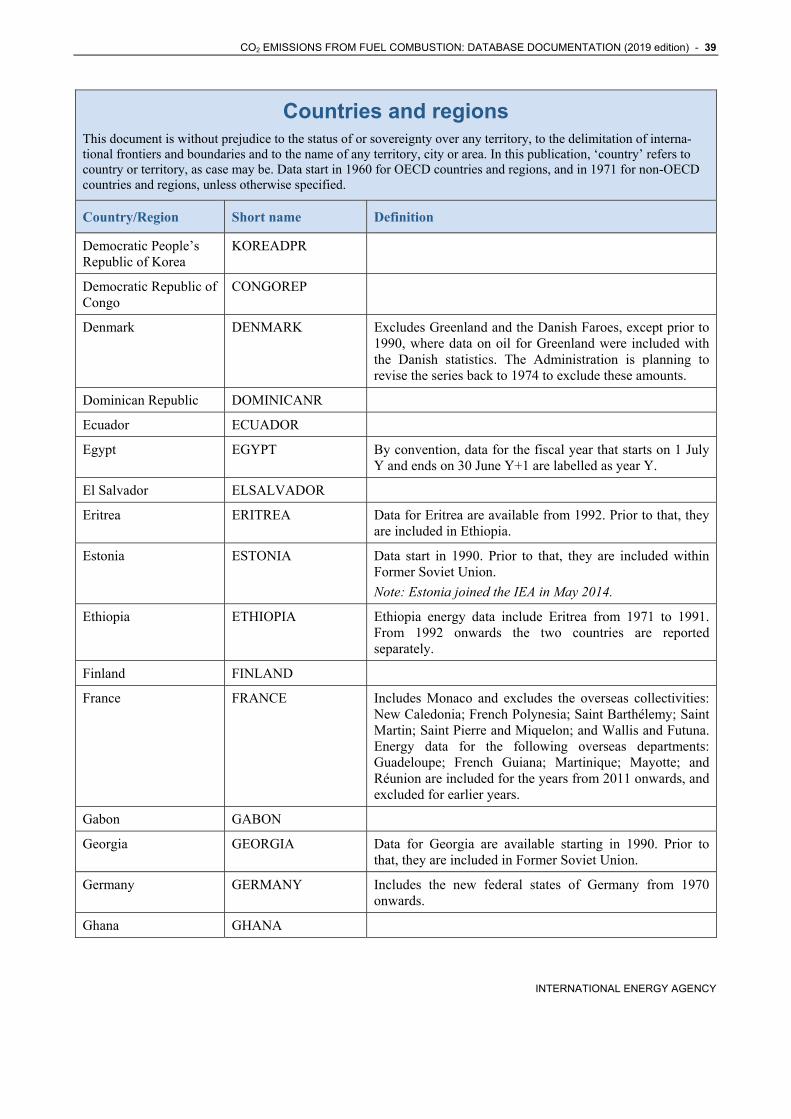
CO2 EMISSIONS FROM FUEL COMBUSTION: DATABASE DOCUMENTATION (2019 edition) - 39
INTERNATIONAL ENERGY AGENCY
Countries and regions This document is without prejudice to the status of or sovereignty over any territory, to the delimitation of interna-tional frontiers and boundaries and to the name of any territory, city or area. In this publication, ‘country’ refers to country or territory, as case may be. Data start in 1960 for OECD countries and regions, and in 1971 for non-OECD countries and regions, unless otherwise specified.
Country/Region Short name Definition
Democratic People’s Republic of Korea
KOREADPR
Democratic Republic of Congo
CONGOREP
Denmark DENMARK Excludes Greenland and the Danish Faroes, except prior to 1990, where data on oil for Greenland were included with the Danish statistics. The Administration is planning to revise the series back to 1974 to exclude these amounts.
Dominican Republic DOMINICANR
Ecuador ECUADOR
Egypt EGYPT By convention, data for the fiscal year that starts on 1 July Y and ends on 30 June Y+1 are labelled as year Y.
El Salvador ELSALVADOR
Eritrea ERITREA Data for Eritrea are available from 1992. Prior to that, they are included in Ethiopia.
Estonia ESTONIA Data start in 1990. Prior to that, they are included within Former Soviet Union.
Note: Estonia joined the IEA in May 2014.
Ethiopia ETHIOPIA Ethiopia energy data include Eritrea from 1971 to 1991. From 1992 onwards the two countries are reported separately.
Finland FINLAND
France FRANCE Includes Monaco and excludes the overseas collectivities: New Caledonia; French Polynesia; Saint Barthélemy; Saint Martin; Saint Pierre and Miquelon; and Wallis and Futuna. Energy data for the following overseas departments: Guadeloupe; French Guiana; Martinique; Mayotte; and Réunion are included for the years from 2011 onwards, and excluded for earlier years.
Gabon GABON
Georgia GEORGIA Data for Georgia are available starting in 1990. Prior to that, they are included in Former Soviet Union.
Germany GERMANY Includes the new federal states of Germany from 1970 onwards.
Ghana GHANA
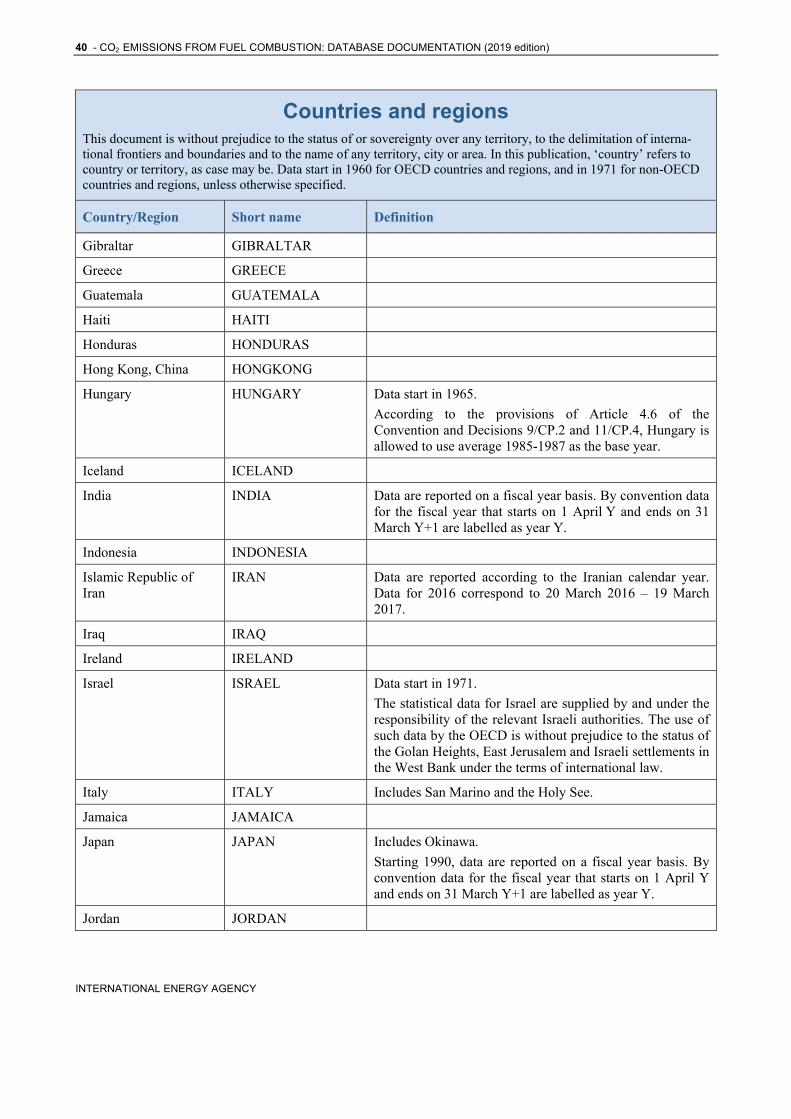
40 - CO2 EMISSIONS FROM FUEL COMBUSTION: DATABASE DOCUMENTATION (2019 edition)
INTERNATIONAL ENERGY AGENCY
Countries and regions This document is without prejudice to the status of or sovereignty over any territory, to the delimitation of interna-tional frontiers and boundaries and to the name of any territory, city or area. In this publication, ‘country’ refers to country or territory, as case may be. Data start in 1960 for OECD countries and regions, and in 1971 for non-OECD countries and regions, unless otherwise specified.
Country/Region Short name Definition
Gibraltar GIBRALTAR
Greece GREECE
Guatemala GUATEMALA
Haiti HAITI
Honduras HONDURAS
Hong Kong, China HONGKONG
Hungary HUNGARY Data start in 1965.
According to the provisions of Article 4.6 of the Convention and Decisions 9/CP.2 and 11/CP.4, Hungary is allowed to use average 1985-1987 as the base year.
Iceland ICELAND
India INDIA Data are reported on a fiscal year basis. By convention data for the fiscal year that starts on 1 April Y and ends on 31 March Y+1 are labelled as year Y.
Indonesia INDONESIA
Islamic Republic of Iran
IRAN Data are reported according to the Iranian calendar year. Data for 2016 correspond to 20 March 2016 – 19 March 2017.
Iraq IRAQ
Ireland IRELAND
Israel ISRAEL Data start in 1971.
The statistical data for Israel are supplied by and under the responsibility of the relevant Israeli authorities. The use of such data by the OECD is without prejudice to the status of the Golan Heights, East Jerusalem and Israeli settlements in the West Bank under the terms of international law.
Italy ITALY Includes San Marino and the Holy See.
Jamaica JAMAICA
Japan JAPAN Includes Okinawa.
Starting 1990, data are reported on a fiscal year basis. By convention data for the fiscal year that starts on 1 April Y and ends on 31 March Y+1 are labelled as year Y.
Jordan JORDAN
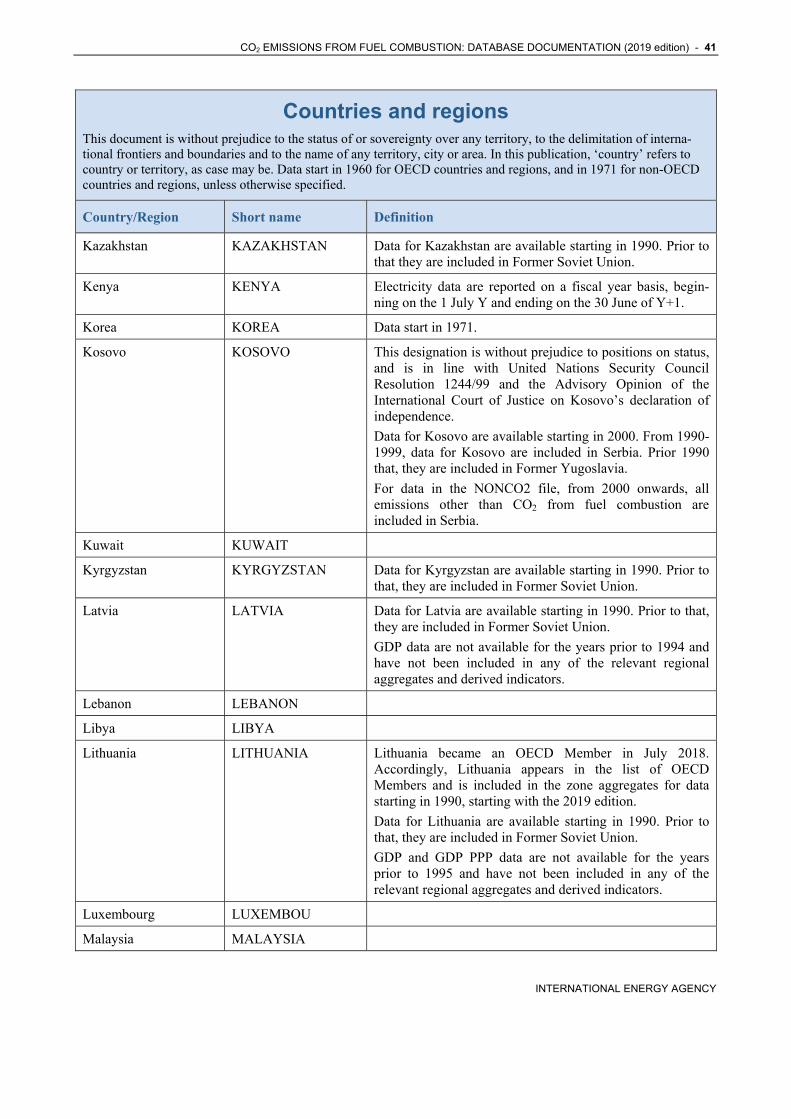
CO2 EMISSIONS FROM FUEL COMBUSTION: DATABASE DOCUMENTATION (2019 edition) - 41
INTERNATIONAL ENERGY AGENCY
Countries and regions This document is without prejudice to the status of or sovereignty over any territory, to the delimitation of interna-tional frontiers and boundaries and to the name of any territory, city or area. In this publication, ‘country’ refers to country or territory, as case may be. Data start in 1960 for OECD countries and regions, and in 1971 for non-OECD countries and regions, unless otherwise specified.
Country/Region Short name Definition
Kazakhstan KAZAKHSTAN Data for Kazakhstan are available starting in 1990. Prior to that they are included in Former Soviet Union.
Kenya KENYA Electricity data are reported on a fiscal year basis, begin-ning on the 1 July Y and ending on the 30 June of Y+1.
Korea KOREA Data start in 1971.
Kosovo KOSOVO This designation is without prejudice to positions on status, and is in line with United Nations Security Council Resolution 1244/99 and the Advisory Opinion of the International Court of Justice on Kosovo’s declaration of independence.
Data for Kosovo are available starting in 2000. From 1990-1999, data for Kosovo are included in Serbia. Prior 1990 that, they are included in Former Yugoslavia.
For data in the NONCO2 file, from 2000 onwards, all emissions other than CO2 from fuel combustion are included in Serbia.
Kuwait KUWAIT
Kyrgyzstan KYRGYZSTAN Data for Kyrgyzstan are available starting in 1990. Prior to that, they are included in Former Soviet Union.
Latvia LATVIA Data for Latvia are available starting in 1990. Prior to that, they are included in Former Soviet Union.
GDP data are not available for the years prior to 1994 and have not been included in any of the relevant regional aggregates and derived indicators.
Lebanon LEBANON
Libya LIBYA
Lithuania LITHUANIA Lithuania became an OECD Member in July 2018. Accordingly, Lithuania appears in the list of OECD Members and is included in the zone aggregates for data starting in 1990, starting with the 2019 edition.
Data for Lithuania are available starting in 1990. Prior to that, they are included in Former Soviet Union.
GDP and GDP PPP data are not available for the years prior to 1995 and have not been included in any of the relevant regional aggregates and derived indicators.
Luxembourg LUXEMBOU
Malaysia MALAYSIA
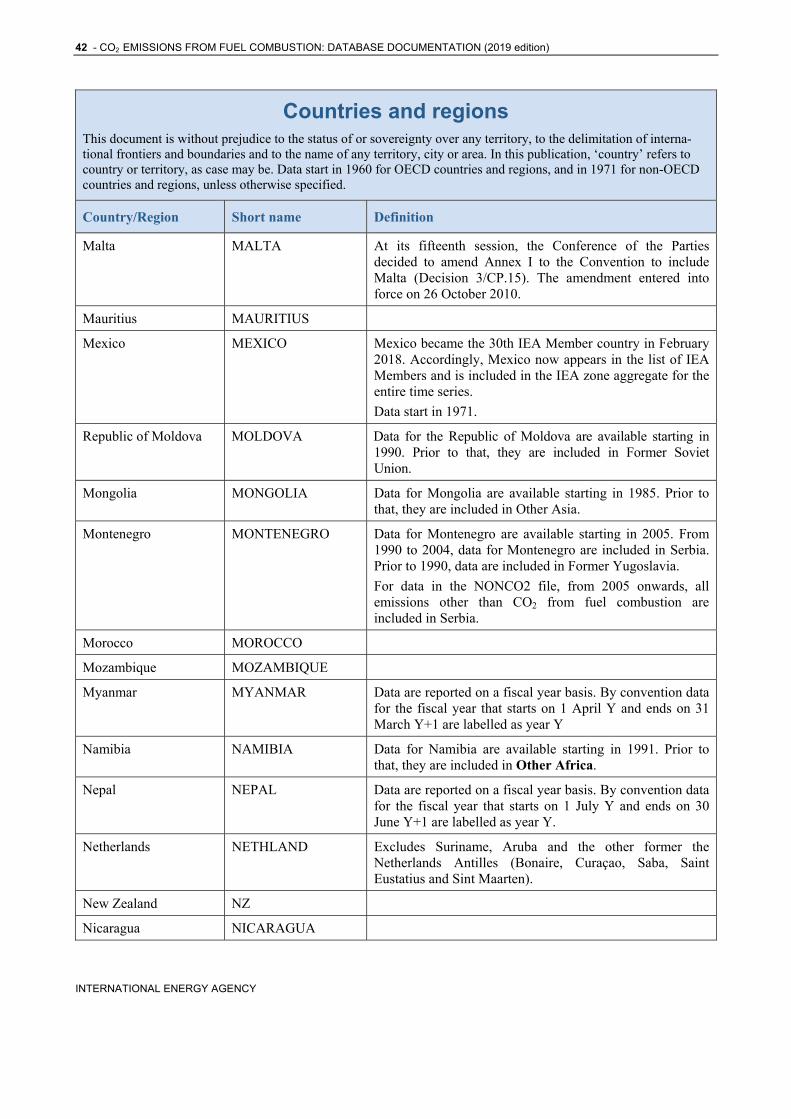
42 - CO2 EMISSIONS FROM FUEL COMBUSTION: DATABASE DOCUMENTATION (2019 edition)
INTERNATIONAL ENERGY AGENCY
Countries and regions This document is without prejudice to the status of or sovereignty over any territory, to the delimitation of interna-tional frontiers and boundaries and to the name of any territory, city or area. In this publication, ‘country’ refers to country or territory, as case may be. Data start in 1960 for OECD countries and regions, and in 1971 for non-OECD countries and regions, unless otherwise specified.
Country/Region Short name Definition
Malta MALTA At its fifteenth session, the Conference of the Parties decided to amend Annex I to the Convention to include Malta (Decision 3/CP.15). The amendment entered into force on 26 October 2010.
Mauritius MAURITIUS
Mexico MEXICO Mexico became the 30th IEA Member country in February 2018. Accordingly, Mexico now appears in the list of IEA Members and is included in the IEA zone aggregate for the entire time series.
Data start in 1971.
Republic of Moldova MOLDOVA Data for the Republic of Moldova are available starting in 1990. Prior to that, they are included in Former Soviet Union.
Mongolia MONGOLIA Data for Mongolia are available starting in 1985. Prior to that, they are included in Other Asia.
Montenegro MONTENEGRO Data for Montenegro are available starting in 2005. From 1990 to 2004, data for Montenegro are included in Serbia. Prior to 1990, data are included in Former Yugoslavia.
For data in the NONCO2 file, from 2005 onwards, all emissions other than CO2 from fuel combustion are included in Serbia.
Morocco MOROCCO
Mozambique MOZAMBIQUE
Myanmar MYANMAR Data are reported on a fiscal year basis. By convention data for the fiscal year that starts on 1 April Y and ends on 31 March Y+1 are labelled as year Y
Namibia NAMIBIA Data for Namibia are available starting in 1991. Prior to that, they are included in Other Africa.
Nepal NEPAL Data are reported on a fiscal year basis. By convention data for the fiscal year that starts on 1 July Y and ends on 30 June Y+1 are labelled as year Y.
Netherlands NETHLAND Excludes Suriname, Aruba and the other former the Netherlands Antilles (Bonaire, Curaçao, Saba, Saint Eustatius and Sint Maarten).
New Zealand NZ
Nicaragua NICARAGUA
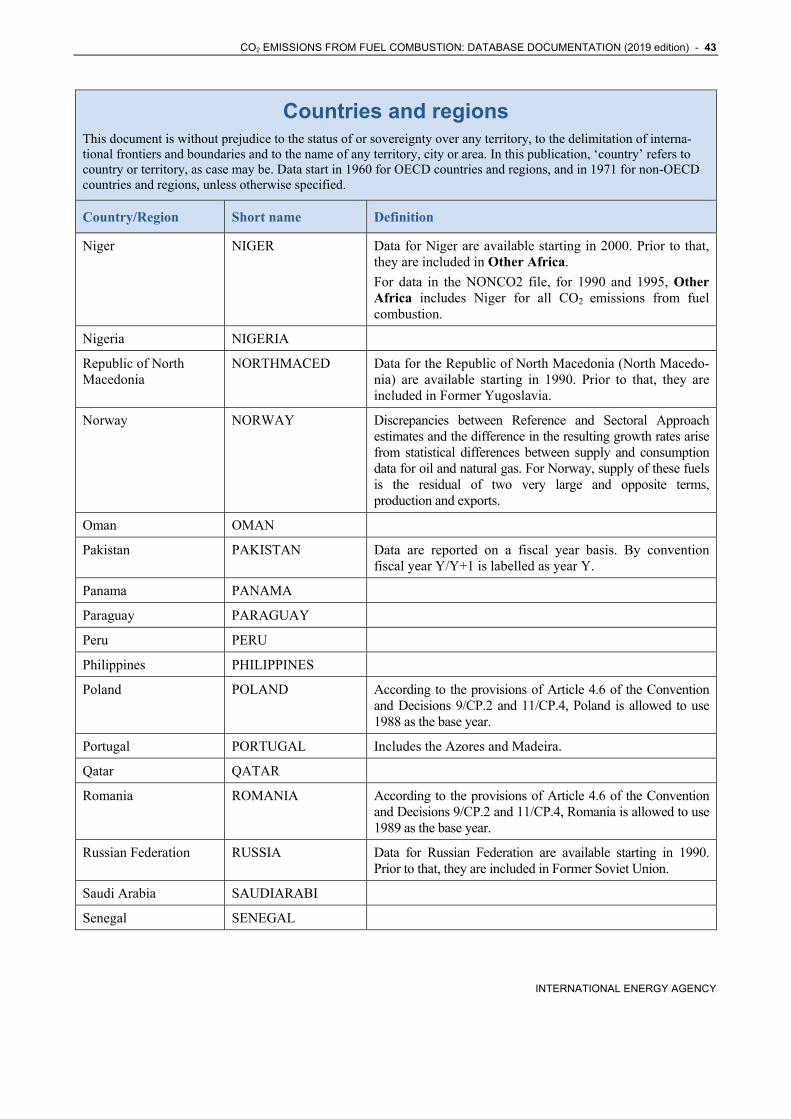
CO2 EMISSIONS FROM FUEL COMBUSTION: DATABASE DOCUMENTATION (2019 edition) - 43
INTERNATIONAL ENERGY AGENCY
Countries and regions This document is without prejudice to the status of or sovereignty over any territory, to the delimitation of interna-tional frontiers and boundaries and to the name of any territory, city or area. In this publication, ‘country’ refers to country or territory, as case may be. Data start in 1960 for OECD countries and regions, and in 1971 for non-OECD countries and regions, unless otherwise specified.
Country/Region Short name Definition
Niger NIGER Data for Niger are available starting in 2000. Prior to that, they are included in Other Africa.
For data in the NONCO2 file, for 1990 and 1995, Other Africa includes Niger for all CO2 emissions from fuel combustion.
Nigeria NIGERIA
Republic of North Macedonia
NORTHMACED Data for the Republic of North Macedonia (North Macedo-nia) are available starting in 1990. Prior to that, they are included in Former Yugoslavia.
Norway NORWAY Discrepancies between Reference and Sectoral Approach estimates and the difference in the resulting growth rates arise from statistical differences between supply and consumption data for oil and natural gas. For Norway, supply of these fuels is the residual of two very large and opposite terms, production and exports.
Oman OMAN
Pakistan PAKISTAN Data are reported on a fiscal year basis. By convention fiscal year Y/Y+1 is labelled as year Y.
Panama PANAMA
Paraguay PARAGUAY
Peru PERU
Philippines PHILIPPINES
Poland POLAND According to the provisions of Article 4.6 of the Convention and Decisions 9/CP.2 and 11/CP.4, Poland is allowed to use 1988 as the base year.
Portugal PORTUGAL Includes the Azores and Madeira.
Qatar QATAR
Romania ROMANIA According to the provisions of Article 4.6 of the Convention and Decisions 9/CP.2 and 11/CP.4, Romania is allowed to use 1989 as the base year.
Russian Federation RUSSIA Data for Russian Federation are available starting in 1990. Prior to that, they are included in Former Soviet Union.
Saudi Arabia SAUDIARABI
Senegal SENEGAL
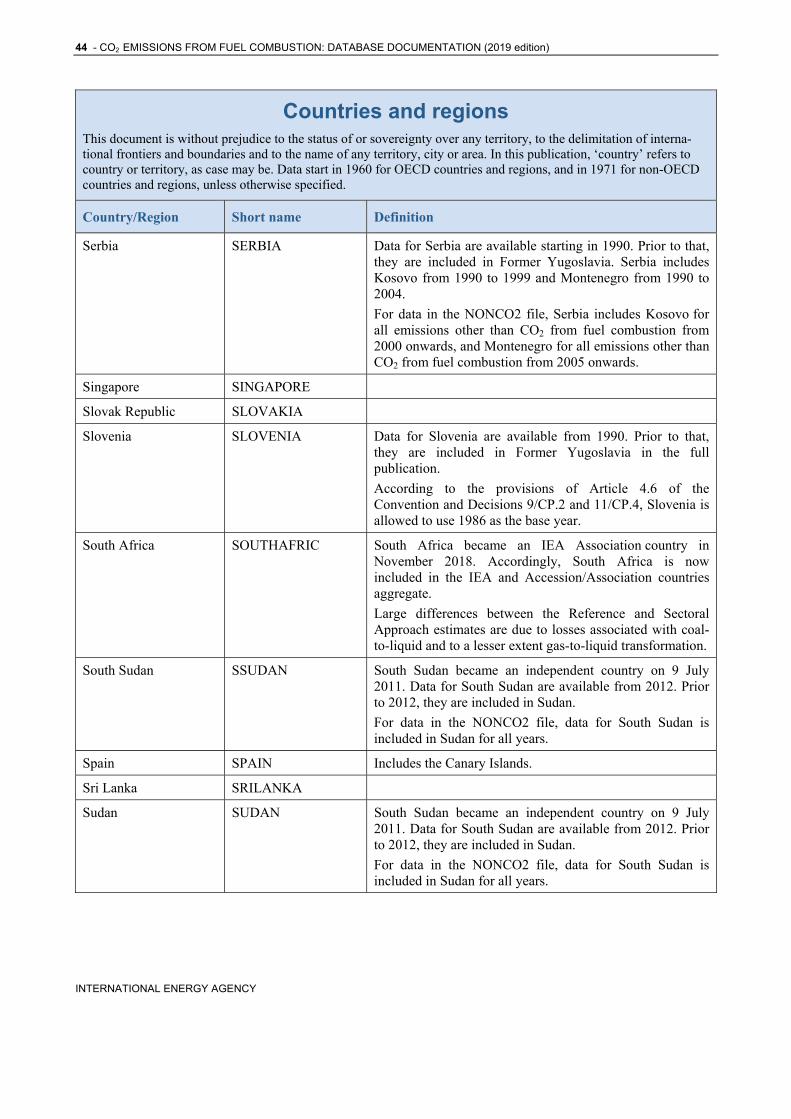
44 - CO2 EMISSIONS FROM FUEL COMBUSTION: DATABASE DOCUMENTATION (2019 edition)
INTERNATIONAL ENERGY AGENCY
Countries and regions This document is without prejudice to the status of or sovereignty over any territory, to the delimitation of interna-tional frontiers and boundaries and to the name of any territory, city or area. In this publication, ‘country’ refers to country or territory, as case may be. Data start in 1960 for OECD countries and regions, and in 1971 for non-OECD countries and regions, unless otherwise specified.
Country/Region Short name Definition
Serbia SERBIA Data for Serbia are available starting in 1990. Prior to that, they are included in Former Yugoslavia. Serbia includes Kosovo from 1990 to 1999 and Montenegro from 1990 to 2004.
For data in the NONCO2 file, Serbia includes Kosovo for all emissions other than CO2 from fuel combustion from 2000 onwards, and Montenegro for all emissions other than CO2 from fuel combustion from 2005 onwards.
Singapore SINGAPORE
Slovak Republic SLOVAKIA
Slovenia SLOVENIA Data for Slovenia are available from 1990. Prior to that, they are included in Former Yugoslavia in the full publication.
According to the provisions of Article 4.6 of the Convention and Decisions 9/CP.2 and 11/CP.4, Slovenia is allowed to use 1986 as the base year.
South Africa SOUTHAFRIC South Africa became an IEA Association country in November 2018. Accordingly, South Africa is now included in the IEA and Accession/Association countries aggregate.
Large differences between the Reference and Sectoral Approach estimates are due to losses associated with coal-to-liquid and to a lesser extent gas-to-liquid transformation.
South Sudan SSUDAN South Sudan became an independent country on 9 July 2011. Data for South Sudan are available from 2012. Prior to 2012, they are included in Sudan.
For data in the NONCO2 file, data for South Sudan is included in Sudan for all years.
Spain SPAIN Includes the Canary Islands.
Sri Lanka SRILANKA
Sudan SUDAN South Sudan became an independent country on 9 July 2011. Data for South Sudan are available from 2012. Prior to 2012, they are included in Sudan.
For data in the NONCO2 file, data for South Sudan is included in Sudan for all years.
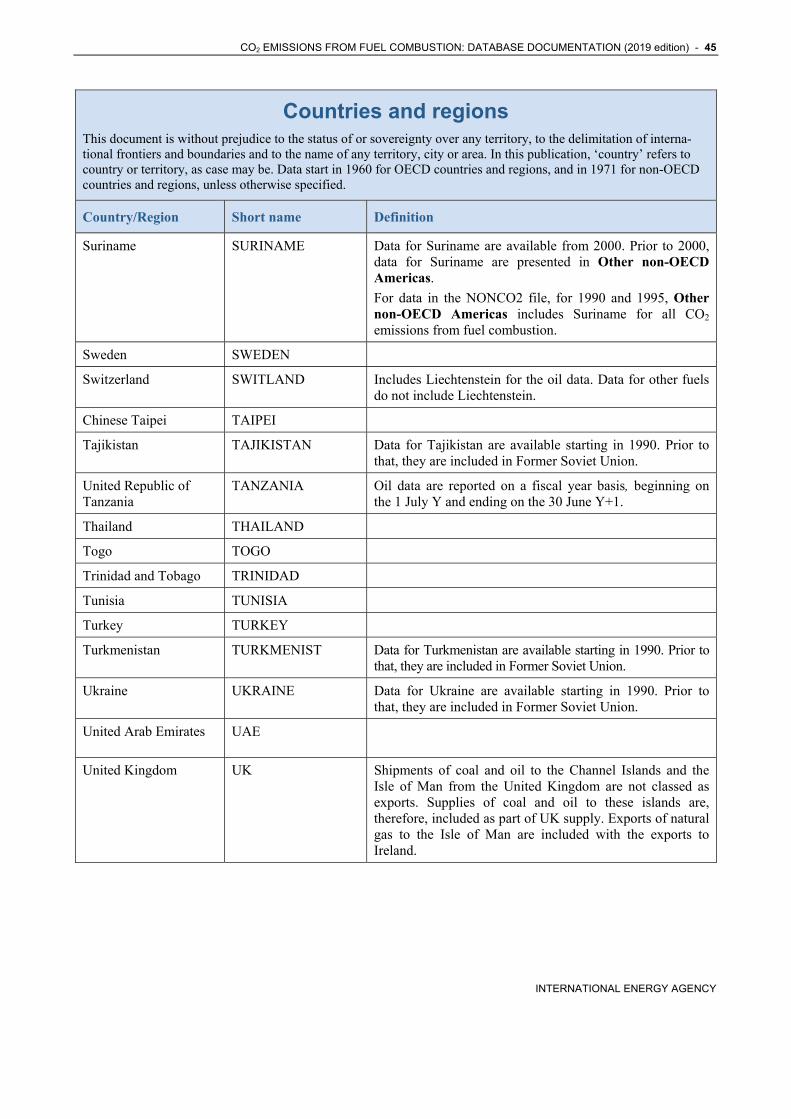
CO2 EMISSIONS FROM FUEL COMBUSTION: DATABASE DOCUMENTATION (2019 edition) - 45
INTERNATIONAL ENERGY AGENCY
Countries and regions This document is without prejudice to the status of or sovereignty over any territory, to the delimitation of interna-tional frontiers and boundaries and to the name of any territory, city or area. In this publication, ‘country’ refers to country or territory, as case may be. Data start in 1960 for OECD countries and regions, and in 1971 for non-OECD countries and regions, unless otherwise specified.
Country/Region Short name Definition
Suriname SURINAME Data for Suriname are available from 2000. Prior to 2000, data for Suriname are presented in Other non-OECD Americas.
For data in the NONCO2 file, for 1990 and 1995, Other non-OECD Americas includes Suriname for all CO2
emissions from fuel combustion.
Sweden SWEDEN
Switzerland SWITLAND Includes Liechtenstein for the oil data. Data for other fuels do not include Liechtenstein.
Chinese Taipei TAIPEI
Tajikistan TAJIKISTAN Data for Tajikistan are available starting in 1990. Prior to that, they are included in Former Soviet Union.
United Republic of Tanzania
TANZANIA Oil data are reported on a fiscal year basis, beginning on the 1 July Y and ending on the 30 June Y+1.
Thailand THAILAND
Togo TOGO
Trinidad and Tobago TRINIDAD
Tunisia TUNISIA
Turkey TURKEY
Turkmenistan TURKMENIST Data for Turkmenistan are available starting in 1990. Prior to that, they are included in Former Soviet Union.
Ukraine UKRAINE Data for Ukraine are available starting in 1990. Prior to that, they are included in Former Soviet Union.
United Arab Emirates UAE
United Kingdom UK Shipments of coal and oil to the Channel Islands and the Isle of Man from the United Kingdom are not classed as exports. Supplies of coal and oil to these islands are, therefore, included as part of UK supply. Exports of natural gas to the Isle of Man are included with the exports to Ireland.
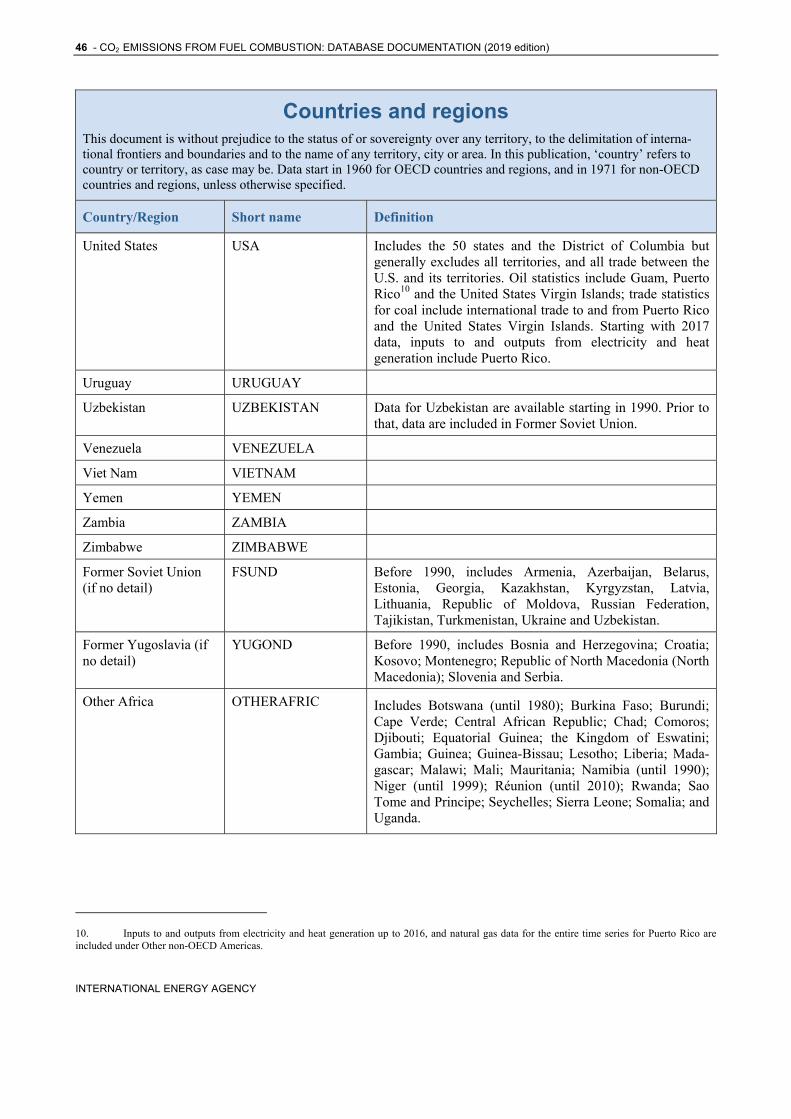
46 - CO2 EMISSIONS FROM FUEL COMBUSTION: DATABASE DOCUMENTATION (2019 edition)
INTERNATIONAL ENERGY AGENCY
Countries and regions This document is without prejudice to the status of or sovereignty over any territory, to the delimitation of interna-tional frontiers and boundaries and to the name of any territory, city or area. In this publication, ‘country’ refers to country or territory, as case may be. Data start in 1960 for OECD countries and regions, and in 1971 for non-OECD countries and regions, unless otherwise specified.
Country/Region Short name Definition
United States USA Includes the 50 states and the District of Columbia but generally excludes all territories, and all trade between the U.S. and its territories. Oil statistics include Guam, Puerto Rico10 and the United States Virgin Islands; trade statistics for coal include international trade to and from Puerto Rico and the United States Virgin Islands. Starting with 2017 data, inputs to and outputs from electricity and heat generation include Puerto Rico.
Uruguay URUGUAY
Uzbekistan UZBEKISTAN Data for Uzbekistan are available starting in 1990. Prior to that, data are included in Former Soviet Union.
Venezuela VENEZUELA
Viet Nam VIETNAM
Yemen YEMEN
Zambia ZAMBIA
Zimbabwe ZIMBABWE
Former Soviet Union (if no detail)
FSUND Before 1990, includes Armenia, Azerbaijan, Belarus, Estonia, Georgia, Kazakhstan, Kyrgyzstan, Latvia, Lithuania, Republic of Moldova, Russian Federation, Tajikistan, Turkmenistan, Ukraine and Uzbekistan.
Former Yugoslavia (if no detail)
YUGOND Before 1990, includes Bosnia and Herzegovina; Croatia; Kosovo; Montenegro; Republic of North Macedonia (North Macedonia); Slovenia and Serbia.
Other Africa OTHERAFRIC
Includes Botswana (until 1980); Burkina Faso; Burundi; Cape Verde; Central African Republic; Chad; Comoros; Djibouti; Equatorial Guinea; the Kingdom of Eswatini; Gambia; Guinea; Guinea-Bissau; Lesotho; Liberia; Mada-gascar; Malawi; Mali; Mauritania; Namibia (until 1990); Niger (until 1999); Réunion (until 2010); Rwanda; Sao Tome and Principe; Seychelles; Sierra Leone; Somalia; and Uganda.
10. Inputs to and outputs from electricity and heat generation up to 2016, and natural gas data for the entire time series for Puerto Rico are included under Other non-OECD Americas.
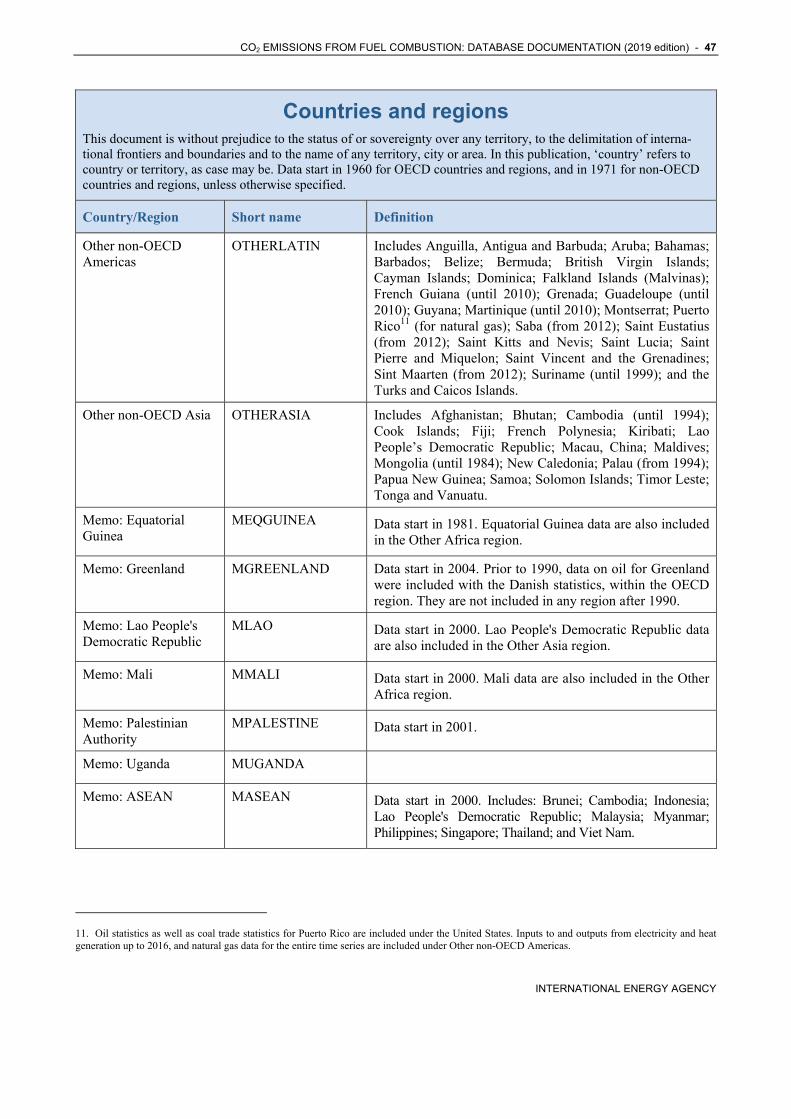
CO2 EMISSIONS FROM FUEL COMBUSTION: DATABASE DOCUMENTATION (2019 edition) - 47
INTERNATIONAL ENERGY AGENCY
Countries and regions This document is without prejudice to the status of or sovereignty over any territory, to the delimitation of interna-tional frontiers and boundaries and to the name of any territory, city or area. In this publication, ‘country’ refers to country or territory, as case may be. Data start in 1960 for OECD countries and regions, and in 1971 for non-OECD countries and regions, unless otherwise specified.
Country/Region Short name Definition
Other non-OECD Americas
OTHERLATIN
Includes Anguilla, Antigua and Barbuda; Aruba; Bahamas; Barbados; Belize; Bermuda; British Virgin Islands; Cayman Islands; Dominica; Falkland Islands (Malvinas); French Guiana (until 2010); Grenada; Guadeloupe (until 2010); Guyana; Martinique (until 2010); Montserrat; Puerto Rico11 (for natural gas); Saba (from 2012); Saint Eustatius (from 2012); Saint Kitts and Nevis; Saint Lucia; Saint Pierre and Miquelon; Saint Vincent and the Grenadines; Sint Maarten (from 2012); Suriname (until 1999); and the Turks and Caicos Islands.
Other non-OECD Asia OTHERASIA
Includes Afghanistan; Bhutan; Cambodia (until 1994); Cook Islands; Fiji; French Polynesia; Kiribati; Lao People’s Democratic Republic; Macau, China; Maldives; Mongolia (until 1984); New Caledonia; Palau (from 1994); Papua New Guinea; Samoa; Solomon Islands; Timor Leste; Tonga and Vanuatu.
Memo: Equatorial Guinea
MEQGUINEA Data start in 1981. Equatorial Guinea data are also included in the Other Africa region.
Memo: Greenland MGREENLAND Data start in 2004. Prior to 1990, data on oil for Greenland were included with the Danish statistics, within the OECD region. They are not included in any region after 1990.
Memo: Lao People's Democratic Republic
MLAO Data start in 2000. Lao People's Democratic Republic data are also included in the Other Asia region.
Memo: Mali MMALI Data start in 2000. Mali data are also included in the Other Africa region.
Memo: Palestinian Authority
MPALESTINE Data start in 2001.
Memo: Uganda MUGANDA
Memo: ASEAN MASEAN Data start in 2000. Includes: Brunei; Cambodia; Indonesia; Lao People's Democratic Republic; Malaysia; Myanmar; Philippines; Singapore; Thailand; and Viet Nam.
11. Oil statistics as well as coal trade statistics for Puerto Rico are included under the United States. Inputs to and outputs from electricity and heat generation up to 2016, and natural gas data for the entire time series are included under Other non-OECD Americas.
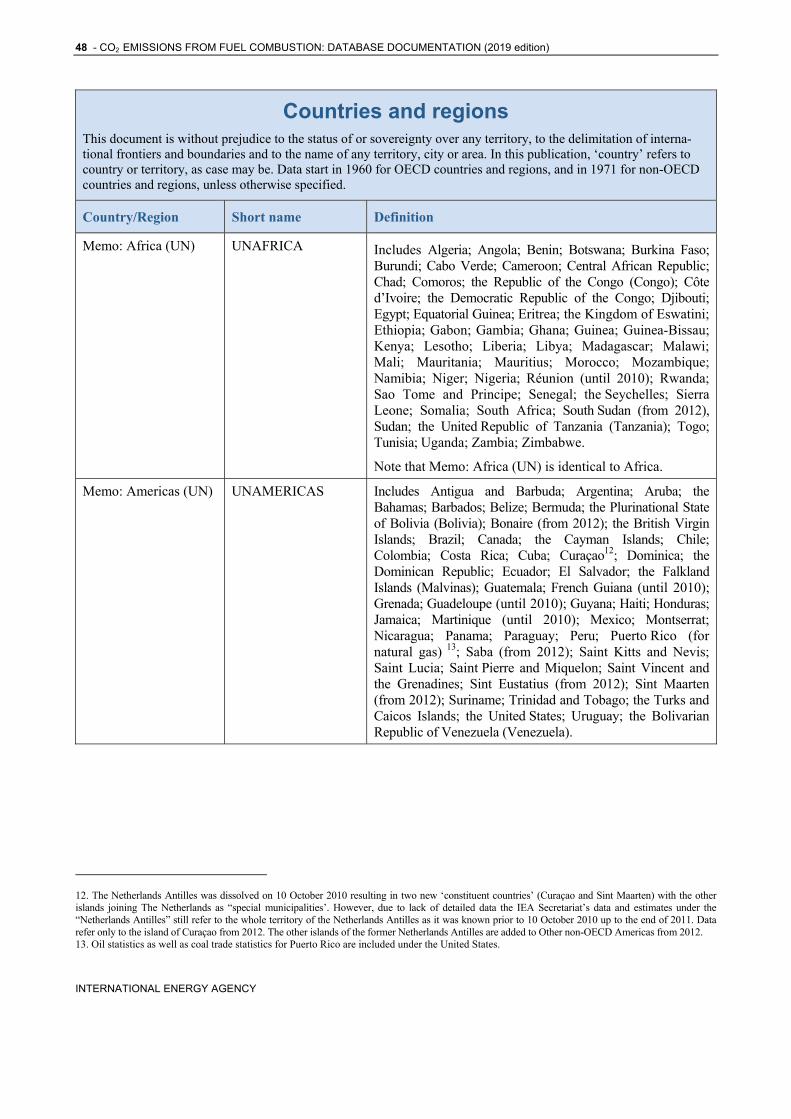
48 - CO2 EMISSIONS FROM FUEL COMBUSTION: DATABASE DOCUMENTATION (2019 edition)
INTERNATIONAL ENERGY AGENCY
Countries and regions This document is without prejudice to the status of or sovereignty over any territory, to the delimitation of interna-tional frontiers and boundaries and to the name of any territory, city or area. In this publication, ‘country’ refers to country or territory, as case may be. Data start in 1960 for OECD countries and regions, and in 1971 for non-OECD countries and regions, unless otherwise specified.
Country/Region Short name Definition
Memo: Africa (UN) UNAFRICA Includes Algeria; Angola; Benin; Botswana; Burkina Faso; Burundi; Cabo Verde; Cameroon; Central African Republic; Chad; Comoros; the Republic of the Congo (Congo); Côte d’Ivoire; the Democratic Republic of the Congo; Djibouti; Egypt; Equatorial Guinea; Eritrea; the Kingdom of Eswatini; Ethiopia; Gabon; Gambia; Ghana; Guinea; Guinea-Bissau; Kenya; Lesotho; Liberia; Libya; Madagascar; Malawi; Mali; Mauritania; Mauritius; Morocco; Mozambique; Namibia; Niger; Nigeria; Réunion (until 2010); Rwanda; Sao Tome and Principe; Senegal; the Seychelles; Sierra Leone; Somalia; South Africa; South Sudan (from 2012), Sudan; the United Republic of Tanzania (Tanzania); Togo; Tunisia; Uganda; Zambia; Zimbabwe.
Note that Memo: Africa (UN) is identical to Africa.
Memo: Americas (UN) UNAMERICAS Includes Antigua and Barbuda; Argentina; Aruba; the Bahamas; Barbados; Belize; Bermuda; the Plurinational State of Bolivia (Bolivia); Bonaire (from 2012); the British Virgin Islands; Brazil; Canada; the Cayman Islands; Chile; Colombia; Costa Rica; Cuba; Curaçao12; Dominica; the Dominican Republic; Ecuador; El Salvador; the Falkland Islands (Malvinas); Guatemala; French Guiana (until 2010); Grenada; Guadeloupe (until 2010); Guyana; Haiti; Honduras; Jamaica; Martinique (until 2010); Mexico; Montserrat; Nicaragua; Panama; Paraguay; Peru; Puerto Rico (for natural gas) 13; Saba (from 2012); Saint Kitts and Nevis; Saint Lucia; Saint Pierre and Miquelon; Saint Vincent and the Grenadines; Sint Eustatius (from 2012); Sint Maarten (from 2012); Suriname; Trinidad and Tobago; the Turks and Caicos Islands; the United States; Uruguay; the Bolivarian Republic of Venezuela (Venezuela).
12. The Netherlands Antilles was dissolved on 10 October 2010 resulting in two new ‘constituent countries’ (Curaçao and Sint Maarten) with the other islands joining The Netherlands as “special municipalities’. However, due to lack of detailed data the IEA Secretariat’s data and estimates under the “Netherlands Antilles” still refer to the whole territory of the Netherlands Antilles as it was known prior to 10 October 2010 up to the end of 2011. Data refer only to the island of Curaçao from 2012. The other islands of the former Netherlands Antilles are added to Other non-OECD Americas from 2012. 13. Oil statistics as well as coal trade statistics for Puerto Rico are included under the United States.
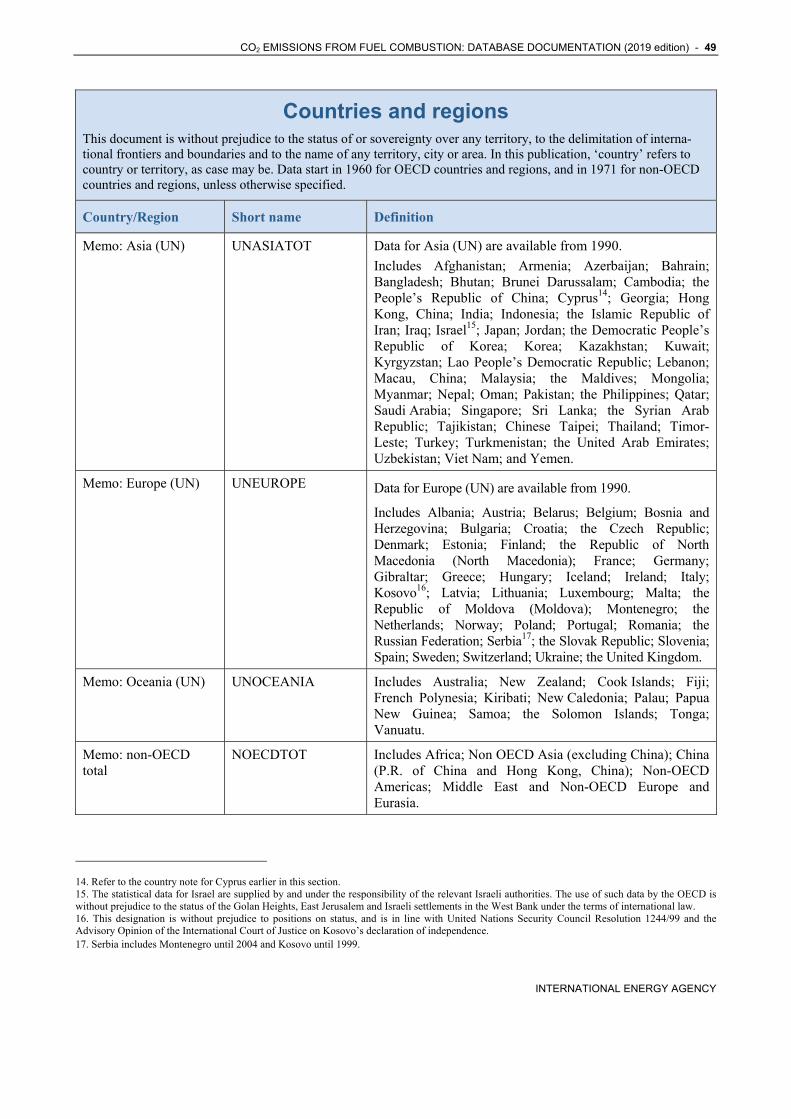
CO2 EMISSIONS FROM FUEL COMBUSTION: DATABASE DOCUMENTATION (2019 edition) - 49
INTERNATIONAL ENERGY AGENCY
Countries and regions This document is without prejudice to the status of or sovereignty over any territory, to the delimitation of interna-tional frontiers and boundaries and to the name of any territory, city or area. In this publication, ‘country’ refers to country or territory, as case may be. Data start in 1960 for OECD countries and regions, and in 1971 for non-OECD countries and regions, unless otherwise specified.
Country/Region Short name Definition
Memo: Asia (UN) UNASIATOT Data for Asia (UN) are available from 1990.
Includes Afghanistan; Armenia; Azerbaijan; Bahrain; Bangladesh; Bhutan; Brunei Darussalam; Cambodia; the People’s Republic of China; Cyprus14; Georgia; Hong Kong, China; India; Indonesia; the Islamic Republic of Iran; Iraq; Israel15; Japan; Jordan; the Democratic People’s Republic of Korea; Korea; Kazakhstan; Kuwait; Kyrgyzstan; Lao People’s Democratic Republic; Lebanon; Macau, China; Malaysia; the Maldives; Mongolia; Myanmar; Nepal; Oman; Pakistan; the Philippines; Qatar; Saudi Arabia; Singapore; Sri Lanka; the Syrian Arab Republic; Tajikistan; Chinese Taipei; Thailand; Timor-Leste; Turkey; Turkmenistan; the United Arab Emirates; Uzbekistan; Viet Nam; and Yemen.
Memo: Europe (UN) UNEUROPE Data for Europe (UN) are available from 1990.
Includes Albania; Austria; Belarus; Belgium; Bosnia and Herzegovina; Bulgaria; Croatia; the Czech Republic; Denmark; Estonia; Finland; the Republic of North Macedonia (North Macedonia); France; Germany; Gibraltar; Greece; Hungary; Iceland; Ireland; Italy; Kosovo16; Latvia; Lithuania; Luxembourg; Malta; the Republic of Moldova (Moldova); Montenegro; the Netherlands; Norway; Poland; Portugal; Romania; the Russian Federation; Serbia17; the Slovak Republic; Slovenia; Spain; Sweden; Switzerland; Ukraine; the United Kingdom.
Memo: Oceania (UN) UNOCEANIA Includes Australia; New Zealand; Cook Islands; Fiji; French Polynesia; Kiribati; New Caledonia; Palau; Papua New Guinea; Samoa; the Solomon Islands; Tonga; Vanuatu.
Memo: non-OECD total
NOECDTOT Includes Africa; Non OECD Asia (excluding China); China (P.R. of China and Hong Kong, China); Non-OECD Americas; Middle East and Non-OECD Europe and Eurasia.
14. Refer to the country note for Cyprus earlier in this section. 15. The statistical data for Israel are supplied by and under the responsibility of the relevant Israeli authorities. The use of such data by the OECD is without prejudice to the status of the Golan Heights, East Jerusalem and Israeli settlements in the West Bank under the terms of international law. 16. This designation is without prejudice to positions on status, and is in line with United Nations Security Council Resolution 1244/99 and the Advisory Opinion of the International Court of Justice on Kosovo’s declaration of independence. 17. Serbia includes Montenegro until 2004 and Kosovo until 1999.
50 - CO2 EMISSIONS FROM FUEL COMBUSTION: DATABASE DOCUMENTATION (2019 edition)
INTERNATIONAL ENERGY AGENCY
Countries and regions This document is without prejudice to the status of or sovereignty over any territory, to the delimitation of interna-tional frontiers and boundaries and to the name of any territory, city or area. In this publication, ‘country’ refers to country or territory, as case may be. Data start in 1960 for OECD countries and regions, and in 1971 for non-OECD countries and regions, unless otherwise specified.
Country/Region Short name Definition
Memo: IEA Total IEATOT Includes Australia; Austria; Belgium; Canada; the Czech Republic; Denmark; Estonia; Finland; France; Germany; Greece; Hungary; Ireland; Italy; Japan; Korea; Luxembourg; Mexico18; the Netherlands; New Zealand; Norway; Poland; Portugal; the Slovak Republic; Spain; Sweden; Switzerland; Turkey; the United Kingdom and the United States.
Estonia is included starting in 1990. Prior to 1990, data for Estonia are included in Former Soviet Union.
18. Mexico became the 30th IEA Member country in February 2018. Accordingly, starting with the 2018 preliminary edition, Mexico now appears in the list of IEA Members and is included in the IEA zone aggregate for the entire time series.
CO2 EMISSIONS FROM FUEL COMBUSTION: DATABASE DOCUMENTATION (2019 edition) - 51
INTERNATIONAL ENERGY AGENCY
Countries and regions This document is without prejudice to the status of or sovereignty over any territory, to the delimitation of interna-tional frontiers and boundaries and to the name of any territory, city or area. In this publication, ‘country’ refers to country or territory, as case may be. Data start in 1960 for OECD countries and regions, and in 1971 for non-OECD countries and regions, unless otherwise specified.
Country/Region Short name Definition
Memo: IEA and Accession/Association countries
IEAFAMILY Includes: IEA member countries: Australia, Austria, Bel-gium, Canada, the Czech Republic, Denmark, Estonia, Fin-land, France, Germany, Greece, Hungary, Ireland, Italy, Japan, Korea, Luxembourg, Mexico, the Netherlands, New Zealand, Norway, Poland, Portugal, the Slo-vak Republic, Spain, Sweden, Switzerland, Turkey, the United Kingdom and the United States; Accession coun-tries: Chile; Association countries: Brazil; the People’s Re-public of China; India; Indonesia; Morocco; Singapore; South Africa; Thailand.
Mexico became the International Energy Agency’s 30th member country on 17 February 2018. Accordingly, starting with the 2018 edition, Mexico appears in the list of IEA Members and is included in the IEA zone aggregates for data starting in 1971 and for the entire time series.
South Africa became an IEA Association country in No-vember 2018. Accordingly, South Africa is now included in the IEA and Accession/Association countries regional aggregate for data starting in 1971 and for the entire time series.
At the time of the preparation of this publication Lithuania was not yet formally an IEA Accession country and therefore has not been included in the relevant aggregate.
Memo: European Union – 28
EU28 Includes Austria, Belgium, Bulgaria, Croatia, Cyprus19, the Czech Republic, Denmark, Estonia, Finland, France, Germany, Greece, Hungary, Ireland, Italy, Latvia, Lithuania, Luxembourg, Malta, the Netherlands, Poland, Portugal, Romania, the Slovak Republic, Slovenia, Spain, Sweden and the United Kingdom.
Please note that in the interest of having comparable data, all of these countries are included since 1990 despite different entry dates into the European Union.
Memo: Former Yugoslavia
MYUGO Includes Former Yugoslavia (if no detail); Bosnia and Herzegovina; Croatia; the Republic of North Macedonia (North Macedonia); Kosovo; Montenegro; Slovenia and Serbia
Memo: Former Soviet Union
MFSU15 Includes the Former Soviet Union with all 15 countries for all years.
19. Refer to the country note for Cyprus earlier in this section.
52 - CO2 EMISSIONS FROM FUEL COMBUSTION: DATABASE DOCUMENTATION (2019 edition)
INTERNATIONAL ENERGY AGENCY
Countries and regions This document is without prejudice to the status of or sovereignty over any territory, to the delimitation of interna-tional frontiers and boundaries and to the name of any territory, city or area. In this publication, ‘country’ refers to country or territory, as case may be. Data start in 1960 for OECD countries and regions, and in 1971 for non-OECD countries and regions, unless otherwise specified.
Country/Region Short name Definition
Memo: OPEC OPEC Includes Algeria; Angola; Ecuador; Equatorial Guinea (starting with 1981 data); Gabon; the Islamic Republic of Iran; Iraq; Kuwait; Libya; Nigeria; Qatar; Saudi Arabia; the United Arab Emirates; the Bolivarian Republic of Venezuela (Venezuela). 20
Memo: G7 MG7 Includes Canada, France, Germany, Italy, Japan, the United Kingdom and the United States.
Memo: G8 MG8 Includes Canada, France, Germany, Italy, Japan, Russian Federation, the United Kingdom and the United States.
Memo: G20 MG20 Includes Argentina, Australia, Brazil, Canada, China (includ-ing Hong Kong, China), India, Indonesia, Japan, Korea, Mexico, Russian Federation, Saudi Arabia, South Africa, Turkey, the United States and the European Union – 28.
Memo: Annex I Parties ANNEX1 Includes Australia, Austria, Belarus, Belgium, Bulgaria, Canada, Croatia, Cyprus21, the Czech Republic22,23, Denmark, Estonia, Finland, France, Germany, Greece, Hungary, Iceland, Ireland, Italy, Japan, Latvia, Liechtenstein (not available in this publication)24, Lithuania, Luxembourg, Malta, Monaco (included with France), the Netherlands, New Zealand, Norway, Poland, Portugal, Romania, the Russian Federation, the Slovak Republic25, Slovenia, Spain, Sweden, Switzerland, Turkey, Ukraine, the United Kingdom and the United States.26
The countries that are listed above are included in Annex I of the United Nations Framework Convention on Climate Change as amended on 11 December 1997 by the 12th Plenary meeting of the Third Conference of the Parties in Decision 4/CP.3. This includes the countries that were members of the OECD at the time of the signing of the Convention, the EEC, and fourteen countries in Central and Eastern Europe and the Former Soviet Union that were undergoing the process of transition to market economies. During subsequent sessions, the Conference of the Parties agreed to amend Annex I to the Convention to include Malta (Decision 3/CP.15, effective from 26 October 2010) and Cyprus (Decision 10/CP.17, effective from 9 January 2013).
20. Data for Congo, that joined OPEC in June 2018, are not included in the OPEC aggregate in this edition. 21. Refer to the country note for Cyprus earlier in this section. 22. Czechia in official UN documents. 23. Czechoslovakia was in the original list of Annex I countries. 24. Oil data for Liechtenstein are included under Switzerland.
CO2 EMISSIONS FROM FUEL COMBUSTION: DATABASE DOCUMENTATION (2019 edition) - 53
INTERNATIONAL ENERGY AGENCY
Countries and regions This document is without prejudice to the status of or sovereignty over any territory, to the delimitation of interna-tional frontiers and boundaries and to the name of any territory, city or area. In this publication, ‘country’ refers to country or territory, as case may be. Data start in 1960 for OECD countries and regions, and in 1971 for non-OECD countries and regions, unless otherwise specified.
Country/Region Short name Definition
Memo: Annex II Parties
ANNEX2 Includes Australia, Austria, Belgium, Canada, Denmark, Finland, France27, Germany, Greece, Iceland, Ireland, Italy, Japan, Luxembourg, the Netherlands, New Zealand, Norway, Portugal, Spain, Sweden, Switzerland28, the United Kingdom and the United States.
According to Decision 26/CP.7 in document FCCC/CP/2001/13/ Add.4, Turkey has been deleted from the list of Annex II countries to the Convention. This amendment entered into force on 28 June 2002.
Memo: Annex II North America
ANNEX2NA Includes Canada and the United States.
Memo: Annex II Europe
ANNEX2EU Includes Austria, Belgium, Denmark, Finland, France, Germany, Greece, Iceland, Ireland, Italy, Luxembourg, the Netherlands, Norway, Portugal, Spain, Sweden, Switzerland and the United Kingdom.
Memo: Annex II Asia Oceania
ANNEX2AO Includes Australia, Japan and New Zealand.
Memo: Annex I Economies in Transition
ANNEX1EIT Annex I: Economies in Transition (EITs) are those countries in Annex I that are undergoing the process of transition to a market economy. This includes Belarus, Bulgaria, Croatia, the Czech Republic, Estonia, Hungary, Latvia, Lithuania, Poland, Romania, Russian Federation, the Slovak Republic, Slovenia and Ukraine.
Memo: Non-Annex I Parties
NONANNEX1
25. Slovakia in official UN documents. 26. The European Union is also an Annex I Party in its own right. The EU was assigned an overall reduction target under the Kyoto Protocol, which by agreement, was used to determine the individual targets of the fifteen states that were EU members in 1997 when the Kyoto Protocol was adopted. 27. In IEA data, France also includes Monaco, which is not in the list of Annex II Parties. 28. In IEA data, Switzerland includes Oil data for Liechtenstein, which is not in the list of Annex II Parties.
54 - CO2 EMISSIONS FROM FUEL COMBUSTION: DATABASE DOCUMENTATION (2019 edition)
INTERNATIONAL ENERGY AGENCY
Countries and regions This document is without prejudice to the status of or sovereignty over any territory, to the delimitation of interna-tional frontiers and boundaries and to the name of any territory, city or area. In this publication, ‘country’ refers to country or territory, as case may be. Data start in 1960 for OECD countries and regions, and in 1971 for non-OECD countries and regions, unless otherwise specified.
Country/Region Short name Definition
Memo: Annex B Kyoto Parties
ANNEXB Includes Australia, Austria, Belgium, Belarus, Bulgaria, Croatia, Cyprus29, the Czech Republic, Denmark, Estonia, Finland, France, Germany, Greece, Hungary, Iceland, Ireland, Italy, Kazakhstan, Latvia, Liechtenstein (not available in this publication), Lithuania, Luxembourg, Malta, Monaco (included with France), the Netherlands, Norway, Poland, Portugal, Romania, the Slovak Republic, Slovenia, Spain, Sweden, Switzerland, Ukraine and the United Kingdom.30 Refers to countries with emission targets under the second commitment period (CP) of the Kyoto Protocol (2013-2020) as per the Doha Amendment. This differs from the list of countries with targets under the first CP (2008-2012). Please note that the Doha Amendment has not yet entered into force. Membership of Annex B in the second CP of the Kyoto Protocol differs from that in Annex I. In particular, Annex B excludes, or does not contain targets for Canada, Japan, New Zealand, the Russian Federation, Turkey and the United States (all Annex I member states), but includes Kazakhstan (a non-Annex I Party under the Convention, but an Annex I Party under the Kyoto Protocol (as per decision 9/CMP.8).
Please note that the following countries have not been considered:
Non-OECD Europe and Eurasia: Andorra; Faroe Islands (after 1990); Liechtenstein (except for oil data); Svalbard; Jan Mayen Islands;
Africa: British Indian Ocean Territory; French Southern and Antarctic Lands; Mayotte; Saint Helena; Western Sahara;
Non-OECD Americas: Bouvet Island; Saint Barthélemy; Greenland (after 1990); Saint Martin (French Part); South Georgia and the South Sandwich Islands;
Antarctica;
Non-OECD Asia (excluding China): American Samoa; Cocos (Keeling) Islands; Christmas Island; Heard Island and McDonald Islands; Marshall Islands; Micronesia (Federated States of); Nauru; Niue; Norfolk Island; Northern Mariana Islands; Pitcairn; Tokelau; Tuvalu; United States Minor Outlying Islands; Wallis and Futuna Islands.
29. Refer to the country note for Cyprus earlier in this section. 30. The European Union is also an Annex I Party in its own right. The EU was assigned an overall reduction target under the Kyoto Protocol, which by agreement, was used to determine the individual targets of the fifteen states that were EU members in 1997 when the Kyoto Protocol was adopted.
CO2 EMISSIONS FROM FUEL COMBUSTION: DATABASE DOCUMENTATION (2019 edition) - 55
INTERNATIONAL ENERGY AGENCY
5. UNDERSTANDING THE IEA CO2 EMISSIONS ESTIMATES
The importance of estimating emissions
The ultimate objective of the UNFCCC (the Convention) is the stabilisation of GHG concentrations in the at-mosphere at a level that would prevent dangerous an-thropogenic interference with the climate system. The Convention also calls for all Parties to commit them-selves to the following objectives:
to develop, update periodically, publish and make available to the Conference of the Parties (COP) their national inventories of anthropogenic emissions by sources and removals by sinks, of all greenhouse gases not controlled by the Montreal Protocol.
to use comparable methodologies for inventories of GHG emissions and removals, to be agreed up-on by the COP.
As a response to the objectives of the UNFCCC, the IEA Secretariat, together with the IPCC, the OECD and numerous international experts, has helped to develop and refine an internationally-agreed methodology for the calculation and reporting of national GHG emis-sions from fuel combustion. This methodology was published in 1995 in the IPCC Guidelines for National Greenhouse Gas Inventories. After the initial dissemi-nation of the methodology, revisions were added to several chapters, and published as the Revised 1996 IPCC Guidelines for National Greenhouse Gas Inven-tories (1996 GLs). In April 2006, the IPCC approved the 2006 Guidelines at the 25th session of the IPCC in Mauritius. Until 2015, most Parties, as well as the IEA, still calculated their inventories using the 1996 GLs. In December 2011 in Durban, Parties adopted
Decision 15/CP.17 to update their reporting tables so as to implement the 2006 GLs. The new reporting ta-bles have been mandatory since 15 April 2015.
The IEA estimates of CO2 emissions from fuel combustion
Energy is at the core of the greenhouse gas estimation. It is estimated that for Annex I Parties energy ac-counts for 82%31 of total GHG emissions, while for the world the share is around three quarters, although shares vary greatly by country. Within energy, CO2 from fuel combustion accounts for the largest fraction, 92% for Annex I countries, once again varying de-pending on the economic structure of the country.
Given its extensive work in global energy data collec-tion and compilation, the IEA is able to produce com-parable estimates of CO2 emissions from fuel combustion across countries and region, providing a reference database for countries with more and less advanced national systems.
The estimates of CO2 emissions from fuel combustion presented in this publication are calculated using the IEA energy data32 and the default methods and emis-sion factors from the 2006 IPCC Guidelines for National Greenhouse Gas Inventories (2006 GLs)33.
31. Based on data reported to the UNFCCC for 2012, excluding land-use, land-use change and forestry (LULUCF). 32. Published in World Energy Statistics and World Energy Balances, IEA, Paris, 2019. 33. See: http://www.ipcc-nggip.iges.or.jp/public/2006gl/vol2.html.
56 - CO2 EMISSIONS FROM FUEL COMBUSTION: DATABASE DOCUMENTATION (2019 edition)
INTERNATIONAL ENERGY AGENCY
Prior to the 2015 edition of this publication, the IEA used methods and emission factors of the Revised 1996 IPCC Guidelines, in line with UNFCCC rec-ommendations for the reporting under the Kyoto Pro-tocol. The IEA implementation of the 2006 GLs in this edition follows the decision of UNFCCC Parties to update their reporting tables and to implement the 2006 GLs starting on 15 April 2015.
The implications of changes in methods and emissions factors on the IEA emissions estimates for this edition are discussed in the section IEA estimates: Changes under the 2006 IPCC Guidelines.
Data in this publication and its corresponding data-base may have been revised with respect to previous editions also because the IEA reviews its energy data-bases each year. In the light of new assessments, revi-sions may be made to the energy data time series for any individual country.
CO2 emissions from fuel combustion: key concepts
The IEA uses the simplest (Tier 1) methodology to estimate CO2 emissions from fuel combustion based on the 2006 GLs. The computation follows the con-cept of conservation of carbon, from the fuel com-busted into CO2. While for the complete methodology the reader should refer to the full IPCC documents, a basic description follows.
Generally, the Tier 1 estimation of CO2 emissions from fuel combustion for a given fuel can be summa-rised as follows:
CO2 emissions from fuel combustion CO2 = Fuel consumption * Emission factor
where:
Fuel consumption = amount of fuel combusted; Emission factor = default emission factor
Emissions are then summed across all fuels and all sectors of consumption to obtain national totals. A more detailed explanation of the step by step calcula-tion is presented in the section IEA estimates: Chang-es under the 2006 IPCC Guidelines.
IEA estimates vs. UNFCCC submissions
Based on the IEA globally collected energy data, the IEA estimates of CO2 emissions from fuel combustion are a global database obtained following harmonised definitions and comparable methodologies across countries. They do not represent an official source for national submissions, as national administrations should use the best available country-specific infor-mation to complete their emissions reporting.
The IEA CO2 estimates can be compared with those reported by countries to the UNFCCC Secretariat to highlight possible problems in methods, input data or emission factors. Still, care should be used in inter-preting the results of any comparison since the IEA estimates may differ from a country’s official submis-sion for many reasons.
For most Annex II countries, the two calculations are expected to be within 5-10%, depending on the cover-age of the fuel combustion sector in the national in-ventory. For some EIT and non-Annex I countries, differences may be larger. If the underlying energy data are different, more work is needed on the collect-ing and reporting of energy statistics.
In case of systematic biases in the energy data or emis-sion factors, emission trends will usually be more relia-ble than the absolute emission levels. By comparing trends in the IEA estimates with trends in emissions as reported to the UNFCCC, it should be possible to identi-fy definition problems or methodological differences.
Some of the reasons for these differences are:
The IEA uses a Tier 1 method to compute emis-sions estimates.
For the calculation of CO2 emissions from fuel com-bustion, the IEA uses a Tier 1 method. Countries may be using a more sophisticated Tier 2 or Tier 3 method that takes into account more detailed country-specific information available (e.g. on different technologies or processes).
Energy activity data based on IEA energy bal-ances may differ from those used for the UNFCCC calculations.
Countries often have several “official” data sources such as a Ministry, a Central Bureau of Statistics, a nationalised electricity company, etc. Data can also be
CO2 EMISSIONS FROM FUEL COMBUSTION: DATABASE DOCUMENTATION (2019 edition) - 57
INTERNATIONAL ENERGY AGENCY
collected from the energy suppliers, the energy consum-ers or customs statistics. The IEA Secretariat tries to collect the most accurate data, but does not necessarily have access to the complete data set that may be available to national experts calculating emission in-ventories for the UNFCCC. In addition to different sources, the methodology used by the national bodies providing the data to the IEA and to the UNFCCC may differ. For example, general surveys, specific surveys, questionnaires, estimations, combined meth-ods and classifications of data used in national statis-tics and in their subsequent reclassification according to international standards may result in different series.
The IEA uses average net calorific values for oil products.
To transform fuel consumption data from physical units to energy units, the IEA uses an average net calorific value (NCV) for each secondary oil product. These NCVs are region-specific and constant over time. Coun-try-specific NCVs that can vary over time are used for NGL, refinery feedstocks and additives. Crude oil NCVs are further split into production, imports, exports and average. Different coal types have specific NCVs for production, imports, exports, inputs to main activity power plants and coal used in coke ovens, blast furnaces and industry, and can vary over time for each country.
Country experts may have more detailed data on calo-rific values available when calculating the energy con-tent of the fuels. This in turn could produce different values than those of the IEA.
The IEA uses average carbon content values.
The IEA uses the default carbon content values given in the 2006 GLs. Country experts may have better information available, allowing them to use country-specific values.
The IEA cannot allocate emissions from auto-producers into the end-use sectors.
The 2006 GLs recommend that emissions from auto-production should be included with emissions from other fuel use by end-consumers. At the same time, the emissions from the autoproduction of electricity and heat should be excluded from the energy trans-formation source category to avoid double counting. The IEA is not able to allocate the fuel use from auto-producers between industry and other. Therefore, this publication shows a category called “Unallocated auto-producers”. However, this should not affect the total emissions for a country.
Military emissions may be treated differently.
According to the 2006 GLs, military emissions should be reported in Source/Sink Category 1 A 5, Non-Specified. Previously, the IEA questionnaires request-ed that warships be included in international marine bunkers and that the military use of aviation fuels be included in domestic air. All other military use should have been reported in non-specified other.
At the IEA/Eurostat/UNECE Energy Statistics Working Group meeting (Paris, November 2004), participants decided to harmonise the definitions used to collect energy data on the joint IEA/Eurostat/UNECE ques-tionnaires with those used by the IPCC to report GHG inventories. As a result, starting in the 2006 edition of this publication, all military consumption should be reported in non-specified other. Sea-going versus coastal is no longer a criterion for splitting interna-tional and domestic navigation.
However, it is not clear whether countries are report-ing on the new basis, and if they are, whether they will be able to revise their historical data. The IEA has found that in practice most countries consider infor-mation on military consumption as confidential and therefore either combine it with other information or do not include it at all.
The IEA estimates include all CO2 emissions from fuel combustion. Countries may have includ-ed parts of these emissions in the IPCC category industrial processes and product use.
Although emissions totals would not differ, the alloca-tion to the various sub-totals of a national inventory could. National GHG inventories submitted to the UNFCCC divide emissions according to source catego-ries. Two of these IPCC Source/Sink Categories are energy, and industrial processes and product use. Care must be taken not to double count emissions from fuel combustion that occur within certain industrial pro-cesses (e.g. iron and steel). The IEA estimates in this publication include all the CO2 emissions from fuel combustion, while countries are asked to report some of them within the industrial processes and product use category under the 2006 GLs. See a more detailed discussion in the section IEA Estimates: Changes un-der the 2006 IPCC Guidelines.
The units may be different.
The 2006 GLs ask that CO2 emissions be reported in Gg of CO2 (1 Gg = 1 kilotonne). A million tonnes of CO2 is equal to 1 000 Gg of CO2, so to compare the numbers in this publication with national inventories expressed in Gg, the IEA emissions must be multi-plied by 1 000.
58 - CO2 EMISSIONS FROM FUEL COMBUSTION: DATABASE DOCUMENTATION (2019 edition)
INTERNATIONAL ENERGY AGENCY
Macroeconomic drivers of CO2 emissions trends
Tables and graphs for drivers refer to the decomposi-tion of CO2 emissions into four driving factors (Kaya identity)34, which is generally presented in the form:
Kaya identity C = P (G/P) (E/G) (C/E)
where:
C = CO2 emissions;
P = population;
G = GDP;
E = primary energy consumption.
The identity expresses, for a given time, CO2 emissions as the product of population, per capita economic out-put (G/P), energy intensity of the economy (E/G) and carbon intensity of the energy mix (C/E). Because of possible non-linear interactions between terms, the sum of the percentage changes of the four factors, e.g. (Py-Px)/Px, will not generally add up to the per-centage change of CO2 emissions (Cy-Cx)/Cx. Howev-er, relative changes of CO2 emissions in time can be obtained from relative changes of the four factors as follows:
Kaya identity: relative changes in time Cy/Cx = Py/Px (G/P)y/(G/P)x (C/E)y/(C/E)x
where x and y represent for example two different years.
34. Yamaji, K., Matsuhashi, R., Nagata, Y. Kaya, Y., An integrated system for CO2/Energy/GNP analysis: case studies on economic measures for CO2 reduction in Japan. Workshop on CO2 reduction and removal: measures for the next century, March 19, 1991, International Institute for Applied Systems Analysis, Laxenburg, Austria.
In this publication, the Kaya decomposition is pre-sented as:
CO2 emissions and drivers CO2 = P (GDP/P) (TPES/GDP) (CO2/TPES)
where:
CO2 = CO2 emissions;
P = population;
GDP35/P = GDP/population;
TPES/GDP35 = Total Primary Energy Supply per GDP;
CO2/TPES = CO2 emissions per unit TPES.
Indices of all terms (1990 = 100 unless otherwise specified) are shown for each country and regional aggregate in Part II of the full publication, both in the Summary tables and in the individual country/region pages (Table 1, Key indicators, and Figure 6, CO2 emissions and drivers). Note that in its index form, CO2/TPES corresponds to the Energy Sector Carbon Intensity Index (ESCII)36.
The Kaya identity can be used to discuss the primary driving forces of CO2 emissions. For example, it shows that, globally, increases in population and GDP per capita have been driving upwards trends in CO2 emis-sions, more than offsetting the reduction in energy intensity. In fact, the carbon intensity of the energy mix is almost unchanged, due to the continued dominance of fossil fuels - particularly coal - in the energy mix, and to the slow uptake of low-carbon technologies.
However, it should be noted that there are important caveats in the use of the Kaya identity. Most im-portant, the four terms on the right-hand side of equa-tion should be considered neither as fundamental driving forces in themselves, nor as generally inde-pendent from each other.
35. GDP based on purchasing power parities (PPP). 36. See the IEA publication Tracking Clean Energy Progress 2015.
CO2 EMISSIONS FROM FUEL COMBUSTION: DATABASE DOCUMENTATION (2019 edition) - 59
INTERNATIONAL ENERGY AGENCY
Drivers of electricity generation emissions trends
In this edition, new graphs present the change in CO2 emissions from electricity generation over time de-composed into the respective changes of four driving factors37:
CO2 emissions from electricity generation C = (C/E) (E/ELF) (ELF/EL) (EL)
where:
C = CO2 emissions; E = fossil fuel inputs to thermal generation; ELF = electricity output from fossil fuels; EL = total electricity output;
This can be rewritten as:
CO2 emissions from electricity generation C = (CF) (EI) (EFS) (EL)
where:
C = CO2 emissions; CF = carbon intensity of the fossil fuel mix; EI = the reciprocal of fossil fuel based electricity generation efficiency; EFS = share of electricity from fossil fuels; EL = total electricity output.
This decomposition expresses, for a given time, CO2 emissions from electricity generation as the product of the carbon intensity of the fossil fuel mix (CF), the re-ciprocal of fossil fuel based thermal electricity genera-tion efficiency (1/EF), the share of electricity from fossil fuels (EFS) and total electricity output (EL).
However, due to non-linear interactions between terms, if a simple decomposition is used, the sum of the percentage changes of the four factors, e.g. (CFy-CFx)/CFx may not perfectly match the
37. M. Zhang, X. Liu, W. Wang, M. Zhou. Decomposition analysis of CO2 emissions from electricity generation in China. Energy Policy, 52 (2013), pp. 159–165.
percentage change of total CO2 emissions (Cy-Cx)/Cx. To avoid this, a more complex decomposition method is required. In this case, the logarithmic mean divisia (LMDI) method proposed by Ang (2004)38 has been used.
Using this method, the change in total CO2 emissions from electricity generation (CTOT) between year t and a base year 0, can be computed as the sum of the changes in each of the individual factors as follows:
CTOT = CCF + CEI +CEFS +CEL
where:
CCF ,
CEI ,
CEFS ,
CEL ,
and:
L , /
This decomposition can be useful when analysing the trends in CO2 emissions from electricity generation. For instance, it shows that globally, since 1990, the main driver of increased CO2 emissions from elec-tricity generation has been increased electricity out-put, with improvements in the overall thermal efficiency, and the CO2 intensity of the electricity generation mix being offset by an increase in the share of electricity derived from fossil fuel sources.
However, as is the case with the Kaya decomposition, it should be noted that the four terms on the right-hand side of equation should be considered neither as fundamental driving forces in themselves, nor as gen-erally independent from each other. For instance, sub-stituting coal with gas as a source of electricity generation would affect both the CO2 intensity of the electricity generation mix and the thermal efficiency of generation.
38. B. W. Ang, Decomposition analysis for policymaking in energy: which is the preferred method?, Energy Policy, 32 (9) (2004), pp. 1131–1139.
60 - CO2 EMISSIONS FROM FUEL COMBUSTION: DATABASE DOCUMENTATION (2019 edition)
INTERNATIONAL ENERGY AGENCY
6. IEA ESTIMATES: CHANGES UNDER THE 2006 IPCC GUIDELINES
The 2006 IPCC Guidelines methodology: key concepts
This section briefly presents the Tier 1 methodology to estimate CO2 emissions from fuel combustion based on the 2006 GLs, outlining the main differences with the 1996 GLs - used for previous editions of this publication. The focus is on the key points relevant to the IEA estimation. For the complete methodology, the reader should refer to the full IPCC documents.39
Generally, the Tier 1 estimation of CO2 emissions from fuel combustion for a given fuel can be summarised as follows:
CO2 emissions from fuel combustion CO2 = AD * NCV * CC * COF
where:
CO2 = CO2 emissions from fuel combustion; AD = Activity data; NCV = Net calorific value; CC = Carbon content; COF = Carbon oxidation factor.
Emissions are then summed over all fuels.
While the basic concept of the calculation - the con-servation of carbon - is unchanged, the 2006 GLs dif-fer from the 1996 GLs in the:
default net calorific values by product;
default carbon content by product;
39. Both the 1996 GLs and the 2006 GLs are available from the IPCC Greenhouse Gas Inventories Programme (www.ipcc-nggip.iges.or.jp ).
default carbon oxidation factors;
treatment of fuels used for non-energy purposes;
allocation of fuel combustion emissions across the Energy and IPPU categories.
2006 Guidelines: overview of changes
This section describes the key methodological chang-es 2006 GLs for a Tier 1 estimation of CO2 emissions from fuel combustion, with a short assessment of their impact on results.
Net calorific values
Net calorific values (NCVs) are used to convert the activity data for all the different fuels from "physical" units (e.g. tonnes) to "energy" units (e.g. Joules).
In the 1996 GLs, country-specific net calorific values were given for primary oil (crude oil and NGL), for primary coal and for a few secondary coal products. These NCVs were based on the average 1990 values of the 1993 edition of the IEA Energy Balances.
In the 2006 GLs, those country-specific NCVs were removed, and one default is provided for each fuel (with upper and lower limits, as done for the carbon content). Large differences were therefore observed for products whose quality varies a lot from country to country, such as primary oil and coal products. Re-placing country-specific values with one default value would significantly affect emissions calculations if the default values were used.
CO2 EMISSIONS FROM FUEL COMBUSTION: DATABASE DOCUMENTATION (2019 edition) - 61
INTERNATIONAL ENERGY AGENCY
The IEA CO2 emissions from fuel combustion estimates are based on the IEA energy balances, computed using time-varying country-specific NCVs. Therefore, they are not affected by changes to the default net calorific values of the 2006 GLs.
Carbon content
Carbon content is the quantity of carbon per unit of energy of a given fuel. Some of the fuel-specific de-fault values for carbon content, called “carbon emis-sion factors” in the 1996 GLs, were revised in the 2006 GLs. In addition, values were added for some fuels not directly mentioned in the 1996 GLs.
As the carbon content may vary considerably for some fuels, the 2006 GLs introduced ranges of values, i.e. providing for each fuel a default value with lower and upper limits. The IEA CO2 emissions are calcu-lated using the IPCC default values.
A summary of the default carbon content values in the two set of guidelines is shown in Table 1. Relative changes between the 2006 GLs and the 1996 GLs range between -13.7% (refinery gas) and + 7.3% (blast furnace gas), although for many fuels the varia-tion is minimal, or zero. Such systematic changes are reflected in Tier 1 CO2 emissions estimates.
Carbon oxidation factors
A small fraction of the carbon contained in fuels en-tering the combustion process (typically less than 1-2%) is not oxidised. Under the 1996 GLs, this amount was subtracted from emissions in the calcula-tions by multiplying the calculated carbon content of a fuel by a “fraction of carbon oxidised”. The fraction of carbon oxidised had a value of less than 1.0, which had the effect of reducing the emissions estimate. However, in most instances, emissions inventory compilers had no “real” information as to whether this correction was actually applicable.
Therefore, in the 2006 GLs, it was decided that all carbon is assumed to be emitted by default, unless more specific information is available. Therefore, un-der the 2006 GLs, the default carbon oxidation factor is equal to 1 for all fuels.
A summary of the default carbon oxidation factors in the two set of guidelines is shown in Table 2. Relative changes from the 1996 GLs and the 2006 GLs are +0.5% for natural gas; +1% for oil, oil products and peat; and +2% for coal. Such changes are reflected in systematic increases in Tier 1 CO2 emissions estimates.
Table 1. Comparison of default carbon content values*
Kilogrammes / gigajoule
Fuel Type 1996
Guidelines 2006
Guidelines**Percent Change
Anthracite 26.8 26.8 0.0% Coking Coal 25.8 25.8 0.0% Other Bituminous Coal 25.8 25.8 0.0% Sub-Bituminous Coal 26.2 26.2 0.0% Lignite 27.6 27.6 0.0% Patent Fuel 25.8 26.6 +3.1% Coke oven coke 29.5 29.2 -1.0% Gas Coke 29.5 29.2 -1.0% Coal Tar .. 22.0 x BKB 25.8 26.6 +3.1% Gas Works Gas .. 12.1 x Coke Oven Gas 13.0 12.1 -6.9% Blast Furnace Gas 66.0 70.8 +7.3% Other recovered gases .. 49.6 x Peat 28.9 28.9 0.0% Oil shale 29.1 29.1 0.0% Natural Gas 15.3 15.3 0.0% Crude Oil 20.0 20.0 0.0% Natural Gas Liquids 17.2 17.5 +1.7% Refinery Feedstocks 20.0 20.0 0.0% Orimulsion 22.0 21.0 -4.5% Refinery Gas 18.2 15.7 -13.7% Ethane 16.8 16.8 0.0% Liquefied petroleum gases (LPG)
17.2 17.2 0.0%
Motor Gasoline excl. biofuels18.9
18.9 0.0% Aviation Gasoline 19.1 +1.1% Gasoline type jet fuel 19.1 +1.1%Kerosene type jet fuel excl. bio 19.5 19.5 0.0%Other Kerosene 19.6 19.6 0.0%Gas/Diesel Oil excl. biofuels 20.2 20.2 0.0%Fuel Oil 21.1 21.1 0.0%Naphtha 20.0 20.0 0.0%Lubricants 20.0 20.0 0.0% Bitumen 22.0 22.0 0.0%Petroleum Coke 27.5 26.6 -3.3%Non-specified oil products
20.0 20.0 0.0%
Other hydrocarbons White Spirit & SBP 20.0 0.0%Paraffin Waxes 20.0 0.0% Industrial Waste .. 39.0 xMunicipal Waste (non-renewable)
.. 25.0 x
* “Carbon content” was referred to as the “carbon emission factor” in the 1996 GLs.
** The 2006 GLs also give the lower and upper limits of the 95 percent confidence intervals, assuming lognormal distributions.
Table 2. Comparison of default carbon oxidation factors*
Fuel Type 1996
Guidelines 2006
Guidelines**Percent Change
Coal 0.980 1.00 +2.0%
Oil and oil products 0.990 1.00 +1.0%
Natural gas 0.995 1.00 +0.5%
Peat ** 0.990 1.00 +1.0%
* “Carbon oxidation factor” was referred to as “fraction of carbon oxidised” in the 1996 GLs.
** The 1996 GLs specified a carbon oxidation factor for peat used for electricity generation only.
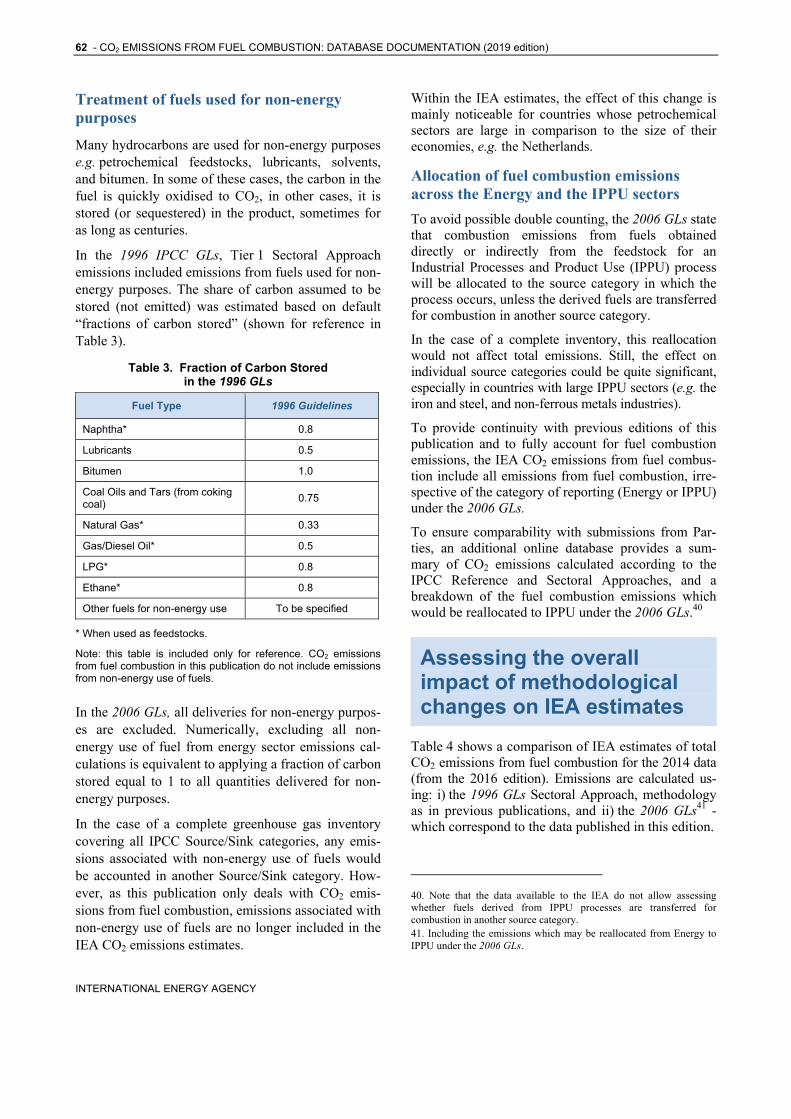
62 - CO2 EMISSIONS FROM FUEL COMBUSTION: DATABASE DOCUMENTATION (2019 edition)
INTERNATIONAL ENERGY AGENCY
Treatment of fuels used for non-energy purposes
Many hydrocarbons are used for non-energy purposes e.g. petrochemical feedstocks, lubricants, solvents, and bitumen. In some of these cases, the carbon in the fuel is quickly oxidised to CO2, in other cases, it is stored (or sequestered) in the product, sometimes for as long as centuries.
In the 1996 IPCC GLs, Tier 1 Sectoral Approach emissions included emissions from fuels used for non-energy purposes. The share of carbon assumed to be stored (not emitted) was estimated based on default “fractions of carbon stored” (shown for reference in Table 3).
Table 3. Fraction of Carbon Stored in the 1996 GLs
Fuel Type 1996 Guidelines
Naphtha* 0.8
Lubricants 0.5
Bitumen 1.0
Coal Oils and Tars (from coking coal)
0.75
Natural Gas* 0.33
Gas/Diesel Oil* 0.5
LPG* 0.8
Ethane* 0.8
Other fuels for non-energy use To be specified
* When used as feedstocks.
Note: this table is included only for reference. CO2 emissions from fuel combustion in this publication do not include emissions from non-energy use of fuels.
In the 2006 GLs, all deliveries for non-energy purpos-es are excluded. Numerically, excluding all non-energy use of fuel from energy sector emissions cal-culations is equivalent to applying a fraction of carbon stored equal to 1 to all quantities delivered for non-energy purposes.
In the case of a complete greenhouse gas inventory covering all IPCC Source/Sink categories, any emis-sions associated with non-energy use of fuels would be accounted in another Source/Sink category. How-ever, as this publication only deals with CO2 emis-sions from fuel combustion, emissions associated with non-energy use of fuels are no longer included in the IEA CO2 emissions estimates.
Within the IEA estimates, the effect of this change is mainly noticeable for countries whose petrochemical sectors are large in comparison to the size of their economies, e.g. the Netherlands.
Allocation of fuel combustion emissions across the Energy and the IPPU sectors
To avoid possible double counting, the 2006 GLs state that combustion emissions from fuels obtained directly or indirectly from the feedstock for an Industrial Processes and Product Use (IPPU) process will be allocated to the source category in which the process occurs, unless the derived fuels are transferred for combustion in another source category.
In the case of a complete inventory, this reallocation would not affect total emissions. Still, the effect on individual source categories could be quite significant, especially in countries with large IPPU sectors (e.g. the iron and steel, and non-ferrous metals industries).
To provide continuity with previous editions of this publication and to fully account for fuel combustion emissions, the IEA CO2 emissions from fuel combus-tion include all emissions from fuel combustion, irre-spective of the category of reporting (Energy or IPPU) under the 2006 GLs.
To ensure comparability with submissions from Par-ties, an additional online database provides a sum-mary of CO2 emissions calculated according to the IPCC Reference and Sectoral Approaches, and a breakdown of the fuel combustion emissions which would be reallocated to IPPU under the 2006 GLs.40
Assessing the overall impact of methodological changes on IEA estimates
Table 4 shows a comparison of IEA estimates of total CO2 emissions from fuel combustion for the 2014 data (from the 2016 edition). Emissions are calculated us-ing: i) the 1996 GLs Sectoral Approach, methodology as in previous publications, and ii) the 2006 GLs41 - which correspond to the data published in this edition.
40. Note that the data available to the IEA do not allow assessing whether fuels derived from IPPU processes are transferred for combustion in another source category. 41. Including the emissions which may be reallocated from Energy to IPPU under the 2006 GLs.
CO2 EMISSIONS FROM FUEL COMBUSTION: DATABASE DOCUMENTATION (2019 edition) - 63
INTERNATIONAL ENERGY AGENCY
The overall impact of the change in methodology on the IEA estimates of CO2 emissions from fuel com-bustion varies from country to country, mainly de-pending on the underlying fuel mix and on the relative importance of non-energy use of fuels in the total.
Most countries show a decrease in CO2 emissions lev-els under the new methodology, as the reductions due to the removal of non-energy use emissions are gener-ally larger than the systematic increase due to changes in the oxidation factor.
For the year 2014, reductions of 1% or greater are observed for sixty-five countries, with thirteen show-ing a decrease of 5% or more. The largest relative decreases are observed in countries with high non-energy use of fuels (mainly oil products and natu-ral gas) relative to their total energy consumption: Trinidad and Tobago (-39%), Gibraltar (-17%), Lithu-ania (-14%), and Singapore (-13%), the Netherlands, Belarus and Brunei Darussalam (all 11%). As emis-sions from non-energy use of fuels are not included in
energy sector emissions under the 2006 GLs, emis-sions previously attributed to non-energy use of oil products and natural gas are no longer included in IEA CO2 emissions from fuel combustion estimates for these countries. One country, Curaçao presented a large increase (27%) in 2014. This was due to the in-clusion of emissions from reported energy use of bi-tumen, which had been excluded (considered carbon stored / non-energy use) under the 1996 GLs.
Within the IEA databases, these changes will also be reflected in all indicators derived from CO2 emissions totals (e.g. CO2/TPES, CO2/GDP). Impacts on trends should be visible when the relative weight of the non-energy use of fuels changes in time.
However, as mentioned, most of the methodological changes would not have significant impact in the case of a complete inventory covering all IPCC source/sink categories; in particular, the reallocation of emissions between categories would not affect total emissions estimates, nor the overall trends.
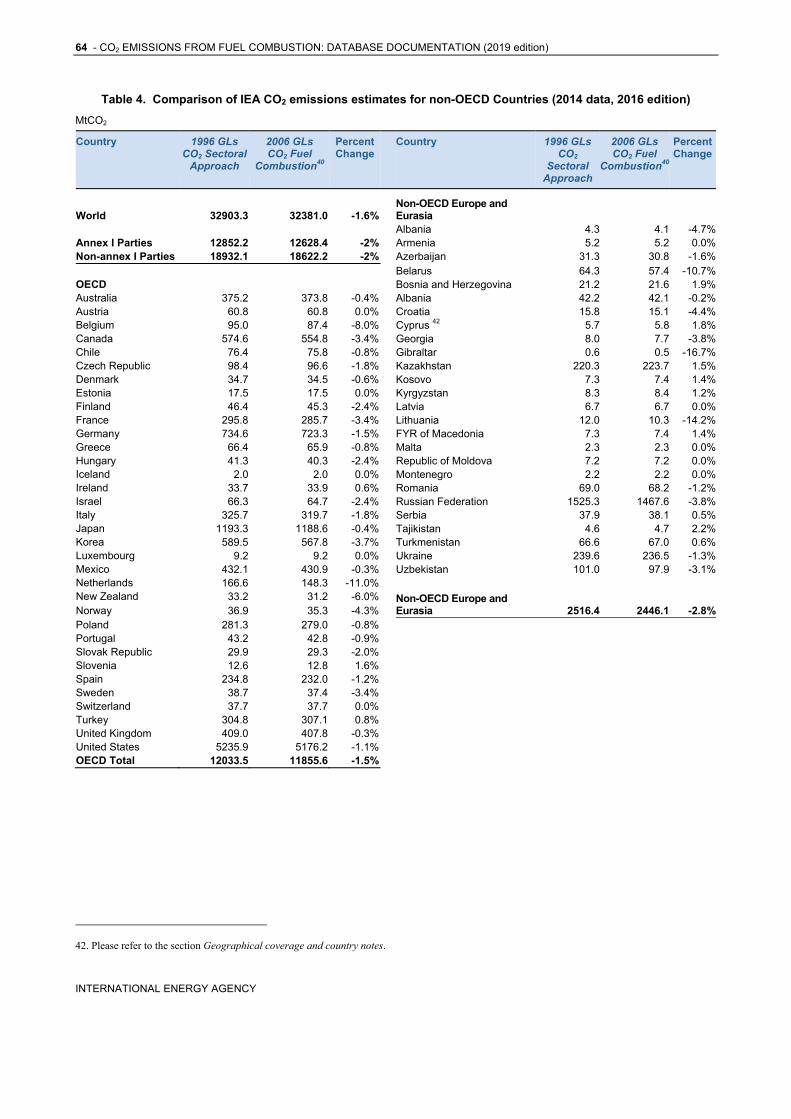
64 - CO2 EMISSIONS FROM FUEL COMBUSTION: DATABASE DOCUMENTATION (2019 edition)
INTERNATIONAL ENERGY AGENCY
Table 4. Comparison of IEA CO2 emissions estimates for non-OECD Countries (2014 data, 2016 edition)
MtCO2
Country 1996 GLs CO2 Sectoral
Approach
2006 GLs CO2 Fuel
Combustion40
Percent Change
Country 1996 GLs CO2
Sectoral Approach
2006 GLsCO2 Fuel
Combustion40
Percent Change
World 32903.3 32381.0 -1.6%Non-OECD Europe and Eurasia
Albania 4.3 4.1 -4.7%Annex I Parties 12852.2 12628.4 -2% Armenia 5.2 5.2 0.0%Non-annex I Parties 18932.1 18622.2 -2% Azerbaijan 31.3 30.8 -1.6% Belarus 64.3 57.4 -10.7%OECD Bosnia and Herzegovina 21.2 21.6 1.9%Australia 375.2 373.8 -0.4% Albania 42.2 42.1 -0.2%Austria 60.8 60.8 0.0% Croatia 15.8 15.1 -4.4%Belgium 95.0 87.4 -8.0% Cyprus 42 5.7 5.8 1.8%Canada 574.6 554.8 -3.4% Georgia 8.0 7.7 -3.8%Chile 76.4 75.8 -0.8% Gibraltar 0.6 0.5 -16.7%Czech Republic 98.4 96.6 -1.8% Kazakhstan 220.3 223.7 1.5%Denmark 34.7 34.5 -0.6% Kosovo 7.3 7.4 1.4%Estonia 17.5 17.5 0.0% Kyrgyzstan 8.3 8.4 1.2%Finland 46.4 45.3 -2.4% Latvia 6.7 6.7 0.0%France 295.8 285.7 -3.4% Lithuania 12.0 10.3 -14.2%Germany 734.6 723.3 -1.5% FYR of Macedonia 7.3 7.4 1.4%Greece 66.4 65.9 -0.8% Malta 2.3 2.3 0.0%Hungary 41.3 40.3 -2.4% Republic of Moldova 7.2 7.2 0.0%Iceland 2.0 2.0 0.0% Montenegro 2.2 2.2 0.0%Ireland 33.7 33.9 0.6% Romania 69.0 68.2 -1.2%Israel 66.3 64.7 -2.4% Russian Federation 1525.3 1467.6 -3.8%Italy 325.7 319.7 -1.8% Serbia 37.9 38.1 0.5%Japan 1193.3 1188.6 -0.4% Tajikistan 4.6 4.7 2.2%Korea 589.5 567.8 -3.7% Turkmenistan 66.6 67.0 0.6%Luxembourg 9.2 9.2 0.0% Ukraine 239.6 236.5 -1.3%Mexico 432.1 430.9 -0.3% Uzbekistan 101.0 97.9 -3.1%Netherlands 166.6 148.3 -11.0% New Zealand 33.2 31.2 -6.0% Non-OECD Europe and
Eurasia 2516.4 2446.1 -2.8%Norway 36.9 35.3 -4.3%Poland 281.3 279.0 -0.8% Portugal 43.2 42.8 -0.9% Slovak Republic 29.9 29.3 -2.0% Slovenia 12.6 12.8 1.6% Spain 234.8 232.0 -1.2% Sweden 38.7 37.4 -3.4% Switzerland 37.7 37.7 0.0% Turkey 304.8 307.1 0.8% United Kingdom 409.0 407.8 -0.3% United States 5235.9 5176.2 -1.1% OECD Total 12033.5 11855.6 -1.5%
42. Please refer to the section Geographical coverage and country notes.
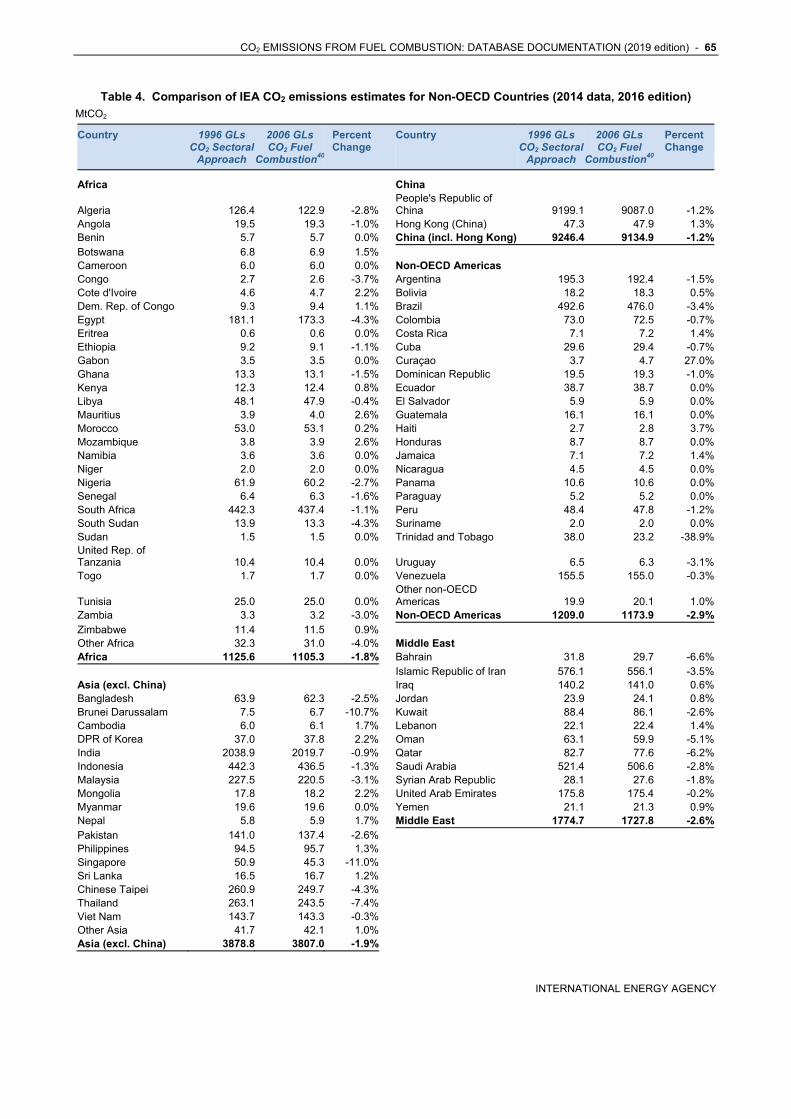
CO2 EMISSIONS FROM FUEL COMBUSTION: DATABASE DOCUMENTATION (2019 edition) - 65
INTERNATIONAL ENERGY AGENCY
Table 4. Comparison of IEA CO2 emissions estimates for Non-OECD Countries (2014 data, 2016 edition) MtCO2
Country 1996 GLs CO2 Sectoral
Approach
2006 GLs CO2 Fuel
Combustion40
Percent Change
Country 1996 GLs CO2 Sectoral
Approach
2006 GLs CO2 Fuel
Combustion40
Percent Change
Africa China
Algeria 126.4 122.9 -2.8%People's Republic of China 9199.1 9087.0 -1.2%
Angola 19.5 19.3 -1.0% Hong Kong (China) 47.3 47.9 1.3%Benin 5.7 5.7 0.0% China (incl. Hong Kong) 9246.4 9134.9 -1.2%Botswana 6.8 6.9 1.5% Cameroon 6.0 6.0 0.0% Non-OECD Americas Congo 2.7 2.6 -3.7% Argentina 195.3 192.4 -1.5%Cote d'Ivoire 4.6 4.7 2.2% Bolivia 18.2 18.3 0.5%Dem. Rep. of Congo 9.3 9.4 1.1% Brazil 492.6 476.0 -3.4%Egypt 181.1 173.3 -4.3% Colombia 73.0 72.5 -0.7%Eritrea 0.6 0.6 0.0% Costa Rica 7.1 7.2 1.4%Ethiopia 9.2 9.1 -1.1% Cuba 29.6 29.4 -0.7%Gabon 3.5 3.5 0.0% Curaçao 3.7 4.7 27.0%Ghana 13.3 13.1 -1.5% Dominican Republic 19.5 19.3 -1.0%Kenya 12.3 12.4 0.8% Ecuador 38.7 38.7 0.0%Libya 48.1 47.9 -0.4% El Salvador 5.9 5.9 0.0%Mauritius 3.9 4.0 2.6% Guatemala 16.1 16.1 0.0%Morocco 53.0 53.1 0.2% Haiti 2.7 2.8 3.7%Mozambique 3.8 3.9 2.6% Honduras 8.7 8.7 0.0%Namibia 3.6 3.6 0.0% Jamaica 7.1 7.2 1.4%Niger 2.0 2.0 0.0% Nicaragua 4.5 4.5 0.0%Nigeria 61.9 60.2 -2.7% Panama 10.6 10.6 0.0%Senegal 6.4 6.3 -1.6% Paraguay 5.2 5.2 0.0%South Africa 442.3 437.4 -1.1% Peru 48.4 47.8 -1.2%South Sudan 13.9 13.3 -4.3% Suriname 2.0 2.0 0.0%Sudan 1.5 1.5 0.0% Trinidad and Tobago 38.0 23.2 -38.9%United Rep. of Tanzania 10.4 10.4 0.0% Uruguay 6.5 6.3 -3.1%Togo 1.7 1.7 0.0% Venezuela 155.5 155.0 -0.3%
Tunisia 25.0 25.0 0.0%Other non-OECD Americas 19.9 20.1 1.0%
Zambia 3.3 3.2 -3.0% Non-OECD Americas 1209.0 1173.9 -2.9%Zimbabwe 11.4 11.5 0.9% Other Africa 32.3 31.0 -4.0% Middle East Africa 1125.6 1105.3 -1.8% Bahrain 31.8 29.7 -6.6% Islamic Republic of Iran 576.1 556.1 -3.5%Asia (excl. China) Iraq 140.2 141.0 0.6%Bangladesh 63.9 62.3 -2.5% Jordan 23.9 24.1 0.8%Brunei Darussalam 7.5 6.7 -10.7% Kuwait 88.4 86.1 -2.6%Cambodia 6.0 6.1 1.7% Lebanon 22.1 22.4 1.4%DPR of Korea 37.0 37.8 2.2% Oman 63.1 59.9 -5.1%India 2038.9 2019.7 -0.9% Qatar 82.7 77.6 -6.2%Indonesia 442.3 436.5 -1.3% Saudi Arabia 521.4 506.6 -2.8%Malaysia 227.5 220.5 -3.1% Syrian Arab Republic 28.1 27.6 -1.8%Mongolia 17.8 18.2 2.2% United Arab Emirates 175.8 175.4 -0.2%Myanmar 19.6 19.6 0.0% Yemen 21.1 21.3 0.9%Nepal 5.8 5.9 1.7% Middle East 1774.7 1727.8 -2.6%Pakistan 141.0 137.4 -2.6% Philippines 94.5 95.7 1.3% Singapore 50.9 45.3 -11.0% Sri Lanka 16.5 16.7 1.2% Chinese Taipei 260.9 249.7 -4.3% Thailand 263.1 243.5 -7.4% Viet Nam 143.7 143.3 -0.3% Other Asia 41.7 42.1 1.0% Asia (excl. China) 3878.8 3807.0 -1.9%
66 CO2 EMISSIONS FROM FUEL COMBUSTION: DATABASE DOCUMENTATION (2019 edition)
INTERNATIONAL ENERGY AGENCY
7. GHG EMISSIONS: SOURCES AND METHODS
CO2 emissions from fuel combustion represent the majority of anthropogenic GHG emissions. However, comprehensive analysis of emission trends considers other sources of CO2 as well as other gases, knowing that data on gases and sources other than CO2 from fuel combustion are much more uncertain. Country-specific estimates of CO2 from biomass burning and F-gas emissions are particularly difficult to ascertain.
To complement work regarding the emissions of CO2 from fuel combustion, the IEA also included EDGAR data on other CO2 sources and on five other greenhouse gases; methane (CH4), nitrous oxide (N2O) and the fluorinated gases (or “F-gases”) HFCs, PFCs and SF6, all gases addressed by the Kyoto Protocol.
The information for GHG emissions (with the exception of CO2 emissions from fuel combustion) has been provided by Monica Crippa and Diego Guizzardi from the Joint Research Centre (JRC) of the European Commission and Jos G.J. Olivier from the PBL Netherlands Environmental Assessment Agency, using the EDGAR database (version 4.3.2_FT2016 for CO2, version 5.0 for CH4 and N2O emissions and 4.2FT2010 for the F-gases) developed jointly by JRC and PBL.
In this edition, the global warming potentials (GWP-100) for the non-CO2 gases are taken from the IPCC Fourth Assessment Report and no longer from the second. The data in this dataset may differ from previous editions also due to changes in the methodology used for the accounting of large-scale biomass burning (including mainly savannah fires). Therefore, no complete estimates of the land use, land use change and forestry sector emissions are currently provided by the EDGAR database.
Please note that the GHG emissions totals presented here will differ from those shown in countries’ official national inventory submissions to the UNFCCC, primarily due to differences in coverage for the category Other. Differences may also occur due to differences in allocation, methodologies and underlying data sources for activities and emission factors, as specified in Part III. Details on possible differences between IEA and UNFCCC CO2 emissions from fuel combustion estimates can be found in Part I.
The information or GHG emissions (with the exception of CO2 emissions from fossil fuel combustion) has been provided by Monica Crippa, Diego Guizzardi and Jos G.J. Olivier based on the EDGAR version 4.3.2_FT2016 for CO2, version 4.4 for CH4 and N2O emissions and 4.2FT2010 for the F-gases. JRC and PBL are responsible for these datasets.
General note on EDGAR
The Emission Database for Global Atmospheric Re-search (EDGAR4) has been developed jointly by the European Commission’s Joint Research Centre (JRC) and the PBL Netherlands Environmental Assessment Agency and is hosted at edgar.jrc.ec.europa.eu. EDGAR v4.3.2 is providing global anthropogenic
CO2 EMISSIONS FROM FUEL COMBUSTION: DATABASE DOCUMENTATION (2019 edition) - 67
INTERNATIONAL ENERGY AGENCY
emissions of greenhouse gases CO2, CH4, N2O, HFCs, PFCs and SF6 and of precursor gases and air pollu-tants CO, NOx, NMVOC, SO2 and the aerosols PM10, PM2.5, BC, OC, per source category, both at country level as well as on a 0.1 x 0.1 grid online to its large community of users. EDGAR data are used for policy applications and scientific studies such as atmospheric modelling and were used for the Fifth Assessment Re-port of the Intergovernmental Panel on Climate Change (IPCC, 2014) (Working Group III).
Activity data were mostly taken from international statis-tics (checked for completeness and consistency and where required gap filled) and greenhouse gas emission factors were selected mostly from the 2006 IPCC Guide-lines for National Greenhouse Gas Inventories (IPCC, 2006) to ensure a consistent approach across countries and complete and consistent time series. It is stressed that the uncertainty in the resulting dataset at national level may be substantial, especially for methane and ni-trous oxide, and even more so for the F-gases (see Box 2 for more details). However, this dataset provides a sound basis for comparability with national emissions reports and other studies since the methods used are either IPCC methodologies or comparable to them (see below), glob-al totals are obtained in a transparent way and comply with budgets used in atmospheric studies, and the data were based on international information sources. For recent estimates of the GHG emissions, reports of Annex I countries to the UN Convention on Climate Change (UNFCCC) and the recent and significant impact of Clean Development Mechanism projects in developing countries to reduce CH4, N2O and HFC-23 emissions were taken into account. This applies to sources such as coal mines and landfills (CH4 recovery), nitric acid and adipic acid production (N2O) and the production of HCFC-22 (HFC-23).
The EDGAR v4.3.2 dataset covers 1970-2012 time-series for all sector-specific and country-specific totals of greenhouse gases. Thereto new activity data statistics (with updated and revised time series) were uploaded for energy-related emissions using IEA (2017), for agricul-ture related activities till 2015 using the latest FAO sta-tistics (FAOSTAT, 2018) and emission factors revised where appropriate. Although this dataset has been con-structed with great care, JRC and PBL do not accept any liability from use of the data provided in this report in-cluding any inaccuracies or omissions in the data provid-ed. For details on uncertainty and caveats identified in the dataset, as well as more detailed source category es-timates, we refer to Janssens-Maenhout et al. (2017a) and the EDGAR v4.3.2 website at http://edgar.jrc.ec.europa.eu/overview.php?v=432&SECURE=123. Note that estimates for other more recent years than
2012 are also made publicly available through this website. Most recent trends for CO2 emissions through 2016 are discussed in Olivier et al. (2017) and Janssens-Maenhout et al. (2017b).
Box 1: Uncertainty in greenhouse gas emissions.
When considering comparative shares and trends in greenhouse-gas emissions, data on gases and sources other than CO2 from fuel combustion are much more uncertain. Country-specific estimates of CO2 from bio-mass burning and F-gas emissions are particularly diffi-cult to ascertain. The uncertainty in these emissions is caused by the limited accuracy of international activity data used and in particular of emission factors selected for calculating emissions on a country level (Olivier, 2002; Olivier et al., 2005). For a detailed evaluation of emission uncertainties using international statistics and IPCC and other emission factors we refer to the 2006 IPCC Guidelines (2006), and for comparisons between countries and datasets to Olivier et al (2005, 2010, 2015).
For global total anthropogenic CO2 emissions the cal-culated uncertainty in the total ranges from about ‐10% to +10%, including large-scale biomass burning. For global emissions of CH4, N2O and the F‐gases uncertainty estimates of 25%, 30% and 20%, respec-tively, were assumed based on default uncertainty es-timates for the 2006 IPCC methodologies (IPCC, 2006), which correspond with emissions estimates inferred from atmospheric concentration measure-ments (UNEP, 2012).
When considering emission shares and trends of countries one should note that:
CO2: Fossil fuel combustion, which is often the larg-est source of CO2 in a country, is estimated to have an uncertainty of about 5% (95% confidence inter-val) for OECD countries. However, for many non-OECD countries the uncertainty is estimated at about 10%. This is often regarded as the most accurate source of GHG emissions.
CH4: Uncertainties are particularly large for methane emissions from fugitive sources (coal mining and from oil and gas production and transmission) and from landfills and wastewater.
N2O: Uncertainties of most N2O sources are very large, e.g. the uncertainty for agricultural sources may sometimes exceed 100%.
F-gases: Uncertainties in annual emissions of most sources of F-gases are very large, e.g. at a country level they may well exceed 100%. Therefore, the fig-ures provided for individual countries should be con-sidered solely as order-of-magnitude estimates.
68 CO2 EMISSIONS FROM FUEL COMBUSTION: DATABASE DOCUMENTATION (2019 edition)
INTERNATIONAL ENERGY AGENCY
Source definitions
The source definitions for Fuel combustion refer to the categories and codes used in the 2006 IPCC guide-lines, Chapter 8 of Vol. 1: General guidance and reporting (IPCC, 2006). For other categories and codes the definitions refer to the Revised 1996 IPCC guidelines, Chapter 1 of Vol. 1: Reporting instructions (IPCC, 1996).
Note that the IPCC guidelines are sometimes ambigu-ous in where to report emissions from particular sources e.g when reporting to the UNFCCC, coun-tries may opt to report CO2 emissions from integrated steel plants (including coke ovens and blast furnaces), wholly under IPCC Source/Sink Category 1A, or also under 1B1 and 2C.
For carbon dioxide:
Fuel combustion refers to fossil fuel combustion only. Emissions have been estimated by the IEA using the methodology as described in the section IEA esti-mates: Changes under the 2006 IPCC Guidelines in Part I. (2006 IPCC Source/Sink Category 1A)
Fugitive refers mainly to flaring of associated gas in oil and gas production (in some cases including indi-rect CO2 from methane venting) (IPCC Source/Sink Category 1B).
Industrial Processes refer to production of cement, lime, soda ash, carbides, ammonia, methanol, ethylene and other chemicals, metals and to the use of soda ash, limestone and dolomite, and non-energy use of lubricants and waxes. Emissions exclude Fuel com-bustion emissions. (IPCC Source/Sink Category 2).
Other CO2 emissions refer to direct emissions from solvent use (IPCC Source/Sink Category 3), from ap-plication of urea and agricultural lime (IPCC Source/Sink Category 4) and from fossil fuel fires (coal fires & the Kuwait oil fires) (IPCC Source/Sink Category 7). It does not include the significant amount of large scale biomass burning emissions, as these are part of the land use, land-use change and forestry sector, for which a different methodology and use of satellite is required.
For methane:
Energy comprises production, handling, transmission and combustion of fossil fuels and biofuels (IPCC Source/Sink Categories 1A and 1B).
Agriculture comprises enteric fermentation, rice production, manure management, agricultural waste burning (non-energy, on-site) and savannah burning (IPCC Source/Sink Category 4).
Waste comprises landfills, wastewater treatment, wastewater disposal and waste incineration (non-energy) (IPCC Source/Sink Category 6).
Other includes industrial process emissions e.g. methanol production, and forest and peat fires and other vegetation fires (IPCC Source/Sink Categories 2 and 5).
For nitrous oxide:
Energy comprises combustion of fossil fuels and bio-fuels (IPCC Source/Sink Categories 1A and 1B).
Agriculture comprises fertiliser use (synthetic and manure), animal waste (manure) management, agricultural waste burning (non-energy, on-site) and savannah burning (IPCC Source/Sink Category 4).
Industrial Processes comprise non-combustion emissions from manufacturing of adipic acid, nitric acid, caprolactam and glyoxal (IPCC Source/Sink Category 2).
Other includes N2O usage, forest and peat fires (including post-burn decay emissions from remaining biomass) and other vegetation fires, human sewage discharge and waste incineration (non-energy) and indirect N2O from atmospheric deposition of NOx and NH3 from non-agricultural sources (IPCC Source/Sink Categories 3, 5, 6 and 7).
For fluorinated gases:
HFC emissions comprise by-product emissions of HFC-23 from HCFC-22 manufacture and the use of HFCs (IPCC Source/Sink Categories 2E and 2F).
PFC emissions comprise by-product emissions of CF4 and C2F6 from primary aluminium production and the use of PFCs, in particular for the manufacture of sem-iconductors, flat panel displays and photovoltaic cells) (IPCC Source/Sink Categories 2C, 2E and 2F). SF6 emissions stem from various sources of SF6 use (mainly manufacturing of Gas Insulated Switchgear (GIS) used in the electricity distribution networks) (IPCC Source/Sink Categories 2C and 2F) and from SF6 production (Category 2E).
CO2 EMISSIONS FROM FUEL COMBUSTION: DATABASE DOCUMENTATION (2019 edition) - 69
INTERNATIONAL ENERGY AGENCY
Data sources and methodology for EDGAR v4.3.2 FT2016 and EDGAR v4.2FT2010
The EDGAR v4.2FT2010 has been available online since October 201343 and EDGAR v4.3.2_FT2016 since July 201744. For greenhouse gases, the default emission factors from the 2006 IPCC Guidelines (IPCC, 2006) were used, except for CH4 and N2O from road transport where technology-specific factors were used from the EMEP-EEA emission inventory guidebook (EEA, 2009).
The EDGAR v4.3.2_FT2016 dataset covers the entire period 1970-2016 and is largely based on IEA(2014) energy statistics and FAOSTAT (2018) agriculture statistics. The EDGAR v4.3.2_FT2016 dataset was used in this publication as data input for the CO2 emissions for Fugitives and Industrial Processes, the CH4 emissions and the N2O emissions. Updated activ-ity data using the latest FAO statistics for agriculture (FAOSTAT, 2018) were included to estimate CH4 and N2O emissions from agriculture. The emissions of the F-gases are taken from the EDGAR v4.2FT2010 da-taset. The methods, data sources and emission factors used for this new dataset are documented in Janssens-Maenhout et al. (2017a,b). For the documentation of the EDGAR v4.2FT2010 dataset we refer to a previ-ous publication of this report (part III) in 2015.
References
EEA (2009). EMEP-EEA emission inventory guidebook – 2009, European Environment Agency. Internet: www.eea.europa.eu/publications.
FAOSTAT: Statistics Division of the Food Agricultural Organisation (FAO), 2018. http://www.fao.org/statistics/en/
IEA (2012, 2014). Energy Statistics of OECD and Non-OECD Countries. On-line data service. Internet: data.iea.org.
43. See http://edgar.jrc.ec.europa.eu/overview.php?v=42FT2010 44. See http://edgar.jrc.ec.europa.eu/overview.php?v=432&SECURE=123
World Energy Statistics (2017 edition)", IEA 2017. On-line data service: http://data.iea.org/payment/products/118-world-energy-statistics-2018-edition.aspx
IPCC (1996). Revised 1996 IPCC Guidelines for National Greenhouse Gas Inventories IPCC/OECD/ IEA, Paris.
IPCC (2006). 2006 IPCC Guidelines for National Greenhouse Gas Inventories. Eggleston, S., Buendia, L., Miwa, K., Ngara, T., Tanabe, K. (eds.). IPCC-TSU NGGIP, IGES, Japan. Internet: www.ipcc-nggip.iges.or.jp/public/2006gl/index.html.
IPCC, 2007: Climate Change 2007: Synthesis Report. Contribution of Working Groups I, II and III to the Fourth Assessment Report of the Intergovernmental Panel on Climate Change [Core Writing Team, Pachauri, R.K and Reisinger, A. (eds.)]. IPCC, Geneva, Switzerland, 104 pp
IPCC (2014). Climate Change 2014: Mitigation. Contribution of Working Group III to the Fifth Assessment Report of the Intergovernmental Panel on Climate Change [ Edenhofer, O., R. Pichs-Madruga, Y. Sokona, E. Farahani, S. Kadner, K. Seyboth, A. Adler, I. Baum, S. Brunner, P. Eickemeier, B. Kriemann, J. Savolainen, S. Schlömer, C. von Stechow, T. Zwickel and J.C. Minx (eds.)], Cambridge
University Press, Cambridge, United Kingdom and New York, NY. Internet: www.ipcc.ch/report/ar5/wg3/ .
Janssens-Maenhout, G., Crippa, M., Guizzardi, D., Muntean, M., Schaaf, E., Dentener, F., Bergamaschi, P., Pagliari, V., Olivier, J.G.J., Peters, J.A.H.W., van Aardenne, J.A., Monni, S., Doering, U., Petrescu, A.M.R. (2017a). EDGARv4.3.2 Global Atlas of the three major Greenhouse Gas Emissions for the period 1970-2012, Earth Syst. Sci. Data Discuss., https://doi.org/10.5194/essd-2017-79, in review, 2017a
G. Janssens-Maenhout, G., M. Crippa, D. Guizzardi, M. Muntean, E. Schaaf,, J.G.J. Olivier, J.A.H.W. Peters, K.M. Schure, (2017b). CO2 and GHG emissions of all world countries, Joint Research Centre Report, European Union, Luxembourg, 2017b, PUBSY No. 107877
JRC/PBL (2013). EDGAR version 4.2FT2010. Joint Research Centre/PBL Netherlands Environmental Assessment Agency. Internet: http://edgar.jrc.ec.europa.eu/overview.php?v=42FT2010
70 CO2 EMISSIONS FROM FUEL COMBUSTION: DATABASE DOCUMENTATION (2019 edition)
INTERNATIONAL ENERGY AGENCY
JRC/PBL (2017). EDGAR version 4.3.2. Joint Research Centre/PBL Netherlands Environmental Assessment Agency, Internet: http://edgar.jrc.ec.europa.eu/overview.php?v=432&SECURE=123
Olivier, J.G.J. (2002). On the Quality of Global Emission Inventories, Approaches, Methodologies, Input Data and Uncertainties, Thesis Utrecht University, Utrecht, ISBN 90 393 3103 0. Internet: www.library.uu.nl/digiarchief/dip/diss/2002-1025- 131210/inhoud.htm.
Olivier, J.G.J., J.A. Van Aardenne, F. Dentener, V. Pagliari, L.N. Ganzeveld and J.A.H.W. Peters (2005). Recent trends in global greenhouse gas emissions: regional trends 1970-2000 and spatial distribution of key sources in 2000. Environm. Sc., 2 (2-3), 81-99. DOI: 10.1080/15693430500400345.
Olivier, J.G.J., J.A. van Aardenne, S. Monni, U.M. Döring, J.A.H.W. Peters and G. Janssens-Maenhout (2010). Application of the IPCC uncertainty methods to EDGAR 4.1 global greenhouse gas inventories. In: “3rd International Workshop on Uncertainty in Greenhouse Gas Inventories, 22–24 September, 2010”. Proceedings. Lviv Polytechnic National University, Lviv, Ukraine. ISBN: 978-966-8460-81-4, p. 219-226. Internet: http://bit.ly/1FHB0Wt .
Olivier, J.G.J., G. Janssens-Maenhout, M. Muntean and J.A.H.W. Peters (2016). Trends in global CO2 emissions. 2016 report.
Olivier, J.G.J., Schure, K.M., Peters, J.A.H.W. (2017) Trends in global CO2 and total GHG emissions, 2017 report, PBL No. 2983, 2017 forthcoming.
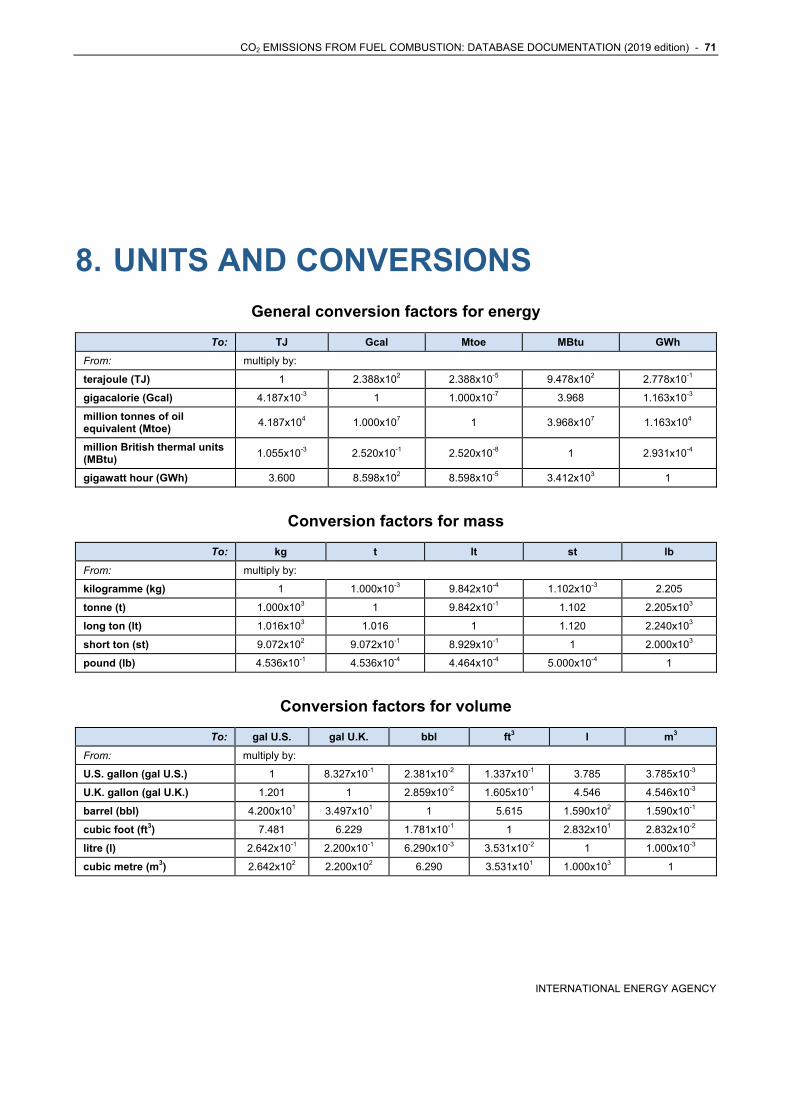
CO2 EMISSIONS FROM FUEL COMBUSTION: DATABASE DOCUMENTATION (2019 edition) - 71
INTERNATIONAL ENERGY AGENCY
8. UNITS AND CONVERSIONS
General conversion factors for energy
To: TJ Gcal Mtoe MBtu GWh
From: multiply by:
terajoule (TJ) 1 2.388x10² 2.388x10⁻⁵ 9.478x10² 2.778x10⁻¹
gigacalorie (Gcal) 4.187x10⁻³ 1 1.000x10⁻⁷ 3.968 1.163x10⁻³
million tonnes of oil equivalent (Mtoe)
4.187x10⁴ 1.000x10⁷ 1 3.968x10⁷ 1.163x10⁴
million British thermal units (MBtu)
1.055x10⁻³ 2.520x10⁻¹ 2.520x10⁻⁸ 1 2.931x10⁻⁴
gigawatt hour (GWh) 3.600 8.598x10² 8.598x10⁻⁵ 3.412x10³ 1
Conversion factors for mass
To: kg t lt st lb
From: multiply by:
kilogramme (kg) 1 1.000x10⁻³ 9.842x10⁻⁴ 1.102x10⁻³ 2.205
tonne (t) 1.000x10³ 1 9.842x10⁻¹ 1.102 2.205x10³
long ton (lt) 1.016x10³ 1.016 1 1.120 2.240x10³
short ton (st) 9.072x10² 9.072x10⁻¹ 8.929x10⁻¹ 1 2.000x10³
pound (lb) 4.536x10⁻¹ 4.536x10⁻⁴ 4.464x10⁻⁴ 5.000x10⁻⁴ 1
Conversion factors for volume
To: gal U.S. gal U.K. bbl ft3 l m3
From: multiply by:
U.S. gallon (gal U.S.) 1 8.327x10⁻¹ 2.381x10⁻² 1.337x10⁻¹ 3.785 3.785x10⁻³
U.K. gallon (gal U.K.) 1.201 1 2.859x10⁻² 1.605x10⁻¹ 4.546 4.546x10⁻³
barrel (bbl) 4.200x101 3.497x101 1 5.615 1.590x10² 1.590x10⁻¹
cubic foot (ft3) 7.481 6.229 1.781x10⁻¹ 1 2.832x101 2.832x10⁻²
litre (l) 2.642x10⁻¹ 2.200x10⁻¹ 6.290x10⁻³ 3.531x10⁻² 1 1.000x10⁻³
cubic metre (m3) 2.642x10² 2.200x10² 6.290 3.531x101 1.000x10³ 1
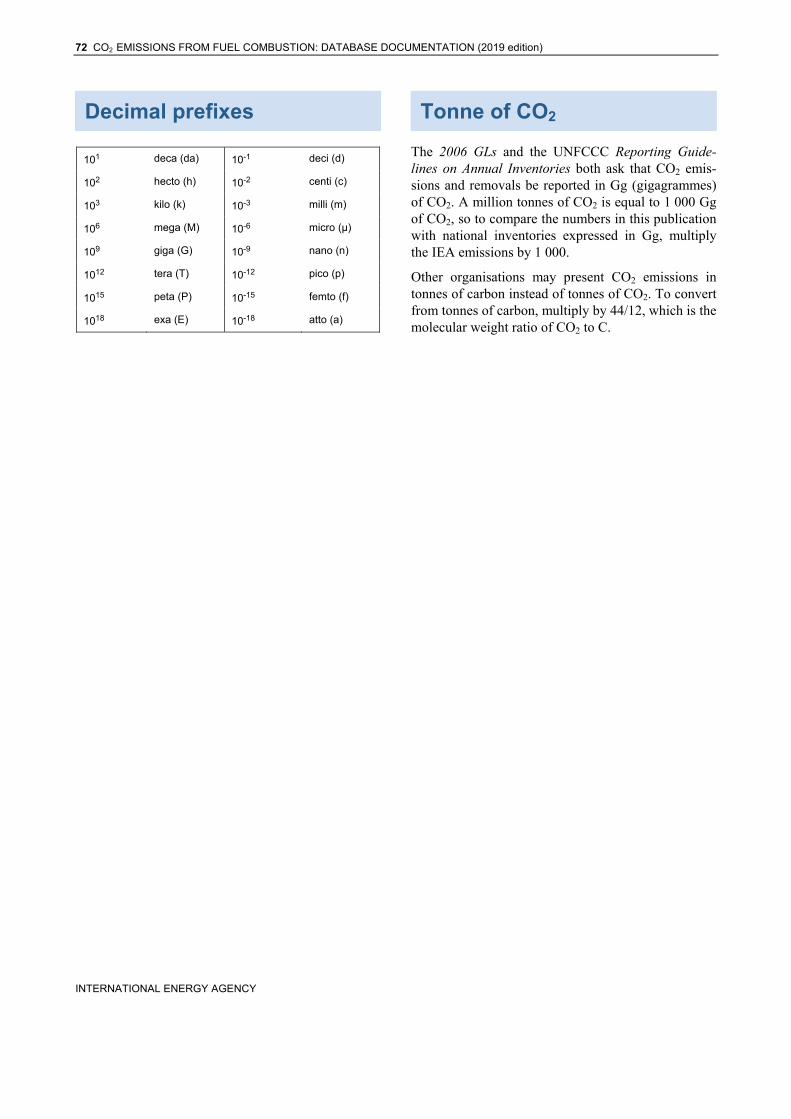
72 CO2 EMISSIONS FROM FUEL COMBUSTION: DATABASE DOCUMENTATION (2019 edition)
INTERNATIONAL ENERGY AGENCY
Decimal prefixes
101 deca (da) 10-1 deci (d)
102 hecto (h) 10-2 centi (c)
103 kilo (k) 10-3 milli (m)
106 mega (M) 10-6 micro (µ)
109 giga (G) 10-9 nano (n)
1012 tera (T) 10-12 pico (p)
1015 peta (P) 10-15 femto (f)
1018 exa (E) 10-18 atto (a)
Tonne of CO2
The 2006 GLs and the UNFCCC Reporting Guide-lines on Annual Inventories both ask that CO2 emis-sions and removals be reported in Gg (gigagrammes) of CO2. A million tonnes of CO2 is equal to 1 000 Gg of CO2, so to compare the numbers in this publication with national inventories expressed in Gg, multiply the IEA emissions by 1 000.
Other organisations may present CO2 emissions in tonnes of carbon instead of tonnes of CO2. To convert from tonnes of carbon, multiply by 44/12, which is the molecular weight ratio of CO2 to C.
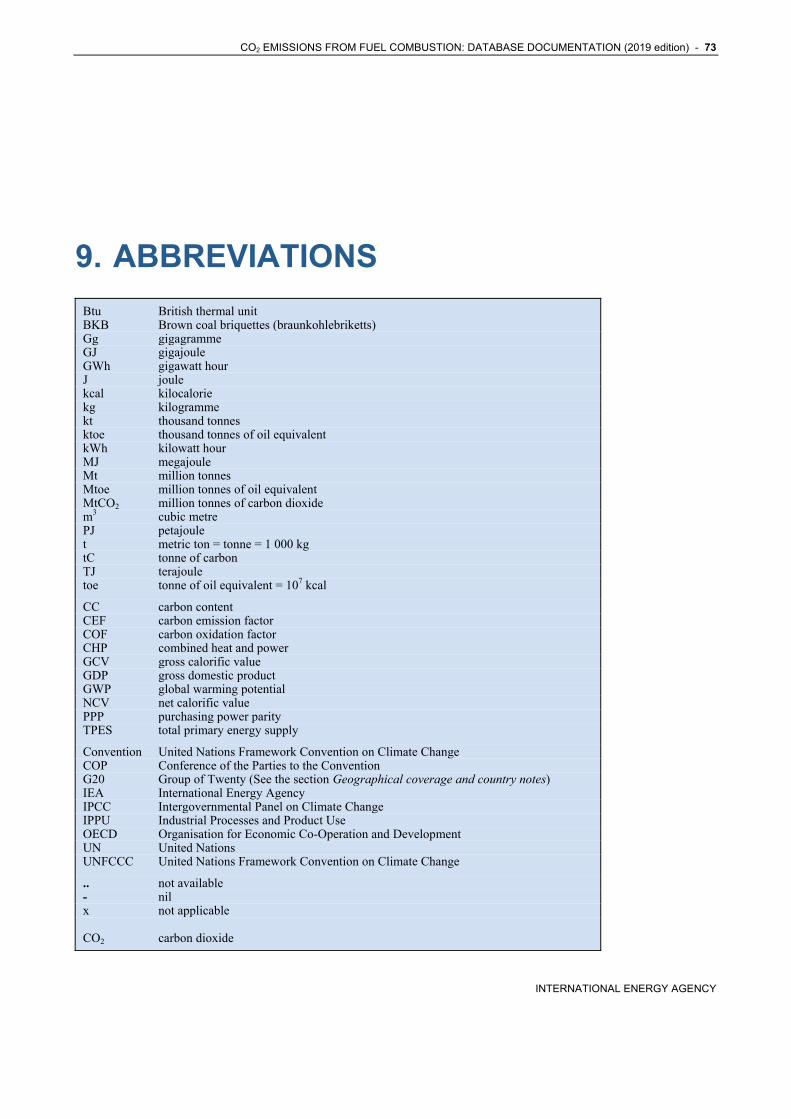
CO2 EMISSIONS FROM FUEL COMBUSTION: DATABASE DOCUMENTATION (2019 edition) - 73
INTERNATIONAL ENERGY AGENCY
9. ABBREVIATIONS
Btu British thermal unit BKB Brown coal briquettes (braunkohlebriketts) Gg gigagramme GJ gigajoule GWh gigawatt hour J joule kcal kilocalorie kg kilogramme kt thousand tonnes ktoe thousand tonnes of oil equivalent kWh kilowatt hour MJ megajoule Mt million tonnes Mtoe million tonnes of oil equivalent MtCO2 million tonnes of carbon dioxide m3 cubic metre PJ petajoule t metric ton = tonne = 1 000 kg tC tonne of carbon TJ terajoule toe tonne of oil equivalent = 107 kcal
CC carbon content CEF carbon emission factor COF carbon oxidation factor CHP combined heat and power GCV gross calorific value GDP gross domestic product GWP global warming potential NCV net calorific value PPP purchasing power parity TPES total primary energy supply
Convention United Nations Framework Convention on Climate Change COP Conference of the Parties to the Convention G20 Group of Twenty (See the section Geographical coverage and country notes) IEA International Energy Agency IPCC Intergovernmental Panel on Climate Change IPPU Industrial Processes and Product Use OECD Organisation for Economic Co-Operation and Development UN United Nations UNFCCC United Nations Framework Convention on Climate Change
.. not available - nil x not applicable CO2 carbon dioxide