
CO2 Disposal Study - Alberta Innovates
121
it= OIL SANDS TECHNOLOGY • AND RESEARCH AUTHORITY CO2 Disposal Study Volume 1.0 Summary Report AOSTRA April 1993
Transcript of CO2 Disposal Study - Alberta Innovates
it= OIL SANDS TECHNOLOGY •
AND RESEARCH AUTHORITY
CO2 Disposal Study
Volume 1.0 Summary Report AOSTRA
April 1993

to •OIL SANDS TECHNOLOGY•
AND RESEARCH AUTHORITY
AOSTRA DISCLAIMER
(403) 297-3380 • Fax (403)•297-3638 18th Floor, McFarlane Tower • 700 - Fourth Avenue•S.W.
• Calgary, Alberta, Canada • T2P 3J4
The technical information and data presented in the following volumes:
Volume 1 Operators Summary Report Volume 2 • CO2 Capture - Design and Estimates
Volume 3 Reservoir Studies Volume 4 - Field Facilities - Design and Estimates Volume 5 Economic Analysis
• is the property of the Alberta Oil Sands Technology and Research Authority (AOSTRA) and shall be• held confidential by the recipient.
• AOSTRA does not warrant the contents of the report and neither does it warrant the usefulness for any particular purpose of any of the technical information and data therein contained.

,
S31
1111
0A A
O a
ll
•
•
•
• LIST OF VOLUMES
Volume 1.0 Summary Report AOSTRA
Volume 2.0 CO2 Capture - Design and Estimates SNC Inc.
Volume 3.0 Reservoir Studies TCA Reservoir Engineering Services Inc.
Volume 4.0 Field Facilities - Design and Estimates Optima Engineering and Constructors Inc.
Volume 5.0 Economic Analysis AOSTRA •
•
• Volume 1.0 - Summary Report
AOSTRA
Volume Contents
1.0 Summary and Conclusions
2.0 Recommendations
3.0 Introduction
4.0 CO2 Sources
5.0 CO2 Capture
6.0 Enhanced Oil Recovery
7.0 Field Facilities
8.0 Economics
9.0 References
6 Appendix
A. IGCC power plant

Volume 2.0 - CO2 Capture - Design and Estimates SNC
Volume Contents
1.0
2.0
3.0
4.0
Executive Summary
Introduction
General Case Descriptions
Observations and Recommendations
5.0 Case 1 Saskatchewan Coal - Boundary Dam
6.0 Case la Carbon Dioxide Pipeline System
7.0 Case 2 Alberta Coal - Sundance Power Plant
8.0 Case 3 Natural Gas Combustion - AGEC, Joffre
9.0 Case 3a Natural Gas Combustion - Small Scale Flue Gas Case
10.0 Case 4a Sour Gas, Hanlan Ro6b - Shutdown Existing Amine Unit
11.0 Case 4b Sour Gas, Hanlan Robb - Using Existing Amine Unit
12.0 Case 5 Bi-provincial Upgrader
13.0 Case 6 Argonne Process - Sundance Power Plant
•

• Volume 3.0 - Reservoir Studies TCA Reservoir Engineering Services Inc.
Volume Contents
1 Summary Report
2 North Elswick
3 Husky Oil Aberfeldy
4 Mobil Oil Canada 'A Pool Carson Creek Gas Pool
5 Carson Creek North Beaverhill Lake
6 Redwater D-3 Pool
7 Mobil Pembina NPCU #1
8 Amoco Pembina 'A' Lease
9 Esso's Pembina Units: Cynthia Cardium
• (Unit #3) and Berrymoor (Unit #10)

• Volume 4.0 - Field Facilities - Design and Estimates
Optima Engineering and Constructors Inc.
Volume Contents
1.0 Executive Summary
2.0 Summary of Cases
3.0 Estimate Method
4.0 Elswick - Westcoast Petroleum
5.0 Carson Creek North - Mobil Oil Canada
6.0 Redwater - Imperial Oil Resources
7.0 Aberfeldy - Husky Oil
8.0 Carson Creek Gas - Mobil Oil Canada
9.0 Pembina Conglomerate
10.0 Pembina Sandstone, Amoco A and Berrymoor
Appendix
A List of Modules for all Cases
B Facilities Design Data (AOSTRA)
C Materials Selection
D Areas for Optimization
•
0 Volume 5.0 - Economic Analysis AOSTRA
Volume Contents
1.0 Executive Summary
2.0 Introduction
3.0 Definition of Base Cases
4.0 Methodology of Economic Analysis
5.0 Field Data Analysis
6.0 Review of CO2 Sinks
7.0 Economic Analysis
Appendix
A1 Field Data Summaries
A2 CO2 Sinks - Backup Information
A3 CO2 Sources - Case Study Outputs
A4 CO2 Pipelines - Case Study Outputs
A5 EOR Fields - Case Study Outputs
A6 Depleted Gas Reservoirs - Case Study Outputs
•

SIN
31N
O3
JO
31
9V
.L
i
•

• TABLE OF CONTENTS Page
1.0 Summary and Conclusions 1 1.1 CO2 Capture 1 1.2 CO2 Disposal in Hydrocarbon Reservoirs 4 1.3 EOR Field Facilities 6 1.4 Economics 7 1.5 Issues 10
2.0 Recommendations
13 2.1 General
13 2.2 Specific 13
3.0 Introduction 3.1 Background 3.2 Project Initiation 3.3 Committees 3.4 Scope of Work
4.0 CO2 Sources
14 14 16 18 18
23
Enhanced Oil Recovery 49 6.1 Introduction 49 6.2 Reservoir Analyses 58 6.3 Conclusions 65
Field Facilities 69
Economics 76 8.1 Introduction and Background 76 8.2 Review of Results 77 8.3 Concluding Remarks 88
References 91
Appendix IGCC Power Plant
• 5.0 CO2 Capture
5.1 Conditioning 5.2 Capture Processes 5.3 Compression and Purification
5.4 Gross and Net CO2 Capture
5.5 Pipeline Transportation
6.0
7.0
8.0
9.0
'it
t45
•
• List of Figures
Page Figure 1.1 Selected CO2 Sources 1 Figure 1.2 Normalized Capital Cost 2 Figure 1.3 CO2 Capture Gross and Net 3 Figure 1.4 CO2 Storage Over a 15 Year Period 5 Figure 1.5 Economics of CO2 Disposal in Alberta 8 Figure 1.6 Economics of CO2 Disposal in Saskatchewan 9 Figure 4.1 Carbon Dioxide Emissions 23 Figure 5.1 CO2 Capture Process 34 Figure 5.2 Normalized Capital Cost 36 Figure 5.3 Amine Gas Treatment 38 Figure 5.4 Case 4A Two Stage Selexol Gas Treatment 41 Figure 5.5 Case 4B Utilize Existing Amine Gas Treatment 42 Figure 5.6 CO2 Capture Gross and Net 46 Figure 5.7 Pipeline Systems 47 Figure 5.8 CO2 Transportation 48 Figure 6.1 Break Down of CO2 Disposal Over a 15 Year Period 68 Figure 7.1 Conceptual Flow Diagram for Field Facilities
Studies 71 Figure 8.1 Break Down of CO2 Disposal Over a 15 Year Period 78
110 Figure 8.2A Alberta CO2 Sources and EOR Fields - Summary
of Economic Analysis Based on 10% Social Approach. 83
Figure 8.2B Alberta CO2 Sources and EOR Fields - Summary of Economic Analysis Based on Normal Business Approach. 83
Figure 8.3A Saskatchewan CO2 Sources and EOR Fields - Summary of Economic Analysis Based on Social Approach. 84
Figure 8.3B Saskatchewan CO2 Sources and EOR Fields - Summary of Economic Analysis Based on Normal Business Approach. 84
Figure 8.4A Saskatchewan CO2 Sources and EOR Fields - Summary of Economic Analysis Based on Social Approach. 85
Figure 8.4B Saskatchewan CO2 Sources and EOR Fields - Summary of Economic Analysis Based on Normal Business Approach. • 85
Figure 8.5 1992 Oil Price Profiles 82 Figure 8.6A Delivered Cost vs. Affordable Price for CO2
Disposal in Alberta. (Based on 10% Social Approach). 89
Figure 8.6B Delivered Cost vs. Affordable Price for CO2 Disposal In Alberta. (Based on Normal Business Approach). 89
Figure 8.7A
Figure 8.7B
Delivered Costs vs. Affordable Price For CO2 Disposal in Saskatchewan. (Economics Based on Social Approach). Delivered Costs vs. Affordable Price for CO2 Disposal In Saskatchewan. (Based on Normal Business Approach).
Page
90
90
•
•

EBS
S5
t33
73 75
List of Tables
Page
Table 3.1 Table 3.2 Table 3.3 Table 4.1
Table 4.2 Table 5.1 Table 6.1 Table 6.2 Table 6.3 Table 7.1 Table 7.2
Table 7.3
Study Participants 17 Scope of Work Summary 20 Overall Project Budget 22 Summary of Major CO2 Sources Reviewed by the Committee Facilities Selected for Case Studies Sundance Power Plant Options Geological Characteristics of Reservoirs Studied Enhanced Oil Recovery Data Input Parameters Enhanced Oil Recovery Study Results Field Facility Study Reservoir Design Estimate Parameters for Field Facility Studies Field Facility Studies Cost Summary

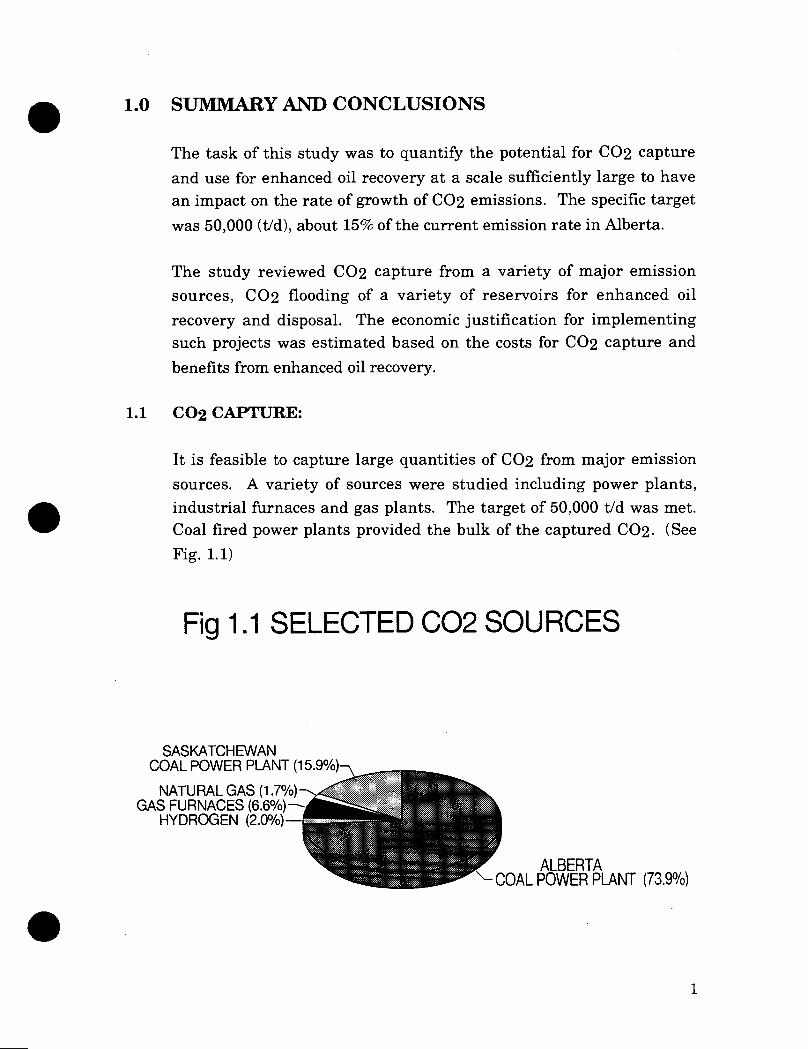
SASKATCHEWAN COAL POWER PLANT (15.9%)
NATURAL GAS (1 :7%) GAS FURNACES (6.6%)
HYDROGEN (2.0%)—
ALBERTA \— COAL POWER PLANT (73.9%)
•
•
1.0 SUMMARY AND CONCLUSIONS
The task of this study was to quantify the potential for CO2 capture
and use for enhanced oil recovery at a scale sufficiently large to have an impact on the rate of growth of CO2 emissions. The specific target
was 50,000 (t/d), about 15% of the current emission rate in Alberta.
The study reviewed CO2 capture from a variety of major emission sources, CO2 flooding of a variety of reservoirs for enhanced oil
recovery and disposal. The economic justification for implementing such projects was estimated based on the costs for CO2 capture and
benefits from enhanced oil recovery.
1.1 CO2 CAPTURE:
It is feasible to capture large quantities of CO2 from major emission
sources. A variety of sources were studied including power plants, industrial furnaces and gas plants. The target of 50,000 t/d was met. Coal fired power plants provided the bulk of the captured CO2. (See
Fig. 1.1)
Fig 1.1 SELECTED 002 SOURCES
• 1

MI CONDITIONING RE CAPTURE um COMPRESSION
500-• 450-"-
400-P cc ui< 350-/
O
-
0 250-'.
LLI z 200-/. 0 150-4-
100-/' 50-"'
0 Sask Alta Fuel Gas Raw Gas H2 02 IGCC
COAL NATURAL GAS OTHERS
A variety of capture processes were selected for the study depending on the CO2 purity, concentration, and pressure of the source stream.
Chemical absorption using amine (MEA) was the dominant process for capturing CO2 from flue gas streams. This process is used
commercially in many natural gas plants and has been demonstrated for CO2 removal from flue gas.
For the cases studied the cost of CO2 capture is high. It ranges from
$40 to $76/tonne ($2 to $4/mscf) depending on the capture source, process and the economic parameters. The capital costs are high totaling $3.8 billion for the selected sites capturing 50,685 t/d CO2.
The operating costs totaled $0.5 billion/year. For a consistent set of economic parameters, the cost variation between cases was not large except for Case 3A, the small scale gas fired furnaces, which is high and Case 7 the hypothetical IGCC Power Plant, which is low. Otherwise the benefits of higher purity and concentration in the small scale cases were offset by the economies of scale for the large scale cases. In spite of the need for flue gas conditioning, the coal fired power plants offered the lowest CO2 capture costs.
Fig 12 NORMALIZED CAPITAL COST
• o
•
2

150
50
Sask Alta Fuel Raw Gas H2 02 IGCC COAL NATURAL GAS OTHERS
GROSS MI UTILITIES I NET
• Capture and compression of CO2 are energy intensive processes
resulting in high CO2 emissions from the utilities required to drive the
processes. The steam and electricity requirements for the capture and compression results in CO2 emissions ranging from 30% to 45% of the
quantity of CO2 captured. The gross CO2 captured is the amount of CO2 captured and delivered to the oil field. The net CO2 captured is the measure of CO2 emission reduction. The net CO2 is the gross CO2 less the CO2 emitted to drive the processes. Even with capture efficiencies of 90% the typical net CO2 reduction in emissions is 50% to 60% of the CO2 available for capture. The gross CO2 may be the basic parameter for capture and enhanced oil recovery, but the net CO2
determines the environmental effect, the impact of the rate of growth of CO2 emissions.
Fig 1.3 002 CAPTURE GROSS & NET •
• 3

A 600km pipeline network is required to transport the CO2 from the
capture sources to the oil fields. Pipe sizes range from 6" to 28" nominal diameter. The CO2 is transported as a dense phase supercritical fluid at 14 MPa (2000 psi). In this state, CO2 is like a
liquid in density and a gas in viscosity.
Although the total capital cost for the pipeline system is $215 million the volume of flow is large. The unit pipeline transportation costs are low relative to the cost of capture. The costs, including operation costs and capital charges, averaged $2/t ($0.10/mscf) for the Alberta network and $0.58 to $0.76/t ($0.02 to $0.04/mscf) for the shorter lines in
Saskatchewan.
1.2 CO2 DISPOSAL IN HYDROCARBON RESERVOIRS
It is feasible to dispose of the target quantity of CO2 (50,000 t/d for 15
years) in hydrocarbon reservoirs in Western Canada. A variety of reservoirs were studied including carbonate reefs and sandstone formations containing light, medium or heavy oil. EOR recovery schemes included miscible and immiscible flooding using slug, WAG, or
continuous injection process.
The fields selected as case studies were expected to be sufficient to
dispose of the targeted quantity but the simulation results showed, from an oil recovery perspective, better CO2 utilization than expected. Although initial CO2 requirements were close to those expected, the reinjection of produced CO2 reduced the requirement for fresh CO2.
Only 29.5% of the 50,000 t/d target would be stored in the 15 year target period. The incremental oil produced from the fields studied in the selected reservoirs in the 15 year target period totaled 55.3 million
m3 (348 million barrels) averaging 10,100 m3/d (63,500 BPD). The CO2 utilization rate averaged 2.1 tonnes CO2/m3 oil (6.3 MSCF/BBL).
The fields selected for detailed case study are representative of many similar reservoirs. A review was undertaken to identify other analogous oil fields suitable for large scale CO2 flooding to make up the
•
•
• 4

• shortfall from the target of 50,000 t/d. Using size, location, and reservoir similarity as selection criteria, a further potential demand of 163 million tonnes (3100 MMSCF) of CO2 for EOR in Alberta was
identified. This is 59.5% of the target quantity. The injection and
production quantities, and rates quoted above for the case studies, would be tripled to 166 million m3 (1044 million barrels) averaging 30,300 m3/d (190,000 BPD) if CO2 flooding was undertaken on all the
potential oil reservoirs identified.
The remaining 11% can be disposed in depleted gas fields. The disposal potential here is very large. The study included one such field which could sink 12.9 million tonnes (246 MMSCF) or 4.7%. Additional gas fields were estimated to have a capacity for 0.8 to 1.0 billion tonnes (15 to 20 BSCF), which is 3 to 4 times the target volume.
Fig 1.4 002 STORAGE OVER 15 YEAR PERIOD
•
EOR ADD.FIELD (59.5%) 41L.‘4415. D
EOR STUDY FIELDS (29.5%)
ISPOSAL ADD.FIELD (6.2%)
DISPOSAL GAS (4.7%)
5

These estimates are based on known hydrocarbon reservoirs where the reservoir geology is known and trapping of fluids has been demonstrated over geological time periods. Not included are non hydrocarbon bearing rock formations in the western sedimentary basin, or aquifers where water can be displaced. The storage potential of these formations is expected to be an order of magnitude greater than the hydrocarbon reservoirs.
1.3 EOR FIELD FACILITIES
•
CO2 flooding for enhanced oil recovery requires a large investment in
field facilities. For the EOR case studies, the capital cost of the field facilities is $1.2 billion. This includes the cost of over 2000 injection and production wells, the associated injection and gathering lines and batteries, the separation and treatment of produced fluids, and the compression of recycled CO2. The annual operating costs, not including the cost of CO2, averaged $90 million per year.
These case studies utilized 29.5% of the target quantity of CO2. To
meet the target of 50,000 tid these costs would be multiplied by more than three times.
It is possible to implement CO2 flooding on such a megaproject scale in
Western Canada? Technically the answer is yes. Miscible flooding using light hydrocarbons now produces over 34,000m3/d (214,000 BPD), or 24% of Alberta's conventional oil production (Scott 1992). CO2 flooding could be adopted on an equivalent scale. In the United States, CO2 is the fluid of choice for miscible flooding due to the availability of low cost CO2 from natural reservoirs. Over 22,500m3/d
(142,000 BPD) is now produced in the US through CO2 flooding.
(Hadlow 1992). Implementation of CO2 flooding in Canada on the scale proposed in this study is limited by economics, more specifically, the cost of CO2 vs the price of oil.
• 6

• 1.4 ECONOMICS
The major economic conclusion from this study is that the benefits from enhanced oil recovery provide substantial offsetting benefits against the cost of CO2 capture. For the most favourable set of
economics parameters the EOR revenue can cover the cost of CO2
capture but for the typical cases these benefits are insufficient to
totally pay for the cost of capture.
In this study the economic potential is determined by the transfer price
at the oil field battery limits.
From the supplier's point of view, the transfer price is the cost to capture CO2 and deliver it to the oil field. This delivered cost is based
on operating costs and a return on the capital invested.
From the user's point of view, the transfer price is the affordable price, the price that can be paid for CO2 as determined by the revenue from
incremental oil production less the operating costs and a return on the capital invested. This affordable price is, in effect, the offsetting benefit for CO2 utilization.
For sales of CO2 to occur and projects to proceed on only internal
economic justifications, the price the user can pay must be at least equal to the delivered cost of CO2. The profitability of the venture is
determined by how much greater the price the user can pay (price available) is compared to the delivered cost.
The figures below for typical cases summarize the delivered cost and price available for EOR. They are based on a normal business analysis for oil and utilities companies. There is a significant gap between the delivered CO2 cost and price of CO2 available for EOR use. As the
quantity increases towards the target of 50,000 t/d, the gap widens.
7

Fig 1.5 ECONOMICS OF CO2 DISPOSAL IN ALBERTA
VTONNE OF CO2
— DELIVERED COST — AFFORDABLE PRICE • .1 HANLAN: ROBB 0"N:
AGEC SUNDANC.E ROWER pLANT ............
.. ... -
SANDSTONE (EOR)
GAS RES.
D3 (g9FIL (DES)
-20.0 0 0 5.0 10.0 15.0 20.0 25.0 30.0 35.0 40.0
CO2 - 1000s OF TONNES/DAY
In Alberta the lowest cost is $57/tonne for CO2 from the Sundance
Power Plant and the greatest offsetting benefit (price available) is $32/tonne CO2 for sandstone reservoirs. The smallest gap is $25/tonne C 02. This increases to $77/tonne for disposal in depleted gas
reservoirs from more costly sources.
The gap is reduced when more favourable economic assumptions are used such as social rate of return, lower return on investment requirements (5%), and low cost option such as IGCC. See section 8
and the economics report for details.
In Saskatchewan the situation is similar. For the normal business approach, the lowest capture costs at Boundary Dam Power plant are
$60/tonne. The highest available revenue from EOR is $31.50 for a gap
of $28.50.
• 100.0
80.0
60.0
40.0
20.0
0.0
IGCC REEF (FOR)
•
• 8

FIG 1.6 ECONOMICS OF CO2 DISPOSAL IN SASKATCHEWAN
VTONNE OF CO2
( •
— DELIVERED COST — AFFORDABLE PRICE
•jtBOUNDARY DAM POWER PLANT BI-PROVINCIAL UPGRADER _ .................... _
ELSWICK AND OTHER FIELDS
ABERFELDY AND OTHER FIELDS
• 100.0
80.0
60.0
40.0
20.0
0.0
-20.0 0 0 1.0 2.0 3.0 4.0 5.0 6.0 7.0
CO2 - 1000s OF TONNES/DAY
8.0
9.0
If CO2 capture is not justified by the benefits from EOR, the
justification to proceed with a project must be the environmental benefits. In this case, the measure of merit is the reduction in CO2 emissions through implementation of the project, the net CO2. The economic analysis in this study is based upon gross CO2 captured. The typical gap is $25/tonne CO2. However, the typical net CO2 capture is only 2/3 of the gross CO2 capture. The environmental justification
would therefore be based on 2/3 of a tonne net per tonne gross. The typical gap increases by 3/2, from $25/tonne CO2 gross to $38/tonne CO2 net. To put these number in perspective: $38/tonne CO2 is $2/MSCF CO2 or $139/tonne of carbon.
• 9
1.5 ISSUES •
1.5.1 Retrofit
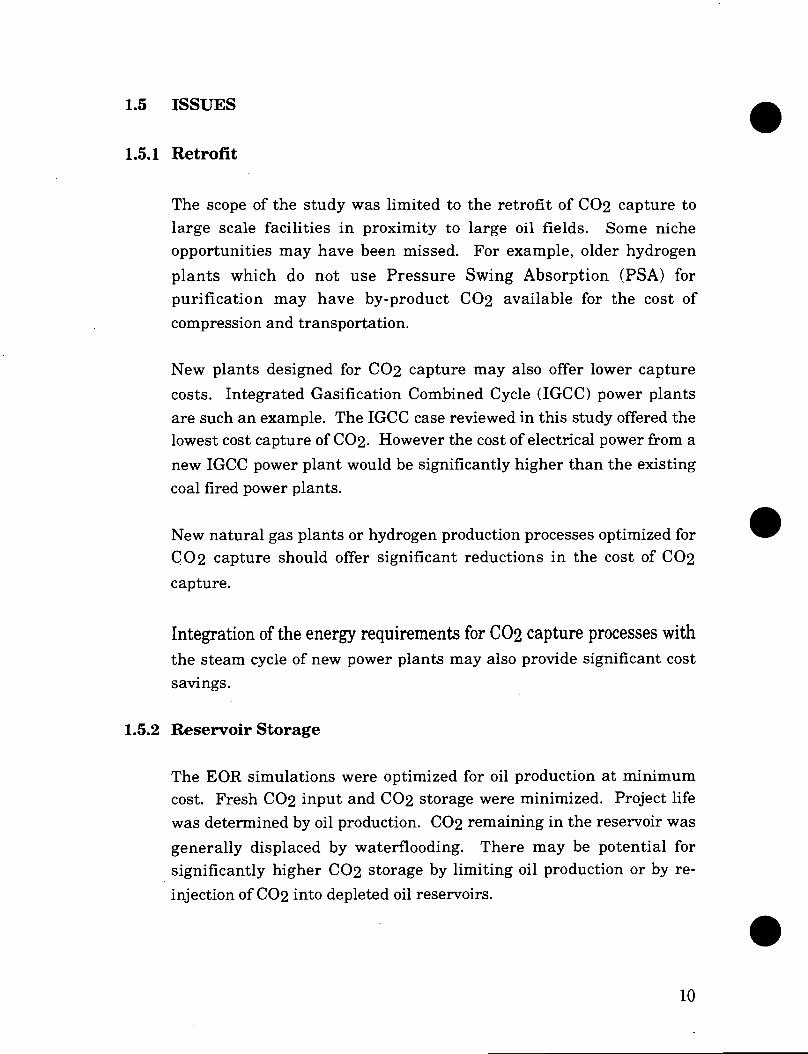
The scope of the study was limited to the retrofit of CO2 capture to large scale facilities in proximity to large oil fields. Some niche opportunities may have been missed. For example, older hydrogen
plants which do not use Pressure Swing Absorption (PSA) for purification may have by-product CO2 available for the cost of
compression and transportation.
New plants designed for CO2 capture may also offer lower capture
costs. Integrated Gasification Combined Cycle (IGCC) power plants are such an example. The IGCC case reviewed in this study offered the lowest cost capture of CO2. However the cost of electrical power from a
new IGCC power plant would be significantly higher than the existing coal fired power plants.
New natural gas plants or hydrogen production processes optimized for •
CO2 capture should offer significant reductions in the cost of CO2
capture.
Integration of the energy requirements for CO2 capture processes with the steam cycle of new power plants may also provide significant cost savings.
1.5.2 Reservoir Storage
The EOR simulations were optimized for oil production at minimum cost. Fresh CO2 input and CO2 storage were minimized. Project life was determined by oil production. CO2 remaining in the reservoir was
generally displaced by waterflooding. There may be potential for significantly higher CO2 storage by limiting oil production or by re-
injection of CO2 into depleted oil reservoirs. • 10

•
•
1.5.3 Market Factors
Market factors were not considered in developing the economics. It was assumed that all the CO2 capture capacity was utilized, all the
CO2 captured was used for EOR, and all produced CO2 was reinjected
within the field or made available to other projects. Variations in demand and peak flows were not considered except in project phasing and recycle capacity limitations.
In reality there would be considerable variation in CO2 requirements
leading to shortfalls at peak periods and excess capacity at others. CO2 disposed in depleted gas fields would be expected to minimize
supply/demand imbalances but this has not been included in the economics.
1.5.4 Oil Production
Although the reservoir simulations are based on multiple zones with different parameters, the problem of reservoir heterogeneity remains. There is a risk that the simulated oil production is overestimated. In this study, the economics considered three production levels, 100%, 75% and 50% of the simulation results, with 75% being the base case.
In the Aberfeldy case, the CO2 for immiscible flooding is transported to
the oil dissolved in water. This method offers tremendous potential.
The simulation results from this immiscible flood were excellent. There are concerns that the simulation results may not be proven in practice. There is a need to pilot this carbonated water process.
1.5.5 S02 Removal
An additional benefit of CO2 capture is S02 removal. The chemical
capture processes can tolerate only very low levels of S02, so
conditioning processes have been added to the power plant cases to capture 95% to 97% of the S02 in the flue gas. The cost of S02 removal
11

are included in the cost of CO2 capture. The benefits have not been estimated or attributed to CO2 capture.
1.5.6 Economic Approaches
The Social approach of calculating the economics provide significantly more attractive results than the Normal Business approach. The intent of the Social approach is to eliminate the effects of royalties, taxation and inflation. The intent is to answer the question "Is there an economic benefit to society?", rather than, "Who benefits: governments, industry or investors?"
•
• 12

•
•
• Ila
SN
OI1
VaN
NIW
OO
MI W
Z

•
2.0 RECOMMENDATIONS
2.1 GENERAL
If CO2 capture is required to meet CO2 emission stabilization targets, the use of captured CO2 for enhanced oil recovery is recommended as
the best disposal option. This may not be applicable on a global basis, but this study shows it is appropriate for Western Canada.
2.2 SPECIFIC
The following recommendations are based on the specific issues raised by this study.
2.2.1 Capture Optimization
Review cases which show the potential for reduced CO2 capture costs
through retrofit to small existing high quality sources, or through the design for CO2 capture integrated into new sources.
2.2.2 Storage Optimization
Review the EOR simulations to determine if different operating strategies, project lives, or CO2 reinjection can provide more CO2 storage and disposal.
2.2.3 Immiscible Flooding
Develop a pilot project to demonstrate immiscible flooding using CO2 dissolved in water.
• 13

•
•
NO
113f
1001
:11N
1 Ot
•
•
•
3.0 INTRODUCTION
3.1 BACKGROUND
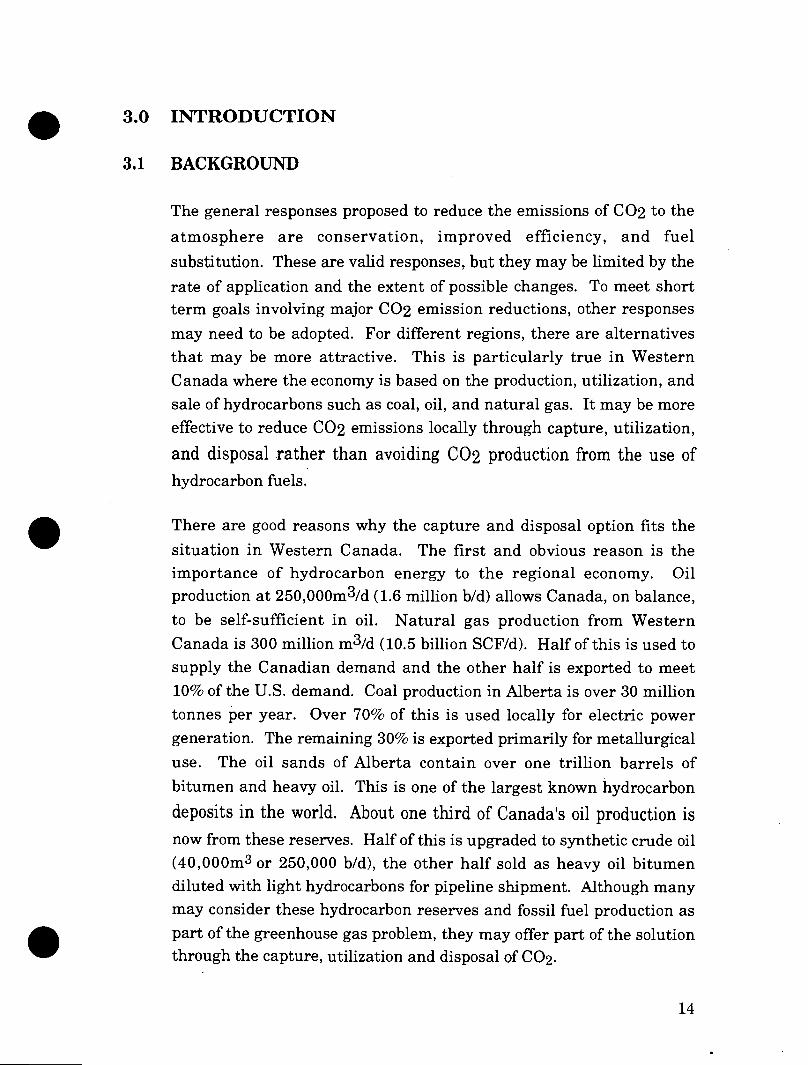
The general responses proposed to reduce the emissions of CO2 to the
atmosphere are conservation, improved efficiency, and fuel
substitution. These are valid responses, but they may be limited by the
rate of application and the extent of possible changes. To meet short term goals involving major CO2 emission reductions, other responses
may need to be adopted. For different regions, there are alternatives that may be more attractive. This is particularly true in Western Canada where the economy is based on the production, utilization, and sale of hydrocarbons such as coal, oil, and natural gas. It may be more effective to reduce CO2 emissions locally through capture, utilization,
and disposal rather than avoiding CO2 production from the use of
hydrocarbon fuels.
There are good reasons why the capture and disposal option fits the
situation in Western Canada. The first and obvious reason is the importance of hydrocarbon energy to the regional economy. Oil production at 250,000m3/d (1.6 million b/d) allows Canada, on balance,
to be self-sufficient in oil. Natural gas production from Western Canada is 300 million m3/d (10.5 billion SCF/d). Half of this is used to supply the Canadian demand and the other half is exported to meet 10% of the U.S. demand. Coal production in Alberta is over 30 million tonnes per year. Over 70% of this is used locally for electric power generation. The remaining 30% is exported primarily for metallurgical
use. The oil sands of Alberta contain over one trillion barrels of
bitumen and heavy oil. This is one of the largest known hydrocarbon
deposits in the world. About one third of Canada's oil production is
now from these reserves. Half of this is upgraded to synthetic crude oil (40,000m3 or 250,000 b/d), the other half sold as heavy oil bitumen diluted with light hydrocarbons for pipeline shipment. Although many may consider these hydrocarbon reserves and fossil fuel production as
part of the greenhouse gas problem, they may offer part of the solution through the capture, utilization and disposal of CO2.
14

• Capture is facilitated in Western Canada because the majority of the emissions are from large point sources. For example, in Alberta one third of the CO2 emissions are from coal fired power plants and one
, third are from the oil and gas industry. Capture from these large
sources should be easier and less costly than from smaller dispersed sources. The capture processes are generally the same as the processes used to purify natural gas. This chemical absorption technology is
practiced in hundreds of gas processing plants in Western Canada.
Disposal is facilitated by the large underground reservoirs in the Western Canadian sedimentary basin. The porosity, permeability and
stratigraphic traps which held oil and gas over geological time can be used for storage of carbon dioxide. In fact, the potential for storage goes far beyond the oil and gas reservoirs and applies to many of the sedimentary deposits in Western North America. The major advantages of utilizing oil and gas reservoirs are that the geology is better known, the storage capability has been demonstrated over
geological time and enhanced oil recovery benefits may be obtained.
Carbon dioxide at reservoir pressures is a dense supercritical fluid
which can mix miscibly with oil. The miscible fluid can displace virtually all the oil that it contacts in the reservoir leading to substantially improved oil recoveries and economic benefits.
The capture, utilization, and disposal option is, therefore, of significant interest•in Western Canada. Here there are the sources, the sinks, the technology, and a potential economic incentive.
The option to limit CO2 emissions through CO2 capture is generally
recognized as an abstract possibility, but is often dismissed in policy discussions because it is not universally applicable and there is a lack of data on feasibility, potential, costs, and benefits. This study was undertaken to correct this deficiency, to define the technology for CO2 capture, to quantify the amount of CO2 that can be stored in
underground reservoirs, to estimate the cost of capture, purification
•
• 15
•
•
and transmission and to project the benefits from CO2 flood enhanced
oil recovery.
3.2 PROJECT INITIATION
In 1990 Alberta Oil Sands Technology and Research Authority
(AOSTRA) accepted a proposal from industry leaders to undertake a
study with the following objective: to determine the technical and
economic feasibility of reducing the rate of growth of CO2 emissions by
collecting CO2 from major sources and disposing of the collected gases
in hydrocarbon bearing reservoirs where hydrocarbon recovery benefits
could be obtained.
The original project sponsors, Imperial, Shell, TransAlta Utilities and the Coal Association were soon joined by more than twenty others
representing all aspects of the question. The participants, listed below, include oil and gas companies, power and coal companies, CO2 supply
companies, and the government groups, both federal and provincial, representing research, energy, and environment departments.
• 16
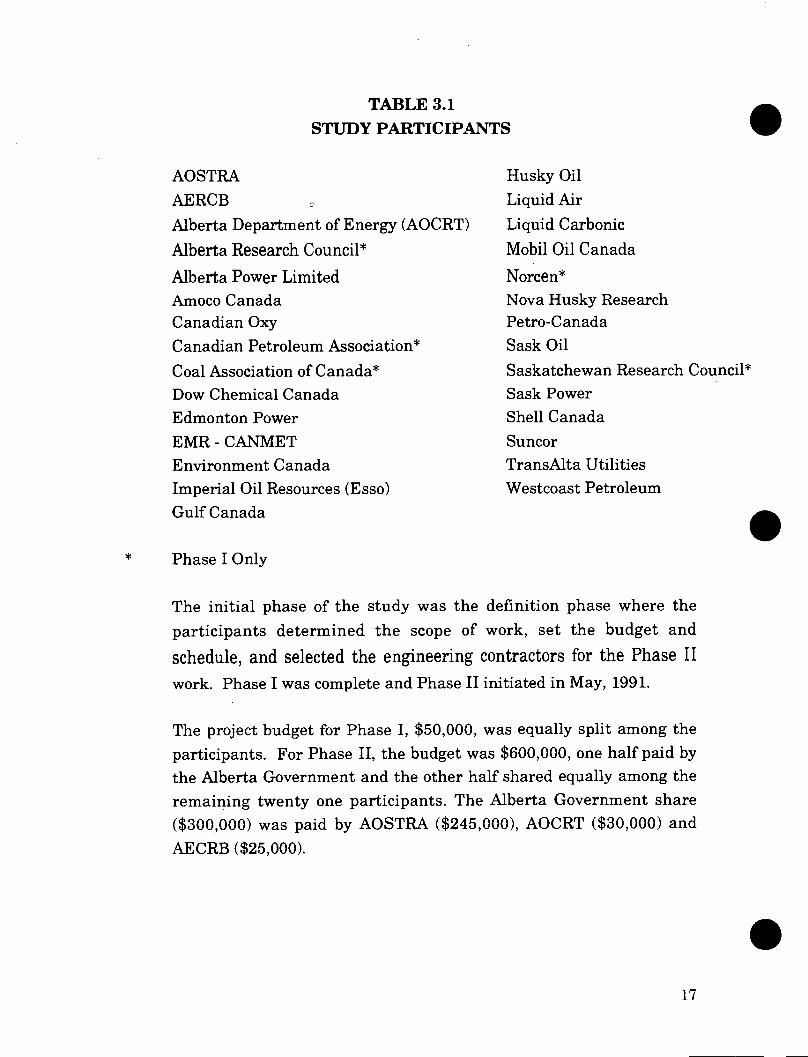
STUDY PARTICIPANTS TABLE 3.1 •
AOSTRA Husky Oil
AERCB Liquid Air
Alberta Department of Energy (AOCRT) Liquid Carbonic
Alberta Research Council* Mobil Oil Canada
Alberta Power Limited Norcen* Amoco Canada Nova Husky Research Canadian Oxy Petro-Canada
Canadian Petroleum Association* Sask Oil
Coal Association of Canada* Saskatchewan Research Council* Dow Chemical Canada Sask Power
Edmonton Power Shell Canada
EMR - CANMET Suncor
Environment Canada TransAlta Utilities
Imperial Oil Resources (Esso) Westcoast Petroleum
Gulf Canada
Phase I Only
The initial phase of the study was the definition phase where the
participants determined the scope of work, set the budget and
schedule, and selected the engineering contractors for the Phase II
work. Phase I was complete and Phase II initiated in May, 1991.
The project budget for Phase I, $50,000, was equally split among the
participants. For Phase II, the budget was $600,000, one half paid by the Alberta Government and the other half shared equally among the remaining twenty one participants. The Alberta Government share ($300,000) was paid by AOSTRA ($245,000), AOCRT ($30,000) and
AECRB ($25,000).
• 17

•
•
•
3.3 COMMITTEES
A management committee was established with representatives from all participants to direct the project. With the large number of diverse
participants, there was also a need for effective working sub-committees to maximize the technical contributions from the participants. To facilitate the transfer of information and expertise to
the project, the following committees were setup with volunteers from the participants.
CO2 Recovery, Purification, and Distribution
EOR and Underground Disposal Alternative Disposal/Applied Research Contractor Selection Economics Communications
Each committee elected a chairman, defined objectives, and set up methods to accomplish their tasks.
In Phase I, the major task was to define the scope for the project by
gathering data, reviewing alternatives, and recommending specific
cases. In Phase II, the major task was to review the various contractors work progress and technical reports. Since the project covered such a range of scientific engineering disciplines and business interests, the committee system proved to be a very effective way of focusing the expertise from the diverse group of participants on the specific elements of the project. The project could not have been accomplished effectively without this focused support from the participants.
3.4 SCOPE OF WORK
The objective statement was translated into a specific project missions
statement which led to specific work packages.
18
3.4.1 Objective
To determine the technical and economic feasibility of reducing the rate of growth of CO2 emissions by collecting CO2 from major sources and
disposing of the collected gases in hydrocarbon bearing reservoirs where
hydrocarbon recovery benefits could be obtained.
3.4.2 Mission
To capture 50,000 tonnes per day (951 MMSCF D) and use to optimum benefit in enhanced oil recovery in Alberta and Saskatchewan,
beginning in the year 2000 and continuing for a period of at least 15
years.
The specific quantity 50,000, tonnes per day, was chosen as a quantity large enough to have a significant impact on CO2 emission, but not so
large that it became an impossible target. To put this quantity in perspective, 50,000 tonnes/day is about 15% of the current total CO2
emissions for Alberta or about 12% of the Alberta, Saskatchewan total. It represents about half the emissions from either the electrical power industry or the oil and gas industry. CO2 use in the U.S. for enhanced
oil recovery is currently about 125,000 tonnes/day (Hadlow 1992), so
the potential use of 50,000 tonnes/day in Canada seemed to be a
reasonable target.
The specific time frame allowed sufficient time for project definition and implementation but recognizes that CO2 capture is a short term solution tied to specific industries and technologies for both sources
and sinks.
3.4.3 Work Packages
The scope of work was based on the CO2 sources, capture technologies
and reservoirs listed on Table 3.2
•
•
19

•
TABLE 3.2 SCOPE OF WORK SUMMARY
CAPTURE EOR SOURCE
TECHNOLOGY APPLICATION
Power plant (Boundary Dam, Boundary Dam Process Steelman, Weyburn, SaskPower) Midale
Power Plant Pembina, Cooking (Sundance, Amine Lake, Rainbow or TransAlta) other
Industrial Complex (Ethylene Plant, Amine Cooking Lake, Novacor) Redwater
Natural Gas Plant (Petro Canada Selexol Pembina Hanlan Robb)
Hydrogen Plant (Bi-Provincial PSA & Amine Lloydminster Upgrader, Husky)
The selection of sources was based on quality, quantity, and location. Represented are the largest sources (coal fired power plants), the most abundance sources (natural gas fired furnaces), and the richest sources (petrochemical byproducts).
Reservoir selection was based on location, reservoir type, crude oil characteristics, and applicable EOR process.
Four work packages were defined and sent out for bids from
appropriate engineering contractors.
• 20

The contract for design and cost estimation of the CO2 capture
facilities was completed by SNC Inc. for a fixed price of $283,000.
The contract for reservoir simulation to estimate the CO2 utilization
and enhanced oil recovery was completed by TCA Reservoir Engineering Services for a fixed price of $174,000.
The contract for the design and cost estimation of the field facilities
was completed by Optima Engineers and Constructors Inc. for a fixed price of $32,200.
The Economics work package was completed by AOSTRA. AOSTRA
was also the project operator and provided a Project Manager to integrate the various work programs.
•
•
• 21

•
•
The overall project budget is outlined in Table 3.3.
TABLE 3.3 OVERALL PROJECT BUDGET
Consultants
SNC $283,000 TCA 174,000 OPTIMA 30,000 AOSTRA 14,000
Project Management 48,000
Operator Services
Data Acquisition 5,000 Program Support 15,000 Direct Cost 9,000
Sub Total $578,000
Overhead @ 2-1/2% 14,000 Contingency 8,000
Total $600,000
• 22

•
•
• S
3311
flOS
CO
3 0
3,
_,.
Transportation 21.1
Power Generation 10.3
Transportation 7.4
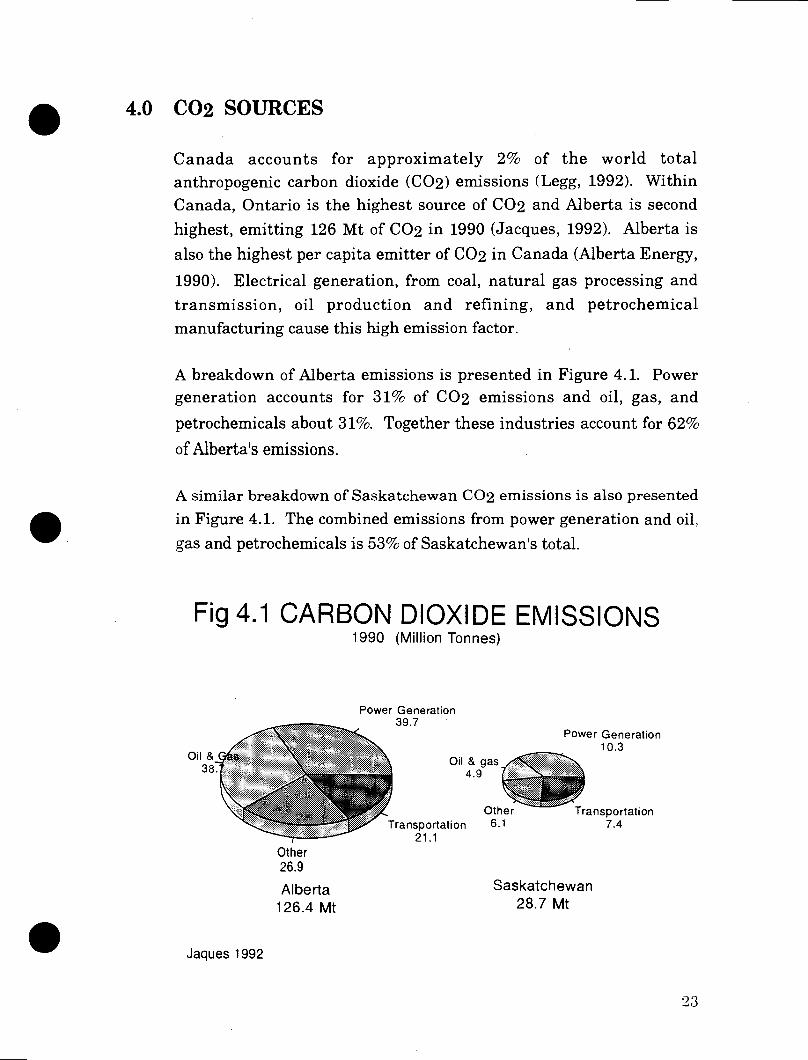
4.0 CO2 SOURCES
Canada accounts for approximately 2% of the world total anthropogenic carbon dioxide (CO2) emissions (Legg, 1992). Within Canada, Ontario is the highest source of CO2 and Alberta is second
highest, emitting 126 Mt of CO2 in 1990 (Jacques, 1992). Alberta is
also the highest per capita emitter of CO2 in Canada (Alberta Energy,
1990). Electrical generation, from coal, natural gas processing and transmission, oil production and refining, and petrochemical manufacturing cause this high emission factor.
A breakdown of Alberta emissions is presented in Figure 4.1. Power generation accounts for 31% of CO2 emissions and oil, gas, and
petrochemicals about 31%. Together these industries account for 62%
of Alberta's emissions.
A similar breakdown of Saskatchewan CO2 emissions is also presented in Figure 4.1. The combined emissions from power generation and oil,
gas and petrochemicals is 53% of Saskatchewan's total.
Fig 4.1 CARBON DIOXIDE EMISSIONS 1990 (Million Tonnes)
Power Generation 39.7
Other 26.9
Alberta Saskatchewan
126.4 Mt
28.7 Mt
Jaques 1992
23
In order to meet the goal of removing 50,000 tonne/day of CO2, major sources of CO2 in both Alberta and Saskatchewan were reviewed. Table 4.1 presents the list of major CO2 sources reviewed by the
Management Committee during the early stages of the study. The
criteria used to select the study facilities were:
1. Quality and Quantity
A. Largest sources - These are Novacor/AGE, Bi-Provincial
Upgrader (BPU), and coal-fired power plants. The BPU and Novacor are higher quality sources because their flue gases do not contain S02 and particulates.
B. Most abundant sources - These sources include natural gas fired furnaces and natural gas processing plants. Hydrogen sulphide presents a problem. The Petro-Canada Hanlan Robb gas plant is an example.
C. Richest sources - These sources are hydrogen processing plants which can produce streams with high percentages of CO2.
2. Strategically Located
The sites should be close to potential enhanced oil recovery (EOR) sites.
3. Readily Available Information
Information on plant layouts, process CO2 sources and process
diagrams must be readily available.
4. Retrofit
Only existing sources of CO2 were included. No new facilities were
studied in detail. Those facilities capable of being retrofitted for CO2 removal will be emphasized.
•
•
• 24
• On the basis of the above selection criteria the facilities chosen for study were:
Case 1 Boundary Dam (Saskatchewan) Coal-Fired Power
Plant
Case 2 Sundance (Alberta) Coal-Fired Power Plant
Case 3 Novacor Chemicals/AGEC Utility Plants, Joffre, Alberta
Case 4 Hanlan Robb Gas Plant, Alberta
Case 5 Bi-Provincial Upgrader Hydrogen Plant, Lloydminster
• Case 6 Sundance/Argonne Process
Case 7 Integrated Gasification Combined Cycle (IGCC)
A review of the facilities (Table 4.2) shows that Case 1 Boundary Dam and Case 2 Sundance represent large sources of low quality CO2. At Boundary Dam the flue gas is about 14% CO2 with the one unit
studied (293 MW) producing about 8,920 tonnes/day. Sundance has six units producing about 45,000 tonnes/day of CO2. The concentration of
CO2 in the power plant flue gases is about 14%. Both Boundary Dam
and Sundance flue gas streams contain particulates, sulphur dioxide (S02) and nitrogen oxides (N0x) which affect the conditioning and
capture processes chosen.
Case 3 Novacor Chemicals Alberta Gas Ethylene Plant at Joffre,
Alberta uses natural gas and process off gas to fuel several heaters, furnaces and boilers. Furnaces and fired boilers provide most of the • CO2 (about 3700 tonnes/day)• Case 3A was developed to recover 100
25

tonnes/day of CO2 recovery from a flue gas stream smaller than in
Case 3. The CO2 concentration in the flue gas is 8.3%.
Case 4A deals with the Hanlan Robb gas plant owned by Petro-Canada. The study allows for the shutdown of the existing amine unit and replacement with two Selexol units for removal of hydrogen sulphide first (H2S) and then CO2.
Case 4B estimates the costs of CO2 removal adding a Selexol unit for H2S removal and using the existing amine utht for CO2 removal.
In both Cases 4A and 4B approximately 1023 tonnes/day of CO2 are
available for capture.
Case 5 develops costs for removal of CO2 from the hydrogen plant vent
gases of the Bi-Provincial Upgrader at Lloydminster, Saskatchewan.
During the steam/methane reforming process a 47% vol CO2 tail gas leaves the pressure swing adsorption (PSA) Linit. This high quality gas is treated to remove CO2. Potentially, 1033 tonnes/day of CO2 are
available for capture.
Case 6 is a variation on Case 2. By using the Argonne Process in the Sundance Power Plant boiler to burn the coal in an atmosphere of pure oxygen diluted to 30% with recycled CO2, a flue gas with 80% CO2 is produced. After S02 removal a slipstream of flue gases from the boiler is diverted to the CO2 recovery plant where about 37,440 tonnes CO2/day are produced.
Case 7 was added to the study to develop comparable information for an Integrated Gasification Combined Cycle power plant with CO2
removal. The use of gasification and the water gas shift reaction produces a flue gas with high concentrations of hydrogen (50%) and carbon dioxide (35%). IGCC is an exception to the retrofit criteria as
no such facilities exist in Alberta or Saskatchewan at this time. An overview for IGCC was added to the scope of work because this
26
• technology is expected to be used for future electrical power development and it has the potential for low cost CO2 capture.
The processes and facilities for CO2 capture are presented in the next
section of this report.
•
• 27

TABLE 4.1
SUMMARY OF MAJOR CO2 SOURCES REVEEWED BY THE COMMITFEE
PLANT SOURCE QUANTITY QUALITY (T/D) CO2 (% Vol CO2 wet)
Power Plants:
Poplar River, Sask. Coal Fired 13,990 12.7
Boundary Dam, Sask. Coal Fired 22,280 13.1
Shand, Sask. • Coal Fired 6,610 12.2
Queen Elizabeth, Sask. Gas Fired 3,390 13.4
Sundance, Alberta Coal Fired 41,600 13.4
Keephills, Alberta Coal Fired 16,400 13.4
Wabamun, Alberta Coal Fired 13,000 13.4
Genesee, Alberta Coal Fired 10,430 12.0
Queen Elizabeth, Sask. Gas Fired 2,040 9.0
Success, Sask. Gas Fired 570 3.3
Landis, Sask. Gas Fired 1,050 3.3
Meadow Lake, Sask. Gas Fired 670 3.3
Clover Bar, Alberta Gas Fired 2,497 9.5
Rossdale, Alberta Coal Fired 802 9.6
Battle River, Alberta Coal Fired 18,000 12.6
H.R. Milner, Alberta Coal Fired 2,800 11.8
Sheerness, Alberta Coal Fired 16,350 12.8
28
•
•
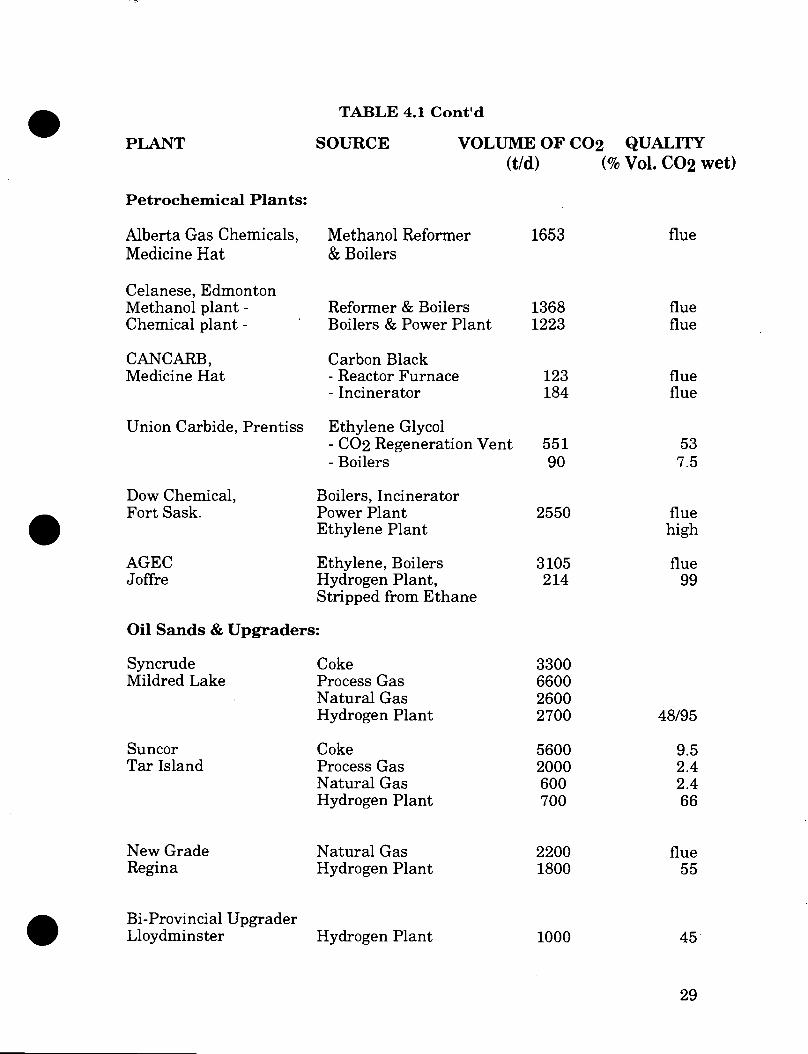
TABLE 4.1 Cont'd
PLANT
Petrochemical Plants:
SOURCE VOLUME OF CO2 QUALITY (t/d) (% Vol. CO2 wet)
Alberta Gas Chemicals, Medicine Hat
Methanol Reformer & Boilers
1653 flue
Celanese, Edmonton Methanol plant - Reformer & Boilers 1368 flue Chemical plant - Boilers & Power Plant 1223 flue
CANCARB, Medicine Hat
Carbon Black - Reactor Furnace 123 flue - Incinerator 184 flue
Union Carbide, Prentiss Ethylene Glycol - CO2 Regeneration Vent 551 53 - Boilers 90 7.5
Dow Chemical, Fort Sask.
Boilers, Incinerator Power Plant Ethylene Plant
2550 flue high
AGEC Ethylene, Boilers 3105 flue Joffre Hydrogen Plant,
Stripped from Ethane 214 99
Oil Sands & Upgraders:
Syncrude Coke 3300 Mildred Lake Process Gas 6600
Natural Gas 2600 Hydrogen Plant 2700 48/95
Suncor Coke 5600 9.5 Tar Island Process Gas 2000 2.4
Natural Gas 600 2.4 Hydrogen Plant 700 66
New Grade Natural Gas 2200 flue Regina Hydrogen Plant 1800 55
Bi-Provincial Upgrader Lloydminster Hydrogen Plant 1000 45
29

TABLE 4.1 Cont'd
PLANT SOURCE VOLUME OF CO2 QUALITY (t/d) (% Vol. CO2 wet)
Fertilizer Plants:
CFI, Medicine Hat CO2 Vent 1500 93.7 Reformer Stacks 2120 9 Boiler 450 flue
Cominco, Calgary Boiler 42 flue
Cominco, Carseland CO2 Vent 342 90 Reformer stacks 756 5.9 Boiler • 439 7.1
• Saferco, Belle Plain CO2 Vent N/A N/A Saskatchewan Reforemer Stacks N/A N/A
Boiler N/A N/A
Cominco, Joffre Boiler 43 flue
Esso, Redwater CO2 Vent 1595 90 Reformer & Boilers 268 flue
Sherritt Gordon, CO2 Vent 667 90 Fort Saskatchewan Reformer & Boilers 1959 flue
Refineries:
Esso Petroleum Products, 2500 N/A Edmonton
Petro-Canada, 1900 N/A Edmonton
Shell, Scotford 800 N/A
Consumers Co-op, 700 N/A Regina*
Parkland Industries, 100 N/A Bowden**
Turbo, Calgary 400 N/A
Husky, Lloydminster 300 N/A
•
•
• 30

• TABLE 4.1 Cont'd
PLANT SOURCE QUANTITY QUALITY (t/d) CO2 (% Vol CO2 wet)
Natural Gas Plants:
Husky, Ram River Formation 1280 6.99
Shell, Waterton Formation 1196 7.85
Petro Canada, Robb Formation 1033 9.54
Chevron, Kaybob Formation 645 3.40
Mobil, Harmatten Formation 641 4.74
Shell, Jumping Pond Formation 633 5.94
Petrogas, Crossfield Formation 378 7.90
Shell, Burnt Timber Formation 377 7.96
Amoco, Crossfield Formation 305 6.81
Amoco, Vulcan Formation 303 14.62
Gulf, Homeglen-Rimbey Formation 303 2.14
Home, Carstairs Formation 296 5.69
Amoco, Windfall Formation 254 3.66
Amoco, Edson Formation 214 3.25
Other Industries:
Lime & Cement:
•
Alcan Main Stack 423 10 Calcinated coke
Continental Lime Lime 490 N/A Exshaw Fuel N/A
Inland Cement*** Cement 1500
• Edmonton Fuel N/A 20.0
31
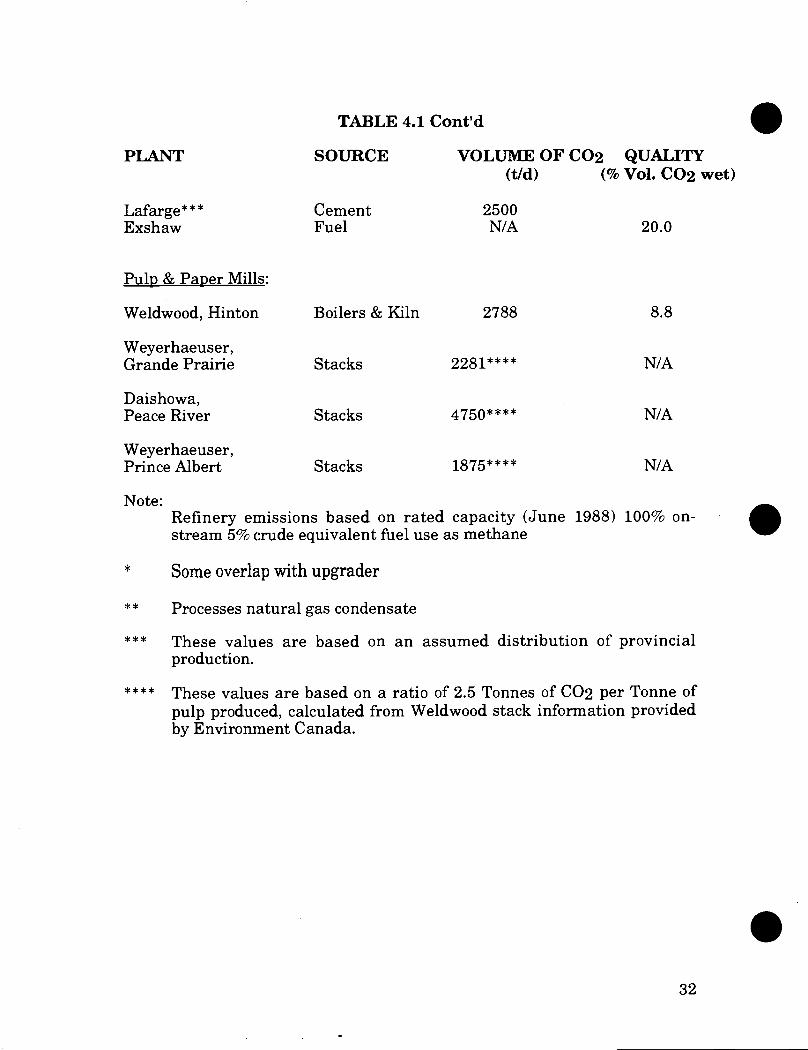
TABLE 4.1 Cont'd •
PLANT SOURCE VOLUME OF CO2 QUALITY (t/d) (% Vol. CO2 wet)
Lafarge*** Cement 2500 Exshaw Fuel N/A 20.0
Pulp & Paper Mills:
Weldwood, Hinton Boilers & Kiln 2788 8.8
Weyerhaeuser, Grande Prairie Stacks 2281**** N/A
Daishowa, Peace River Stacks 4750**** N/A
Weyerhaeuser, Prince Albert Stacks 1875**** N/A
Note: Refinery emissions based on rated capacity (June 1988) 100% on-stream 5% crude equivalent fuel use as methane
Some overlap with upgrader
Processes natural gas condensate
These values are based on an assumed distribution of provincial production.
These values are based on a ratio of 2.5 Tonnes of CO2 per Tonne of pulp produced, calculated from Weldwood stack information provided by Environment Canada.
•
32

TABLE 4.2 FACILITIES SELECTED FOR CASE STUDIES
Case No. Location
1 Boundary Dam Saskatchewan
CO2 Source
Coal-Fired Power Plant
CO2 Concentration
(%)
14
CO2 Available
Tonnes/day for Capture
8,927
Characteristics
Large Quantity Low Quality Close to EOR
2 Sundance
Coal-Fired
Large Quantity
14
45,000 Alberta
Power Plant
Low Quality Close to EOR
3 Novacor
Natural Gas Joffre, Alberta
Utilities
3A*Novacor Natural Gas Joffre, Alberta Utilities
4A HanIan Robb
Raw Natural Alberta
Gas (Selexol)
Large Quantity Low Quality
Close to EOR
Small Quatity Low Quality Close to EOR
Small Quantity Low Quality Dispersed Sites
4-9
3,717
8
111
10
1,023
4B HanIan Robb
Raw Natural Small Quantity 10
1,023 Alberta
Gas Low Quality (Existing Amine Dispersed Sites Unit)
5 Biprovincial Upgrader Lloydminster, Saskatchewan
6 Sundance Alberta
Hydrogen Plant
Coal-Fired Power Plant (Argonne)
Small Quantity High Quality Close to EOR
Large Quantity High Quality Close to EOR
47
1,033
80
40,500
7 Alberta
Coal-Fired
Large Quantity
35
5210 IGCC
High Concentration Power Plant
Potential Low Cost
33

,
3Lif I
ldif0
'00 01
•
•

• 5.0 CO2 CAPTURE
The process used for capture of CO2 from emission sources depends on the pressure and concentration of CO2 and the level of impurities
which interfere with the capture process. The process steps generally
involved conditioning, capture, and compression.
FIGURE 5.1 CO2 CAPTURE PROCESSES
CONDITIONING CAPTURE
1...0
COMPRESSION ,,..
• Cooling Separation S02 Absorption/Desorption Particulates Chemical/Physical
Dehydration Purification Liquefaction Compression
5.1 CONDITIONING
Flue gas streams, particularly from coal fired power plants, require conditioning to cool the streams and remove sulfur dioxide and
particulates which will interfere with the subsequent capture process.
Although normal stack gas cleaning processes are used for this
conditioning, complications arise because of low pressures and large volumes of flue gas, the potential for corrosion and scaling of process equipment, and the degree of clean up required to protect the downstream capture process.
34

The first step in conditioning is generally a water wash. This cools the flue gas from over 200°C to below 50°C. Fly ash remaining in the flue gas should be scrubbed out. A conclusion based on the operation of the CO2 Extraction Pilot Plant at Boundary Dam Saskatchewan is that:
"The seriousness of the fly ash problem cannot be overemphasized. Fly ash must be satisfactorily dealt with in any future commercial endeavoe (Wilson 1992).
Chemical absorption is the process generally used for CO2 capture where the CO2 partial pressure (total pressure times concentration) is low. Because of the strong chemical affinity of CO2 with chemical
solvents such as amines, the process will work and give capture efficiencies over 95% at atmospheric pressures and low CO2
concentrations. However, this strong chemical affinity also exists for oxygen, sulphur oxides and nitrogen oxides.
Oxygen from excess combustion air is a normal component of flue gas in the range of 3% to 8%. This can oxidize amines to organic acids and ammonia. Inhibitors are added to control this problem which can
otherwise result in amine losses and corrosion problems.
Sulphur oxides form non-regenerable heat stable salts with amines. High levels of sulphur oxides result in high amine consumption. SOx scrubbing systems using lower cost chemical absorbents such as caustic (Na0H) or lime (CaOH) are required to lower S02 concentration to below 10 ppm. Although S02 scrubbing is commercially practiced on power plant flue gas, the degree of S02 removal required prior to CO2 removal is much greater. For example, at Boundary Dam (Case 1), the design S02 removal is 98.7%, from 380 ppm to 5 ppm. For Sundance (Case 2) the design S02 removal for the lower sulphur coal is 97.2% from 180 ppm to 5 ppm. There are few S02
scrubbing processes capable of performing to this level of removal
efficiency. For Boundary Dam (Case 1) the conditioning process selected is the Andersen 2000 process which was tested in the pilot plant. This is a two stage scrubbing process using sodium sulphite formed from caustic sodium hydroxide and sulphur dioxide as the
•
•
• 35
CONDITIONING
CAPTURE COMPRESSION
500
450
400 n 350
300 0 0 250 z 200 p 150 64 100
50
Sask Alta Fuel Gas Raw Gas H2 02 IGCC COAL NATURAL GAS OTHERS
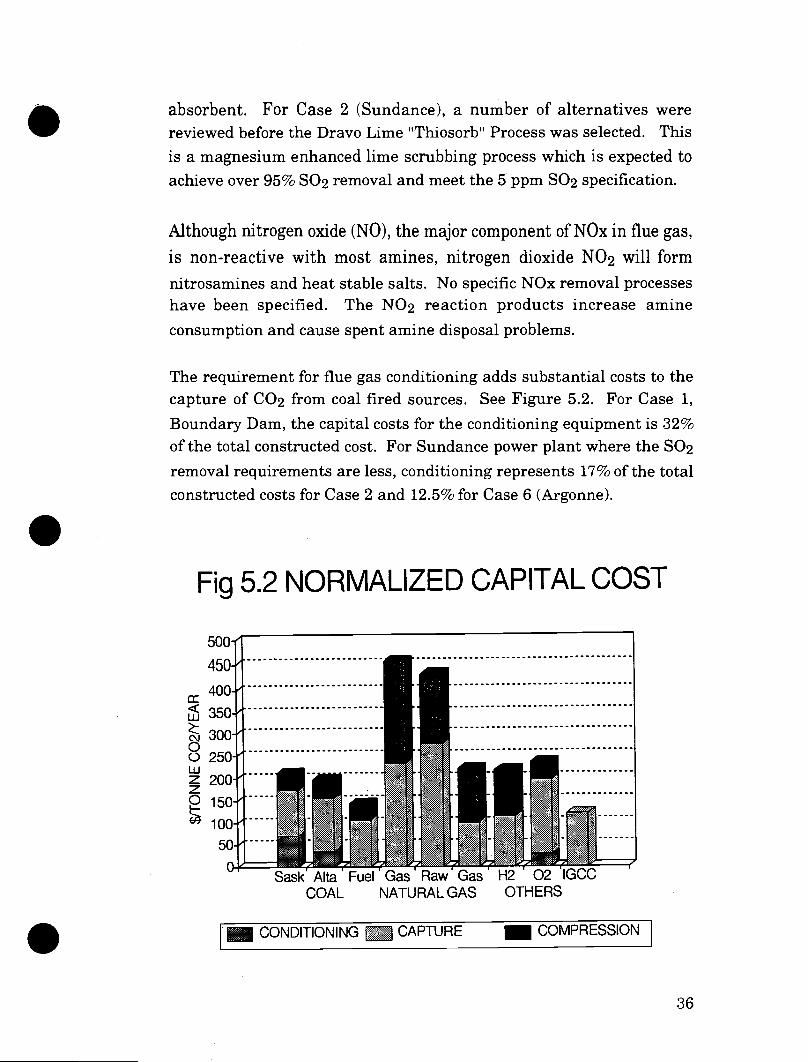
absorbent. For Case 2 (Sundance), a number of alternatives were reviewed before the Dravo Lime "Thiosorb" Process was selected. This
is a magnesium enhanced lime scrubbing process which is expected to achieve over 95% S02 removal and meet the 5 ppm S02 specification.
•
•
Although nitrogen oxide (NO), the major component of NOx in flue gas,
is non-reactive with most amines, nitrogen dioxide NO2 will form
nitrosamines and heat stable salts. No specific NOx removal processes have been specified. The NO2 reaction products increase amine
consumption and cause spent amine disposal problems.
The requirement for flue gas conditioning adds substantial costs to the capture of CO2 from coal fired sources. See Figure 5.2. For Case 1,
Boundary Dam, the capital costs for the conditioning equipment is 32% of the total constructed cost. For Sundance power plant where the S02
removal requirements are less, conditioning represents 17% of the total
constructed costs for Case 2 and 12.5% for Case 6 (Argonne).
Fig 5.2 NORMALIZED CAPITAL COST
36
For natural gas fired sources there is no conditioning requirements because of the low sulphur and particulate concentrations in the flue gas. The simple water wash for flue gas cooling is included as part of the capture process.
For raw natural gas (Case 4) and gasified coal (IGCC Case 7) the removal of hydrogen sulphide (H2S) prior to CO2 capture is important. Both CO2 and H2S are acid gases and are absorbed by the same
physical solvents so separation becomes a problem. This results in a trade off between recovery and purity which affects costs and yields.
5.2 CAPTURE PROCESSES
5.2.1 Chemical Absorption
Because of the low partial pressure of CO2 in flue gas, chemical absorbents are generally used to separate the CO2. It is possible to
compress the flue gas so physical solvents, cryogenics, membranes or pressure swing absorption can be used for separation but the costs and energy requirements for compression are generally too high for practical consideration. The use of chemical absorption is very common in Western Canada where hundreds of gas processing plants use the technology to separate CO2 and H2S from natural gas.
Chemical absorption involves the reaction of CO2 (or other acid gases)
with an• organic base, typically an alkanolamine to produce a water soluble salt. This salt can be thermally decomposed releasing the CO2
and regenerating the alkanolamine. The reaction is shown below for monoethanolamine (MEA).
C2H4OHNH2 + CO2 + H20 = C2H4OHNH3CO3.
•
•
• 37

•
•
Many chemical absorbents are available which can be used for this
reaction.
MEA monoethanolamine
DEA diethanolamine
TEA triethanolamine
MDEA methyl diethanolamine
DIPA diisopropanalamine K2CO3 potassium carbonate
Proprietary mixtures of different compounds, concentrations and
inhibitors are available under a variety of trade names. Some have
proven to be very effective in flue gas service including Union Carbide's
"Fluegard"(sm) and "ECONOMINE FG(sm)" developed by Fluor Daniel
from Dow's "Gas/Spec. FT-1"(sm). Both are based on MEA with
inhibitors to prevent oxidation and corrosion problems. MEA is generally the economic choice for CO2 capture from flue gas on the basis of reactivity at low CO2 partial pressure and cost. Other
abosorbents are used when selectivity between acid gases such as CO2
and H2S are important. A simplified flow sheet is shown below.
FIGURE 5.3 AMINE GAS TREATMENT
VET_T
I
CO2
FIAJE GAS ---'
41 ABSORBER
CW
916 STRIPPER
•
STEAM
38
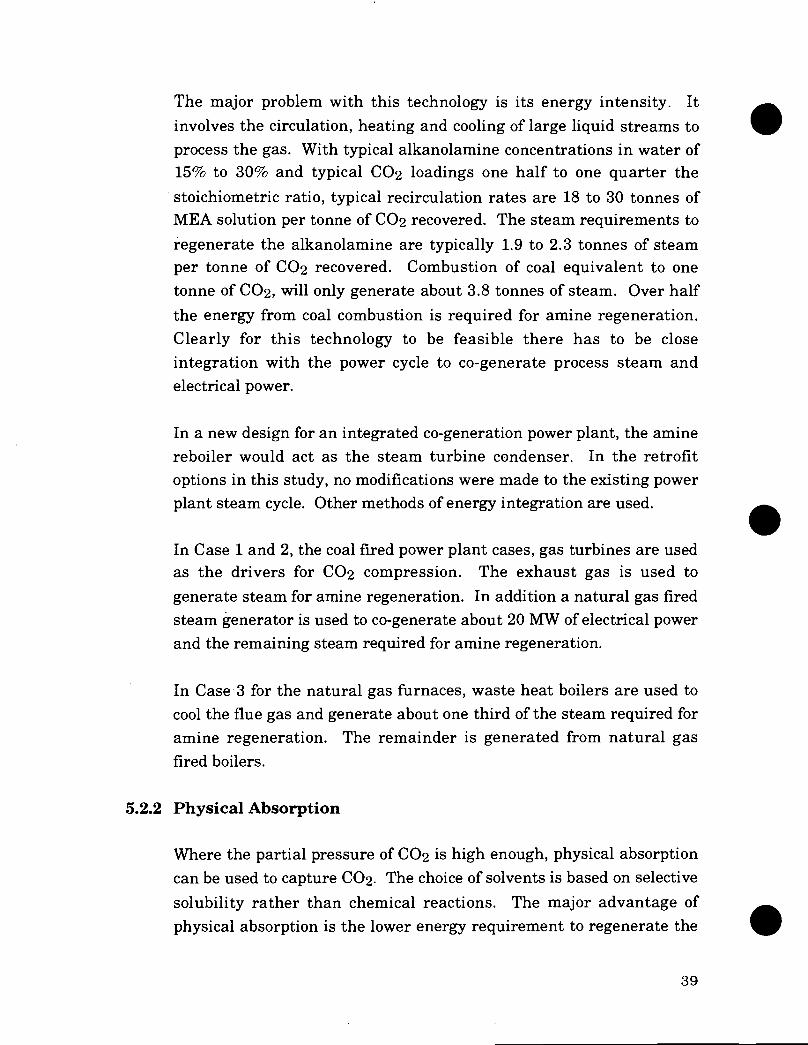
The major problem with this technology is its energy intensity. It involves the circulation, heating and cooling of large liquid streams to process the gas. With typical alkanolamine concentrations in water of 15% to 30% and typical CO2 loadings one half to one quarter the
stoichiometric ratio, typical recirculation rates are 18 to 30 tonnes of MEA solution per tonne of CO2 recovered. The steam requirements to
regenerate the alkanolamine are typically 1.9 to 2.3 tonnes of steam per tonne of CO2 recovered. Combustion of coal equivalent to one tonne of CO2, will only generate about 3.8 tonnes of steam. Over half
the energy from coal combustion is required for amine regeneration. Clearly for this technology to be feasible there has to be close integration with the power cycle to co-generate process steam and electrical power.
In a new design for an integrated co-generation power plant, the amine reboiler would act as the steam turbine condenser. In the retrofit options in this study, no modifications were made to the existing power plant steam cycle. Other methods of energy integration are used.
In Case 1 and 2, the coal fired power plant cases, gas turbines are used as the drivers for CO2 compression. The exhaust gas is used to
generate steam for amine regeneration. In addition a natural gas fired steam generator is used to co-generate about 20 MW of electrical power and the remaining steam required for amine regeneration.
In Case 3 for the natural gas furnaces, waste heat boilers are used to cool the flue gas and generate about one third of the steam required for amine regeneration. The remainder is generated from natural gas fired boilers.
5.2.2 Physical Absorption
Where the partial pressure of CO2 is high enough, physical absorption can be used to capture CO2. The choice of solvents is based on selective
solubility rather than chemical reactions. The major advantage of physical absorption is the lower energy requirement to regenerate the
•
•
• 39
•
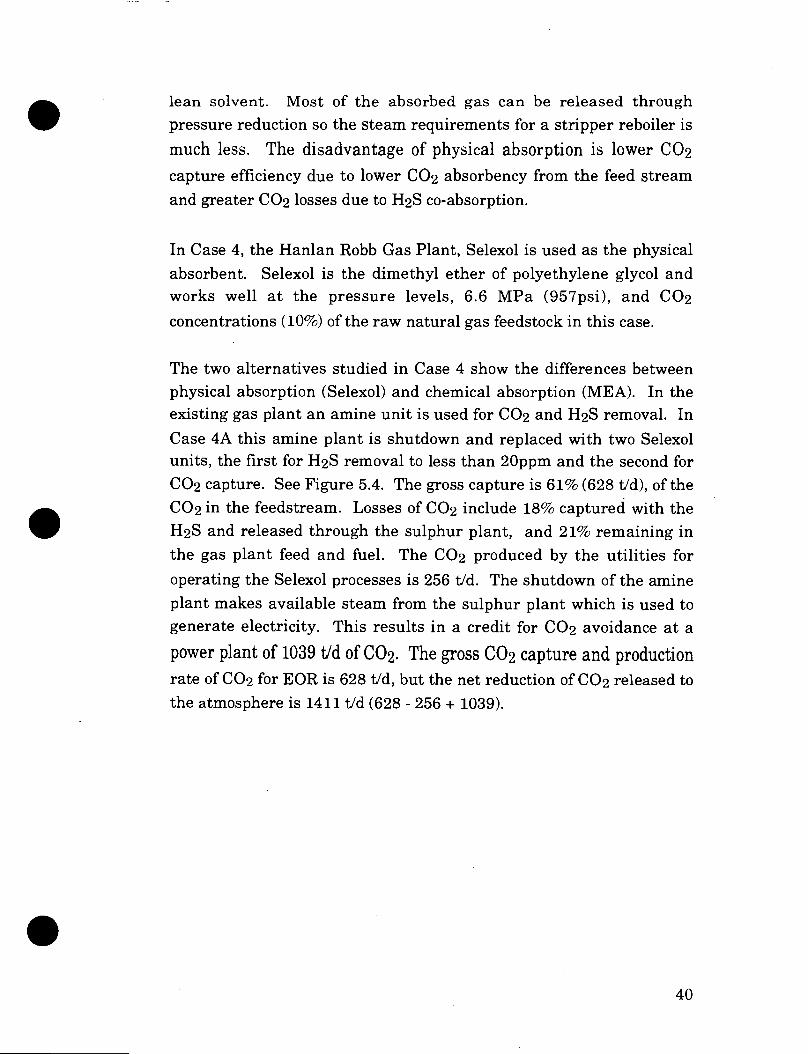
lean solvent. Most of the absorbed gas can be released through pressure reduction so the steam requirements for a stripper reboiler is
much less. The disadvantage of physical absorption is lower CO2
capture efficiency due to lower CO2 absorbency from the feed stream
and greater CO2 losses due to H2S co-absorption.
In Case 4, the Hanlan Robb Gas Plant, Selexol is used as the physical absorbent. Selexol is the dimethyl ether of polyethylene glycol and works well at the pressure levels, 6.6 MPa (957psi), and CO2
concentrations (10%) of the raw natural gas feedstock in this case.
The two alternatives studied in Case 4 show the differences between physical absorption (Selexol) and chemical absorption (MEA). In the existing gas plant an amine unit is used for CO2 and H2S removal. In
Case 4A this amine plant is shutdown and replaced with two Selexol units, the first for H2S removal to less than 2Oppm and the second for CO2 capture. See Figure 5.4. The gross capture is 61% (628 t/d), of the CO2 in the feedstream. Losses of CO2 include 18% captured with the H25 and released through the sulphur plant, and 21% remaining in the gas plant feed and fuel. The CO2 produced by the utilities for
operating the Selexol processes is 256 t/d. The shutdown of the amine plant makes available steam from the sulphur plant which is used to generate electricity. This results in a credit for CO2 avoidance at a
power plant of 1039 t/d of CO2. The gross CO2 capture and production rate of CO2 for EOR is 628 t/d, but the net reduction of CO2 released to the atmosphere is 1411 t/d (628 - 256 + 1039).
• 40

SELEXOL
1
Acid Gas 186 t/D CO2 SULFUR
MP- PLANT
SELEXOL
CO2 628 t/D CO2 DEHYD. PP 4.
COMP. Clean Gas 148 t/D CO2
Ill GAS op. PLANT Fuel 63 t/D CO2
FIGURE 5.4 CASE 4A TWO STAGE SELEXOL GAS TREATMENT
Raw Sour Gas --1111P- 1025 t/D CO2
CO2 Recovery 61% CO2 to SRU 18% CO2 to Gas Plant 21%
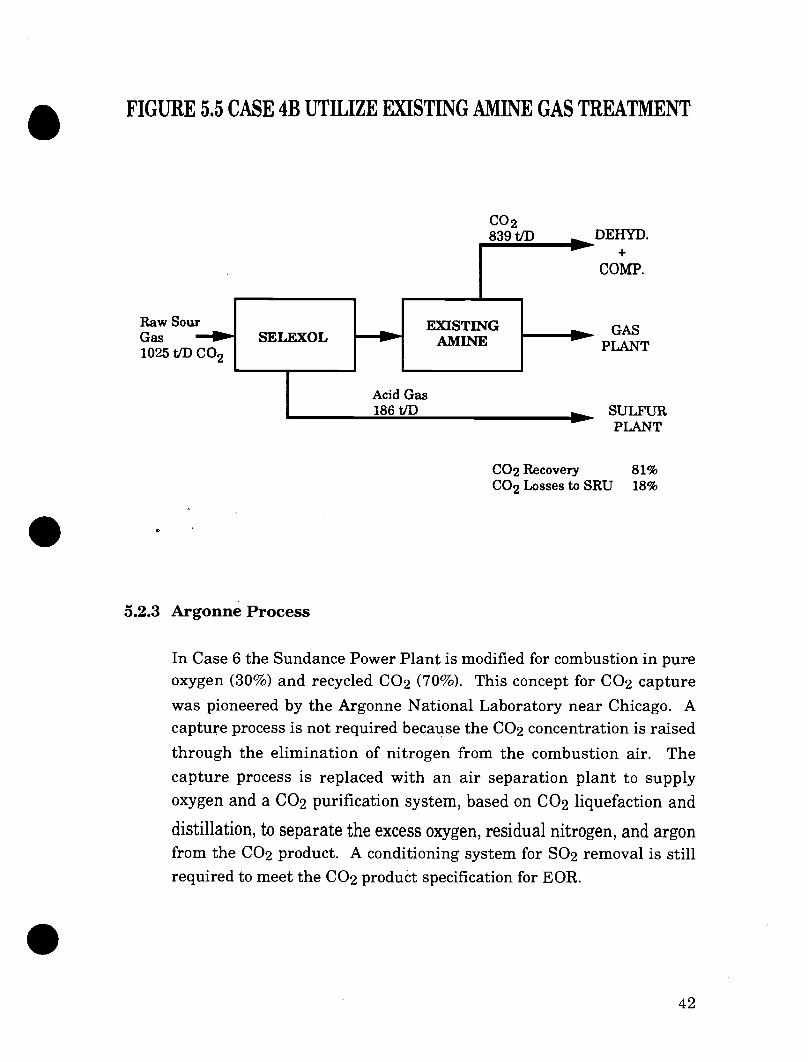
In Case 4B (Figure 5.5), the existing amine plant is utilized for CO2 capture following H2S removal using Selexol. The capital cost savings
using the existing amine plant is $31 million (99 - 68) but the energy requirements and resultant operating costs are over twice as high, $34.93 vs $16.21 per tonne of CO2 captured, more than compensating
for the higher capital costs.
Although the gross CO2 recovery at 82% (840 t/d) is higher in the amine/Selexol case, the net reduction in CO2 released to the
environment is more (1158 t/d vs 1411). The higher steam requirement of CO2 desorption from amine results in less surplus steam from the
sulphur plant being available for electrical power generation.
•
•
• 41
EXISTING AMINE
GAS PLANT
Raw Sour Gas —MP- SELEXOL 1025 t/D CO2
CO2 839 t/D DEHYD.
COMP.
Acid Gas 186 t/D SULFUR
111, PLANT
• FIGURE 5.5 CASE 4B UTILIZE EXISTING AMINE GAS TREATMENT
CO2 Recovery 81% CO2 Losses to SRU 18%
5.2.3 Argonne Process
In Case 6 the Sundance Power Plant is modified for combustion in pure oxygen (30%) and recycled CO2 (70%). This concept for CO2 capture
was pioneered by the Argonne National Laboratory near Chicago. A capture process is not required because the CO2 concentration is raised
through the elimination of nitrogen from the combustion air. The
capture process is replaced with an air separation plant to supply oxygen and a CO2 purification system, based on CO2 liquefaction and
distillation, to separate the excess oxygen, residual nitrogen, and argon from the CO2 product. A conditioning system for S02 removal is still
required to meet the CO2 product specification for EOR.
•
• 42

The table below compares the two options for CO2 capture at the
Sundance Power Plant.
TABLE 5 1 SUNDANCE POWER PLANT OPTIONS
CASE 2 AMINE
CASE 6 ARGONNE
Gross CO2 Capture (t/d) 37440 37440
CO2 From Utilities (t/d) 12481 12307
Net CO2 Capture (t/d) 24959 25133
Capital Cost ($Million) 207.16 247.45 ($/gross tonne) 310.76 368.45
Operating Costs ($Million/y) 341 307.9 ($/gross tonne) 24.95 22.52
Within the accuracy of this study there is no clear advantage of one
option over the other.
5.3 COMPRESSION AND PURIFICATION
In all cases the captured CO2 has to be dehydrated and compressed to
dense phase conditions for pipeline transmission. Water removal is required to prevent corrosion from carbonic acid, two phase flow and freezing problems. Interstage cooling and condensed water knockout during compression removes most of the water. The remainder is removed using triethylene glycol, the normal dehydration process used in natural gas processing.
Compression of CO2 from atmospheric pressure to pipeline conditions
of 14 MPa (2030 psia) is another energy intensive process typically requiring 110 kWh per tonne of CO2. Since coal fired power stations
typically produce 1100 kWh per tonne of CO2 emitted, the CO2
•
•
43

•
•
compression alone will require the equivalent of about 10% of the
power plant output.
As shown on Figure 5.2 compression is a major portion of the plant,
(with a range from 19% to 57%) typically representing 30% of capital
cost.
For the large scale cases, compression is provided by multistage centrifugal compressors similar to those used as major natural gas pipeline compressors. In the power plant cases these are driven by gas turbines which also cogenerate electricity and steam for amine regeneration. For the smaller cases (4 and 5) where CO2 capture is
about 1000 t/d, four stage reciprocating compressors are used. Once the CO2 is compressed to dense supercritical conditions it is handled
like a liquid using centrifugal pumps.
Where amine has been used as the capture process no further purification is required to meet the EOR specification. There are no potential savings for reducing the specifications except in the gas plant case where the H2S specification (20ppm) has limited process choices and reduced CO2 capture efficiency.
Liquefaction and distillation is used to purify CO2 in Case 6 (Sundance-Argonne). The CO2 stream from the power plant contains about 2% to 3% excess oxygen which is separated from the CO2 product
and recycled back to the power plant. A refrigeration system using propane as the refrigerant to provide the liquefaction temperature of -4°C (25°F) at a reasonable pressure (4.8 MPa) (693 psia). A similar refrigeration/liquefaction process is used in the EOR field facilities for purification of recycled CO2 and the removal of inerts such as nitrogen
and light hydrocarbon gases.
• 44

5.4 GROSS AND NET CO2 CAPTURE
The basic task of this study has been to determine the cost of CO2 capture and the benefits from enhanced oil recovery through CO2 flooding. The key parameter is the amount of CO2 captured and injected into the reservoir, the "Gross CO2. The economics of capture and utilization are based in this study on the Gross CO2 captured.
However, the main reason for capturing CO2 is to achieve an
environmental benefit, to have a major impact on the rate of growth of CO2 emissions to the atmosphere. To measure this, a "Net CO2" is calculated which takes into consideration the CO2 emissions related to capture and utilization. From the Gross CO2, the CO2 emissions to drive the capture and compression processes and the CO2 emission in EOR are deducted. Any CO2 emission avoidance due to the recovery
process is added as a credit.
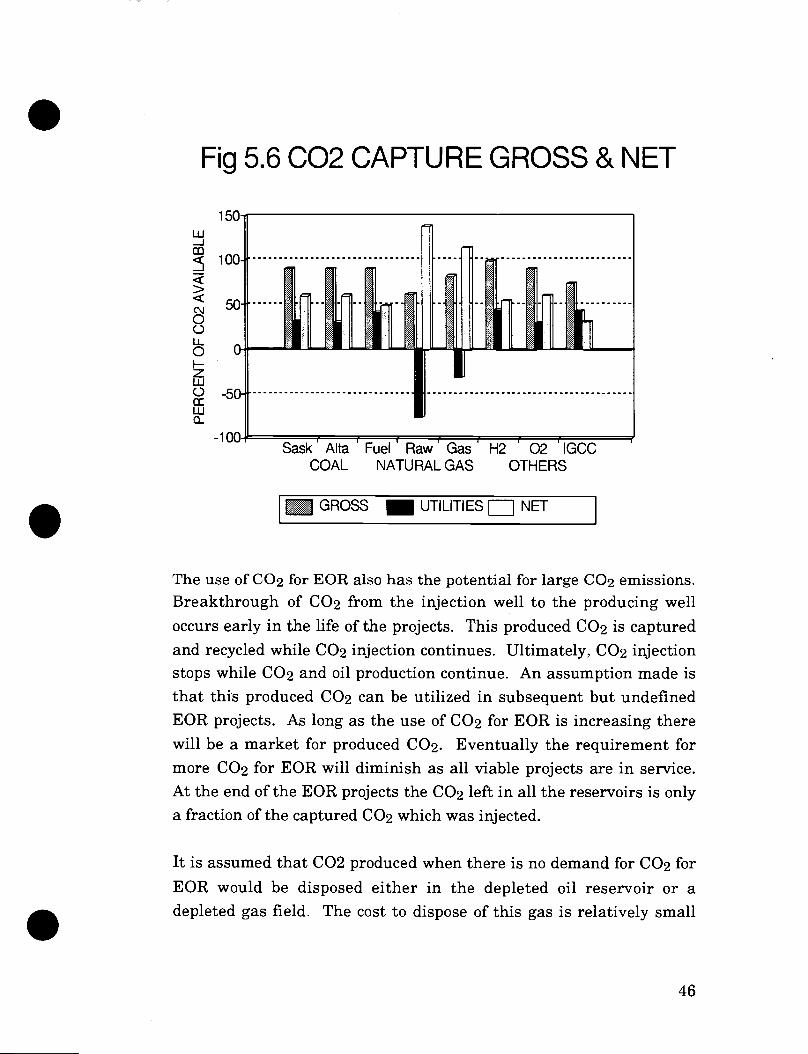
The capture of CO2 is an energy intensive process particularly for amine regeneration and CO2 compression. Figure 5.6 summarizes the
Gross and Net CO2 captured with respect to the CO2 available. Even
with typical capture efficiencies of 90%, the typical net CO2 reduction
in emissions is 50% to 60% of the CO2 available for capturing. The net c02 is typically 67% of the Gross CO2 captured.
Case 4, the natural gas processing plant, is anomalous due to the substitution of physical absorption (Selexol) for the existing chemical absorption (amine) process and surplus energy available from the Claus Process furnaces of the sulphur plant.
•
•
45
•
•
Fig 5.6 002 CAPTURE GROSS & NET
Sask Alta Fuel Raw Gas H2 02 IGCC COAL NATURAL GAS OTHERS
GROSS UTILITIES NET
The use of CO2 for EOR also has the potential for large CO2 emissions. Breakthrough of CO2 from the injection well to the producing well
occurs early in the life of the projects. This produced CO2 is captured
and recycled while CO2 injection continues. Ultimately, CO2 injection stops while CO2 and oil production continue. An assumption made is
that this produced CO2 can be utilized in subsequent but undefined
EOR projects. As long as the use of CO2 for EOR is increasing there
will be a market for produced CO2. Eventually the requirement for
more CO2 for EOR will diminish as all viable projects are in service.
At the end of the EOR projects the CO2 left in all the reservoirs is only
a fraction of the captured CO2 which was injected.
It is assumed that CO2 produced when there is no demand for CO2 for
EOR would be disposed either in the depleted oil reservoir or a
depleted gas field. The cost to dispose of this gas is relatively small
•
46
SASKATCHEWAN ALBERTA
PoSjItIROAFNcr (CARSON CRIB RESERVOIR
(H,_LNLAN-ROBB
CAS PLANT
REDVATER RESERVOIR BI-PROVINE
UPCR.ADER
ED•OPRON
NOVA= 10FPRE PLANT )
• CALGARY
AMAMIRESERVOIR
PEMBINA RESERVOIR
because there is no capture cost and the infrastructure would be in
place for compression, transmission and injection.
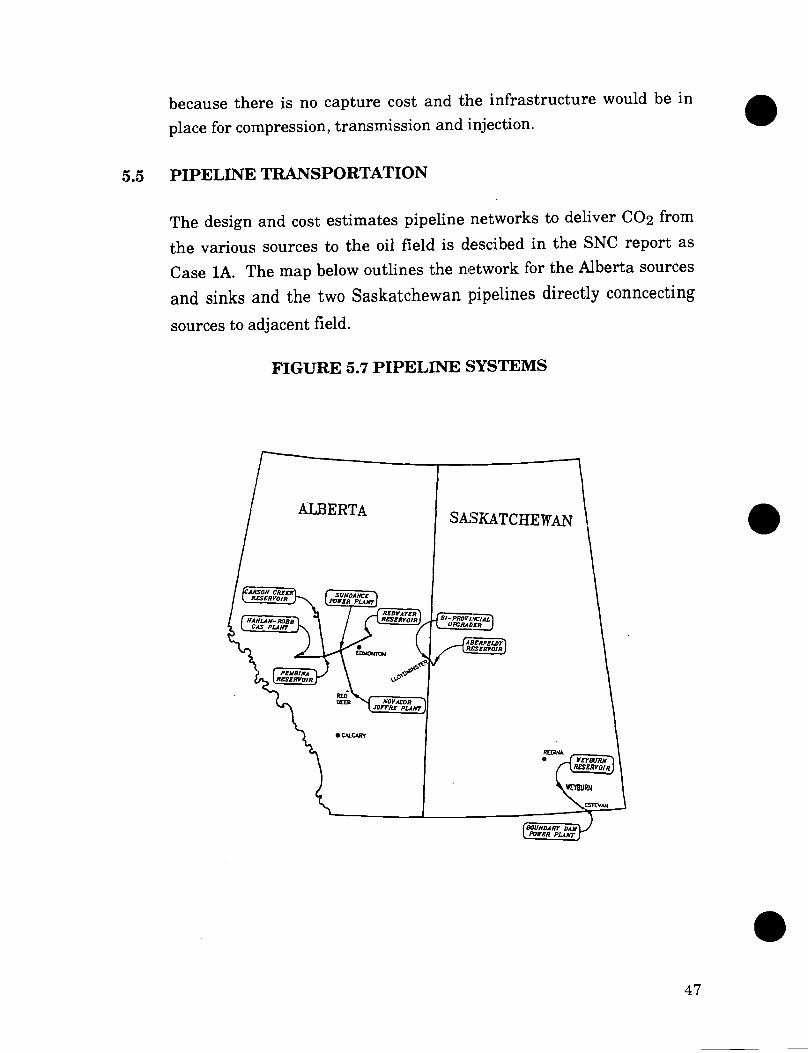
5.5 PIPELINE TRANSPORTATION
The design and cost estimates pipeline networks to deliver CO2 from
the various sources to the oil field is descibed in the SNC report as
Case 1A. The map below outlines the network for the Alberta sources
and sinks and the two Saskatchewan pipelines directly conncecting
sources to adjacent field.
FIGURE 5.7 PIPELINE SYSTEMS
•
47

48
70 10 0 0 40 50
do CAPACITY (tonnes/day)
(Thousands)
The pipeline design is based on the AGA Equation which has been recommended for dense phase CO2 pipelining (Farris, 1983). The
pipeline capital costs are based on a cost factor of $18,750 per diameter inch per kilometer. The cost of transporting CO2 by pipeline are
derived in the Economics report and summarized in Chapter 8.0 of this report.
The cost of transporting CO2 from the sources by the pipeline network
is relatively small due to the large volume moved, the relatively short distances and the low pressure drop for dense phase fluids. For the Alberta pipeline network typical transportation costs were $2/tonne. For the shorted dedicated lines in Saskatchewan the costs were only $.58 to $.76/tonne. The delivered price for CO2 is dominated by the
cost of capture which is typically over $50/tonne.
The design and cost equations can be worked together to produce the generalized pipeline cost/capacity curve shown in Figure 5.8. This is based on annual capital charges of 16% and does not include compression costs.
Fig 5.8 002 TRANSPORTATION PIPELINE CAPACITY vs COST
•
• 4
'.. 10" 1.5— ----- 1— - - -12""
cn 14" 0 1 _1 o T8" 20"
0.5 22" 24" • 28"
0 •

OP —0 r 1PM rnZ OM 0> <Z mo X1rn -<0

• 6.0 ENHANCED OIL RECOVERY (EOR)
6.1 INTRODUCTION
Conventional oil recovery leaves most of the original oil in place (00IP)
in the reservoir. Primary recovery methods using the natural reservoir
energy and artificial lift methods typically recover 5% to 20% of 00IP.
Secondary recovery techniques such as water flood or gas injection for
pressure maintenance are used to recover a further 10% to 20% but
most of the oil remains underground. This residual oil saturation is a
small film of oil held by surface tension and capillary forces to the
pores and voids in the rock.
Enhanced Oil Recovery processes are used to reduce this residual oil
saturation and obtain further oil production. A number of EOR
techniques are in commercial use including miscible and immiscible
flooding, solvent flooding, and polymer flooding. All techniques
attempt to mobilize and recover the oil by reducing the capillary forces • due to interfacial tension.
Carbon dioxide is used in EOR as both a miscible and immiscible solvent. The initial effect of CO2 is to dissolve in the oil reducing the
viscosity and causing the oil to swell. These effects can be large even when the oil and CO2 are separate (immiscible) phases. Viscosity
reductions by orders of magnitude are possible due to the very low viscosity of CO2. Swelling of up to 50% is possible with sufficient
dissolved CO2. Both effects can increase oil mobility and production.
At a high enough pressure, defined as the minimum miscibility pressure (MMP), sufficient CO2 will dissolve in the oil, and oil in the
CO2, that the interface between the fluids disappears. They become a
single phase fluid, like ethanol mixed with water rather than like oil
mixed with water. The interfacial tension vanishes with the
disappearance of the interface. The capillary forces holding the oil in
the pore are dramatically reduced so the oil can be mobilized and • displaced to the production well.
49

In Western Canada, light hydrocarbon gases, in particular ethane, have been effectively used for miscible flooding. The choice of ethane has been based on availability (from natural gas), price, and expected recovery of both oil and gas. Hydrocarbon miscible flooding accounted for almost 30% of the oil produced in Canada in 1990: The total established reserves for hydrocarbon floods are 513 x 106 m3 (3.2 billion barrels) in 53 pools representing 23% of Alberta's total conventional crude oil reserves. Further miscible floods could add 175 x 106 M3 (1.1 billion barrels) to these reserves (Scott, 1992).
In the U.S., CO2 is the fluid of choice for miscible flooding. In 1990
over 50 projects produced almost 16,000 m3/day (100,000 BPD) (Moritis, 1990, Hadlow, 1992). Low cost CO2 from natural reservoirs has been used for most of these projects but CO2 capture from flue gas
has been commercially practiced in Texas.
For successful CO2 flooding the following reservoir conditions and oil
characteristics are important. The reservoir temperature must be above 31°C, the critical point for CO2 to exist as a supercritical fluid
with no gas/liquid interface. The reservoir pressure must be above the minimum miscibility pressure (MMP) for the oil in order to ensure miscible mixing. The reservoir fracture pressure must be above MMP to prevent fracturing of the reservoir rock creating high permeability thief zones. The mobility (relative permeability divided by viscosity) of the oil and CO2 should be similar. If the mobility ratio is not close to 1,
flow instabilities such as viscous fingering can occur. The fluid
densities should also be similar to avoid gravity override. Both viscous fingering and gravity override can result in early breakthrough and
poor sweep efficiency. Both mobility ratio and density indicate that the best candidates for CO2 flooding are light, low viscosity crude oils.
C 02 flooding can be improved using water as the driving fluid following the injection of a CO2 slug or as an alternating process, water
alternating gas (WAG).
•
50
•
•
•
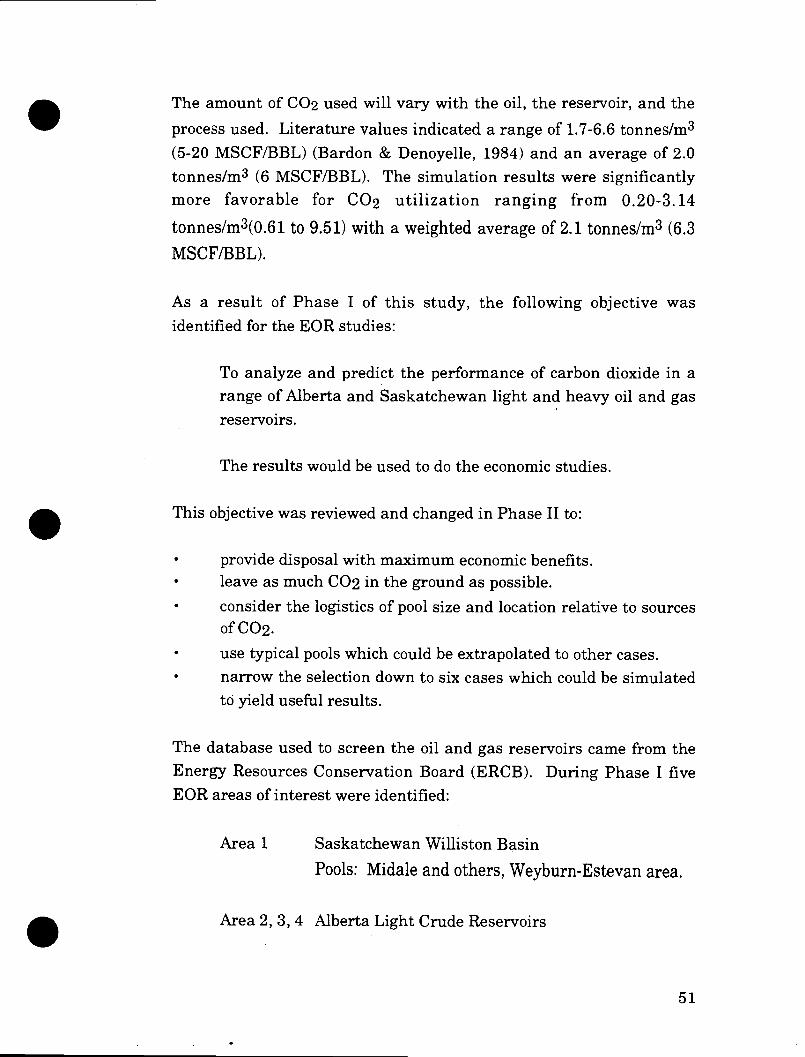
The amount of CO2 used will vary with the oil, the reservoir, and the
process used. Literature values indicated a range of 1.7-6.6 tonnes/m3 (5-20 MSCF/BBL) (Bardon & Denoyelle, 1984) and an average of 2.0 tonnes/m3 (6 MSCF/BBL). The simulation results were significantly more favorable for CO2 utilization ranging from 0.20-3.14
tonnes/m3(0.61 to 9.51) with a weighted average of 2.1 tonnes/m3 (6.3
MSCF/BBL).
As a result of Phase I of this study, the following objective was identified for the EOR studies:
To analyze and predict the performance of carbon dioxide in a range of Alberta and Saskatchewan light and heavy oil and gas reservoirs.
The results would be used to do the economic studies.
This objective was reviewed and changed in Phase II to:
provide disposal with maximum economic benefits. leave as much CO2 in the ground as possible.
consider the logistics of pool size and location relative to sources of CO2. use typical pools which could be extrapolated to other cases. narrow the selection down to six cases which could be simulated to yield useful results.
The database used to screen the oil and gas reservoirs came from the Energy Resources Conservation Board (ERCB). During Phase I five EOR areas of interest were identified:
Area 1 Saskatchewan Williston Basin
Pools: Midale and others, Weyburn-Estevan area.
Area 2, 3, 4 Alberta Light Crude Reservoirs
51

Pools: Cooking Lake System-Leduc, Woodbend, Bonnie Glenn, Redwater, Acheson, Cardium-Pembina, Keg River, Rainbow Note: Fenn Big Valley and Buffalo Coulee were added to the screening list in Phase II.
Area 2A Depleted Natural Gas Reservoir
Area 5 Saskatchewan Heavy Crude Oil Reservoirs: Senlac, Tangleflags, Aberfeldy, Lloydminster
It was important to select reservoirs from different geographical areas with different crude oil characteristics and different reservoir geological settings.
The screening criteria for the CO2 miscible horizontal floods were:
1. ' Areal Extent 2. Oil Density < 876 kg/m3 3. Depth > 915 m
4. Area > 70 ha
For CO2 miscible vertical floods the criteria were:
1. Pay Thickness 2. Oil Density < 876 kg/m3
3. Depth > 915 m 4. Area < 1650 ha.
The CO2 immiscible floods were selected using:
1. Pay Thickness 2. Oil Density 876-970 kg/m3 3. Pool Area < 70ha
52

The screening criteria for CO2 injection was that the pools must currently be undergoing enhanced recovery. •
•
•
It was expected that the potential project life would be at least 10 years. The selected reservoirs would be used to dispose of 50,000
tonnes of CO2/day over a 15 year period. Both EOR fields and depleted
gas fields could be used to dispose of the targetted quantity of CO2.
Additional characteristics for the gas reservoirs were:
high relief carbonate reef sealed depleted
The types of gas wells considered are:
active bottom aquifer e.g. Leduc gas blowdown fully completed gas reservoir e.g. Westrose dry gas reservoir e.g. Pine Creek.
Carson Creek gas field was chosen by the EOR Committee as the study case for CO2 injection into depleted gas reservoirs.
The final selections for oil reservoirs, outlined on Table 6.1, were:
Elswick for a Saskatchewan light crude extrapolatable to the
larger Weyburn, Midale and Steelman reservoirs. It is a dolomite limestone reef from the Midale Beds of Mississipian age.
Pembina with five prototypes i.e. Pembina Sandstone, Pembina Conglomerate, Cynthia-Cardium, Berrymoor, and Amoco "A". All are predominantly sandstone structures in the Upper Cretaceous Cardium formation.
53
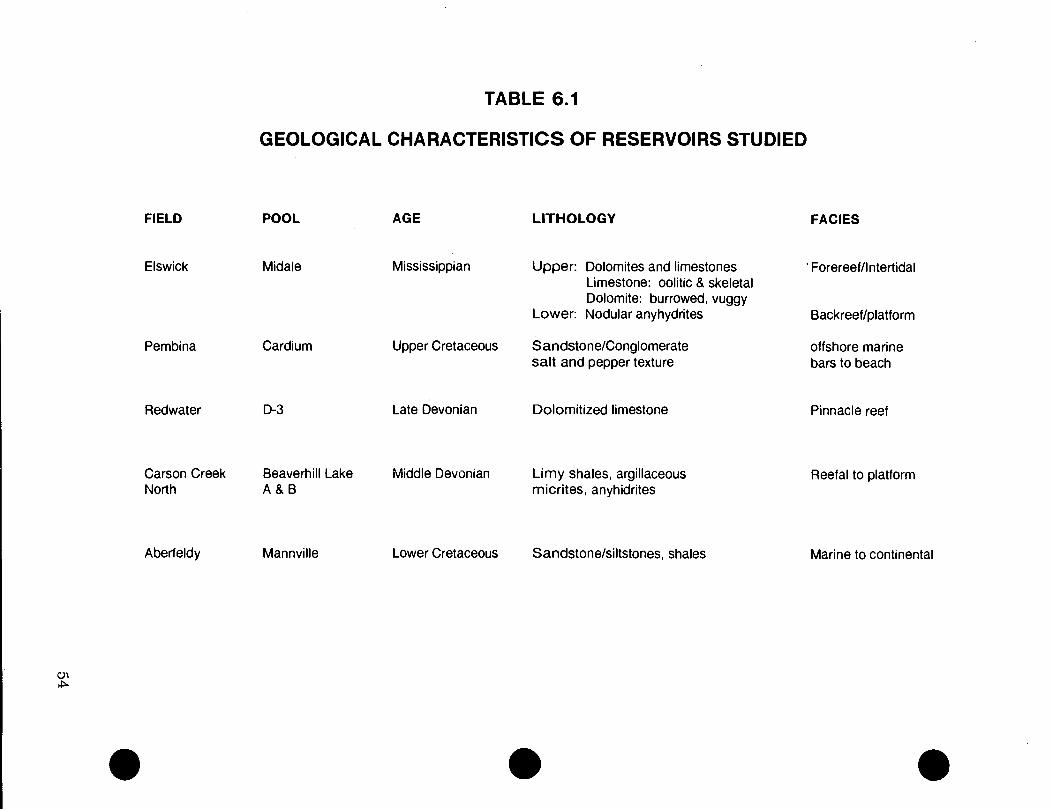
TABLE 6.1
GEOLOGICAL CHARACTERISTICS OF RESERVOIRS STUDIED
FIELD POOL AGE LITHOLOGY FACIES
Elswick Midale Mississippian Upper: Dolomites and limestones ' Forereef/lntertidal Limestone: oolitic & skeletal Dolomite: burrowed, vuggy
Lower: Nodular anyhydrites Backreef/platform
Pembina Cardium Upper Cretaceous Sandstone/Conglomerate salt and pepper texture
offshore marine bars to beach
Redwater D-3 Late Devonian Dolomitized limestone Pinnacle reef
Carson Creek Beaverhill Lake Middle Devonian Limy shales, argillaceous Reefal to platform North A & B micrites, anyhidrites
Aberfeldy Mannville Lower Cretaceous Sandstone/siltstones, shales Marine to continental
• • •

•
•
•
Redwater D-3 pool since it is large, with 50 m thick pay and high horizontal and low vertical permeability.
Carson Creek North, a Devonial reef typical of the Beaver Hill Lake group. Extension is possible to similar reservoirs such as Swan Hills, Virginia Hills and Judy Creek.
Aberfeldy for a Saskatchewan heavy crude oil, because of its proximity to the Bi-Provincial Upgrader, its history of waterflooding, well to well continuity and its similarity to other
Lloydminster pools. This is a sandstone in the Sparky Formation of the Mannville Group of Lower Cretaceous age.
Once the reservoirs were selected, TCA Engineering carried out mechanistic studies and then field project studies. Both of these types
of studies were done with close interaction with the operators of the
fields. The operators were responsible for economic and technical
questions and the EOR Committee was responsible for policy, project and general direction of the overall study. The mechanistic studies were essentially screening runs of the MULTIFLOOD numerical simulator for geological prototypes representative of the entire
reservoir. A geological prototype is a combination of well configuration and a geological model. This screening was carried out to determine the best CO2 displacement process for the candidate reservoir.
Throughout the reservoir studies the emphasis was on the most attractive oil recovery process providing the best economics. This recognizes that any process optimizing CO2 storage at the expense of
economical oil recovery would not be undertaken by a prudent operator. This approach will also identify the true costs of using CO2 for EOR and the amount of CO2 potentially stored. These numbers are required before any consideration could be given to maximizing CO2
storage.
MULTIFLOOD is a numerical reservoir simulator described in TCA's report. The reservoirs were simulated using parameters provided by the operators. Optimization included vertical versus horizontal floods,
55
various drilling patterns, differing locations of injectors and producers,
recognition of reservoir anisotropies, various slug processes, and
different WAG procedures.
• The most important parameters used in the screening were:
1. Original Oil In Place (00IP): The larger the reservoir the larger the potential for CO2 disposal and oil recovery.
2. Ultimate recovery (%00IP): This value, and the value of the
current recovery, provide measures of the reservoir
susceptibility and conformance to flooding, the target for an enhanced recovery process, and where the reservoir stands with
regard to its exploitation history.
3. Recovery Mechanism: This reflects the pool exploitation history, and suggests whether the field has been considered for a recovery process other than primary depletion.
4. Depth, Initial Pressure, Saturation Pressure, Fracture Pressure and Temperature: CO2 displacement processes are
highly sensitive to pressure. Generally, for a given reservoir temperature, there is a pressure above which CO2 is miscible
with the reservoir crude oil. This is the minimum miscibility pressure (MMP). It is possible to estimate this pressure using
the reservoir temperature. The miscibility pressure is higher
than the current saturation pressure. Therefore, the saturation
pressure provides the lower limit for the MMP.
There is a maximum pressure above which the reservoir will
fracture known as the reservoir fracture pressure. It is known directly or estimated as a function of depth. Miscible floods can only occur when the reservoir fracture pressure is greater than the MMP. The initial reservoir pressure is also important. If it is low relative to the MMP and the reservoir fracture pressure is
•
56

•
•
higher than the MMP then further pressure can be put on the reservoir. The difference between MMP and current reservoir pressure is a measure of the effort required to prepare a reservoir for miscible displacement.
5. Reservoir Type: By comparing certain attributes of the candidate reservoirs with known CO2 performance parameters, some likely features of a CO2 displacement can be anticipated.
For example, sandstone reservoirs, if strongly water-wet, are less responsive than carbonate or limestone reservoirs to the water-alternating-gas (WAG) processes. This is because, in strongly water-wet reservoirs, water tends to shield the residual oil from contact by the CO2 miscible solvent. Further, in
reservoirs that exhibit mixed or oil-wetness, there appears to be an intrisic mobility control for the injected CO2 solvent that
probably derives from hysteresis in the relative permeability functions. Except for one case, where the operator actually provided TCA with relative permeability functions that included the hysteresis loop, this feature was not included in the mechanistic studies as results would have been unsupported by laboratory data. This omission adds a small element of conservatism to the predicted oil recovery performances.
As another example of the influence of reservoir type,
conglomerate zones within reservoirs tend to have high flow capacities and hence, tend to be thief zones for any injected fluid. This lowers the vertical sweep efficiency of a process and can result in economically unacceptable oil recovery levels.
6. Oil Density (deg API): This is another qualitative measure of the responsiveness of the reservoir to CO2 flooding. For a given
temperature, the higher the API, the lower the oil viscosity is likely to be. This, in turn, results in' a better CO2-oil mobility
ratio and, usually, a more efficient miscible displacement process. In heavier oil reservoirs, immiscible CO2 processes can
be considered. Here, incremental oil recovery is obtained by
57

improving the mobility ratio of a waterflood and thus, extending the economic life of the displacement process.
7. Operator: The intent of an operator to support the study was critical to its success. Only the operator could provide details of reservoir description, fluid description, saturation functions, operating constraints, and field history.
Once the parameters for the mechanistic studies were computed the individual prototype information was put into a numerical simulator called FLDPROJ. The input data are provided in Table 6.2. The results have been summarized in Table 6.3.
6.2 RESERVOIR ANALYSES
6.2.1 Carson Creek North
This is a reef formation. The input parameters are summarized in Table 6.2. A vertical miscible flood using a 1:1 WAG process was chosen for the computer simulations. There are 3 geological zones: B-Pool transition region, B-Pool rim region and A-Pool.
Recovery was not what was expected. This was caused by incomplete sweep of the reservoir volume increased geological heterogenity and low recovery in the lagoonal area of the reservoir.
The CO2 scheme was implemented in two phases in order to optimize
costs and use of surface facilities.
Results of the EOR process are provided in Table 6.3. The injection of 24.6 x 10⁶ tonnes (468 BSCF) CO2 recovers an additional 49.2 million
standard barrels of oil (MMSTBO) over a 16.5 year period. This represents an additional 13.4% of the original oil in place (00IP). While doing this 7.8 x 10⁶ tonnes (148 BSCF) of CO2 are stored in the
ground. Based on cumulative numbers, it takes 1.84 tonnes/m3 (5.57
MSCF/STBO) to recover this oil.
•
•
• 58

• • • TABLE 6.2 - ENHANCED OIL RECOVERY DATA INPUT PARAMETERS
Reservoir Location Operator Formation Production Miscibility CO2
Flood Well
Configuration Slug
Process Prototype Water Cut
001P MMSTB
Carson Creek North Central Mobil Reef Light Crude Miscible Vertical 1/4 - 5 spot/320 ac 0.45 HPV 3 0.99 366 Alberta
Pembina NPCU 51* Central Mobil Sandstone Light Crude Miscible Vertical 325/5 spoV80 ac 0.6 HPV 1 0.98 738 Alberta Central Mobil Conglomerate/ Light Crude Miscible Vertical 106/5 spot/80 ac 0.6 HPV 1 0.98 382 Alberta Sandstone
Amoco "A" Central Amoco Conglomerate/ Light Crude Miscible Horizontal 120/1/2 5 spot/80 ac 0.4 HPV 1 0.98 186 Alberta Sandstone
Cynthia-Cardium Central Esso Sandstone Light Crude Miscible Vertical 96/1/4 5 spot/80 ac 0.4 HPV 1 0.98 47
Unit h3 Alberta
Berrymoor Central Esso Conglomerate/ Light Crude Miscible Vertical 160/1/4 5 spot/40 ac 0.64 HPV 1 0.98 217
Unit h10 Alberta Sandstone Central
Redwater Alberta Esso 0-3 Light Crude Miscible Vertical 480/1/2 5 spot 1.0 HPV 1 0.99 1060 South
Elswick Eastern West Coast Carbonate Light Crude Miscible Vertical 16/1/4 9 spot/80 ac 0.5 HPV 1 0.95 27 Saskat- chewan
Western
Aberfeldy Saskat- chewan
Husky Sandstone ' Heavy Crude immiscible Vertical 259/5 spot/40 ac 2 mol % 1 0.94 594
Carson Creek Central
Gas Alberta Mobil Reel Gas N/A Vertical N/A N/A N/A N/A
TABLE 6.3 - ENHANCED OIL RECOVERY STUDY RESULTS
Reservoir Location Operator Formation Production Miscibility CO2
Flood
Incremental 011 Recovery
(KNASTB) Net MSCF/
incr. bb. of Oil 1.1 WAG CO2 Disposal
(Bscf) CO2 lnj. (Bscf)
001P MMSTB
Carson Creek North Central Mobil Reel Light Crude Miscible Vertical 49.2 3.2 1:1 148 469 366 Alberta
Pembina NPCU tit ' Central Mobil Sandstone Light Crude Miscible Vertical 89.3 1.8 1:2 165 1121 738 Alberta Central Mobil Conglomerate/ Light Crude Miscible Vertical 51.5 2.5 1:2 107 574 382 Alberta Sandstone
Amoco "A" Central Amoco Conglomerate/ Light Crude Miscible Horizontal 27.6 .01 0 6 206 186 Alberta Sandstone
Cynthia-Cardium Central Esso Sandstone Light Crude Miscible Vertical 4.2 6.5 Water 25 54 47
Unit h3 Alberta Drive
Berrymoor Central Esso Conglomerate/ Light Crude Miscible Vertical 27.6 2.2 1:1 61 387 217
Unit h10 Alberta Sandstone Central
Redwater Alberta Esso D-3 Light Crude Miscible Vertical . 69.4 7.8 1:1 660 689 1060 South
Elswick Eastern West Coast Carbonate Light Crude Miscible Vertical 5.6 2.4 1:1 10 25.5 27 Saskat- chewan
Western
Aberfeldy Saskat- chewan
Husky Sandstone Heavy Crude Immiscible Vertical 118.4 0.73 2 mol% 66 167 594
Carson Creek Central
Gas Alberta mobil Reel Gas N/A Vertical N/A N/A N/A 300 307 N/A

6.2.2 Mobil Pembina Cardium Sandstone •
This case represents one of five Pembina Cardium geological prototypes. All ar dominated by sandstone and are found in the Cardium unit. This prototype, operated by Mobil, is a moderately stratified sandstone zone.
A vertical CO2 flood with a 1:2 WAG process is used to produce
incremental quantities of light crude. Production is affected by an unfavorable mobility ratio, and heterogenous reservoir structure which result in poor vertical sweep efficiency. Within the reservoir there is a shale layer with a low permeability zone below it. Stratification and gravity effects change responses in the oil saturation zone. The 1:2 WAG improves the reservoirs response.
The incremental oil production is 89.3 MMSTBO or 12.1% of the 738 MMSTBO in place. CO2 storage was 8.7 x 10⁶ tonnes (165.4 BSCF).
Approximately 1.70 tonnes/m3 (5.13 MSCF/STBO) are required to recover the incremental oil.
6.2.3 Mobil Pembina Cardium Conglomerate/Sandstone
Another Pembina Cardium prototype represents a conglomerate over sandstone geological sequence. The conglomerate region is 1.7 times as permeable as the sandstone. This causes the conglomerate to act as a thief zone for the sandstone. The input parameters to the simulator are provided in Table 6.2.
A miscible vertical flood with a 1:2 WAG process produced an
incremental 8.19 x 10⁶ m3(51.5 MMSTBO) on 13.5% of the 00IP. Over 30.6 x 10⁶ tonnes (574 BSCF) CO2 are injected to recover this oil. Once the process is complete 5.6 x 10⁶ tonnes (107 BSCF) of CO2 are
stored in the reservoir. About 1.43 tonnes/m3 (4.32 MSCF/STBO) are required for the incremental oil production. •
60

•
•
•
6.2.4 Pembina Amoco "A" Lease
This Cardium formation prototype represents leases operated by
Amoco. It consists of four zones. Uppermost is a conglomerate
followed by Zone 2, a sandstone. Under this is Zone 3 which is
unproductive followed by a sandstone in Zone 4. The conglomerate is
highly permeable and reduces production capacity. In addition, the
sandstones have a lot of vertical variation in horizontal permeability, which reduces the sweep efficiency of CO2 floods.
The oil in the Zone 2 sandstone and the conglomerate (Oil 1) is heavier
than that in Zone 4 (Oil 2).
The permeability in the SW-NE direction is 1.8 times that of the
offtrend direction.
Additional recovery problems result from the wide well spacing and
tightness of the geological formation. The best results came from the
placement of one horizontal well at the bottom of Zone 2 and another at
the bottom of Zone 4. Injection of 0.4 Hydrocarbon Pore Volumes (HPV) CO2 followed by a water drive to a 0.98 watercut provided an
incremental recovery of 13.7% 00IP over a 50 year period.
The incremental oil recovery was 4.38 x 10⁶ m3 (27.55 MMSTB). This required injection of 10.8 x 10⁶ tonnes (206 BSCF) of CO2 over 28
years. In order to obtain the oil 1.13 tonnes/m3 (3.41 MSCF/STBO)
have to be injected. Approximately 0.32 x 10⁶ tonnes (6.1 BSCF) of CO2 are disposed in the reservoir.
6.2.5 Esso Pembina Cynthia Cardium Unit #3
The leases containing this prototype are operated by Imperial Oil
Canada Limited. There are three sandstone zones with poor
continuity. Only 55% of the sands connect through to the injection
well. The formation has a low permeability (6 md).
61

• A miscible vertical flood using a water drive recovers 6.7 x 10⁶ m3 (4.2
MMSTBO). This takes over 50 years. The results were very poor.
Redoing the study using horizontal wells„as in the Amoco "A" Lease,
may have provided better results but was beyond the scope of this
project.
6.2.6 Esso Pemina Berrymoor Unit #10
Imperial Oil Canada Limited also operates this reservoir. A miscible
vertical flood with 1:1 WAG followed by a water drive was
recommended for the final simulations.
The pay zone has a highly permeable conglomerate over a highly
permeable sandstone. The conglomerate would act as a thief zone
reducing performance of the reservoir. About 4.37 x 10⁶ m3 (27.5
MMSTBO) of incremental oil would be produced. This is 12.7% of 00IP. After 28 years 23.6 x 10⁶ tonnes (387 BSCF) of CO2 would be
injected into the ground. Only 3.2 x 10⁶ tonnes (61.0 BSCF) would be stored. The requirement for CO2 is 1.20 tonnes/m3 (3.63
MSCF/STBO).
6.2.7 Redwater
This lease is a Devonian Leduc Reef reservoir operated by Imperial Oil Canada Limited. A vertical miscible CO2 flood with a 1:1 WAG process
was recommended. Recovery is affected by a poor CO2 mobility ratio
and a high geological heterogeneity. The poor mobility ratio would lead to fingering of CO2 through the oil bank. The geological
heterogenity would reduce recovery efficiency. These factors are enhanced due to density differences between oil and CO2 and the
presence CO2 and brine in the formation. The CO2 would tend to
override the fluids present.
•
• 62

•
•
Other simulation problems could be the result of:
poor miscible process description.
bad reservoir description.
less field heterogeneity than the models.
effects of permeability curve hysteresis.
asphalt precipitation.
The incremental oil recovered was predicted to be 11.03 x 10⁶ m3 (69.4 MMSTB) oil. This requires the injection of 36.2 x 10⁶ tonne (689 BSCF) of CO2 over 14 years. This would leave 34.7 x 10⁶ tonnes (660
BSCF) of CO2 stored in the reservoir. About 3.14 tonnes/m3 (9.51
MSCF/STBO) would be required for recovery.
6.2.8 Elswick
The Elswick Lease is southeast of Weyburn, Saskatchewan. It is a
geological analog of the Midale reservoir. The operator of this field is
West Coast Petroleum. Models were based on work done at Canadian
Roxy Petroleum Limited's North Elswick Oil Pool.
The Elswick sands consist of marly and vuggy rocks with a SW-NE
oriented fracture system. These fractures create a noticeable
permeability anisotropy.
Early CO2 breakthrough and poor conformance due to the fracture
induced anisotropy yielded poor results with continuous CO2 injection.
By adding an infill producer well and converting an ontrend producer
to an injector along with a 1:1 WAG process yields were improved. The project lasts 30 years with 18 years of CO2 injection. The incremental
oil produced is 8.9 x 10⁵ m3 (5.6 MMSTBO). This requires 13.4 x 10⁶ tonnes (25.5 BSCF) of CO2 for injection and leaves 0.5 x 10⁶ tonne (10
BSCF) in the reservoir. About 0.79 tonnes /m3 (2.4 MSCF/STBO) are required for this miscible flood.
63
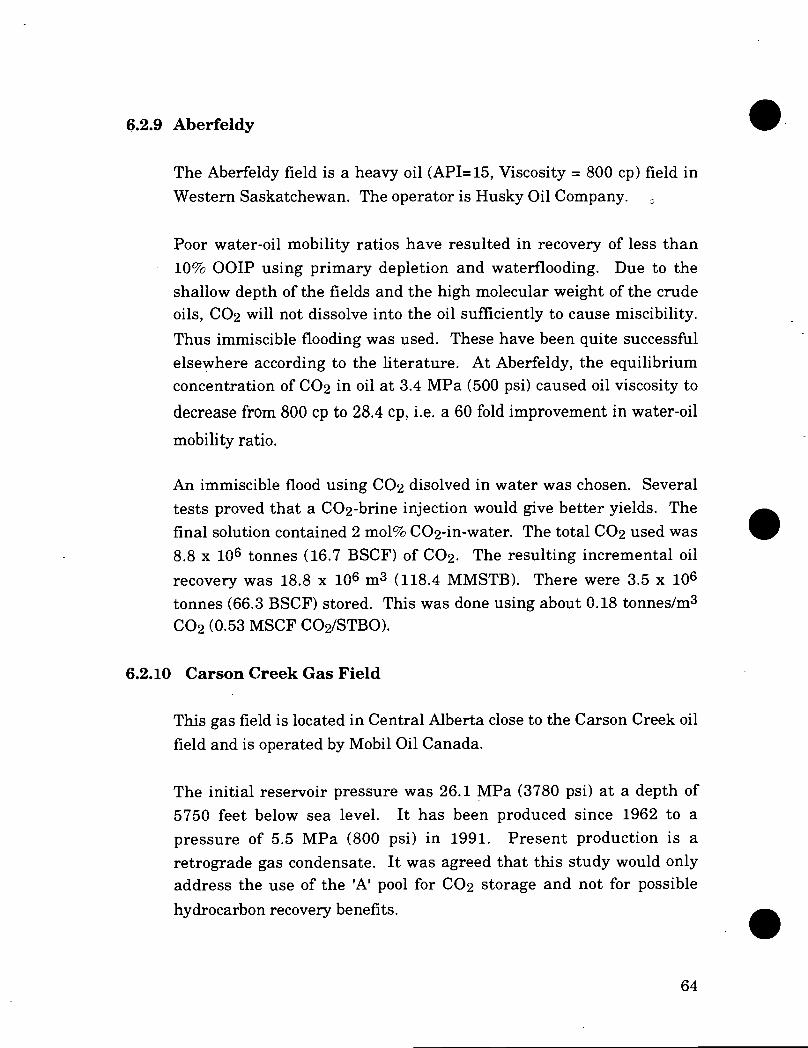
6.2.9 Aberfeldy
The Aberfeldy field is a heavy oil (API=15, Viscosity = 800 cp) field in
Western Saskatchewan. The operator is Husky Oil Company. „
Poor water-oil mobility ratios have resulted in recovery of less than 10% 00IP using primary depletion and waterflooding. Due to the shallow depth of the fields and the high molecular weight of the crude oils, CO2 will not dissolve into the oil sufficiently to cause miscibility.
Thus immiscible flooding was used. These have been quite successful elsewhere according to the literature. At Aberfeldy, the equilibrium concentration of CO2 in oil at 3.4 MPa (500 psi) caused oil viscosity to
decrease from 800 cp to 28.4 cp, i.e. a 60 fold improvement in water-oil
mobility ratio.
An immiscible flood using CO2 disolved in water was chosen. Several tests proved that a CO2-brine injection would give better yields. The final solution contained 2 mol% CO2-in-water. The total CO2 used was 8.8 x 10⁶ tonnes (16.7 BSCF) of CO2. The resulting incremental oil
recovery was 18.8 x 10⁶ m3 (118.4 MMSTB). There were 3.5 x 10⁶ tonnes (66.3 BSCF) stored. This was done using about 0.18 tonnes/m3 CO2 (0.53 MSCF CO2/STB0).
6.2.10 Carson Creek Gas Field
This gas field is located in Central Alberta close to the Carson Creek oil field and is operated by Mobil Oil Canada.
The initial reservoir pressure was 26.1 MPa (3780 psi) at a depth of 5750 feet below sea level. It has been produced since 1962 to a pressure of 5.5 MPa (800 psi) in 1991. Present production is a retrograde gas condensate. It was agreed that this study would only address the use of the 'N pool for CO2 storage and not for possible
hydrocarbon recovery benefits.
•
64

•
•
Both hydrocarbon liquids remaining in the reservoir (8%) and connate water saturation (21%) reduce potential CO2 storage capacity.
The injected CO2 required time to move away from the well into the
rest of the reservoir. If no allowance was made for this, injection rates would have had to be reduced. By varying injection rate and injection pressure, it was found that injection pressure is also a constraint. These constraints are probably a function of reservoir flow capacity. Injection pressure and rate function independently. Together they determine the duration of injection. For any given pressure, the lower the injection rate the longer the pressure can be maintained. Therefore, the cost of maintaining pressure and the length of time the rate is maintained affect cost significantly.
The most favorable results for this study were a 27.6 MPa (4000 psi) injection pressure, injecting 2.6 x 10³ tonnes/day (50 MMSCF/d) of CO2 over 13.5 years which resulted in the storage of 16.1 x 10⁶ tonnes (307 BSCF) of CO2.
6.3 CONCLUSIONS
The EOR simulation results are fundamental to the study objective of disposing of 50,000 tonnes/day of CO2. The results show that EOR
recovery is possible and that good recoveries are attainable. Recoveries between 1-2 tonnes of CO2/m3 of oil (3-5 MSCF of CO2/incremental
barrel of oil) are expected to produce good results. Nevertheless, the CO2 required for EOR in the study fields was less than expected at the
start of the project.
• 65

The results have been summarized in Table 6.3. These results and the studies show that each reservoir must be handled specifically on its own and that responses to EOR vary with:
geological formation geological structure
• miscibility pressure • slug process • oil viscosity (cp) • oil gravity ('API) • depth • temperature
• original reservoir pressure
• well pattern (number, spacing, configuration)
• type of flood (horizontal or vertical) • water alternating gas (WAG) process • formation fracture pressure, and • permeability
to mention a few important parameters.
Modelling and laboratory work help to refine estimates of oil production. Frequently, pilot tests are required to confirm simulations and improve production procedures.
It is very difficult to maximize enhanced oil recovery and to maximize storage of CO2 in the ground at the same time. The question of when to stop oil production and maximize CO2 storage will be determined by
economics, government policies, incentives and public demand.
Although our original objective was to dispose of 50,000 tonnes/day (950.5 MMSCF/d) of CO2, the total from the selected capture sources
show that a slightly greater amount would be captured i.e. 50,684 tonnes/day (964.0 MMSCF/day). Over 15 years this amounts to 277.5 x 10⁶ tonnes (5280 MMMSCF) of CO2.
66

•
•
For the fields studied in this project, the total capability of CO2
disposal in EOR and gas reservoirs over 15 years was 93.7 x 10⁶ tonnes
(1,783 MMMSCF). There was a shortfall of 183.7 x 10⁶ tonnes (3,494
MMMSCF). The shortfall from the study target was due to a lower CO2 utilization requirement than the industry average and a high
recycle of produced CO2 during the injection period.
Information on alternative pools was derived from the ERCB FT 92-18
report for "Alberta's Reserves of Crude Oil, Oil Sands, Gas, Natural
Gas Liquids and Sulphur", and was reviewed with the EOR Committee
and is presented in AOSTRA's economics report. Recognition was
given to three oil reservoir types (sandstone, reef and D-3), differing
fractors of IOIP available for EOR (sandstone 50%, reef 90% and D-3 100%) and to CO2 utilization per barrel of IOIP (sandstone 481
SCF/BB, reef 434 SCF/BBL and D-3 623 SCF/BB) (sandstone 0.16
tonnes/m3, reef 0.14 tonnes/m3, D-3 0.21 tonnes/m3). Over 15 years the
Alberta oil fields could utilize 194.1 x 10⁶ tonnes (3,692 MMMSCF) of CO2 for EOR. This represents 85.1% of the total quantity of CO2
captured in Alberta.
The 14.9% shortfall in Alberta would have to be disposed in the depleted gas reservoirs identified in this study. Estimates were made of disposal capability using various injection pressures and recognizing differences in compressability between CO2 and CH4 (methane).
Between 829.9 x 10⁶ tonnes (15,784 MMMSCF) and 1,105.3 x 106
tonnes (21,023 MMMSCF) could be disposed in depleted gas reservoirs. This is 3 to 4 times the total CO2 captured over 15 years and therefore
much larger than the shortfall.
No analysis of this type was done for Saskatchewan as the data was not readily available.
• 67

EOR - ADD. FIELDS 162.94 58.7%
DISPOSAL - CCG FIELD 12.93 4.7%
EOR - STUDY FIELDS 80.81 29.1%
DISPOSAL - ADD FIELDS 20.82 7.5%
The overall balance for Alberta and Saskatchewan was derived and is
shown in Figure 6.1. • FIGURE 6.1 - BREAK DOWN OF 002 DISPOSAL
OVER THE 15 YEAR PERIOD (MM TONNES)
Of the 278 x 106 tonnes (5280 MMMSCF) of CO2 (100%) being
captured over a period of 15 years, 244 x 106 tonnes (4636 MMMSCF) of CO2 (87.8%) would be utilized for EOR and the balance of 33.8 x 10⁶
tonnes (640 MMMSCF) of CO2 (12.2%) would be disposed in depleted
gas reservoirs. Figure 6.1 also gives a breakdown of CO2 disposition
between the study fields and additional fields.
Thus it is possible to satisfy our objective of disposing of 50,000 tonnes CO2/day over 15 years. It will require the additional oil reservoirs
within 160 km of the study's pipeline infracstructure plus a small
proportion of the gas reservoirs within the same area capable of storing CO2.
68

S3111113V
A a
l3IA
O'L
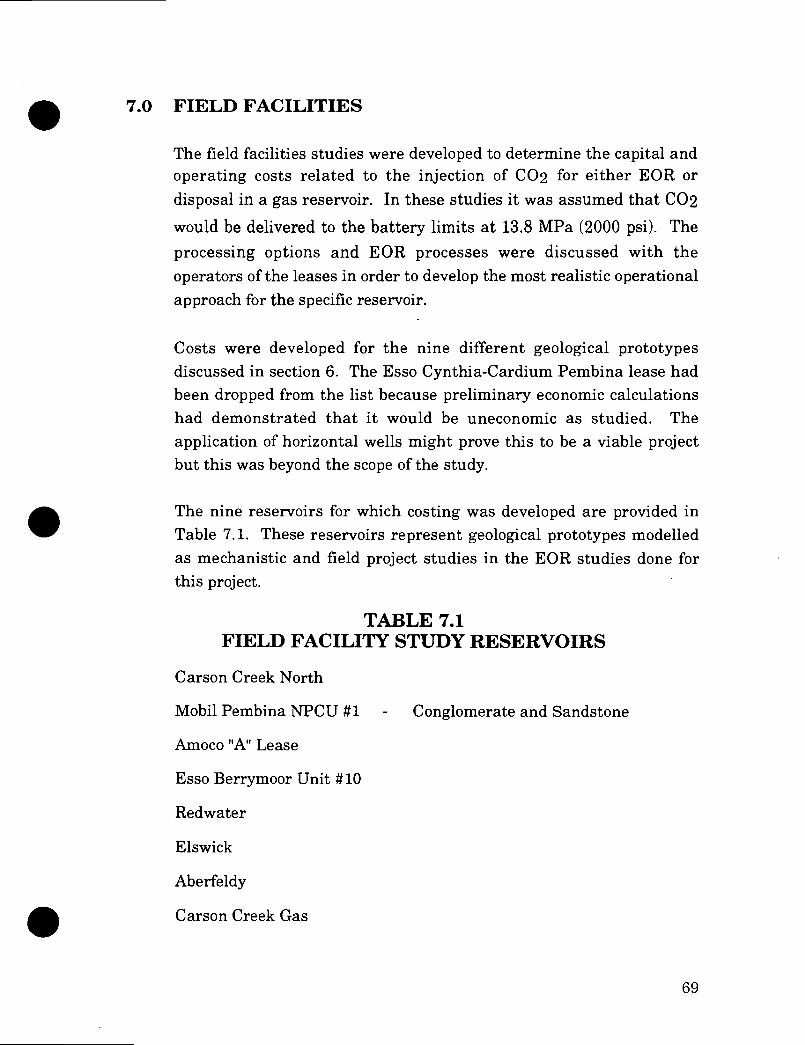
•
•
7.0 FIELD FACILITIES
The field facilities studies were developed to determine the capital and operating costs related to the injection of CO2 for either EOR or
disposal in a gas reservoir. In these studies it was assumed that CO2
would be delivered to the battery limits at 13.8 MPa (2000 psi). The
processing options and EOR processes were discussed with the operators of the leases in order to develop the most realistic operational approach for the specific reservoir.
Costs were developed for the nine different geological prototypes discussed in section 6. The Esso Cynthia-Cardium Pembina lease had been dropped from the list because preliminary economic calculations had demonstrated that it would be uneconomic as studied. The application of horizontal wens might prove this to be a viable project but this was beyond the scope of the study.
The nine reservoirs for which costing was developed are provided in Table 7.1. These reservoirs represent geological prototypes modelled as mechanistic and field project studies in the EOR studies done for this project.
TABLE 7.1 FIELD FACILITY STUDY RESERVOIRS
Carson Creek North
Mobil Pembina NPCU #1 Conglomerate and Sandstone
Amoco "A" Lease
Esso Berrymoor Unit #10
Redwater
Elswick
Aberfeldy
Carson Creek Gas
69

The field facilities design and cost estimates were done by Optima Engineers and Constructors Inc. • Each reservoir represents a case study. Each case is broken into a number of modules. These modules are printed in Optima's report. Figure 7.1 provides a conceptual flow sheet for the field facilities studies. Variations on this theme occurred and are discussed below.
Modules were selected through consultation with the operator. The base module was constructed from a modular factored estimate for a 6000 t/d CO2 EOR flood with 3000 t/d CO2 recycle. Each base module
for the estimates had risk and contingency factored into it.
Estimate consistency was ensured by scaling the modules up or down using the following criteria:
• pump - ratio of brake horse power (BHP) raised to power of 0.60
• compressor ratio of BHP raised to power of 0.80
• heat exchanger ratio of bare area to power of 0.85 • plant ratio of total capacity raised to power of 0.60
The total operating cost for each module is based on the utility cost, a percentage of the capital cost for maintenance and the cost of the operators. The utility cost is calculated based on the electric consumption at $ .04/kWh and fuel gas use at $ 1.00/MMBTU. The number of operators required for a particular facility is based on historical experience in oil plants, gas plants and field facilities.
The annual operating cost is the sum of the utility cost (including electricity and fuel), the maintenance cost (based on percentage of the capital cost), and operating cost (based on a loaded cost of $100,000 per
operator).
The utility costs for the different cases are scaled up or down based on the required horsepower ratio for a given module.
70
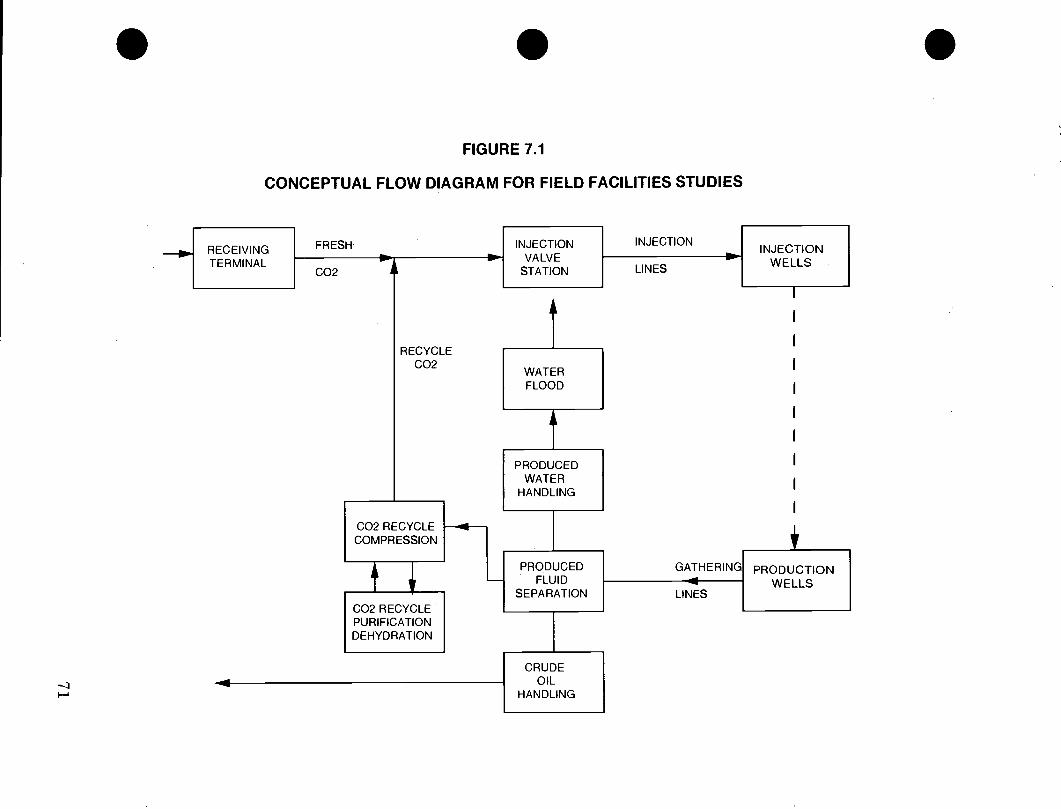
• • • FIGURE 7.1
CONCEPTUAL FLOW DIAGRAM FOR FIELD FACILITIES STUDIES
FRESH•
CO2
RECEIVING TERMINAL
RECYCLE CO2
CO2 RECYCLE COMPRESSION
CO2 RECYCLE PURIFICATION DEHYDRATION
INJECTION VALVE
STATION
WATER FLOOD
PRODUCED WATER
HANDLING
PRODUCED FLUID
SEPARATION
INJECTION
LINES WELLS
GATHERING PRODUCTION WELLS
INJECTION
LINES
CRUDE OIL
HANDLING

The data from TCA Reservoir Consulting was reformatted on an annual basis for economic modelling by AOSTRA. This reformatted data was used to do the field facilities design and estimate.
Detailed estimates were done for Carson Creek North Phases 1 and 2, Redwater Phases 1 and 2, Aberfeldy, Carson Creek Gas, Elswick, and Pembina Conglomerate. The other Pembina fields were scaled up from the Pembina Conglomerate Case using parameters recommended by the operators and the ratio of the CO2 injection rates to that for the
Pembina Conglomerate raised to the power of 0.6. Important parameters used in the design estimates are provided in Table 7.2.
The production wells are of two types. Some have a high risk of CO2 breakthrough and others a low risk of CO2 breakthrough. These are
identified in each case. The high risk of breakthrough wells have a choke in the wellhead to prevent blowout problems.
The design is based on 80% of the peak injection rate in order to even out the demand for compression. Elswick is an exception where 100% of the peak rate was used.
Existing facilities are used where possible. This includes the water injection systems and existing emulsion separation facilities.
A conceptual design is presented in Figure 7.1. There are three variations on this concept. They include:
the basic approach with no purification at Redwater, Pembina
and Carson Creek Gas fields.
the requirement for purifying the recycled CO2 to 90% purity at Carson Creek North and Elswick leases.
• a special approach saturating water with CO2 for an immiscible
flood at Aberfeldy.
72
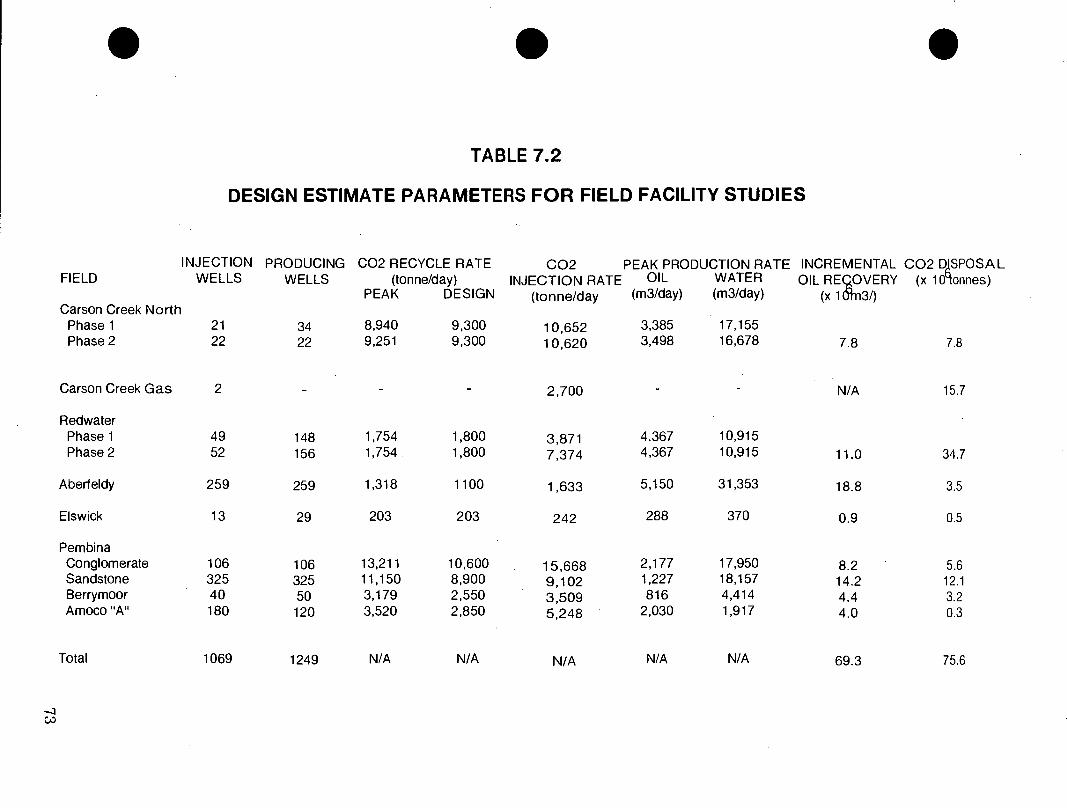
• • • TABLE 7.2
DESIGN ESTIMATE PARAMETERS FOR FIELD FACILITY STUDIES
FIELD INJECTION
WELLS PRODUCING
WELLS CO2 RECYCLE RATE
(tonne/day) PEAK DESIGN
CO2 INJECTION RATE
(tonne/day
PEAK PRODUCTION RATE INCREMENTAL CO2 DJSPOSAL OIL WATER OIL REgOVERY (x 10cionnes)
(m3/day) (m3/day) (x 1 lan3/) Carson Creek North Phase 1 21 34 8,940 9,300 10,652 3,385 17,155 Phase 2 22 22 9,251 9,300 10,620 3,498 16,678 7.8 7.8
Carson Creek Gas 2 2,700 N/A 15.7
Redwater Phase 1 49 148 1,754 1,800 3,871 4.367 10,915 Phase 2 52 156 1,754 . 1,800 7,374 4,367 10,915 11.0 34.7
Aberfeldy 259 259 1,318 1100 1,633 5,150 31,353 18.8 3.5
Elswick 13 29 203 203 242 288 370 0.9 0.5
Pembina Conglomerate 106 106 13,211 10,600 15,668 2,177 17,950 8.2 5.6 Sandstone 325 325 11,150 8,900 9,102 1,227 18,157 14.2 12.1 Berrymoor 40 50 3,179 2,550 3,509 816 4,414 4.4 3.2 Amoco "A" 180 120 3,520 2,850 5,248 2,030 1,917 4.0 0.3
Total 1069 1249 N/A N/A N/A N/A N/A 69.3 75.6

In the basic approach, produced water and CO2 are separated and handled for disposal, recycling, or venting. The recycled CO2 requires
dehydration and compression before it can be reinjected. •
At Redwater costs for recycle represent 8% of Phase 1 capital costs and 31% of Phase 1 annual operating costs. At Mobil Pembina Conglomerate CO2 recycle costs are about 45% of capital costs and 82%
of annual operating costs.
Because of a requirement for 90% CO2 purity for reinjection at Carson
Creek North and Elswick, the gas, oil and water emulsion is
dehydrated in a two tower 3 bed mole sieve dehydration unit. The gas goes on to a purification plant. This process is discussed in the Optima report.
At Carson Creek North, the recycle facilities represent 60% of the capital costs and 90% of the annual operating costs for Phase 1, and are not required for Phase 2. Purification costs represent 51.4% of the Phase 1 recycling capital costs and 82.2% of the Phase 1 recycling
annual operating costs.
Elswick recycle costs are only 25% of capital costs and 71% of annual
operating costs. Purification accounts for 12.9% of recycling capital
costs and 47.4% of recycling operating costs.
At Aberfeldy, the recycled CO2 is compressed and mixed with water before reinjection. Fresh CO2 arriving as a liquid at the receiving
terminal is vaporized and mixed with produced water for reinjection. The costs for recycle, compression and mixing are 10.6% of capital costs
and 22% of annual operating costs.
The Carson Creek Gas field is used to dispose of CO2. Two high rate gas wells will be used to inject the CO2. Methane and other
hydrocarbon gases will be displaced in the reservoir. The design does not consider CO2 recycle gas.
•
74
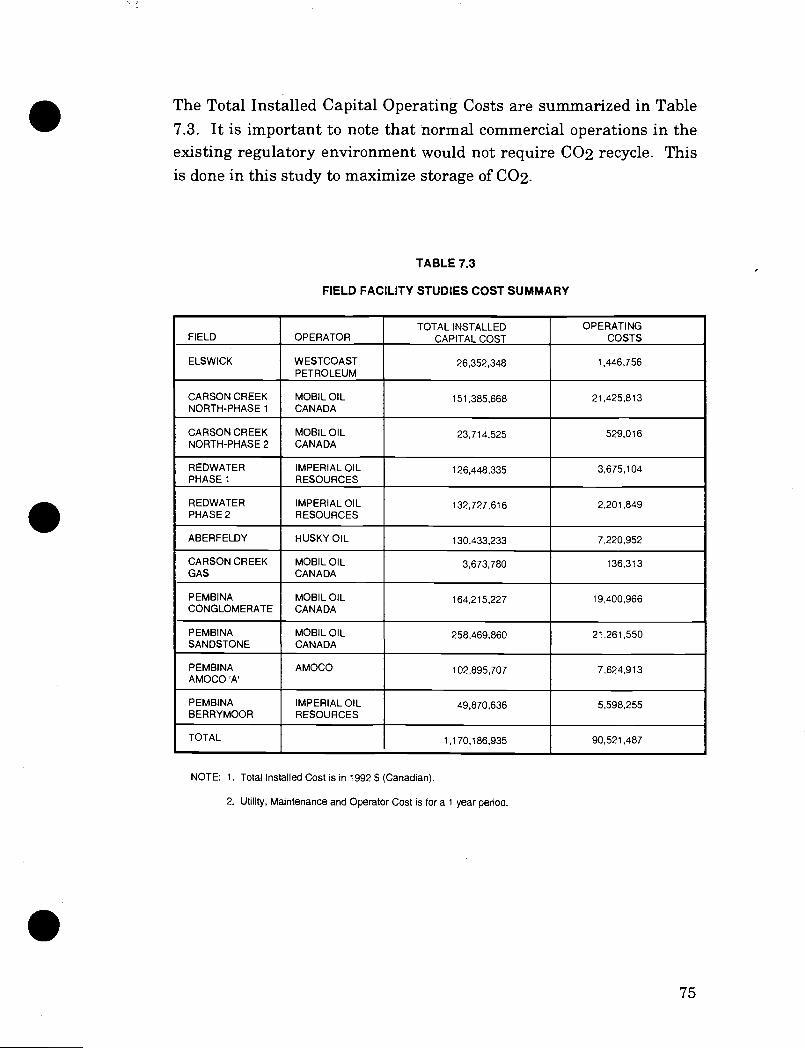
The Total Installed Capital Operating Costs are summarized in Table 7.3. It is important to note that normal commercial operations in the existing regulatory environment would not require CO2 recycle. This is done in this study to maximize storage of CO2.
TABLE 7.3
FIELD FACILITY STUDIES COST SUMMARY
FIELD OPERATOR TOTAL INSTALLED
CAPITAL COST OPERATING
COSTS
ELSWICK WESTCOAST PETROLEUM
26,352,348 1,446,756
CARSON CREEK NORTH-PHASE 1
MOBIL OIL CANADA
151,385,668 21,425,813
CARSON CREEK NORTH-PHASE 2
MOBIL OIL CANADA
23,714,525 529,016
REDWATER PHASE 1
IMPERIAL OIL RESOURCES
126,448,335 3,675,104
REDWATER PHASE 2
IMPERIAL OIL RESOURCES
132,727,616 2,201,849
ABERFELDY HUSKY OIL 130,433,233 7,220,952
CARSON CREEK GAS
MOBIL OIL CANADA
3,673,780 136,313
PEMBINA CONGLOMERATE
MOBIL OIL CANADA
164,215,227 19,400,966
PEMBINA SANDSTONE
MOBIL OIL CANADA
258,469,860 21,261,550
PEMBINA AMOCO 'A'
AMOCO 102,895,707 7,624,913
PEMBINA BERRYMOOR
IMPERIAL OIL RESOURCES
49,870,636 5,598,255
TOTAL 1,170,186,935 90,521,487
NOTE: 1. Total Installed Cost is in 1992 S (Canadian).
2. Utility, Maintenance and Operator Cost is for a 1 year period.
75

•
SO
RN
ON
003 0'8
•
•
•
8.0 ECONOMICS
8.1 INTRODUCTION AND BACKGROUND
AOSTRA undertook the work outlined in the scope document for the
Economics Package of this study. The objective was to quantify the cost/benefit relationship for recovering CO2 from defined sources and
using it for enhanced oil recovery (EOR), or disposing it in depleted gas reservoirs. The study mission statement was based on capturing
50,000 tonnes/Day (951 x 106 SCF/Day) and using this to optimum
benefit for EOR in Alberta and Saskatchewan, beginning in the year
2000 and continuing for a period of at least 15 years.
To quantify the cost/benefit relationship an economic criteria based on
the Differential (Differential) between cost of capturing and delivering CO2 to the field (EOR or depleted gas) (Delivered Cost) and the price
affordable (Affordable Price) at the field was established. The Delivered Cost includes all the capital charges and operating costs
incurred over the life of the project. The Affordable Price at the field is
the price that an oil field operator can afford to pay after deducting
from the revenue, due to incremental oil production, the operating
costs and capital charges over the life of the project. The Differential,
calculated as Affordable Price less the Delivered Cost of CO2 to field,
therefore indicates project viability. If the Differential is positive there is net benefit being accrued and the project is economically viable. On the other hand, if the Differential is negative there is a net cost being
incurred and the project is not economically viable based solely on the
revenue from EOR.
The Differential was expressed in $/tonne ($/MSCF) of CO2 and was
derived using both the Social (5% and 10% rate of return (ROR)) and Normal Business (full flow through (FFT) and project limited (PL)
taxation) approaches. The Social approach is a test of project economic
viability independent of inflation factors and fiscal policies. The
Normal Business approach, on the other hand, is a test of project
economic viability which includes inflation factors, royalties, and
76
taxation. AH the Delivered Costs and Affordable Prices were developed and expressed in 1 Q 1992 Canadian $.
In situations where the CO2 is being disposed in depleted gas
reservoirs, the Affordable Price is zero, instead an additional cost of disposal is being incurred. In this case the Differential is negative, with total cost of disposal equal to cost of capture, pipelining and disposal.
AOSTRA utilized the cost and performance data developed by other contractors on CO2 sources, pipeline systems, EOR fields, and depleted
gas reservoirs to derive the Delivered Costs and Affordable Prices.
AOSTRA developed in-house models to evaluate all cases except for
EOR using the Normal Business approach. For this AOSTRA used the Petroleum Economics Evaluation Program (PEEP) software marketed by Merak Projects Limited and widely used in the oil industry.
In addition to developing the Delivered Cost and Affordable Price, AOSTRA also reviewed data on oil and gas fields that could be used as CO2 sinks in Alberta. This review was undertaken to check what fraction of CO2 captured over a period of 15 years could be utilized for
EOR, and how much of the balance could be disposed in depleted gas reservoirs. The results of this review permitted the establishment of
the overall net cost or net benefit associated with utilizing or disposing
the total captured CO2.
8.2 REVIEW OF RESULTS
8.2.1 CO2 Sources and Sinks
An initial review of the CO2 disposal indicated that only 29.1% (80.8 x
106 Tonnes) [1.54 x 10¹² SCF]) of the captured CO2 was being utilized
for EOR in the fields selected for the study. This was mainly due to the
following:
•
77
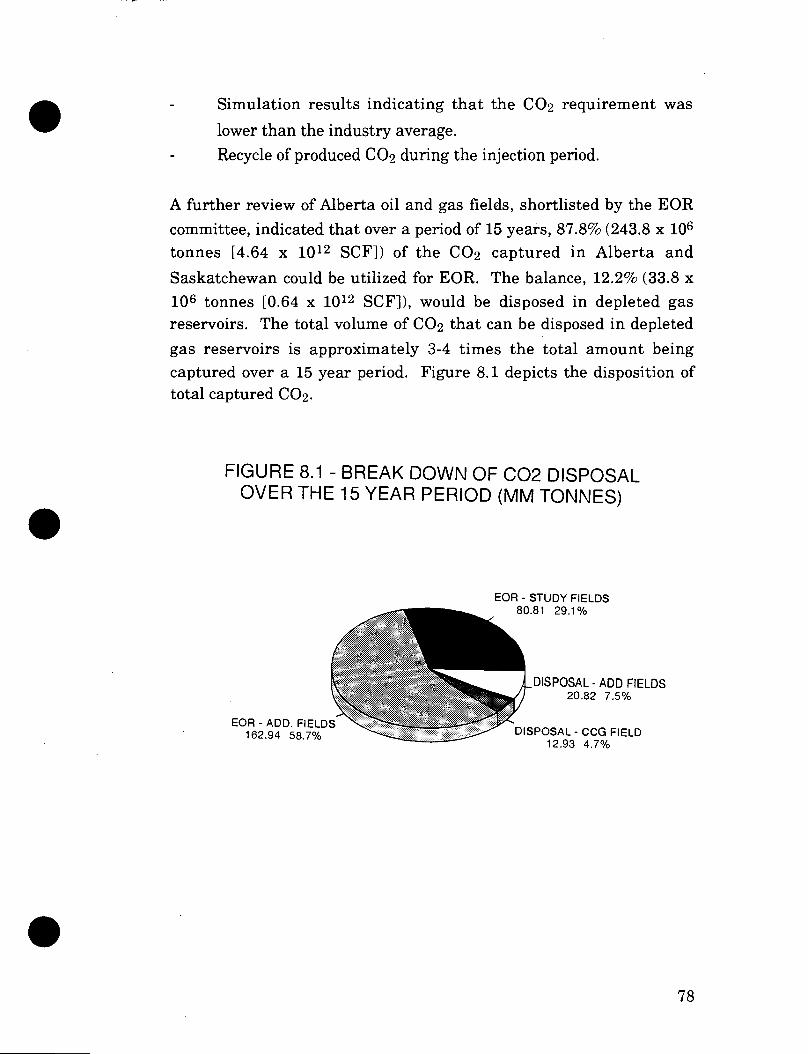
EOR - ADD. FIELDS 162.94 58.7% DISPOSAL - CCG FIELD
12.93 4.7%
EOR - STUDY FIELDS 80.81 29.1%
DISPOSAL - ADD FIELDS 20.82 7.5%
• Simulation results indicating that the CO2 requirement was
lower than the industry average.
Recycle of produced CO2 during the injection period.
A further review of Alberta oil and gas fields, shortlisted by the EOR
committee, indicated that over a period of 15 years, 87.8% (243.8 x 10⁶ tonnes [4.64 x 10¹² SCF]) of the CO2 captured in Alberta and
Saskatchewan could be utilized for EOR. The balance, 12.2% (33.8 x 10⁶ tonnes [0.64 x 10¹² SCF]), would be disposed in depleted gas reservoirs. The total volume of CO2 that can be disposed in depleted
gas reservoirs is approximately 3-4 times the total amount being captured over a 15 year period. Figure 8.1 depicts the disposition of total captured CO2.
FIGURE 8.1 - BREAK DOWN OF 002 DISPOSAL OVER THE 15 YEAR PERIOD (MM TONNES) •
• 78
8.2.2 Economic Analysis • A total of 344 individual -case studies were conducted. This large number of case studies resulted since thére were 22 base cases (10 CO2 sources, 3 pipeline system, 8 EOR fields and 1 depleted gas
field), and each of the base cases was analyzed using the following four approaches:
Social utilizing 5% rate of return Social utilizing 10% rate of return Normal Business utilizing full flow through taxation Normal Business utilizing project limited taxation.
In addition, each EOR field was analyzed at three levels of oil
production (50%, 75% and 100% of simulated results) and three flat crude price profiles which remained constant in 1992 Canadian $ throughout the project life. These price levels were analyzed for both crude types. These were for light oil $125.79, $157.24 and $188.69/M3 ($20.00, $25.00 and $30.00/Barrel), and for heavy oil $31.45, $62.90 and $94.35/M3 ($5.00, $10.00 •and $15.00/Barrel). Three levels of crude production were utilized to reflect the impact of reservoir factors such as heterogeneity and sweep efficiency on simulation results.
In order to avoid the debate concerning which crude oil price forecast was 'right', the methodology of using a range of flat crude oil prices was adopted. This range was intended to cover the spectrum of individual forecasts that are routinely published by various engineering consulting firms, the National Energy Board, and other agencies. In addition, this approach has enabled the study to examine the relative sensitivity of economics to crude oil prices.
• 79
• All the results of economic analysis have been summarized in the
Economics report. In this section, only the results obtained using the
following approaches are presented and discussed:
- Social utilizing 10% rate of return
- Normal Business utilizing full flow through taxation.
Please note that the results presented for the EOR fields are based on an oil production level of 75% of simulated results.
The results of economic analysis of the individual cases, namely the Delivered Costs, Affordable Prices, and the resulting Differentials, have been plotted on the following figures:
Figure 8.2A - Alberta CO2 Sources and EOR Fields -
Summary of Economic Analysis based on Social approach.
Figure 8.2B - Alberta CO2 Sources and EOR Fields -
Summary of Economic Analysis based on Normal Business approach.
Figure 8.3A - Saskatchewan CO2 Sources (Boundary Dam)
and EOR Fields (Elswick) - Summary of Economic Analysis based on Social approach
• Figure 8.3B - Saskatchewan CO2 Sources (Boundary Dam)
and EOR Fields (Elswick) - • Summary of Economic Analysis based on Normal Business approach
80

Figure 8.4A - Saskatchewan CO2 Sources (Bi-Provincial Upgrader)
and EOR Fieldš (Aberfeldy) -
Summary of Economic Analysis based on
Social approach
• Figure 8.4B - Saskatchewan CO2 Sources (Bi-PrOvincial Upgrader)
and EOR Fields (Aberfeldy) -
Summary of Economic Analysis based on Normal
Business approach
The dotted lines on these figures represent the Delivered Cost for a given CO2 source. The solid lines on the graph represent the
Affordable Price, for a given EOR field. (Please note that a negative
Affordable Price represents the price that an EOR field operator would have to be paid for utilizing the CO2). The gap between the lines
represents the Differential which is a net benefit (if the Affordable Price is above the Delivered Cost) or a net cost (if the Affordable Price
is below the Delivered Cost).
EXAMPLE GRAPH DEPICTING SUMMARY OF ECONOMIC ANALYSIS
DELIVERED COST OR AFFORDABLE PRICE - $/TONNE
•
•
120.0
100.0
80.0
60.0
40.
20.0
0.0
..0O2 SOURCE + EOR FIELD * EOR FIELD 2 /
DELIVERED COST OF CO2-'101. "+" DIFFERENTIAL
"-" DIFFERENTIAL AFFORDABLE PRICE FOR FIELD 1
?OVINE pBtCE AFFORDABLE PRICE FOR FIELD 2.
NEGATNE PR‘CE
-20. 120 125 130 135 140 145 150 155 160 165 170 175 180
OIL PRICE - S/M3
81

The oil price shown is the field gate price. This price, compared to
Edmonton Par or Hardisty Heavy, is generally lower due to the cost of transportation from the field to the terminal, and for heavy crudes by the additional cost associated with diluent blending. The Edmonton
Par Price and Hardisty Heavy (Diluent Free) for 1992 is depicted in Figure 8.5. The Edmonton Par averaged at $147.75/M3 ($23.50/Barrel)
and Hardisty Heavy (Diluent Free) averaged at $95.60/M3
($15.20/Barrel).
FIGURE 8.5 - 1992 OIL PRICE PROFILES
1992 CANADIAN $/M3 200
*EDMONTON PAR Ar HARDISTY HEAVY (D/F)
180
160 AVERAGE @ S147.75/M3
140
120
1 00 AVERAGE @,59.5.60/M3
80
60 Jan Feb Mar Apr May Jun Jul Aug Sep
MONTH
SOURCE - DAR.Y OIL BULLETEN
•
Oct Nov Dec
82
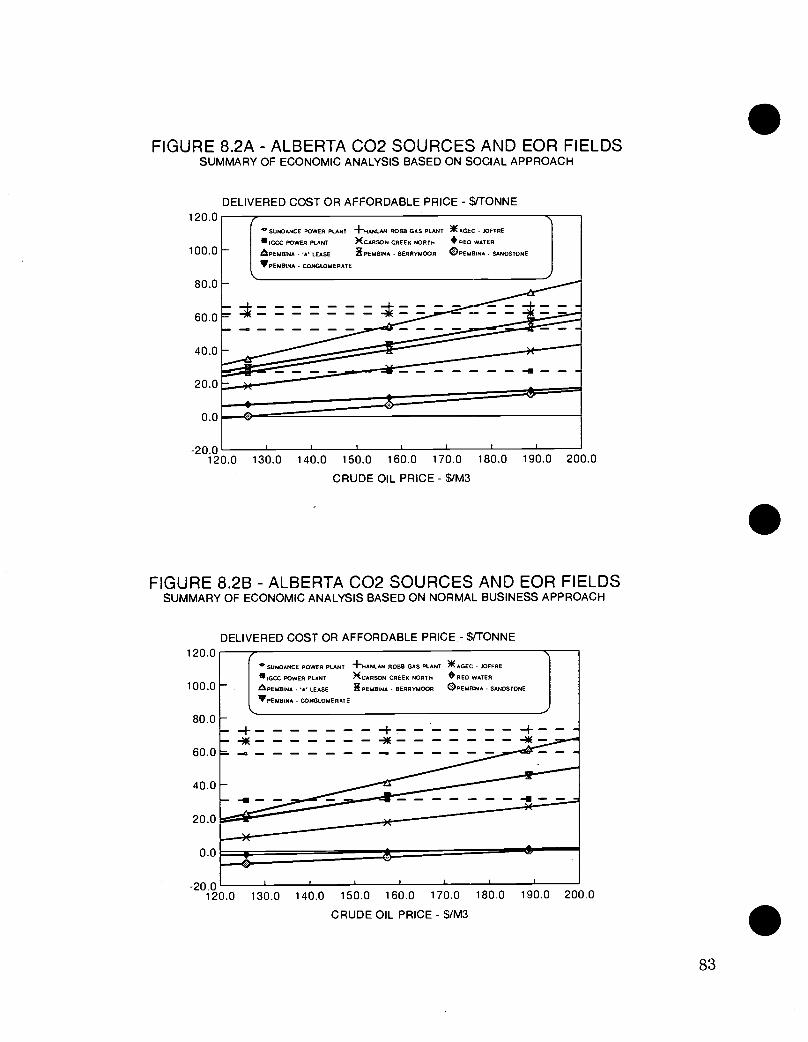
&PEMBINA - -A- LEASE if PEMBINA - TiERRYMOOR PEMBINA SANDSTONE
',PEMBINA - CONGLOMERATE
4.SUNDANCE POWER PLANT +HARLAN ROBB GAS PLANT ME AGEC JCIFFRE
IGCC POWER PLANT )(CARSON CREEK NORTH *RED WATER
FIGURE 8.2A - ALBERTA 002 SOURCES AND EOR FIELDS SUMMARY OF ECONOMIC ANALYSIS BASED ON SOCIAL APPROACH
DELIVERED COST OR AFFORDABLE PRICE - S/TONNE
• 120.0
100.0
80.0
60.0
40.0
20.0
0.0
-20.0 120.0 130.0 140.0 150.0 160.0 170.0 180.0 190.0 200.0
CRUDE OIL PRICE - $/M3
FIGURE 8.2B - ALBERTA CO2 SOURCES AND EOR FIELDS SUMMARY OF ECONOMIC ANALYSIS BASED ON NORMAL BUSINESS APPROACH
DELIVERED COST OR AFFORDABLE PRICE - VTONNE 120.0
4.SUNDANCE POWER PLANT
**CC POWER PLANT
APEMBINA - 'A LEASE
',PEMBINA - CONGLOMERATE
+HARLAN ROBB GAS PLANT *AGEC - JOFFRE
XCARSON CREEK NORTH *RED WATER
If PEMBINA BERRYMOOR ()PEMBINA - SAIVOSTONE
80.0
60.0
40.0
20.0
0 0
-20.0 120.0 130.0 140.0 150.0 160.0 170.0 180.0 190.0 200.0
CRUDE OIL PRICE - $//M3
100.0
•
83
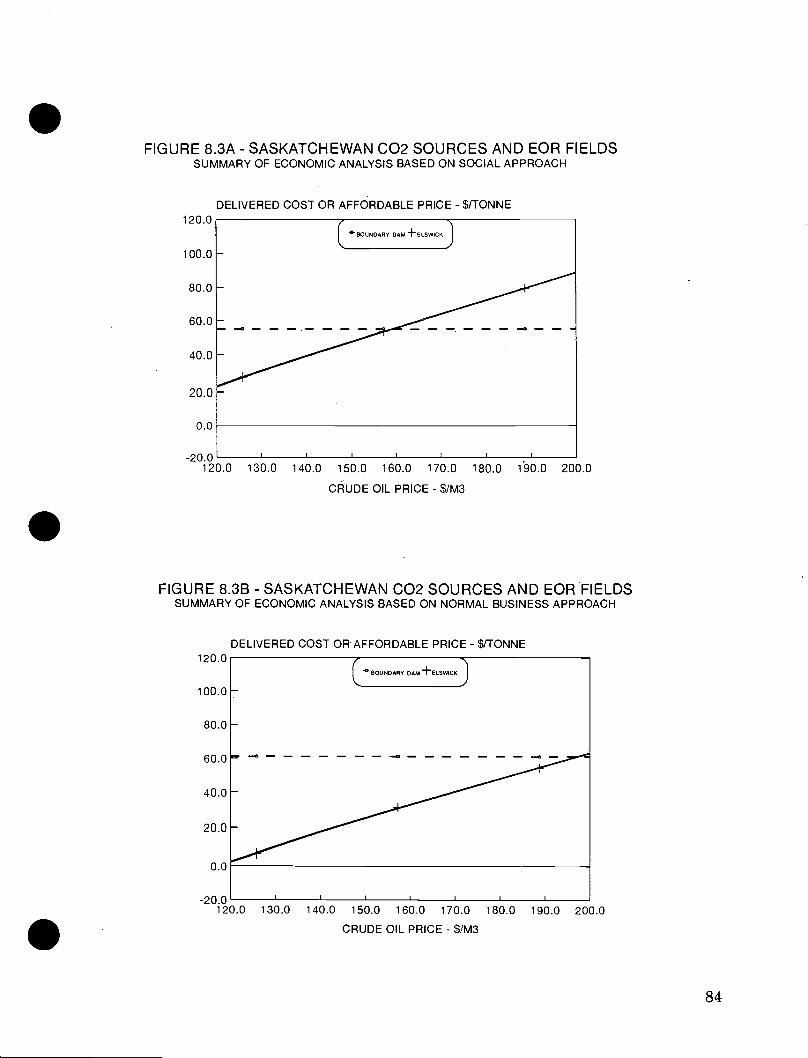
BOUNDARY OAM +ELSVOCK
-- - r
FIGURE 8.3A - SASKATCHEWAN 002 SOURCES AND EOR FIELDS SUMMARY OF ECONOMIC ANALYSIS BASED ON SOCIAL APPROACH
DELIVERED COST OR AFFOIRDABLE PRICE - VTONNE
-20.0 120.0 130.0 140.0 150.0 160.0 170.0 180.0 190.0 200.0
CRUDE OIL PRICE - $/M3
FIGURE 8.3B - SASKATCHEWAN CO2 SOURCES AND EOR FIELDS SUMMARY OF ECONOMIC ANALYSIS BASED ON NORMAL BUSINESS APPROACH
DELIVERED COST OR AFFORDABLE PRICE - $/TONNE
4. BOUNDARY DAM +ELSWICK
-20.0 120.0 130.0 140.0 150.0 160.0 170.0 180.0 190.0 200.0
CRUDE OIL PRICE - S/M3
•
•
120.0
100.0
80.0
60.0
40.0
20.0
0.0
120.0
100.0
80.0
60.0
40.0
20.0
0.0
84

EU-PROYDICIAL UPGRADER +ABERFELDY
40.0 50.0 60.0 70.0 80.0 90.0 100.0
HEAVY OIL PRICE - $/M3 (DILUENT FREE)
150.0
100.0
50.0
0.0
-50.0
-100.0 30.0
200.0
FIGURE 8.4A - SASKATCHEWAN CO2 SOURCES AND EOR FIELDS SUMMARY OF ECONOMIC ANALYSIS BASED ON SOCIAL APPROACH
DELIVERED COST OR AFFORDABLE PRICE - S/TONNE
FIGURE 8.4B - SASKATCHEWAN CO2 SOURCES AND EOR FIELDS SUMMARY OF ECONOMIC ANALYSIS BASED ON NORMAL BUSINESS APPROACH
DELIVERED COST OR AFFORDABLE PRICE - $/TONNE
Ell-PROVINCIAL UPGRADER +ABERFELOYJ
•
200.0
• 150.0
100.0
50.0
0.0
-50.0
-100.0 30.0 40.0 50.0 60.0 70.0 80.0 90.0 100.0
HEAVY OIL PRICE - S/M3 (DILUENT FREE)
85

•
•
•
The results summarized in Figures 8.2A and 8.2B indicate that there is
significant variation in the Differential for Alberta. The magnitude of the Differential depends on the CO2 source, EOR field, oil price, and the economic analysis approach used. Using the Social approach and
an oil price of $157.24/M3 ($25/Barrel), the Differential varies from +$1.90/tonne (+$0.10/MSCF) (net benefit) to -$59.35/tonne (-$3.10/MSCF) (net cost). The positive Differential (net benefit) is based
on the lowest cost CO2 source (Sundance Power Plant) and the best
performing EOR field (Pembina 'A" Lease). The negative Differential (net cost), on the other hand, is based on the highest cost CO2 source
(Hanlan Robb) and the worst performing EOR field (Pembina - Sandstone). Using the Normal Business approach, the Differential (net cost) varies from -$17.50/tonne to -$76.25/tonne (-$0.90/MSCF to -$4.00/MSCF) for the same best and worst cases. The increase in Differential (net cost) between the two approaches can be attributed to taxes and royalties.
Please note that in deriving these Differentials the hypothetical IGCC case was not considered. If this case is considered, the Differential (net benefit) is significantly increased since the cost of producing CO2 by IGCC is $27.75/tonne ($1.50/MSCF) lower than the cheapest CO2
source (Sundance Power Plant).
For the Boundary Dam/Elswick case in Saskatchewan (Figures 8.3A and 8.3B) the Differential (net cost) is -$1.53/tonne (-$0.07/MSCF) using the Social approach and an oil price of $157.24/M3 ($25.00/Barrel). This Differential (net cost) increases to -$29.67/tonne (-$1.55/MSCF) if Normal Business approach is utilized. This increase in Differential (net cost) can be attributed to taxes and royalties.
For the Bi-Provincial Upgrader/Aberfeldy case in Saskatchewan (Figures 8.4A and 8.4B) the Differential (net cost) is -$4.75/tonne (-$0.25/MSCF) using the Social approach and an oil price of $62.90/1\43 ($10.00/Barrel). This Differential increases to -$91.25/tonne (-$4.75/MSCF) (net cost) if Normal Business approach is utilized. This
drastic change can be attributed mostly to royalties.
86

• The cost of CO2 disposal in depleted gas reservoirs is not depicted on
Figures 8.2A and 8.2B. This cost is equal to the cost of capture, the cost of delivery, and the cost of disposal. The cost of disposal into depleted gas reservoirs, exclusive of capture and delivering, is $0.57/tonne to $0.95/tonne ($0.03/MSCF to $0.05/MSCF). The lower cost reflects the Social approach while the higher cost reflects the Normal Business approach. The total disposal cost, including the cost of capture and delivery from various CO2 sources, ranges from
$53.00/tonne ($2.80/MSCF) to $73.40/tonne ($3.85/MSCF).
Figures 8.2A to 8.4B do not reflect the CO2 quantities involved. The impact of CO2 quantities is reflected in Figures 8.6A to 8.7B. In
developing these figures it was assumed that all the sandstone type reservoirs shortlisted in Alberta would have economics similar to those of the Pembina (Conglomerate and Berrymoor) field. Similarly, the reef type reservoirs and D-3 type reservoirs would have economics similar to those of Carson Creek North and Redwater fields, respectively.
These figures depict the Delivered Cost (dotted line), the Affordable Price (solid line), and the resulting Differential (net cost) as a function of CO2 captured. The Affordable Price for CO2 is based on an oil price
of $157.24843 ($25.00/Bbl) for light oil, and 862.90843 ($10.00/Barrel) for heavy oil. These figures have been drawn to reflect increasing
Differential (net cost) with quantity.
For Alberta (Figures 8.6A and 8.7B) based on results obtained using Social approach, the Differential (net cost) varies from -$10.85/tonne (-
$0.55/MSCF) to -$66.60/tonne (-$3.50/MSCF), with an average Differential of -$27.96/ tonne (-$1.47/MSCF). Based on results
obtained using the Normal Business approach, the Differential (net cost) varies from -$25.87/tonne to -$73.41/tonne (-$1.35/MSCF to-
$3.85/MSCF), with an average Differential of -$42.60/tonne (-
$2.24/MSCF).
•
• 87

•
•
For Saskatchewan (Figures 8.7A and 8.7B) based on results obtained
using Social approach, the Differential (net cost) varies from
-$1.53/tonne (-$0.08/MSCF) to -$4.75/tonne (-$0.25/MSCF), with an
average Differential (net cost) of -$1.90/tonne (-$0.10/MSCF). Based on results obtained using the Normal Business approach, the Differential
(net cost) varies from -$29.67/tonne to -$90.91/tonne (-$1.55/MSCF to
-$4.78/MSCF), with an average Differential (net cost) of -$36.52/tonne (-$1.92/MSCF).
8.3 CONCLUDING REMARKS
The results of economic analysis have indicated that under the following conditions the benefits from EOR do not totally offset the cost of capture and delivery of CO2.
Economic analysis approach is based on either Social utilizing 10% rate of return or Normal Business. Flat oil price profile of $157.24/1\43 ($25.00/Barrel) or lower is utilized.
Crude production profile for the EOR fields is based on 75% or lower of TCA's predictions.
There are, however, other conditions, such as oil price of $188.69 M3
($30.00/Barrel), Social approach utilizing 5% rate of return, and crude production profile for EOR fields based on 100% of TCA's prediction, under which the Affordable Price for certain EOR fields either totally offset, or exceed, the Delivered Cost of CO2. In order to establish these
conditions for the various EOR fields please refer to Section 7.0 of Volume 5 (Economic Analysis).
• 88

60.0
40.0
20.0
0.0
( - DELIVERED COST - AFFORDABLE PRICE
100.0
HANLAN- ROBB'a%
A,..GEC
80.0
SUNQANCE POWER PLANT
SANDSTONE (EOR)
IGC REEF. (E0R)..
GAS RES.
I
03 (EOR) (DES)
-20.0 0 0 5.0 10.0 15.0 20.0 25.0 30.0 35.0 40.0
FIGURE 8.6A - DELIVERED COST vs. AFFORDABLE PRICE FOR CO2 DISPOSAL IN ALBERTA (BASED ON SOCIAL APPROACH)
$/TONNE OF CO2
100.0
- DELIVERED COST - AFFORDABLE PRICE
80.0
HANLAN- ROBB AGECr
60.0 '''' SliNI5AIVCE -POWER PL.-ANT - - - - ----------- - -
SANDSTONE (EOR) 40.0
IGCC REEF (EOR)
20.0
D3 (EOR)
GAS RES.
0.0 (DES)
-20.0 0 0 5.0 10.0 15.0 20.0 25.0 30.0 35.0 40.0
CO2 - 1000s OF TONNES/DAY (AVERAGED)
FIGURE 8.6B - DELIVERED COST vs. AFFORDABLE PRICE FOR CO2 DISPOSAL IN ALBERTA (BASED ON NORMAL BUSINESS APPROACH)
$/TONNE OF CO2
CO2 - 1000s OF TONNES/DAY (AVERAGED)
•
•
• 89

FIGURE 8.7A - DELIVERED COST vs. AFFORDABLE PRICE FOR CO2 DISPOSAL IN SASKATCHEWAN (BASED ON SOCIAL APPROACH)
• 100.0
80.0
60.0
40.0
S/TONNE OF CO2
BOUNDARY -DAM POWER -PLANT,li
ELSWICK AND OTHER FIELDS...0
BI-PROVINCIAL UPGRADER
ABERFELDY AND40. OTHER FIELDS'
- DELIVERED COST - AFFORDABLE PRICE
20.0
0.0
-20.0 0 0 1.0 2.0 3.0 4.0 5.0 6.0 7.0 8.0 9.0
CO2 - 1000s OF TONNES/DAY (AVERAGED)
FIGURE 8.7B - DELIVERED COST vs. AFFORDABLE PRICE FOR CO2 DISPOSAL IN SASKATCHEWAN (BASED ON NORMAL BUSINESS APPROACH)
$/TONNE OF CO2 100.0
- DELIVERED COST - AFFORDABLE PRICE
80.0
BI-PROVINCIAL UPGRADERSJ:, BOUNDARY DAM POWER PLANT .............. ...
ELSWICK AND OTHER FIELDS
ABERFELDY AND OTHER FIELDS
60.0
40.0
20.0
0.0
-20.0 0 0 1.0 2.0 3.0 4.0 5.0 6.0 7.0 8.0
CO2 - 1000s OF TONNES/DAY (AVERAGED)
9.0
90

S33N
3E13
331:1
0'6
•

•
9.0 REFERENCES
Bardon, C. and L. Denoyelle, 1984. CO2 Injection to Enhance Oil Recovery, pp. 177-210 In: Heavy Crude Oil Recovery, NATO ASI Series E: Applied Services No. 76 Edited by: E. Okandan
Bondor, P.L., 1992. Applications of Carbon Dioxide In Enhanced Oil Recovery. Energy Conservation Management. 33 (5-8): 579-586.
Energy Resources Conservation Board, 1991. Alberta's Reserves of Crude Oil, Oil Sands, Gas, Natural Gas Liquids and Sulphur. ERCB FT 92-18.
Farris, C.B., "Unusual Design Factors for Supercritical CO2 Pipelines" Energy Progress Vol. 3 No. 3, Sept. 1983.
Hadlow, R.E., 1992. Update of Industry Experience with CO2 Injection. SPE 24 928.
Jaques, A.P., 1992. Canada's Greenhouse Gas Emissions: Estimates for 1990. Environment Canada Report.
Scott, J.D., 1992. The Quiet Success of Miscible Flood Enhanced Oil Recovery. In: Fueling The Future New Horizons In Oil Sands, Heavy Oil and Enhanced Oil Recovery. June 10, 11, 12, 1992. Calgary, Alberta. AOSTRA/Canadian Heavy Oil Association 1992 Conference.
• 91

•

•
•
•
APPENDIX IGCC POWER PLANTS
Al SUMMARY
Integrated gasification combined cycle (IGCC) power plants offer the potential for not only higher efficiency and lower emissions, but lower costs for the recovery of CO2 . This option was originally not included in this project because no IGCC plants are operational in Canada. Since future coal fired power plants may use IGCC, the scope of this project was changed to include a review of CO2 capture for IGCC power plants.
The basis for this review is a report "Evaluation of IGCC Design Options" by Bechtel Canada for TransAlta Utilities and Alberta Power Limited. Interpreting this report on the same basis as other cases in this study gives the following results on the incremental costs for capture of 75% of the CO2 emissions from a 500 MWe IGCC power plant.
In summary with CO2 recovery of 8487 tonnes per day, 10% more coal is used to produce 9% less power. The thermal efficiency drops from 38.8% to 32.5%, the imputed CO2 emission for CO2 capture utilities is 2092 tonnes/day, so the resulting net capture is 6395 tonnes/day. The capital costs of the capture facilities increases the capital cost by 22% or $369 million. The annual incremental operating costs on a comparable basis with other cases in this report is $24.6 million.
Gross
CO2 Captured (Tonnes/day) 8487 6395
Unit Operating Costs ($/Tonnes) 7.96 10.56
Capital Cost ($ Million) 368.8 368.8
These costs are significantly lower than any of the CO2 capture costs in this study. However, the costs do not include the cost of implementing the IGCC technology. The cost of new IGCC power plants is expected to be significantly higher than the coal fired power plants now in service in Western Canada.
A2 SCOPE OF WORK
The scope of this study was to include only existing CO2 emission sources. The capture processes were to be retrofitted to plants now in service and expected to remain in service for the study period (to 2015). It was recognized that opportunities to capture CO2 from new sources at lower costs may be missed since it is generally cheaper to
A-1

incorporate„changes at the design stage than to retrofit changes to existing facilities. This decision to limit the scope to existing facilities and not te include hypothetical cases, was made to maintain the accuracy and reality of the study.
One exception to this retrofit policy is the inclusion of integrated gasification. I combined Cycle r(IGCC) teChnology because of the expectation that future coal fired power plants in Western Canada are likely to be based on IGCC. The-sit:lay -vjonittjhave been considered deficient if this technology was not included. Not only is IGCC viewed as .0w- basis for future poWer gerieratioir,- but it offers substantial advantages for C.02 capture at .higher, pressure and concentration resulting in much lower costs and efficiency losses.
The interest in IGCCteChnology foi electrical power production is based on the higher energy efficiencies available (typically around 40%), lower emissions of...c02, NOx, and SOx and the potential for _ . _ stage4 construction. To provide the initial increment of power the gas tur10e/generator can be installed and fired with natural gas. To gain capacity and impspve efficienCy the heat recovery steam generator can be added. FiiiallST, the coal gasifier can be- added • when justified by the price differential between coal and natural gas.
To enable IGCC to be included in -this study 'without duplicating • previous work, TransAlta Utilities and Alberta Power Limited agreed
tó provide access for AOSTRA to a recent'study "Evaluation of IGCC Design pptions" bÿ Bechtel Canada Ltd. AOSTRA .agreed to review
• the reportiand comparative data on CO2 capture for an IGCC power plant.:IThe IGCC case was added tò AOSTRA's scope of work, as project-operator, but it was not added to the scope of work for SNC, the facilities contractor or other contractbrs. The Bechtel Report provided the necessary technical inforniation (technical description, flow diagrams;.inass balances andtbstekimates) to the same level of detail and accuracy as the SNC reports.
'T :i;1),•=.er : f•= flt)i?
-A3 MCC TQMNOLOGY
Electrical power production by IGCC (Figure A1) involves the gasificatiorioaf coal through partial oxidation to a synthesis gas (syngas)m*ture of carbon.monoxide (c0)i hydrogen (H2) and carbon dioxide (C62), The syngas is,scrubbe& of impurities and burned in a gas turbine to generate electric power. In the combined cycle process, exhaust.from,the gas turbine is passed-through a heat recovery steam generatorT(HRSG) and the steam is used,to drive a steam turbine and genera:kw to produce more electric power.
The base case in the Bechtel Report is a nominal 500 MWe power plant which uses the Shell Coal Gasification Process, two GE MS7001F gas
--
•
•
• A-2

•
turbines producing-350 MWe, and two heat recoveiy stearn generators producing 226 MWe. In plant power ConsumptiOn was 83.5 MWe, mostly for the air separation plant, (54.8 MWe). This results in a net output of 492.5 MWe, an efficiency of 38.8%, and a net heat rate of 9278 kJ/kWh, The capital cost for an_ Alberta:, installation was estimated to .be.$167,9 million in 1989 Canadian (1704.5-- $/kW.)
n. -;'(- , ' A4 IGCC WITH CAPTI.TRE: kf)
To capture CO2 'from an-IG.CCtplant, the cleaned- synkäs is reacted with steam in a Water:GAS-8hift. Thiš 'converts the carbOn in6noxide to hydrogen and carbon dioxide. •
Ca+ 1120 002 4-1-12 fir 3 s,
The CO2 is then scrubbed'out of thelkas[leavirik the hydrogen as the fuel for the gas turbine. Because of the CO2 C6neentratioiV(2-35 V%) and pressure (2.5 MPa), a ph3isical Solvenfsuch as Selexol can be used to absorb CO2. The'CO2 flashed frOM the Selekol IS then dried and compressed for deliery t9 the pipeline systep. (See Figure A2). =
The design case in the Bechtel report utilizes the same gas turbine system. More coal•(10%) must be gasified to make up for ihe lower heating valne of hýdrogen compared to syngas. The power production is 350 MWe_ from the- gas turbines and 230.5 MWe from,the steam turbine. • The in plant power consumption is incx.:e@ae4 O 134.5 MWe due to the Q02 repoyery and compression (42„7.7 MWe) and the increased air compression:and separation energy requirements (now 60 MWe). The net power ontmit is, reduced to 452 ,MW:e. The' overall plant efficiency drops to 32.5470(.0r a net heat ratesof,11,080 kJ/kWh. The capital cost is inoreaskidflpy22%-to $4,0478 milliortor 2,265 $/kWh,
,51:1 %!!.E. v;3ii
The CO2 emissions are reduced from 10,481 tonnes/day (887 kg/MWh) to 3,000 tonnes/day (276 kg/MWh) throukh )tilt.14A6v'eT-iY '6f 8,487 tonnes/day.
1 --3\•7170
In the IGCC CO2 taPture calse, 10% more c6al goes. in, 9% less power comes out, the dal3itd1: ebst is increaSed by 22%, bcif8;487 tonnes per day of CO2Are captured and availabk as a produtt:
This case was designed for 75% 002 captireritypTiS,Still released from unshifted CO in -the turbine. fuel and cdiloSSeg• with the gas • • r clean-up system. •
A-3
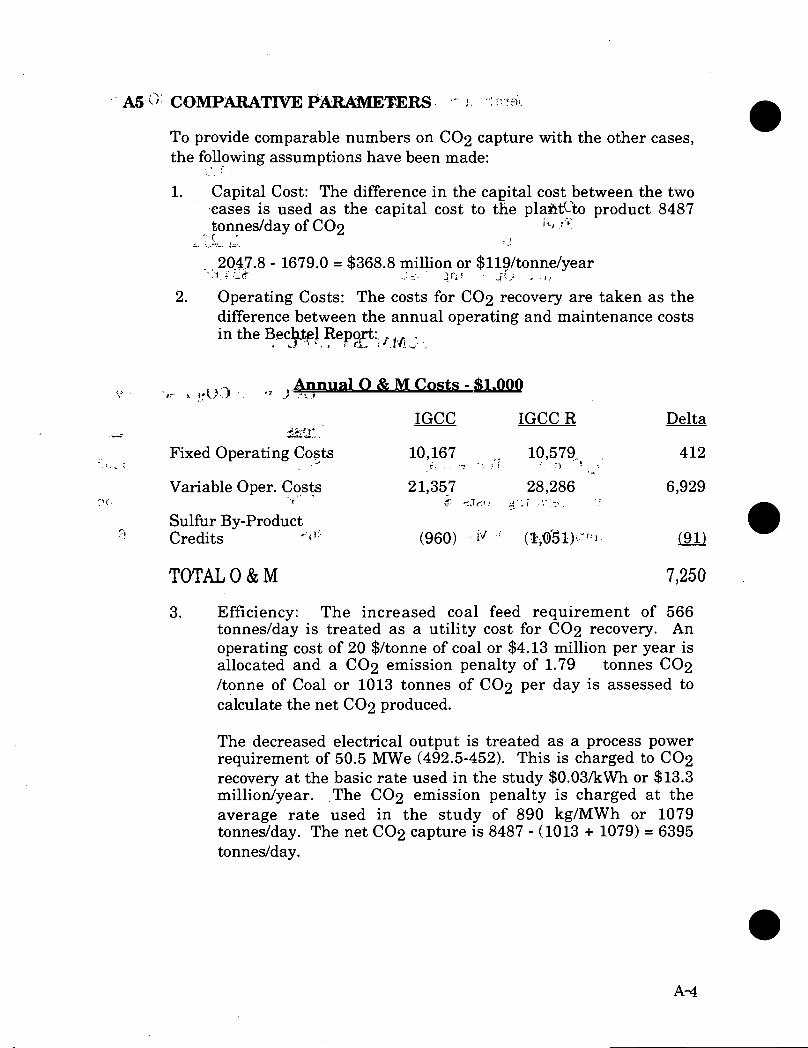
A5 0. COMPARATIVE PARAMETERS
To provide comparable numbers on CO2 capture with the other cases, the following assumptions have been made:
1. Capital Cost: The difference in the capital cost between the two ,Cases is used as the capital cost to the platitUto product 8487 tonnes/day of CO2 • •
2z1
20,47.8 - 1679.0 = $368.8 million or $119/tonne/year .1 :s
2. Operating Costs: The costs for CO2 recovery are taken as the difference between the annual operating and maintenance costs in the Becliltel Repr:;/- tti • , . • _
, Annual O & M Costs - $1.00Q
IGCC IGCC R Delta
Fixed Operating Costs 10,167 10,579_ ;
412
Variable Oper. Costs 21,357 28,286 6,929 k-r -.Jr:, .•
Sulfur By-Product Credits --()-- (960) • (112;051)i-('J f 91)
TOTAL 0 & M 7,250
3. Efficiency: The increased coal feed requirement of 566 tonnes/day is treated as a utility cost for CO2 recovery. An operating cost of 20 $/tonne of coal or $4.13 million per year is allocated and a CO2 emission penalty of 1.79 tonnes CO2 /tonne of Coal or 1013 tonnes of CO2 per day is assessed to calculate the net CO2 produced.
The decreased electrical output is treated as a process power requirement of 50.5 MWe (492.5-452). This is charged to CO2 recovery at the basic rate used in the study $0.03/kWh or $13.3 million/year. • The CO2 emission penalty is charged at the average rate used in the study of 890 kg/MWh or 1079 tonnes/day. The net CO2 capture is 8487 - (1013 + 1079) = 6395 tonnes/day.
•
•
• A-4

Jai- • -
4.
Os& M, Fuel Electricity
Annual Operating Costs •
13 271
$24,653 '
cI
•
• r,
19C) 110E8%.1.11t:3 •••
• :A •27riii
9'211
• . . ,j.;bve.snn
The annual operating costs to3z(pitgrkii07 tonn.p.p:,pprday or CO2.a.re:
" : YC
($1,000)
ImC with CO2 Recovery
• •
- CO2 Captured (Tonnes/day)
Unit Operating Costs ($/Tonne)
Capital ($ MM)
Gross no,
8487
7.96
368.8
Ngt
6395
10.56
368.8
b.,tri511 7isqluu
1 •-••
10 "1f1
-.•17•••:. -.1‘5•1
A-5
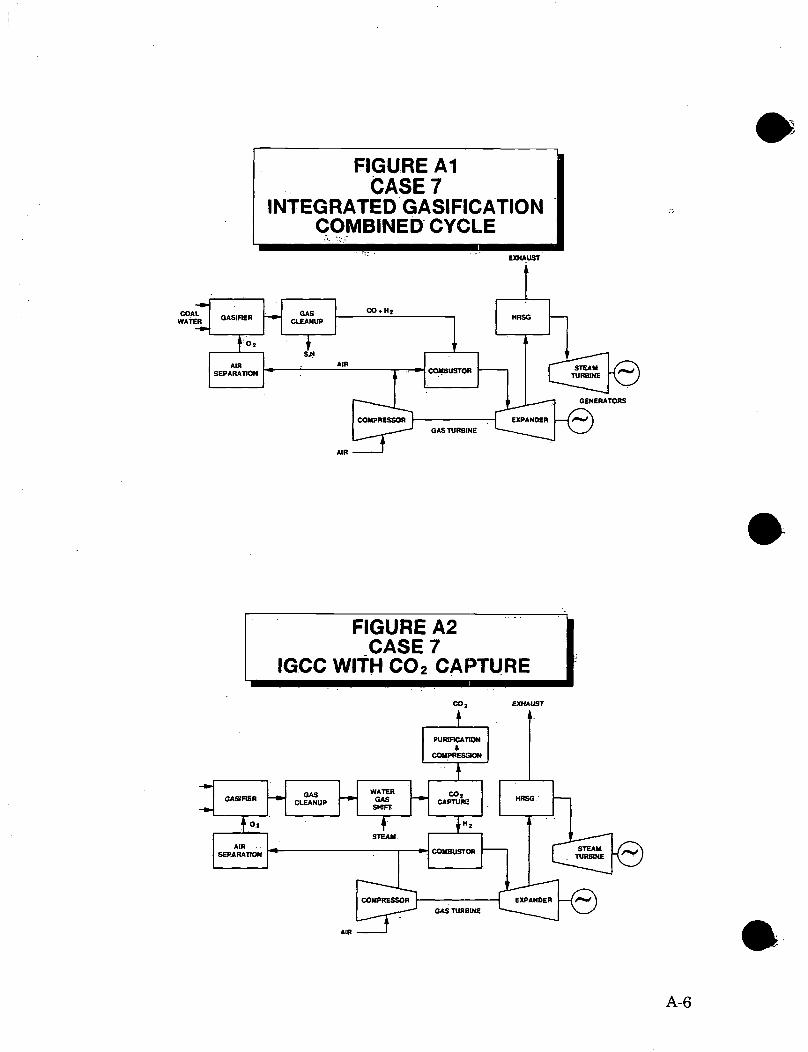
GASIFIER CO3
CAPTURE WATER
GAS SHIFT.
GAS CLEANUP
FIGURE Al CASE 7
INTEGRATED GASIFICATION COMBINED CYCLE
EXHAUST
CO • 212 14RSG GAS
CLEANUP GASIFIER COAL WATER
STEAM TURBINE
2
AIR cokmusTOR AIR
SEPARATION
GENERATORS
COMPRESSOR EXPANDER GAS TURBINE
AIR
FIGURE A2 _CASE 7
IGCC WITH CO2 CAPTURE
EXHAUST
PURIFICATION
COMPRESSON
MSG; H
COMPRESSOR EXPANDER
AIR - - SEPARATION COMBUSTOR
GAS TURBINE
STEAM TURBINE -c)
AIR
A-6