
co2-capture-report-incl-statement
83
The Costs of CO 2 Capture Post-demonstration CCS in the EU
description
co2-capture-report-incl-statement
Transcript of co2-capture-report-incl-statement

The Costs of CO2 Capture
Post-demonstration CCS in the EU
Key conclusions
The companies, scientists, academics and environmental NGOs that together make up the
Zero Emissions Platform (ZEP) have undertaken a ground-breaking study into the costs of
CO2 Capture and Storage (CCS) based on new data provided exclusively by ZEP member
organisations on existing pilot and planned demonstration projects. The conclusion: following
the European Union’s CCS demonstration programme, CCS will be cost-competitive with other
sources of low-carbon power, including on-/offshore wind, solar power and nuclear.
As publicly available cost data is scarce, ZEP members provided their own in-house data in order to establish a reference point for the costs of CCS based on a “snapshot” in time (all investment costs are referenced to the second quarter of 2009). The aim: to estimate the costs of complete CCS value chains – i.e. the capture, transport and storage of CO2 – for new-build coal- and gas-fired power plants, located at a generic site in Northern Europe from
the early 2020s. This is described in three reports1 on CO2 capture, CO2 transport and CO2 storage respectively, with resulting integrated CCS value chains presented in a summary report2.
N.B. As the costs of CCS will be inherently uncertain until
further projects come on stream, the ZEP CCS cost study will be
updated every two years in line with technological developments
and the progress of the EU CCS demonstration programme.
Post 2020, CCS will be cost-competitive with other low-carbon energy technologies
1 www.zeroemissionsplatform.eu/library/publication/166-zep-cost-report-capture.html; www.zeroemissionsplatform.eu/library/publication/167-zep-cost-report-transport.html; www.zeroemissionsplatform.eu/library/publication/168-zep-cost-report-storage.html
2 www.zeroemissionsplatform.eu/library/publication/165-zep-cost-report-summary.html3 www.iea.org/publications/free_new_Desc.asp?PUBS_ID=2207
ZEP statement on CCS cost reports
KEy ConCluSionS
CCS is on track to become one of the key technologies for combating climate change
In order to keep global warming below 2ºC – cost-effectively – CCS must provide 20% of the global cuts required by 2050, according to the International Energy Agency (IEA); the costs of doing so without CCS will be over 70% higher. In turn, CCS will enable Europe to enjoy a surge in economic growth – creating new jobs, boosting industry and promoting technology leadership.
ZEP’s study indicates that the EU CCS demonstration programme will not only prove the costs of CCS, but provide the basis for future cost reductions, enhanced by the introduction of second- and third-generation technologies. CCS is therefore on track to become one of the key technologies for combating climate change – within a portfolio of technologies, including greater energy efficiency and renewable energy.
Indeed, the future electricity system will look very different from today’s, requiring flexible solutions to accommodate increasing quantities of intermittent power sources. Energy storage (e.g. via pumped storage, or new forms such as electric car batteries)
is likely to spread and combine with demand-side management, supported by smart grids. Base-load demand will probably fall and the need for balancing power increase in order to complement intermittent power sources. The additional need for energy storage capacity and balancing power, as well as the operation of thermal power plants at lower utilisation, is likely to increase the cost of electricity.
ZEP will therefore undertake a complementary study on the costs of CCS in the context of other low-carbon energy technologies. However, recent reports such as the IEA’s “Projected Costs of Generating Electricity - 2010”3 indicate that the costs of post-demonstration CCS with coal (€70-90/MWh) and gas (€70-120/MWh), as presented in ZEP’s study, will be cost-competitive with other low-carbon power options – including on-/offshore wind, solar power and nuclear.
In short, a broad mix of low-carbon energy technologies is necessary, not only to meet CO2 reduction targets, but ensure a reliable energy supply – cost-effectively.

Key conclusions
ZEP statement on CCS cost reports
CCS is applicable to both coal- and gas-fired power plants
All three Co2 capture technologies could be competitive once successfully demonstrated
Early strategic planning of large-scale Co2 transport infrastructure is vital to reduce costs
A risk-reward mechanism is needed to realise the significant aquifer potential for Co2 storage
Creating a secure environment for long-term investment in Europe
CCS can technically be applied to both coal- and gas-fired power plants. Their relative economics depend on power plant cost levels, fuel prices and market positioning, whereas applicability is mainly determined
by load regime. While co-firing with biomass is not covered in the study, it will be in future updates as it provides significant abatement potential when combining CCS with sustainably-produced biomass feedstock.
The study covers first-generation capture technologies only (post-combustion, pre-combustion and oxy-fuel). Using agreed assumptions and the Levelised Cost of Electricity as the main quantitative value, there is
currently no clear difference between any of these and all could be competitive in the future once successfully demonstrated. The main factors influencing total costs are fuel and investment costs.
Clustering plants to a transport network can achieve significant economies of scale – in both CO2 transport and CO2 storage in larger reservoirs, on- and offshore. Large-scale CCS therefore requires the development of a transport infrastructure on a scale matched only by that of the current hydrocarbon infrastructure. As this will lead to greatly reduced long-term costs, early strategic planning is vital – including the development of clusters and over-sized pipelines – with any cross-border restrictions removed.
While the study focuses on power generation, the application of CCS to heavy industry and fuel transformation could abate ~15% of all global man-made CO2 emissions by 2050 (IEA). Indeed, in steel and cement production, for example, it is the only means of achieving deep emission cuts. If different CO2 sources – power, industry and fuel transformation – are located in close proximity, they can therefore share CO2 transport and storage infrastructure, and should be included in all National CCS Master Plans.
Location and type of storage site, reservoir capacity and quality are the main determinants for the costs of CO2 storage: onshore is cheaper than offshore; depleted oil and gas fields are cheaper than deep saline aquifers; larger reservoirs are cheaper than smaller ones; high injectivity is cheaper than poor injectivity. Given the large variation in storage costs
(up to a factor of 10) and the risk of investing in the exploration of deep saline aquifers that are ultimately found to be unsuitable, a risk-reward mechanism is needed to realise their significant potential and ensure sufficient storage capacity is available – in the time frame needed.
The current main incentive for the EU-wide deployment of CCS is the price of Emission Unit Allowances (EUAs) under the EU Emissions Trading System (ETS). However, based on current trajectories, this will not be a sufficient driver for investment after the first generation of demonstration projects is built (2015 - 2020). Enabling policies are therefore required in the intermediate period – after the technology is commercially proven, but before the EUA price has increased sufficiently to allow full commercial operation. The goal: to make new-build power generation with CCS more attractive to investors than without it.
Until a support system for biomass is in place, co-firing with CCS will not be commercially viable. A negative emission factor for such use of biomass under the ETS Directive is therefore necessary in order to create a level playing field
between renewable energy and fossil fuel-based CCS. This can be achieved through project-specific applications to the European Commission, which has signalled that it would welcome such requests from Member States.
Incentives for CCS in heavy industry and fuel transformation are also urgently required: to date, only the “NER 300” mechanism provides any significant amount of funding for such applications.
Finally, there is an urgent need to drive down costs via new well-targeted R&D into next-generation technologies, as defined by ZEP in its 2010 report: “Recommendations for Research to Support the Deployment of CCS in Europe beyond 2020.”4 This identifies key areas for improvement, together with the main strands for R&D to 2030 and beyond.
4 www.zeroemissionsplatform.eu/library/publication/95-zep-report-on-long-term-ccs-rad.html

2
This document has been prepared on behalf of the Advisory Council of the European Technology Platform for Zero Emission Fossil Fuel Power Plants. The information and views contained in this document are the collective view of the Advisory Council and not of individual members, or of the European Commission. Neither the Advisory Council, the European Commission, nor any person acting on their behalf, is responsible for the use that might be made of the information contained in this publication.

3
Contents Executive Summary ......................................................................................................................................... 5
1 Study on CO2 Capture Costs .................................................................................................................. 12 1.1 Background .................................................................................................................................... 10 1.2 Use of new, actualised data .......................................................................................................... 10 1.3 Calculation of the Levelised Cost of Electricity and CO2 avoidance costs .................................... 10
2 Boundary Conditions ............................................................................................................................. 12 2.1 Technical boundary conditions ....................................................................................................... 12 2.1.1 Reference power plants without CO2 capture ........................................................................... 12 2.1.2 Ambient site conditions .............................................................................................................. 13 2.1.3 Operating conditions .................................................................................................................. 13 2.1.4 CO2 quality and compression/processing .................................................................................. 13 2.2 Financial boundary conditions: key assumptions ........................................................................... 14 2.2.1 Investment costs ........................................................................................................................ 14 2.2.2 Plant life ..................................................................................................................................... 15 2.2.3 Operation and maintenance costs ............................................................................................. 15 2.2.4 Fuel costs ................................................................................................................................... 15 2.2.5 Interest costs and other charges ............................................................................................... 16 2.3 Summary of boundary conditions ................................................................................................... 16
3 CO2 Capture Costs for First-Generation Technologies ......................................................................... 18 3.1 Hard coal ........................................................................................................................................ 18 3.1.1 Hard coal PF coal-fired power plant with post-combustion capture .......................................... 21 3.1.2 Hard coal IGCC with pre-combustion capture ........................................................................... 25 3.1.3 Hard coal oxy-fueI PF power plant ............................................................................................ 30 3.2 Lignite ............................................................................................................................................. 37 3.2.1 Lignite-fired PF coal-fired power plant with post-combustion capture ....................................... 38 3.2.2 Lignite IGCC with pre-combustion capture ................................................................................ 41 3.2.3 Lignite oxy-fueI PF power plant ................................................................................................. 43 3.3 Natural gas ..................................................................................................................................... 45 3.3.1 Natural gas combined cycle with post-combustion capture ...................................................... 48
4 Comparison of ZEP Cost Estimates with Other Studies ........................................................................ 53 4.1 Hard coal ........................................................................................................................................ 55 4.1.1 Hard coal PF coal-fired power plant with post-combustion capture .......................................... 55 4.1.2 Hard coal IGCC with pre-combustion capture ........................................................................... 57 4.1.3 Hard coal oxy-fueI PF power plant ............................................................................................ 59 4.2 Lignite ............................................................................................................................................. 61 4.2.1 Lignite PF coal-fired power plant with post-combustion capture ............................................... 61 4.2.2 Lignite IGCC with pre-combustion capture ................................................................................ 62 4.2.3 Lignite oxy-fueI PF power plant ................................................................................................. 63 4.3 Natural gas ..................................................................................................................................... 64 4.3.1 Natural gas combined cycle with post-combustion capture ...................................................... 64
5 Future Trends in CO2 Capture Costs and Impact of Second-Generation Technologies ....................... 67 5.1 Post-combustion capture ............................................................................................................... 67 5.2 IGCC with pre-combustion capture ................................................................................................ 68 5.3 Oxy-fueI PF power plants ............................................................................................................... 69

4
5.4 Second-generation capture technologies....................................................................................... 70 5.4.1 Hard coal-based technologies .................................................................................................. 70 5.4.2 Natural gas-based technologies 72
6 Acknowledgements ................................................................................................................................ 77 6.1 Working Group participants and organisations .............................................................................. 77 6.2 Review partners .............................................................................................................................. 78
Glossary 79
Annex: List of Figures 80

5
Executive Summary Founded in 2005 on the initiative of the European Commission, the European Technology Platform for Zero Emission Fossil Fuel Power Plants (known as the Zero Emissions Platform, or ZEP) represents a unique coalition of stakeholders united in their support for CO2 Capture and Storage (CCS) as a critical solution for combating climate change. Indeed, it is not possible to achieve EU or global CO2 reduction targets cost-effectively without CCS – providing 20% of the global cuts required by 2050.
1 Members include European
utilities, oil and gas companies, equipment suppliers, national geological surveys, academic institutions and environmental NGOs. The goal: to make CCS commercially available by 2020 and accelerate wide-scale deployment. ZEP is an advisor to the EU on the research, demonstration and deployment of CCS. Members of its Taskforce Technology have therefore now undertaken a study into the costs of complete CCS value chains – i.e. the capture, transport and storage of CO2 – estimated for new-build coal- and natural gas-fired power plants, located at a generic site in Northern Europe from the early 2020s. Utilising new, in-house data provided by ZEP member organisations, it establishes a reference point for the costs of CCS, based on a “snapshot” in time (all investment costs are referenced to the second quarter of 2009). Three Working Groups were tasked with analysing the costs related to CO2 capture, CO2 transport
2 and CO2
storage3 respectively. The resulting integrated CCS value chains, based on these three individual reports,
are presented in a summary report.4
This report focuses on CO2 capture.
Best estimates for new power plants with CO2 capture in Europe, based on new, actualised data
The cost calculations made in this study utilise new, actualised data provided by the industrial and utility members of ZEP and reviewed by the working group, based on their own extensive knowledge and experience. Indeed, many are already undertaking detailed engineering studies for EU CCS demonstration projects. This has enabled ZEP to estimate the Levelised Cost of Electricity (LCOE) and CO2 avoidance costs for new-build commercial power plants with CO2 capture that would enter into operation in the early 2020s, located at a generic greenfield site in Northern Europe. N.B. Cost estimates do not include any additional site-specific investments. Costs for CO2 capture include the capture process, plus the conditioning and compression/liquefaction of the captured CO2 required for transport. The technologies studied are first-generation capture technologies: post-combustion CO2 capture; IGCC with pre-combustion capture; and oxy-fuel for hard coal, lignite and natural gas, where applicable. (Costs for the transport and storage of CO2 are not included.) For each technology, a range of costs has been developed, with low-end costs based on more ambitious power plant designs that depend on a completely successful demonstration of the technology, the inclusion of technology improvements, refined solutions and improved integration. In this study, such plants have been termed “OPTI”, which represents an optimised cost estimation. The more conservative, high-cost plant designs are termed “BASE” for a plant representing today‟s technology choices, employing the most commercial designs while adopting a conservative approach to risk,
1 International Energy Agency, World Energy Outlook, 2009
2 www.zeroemissionsplatform.eu/library/publication/167-zep-cost-report-transport.html
3 www.zeroemissionsplatform.eu/library/publication/168-zep-cost-report-storage.html
4 www.zeroemissionsplatform.eu/library/publication/165-zep-cost-report-summary.html

6
component redundancy and design performance margins. This case represents a highly conservative cost level. No development curve has been used to derive the OPTI power plant from a BASE power plant; and indeed if the demonstration phase is completely successful, it may be possible to skip the BASE and build an OPTI straight away. In addition, as CO2 capture is an emerging technology, cost improvement through learning curves can be expected for both the BASE and OPTI designs. All costs have been referenced to second quarter 2009 investment costs, with the LCOE and CO2 avoidance costs of each plant concept calculated according to the boundary conditions and fuel costs established in the study. Importantly, the clear definition of the boundary conditions will enable future comparison with other studies. Whilst the costs obtained in this study are not definitive final costs, they represent the current best estimation of ZEP supported by their considerable experience. In short, they represent a “snapshot” based on current engineering knowledge and will be refined on an ongoing basis in line with technology developments and the progress of EU CCS demonstration projects.
The results
For a hard coal-fired power plant (based on second quarter 2009, equipment cost levels and a fuel cost of €2.4/GJ), it has been calculated that the addition of CO2 capture and the processing of the CO2 for transport will increase the LCOE from ~€45/MWh to ~€70/MWh, depending on the capture technology for a new-build OPTI power plant design (Figure 1):
Figure 1: LCOE for hard coal-fired power plants with CO2 capture
The CO2 avoidance costs for capture are calculated to be in the range €30-40/tonne of CO2 for an OPTI early commercial power plant design (Figure 2):

7
Figure 2: CO2 avoidance costs for hard coal-fired power plants with CO2 capture
Calculations undertaken for lignite-fired power plants with CO2 capture also imply that a CO2 avoidance cost in the range of €30/t CO2 is possible for an OPTI advanced power plant with CO2 capture (including pre-drying of the lignite), while results for an OPTI natural gas combined cycle power plant with post-combustion capture show the heavy dependence of fuel costs on the final result (Figure 3). Indeed, at the lower end of the cost range for natural gas, the LCOE is competitive with other fuel sources, being ~€65/MWh for a fuel price slightly under €5/GJ.
Although the results place the costs of IGCC with pre-combustion capture slightly higher than those of post- combustion capture, and oxy-fuel appears to have a larger range of values with some studies indicating that this technology has the lowest cost, there is no clear difference between any of the capture technologies and all three could be competitive in the future, if successfully demonstrated.
0.0
20.0
40.0
60.0
80.0
100.0
120.0
2 3 4 5 6 7 8 9 10 11 12
Cos
t / €
CO2 Avoidance Cost (€/tCO2)
LCOE Reference Plant (€/MWh)
LCOE with Post-Combustion Capture (€/MWh)
Figure 3: Dependence on the natural gas price for post-combustion capture

8
The EU CCS demonstration programme is therefore essential in order to:
Validate each capture technology and power plant concept using different fuels;
Confirm that capture technologies can achieve high plant availabilities so costs remain competitive; and, most importantly,
Determine the real costs for each case. There is also an urgent need to drive down the costs of CO2 capture and compression through new, well-targeted R&D programmes, such as those defined in ZEP‟s 2010 report “Recommendations for research to support the deployment of CCS in Europe beyond 2020”.
5 CO2 capture is an emerging technology and
historical experience with comparable processes suggests that significant improvements are achievable. The potential cost benefits of future promising capture technologies are therefore also briefly discussed. The costs obtained in this study cannot be compared directly to other published studies, as the boundary conditions tend to be different, which impacts on the final result. However, a simplistic comparison has been made by extracting the technical and economic data, and recalculating the costs according to the boundary conditions for this study. This shows that as CO2 avoidance costs are higher for less efficient subcritical steam power plants, state-of-the-art ultra supercritical steam conditions need to be considered as standard for new-build European power plants. The LCOE and CO2 avoidance costs calculated in this study are also higher than those of previous European cost studies, probably due to a better current understanding of the capture processes. However, they tend to be slightly lower than the majority of other recent international studies, although this simplistic analysis does not permit any further detailed comparison.
6
In all cost studies, there are degrees of technical and economic uncertainty in the power plant concepts and no value can be considered to be a definitive cost. However, the conclusions of this study are based on new, actualised data and the extensive experience of key industry players, many of whom are now developing large-scale CCS projects. In short, ZEP considers the costs determined in this study to represent the best current estimate for new-build commercial power plants with first-generation CO2 capture technologies, entering into operation in Europe in the early 2020s.
5 www.zeroemissionsplatform.eu/library/publication/95-zep-report-on-long-term-ccs-rad.html
6 See Chapter 4, page 53

9
Key conclusions
CO2 capture is an emerging technology and historical experience with comparable processes suggests that significant improvements are achievable. However, as it represents 80-90% of the costs of integrated CCS projects (~75% excluding the power plant), cost reduction must focus on capture – while keeping the costs of transport and storage low. The EU CCS demonstration programme is therefore essential in order to validate each capture technology and power plant concept using different fuels; confirm that capture technologies can achieve high plant availabilities so costs remain competitive; and most importantly, determine the real costs for each case.
For hard coal-fired power plants based on second quarter 2009 equipment cost levels and a fuel cost of €2.4/GJ, the addition of CO2 capture and the processing of CO2 for transport increases the LCOE from ~€45/MWh to ~€70/MWh, depending on the capture technology for an optimised (OPTI) power plant design entering into operation in the early 2020s. This is equivalent to CO2 avoidance costs of €30-40/t.
Although the results position the costs of IGCC with pre-combustion capture slightly higher than those of post-combustion, and oxy-fuel appears to have a larger range of values (with some studies indicating it has the lowest cost), there is no clear difference between any of the capture technologies and all could be competitive in the future if successfully demonstrated.
For natural gas CCGT power plants with post-combustion capture, the final result is heavily dependent on the fuel cost. Although CO2 avoidance costs are more than double those of hard coal-fired power plants, due in part to the lower CO2 production, when the natural gas fuel cost is lower than €5/GJ, the LCOE is competitive with that of hard coal-fired power plants.
For lignite-fired power plants with CO2 capture, CO2 avoidance costs could be in the range of €30/t CO2 for an OPTI power plant with pre-drying of the lignite.

10
1 Study on CO2 Capture Costs
1.1 Background
In 2006, ZEP launched its first Strategic Deployment Document (SDD) and Strategic Research Agenda (SRA) for CO2 Capture and Storage (CCS). The goal: to provide a clear strategy for accelerating its deployment as a critical technology for combating climate change. The conclusion: an integrated network of demonstration projects should be implemented urgently EU-wide in order to ensure CCS is commercially available by 2020. In 2008, ZEP then carried out an in-depth study
7 into how such a demonstration programme could work in
practice, from every perspective – technological, operational, geographical, political, economic and commercial. This approach was endorsed by both the European Commission and European Council; and by 2009, two key objectives had already been met – to establish funding for an EU CCS demonstration programme and a regulatory framework for CO2 storage. An updated SDD followed in 2010.
8
As importantly, ZEP has published its long-term R&D
9 plan for next-generation CCS technologies to ensure
rapid deployment post-2020. Now, ZEP experts have identified the key cost elements and forecast the long-term cost of CO2 capture – in the context of CO2 transport and storage solutions – in order to provide the most complete and consistent analysis to date. Indeed, this has been undertaken in parallel with similar work on transport
10 and storage
11 costs, and should be assessed in conjunction with these results.
An analysis of integrated CCS value chains, based on the results of the three individual reports, are presented in a summary report.
12
1.2 Use of new, actualised data
The technical and economical data used to calculate the cost estimates are new actualised data, provided and reviewed by members of ZEP‟s Taskforce Technology. Indeed, many are participating in EU CCS demonstration projects and are already undertaking detailed engineering and/or pre-FEED studies for new- build first-generation CO2 capture power plants using different fuels. The technologies studied include post-combustion CO2 capture, IGCC with pre-combustion capture and oxy-fuel for hard coal, lignite and natural gas, where applicable. While not definitive, the results may therefore be considered a current snapshot of perceived „real‟ costs for developing new-build commercial power plants with first-generation CO2 capture technologies that would enter into operation in the early 2020s. The plants are assumed to be located at a generic location in Europe. N.B. Cost estimates do not include any additional site-specific investments.
1.3 Calculation of the Levelised Cost of Electricity and CO2 avoidance costs
Investment, operation and maintenance cost data, combined with the design parameters and net plant efficiency, have then been used to calculate the Levelised Cost of Electricity (LCOE) of the different power plant concepts with and without capture, while the CO2 avoidance cost has been determined by referencing the costs and emissions of power plants with capture to those of a state-of-the-art thermal power plant without CO2 capture.
7 www.zeroemissionsplatform.eu/library/publication/2-eu-demonstration-programme-co-2-capture-storage.html
8 www.zeroemissionsplatform.eu/library/publication/125-sdd.html
9 www.zeroemissionsplatform.eu/library/publication/95-zep-report-on-long-term-ccs-rad.html
10 www.zeroemissionsplatform.eu/library/publication/167-zep-cost-report-transport.html
11 www.zeroemissionsplatform.eu/library/publication/168-zep-cost-report-storage.html
12 www.zeroemissionsplatform.eu/library/publication/165-zep-cost-report-summary.html

11
The total investment cost for each concept includes the Engineering Procurement and Construction costs (EPC) of the power plant, as well as the Owner‟s Costs to develop the project. The Owner‟s Costs are those incurred during the planning, designing and commissioning phases of the power plant and include a contingency for any deviations. However, no site-specific costs have been included for grid connection etc. Boundary conditions established for the study also, of course, have a significant impact on the final results and their transparent definition should enable future comparison with other studies (see pages 12-17). In this study, all investment costs are fixed to materials‟ costs for the second of quarter 2009. For plant and equipment costs based on other time periods, data have been adjusted to second quarter 2009 costs by applying the Cambridge Energy Research Associates (CERA) cost index curve (see page 14). For each technology, a range of costs has been developed, with low-end costs based on more ambitious power plant designs that depend on a completely successful demonstration of the technology, the inclusion of technology improvements, refined solutions and improved integration. In this study, such plants have been termed “OPTI”, which represents an optimised cost estimation. The more conservative, high-cost plant designs are termed “BASE” for a plant representing today‟s technology choices, employing the most commercial designs while adopting a conservative approach to risk, component redundancy and design performance margins. This case represents a highly conservative cost level. No development curve has been used to derive the OPTI power plant from a BASE power plant; and indeed if the demonstration phase is completely successful, it may be possible to skip the BASE and build an OPTI straight away. In addition, as CO2 capture is an emerging technology, cost improvement learning curve can be expected for both BASE and OPTI designs.

12
2 Boundary Conditions
This study has calculated the LCOE and CO2 avoidance costs for various types of new-build commercial power plants with CO2 capture that are expected to enter into operation in the early 2020s. The LCOE takes into consideration plant capital costs, O&M costs, fuel costs, site location and financial assumptions over the lifetime of the power plant in order to calculate the electricity cost without profit. The CO2 avoidance cost of a capture technology is determined by comparing the LCOE and CO2 emissions of a power plant concept with CO2 capture against a reference power plant without CO2 capture. Some of the data employed in these calculations is obviously specific to the capture technology option, whilst other data is common/reference data specific to this cost study and applied in all cases. As these boundary conditions have a significant effect on the final results, the values assumed in this study are shown below so that the results may be compared to those of other cost studies in a transparent manner.
2.1 Technical boundary conditions
2.1.1 Reference power plants without CO2 capture In order to calculate the CO2 avoidance costs for the power plant concepts with capture, the following reference power plants without CO2 capture have been used in this study:
Natural gas-fired single-shaft F-class Combined Cycle Gas Turbine producing 420 MWe net at an efficiency of 58% (LHV for BASE) or 60% (LHV for OPTI).
Hard coal 736 MWe net pulverised fuel (PF) ultra supercritical (280 bar 600/620ºC steam cycle) power plant
Lignite-fired 989 MWe net PF ultra supercritical (280 bar 600/620ºC steam cycle) power plant and a lignite-fired 920MWe net PF ultra supercritical (280 bar 600/620ºC steam cycle) power plant with pre-drying of the lignite.
The generic technical parameters of each reference power plant case are shown in the following table:
Parameters PF Hard Coal PF Lignite-Fired CCGT (F-class)
Net Electricity Output MWe 736 989 920 420
HP Turbine Steam Inlet Pressure
Bara
280 280 280 113.8/27.7/3.99
HP Turbine Inlet Temperature ºC 600 600 600 549
IP Turbine Inlet Steam Reheat Temperature
ºC 620 620 620 549
Net Full Load Plant Efficiency % LHV 46% 43% 48% 58% (BASE) 60% (OPTI)
Plant Load Factor h/year 7,500 7,500 7,500
Plant Life Year 40 40 25
CO2 Emissions Calculated from Fuel Carbon Content
t/MWh 0.759 0.930 0.347
N.B. An IGCC plant without CO2 capture has not been selected as a reference power plant case because these types of plants have not been constructed in the last decade and the four existing IGCC power plants are best described as first-of-a-kind demonstration plants. As no reliable cost data therefore exists, it was

13
therefore decided to reference the IGCC power plants with CO2 capture against the pulverised coal power plants without CO2 capture. The pulverised coal thermal power plant is the standard state-of-the-art model used today for coal-fired generation. Both the reference power plants and those with capture analysed in this study are designed to comply with the future Industrial Emissions Directive (IED), which will supersede the Large Combustion Plant Directive (LCPD) in 2016. This directive limits the amount of NOx, SOx, CO and particulates that power plants may emit and thus determines the clean-up technologies that must be employed.
2.1.2 Ambient site conditions As ambient conditions are site-specific, it was decided to use a fictional location that corresponds to ISO standard conditions for an inland construction site with natural draught cooling towers:
Ambient temperature: 15°C
Ambient relative moisture: 60%
Ambient pressure (absolute) 1013 mbar
Condensing pressure: 48 mbar
Cooling water temperature 18.2°C
It was also assumed that the site would be a greenfield site in Northern Europe, with no specific site development costs or on-site utility system investments to connect the power plant to the grid.
2.1.3 Operating conditions Due to the inherent higher investment costs of thermal power plants with CO2 capture, it is assumed that the power plants would operate in base load, operating for 7,500 hours per year.
2.1.4 CO2 quality and compression/processing Including the compression/processing of the captured CO2 (to meet the requirements of the transport process) in the design and cost of the power plant concept enables any benefits arising from the integration of streams between the compression/processing island, capture plant and the power plant to be taken into account, as well as those synergies arising from using common plant infrastructures and utilities. This methodology also ensures that all the internally consumed electricity required for the CO2 compression and processing is part of the capture penalty. Requirements for CO2 quality are defined by those for CO2 transport, storage, environmental regulations and overall cost. There are generally no strong technical barriers to providing high purity captured CO2, but high purity requirements are likely to incur additional costs and energy requirements, resulting in a loss of power plant efficiency. Significant work is ongoing, both via various demonstration projects and R&D institutes to determine the limits for impurities in the CO2 stream related to both transport options and storage. For this study, the following criteria have been assumed as a basis for CO2 compression pressure and quality requirements for pipeline transport conditions that should permit the use of cost-effective carbon steel materials in CO2 pipelines:
• CO2 delivery pressure 100-110 bar
• CO2 delivery temperature max. 30°C
• CO2 quality: o CO2 concentration >95.5% o Water content sufficiently low to ensure that no free water can form in any mode of operation o Total content of all non-condensable gases < 4% volume o Due to health and safety limits that would be associated with short-term sudden leakages in case
of a rupture, the following were also assumed:

14
- H2S <200ppm - CO <2000ppm - SO2 <100ppm - NOx <100ppm
N.B. The above criteria are those employed for this cost study and in no way reflect a CO2 specification for pipeline transport. However, if the initial transport from the power plant is possible by ship and the CO2 can be loaded directly into the boat, the CO2 needs to be conditioned and liquefied to the following conditions:
CO2 delivery pressure: around 7 bar
CO2 delivery temperature: down to around –55ºC
CO2 quality: as above From the cost data supplied it is considered that both the investment and O&M costs, based on the same CO2 capture and flow rate, are very similar for both options. The data also indicate that the processing of the captured CO2 into conditions suitable for ship transport would require a slightly larger internal power penalty than that required for compression and processing for pipeline conditions. This larger internal power penalty
results in a net final power plant efficiency of ~0.5% points lower. This difference is, however, well within the margin of variation for the estimations of such plants and the costs presented in this study can therefore be considered relevant for both transport options.
2.2 Financial boundary conditions: key assumptions
The following economic assumptions have been used in this study.
2.2.1 Investment costs All the investment costs in this study are referenced to the second quarter of 2009 for materials costs. Cost data with plant and equipment costs referenced to a different time period have been adjusted to second quarter 2009 costs by applying the Cambridge Energy Research Associates (CERA) cost index curve below:
The total investment cost includes the Engineering Procurement and Construction (EPC) costs of the power plant, as well as the Owner‟s Costs to develop the project. The EPC costs include the complete power plant
15
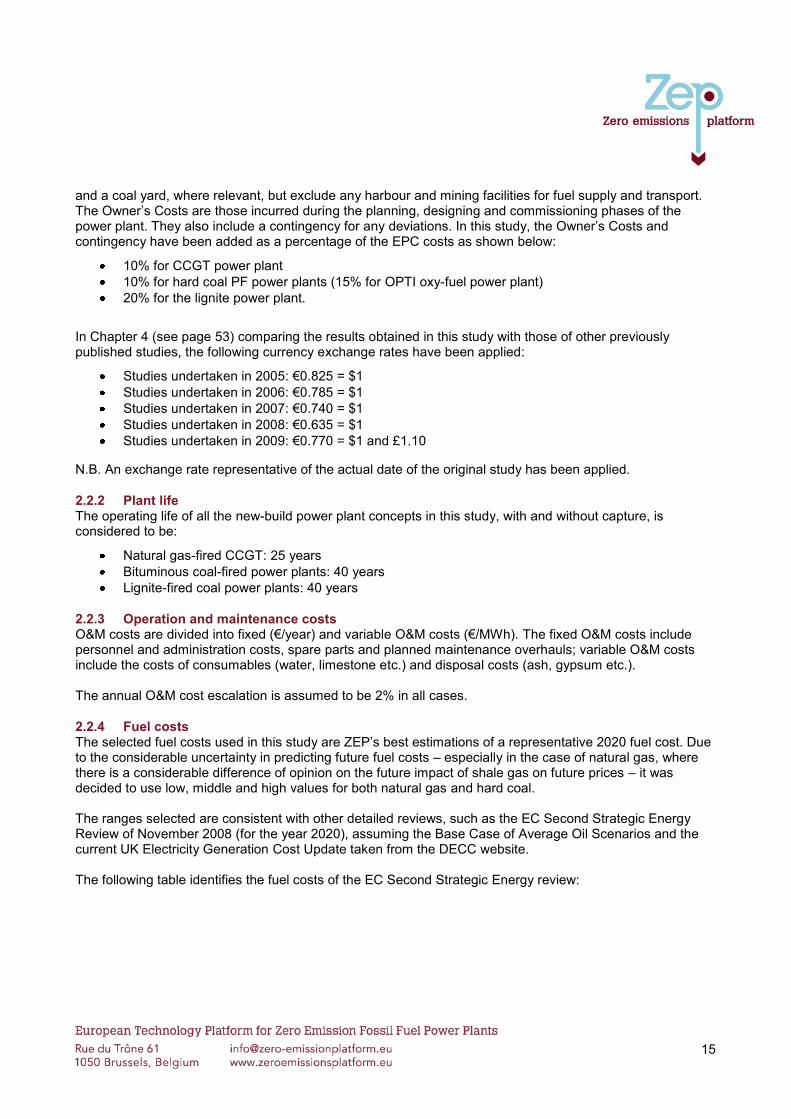
and a coal yard, where relevant, but exclude any harbour and mining facilities for fuel supply and transport. The Owner‟s Costs are those incurred during the planning, designing and commissioning phases of the power plant. They also include a contingency for any deviations. In this study, the Owner‟s Costs and contingency have been added as a percentage of the EPC costs as shown below:
10% for CCGT power plant
10% for hard coal PF power plants (15% for OPTI oxy-fuel power plant)
20% for the lignite power plant.
In Chapter 4 (see page 53) comparing the results obtained in this study with those of other previously published studies, the following currency exchange rates have been applied:
Studies undertaken in 2005: €0.825 = $1
Studies undertaken in 2006: €0.785 = $1
Studies undertaken in 2007: €0.740 = $1
Studies undertaken in 2008: €0.635 = $1
Studies undertaken in 2009: €0.770 = $1 and £1.10
N.B. An exchange rate representative of the actual date of the original study has been applied.
2.2.2 Plant life The operating life of all the new-build power plant concepts in this study, with and without capture, is considered to be:
Natural gas-fired CCGT: 25 years
Bituminous coal-fired power plants: 40 years
Lignite-fired coal power plants: 40 years
2.2.3 Operation and maintenance costs O&M costs are divided into fixed (€/year) and variable O&M costs (€/MWh). The fixed O&M costs include personnel and administration costs, spare parts and planned maintenance overhauls; variable O&M costs include the costs of consumables (water, limestone etc.) and disposal costs (ash, gypsum etc.). The annual O&M cost escalation is assumed to be 2% in all cases.
2.2.4 Fuel costs The selected fuel costs used in this study are ZEP‟s best estimations of a representative 2020 fuel cost. Due to the considerable uncertainty in predicting future fuel costs – especially in the case of natural gas, where there is a considerable difference of opinion on the future impact of shale gas on future prices – it was decided to use low, middle and high values for both natural gas and hard coal. The ranges selected are consistent with other detailed reviews, such as the EC Second Strategic Energy Review of November 2008 (for the year 2020), assuming the Base Case of Average Oil Scenarios and the current UK Electricity Generation Cost Update taken from the DECC website. The following table identifies the fuel costs of the EC Second Strategic Energy review:

16
Oil price scenario 61$/bbl 100$/bbl 61$/bbl 100$/bbl 61$/bbl 100$/bbl
Oil 7.6 9.7 8.0 11.6 8.5 13.9
Gas 5.8 6.4 6.0 8.5 6.4 10.8
Coal 1.9 2.2 2.0 2.8 2.0 3.4
Fuel cost in €/GJ
Inflation: 2%/year
2010 2015 2020
EC Working Document "Europe's current and future energy position. Demand-resources-investments"
for EU Second Strategic Energy Review, {COM(2008) 781 final} , Nov 2008
The table below identified the predicted fuel prices of the UK Electricity Generation Cost Update:
Scenario Gas Coal Coal adv.
Low 4.29 1.53 2.75
Middle 8.11 2.35 5.75
High 11.23 2.90 8.33
Source: Mott MacDonald estimates based on
DECC assumptions
Average price 2015-2020 converted in €/GJ
The following fuel costs were selected for this study:
Fuel Costs Low Middle High
Hard Coal – €/GJ 2.0 2.4 2.9
Lignite – €/GJ 1.39
Natural Gas – €/GJ 4.5 8.0 11.0
A fuel escalation cost of 1.5% per annum is applied in the calculation.
2.2.5 Interest costs and other charges In this study, the weighted average cost of capital (WACC) takes into account the equity rate, inflation and required rate of return on equity, i.e. it assumes that the inflation rate is equal for all costs and incomes during the project life. The WACC is assumed here to be 8.0%.
2.3 Summary of boundary conditions
The table below identifies the main assumptions and costs used in this study:

17
Figure 4: Financial and other boundary conditions used in the study
Lignite plant
Reference year of study year
Economic lifetime years 40
Depreciation years 40
Fuel price EUR/GJ (LHV) 2 2.4 2.9 4.5 8 11 1.39
Fuel price escalation % per year 1.5%
Operating hours per year hours per year 7,500
Standard Emission factor t/MWh th 0.402
Common Inputs
O&M cost escalation
Debt/Equity ratio %
Loan interest rate %
Interest during construction %
Return on Equity %
Start of debt service
Tax rate %
WACC
Discount rate %
Natural gas plant
0.344
Second quarter 2009
Hard coal plant
8%
9%
25
25
1.5%
7,500
0.210
6%
12%
Commercial operation
35%
2%
50%
6%
40
40
1.5%
7,500

18
3 CO2 Capture Costs for First-Generation Technologies In any calculations of this type, there will be degrees of technical and economic uncertainty in the power plant concepts. However, as the study shows no clear differences in the LCOE between any of the CO2 capture technologies – post-combustion, pre-combustion and oxy-fuel – all three could be competitive in the future, if successfully demonstrated. For example, the results suggest that the costs of the IGCC power plant with pre-combustion capture are slightly higher than those of the advance pulverised fuel (PF) power plant with post-combustion capture. However, there is more conservatism in the IGCC power plant design as it is not a common technology within the electrical sector and there are concerns regarding its ability to achieve high plant availabilities. With respect to oxy-fuel capture, there is also a considerable spread in the cost results, with BASE plants with hard coal having the highest LCOE, but OPTI plants having the lowest. However, this reflects the fact that this technology is the least well-developed of the three options, causing greater uncertainty in the final power plant configuration. The EU CCS demonstration programme is therefore essential as it will enable the validation of each power plant concept and determine the real costs of each technology. There is also an urgent need to drive down the costs of CO2 capture and compression via new, well-targeted R&D programmes such as those defined in ZEP’s 2010 report, “Recommendations for research to support the deployment of CCS in Europe beyond 2020”.
13
CO2 capture is an emerging technology and historical experience with comparable processes suggests that significant improvements are achievable.
3.1 Hard coal
For hard coal, the following power plant concepts have been considered:
Hard coal PF ultra supercritical (280 bar 600/620ºC steam cycle) power plant with post-combustion capture based on advanced amines
Hard coal-fired oxygen blown IGCC with full quench design, sour shift and CO2 capture with F-class gas turbine (diffusion burners with syngas saturation and dilution)
Hard coal oxy-fired PF power plant with ultra supercritical steam conditions (280 bar 600/620ºC steam cycle).
As previously stated, power plant costs are referenced to the second quarter of 2009 and three fuel prices assumed:
Fuel Costs Low Middle High
Hard Coal – €/GJ 2.0 2.4 2.9
The following costs have been determined for each of the concepts studied. N.B. These costs are for CO2
capture only and exclude costs for CO2 transport and storage.
13
www.zeroemissionsplatform.eu/library/publication/95-zep-report-on-long-term-ccs-rad.html

19
Levelised Electricity Costs (LCOE) €/MWh
CO2 Avoidance Cost €/t CO2
Low Fuel Cost €2.0/GJ
Reference Case – No Capture
State-of-the-Art 44.4-44.6 –
Hard Coal PF Post- Combustion Capture
BASE Early Commercial 68.5 36.0
AVERAGE 65.9 32.1
OPTI Early Commercial 62.9
27.5
Hard Coal IGCC with Pre-Combustion Capture
BASE Early Commercial 75.3 46.7
AVERAGE 70.2 38.6
OPTI Early Commercial 66.3 32.5
Hard Coal PF Oxy-Fuel
BASE Early Commercial 71.3-81.9 40.5-56.6
(Ref Plant) OPTI Early Commercial
(39.1) 58.5-64.3
28.5-37.6
Middle Fuel Cost €2.4/GJ
Reference Case – No Capture
State-of-the-Art 48.1-48.3 –
Hard Coal PF Post- Combustion Capture
BASE Early Commercial 72.9 37.2
AVERAGE 70.3 33.3
OPTI Early Commercial 67.2 28.5
Hard Coal IGCC with Pre-Combustion Capture
BASE Early Commercial 80.0 48.3
AVERAGE 74.7 39.8
OPTI Early Commercial 70.5 33.3
Hard Coal PF Oxy-fuel BASE Early Commercial 76.0-86.7 42.1-58.2
(Ref Plant) OPTI Early Commercial
(42.8) 63.0-69.1
29.9-39.3
High Fuel Cost €2.9/GJ
Reference Case – No Capture
State-of-the-Art 52.7-52.8 –
Hard Coal PF Post-Combustion Capture
BASE Early Commercial 78.5 38.8
AVERAGE 75.9 34.7
OPTI Early Commercial 72.6 29.7
Hard Coal IGCC with Pre-Combustion Capture
BASE Early Commercial 85.9 50.3
AVERAGE 80.2 41.2
OPTI Early Commercial 75.8 34.4
Hard Coal PF Oxy-fuel BASE Early Commercial 82.0-92.6 44.2-60.2
(Ref Plant) OPTI Early Commercial
(47.4) 68.7-75.1
31.6-41.4
N.B. In the case of oxy-fuel, where there exists a range of values for both the BASE and OPTI cases, the values identified in bold text are those that have been used in the figures.
Figures 5 and 6 show the data from the above table for the middle fuel cost of €2.4/GJ:

20
Figure 5: LCOE for hard coal-fired power plants with CO2 capture
Figure 6: CO2 avoidance costs for hard coal-fired power plants with CO2 capture
Changing the fuel costs simply displaces the values, in a fairly consistent manner, as the plant efficiencies for each case are similar. While it is difficult to draw concrete conclusions as the values represent a “snapshot” of the perceived real costs, the following observations can be made:
As there is currently uncertainty as to the values of all three technologies, there is a clear need to demonstrate all options.
The difference between the values of each technology is not sufficient to discard any of them and all three could be competitive.
Costs for hard coal IGCC pre-combustion capture appear to be higher than those for post-combustion capture, but as electricity utilities are less familiar with pre-combustion, the cost figures

21
may simply be more conservative. Nevertheless, there is a clear need to target efforts at reducing the costs of the IGCC power plant and, in particular, the air separation process.
The lower end of the LCOE for an OPTI plant with hard coal oxy-fuel is the lowest of the three first-generation capture technologies and potentially represents the cheapest option. However, there is a much larger spread of costs for oxy-fuel technology, as it is the newest technology.
In the following sub-sections, details are given for each hard coal power plant concept studied.
3.1.1 Hard coal PF coal-fired power plant with post-combustion capture A post-combustion capture plant employing advanced amines with CO2 compression was integrated into the reference hard coal PF ultra supercritical thermal power plant. The addition of the capture plant and compression island caused the net efficiency and power output of the reference power plant to decrease due to the energy demands of these processes. The parameters of the reference and power plant with capture are shown in the following table:
Parameters Reference PF Hard Coal without Capture
PF Hard Coal with Post- Combustion Capture
Net Electricity Output MWe 736 616
HP Turbine Steam Inlet Pressure
Bara
280 280
HP Turbine Inlet Temperature ºC 600 600
IP Turbine Inlet Steam Reheat Temperature
ºC 620 620
Net Full Load Plant Efficiency % LHV 46% 38%
Plant Load Factor h/year 7,500 7,500
Plant Life Year 40 40
CO2 Emissions Calculated from Fuel Carbon Content
t/MWh 0.759 0.918
CO2 Capture Rate % – 90
CO2 Captured t/MWh – 0.827
The following considerations can be made concerning the hard coal PF power plant with post-combustion capture:
Its design is representative of one of the early commercial power plants – the higher cost range being indicative of a BASE power plant employing today‟s technologies and lower cost range of an OPTI commercial power plant, assuming foreseen improvements and improved integration.
The capture power plant consists of two parallel capture trains based on a commercially available advanced amine for the most optimistic design (OPTI) and a three parallel capture trains system for the more conservative design (BASE).
The steam turbine design has not been modified to reflect large steam extraction required for the CO2 capture plant. Steam extraction is assumed to be taken from an overflow line and a valve is employed to hold pressure during part load operation.
The main additional energy requirements leading to a 7%-9% real drop in power plant efficiency when compared to the reference power plant without capture are attributable to: - Steam extraction taken from between the intermediate pressure (IP) and low pressure (LP)
turbine for the reboiler of the capture power plant - CO2 compressor electrical drive - Additional ID fan.

22
The capture power plant design is essentially fairly conservative, as no improvements to the steam turbine are considered. There exists the possibility in the future of modifying the steam turbine, e.g. the LP turbine could be reduced in capacity, resulting in possible future cost savings. Improvements in amine sorbent performance and standardisation of the capture plant will also lead to future cost savings and efficiency improvements. The economics of the power plants are shown in the following table:
Economics
Reference PF Hard Coal without Capture
PF Hard Coal with Post-Combustion Capture
Performance Data
Power plant capacity MWe 736 616
Investment Cost
EPC cost mill € 1,144 1,141-1,152
1,509 1,416-1,601
EPC cost, net €/kW 1,555 1,550-1,565
2,450 2,300-2,600
Owner's Cost (including contingencies) % EPC 10 10
Total investment cost mill € 1,259 1,255-1,267
1,660 1,558-1,762
Fuel costs €/GJ (LHV)
Low Mid High Low Mid High
2.0 2.4 2.9 2.0 2.4 2.9
Operating Cost
Fixed O&M mill €/year 26.2 36.0 35.0-37.0
Variable O&M €/MWh 1 3,3 3.0-3.7
Low Fuel Cost (€2/GJ)
Levelised CAPEX €/MWh 19
19.0-19.1 30 28.1-31.8
Levelised O&M €/MWh 7.1 13.7
13.1-14.5
Levelised Fuel Cost €/MWh 18.3 22.2
21.6-22.2
Levelised Electricity Cost (LCOE)
€/MWh 44.5 44.4-44.6
65.9 62.9-68.5
CO2 Avoidance Cost €/t CO2 – 32.1
27.5-36.0
Middle Fuel Cost (€2.4/GJ)
Levelised CAPEX €/MWh 19
19.0-19.1 30 28.1-31.8
Levelised O&M €/MWh 7.1 13.7
13.1-14.5

23
Levelised Fuel Cost €/MWh 22.0 26.6
25.9-26.6
Levelised Electricity Cost (LCOE)
€/MWh 48.1 48.1-48.3
70.3 67.2-72.9
CO2 Avoidance Cost €/t CO2 – 33.3
28.5-37.2
High Fuel Cost (€2.9/GJ)
Levelised CAPEX €/MWh 19
19.0-19.1 30 28.1-31.8
Levelised O&M €/MWh 7.1 13.7
13.1-14.5
Levelised Fuel Cost €/MWh 26.6 32.2
31.3-32.2
Levelised Electricity Cost (LCOE)
€/MWh 52.7 52.7-52.8
75.9 72.6-78.5
CO2 Avoidance Cost €/t CO2 – 34.7
29.7-38.6
CO2 avoidance costs are calculated to be in the range of €28.5 to €37.2/t CO2 for the middle fuel cost of €2.4/GJ. The high end of the cost figure is considered to be more representative of a BASE early commercial power plant with three parallel capture trains, whilst the low end of the costs are deemed to be more representative of an OPTI early commercial power plant based on two parallel capture trains. The fixed O&M costs for a power plant with capture are more than 35% higher than those for the reference power plant without capture. This increase takes into consideration both the maintenance of the capture plant as well as the additional labour required. This cost is considered to be on the high side, as it includes a conservative factor for the novel technological aspect of the capture plant. As the capture plants become standard and plant personnel become familiar with them, fixed O&M costs, in particular personnel costs, should reduce. Variable O&M costs are expected to triple with respect to the reference plant without capture due to the additional chemical costs, cooling water charges and waste disposal costs. Indeed, future solvent costs and the quality of waste materials are two current “big unknowns” for this technology, with considerable uncertainty regarding these values. In summary, Figure 7 (below) identifies the LCOE and CO2 avoidance costs calculated for the hard coal PF power plant with post-combustion capture, based on the middle fuel cost of €2.4/GJ:

24
Figure 7: LCOE and CO2 avoidance costs for hard coal-fired power plants with post-combustion capture
Figure 8 shows the impact on the LCOE and CO2 avoidance costs for the OPTI post-combustion capture case varying the fuel costs:

25
0.0
20.0
40.0
60.0
80.0
100.0
120.0
1.8 2.0 2.2 2.4 2.6 2.8 3.0 3.2 3.4 3.6
Co
st /
€
CO2 Avoidance Cost (€/tCO2)
LCOE Reference Plant (€/MWh)
LCOE with Post-combustion Capture (€/MWh)
Fuel price (€/GJ)
Figure 8: Dependence on the coal price for post-combustion capture (OPTI power plant)
3.1.2 Hard coal IGCC with pre-combustion capture For this study, it was decided that it would be more representative to reference the IGCC power plant with CO2 capture against the PF reference coal-fired power plant. Their design parameters are shown in the following table:
Parameters Reference PF Hard Coal without Capture
IGCC – Full Water Quench design; Sour CO-Shift, H2Syngas Saturation and Dilution
Net Electricity Output MWe 736 900
Net Full Load Plant Efficiency % LHV 46% 38% 35.7%-40%
Plant Load Factor h/year 7,500 7,500
Plant Life Year 40 40
CO2 Emissions Calculated from Fuel Carbon Content
t/MWh 0.759 0.918 0.873-0.978
CO2 Capture Rate % - 90
CO2 Captured t/MWh - 0.827 0.785-0.880
With respect to the IGCC power plant with pre-combustion CO2 capture, the following can be assumed:
A design representative of an OPTI early commercial power plant entering service into operation in 2020
The use of a conventional cryogenic air separation plant
An entrained pressurised gasifier with full water quench of 1,000 MWt
No Air Side Integration
Two-stage sour CO-Shift
CO2 separation with a physical solvent such as Rectisol or Selexol
The design includes Claus tail gas treatment
Resulting H2 rich syngas is saturated and diluted before combustion
Electrical drive CO2 compressor.

26
The economics of such a power plant are shown in the following table:
Economics
Reference PF Hard Coal without Capture
IGCC – Full Water Quench Design; Sour CO-Shift, H2Syngas Saturation and Dilution
Performance Data
Power plant capacity MWe 736 900
Investment Cost
EPC cost mill € 1,144 1,141-1,152
2,520 2,385-2,700
EPC cost, net €/kW 1,555 1,550-1,565
2,800 2,650-3,000
Owner's Cost (including contingencies) % EPC 10 10
Total investment cost mill € 1,259 1,255-1,267
2,772 2,624-2,970
Fuel cost €/GJ (LHV)
Low Mid High Low Mid High
2.0 2.4 2.9 2.0 2.4 2.9
Operating Cost
Fixed O&M mill €/year 26.2
63 60-68
Variable O&M €/MWh 1 1.8 1.5-2.1
Low Fuel Cost (€2.0/GJ)
Levelised CAPEX €/MWh 19
19.0-19.1 34.3 32.4-36.7
Levelised O&M €/MWh 7.1 13.8
12.8-15.0
Levelised Fuel Cost €/MWh 18.3 22.2
21.1-23.6
Levelised Electricity Cost (LCOE)
€/MWh 44.5 44.4-44.6
70.2 66.3-75.3
CO2 Avoidance Cost €/t CO2 – 38.6
32.5-46.7
Middle Fuel Cost (€2.4/GJ)
Levelised CAPEX €/MWh 19
19.0-19.1 34.3 32.4-36.7
Levelised O&M €/MWh 7.1 13.8
12.8-15.0
Levelised Fuel Cost €/MWh 22.0 26.6
25.3-28.3
Levelised Electricity Cost (LCOE)
€/MWh 48.1 48.1-48.3
74.7 70.5-80.0

27
CO2 Avoidance Cost €/t CO2 – 39.8
33.3-48.3
High Fuel Cost (€2.9/GJ)
Levelised CAPEX €/MWh 19
19.0-19.1 34.3 32.4-36.7
Levelised O&M €/MWh 7.1 13.8
12.8-15.0
Levelised Fuel Cost €/MWh 26.6 32.2
30.6-34.2
Levelised Electricity Cost (LCOE)
€/MWh 52.7 52.7-52.8
80.2 75.8-85.9
CO2 Avoidance Cost €/t CO2 – 41.2
34.4-50.3
The calculated CO2 avoidance costs appear much higher than those published in other studies as the reference power plant in this case is a lower cost PF coal-fired power plant without capture. There is a considerable spread for the costs between the BASE and OPTI cases, which is a reflection of the fact that the IGCC is not a common technology in the electricity sector and power companies are less familiar with these power plants. Compared to the reference PF power plant, the LCOE of an IGCC with CO2 capture is predicted to be 46%-66% more expensive for the middle fuel price. The lower end of the CO2 avoidance cost is similar to that of the PF power plant with post-combustion capture, but the top end is significantly higher. The increase in the fixed and variable O&M costs does take into account both the additional plant and extra chemical and catalyst costs. In summary, Figure 9 identifies the LCOE and CO2 avoidance costs calculated for a hard coal IGCC with pre-combustion capture based on a middle fuel cost of €2.4/GJ:

28
Figure 9: LCOE and CO2 avoidance costs for hard coal-fired IGCC power plants
A key aspect for the demonstration of the next-generation of IGCC power plants with CO2 capture is that these plants achieve high levels of plant availability and operate in base load, operating for 7,500 hours per year, so that costs can remain competitive (Figure 10).
This is particularly important for the pre-combustion case, as the IGCC power plant design is not a common technology within the electrical sector and there are some concerns as to whether these plants can achieve the high plant availability required. The possible impact of a reduction in operating hours on the LCOE and CO2 avoidance costs is shown in the following graph (based on OPTI plant costs).

29
0.0
20.0
40.0
60.0
80.0
100.0
120.0
140.0
Co
st / €
CO2 Avoidance Cost (€/tCO2), reference plant load =
7,500h/yearLCOE with Pre-combustion Capture (€/MWh)
Plant Load Factor (hours/year)
Hard coal IGCC power plants with pre-combustion capture
0.0
20.0
40.0
60.0
80.0
100.0
120.0
140.0
Cos
t / €
CO2 Avoidance Cost (€/tCO2), reference plant load = 7,500h/year
LCOE with Post-Combustion Capture (€/MWh)
Plant Load Factor (hours/year)
Hard coal-fired power plants with post-combustion capture
0.0
20.0
40.0
60.0
80.0
100.0
120.0
140.0
Co
st / €
CO2 Avoidance Cost (€/tCO2), reference plant load = 7,500h/year
LCOE with Oxy-fuel (€/tCO2)
Plant Load Factor (hours/year)
Hard coal-fired power plants with oxy-fuel capture
Figure 10: Dependence on Plant Load Factor for all three coal technologies

30
A reduction from 7,500 hours of operation each year to 6,500 hours results in an increase in the LCOE from €74.7/MWh to €81.7/MWh, equivalent to an increase in the CO2 avoidance cost of €5/tonne.
3.1.3 Hard coal oxy-fueI PF power plant The studies concerning the hard coal PF oxy-fuel power plant are based around a state-of-the-art ultra supercritical steam cycle of 600/620ºC, 280 bar. Oxy-fuel is considered to be the least well-developed of the first-generation capture technologies and for this reason there is considerable variability in the cost estimations. This is due to differing assumptions in the final design configurations, the amount of contingencies considered for the less defined areas and future O&M costs. For this reason, two separate cost studies have been developed:
A conservative approach, which represents a BASE commercial power plant.
An expected OPTI early commercial power plant design that represents a more ambitious design. Due to the more ambitious design of this power plant, the Owner‟s Costs were subsequently increased to 15% to allow for more contingency. It must also be noted that, in this study, this power plant was developed starting from a slightly different reference plant than for the conservative power plant design, hence the CO2 avoidance cost is calculated against this reference power plant.
Consequently, two separate tables of data are presented identifying the parameters of each case:
Parameters – BASE Reference PF Hard Coal without Capture
Base Conservative Hard Coal Oxy-fuel PF Power Plant
Net Electricity Output MWe 736 568
HP Turbine Steam Inlet Pressure
Bara
280 280
HP Turbine Inlet Temperature
ºC 600 600
IP Turbine Inlet Steam Reheat Temperature
ºC 620 620
Net Full Load Plant Efficiency
% LHV 46% 35.4% 35.4-35.5
Plant Load Factor h/year 7,500 7,500
Plant Life Year 40 40
CO2 Emissions Calculated from Fuel Carbon Content
t/MWh 0.759 0.986 0.983-0.986
CO2 Capture Rate % - 90
CO2 Captured t/MWh - 0.887 0.885-0.887
Parameters – OPTI Reference PF Hard Coal without Capture
OPTI Hard Coal Oxy-fuel PF Power Plant
Net Electricity Output MWe 600 480
HP Turbine Steam Inlet Pressure
Bara
280 280
HP Turbine Inlet Temperature ºC 600 600
IP Turbine Inlet Steam Reheat Temperature
ºC 620 620
Net Full Load Plant Efficiency % LHV 46% 36.3% 35.4-37%

31
Plant Load Factor h/year 7,500 7,500
Plant Life Year 40 40
CO2 Emissions Calculated from Fuel Carbon Content
t/MWh 0.759 0.961 0.943-0.986
CO2 Capture Rate % – 90
CO2 Captured t/MWh – 0.865 0.849-0.887
With respect to the design of both hard coal oxy-fuel power plants, the following can be stated:
Both oxy-fuel power plants employ cryogenic air separation plants
Both plants have flue gas recirculation and can operate in either oxy-fuel or air firing conditions
Both power plants contemplate a full-scale flue gas desulphurisation (FGD) plant. In some OPTI power plant concepts, sulphur is separated during the CO2 liquefaction process that could result in additional minor cost and net-efficiency benefits.
The principal additional energy requirements leading to a 9%-11% real drop in the power plant efficiency when referenced to power plant without capture are related to:
- Cryogenic air separation processes - Recycle fan - CO2 compression.
The determination of the energy requirement for the cryogenic air separation process is a subject under considerable discussion, as some manufacturers claim that improvements can easily be achieved that will result in a higher overall plant efficiency. However, the cost data for such concepts were not available for this study.
The economics of the BASE and OPTI plants are shown in the following two tables:
Economics
Reference PF Hard Coal without Capture
BASE Conservative Hard Coal Oxy-fuel PF Power Plant
Performance Data
Power plant capacity MWe 736 568
Investment Cost
EPC cost mill € 1,150 1,889 1,770-2,096
EPC cost, net €/kW 1,562.5 3,325 3,116-3,691
Owner's Cost (including contingencies) % EPC 10 10
Total investment cost mill € 1,265 2,077 1,947-2,306
Fuel cost €/GJ (LHV)
Low Mid High Low Mid High
2.0 2.4 2.9 2.0 2.4 2.9

32
Operating Cost
Fixed O&M mill €/year 26.2 31.8 26.1-37.5
Variable O&M €/MWh 1 1.55 1.4-1.7
Low Fuel Cost (€2.0/GJ)
Levelised CAPEX €/MWh 19.1
19.0-19.1 40.7 38.1-45.2
Levelised O&M €/MWh 7.1 11.2
9.3-13.0
Levelised Fuel Cost €/MWh 18.3 23.8
23.7-23.8
Levelised Electricity Cost (LCOE)
€/MWh 44.6 44.4-44.6
71.3-81.9
CO2 Avoidance Cost €/t CO2 – 40.5-56.6
Middle Fuel Cost (€2.4/GJ)
Levelised CAPEX €/MWh 19
19.0-19.1 40.7 38.1-45.2
Levelised O&M €/MWh 7.1 11.2
9.3-13.0
Levelised Fuel Cost €/MWh 22.0 28.6
28.5-28.6
Levelised Electricity Cost (LCOE)
€/MWh 48.2 48.1-48.3
76.0-86.7
CO2 Avoidance Cost €/t CO2 – 42.1-58.2
High Fuel Cost (€2.9/GJ)
Levelised CAPEX €/MWh 19
19.0-19.1 40.7 38.1-45.2
Levelised O&M €/MWh 7.1 11.2
9.3-13.0
Levelised Fuel Cost €/MWh 26.6 34.5
34.4-34.5
Levelised Electricity Cost (LCOE)
€/MWh 52.8 52.7-52.8
82.0-92.6
CO2 Avoidance Cost €/t CO2 – 44.2-60.2

33
Economics
Reference PF Hard Coal without Capture
OPTI Hard Coal Oxy-fuel PF Power Plant
Performance Data
Power plant capacity MWe 600 480
Investment Cost
EPC cost mill € 729 1,056 989-1,132
EPC cost, net €/kW 1,215.2 2,200 2,060-2,359
Owner's Cost (including contingencies) % EPC 15 15
Total investment cost mill € 839 1,214 1,137-1,302
Fuel cost €/GJ (LHV)
Low Mid High Low Mid High
2.0 2.4 2.9 2.0 2.4 2.9
Operating Cost
Fixed O&M mill €/year 15.3 23.0 22.1-24.0
Variable O&M €/MWh 1.1 1.55 1.4-1.7
Low Fuel Cost (€2.0/GJ)
Levelised CAPEX €/MWh 15.5 28.1
26.3-30.2
Levelised O&M €/MWh 5.2 9.9
9.3-10.4
Levelised Fuel Cost €/MWh 18.3 23.2
22.8-23.8
Levelised Electricity Cost (LCOE)
€/MWh 39.1 58.5-64.3
CO2 Avoidance Cost €/t CO2 – 28.5-37.6
Middle Fuel Cost (€2.4/GJ)
Levelised CAPEX €/MWh 15.5 28.1
26.3-30.2
Levelised O&M €/MWh 5.2 9.9
9.3-10.4
Levelised Fuel Cost €/MWh 22.0 27.9
27.3-28.6
Levelised Electricity Cost (LCOE)
€/MWh 42.8 63.0-69.1
CO2 Avoidance Cost €/t CO2 – 29.9-39.3

34
High Fuel Cost (€2.9/GJ)
Levelised CAPEX €/MWh 15.5 28.1
26.3-30.2
Levelised O&M €/MWh 5.2 9.9
9.3-10.4
Levelised Fuel Cost €/MWh 26.6 33.7
33.0-34.5
Levelised Electricity Cost (LCOE)
€/MWh 47.4 68.7-75.1
CO2 Avoidance Cost €/t CO2 – 31.6-41.4
The differences in capital costs within each band of the BASE and OPTI plant designs are in the range of 14%-18%, which are probably due to the difference in the costs assumed for the air separation plant and the CO2 purification and compression islands. For the purposes of this study, and in order to be consistent with the approach adopted for the other technologies, the values for oxy-fuel for the BASE and OPTI cases used in the comparative graphs are identified in bold text. However, in both cases, the efficiency penalties with respect to the reference plants are similar, being between 9 and 10.5 points, probably due to the fact that both specify a cryogenic air separation plant. There was also a considerable spread in fixed O&M costs, ranging from €46 to €66/KWnet per year in the BASE plant design, again attributable to uncertainties in the process and differing assumptions in the maintenance requirements of the air separation plant and CO2 purification and compression islands. However, the variable O&M costs are similar to those of the reference power plants without capture, mainly due to the fact that oxy-fuel technology does not require additional chemicals and cooling water etc. In summary, Figures 11 and 12 identify the LCOE and CO2 avoidance costs considered for the BASE and OPTI hard-coal PF oxy-fired power plant, based on the middle fuel cost of €2.4/GJ.

35
Figure 11: LCOE and CO2 avoidance costs for BASE hard coal-fired power plants with oxy-fuel capture
Figure 12: LCOE and CO2 avoidance costs for OPTI hard coal-fired power plants with oxy-fuel capture

36
The impact of varying fuel costs for the three capture technologies for hard coal simply displaces the graphs in a vertical direction (Figure 13). The steeper dependence on fuel costs of the oxy-fuel power plant with respect to the other two capture technologies is, in general, due to the lower plant efficiency identified for this power plant concept. These graphs are based on OPTI power plant costs.
0.0
20.0
40.0
60.0
80.0
100.0
120.0
1.8 2 2.2 2.4 2.6 2.8 3 3.2 3.4 3.6
Cos
t / €
CO2 Avoidance Cost (€/tCO2)
LCOE Reference Plant (€/MWh)
LCOE with Oxy-fuel Capture (€/MWh)
Fuel price (€/GJ)
Hard coal-fired power plants with oxy-fuel capture
Hard coal-fired power plants with post-combustion capture
Hard coal IGCC power plants with pre-combustion capture
Figure 13: Dependence on the coal price for all three capture technologies

37
3.2 Lignite
The LCOE and CO2 avoidance costs have been calculated for the following early commercial CO2 capture technologies that could enter into operation in the early 2020s:
BASE lignite-fired PF ultra supercritical (280 bar 600/620ºC steam cycle) power plant with post-combustion capture based on advanced amines
BASE lignite-fired oxygen blown IGCC with full quench design, sour shift and CO2 capture with F-class Gas Turbine (diffusion burners with syngas saturation and dilution, and lignite pre-dryer).
OPTI lignite oxy-fuel PF power plant with ultra supercritical steam conditions (280 bar 600/620ºC steam cycle) and lignite pre-dryer.
As previously stated, power plant costs are referenced to the second quarter of 2009 and the lignite fuel price is €1.39/GJ. The following costs have been determined for each of the cases studied:
Levelised Electricity Costs (LCOE) €/MWh
CO2 Avoidance Cost €/t CO2
Reference Case – No Capture
State-of-the-art 43.7 –
Lignite PF Post- Combustion Capture
BASE Early Commercial
75.2 38.9
OPTI Early Commercial
Lignite IGCC with Pre-Combustion Capture
(Reference) BASE Early Commercial
(45.5) 67.4
29.9
OPTI Early Commercial
Lignite PF Oxy-fuel Capture
BASE Early Commercial
(Ref Plant) OPTI Early Commercial
(35.6) 49.5
19.3
Figures 14 and 15 show the data from the above table:

38
Figure 14: LCOE for lignite-fired power plants with CO2 capture
Figure 15: CO2 avoidance costs for lignite-fired power plants with CO2 capture
From this sparse dataset, it is not credible to draw any conclusions. Comparing the two BASE plant options, the indication is that the IGCC power plant with capture is significantly more economical than the post-combustion option. However, it must be taken into consideration that the post-combustion option is the only case where pre-drying of the lignite is not included in both the reference and capture plant. However, the results do suggest the need for further studies on lignite-fired power plants and the need to demonstrate such plants as they could prove to be competitive. In the following sub-sections, details are given of each of the three concepts studied:
3.2.1 Lignite-fired PF coal-fired power plant with post-combustion capture As with the hard coal case, a CO2 capture plant and a compression island were integrated into the reference lignite-fired PF coal power plant. The post-combustion capture plant is again based on an advanced amine.

39
As with the hard coal power plant case, the addition of the capture plant and compression island caused the net efficiency and power output to drop, as shown in the following table:
Parameters Reference PF Lignite without Capture
PF Lignite with Post- Combustion Capture
Net Electricity Output MWe 989 759
HP Turbine Steam Inlet Pressure
Bara
280 280
HP Turbine Inlet Temperature ºC 600 600
IP Turbine Inlet Steam Reheat Temperature
ºC 620 620
Net Full Load Plant Efficiency % LHV 43% 33%
Plant Load Factor h/year 7,500 7,500
Plant Life Year 40 40
CO2 Emissions Calculated from Fuel Carbon Content
t/MWh 0.930 1.212
CO2 Capture Rate % – 90
CO2 Captured t/MWh – 1.091
The lignite PF power plant with post-combustion capture has the following characteristics:
A design representative of a BASE early commercial power plant entering into operation around 2020, with the capture plant employing a commercially available advanced amine.
Neither the reference power plant nor the power plant with capture include pre-drying of the lignite.
The capture power plant consists of four CO2 capture trains mounted in parallel and a six-train CO2 compression plant.
Heat integration is included in the power plant design with capture.
The steam turbine design has not been modified to reflect large steam extraction for the capture power plant. Steam extraction for an overflow line is considered, employing a valve to hold pressure during part load operation.
The main additional energy requirements leading to a 10% real drop in the power plant efficiency are identified as: - The steam extraction taken from between the IP and LP turbine for the reboiler of the capture
power plant - CO2 compressor electrical drive - Additional Induced Draft (ID) fan.
The power plant cost for the lignite power plant with capture can therefore be considered to be very conservative, being representative of a BASE early commercial power plant. The economics are shown in the following table:

40
Economics
Reference PF Lignite without Capture
PF Lignite with Post- Combustion Capture
Performance Data
Power plant capacity MWe 989 759
Investment Cost
EPC cost mill € 1,680 2,360
EPC cost, net €/kW 1,699 3,109
Owner's Cost (including contingencies) % EPC 20 20
Total investment cost mill € 2,016 2,832
Fuel cost €/GJ (LHV) 1.39 1.39
Operating Cost
Fixed O&M mill €/year 37.2 51.6
Variable O&M €/MWh 1 3.8
Levelised CAPEX €/MWh 22.7 41.5
Levelised O&M €/MWh 7.4 15.9
Levelised Fuel Cost €/MWh 13.6 17.8
Levelised Electricity Cost (LCOE)
€/MWh 43.7 75.2
CO2 Avoidance Cost €/t CO2 – 38.9
It must be remembered that the lignite power plant with capture is a BASE power plant design which does not include pre-drying of the lignite. As the reference power plant without capture also does not include pre-drying, this variable is not included in the economics. A reduction in costs would be expected with the incorporation of pre-drying and modification to the steam turbine. The fixed and variable O&M costs for a lignite-fired post-combustion capture power plant increase in a similar way to those of a hard coal-fired power plant with capture, as would be expected. The increase of 39% in fixed O&M costs takes into account the maintenance of the capture plant as well as the additional labour costs. These costs would be expected to reduce as the capture plants become a standard part of the power plant. With respect to the variable O&M costs, they more than triple for the reference power plant without capture due to the additional chemical costs, cooling water fees and waste disposal costs. As with the hard coal case, future solvent costs and quality of waste materials are currently “unknowns”, resulting in an uncertainty in this cost. Figure 16 identifies the LCOE and CO2 avoidance costs for a BASE lignite PF power plant with post-combustion capture:

41
Figure 16: LCOE and CO2 avoidance costs for lignite-fired power plants with post-combustion capture
3.2.2 Lignite IGCC with pre-combustion capture As with the hard coal case, the reference power plant selected for this case was a state-of-the-art PF coal-fired power plant. The design parameters of the lignite IGCC power plant with capture and the reference power plant are shown in the following table:
Parameters Reference PF Lignite without Capture
IGCC – Full Water Quench Design; Sour CO-Shift, H2Syngas Saturation and Dilution
Net Electricity Output MWe 1100 900
Net Full Load Plant Efficiency % LHV 48% 40%
Plant Load Factor h/year 7,500 7,500
Plant Life Year 40 40
CO2 Emissions Calculated from Fuel Carbon Content
t/MWh 0.833 1,000
CO2 Capture Rate % – 90
CO2 Captured t/MWh – 0.900
With respect to the design of the IGCC power plant with pre-combustion CO2 capture, the following can be assumed:
A design representative of a BASE early commercial power plant entering into operation in 2020
The use of a conventional cryogenic air separation plant
Pre-drying of the lignite fuel (the same as the reference PF power plant)
An entrained pressurised gasifier with full water quench of 1,000 MWt
No Air Side Integration
Two-stage sour CO-Shift
CO2 separation with a physical solvent such as Rectisol or Selexol
Claus tail gas treatment is included
Resulting H2 rich syngas is saturated and diluted before combustion
CO2 compressor electrical drive.

42
The economics are shown in the following table:
Economics
Reference PF Lignite without Capture
IGCC – Full Water Quench Design; Sour CO-Shift, H2Syngas Saturation and Dilution
Performance Data
Power plant capacity MWe 1,100 900
Investment Cost
EPC cost mill € 2,017 2,620
EPC cost, net €/kW 1,834 2,911
Owner's Cost (including contingencies) % EPC 20 20
Total investment cost mill € 2,420 3,144
Fuel cost €/GJ (LHV) 1.39 1.39
Operating Cost
Fixed O&M mill €/year 50.4 65.5
Variable O&M €/MWh 1 1.5
Levelised CAPEX €/MWh 24.5 38.8
Levelised O&M €/MWh 8.8 13.9
Levelised Fuel Cost €/MWh 12.2 14.6
Levelised Electricity Cost (LCOE)
€/MWh 45.5 67.4
CO2 Avoidance Cost €/t CO2 – 29.9
As with the hard coal case, the calculated CO2 avoidance cost is referenced to a PF coal-fired power plant and not an IGCC without capture. This figure can therefore appear higher than those published in other studies. The LCOE obtained for the lignite-fired IGCC power plant with pre-combustion capture is considerably lower than that for the post-combustion capture option. However, unlike the post-combustion power plant, pre-drying of the lignite is included in both the reference plant and the plant with capture. The lignite IGCC power plant is considered to be a BASE early commercial power plant, although its design may be considered to be slightly more ambitious than the post-combustion plant. Compared to the reference PF power plant, the LCOE of the lignite IGCC with CO2 capture is predicted to be
~48% more expensive than the lignite PF ultra supercritical power plant without capture. In summary, Figure 17 identifies the LCOE and CO2 avoidance costs for a BASE lignite-fired IGCC with pre-combustion capture and pre-drying of the lignite:
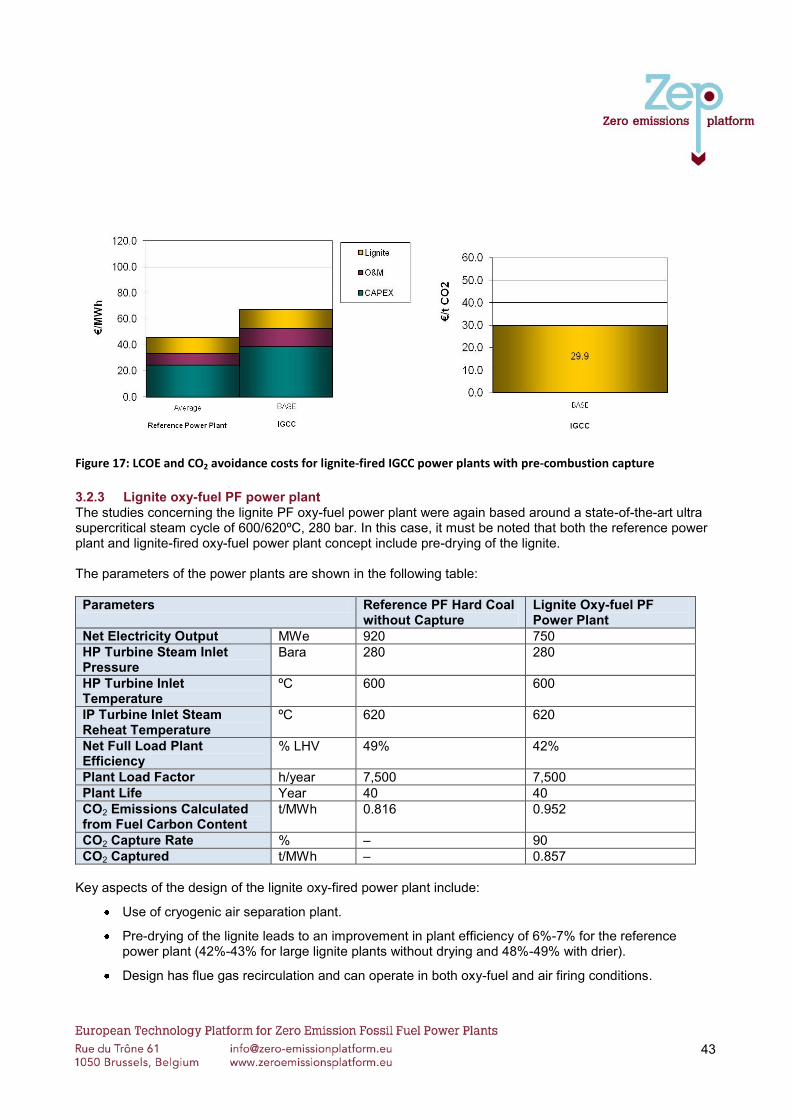
43
Figure 17: LCOE and CO2 avoidance costs for lignite-fired IGCC power plants with pre-combustion capture
3.2.3 Lignite oxy-fueI PF power plant The studies concerning the lignite PF oxy-fuel power plant were again based around a state-of-the-art ultra supercritical steam cycle of 600/620ºC, 280 bar. In this case, it must be noted that both the reference power plant and lignite-fired oxy-fuel power plant concept include pre-drying of the lignite. The parameters of the power plants are shown in the following table:
Parameters Reference PF Hard Coal without Capture
Lignite Oxy-fuel PF Power Plant
Net Electricity Output MWe 920 750
HP Turbine Steam Inlet Pressure
Bara
280 280
HP Turbine Inlet Temperature
ºC 600 600
IP Turbine Inlet Steam Reheat Temperature
ºC 620 620
Net Full Load Plant Efficiency
% LHV 49% 42%
Plant Load Factor h/year 7,500 7,500
Plant Life Year 40 40
CO2 Emissions Calculated from Fuel Carbon Content
t/MWh 0.816 0.952
CO2 Capture Rate % – 90
CO2 Captured t/MWh – 0.857
Key aspects of the design of the lignite oxy-fired power plant include:
Use of cryogenic air separation plant.
Pre-drying of the lignite leads to an improvement in plant efficiency of 6%-7% for the reference power plant (42%-43% for large lignite plants without drying and 48%-49% with drier).
Design has flue gas recirculation and can operate in both oxy-fuel and air firing conditions.

44
The sulphur is separated in an FGD plant.
The principal additional energy requirements that result in a 7% real drop in the power plant efficiency when referenced to power plant without capture are due to: - Cryogenic air separation processes - Recycle fan - CO2 compression.
This design is considered to be representative of an OPTI early commercial power plant and the economics are as follows:
Economics
Reference PF Lignite without Capture
Lignite Oxy-fuel PF Power Plant
Performance Data
Power plant capacity MWe 920 750
Investment Cost
EPC cost mill € 1,167 1,488
EPC cost, net €/kW 1,268 1,983
Owner's Cost (including contingencies) % EPC 20 20
Total investment cost mill € 1,400 1,785
Fuel cost €/GJ (LHV) 1.39 1.39
Operating Cost
Fixed O&M mill €/year 30 33.7
Variable O&M €/MWh 1.09 1.36
Levelised CAPEX €/MWh 16.9 26.5
Levelised O&M €/MWh 6.7 9.1
Levelised Fuel Cost €/MWh 12.0 13.9
Levelised Electricity Cost (LCOE)
€/MWh 35.6 49.5
CO2 Avoidance Cost €/t CO2 – 19.3
N.B. The supplier of the data accepts that the values are ambitious and on the low side, which impacts on the LCOE and raises the question whether this can be compared directly with other LCOE results in this study. However, this impact is somewhat negated for the CO2 avoidance costs, as the basis for both the reference plant and the OPTI plant are the same. In this study, the inclusion of oxy-fuel technology increases the levelised specific investment by €770/KWnet from that of the reference power plant, mainly due to the addition of the cryogenic ASU and the CO2 compression and conditioning equipment. The fixed O&M costs increase from €32.6 to €44.9/KWnet per year, which is attributable to the additional plant components. However, as with the hard coal oxy-fuel, the variable O&M costs do not increase significantly over those of the reference plant, as oxy-fuel technology does not require additional chemicals and cooling water etc. In summary, Figure 18 identifies the LCOE and CO2 avoidance costs for an OPTI lignite PF oxy-fired power plant.

45
Figure 18: LCOE and CO2 avoidance costs for lignite-fired power plants with oxy-fuel capture
3.3 Natural gas
The LCOE and CO2 avoidance costs have been calculated for the following early commercial CO2 capture technologies that would enter into operation in the early 2020s:
Natural gas-fired single-shaft F-class CCGT with post-combustion capture, based on an advanced amine.
As the costs for natural gas have an important impact on the final calculated costs for this plant, the following three fuel prices have been considered. The wide range selected demonstrates the future uncertainty in the natural gas fuel price and the possible impact of shale gas on future prices.
Fuel Costs Low Middle High
Natural Gas – €/GJ 4.5 8.0 11.0
The results obtained are shown in the following table:
Levelised Electricity Costs (LCOE) €/MWh
CO2 Avoidance Cost €/t CO2
Low Fuel Cost €4.5/GJ
BASE Reference Case – No Capture
State-of-the-art 47.2 -
Natural Gas CCGT Post-Combustion Capture
BASE Early Commercial
73.7 91.8
OPTI Reference Case – No Capture
State-of-the-art 45.5
Natural Gas CCGT Post-Combustion Capture
OPTI Early Commercial 64.0 65.9
Middle Fuel Cost €8.0/GJ
BASE Reference Case – No Capture
State-of-the-art 71.9 –

46
As stated previously, the above table demonstrates that LCOE and capture costs for natural gas-fired CCGT plants with capture are heavily influenced by the fuel and CO2 capture costs. Figures 19 and 20 display the results for the middle gas price of €8/GJ:
Figure 19: LCOE for natural gas-fired power plants with CO2 capture
Natural Gas CCGT Post-Combustion Capture
BASE Early Commercial
103.5 109.7
OPTI Reference Case – No Capture
State-of-the-art 69.3
Natural Gas CCGT Post-Combustion Capture
OPTI Early Commercial 91.5 79.0
High Fuel Cost €11.0/GJ
BASE Reference Case – No Capture
State-of-the-art 93.0 –
Natural Gas CCGT Post-Combustion Capture
BASE Early Commercial
129.0 125.0
OPTI Reference Case – No Capture
State-of-the-art 89.7
Natural Gas CCGT Post-Combustion Capture
OPTI Early Commercial 115.1 90.2
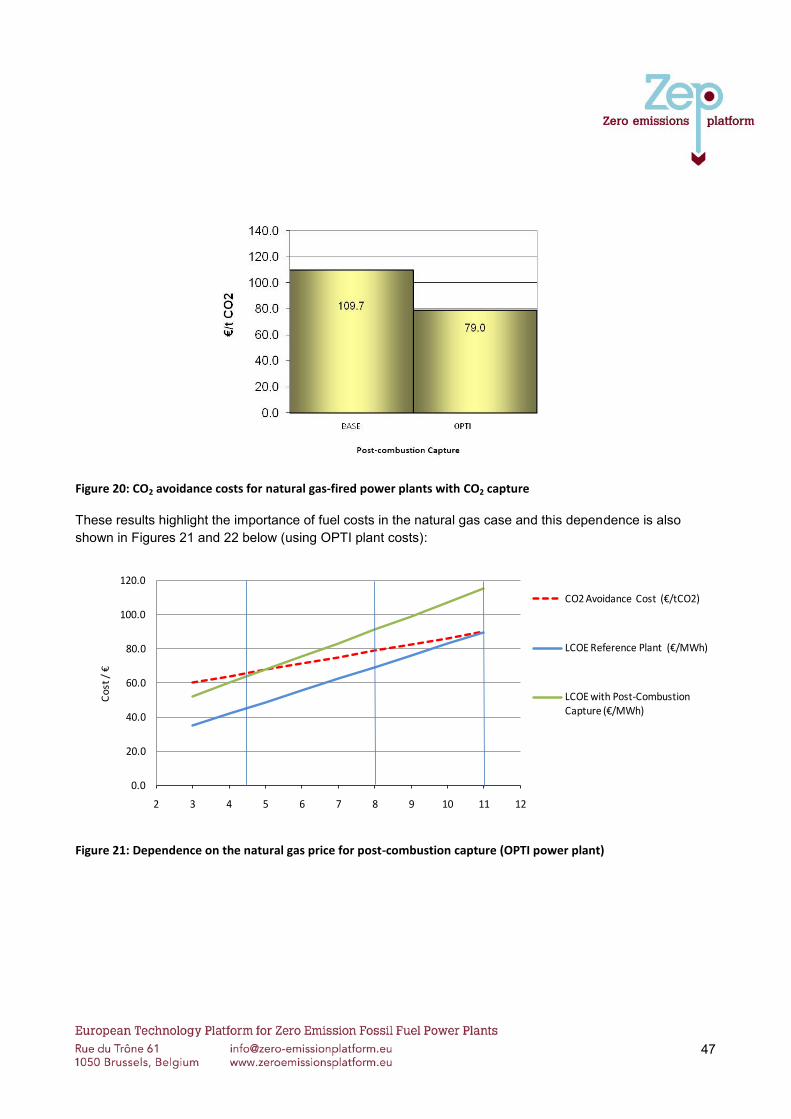
47
Figure 20: CO2 avoidance costs for natural gas-fired power plants with CO2 capture
These results highlight the importance of fuel costs in the natural gas case and this dependence is also
shown in Figures 21 and 22 below (using OPTI plant costs):
0.0
20.0
40.0
60.0
80.0
100.0
120.0
2 3 4 5 6 7 8 9 10 11 12
Co
st /
€
CO2 Avoidance Cost (€/tCO2)
LCOE Reference Plant (€/MWh)
LCOE with Post-Combustion Capture (€/MWh)
Figure 21: Dependence on the natural gas price for post-combustion capture (OPTI power plant)

48
0.0
20.0
40.0
60.0
80.0
100.0
120.0
1.8 2.0 2.2 2.4 2.6 2.8 3.0 3.2 3.4 3.6
Co
st /
€
CO2 Avoidance Cost (€/tCO2)
LCOE Reference Plant (€/MWh)
LCOE with Post-combustion Capture (€/MWh)
Fuel price (€/GJ)
Figure 22: Dependence on the coal price for post-combustion capture (OPTI power plant)
Predicting future natural gas prices for Europe is not an exact science, as the predicted future impact of shale gas on natural gas prices varies from one source to the other. When comparing published CO2 capture costs, it is therefore critical that the fuel cost used in the calculation is taken into consideration. The CO2 avoidance cost for natural gas-fired power plants is higher than for coal-fired power plants due to the fact that they are lower capital cost power plants. The fact that the CO2 is more diluted in the flue gas (3%-5% instead of 12%-15%) does not improve the situation as a larger quantity of flue gas has to be treated for a given volume of CO2 in the CCGT option. The plants analysed do not include new future options such as flue gas recirculation, or different capture options which seem to be required to drive down future CO2 capture costs.
3.3.1 Natural gas combined cycle with post-combustion capture Two separate cases have been studied for the natural gas-fired CCGT with post-combustion capture. The first addressed the addition and integration of a CO2 capture plant and compression island to a current state-of-the-art 2009 F-class single-shaft 50Hz CCGT producing 420 MWe at an efficiency of 58% (LHV) (which is the reference case without capture and compression). Very little integration is foreseen in this design and the power plant concept is for a BASE early commercial capture power plant.
The design details are given in the following table:
Parameters
Single-shaft F-class CCGT
Single-shaft F-class CCGT with Post-Combustion: Advanced Amine
Net Electricity Output MWe 420 350
HP Turbine Steam Inlet Pressure
Bara
113.8/27.7/3.99 113.8/27.7/3.99
HP Turbine Inlet Temperature ºC 549 549
IP Turbine Inlet Steam Reheat Temperature
ºC 549 549
Net Full Load Plant Efficiency % LHV 58% 48%
Plant Load Factor h/year 7,500 7,500

49
Plant Life Year 25 25
CO2 Emissions Calculated from Fuel Carbon Content
t/MWh 0.347 0.419
CO2 Capture Rate % – 86
CO2 Captured t/MWh – 0.360
This study assumes a 10% real drop in plant efficiency owing to additional steam/electricity consumption required due to the installation of a larger flue gas fan, the compression of the CO2 and the energy required by the stripper to separate the CO2 from solvent. In this design for the power plant with capture, the steam turbine is assumed to maintain its efficiency, despite the extraction of steam for stripper operations. The second case is an OPTI power plant, where the CO2 capture plant and compression island is integrated into a more efficient CCGT power plant, with an efficiency of 60% (LHV) in combined cycle without the capture plant and compression island. In this concept, the drop in plant efficiency has been calculated to be eight percentage points. The following table shows the design details of the OPTI power plant:
Parameters
Advanced Single-shaft CCGT
Advanced Single-shaft CCGT with Post- Combustion: Advanced Amine
Net Electricity Output MWe 420 364
HP Turbine Steam Inlet Pressure
Bara
113.8/27.7/3.99 113.8/27.7/3.99
HP Turbine Inlet Temperature ºC 549 549
IP Turbine Inlet Steam Reheat Temperature
ºC 549 549
Net Full Load Plant Efficiency % LHV 60% 52%
Plant Load Factor h/year 7,500 7,500
Plant Life Year 25 25
CO2 Emissions Calculated from Fuel Carbon Content
t/MWh 0.335 0.387
CO2 Capture Rate % - 86
CO2 Captured t/MWh - 0.332
The economics of the reference and capture case for the BASE plant are shown in the following table:
Economics
Single-shaft F-class CCGT
Single-shaft F-class CCGT with Post- Combustion: Advanced Amine
Performance Data
Power plant capacity MWe 420 350
Investment Cost
EPC cost mill € 300 582
EPC cost, net €/kW 714 1,662
Owner's Cost (including contingencies) % EPC 10 10
Total investment cost mill € 330 640
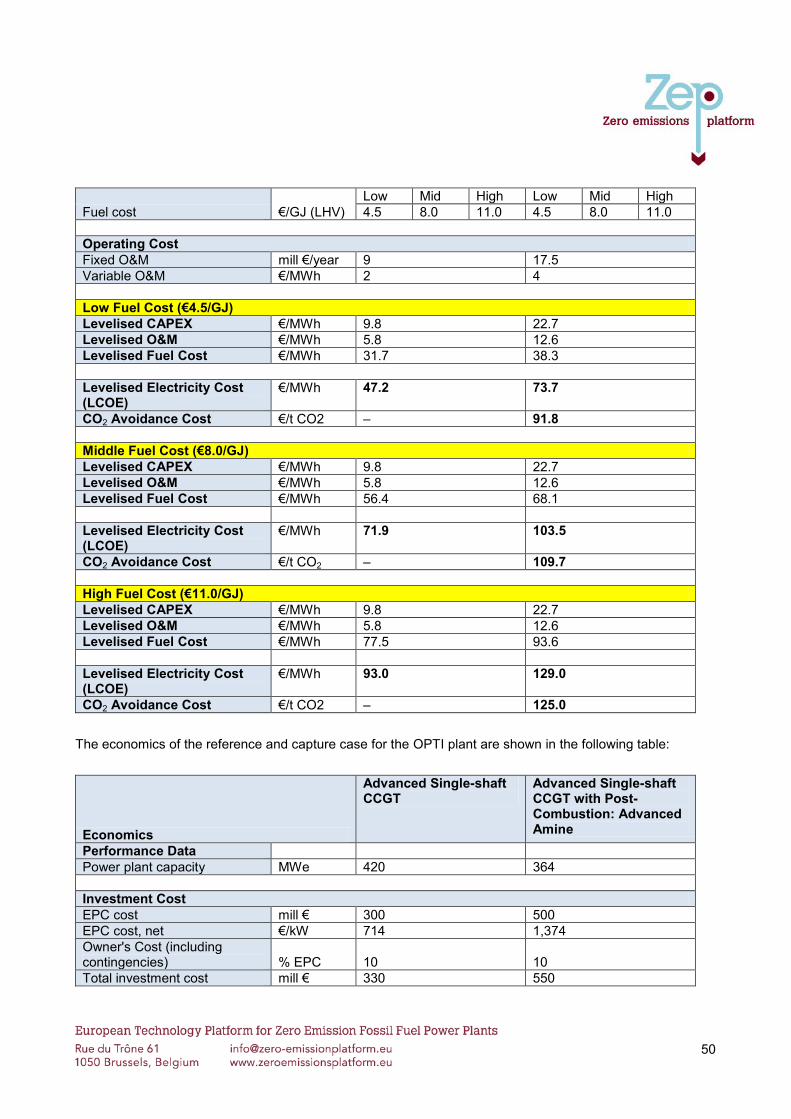
50
Fuel cost €/GJ (LHV)
Low Mid High Low Mid High
4.5 8.0 11.0 4.5 8.0 11.0
Operating Cost
Fixed O&M mill €/year 9 17.5
Variable O&M €/MWh 2 4
Low Fuel Cost (€4.5/GJ)
Levelised CAPEX €/MWh 9.8 22.7
Levelised O&M €/MWh 5.8 12.6
Levelised Fuel Cost €/MWh 31.7 38.3
Levelised Electricity Cost (LCOE)
€/MWh 47.2
73.7
CO2 Avoidance Cost €/t CO2 – 91.8
Middle Fuel Cost (€8.0/GJ)
Levelised CAPEX €/MWh 9.8 22.7
Levelised O&M €/MWh 5.8 12.6
Levelised Fuel Cost €/MWh 56.4 68.1
Levelised Electricity Cost (LCOE)
€/MWh 71.9 103.5
CO2 Avoidance Cost €/t CO2 – 109.7
High Fuel Cost (€11.0/GJ)
Levelised CAPEX €/MWh 9.8 22.7
Levelised O&M €/MWh 5.8 12.6
Levelised Fuel Cost €/MWh 77.5 93.6
Levelised Electricity Cost (LCOE)
€/MWh 93.0 129.0
CO2 Avoidance Cost €/t CO2 – 125.0
The economics of the reference and capture case for the OPTI plant are shown in the following table:
Economics
Advanced Single-shaft CCGT
Advanced Single-shaft CCGT with Post-Combustion: Advanced Amine
Performance Data
Power plant capacity MWe 420 364
Investment Cost
EPC cost mill € 300 500
EPC cost, net €/kW 714 1,374
Owner's Cost (including contingencies) % EPC 10 10
Total investment cost mill € 330 550

51
Fuel cost €/GJ (LHV)
Low Mid High Low Mid High
4.5 8.0 11.0 4.5 8.0 11.0
Operating Cost
Fixed O&M mill €/year 9 15.0
Variable O&M €/MWh 1.4 2.8
Low Fuel Cost (€4.5/GJ)
Levelised CAPEX €/MWh 9.8 18.8
Levelised O&M €/MWh 5.1 9.8
Levelised Fuel Cost €/MWh 30.6 35.4
Levelised Electricity Cost (LCOE)
€/MWh 45.5
64.0
CO2 Avoidance Cost €/t CO2 – 65.9
Middle Fuel Cost (€8.0/GJ)
Levelised CAPEX €/MWh 9.8 18.8
Levelised O&M €/MWh 5.1 9.8
Levelised Fuel Cost €/MWh 54.5 62.9
Levelised Electricity Cost (LCOE)
€/MWh 69.3 91.5
CO2 Avoidance Cost €/t CO2 – 79.0
High Fuel Cost (€11.0/GJ)
Levelised CAPEX €/MWh 9.8 18.8
Levelised O&M €/MWh 5.1 9.8
Levelised Fuel Cost €/MWh 74.9 86.4
Levelised Electricity Cost (LCOE)
€/MWh 89.7 115.1
CO2 Avoidance Cost €/t CO2 – 90.2
As with the other post-combustion studies for other fuels, there is a considerable increase in the fixed and variable O&M costs, due to similar reasons. The doubling of the fixed O&M costs takes into account the maintenance of the capture plant as well as the additional labour costs. As the capture plant becomes more standard, the fixed O&M costs are expected to reduce, which is reflected in the OPTI power plant. With respect to the variable O&M costs, they are foreseen to double, which is attributable to the additional chemical costs, cooling water fee and waste disposal costs. As with the other studies, there is considerable uncertainty regarding the future evolution of solvent and waste disposal costs, resulting in a considerable uncertainty in the variable O&M costs, although they are foreseen to drop in the OPTI power plant. In summary, Figure 23 identifies the LCOE and CO2 avoidance costs calculated for the natural gas-fired CCGT power plant with post-combustion capture, based on the medium fuel price of €8/GJ:

52
Figure 23: LCOE and CO2 avoidance costs for natural gas-fired CC power plants with post-combustion capture

53
4 Comparison of ZEP Cost Estimates with Other Studies Comparing ZEP cost estimates with those of other recently published reports is not straightforward as the boundary conditions are frequently different (see Figure 24 and Chapter 2 for those applied in this study).
Figure 24: Financial and other boundary conditions used in this study
Differences in assumptions may include:
Size of power plant
Location of power plant
Whether the costs refer to a BASE, OPTI, first-of-a-kind, or nth-of-a-kind power plants that have
assumed some future cost reduction
Assumptions made on the level of plant integration between capture, compression and plant design
CO2 export conditions
The year in which the study is referenced.
These can have a significant impact on the results, even though the fundamental data are similar. Without knowledge of the boundary conditions employed in other studies, cost comparisons are meaningless. Recent studies carried out by the Global CCS Institute (GCCSI) and Harvard Kennedy School have tried to correlate previously published studies by levelising the costs to their particular boundary conditions in order to compare results. This report has taken a similar approach by extracting the maximum amount of technical and economic data possible from other studies, adjusting it to the second quarter of 2009 (with the cost correction curve shown on page 14) and recalculating the costs using the boundary conditions established in this study for the middle fuel costs. Cost studies whose results have been analysed include:
DECC Mott MacDonald: “UK Electricity Generation Costs Update”, June 2010
Lignite plant
Reference year of study year
Economic lifetime years 40 Depreciation years 40 Fuel price EUR/GJ (LHV) 2 2.4 2.9 4.5 8 11 1.39 Fuel price escalation % per year 1.5% Operating hours per year hours per year 7,500
Standard Emission factor t/MWh th 0.402
Common Inputs
O&M cost escalation
Debt/Equity ratio % Loan interest rate % Interest during construction % Return on Equity % Start of debt service
Tax rate % WACC
Discount rate %
Natural gas plant
0.344
Second quarter 2009
Hard coal plant
8%
9%
25
25
1.5%
7,500
0.210
6%
12%
Commercial operation
35%
2%
50%
6%
40
40
1.5%
7,500
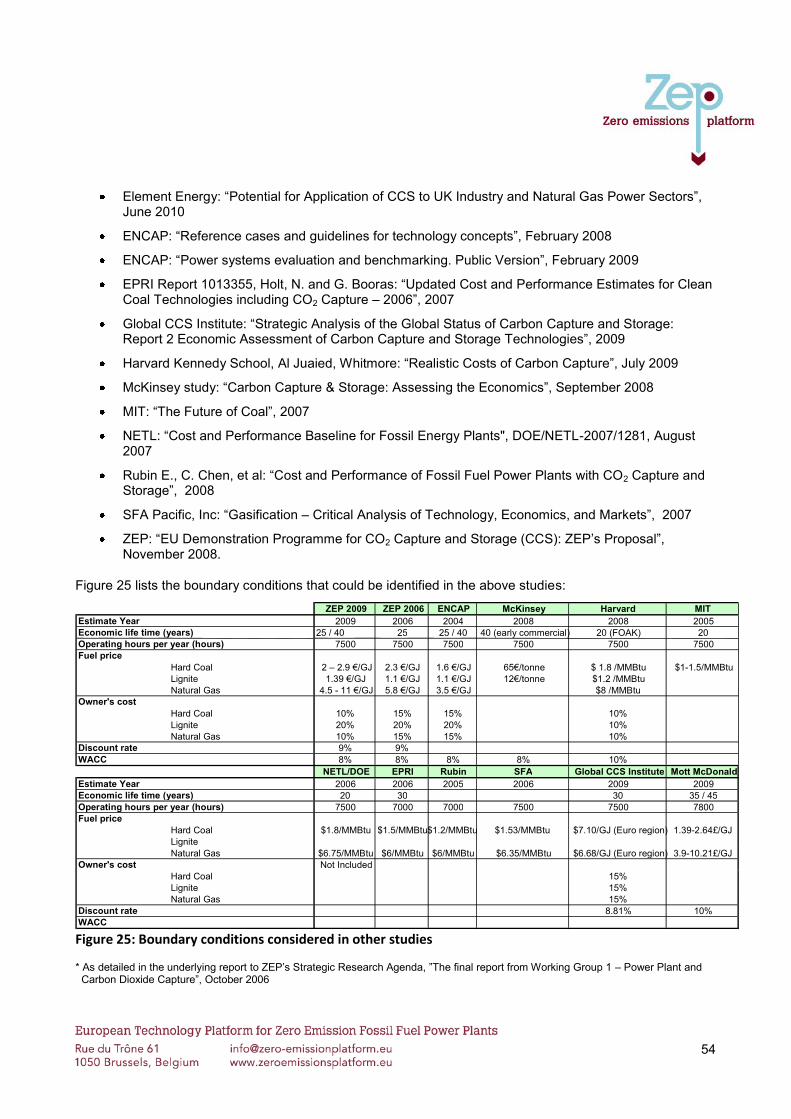
54
Element Energy: “Potential for Application of CCS to UK Industry and Natural Gas Power Sectors”, June 2010
ENCAP: “Reference cases and guidelines for technology concepts”, February 2008
ENCAP: “Power systems evaluation and benchmarking. Public Version”, February 2009
EPRI Report 1013355, Holt, N. and G. Booras: “Updated Cost and Performance Estimates for Clean Coal Technologies including CO2 Capture – 2006”, 2007
Global CCS Institute: “Strategic Analysis of the Global Status of Carbon Capture and Storage: Report 2 Economic Assessment of Carbon Capture and Storage Technologies”, 2009
Harvard Kennedy School, Al Juaied, Whitmore: “Realistic Costs of Carbon Capture”, July 2009
McKinsey study: “Carbon Capture & Storage: Assessing the Economics”, September 2008
MIT: “The Future of Coal”, 2007
NETL: “Cost and Performance Baseline for Fossil Energy Plants", DOE/NETL-2007/1281, August 2007
Rubin E., C. Chen, et al: “Cost and Performance of Fossil Fuel Power Plants with CO2 Capture and Storage”, 2008
SFA Pacific, Inc: “Gasification – Critical Analysis of Technology, Economics, and Markets”, 2007
ZEP: “EU Demonstration Programme for CO2 Capture and Storage (CCS): ZEP‟s Proposal”, November 2008.
Figure 25 lists the boundary conditions that could be identified in the above studies:
Figure 25: Boundary conditions considered in other studies
* As detailed in the underlying report to ZEP‟s Strategic Research Agenda, ”The final report from Working Group 1 – Power Plant and Carbon Dioxide Capture”, October 2006
ZEP 2009 ZEP 2006 ENCAP McKinsey Harvard MIT Estimate Year 2009 2006 2004 2008 2008 2005 Economic life time (years) 25 / 40 25 25 / 40 40 (early commercial) 20 (FOAK) 20 Operating hours per year (hours) 7500 7500 7500 7500 7500 7500 Fuel price
Hard Coal 2 – 2.9 €/GJ 2.3 €/GJ 1.6 €/GJ 65€/tonne $ 1.8 /MMBtu $1-1.5/MMBtu Lignite 1.39 €/GJ 1.1 €/GJ 1.1 €/GJ 12€/tonne $1.2 /MMBtu Natural Gas 4.5 - 11 €/GJ 5.8 €/GJ 3.5 €/GJ $8 /MMBtu
Owner's cost Hard Coal 10% 15% 15% 10% Lignite 20% 20% 20% 10% Natural Gas 10% 15% 15% 10%
Discount rate 9% 9% WACC 8% 8% 8% 8% 10%
NETL/DOE EPRI Rubin SFA Global CCS Institute Mott McDonald Estimate Year 2006 2006 2005 2006 2009 2009 Economic life time (years) 20 30 30 35 / 45 Operating hours per year (hours) 7500 7000 7000 7500 7500 7800 Fuel price
Hard Coal $1.8/MMBtu $1.5/MMBtu $1.2/MMBtu $1.53/MMBtu $7.10/GJ (Euro region) 1.39-2.64 £ /GJ Lignite Natural Gas $6.75/MMBtu $6/MMBtu $6/MMBtu $6.35/MMBtu $6.68/GJ (Euro region) 3.9-10.21 £ /GJ
Owner's cost Not Included Hard Coal 15% Lignite 15% Natural Gas 15%
Discount rate 8.81% 10% WACC

55
For the American studies that normally base their calculations considering the High Heating Value (HHV) instead of the Low Heating Value (LHV) used in ZEP and in other European studies, the HHV values have been converted using the following calculation: Efficiency (LHV) = Efficiency (HHV) * (HHV/LHV) For the hard coal cases, ZEP has assumed that the coal used in the American Studies corresponds to Illinois 6, with a coefficient HHV/LHV of 1.037. For the natural gas cases, the HHV/LHV ratio is assumed to be 1.108.
4.1 Hard coal
For the hard coal cases, a middle fuel price of €2.4/GJ has been assumed. For the purposes of comparison, the ZEP data used to make the comparison with other studies is the average cost value that is the boundary between the OPTI and the BASE power plant. In this simple comparison, no account has been made for the following:
Difference in plant design/configuration for 50 Hz and 60 Hz designs
The differing steam conditions used in the studies – they have simply been grouped into sub-critical, supercritical and ultra supercritical (including advanced supercritical). In this study, the USC conditions are 600/620ºC, 280 bar.
4.1.1 Hard coal PF coal-fired power plant with post-combustion capture The following table shows the results published of the various studies:
N.B. The ZEP 2009 values are the Average LCOE and CO2 avoidance cost. The data shown in red, the CO2 avoidance cost for the GCCSI and NETL studies, and the LCOE for the Mott McDonald study are combined costs for capture, transport and storage, not just capture costs. The relevant power plant costs and O&M data were extracted from each study, adjusted to second quarter of 2009 costs and calculated according to the methodology of this study. For the Rubin study, the fixed O&M cost was set at 1.5%, according to the recommendation of the IEA and the variable O&M cost set at a typical figure used in the ZEP study. Figure 26 shows the adjusted results for the LCOE:
ZEP 2009
ZEP 2006
McKinsey EPRI Rubin SFA Mott McDonald (FOAK)
SubC SC USC SubC SC SC USC ASC Levelised electricity cost (€/MWh) 70.3 57.5 54.7 51.5 49.2 79.6 76.9 62.2 59.0 62.0 162.2 142.1 156.31 CO2 avoidance cost (€/t CO2) 33.3 30.1 21-32 27.7 27.1 27.5 45.6 45.6 37.3 33.3 29.5 66.2 66.2
MIT
HARD COAL
NETL/DOE Global CCSI

56
Figure 26: LCOE for hard coal-fired power plants with post-combustion capture
The CO2 avoidance costs were determined by referencing the above figures to ZEP‟s reference power plant without CO2 capture (Figure 27):
Figure 27: CO2 avoidance costs for hard coal-fired power plants with post-combustion capture
Despite the simplifications assumed in this process, we believe the following observations can be made:
In agreement with other studies, the CO2 avoidance costs are higher for less efficient power plants with the subcritical steam power plants having the highest CO2 avoidance costs. The state-of-the-art USC conditions identified in this study for Europe will lead to lower CO2 avoidance costs.
The levelised CAPEX of this study (€28.1-€31.8/MWh, average 30) and OPEX (€13.1-€14.5/MWh, average 13.7) are generally in good agreement with the figures determined in the GCCSI study, although the CAPEX is some 6% lower.
In 2008, McKinsey published the following costs for an early commercial power plant:
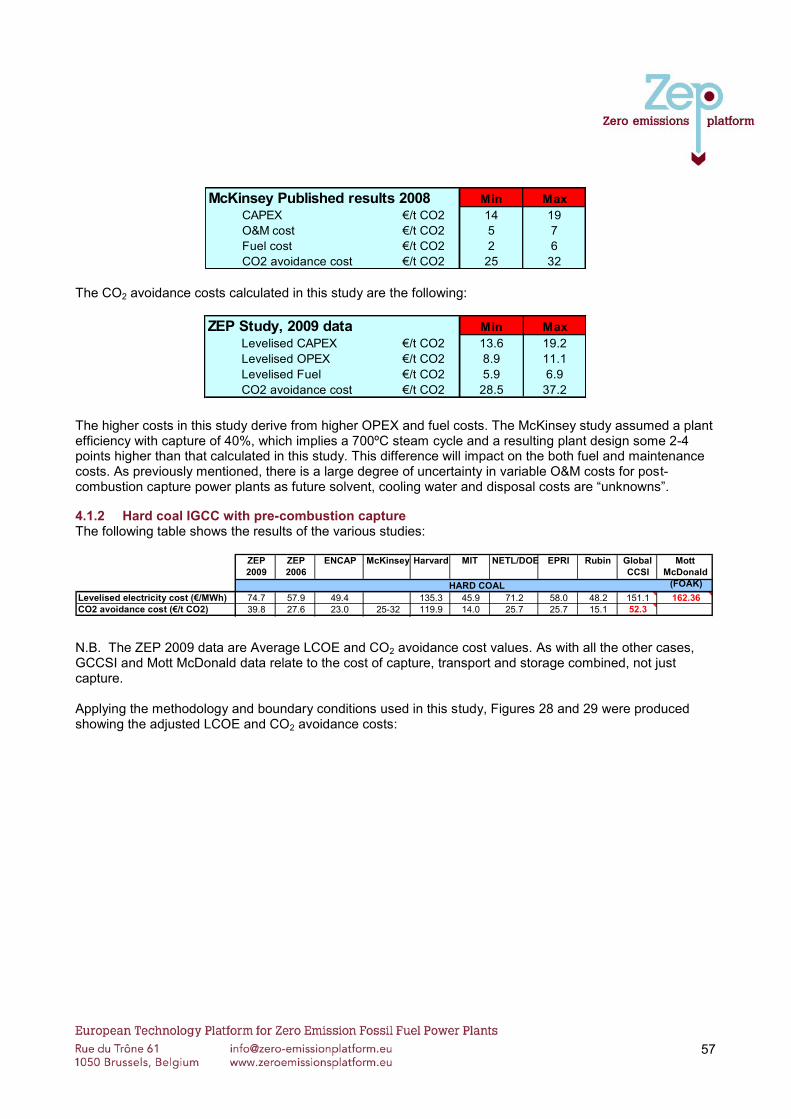
57
McKinsey Published results 2008 Min Max
CAPEX €/t CO2 14 19
O&M cost €/t CO2 5 7
Fuel cost €/t CO2 2 6
CO2 avoidance cost €/t CO2 25 32 The CO2 avoidance costs calculated in this study are the following:
ZEP Study, 2009 data Min Max
Levelised CAPEX €/t CO2 13.6 19.2
Levelised OPEX €/t CO2 8.9 11.1
Levelised Fuel €/t CO2 5.9 6.9
CO2 avoidance cost €/t CO2 28.5 37.2
The higher costs in this study derive from higher OPEX and fuel costs. The McKinsey study assumed a plant efficiency with capture of 40%, which implies a 700ºC steam cycle and a resulting plant design some 2-4 points higher than that calculated in this study. This difference will impact on the both fuel and maintenance costs. As previously mentioned, there is a large degree of uncertainty in variable O&M costs for post-combustion capture power plants as future solvent, cooling water and disposal costs are “unknowns”.
4.1.2 Hard coal IGCC with pre-combustion capture The following table shows the results of the various studies:
N.B. The ZEP 2009 data are Average LCOE and CO2 avoidance cost values. As with all the other cases, GCCSI and Mott McDonald data relate to the cost of capture, transport and storage combined, not just capture. Applying the methodology and boundary conditions used in this study, Figures 28 and 29 were produced showing the adjusted LCOE and CO2 avoidance costs:
ZEP 2009
ZEP 2006
ENCAP McKinsey Harvard MIT NETL/DOE EPRI Rubin Global CCSI
Mott McDonald
(FOAK) Levelised electricity cost (€/MWh) 74.7 57.9 49.4 135.3 45.9 71.2 58.0 48.2 151.1 162.36 CO2 avoidance cost (€/t CO2) 39.8 27.6 23.0 25-32 119.9 14.0 25.7 25.7 15.1 52.3
HARD COAL
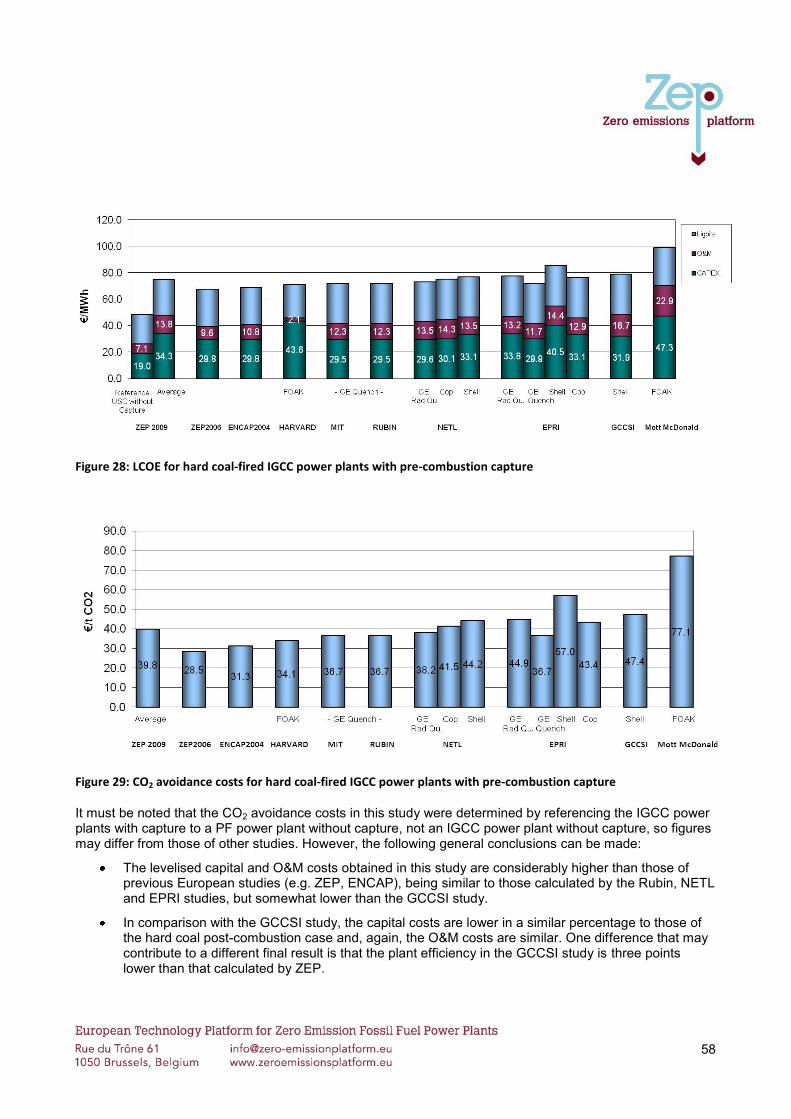
58
Figure 28: LCOE for hard coal-fired IGCC power plants with pre-combustion capture
Figure 29: CO2 avoidance costs for hard coal-fired IGCC power plants with pre-combustion capture
It must be noted that the CO2 avoidance costs in this study were determined by referencing the IGCC power plants with capture to a PF power plant without capture, not an IGCC power plant without capture, so figures may differ from those of other studies. However, the following general conclusions can be made:
The levelised capital and O&M costs obtained in this study are considerably higher than those of previous European studies (e.g. ZEP, ENCAP), being similar to those calculated by the Rubin, NETL and EPRI studies, but somewhat lower than the GCCSI study.
In comparison with the GCCSI study, the capital costs are lower in a similar percentage to those of the hard coal post-combustion case and, again, the O&M costs are similar. One difference that may contribute to a different final result is that the plant efficiency in the GCCSI study is three points lower than that calculated by ZEP.

59
4.1.3 Hard coal oxy-fueI PF power plant The following table shows the results of the various studies:
N.B. The ZEP 2009 data are Average LCOE and CO2 avoidance cost values for an OPTI plant design – not previously cited in the report. As in all other cases, the Global CCS Institute (GCCSI) data relate to the cost of capture, transport and storage, not just the capture cost. Applying the methodology and boundary conditions used in this study, Figures 30 and 31 were produced showing the adjusted LCOE and CO2 avoidance costs for an OPTI oxy-fuel power plant:
Figure 30: LCOE for hard coal-fired power plants with oxy-fuel capture
Figure 31: CO2 avoidance costs for hard coal-fired power plants with oxy-fuel capture
ZEP 2009 ZEP 2006 ENCAP McKinsey Global CCSI
Levelised electricity cost (€/MWh) 65.9 57.9 40.3 144.8 CO2 avoidance cost (€/t CO2) 34.2 31.1 12.1 25-32 49.3
HARD COAL

60
Even taking into consideration the uncertainties of this simplified comparison in calculating the CO2 avoidance costs by referencing all the studies to the reference power plant of this study, the following conclusions can be made:
As with other studies, the CO2 avoidance costs are higher for less efficient power plants based on the supercritical steam cycle.
ZEP‟s levelised CAPEX of €28.1/MWh is in good agreement with GCCSI‟s figure of €29.7/MWh, although its levelised OPEX figures are some 15% lower than those assumed by GCCSI and its plant efficiency is 2% points higher, resulting in differing CO2 avoidance costs.
As with the other capture technologies, the costs determined in this study are considerably higher than those of European studies using 2004 and 2006 data, and represent a more realistic approach to the determination of plant costs.
In 2008, McKinsey published the following costs for an early commercial power plant:
The CO2 avoidance costs calculated in this study are:
The McKinsey study predicts a slightly lower cost than the OPTI power plant calculated in this study. This difference may be due to the higher plant efficiency and steam conditions assumed by McKinsey (40% plant efficiency, 700ºC steam cycle), resulting in a power plant with an efficiency of four points higher than that employed in this study. This difference will impact on both the fuel and maintenance costs. Power plant costs in this study are also calculated using data from commercially available cryogenic air separation plants. It is claimed by the manufacturers that there exists the possibility of obtaining a few percentage points improvement by reducing power consumption by around 40 kWh/tonne. It is not known whether such considerations were taken into consideration in the McKinsey study.

61
4.2 Lignite
4.2.1 Lignite PF coal-fired power plant with post-combustion capture The only other studies of reference concerning lignite PF power plants with post-combustion were previously undertaken in Europe by ZEP and the Castor project, using 2006 data. The published costs are shown in the following table:
Applying the methodology and boundary conditions used in this study, Figures 32 and 33 were produced showing the adjusted LCOE and CO2 avoidance costs:
Figure 32: LCOE for lignite-fired power plants with post-combustion capture
ZEP 2009 ZEP 2006 Castor McKinsey
Levelised electricity cost (€/MWh) 75.2 48.0 59.1 CO2 avoidance cost (€/t CO2) 38.9 20.4 33.7 25-32
LIGNITE

62
Figure 33: CO2 avoidance costs for lignite-fired power plants with post-combustion capture
The only previous studies of lignite-fired PF power plants with post-combustion capture are European-based. The actual costs obtained are very similar to those of the Castor study, which are some 20% higher than the 2006 data used in the underlying report to ZEP‟s Strategic Research Agenda, “The final report from Working Group 1 – Power Plant and Carbon Dioxide Capture”.
4.2.2 Lignite IGCC with pre-combustion capture There have also been very few studies carried out for lignite-fired IGCC power plants – mainly European. The published costs are shown in the following table:
Applying the methodology used in this study, it can be observed that the costs obtained in this study are higher than those of previous European studies and probably represent a more realistic view of the costs of this technology (Figures 34 and 35):
ZEP 2009 ZEP 2006 ENCAP McKinsey
Levelised electricity cost (€/MWh) 67.4 43.9 41.4 CO2 avoidance cost (€/t CO2) 29.9 15.0 17.7 25-32
LIGNITE

63
Figure 34: LCOE for lignite-fired IGCC power plants with pre-combustion capture
Figure 35: CO2 avoidance costs for lignite-fired IGCC power plants with pre-combustion capture
4.2.3 Lignite oxy-fueI PF power plant The only previous studies carried out on lignite-fired oxy-fuel power plants have been European. When adjusted to the boundary conditions of this study, the LCOE and CO2 avoidance costs for these studies are shown in Figures 36 and 37:

64
Figure 36: LCOE for lignite-fired OPTI power plants with oxy-fuel capture
Figure 37: CO2 avoidance costs for lignite-fired OPTI power plants with oxy-fuel capture
The costs determined in this study are considerably lower than those published in previous studies for an OPTI early commercial power plant. However, as previously mentioned, the costs for this option are considered to be very ambitious and could be on the low side. It should be noted that this is in marked contrast to the results for the lignite-fired PF power plant with post-combustion capture and lignite-fired IGCC with pre-combustion capture, where the costs developed in this study are considerably higher than those determined in previous European studies.
4.3 Natural gas
4.3.1 Natural gas combined cycle with post-combustion capture The following table shows the results of the various studies:

65
N.B. Data from the GGCSI and Mott McDonald are for combined capture, transport and storage costs, not just capture. Applying the methodology and boundary conditions used in this study and assuming all the plants in the other studies are more representative of an OPTI plant (except where stated), Figures 38 and 39 have been produced for the LCOE and CO2 avoidance costs:
Figure 38: LCOE for CCGT power plants with post-combustion capture
Figure 39: CO2 avoidance costs for CCGT power plants with post-combustion capture
ZEP 2009
BASE ZEP 2009
OPTI ZEP 2006 NETL/DOE EPRI Rubin SFA Global CCSI Mott McDonald
(FOAK)
Levelised electricity cost (€/MWh) 103.5 91.5 68.8 65.3 52.7 54.0 55.7 83.6 123.75 CO2 avoidance cost (€/t CO2) 109.7 79.0 64.7 55.6 41.9 48.9 83.9
NATURAL GAS

66
The costs obtained for the OPTI power plant in this study are comparable with the DECC study, but somewhat higher than those from the GCCSI, SFA, EPRI NETL and Rubin. Both the capital costs and O&M costs determined in this study are higher, suggesting that it has adopted a more conservative approach.

67
5 Future Trends in CO2 Capture Costs and Impact of Second- Generation Technologies
5.1 Post-combustion capture
The first-generation post-combustion capture systems analysed in this study are based on liquid chemical solvents, commonly an amine-based reagent that imposes a large energy penalty in the capture process. ZEP‟s 2010 publication, “Recommendations for research to support the deployment of CCS in Europe beyond 2020” identified the following potential improvements for solvents:
Progress in this area will lead to an improvement in plant efficiency as the energy requirements of the capture plant should diminish. Assuming that an improvement in plant efficiency can be obtained without incurring additional plant cost, the following cost reductions could be expected:
Plant Efficiency %
Average Levelised Electricity Costs €/MWh
Average CO2 Avoidance Cost €/t CO2
Hard Coal PF Post- Combustion Capture Studied
38 70.3 33.3
Plant Efficiency Improvement of 1 point
39 69.7 32.2
Plant Efficiency Improvement of 2 points
40 69 31.1
Plant Efficiency Improvement of 3 points
41 68.4 30.1
Plant Efficiency Improvement of 4 points
42 67.8 29.1
Other improvements identified for post-combustion capture processes are power plant efficiency improvements due to a higher temperature/pressure steam cycle. Research development is ongoing for the 700ºC, 350 bar steam cycle that will result in plant efficiency improvements and therefore a reduction in CO2 avoidance costs. However, it is difficult to assess the impact of this technology as there are no reliable cost data available for such power plant designs.

68
Improvements in the integration of the capture plant and compression islands should also result in efficiency improvements, as will the commercialisation of the capture power plants. The potential impact of reducing the capital costs is shown in the following table:
Plant Cost €/kWh
Average Levelised Electricity Costs €/MWh
Average CO2 Avoidance Cost €/t CO2
Hard Coal PF Post-Combustion Capture Studied
2,450 70.3 33.3
Plant Cost reduction of 5% 2,327.5 68.8 31.1
Plant Cost reduction of 10% 2,205.0 67.3 28.8
Plant Cost reduction of 15% 2,082.5 65.8 26.6
The sensitivities shown for the cost reduction and efficiency improvements imply that both are required to obtain a substantial savings in CO2 avoidance costs for post-combustion capture systems. In the case of natural gas combined cycle power plants with post-combustion capture, the CO2 content in the flue gas is very diluted, being in the range of 3%-5%, and therefore technology improvements to increase the CO2 concentration in the flue gas are important – in particular, flue gas recirculation. However, no cost data are available to evaluate accurately the impact of this improvement.
5.2 IGCC with pre-combustion capture
The IGCC with pre-combustion CO2 capture is considered to be the most developed of the first-generation technologies, as the majority of components have already been demonstrated at full scale in separate applications and the issue is to integrate them into a reliable power plant concept. In this study, the IGCC power plants employ cryogenic air separation for both oxygen and nitrogen supply as this is the only viable air separation technology currently available. In the first instance, it is believed that there exists the possibility of reducing energy consumption for oxygen production from 250 to 310 kWh/tonne (oxygen at 4 MPa at ISO conditions) with nitrogen integration by around 40 kWh/tonne, based on improved cryogenic processes. It is also foreseen that in the longer term, further development of adsorbents and membranes will lead to a more energy- and cost-efficient technology for oxygen production.
The development of larger gasifiers with efficient heat recovery, simplified gas cleaning processes, improved water gas-shift catalysts and new gas turbines that can operate on hydrogen-rich fuel gas with new dry low NOx (DLN) combustion should lead to both cost savings and efficiency improvements for this technology.

69
The sensitivity of efficiency improvement and cost savings are shown in the following two tables:
Plant Efficiency %
Average Levelised Electricity Costs €/MWh
Average CO2 Avoidance Cost €/t CO2
Hard Coal IGCC with pre-combustion capture
38 74.7 39.8
Plant Efficiency Improvement of 1 point
39 74 38.6
Plant Efficiency Improvement of 2 points
40 73.3 37.5
Plant Efficiency Improvement of 3 points
41 72.7 36.5
Plant Efficiency Improvement of 4 points
42 72.1 35.5
Plant Cost €/kWh
Average Levelised Electricity Costs €/MWh
Average CO2 Avoidance Cost €/t CO2
Hard Coal IGCC with pre-combustion capture
2,800 74.7 39.8
Plant Cost reduction of 5% 2,660 72.4 36.4
Plant Cost reduction of 10% 2,520 70.1 32.9
Plant Cost reduction of 15% 2,380 67.8 29.5
5.3 Oxy-fueI PF power plants
As with IGCC pre-combustion capture, the first-generation oxy-fuel power plants employ a cryogenic air separation plant for the oxygen and nitrogen supply. As stated previously, it is foreseen that future developments and optimisation will reduce the energy consumption for oxygen production from 160 to 220 kWh/tonne (ISO conditions) to a figure approaching 120-140 kWh/tonne. New membrane or sorbent technologies may further reduce this figure down to 90-120 kWh/tonne, resulting in an overall plant efficiency improvement.
There is extensive ongoing R&D work to validate the boiler design; combustion process; flue gas recycling and O2 mixing; flue gas treatment and cooling; and CO2 purification and compression that may lead to efficiency improvements and cost reductions. The sensitivity of efficiency improvements and cost savings are shown in the following two tables:

70
Plant Efficiency %
Average Levelised Electricity Costs €/MWh
Average CO2 Avoidance Cost €/t CO2
Hard Coal Oxy-fuel PF OPTI power plant
36.3 65.9 34.8
Plant Efficiency Improvement of 1 point
37 65.3 34
Plant Efficiency Improvement of 2 points
38 64.6 32.7
Plant Efficiency Improvement of 3 points
39 63.9 31.6
Plant Efficiency Improvement of 4 points
40 63.3 30.5
Plant Cost €/kWh
Average Levelised Electricity Costs €/MWh
Average CO2 Avoidance Cost €/t CO2
Hard Coal Oxy-fuel PF OPTI power plant
2,200 65.9 34.8
Plant Cost reduction of 5% 2,090 64.4 32.7
Plant Cost reduction of 10% 1,980 63.0 30.6
Plant Cost reduction of 15% 1,870 61.6 28.5
5.4 Second-generation capture technologies
There is extensive ongoing R&D work to develop second-generation technologies that should lead to a step reduction in the cost of CO2 capture. These concepts are still very much in the early stages of research and development, being currently demonstrated in pilot plants often below 1 MWt in size. For this reason, very little reliable cost data exist for an industrial-scale power plant of these technologies. Indeed, this study has not unearthed any new cost data since those published by ENCAP in 2006 (see page 54). As a result, in the following sub-sections, the ENCAP data has been adjusted to second quarter 2009 capital costs and the costs calculated using the boundary conditions established in this study.
5.4.1 Hard coal-based technologies Chemical looping combustion (CLC) is a second-generation oxy-fuel technology where the separation of oxygen from air is integrated in the combustion process. Metal particles are oxidised in an air reactor, the resulting metal oxide particles are transported to a fuel reactor, where they are reduced as fuel is oxidised and fuel heat released. The metal particles are then transported back to the air reactor where they can be oxidised again. The ENCAP work studied the following concept:
445 MW CFB CLC: when applied for solid fuels, a CLC boiler is typically based on CFB technology consisting of two interconnected circulating CFB units producing steam in a conventional Rankine cycle.
The costs obtained for this concept, along with the costs for an OPTI oxy-fuel power plant calculated in this study, are shown in Figures 40 and 41:

71
Figure 40: LCOE for hard coal-fired power plants with oxy-fuel capture – a comparison between ZEP and
ENCAP CLC Concept
Figure 41: CO2 avoidance costs for hard coal-fired power plants with oxy-fuel capture – a comparison between
ZEP and SP4 CLC
The driving force for the Chemical Looping is the potential reduction in efficiency drop, which was identified by the ENCAP study as only 2% points efficiency drop compared to their reference case. The reduction in energy penalty is due to the fact that the vast majority of the oxygen separation plant is not required. In terms of capital cost, the reduction in the air separation unit is offset by the fact that the process requires two interconnected CFB reactors. The figures seem to suggest the merit in pursuing this technological option, even though a process based on two interconnected reactors could cause operational difficulties.
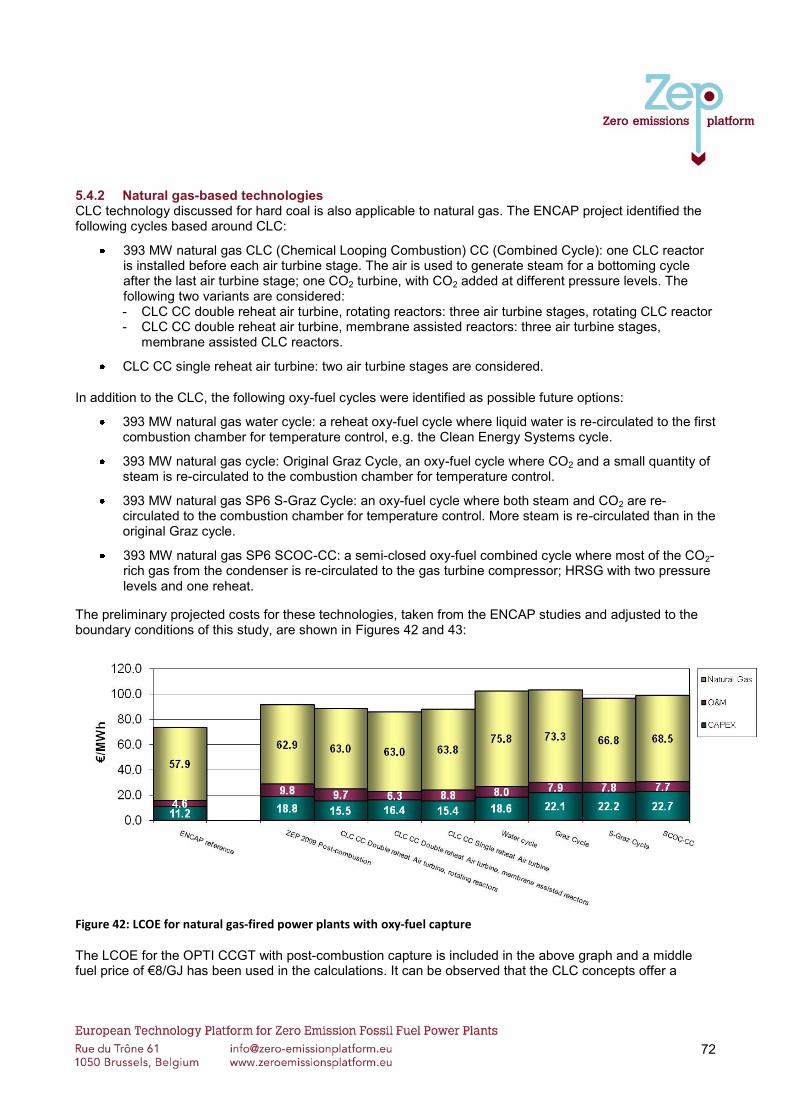
72
5.4.2 Natural gas-based technologies CLC technology discussed for hard coal is also applicable to natural gas. The ENCAP project identified the following cycles based around CLC:
393 MW natural gas CLC (Chemical Looping Combustion) CC (Combined Cycle): one CLC reactor is installed before each air turbine stage. The air is used to generate steam for a bottoming cycle after the last air turbine stage; one CO2 turbine, with CO2 added at different pressure levels. The following two variants are considered: - CLC CC double reheat air turbine, rotating reactors: three air turbine stages, rotating CLC reactor - CLC CC double reheat air turbine, membrane assisted reactors: three air turbine stages,
membrane assisted CLC reactors.
CLC CC single reheat air turbine: two air turbine stages are considered.
In addition to the CLC, the following oxy-fuel cycles were identified as possible future options:
393 MW natural gas water cycle: a reheat oxy-fuel cycle where liquid water is re-circulated to the first combustion chamber for temperature control, e.g. the Clean Energy Systems cycle.
393 MW natural gas cycle: Original Graz Cycle, an oxy-fuel cycle where CO2 and a small quantity of steam is re-circulated to the combustion chamber for temperature control.
393 MW natural gas SP6 S-Graz Cycle: an oxy-fuel cycle where both steam and CO2 are re-circulated to the combustion chamber for temperature control. More steam is re-circulated than in the original Graz cycle.
393 MW natural gas SP6 SCOC-CC: a semi-closed oxy-fuel combined cycle where most of the CO2-rich gas from the condenser is re-circulated to the gas turbine compressor; HRSG with two pressure levels and one reheat.
The preliminary projected costs for these technologies, taken from the ENCAP studies and adjusted to the boundary conditions of this study, are shown in Figures 42 and 43:
Figure 42: LCOE for natural gas-fired power plants with oxy-fuel capture
The LCOE for the OPTI CCGT with post-combustion capture is included in the above graph and a middle fuel price of €8/GJ has been used in the calculations. It can be observed that the CLC concepts offer a

73
fractional reduction in LCOE costs. However, when comparing the CO2 avoidance costs, the following results have been determined:
Figure 43: CO2 avoidance costs for natural gas-fired power plants with oxy-fuel capture
The CO2 avoidance cost for the OPTI CCGT post-combustion capture is considerably higher than the CLC concepts. In this case, it must be noted that the reference power plants are not the same: the ENCAP concepts are referenced against their reference plant, whilst the CCGT post-combustion capture is referenced against the ZEP power plant reference. All the capture technologies reduce net efficiency when compared to the reference case. For differentiation, the S-Graz cycle efficiency is decreased by 8% and the SCOC-GT efficiency is decreased by 9%, whereas the decrease is ~12% for the Graz and ~13% for the water cycle, compared to the base case of 56.5%. The CLC combined cycles potentially have the highest cycle efficiencies (51%-52%), but this design includes pressurised CLC reactors, which is very advanced technology. The CLC reactors also limit possible increases in turbine inlet temperature and thereby possibilities to benefit from future developments towards higher efficiency of the gas turbine cycle. It is therefore uncertain if a CLC natural gas-based system would still have a competitive advantage when compared to a future natural gas post-combustion option with a more efficient gas turbine. In general, the novel oxy-fuel cycles are immature, even when compared to the CLC cycles; will be more expensive in investment costs; and construction time will be increased due to the higher degree of integration and complexity of these plants. When comparing specific investments for these new technologies, those for these novel concepts increase compared with reference cases due to more expensive equipment, air separation processes and the CO2 compression in the oxy-fuel cycles and more expensive equipment in the CLC CC concepts. The ENCAP project also identified the following pre-combustion gas concepts:
ATR pre-combustion ASU: IRCC (Integrated Reforming Combined Cycle) with cryogenic ASU for oxygen production to the ATR (Autothermal Reformer) and MDEA (MethylDiEthanolAmine) for pre-combustion CO2 capture; not much integration with respect to heat and air compression, giving a relatively low energy efficiency, but higher flexibility. Two parallel F-class gas turbines in a CC of the

74
same type as in the ENCAP reference NGCC. In the ENCAP project, development work was performed, aiming at the adaptation of burners for hydrogen-rich gases to the design requirements of modern high temperature F-class gas turbines. This is the most near-term of the pre-combustion gas concepts.
Pre-combustion CAR: the concept is a hybrid between pre-combustion and oxy-fuel. CAR (Ceramic Autothermal Recovery) is a BOC/Linde technology for separating air with a high temperature Pressure Swing Adsorption (PSA). The process consists of a CAR unit, oxy-fuel steam reformer (tubular reactor) and a conventional PSA unit for separating the synthesis gas into H2 from a fuel stream (CH4, CO, CO2). The H2 is combusted in a similar combined cycle as in the ATR Pre-combustion ASU concept. The fuel stream is combusted in the steam reformer with O2 from the CAR unit for providing heat to the synthesis gas production in the tubes. A part of the steam reformer combustion product (mainly CO2) is used for sweeping the CAR unit and recycled to the steam reformer. The rest is compressed for geological storage. This is a novel and immature concept developed in ENCAP. Two parallel F-class gas turbines in a CC of the same type as in the ENCAP reference NGCC. In the ENCAP project, development work was performed, aiming at adaptation of burners for hydrogen-rich gases to the design requirements of modern high temperature F-class gas turbines.
Pre-combustion membrane: pre-combustion cycle with an ATR membrane reactor with an oxygen permeable membrane (ceramic) with a higher total pressure on the permeate side of the membrane than on the retentive side; water-gas-shift membrane reactor with a hydrogen-permeable membrane.
Pre-combustion membrane, high pressure pre-combustion cycle with an ATR membrane reactor with an oxygen permeable membrane (ceramic) with a higher total pressure on the permeate side of the membrane than on the retentive side. Water-gas-shift membrane reactor with a hydrogen-permeable membrane. Compared to the 393 MW natural gas SP6 pre-combustion membrane, this cycle has a higher pressure on the permeate side of the membrane.
The preliminary projected costs for these technologies, that are simply an actualisation of the original ENCAP costs, are shown in Figures 44 and 45:
Figure 44: LCOE for natural gas-fired power plants with pre-combustion capture

75
Figure 45: CO2 avoidance costs for natural gas-fired power plants with pre-combustion capture
In all cases, it is inferred that the predicted costs for the novel cases do not imply a step-wise reduction in costs over the OPTI power plant option. However, future development work may identify cost reductions. When comparing these novel cycles to the reference case, the major additional energy demands are due to the air separation processes: the natural gas combustion to heat the CAR absorber for the pre-combustion CAR concept, the reforming in the ATR and ST cycles respectively of natural gas to produce a hydrogen-rich gas, the CO2 separation and the CO2 compression. All these capture technologies reduce net efficiency compared to the reference case. The efficiency of the pre-combustion CAR concept (44%) is significantly higher than that of the ATR pre-combustion ASU concept (41%) due to the use of new but immature air separation technology, a PSA instead of an amine unit for CO2 separation and a higher level of integration. The ATR pre-combustion ASU concept is based on conservative assumptions, i.e. its efficiency can be improved by more integration and less conservative assumptions. The pre-combustion membrane, high pressure cycle has the highest efficiency with 48%, but is also the most immature. The efficiency of the pre-combustion membrane cycle (44%) is lower due to the use of lower pressure on the permeate side that may be more mature. However, both pre-combustion membrane concepts still seem less mature than the pre-combustion CAR concept due to the use of high temperature membranes. It seems that developing the CAR technology can take less time than the high temperature membranes. Comparing specific investments, the main increases in equipment costs are due to:
Pre-combustion concepts: the air separation processes – cryogenic ASU for the “first-generation” concept, the CAR absorber for the pre-combustion CAR concept and the membrane reactors for the pre-combustion membrane concepts – natural gas reforming, CO-shift, CO2 separation and CO2 compression.
The investment cost for the pre-combustion CAR and the pre-combustion membrane concepts are based on several conservative assumptions, considering assumptions on immature technologies. When comparing fixed O&M costs, the calculated costs for the ATR pre-combustion ASU concept are at a low level compared to the reference case. The maturity and level of integration varies from case to case. Since the ATR pre-combustion ASU concept is based on conservative assumptions, it has a relatively low level of integration, but a high level of maturity.

76
It needs the development of a low NOx H2 turbine which is common for all pre-combustion cases. The pre-combustion CAR concept seems to have a medium level of maturity, but a high level of integration. The pre-combustion membrane concepts have the lowest maturity due to the membrane modules; more than 10 years are claimed to be needed for their development. These differences have a clear effect on the energy efficiency – the most immature ones have the highest efficiency. For the pre-combustion CAR concept, ENCAP reports the lifetime of the CAR adsorbent as an unknown; its economic success depends on it.

77
6 Acknowledgments The work described this report has been possible solely due to the co-operation of participating ZEP members, resulting in a truly cross-border, cross-organisation product. Without their commitment, the challenging and constructive debate could not have been created, nor yielded such substantial results.
6.1 Working Group participants and organisations
Name Country Organisation
Belaustegui Ituarte Yolanda Spain LEIA
Buddenberg Torsten Germany Hitachi Power Europe
Chiesa Paolo Italy Politecnico di Milano
Dernjatin Pauli Finland Fortum
Desideri Umberto Italy University of Perugia
Dodero Giorgio Italy I.P.G. Industrial Project Group Srl
Doukelis Aggelos Greece National Technical University of Athens
Ehinger Andreas France IFP Energies nouvelles
Holland-Lloyd Peter U. K. Doosan Babcock
Girardi Giuseppe Italy ENEA
Goldschmidt Dirk Germany Siemens AG Power Generation
Hotta Arto Finland Foster Wheeler
Jensen Hans Finland RWE Npower
Jordan Escalona Natividad Germany RWE Power AG
Kokko Ari Finland Metso Power
Kuivalainen Reijo Finland Foster Wheeler
Lupion Monica Spain CIUDEN
Manzolini Giampaolo Italy Politecnico di Milano
Marion Pierre France IFP Energies nouvelles
Melien Torgeir Norway Statoil
Morin Jean-Xavier France CO2-H2 Eurl
Røkke Nils A. France SINTEF
Sala Luca Italy Ansaldo Energia
Schwendig Frank Germany RWE
Strömberg Lars Sweden Vattenfall
Unterberger Sven Germany ENBW
Tranier Jean-Pierre France Air Liquide
Weckes Patrick Germany Hitachi Power Europe
Wiedermann Alexander Germany MAN TURBO AG
Wolf Markus Switzerland Alstom Power Technology Centre
Zanin Egidio Italy CSM - Centro Sviluppo Materiali

78
6.2 Review partners
Name Country Organisation
Chamberlain John Spain Gas Natural Fenosa
Teruel Muñoz Juan Enrique Spain Gas Natural Fenosa
Ekström Clas Sweden Vattenfall Research and Development AB
Irons Robin U.K. E.ON engineering UK

79
Glossary
ASU Air Separation Unit BASE Base power plant with CO2 capture CAPEX Capital expenditure or investment CCGT Combined Cycle Gas Turbine CCS CO2 Capture and Storage CC Combined cycle CFB Circulating Fluidised Bed CH4 Methane CLC Chemical Looping Combustion CO Carbon monoxide CO2 Carbon dioxide DLN Dry Low NOx DOGF Depleted oil and gas fields EPC Engineering Procurement and Construction costs EU European Union EUR Euro FEED Front End Engineering Design study FGD Flue gas desulfurisation FOAK First-of-a-kind GCCSI Global CCS Institute GJ Gigajoule H2 Hydrogen H2S Hydrogen sulfide HRSG Heat Recovery Steam Generator ID Induced Draft IGCC Integrated Gasification Combined Cycle IP Intermediate Pressure (IP) kWh Kilowatt Hour LCOE Levelised Cost of Electricity LHV Lower Heating Value LP Low Pressure MMBtu Millions of British thermal units MWe Megawatt Electricity MWh Megawatt Hour MPa Megapascal MWt Megawatt tonne NGCC Natural Gas Combined Cycle NGO Non-governmental organisation NOx Nitrogen Oxide O&M Operation and Maintenance OPEX Annual operational expenditure OPTI Optimised power plant with CO2 capture PF Pulverised Fuel PSA Pressure Swing Adsorption R&D Research and Development SOx Sulphur Oxide ST Steam Turbine t CO2 Tonne of CO2 USC Ultra Super Critical ZEP European Technology Platform for Zero Emission Fossil Fuel Power Plants, known as the Zero
Emissions Platform

80
Annex: List of Figures
Figure # Content Page
Figure 1 LCOE for hard coal-fired power plants with CO2 capture 6
Figure 2 CO2 avoidance costs for hard coal-fired power plants with CO2 capture 7
Figure 3 Dependence on the natural gas price for post-combustion capture 7
Figure 4 Financial and other boundary conditions used in the study 17
Figure 5 LCOE for hard coal-fired power plants with CO2 capture 20
Figure 6 CO2 avoidance costs for hard coal-fired power plants with CO2 capture 20
Figure 7 LCOE and CO2 avoidance costs for hard coal-fired power plants with post-combustion capture 24
Figure 8 Dependence on the coal price for post-combustion capture (OPTI power plant) 24
Figure 9 LCOE and CO2 avoidance costs for hard coal-fired IGCC power plants 27
Figure 10 Dependence on Plant Load Factor for all three coal technologies 29
Figure 11 LCOE and CO2 avoidance costs for BASE hard coal-fired power plants with oxy-fuel capture 35
Figure 12 LCOE and CO2 avoidance costs for OPTI hard coal-fired power plants with oxy-fuel capture 35
Figure 13 Dependence on the coal price for all three capture technologies 36
Figure 14 LCOE for lignite-fired power plants with CO2 capture 38
Figure 15 CO2 avoidance costs for lignite-fired power plants with CO2 capture 38
Figure 16 LCOE and CO2 avoidance costs for lignite-fired power plants with post-combustion capture 41
Figure 17 LCOE and CO2 avoidance costs for lignite-fired IGCC power plants with pre-combustion capture 43
Figure 18 LCOE and CO2 avoidance costs for lignite-fired power plants with oxy-fuel capture 45
Figure 19 LCOE for natural gas-fired power plants with CO2 capture 46
Figure 20 CO2 avoidance costs for natural gas-fired power plants with CO2 capture 47
Figure 21 Dependence on the natural gas price for post-combustion capture (OPTI power plant) 47
Figure 22 Dependence on the coal price for post-combustion capture (OPTI power plant) 48
Figure 23 LCOE and CO2 avoidance costs for natural gas-fired CC power plants with post-combustion capture 52
Figure 24 Financial and other boundary conditions used in this study 53
Figure 25 Boundary conditions considered in other studies 54
Figure 26 LCOE for hard coal-fired power plants with post-combustion capture 56
Figure 27 CO2 avoidance costs for hard coal-fired power plants with post-combustion capture 56
Figure 28 LCOE for hard coal-fired IGCC power plants with pre-combustion capture 58
Figure 29 CO2 avoidance costs for hard coal-fired IGCC power plants with pre-combustion capture 58
Figure 30 LCOE for hard coal-fired OPTI power plants with oxy-fuel capture 59
Figure 31 CO2 avoidance costs for OPTI hard coal-fired power plants with oxy-fuel capture 59
Figure 32 LCOE for lignite-fired power plants with post-combustion capture 61
Figure 33 CO2 avoidance costs for lignite-fired power plants with post-combustion capture 62
Figure 34 LCOE for lignite-fired IGCC power plants with pre-combustion capture 63
Figure 35 CO2 avoidance costs for lignite-fired IGCC power plants with pre-combustion capture 63
Figure 36 LCOE for lignite-fired OPTI power plants with oxy-fuel capture 64
Figure 37 CO2 avoidance costs for lignite-fired OPTI power plants with oxy-fuel capture 64
Figure 38 LCOE for CCGT power plants with post-combustion capture 65
Figure 39 CO2 avoidance costs for CCGT power plants with post-combustion capture 65
Figure 40 LCOE for hard coal-fired power plants with oxy-fuel capture – a comparison between ZEP and
ENCAP CLC Concept 71
Figure 41 CO2 avoidance costs for hard coal-fired power plants with oxy-fuel capture – a comparison between
ZEP and SP4 CLC 71

81
Figure 42 LCOE for natural gas-fired power plants with oxy-fuel capture 72
Figure 43 CO2 avoidance costs for natural gas-fired power plants with oxy-fuel capture 73
Figure 44 LCOE for natural gas-fired power plants with pre-combustion capture 74
Figure 45 CO2 avoidance costs for natural gas-fired power plants with pre-combustion capture 75