CO Recombination to Human Myoglobin Mutants in … · 2202 Biochemistry 1993, 32, 2202-22 12 CO...
11
2202 Biochemistry 1993, 32, 2202-22 12 CO Recombination to Human Myoglobin Mutants in Glycerol-Water Solutionst Sriram Balasubramanian,: David G. Lambright,: Michael C. Marden,§ and Steven G. Boxer'J Department of Chemistry, Stanford University, Stanford, California 94305-5080, and INSERM U299. Hopital de Bicetre, 94275 Le Kremlin Bicetre, France Receiued September 16, 1992; Reuised Manuscript Receioed Nooember 24, 1992 ABSTRACT: The kinetics of CO recombination to site-specific mutants of human myoglobin have been studied by flash photolysis in the temperature range 250-320 K on the nanosecond to second time scale in 75% glycerol at p H 7. The mutants were constructed to examine specific proposals concerning the roles of Lys 45, Asp 60, and Val 68 in the ligand binding process. It is found that ligand recombination is nonexponential for all the mutants and that both the geminate amplitude and rate show large variations. The results are interpreted in terms of specific models connecting the dynamics and structure. It is shown that removal of the charged group at position 45 does not substantially affect the barrier height for escape or entry of the ligand; therefore the breakage of the salt bridge linking Lys 45, Asp 60, and a heme propionate is ruled out as the rate-determining barrier for this process. On the other hand, it is found that the escape barrier decreases roughly as size of the residue at position 68 increases, in the order Ala > Val > Asn > Leu. The residue at position 68 is also a major contributor to the final barrier to rebinding, but the barrier height shows no correlation with residue size and is more dependent on the stereochemistry of the residue. A molecular mechanism for ligand binding that is consistent with the results is discussed, and supporting evidence for this mechanism is examined The direct coupling between biological function and protein dynamics in the ligand binding process of heme proteins such as hemoglobin and myoglobin has stimulated an enormous body of theoretical and experimental work. Soon after the elucidation of the structure of myoglobin (Mb)] by X-ray crystallography (Kendrew et al., 1960), it was apparent that transient pathways, not evident in the X-ray structure, must form so that diatomic ligands can move between the solvent and the heme pocket (Nobbs, 1966). Two limiting models can be suggested for these motions. The first consists of random fluctuations in the structure creating transient cavities which effectively transport ligands through the protein to and from the heme iron. The second postulates specific channels which are gated by amino acid and heme contacts. The latter is attractive because it suggests specificity and control. The actual situation likely lies somewhere in between. In order to investigate the elementary steps of ligand binding, the favored approach is flash photolysis of liganded Mb as originally developed by Gibson (Gibson, 1956). This approach converts a thermal reaction into a photochemically driven reaction, so it is possible to follow the ligand recombination kinetics in competition with escape from the protein by changes in the absorption spectrum. Many years ago, it was noted (Austin et al., 1975) that the rebinding kinetics at low temperatures are highly nonexponential. Under these con- ditions, most of the rebinding occurs from ligands that have not escaped fully from the protein and therefore sample and reflect the distribution of barrier heights imposed by the protein. Frauenfelder and co-workers have presented a complex and evolving series of models which attempts to explain the experimental results phenomenologically (Austin et al., 1975; Doster et al., 1982; Ansari et al., 1985; Steinbach Thisworkwassupprtedinpart byagrantfrom theNationalInstitutes of Health (GM-27738). * Stanford University. 5 INSERM U299. I Abbreviations: Mb, myoglobin: MbCO. carbonmonoxymyoglobin; Hb, hemoglobin; WT, wild type: SW, sperm whale; NMR, nuclear magnetic resonance: ns, nanosecond; ms, millisecond et al., 1991). These models provide a powerful and general view of proteins as consisting of a heirarchy of conformational substates, whose barriers lead to complex kinetics depending on temperature, viscosity, and pressure. Missing from these models is a specific connection with the details of the Mb structure, and it is argued that this picture applies in general to all protein function. At the other limit are molecular dynamics simulations of ligand trajectories (Case & Karplus, 1979; Kottalam & Case, 1988; Elber & Karplus, 1990).These are highly specific for the details of the Mb structure and lead to very detailed proposals for dominant pathways taken by the ligand. Although much easier to visualize, until recently there were few ways to test these proposals. Intermediate between the phenomenological models and detailed molecular mechanics are models, such as those proposed by Agmon and Hopfield (Agmon & Hopfield, 1983a,b), which focus on specific aspects of the particular ligand binding problem but also contain rather general features of protein dynamics and the coupling of protein and ligand motion. There are several related approaches which have similarly attempted to provide a physical basis for this process (Marden, 1982; Young & Bowne, 1984; Buhks & Jortner, 1985; Cotes & Sceats, 1987; Srajer et al., 1988). With the advent of site-specific mutagenesis, it has become possible to test ligand binding models in greater detail. Although it is essential to have precise structural data, the central issue is to determine the nature of the transition states for each step in the ligand binding process, and this cannot be obtained by X-ray crystallography, even though detailed structures of the ligand-bound or dissociated (deoxy) structure are available. One particularly interesting structure is that of a phenyl group bound to the heme iron on the distal side (Ringe et al., 1984). This structure has been suggested as a model for an open configuration of the protein, such as might be formed transiently during ligand entry and escape. The key residues affected by opening the protein in this way are the surface residues at position 45 (Arg in sperm whale Mb) and at position 60 (Asp), which form a salt bridge in the 0006-2960/93/0432-2202$04.00/0 0 1993 American Chemical Society
Transcript of CO Recombination to Human Myoglobin Mutants in … · 2202 Biochemistry 1993, 32, 2202-22 12 CO...

2202 Biochemistry 1993, 32, 2202-22 12
CO Recombination to Human Myoglobin Mutants in Glycerol-Water Solutionst Sriram Balasubramanian,: David G. Lambright,: Michael C. Marden,§ and Steven G. Boxer'J
Department of Chemistry, Stanford University, Stanford, California 94305-5080, and INSERM U299. Hopital de Bicetre, 94275 Le Kremlin Bicetre, France
Receiued September 16, 1992; Reuised Manuscript Receioed Nooember 24, 1992
ABSTRACT: The kinetics of CO recombination to site-specific mutants of human myoglobin have been studied by flash photolysis in the temperature range 250-320 K on the nanosecond to second time scale in 75% glycerol a t p H 7. The mutants were constructed to examine specific proposals concerning the roles of Lys 45, Asp 60, and Val 68 in the ligand binding process. It is found that ligand recombination is nonexponential for all the mutants and that both the geminate amplitude and rate show large variations. The results a r e interpreted in terms of specific models connecting the dynamics and structure. I t is shown that removal of the charged group a t position 45 does not substantially affect the barrier height for escape or entry of the ligand; therefore the breakage of the salt bridge linking Lys 45, Asp 60, and a heme propionate is ruled out as the rate-determining barrier for this process. On the other hand, it is found that the escape barrier decreases roughly as size of the residue a t position 68 increases, in the order Ala > Val > Asn > Leu. The residue a t position 68 is also a major contributor to the final barrier to rebinding, but the barrier height shows no correlation with residue size and is more dependent on the stereochemistry of the residue. A molecular mechanism for ligand binding that is consistent with the results is discussed, and supporting evidence for this mechanism is examined
The direct coupling between biological function and protein dynamics in the ligand binding process of heme proteins such as hemoglobin and myoglobin has stimulated an enormous body of theoretical and experimental work. Soon after the elucidation of the structure of myoglobin (Mb)] by X-ray crystallography (Kendrew et al., 1960), it was apparent that transient pathways, not evident in the X-ray structure, must form so that diatomic ligands can move between the solvent and the heme pocket (Nobbs, 1966). Two limiting models can be suggested for these motions. The first consists of random fluctuations in the structure creating transient cavities which effectively transport ligands through the protein to and from the heme iron. The second postulates specific channels which are gated by amino acid and heme contacts. The latter is attractive because it suggests specificity and control. The actual situation likely lies somewhere in between.
In order to investigate the elementary steps of ligand binding, the favored approach is flash photolysis of liganded M b as originally developed by Gibson (Gibson, 1956). This approach converts a thermal reaction into a photochemically driven reaction, so it is possible to follow the ligand recombination kinetics in competition with escape from the protein by changes in the absorption spectrum. Many years ago, it was noted (Austin et al., 1975) that the rebinding kinetics at low temperatures are highly nonexponential. Under these con- ditions, most of the rebinding occurs from ligands that have not escaped fully from the protein and therefore sample and reflect the distribution of barrier heights imposed by the protein. Frauenfelder and co-workers have presented a complex and evolving series of models which attempts to explain the experimental results phenomenologically (Austin et al., 1975; Doster et al., 1982; Ansari et al., 1985; Steinbach
Thisworkwassupprtedinpart byagrantfrom theNationalInstitutes of Health (GM-27738). * Stanford University.
5 INSERM U299. I Abbreviations: Mb, myoglobin: MbCO. carbonmonoxymyoglobin;
Hb, hemoglobin; WT, wild type: SW, sperm whale; NMR, nuclear magnetic resonance: ns, nanosecond; ms, millisecond
et al., 1991). These models provide a powerful and general view of proteins as consisting of a heirarchy of conformational substates, whose barriers lead to complex kinetics depending on temperature, viscosity, and pressure. Missing from these models is a specific connection with the details of the Mb structure, and it is argued that this picture applies in general to all protein function. At the other limit are molecular dynamics simulations of ligand trajectories (Case & Karplus, 1979; Kottalam & Case, 1988; Elber & Karplus, 1990).These are highly specific for the details of the M b structure and lead to very detailed proposals for dominant pathways taken by the ligand. Although much easier to visualize, until recently there were few ways to test these proposals. Intermediate between the phenomenological models and detailed molecular mechanics are models, such as those proposed by Agmon and Hopfield (Agmon & Hopfield, 1983a,b), which focus on specific aspects of the particular ligand binding problem but also contain rather general features of protein dynamics and the coupling of protein and ligand motion. There are several related approaches which have similarly attempted to provide a physical basis for this process (Marden, 1982; Young & Bowne, 1984; Buhks & Jortner, 1985; Cotes & Sceats, 1987; Srajer et al., 1988).
With the advent of site-specific mutagenesis, it has become possible to test ligand binding models in greater detail. Although it is essential to have precise structural data, the central issue is to determine the nature of the transition states for each step in the ligand binding process, and this cannot be obtained by X-ray crystallography, even though detailed structures of the ligand-bound or dissociated (deoxy) structure are available. One particularly interesting structure is that of a phenyl group bound to the heme iron on the distal side (Ringe et al., 1984). This structure has been suggested as a model for an open configuration of the protein, such as might be formed transiently during ligand entry and escape. The key residues affected by opening the protein in this way are the surface residues at position 45 (Arg in sperm whale Mb) and at position 60 (Asp), which form a salt bridge in the
0006-2960/93/0432-2202$04.00/0 0 1993 American Chemical Society

C O Recombination to Human Myoglobin Mutants
closed, ligand-bound form (Lecomte & La Mar, 1985; Kuriyan et al., 1986; Hubbard et al., 1990), and residues 68 (Val) and 64 (distal His). In the following, a series of single-site mutants a t these positions is investigated over a wide variety of conditions in order to discover the role played by each residue. By working over a range of temperatures with nanosecond time resolution and good signal-to-noise, information can be obtained on both the geminate and bimolecular parts of the rebinding process, as well as on the enthalpy and entropy changes associated with each. In earlier work, we examined the effects of changing the surface residues on the bimolecular ligand recombination and proton exchange kinetics a t room temperature (Lambright et al., 1989). We have also recently demonstrated that information on protein relaxation following ligand dissociation can be obtained by a careful examination of the time dependence of the Soret absorption spectrum on the nanosecond time scale (Lambright et al., 1991). In the following papers in this series, the combined effects of mutliple mutations at these critical residues will be presented, along with the effects of these mutations on the protein relaxation dynamics (S. Balasubramanian, D. G. Lambright, and S. G. Boxer, in preparation).
We find in this study that the nonexponential kinetics observed for all the mutants can be accounted for by a relaxation process that alters the rebinding barrier as a function of time (Steinbach et al., 1991; Petrich et al., 1991). Fits to such a model are compared with a more empirical approach using a stretched exponential function. A global approach that simultaneously analyzes all thedata on a particular mutant is presented. This approach greatly simplifies the analysis and interpretation of the results. This allows barrier heights and prefactors to be extracted and compared in order to define the role of each residue in the mechanism of ligand binding.
MATERIALS AND METHODS
Protein Preparation. The proteins used in this study were based on a site-specific mutation C110A which was made for ease in purification. This protein, hereafter referred to as wile type (WT), is used as the reference protein for all mutagenesis experiments. The other mutants wereconstructed by site-specific oligonucleotide-directed mutagenesis at po- sitions 45, 60, and 68 in the amino acid sequence of human myoglobin. The residues at these positions in WT human Mb are Lys 45, Asp 60, and Val 68. The corresponding positions in SW Mb are occupied by the same residues, except at position 45, where an arginine residue is presented. The X-ray crystal structure of WT human M b is not yet available, but that of the mutant K45R has been obtained at high resolution (Hubbard et al., 1990; since refined to 1.6 A, Hubbard et al., in preparation) and has been found to be very similar to that of sperm whale Mb. The preparation and purification of human Mb mutants is described in detail elsewhere (Lam- bright et al., 1989; Varadarajan et al., 1985, 1989).
Sample Preparation. Concentrated stock solutions of the proteins (1-5 mM) were prepared in 0.1 M potassium phosphate buffer, pH 7.0. Solutions of 75% (w/w) glycerol- water were deoxygenated and equilibrated with C O by stirring under 1 atm of pure CO (or under 1 atm of 5% CO in Ar for certain experiments). Sodium dithionite was added to the glycerol solution in a sealed cuvette, and 2-5 pL of the protein stock was injected. The amounts of protein added were adjusted to give a final OD423 of -0.6. The extinction coefficients for the various forms of Mb used were obtained from published sources (Antonini & Brunori, 1971) and are assumed to be identical for all mutants, except for those
Biochemistry, Vol. 32, No. 9, 1993 2203
measured in our laboratory (Varadarajan et al., 1989). The recombination of C O from solvent is a bimolecular reaction, so CO solubilities in glycerol-water solutions are required; these were obtained at 298 K from the data of Ackerman and Berger (1963). The Bunsen coefficients for C O in glycerol- water solutions are not available. As our samples are prepared by equilibrating with CO at 298 K and are subsequently sealed in the cuvettes, we assume that the CO concentrations do not change appreciably with temperature.
Temperature Conrrol. The samples were held in l-cm- path-length quartz cuvettes in a programmable Peltier effect temperature controller constructed following the design of Marden et al. (1989). This consists of two thermoelectric heat pumps (modules CP5-3 1-06L and CP2.8-32-06L; Melcor Corp., Trenton, NJ) cascaded in parallel and powered by a high current power supply. To one face is attached an A1 cuvette holder and to the other is attached an A1 block through which coolant is circulated from a refrigerated bath. This setup is capable of varying the temperature of a liquid sample rapidly and efficiently in the range 220-350 K with an accuracy of fO. l K.
Flash Photolysis. Our apparatus is described in detail in Lambright et al. (1991). Briefly, the MbCO samples were excited with a 8-11s FWHM pulse from a Q-switched Nd: YAG laser. The absorption changes were monitored by a continuous, weak probe beam from a xenon lamp passed through a monochromator. The probe wavelength ws 440 nm, and the monochromator bandwidth was 4.5 nm. A 200- MHz photodiode and detector constructed in this laboratory were used to amplify the signals. The signals were digitized on a dual time base by a Tektronix DSA602 oscilloscope. Each of the kinetic traces shown in the figures is an average of 4096 scans, and either 9216 or 10240 time points were collected per decay. The transmission data so obtained were converted to absorbance and normalized to the maximum absorbance difference. Zero time was taken to correspond to the maximum of the absorbance difference. The data sets were then compressed logarithmically to 256 points without averaging to avoid possible smoothing artifacts.
Polarization Measurements. Because the exciting laser pulse is polarized, there are changes in the monitored absorption that are due to a photoselection effect. This shows up as an additional decay process in the absorption changes being monitored, and it can become quite important in viscous solutions where the rotation of Mb is on the same time scale as the recombination of CO. In order to correct for this, the transient absorbance was monitored with a probe beam that was polarized alternately parallel and perpendicular to the excitation beam. At each temperature and in each solvent, the decay of the initial anisotropy at 440 nm, given by
was obtained from these data and was found to follow single- exponential kinetics with a maximum initial anisotropy of 0.055 under our experimental conditions. The rate constants so obtained are linear in q / T over the entire range of viscosity and temperature. The data obtained with a probe beam from the monochromator without a polarizer could then be corrected by
and were found to give good agreement with the isotropic

2204
average calculated as
Biochemistry, Vol, 32, No. 9, 1993
AAi,,(t> = (1 /3 ) [u l l ( t ) + 2 U 1 ( t ) l (3) The slight polarization of the probe induced by the grating in the monochromator can be neglected. All data were corrected this way, and the corrected data are henceforth referred to as AA(t).
Data Analysis. While it is known that the quantum yield for the photodissociation of MbCO is 1 (Petrich et al., 1988), it is possible that some recombination of CO occurs during the course of the 8-ns excitation pulse. A number of observations lead us to believe that these effects are small. (i) No picosecond process attributable to geminate rebinding has been observed for SW MbCO from a few ps up to about 9 ns (Cornelius et al., 1981; Reynolds et al., 1982; Martin et al., 1983; Janes et al., 1988). It is expected that W T human M b will behave similarly, and while this is not certain for some of the mutants, they are not expected to be greatly different, as was found for mutants of S W Mb (Carver et al., 1990). (ii) The observed AA/A a t 440 nm for all the mutants in this study are similar to within *5% for the same excitation fluence, which would not be expected to be the case if some of them had a significant picosecond process. Furthermore, the observed AA does not vary significantly as a function of temperature. Accordingly, no deconvolution has been at- tempted to extract information on processes occurring on the time scale of the excitation pulse width.
The data were analyzed by nonlinear least-squares mini- mization of the x2 defined as
x 2 = wyi -y(xi))2/u; (4) where the xi and yi are the experimental points and y(xi ) are the values of the model function a t xi. As the standard deviation of each point ui was quite low, a better estimate of ui was obtained by fitting the data to a sum of exponentials and adjusting ui so that the reduced x2, defined as x 2 / v , where v is the number of degrees of freedom (number of data points - number of fitted parameters) was one. For model I, the analysis was carried out using the Marquardt algorithm (Press et al., 1989); the reduced X2 were usually between 0.95 and 1.3, and the errors in the parameters were obtained from the covariance matrix. The errors were found to be similar for all the mutants and are quoted in the footnotes to Table I.
In the case of model 11, the fitting was carried out using the Simplex algorithm (Press et al., 1989) and the errors were estimated a t the 68.3% (1 a) confidence level as follows: each of the parameters in turn was fixed a t 5, 10, 15, 20, and 30% deviation from its best-fit value, and the other parameters were then minimized. The change in reduced x 2 was noted. Thevalue of the change in the reduced x2, Ax2, corresponding to this confidence interval for one degree of freedom is 1 .OO (Bevington & Robinson, 1992), and the percentage change in each parameter a t this contour level was obtained. The maximum errors (obtained for V68I) were A21, 4~20%; Hi,
*lo%; A32, 4Z15%; and H32, &lo%. The errors for W T and the surface mutants were generally about 5% lower than these values. These errors are fairly large and are the result of strong correlations between some of the parameters in the multiparameter global analysis, particularly the prefactors. Thus, fixing one or more of the prefactors a t the best-fit values led to a considerable decrease in the estimated errors of the other parameters. An independent estimate of some of the parameters could be obtained from Arrhenius plots of the rate constants from model I; these were usually quite similar
*20%; Hf, A15%; Ak, f25%; ffk, *15%; A23, &15%; H23,
Balasubramanian et al.
0.81
$ 1 0 . 2 1
n n -
- 1 4
1 K45R - Data -- Model
4 -1 , , 1 1 , , , , 1 , , , , , 1 , 1 , , d , , , , , , , , I , , , , , , , I , , , ,
IO-* IO-' IO-(' IO IO? IO-^ TlhlE (recond?)
FIGURE 1: Transient absorbance at 440 nm following photodisso- ciation of human K45R MbCO. The solvent is 75% glycerol- phosphate, pH 7, and each curve represents the recombination kinetics at one temperature. The range of temperatures is 240-340 K in increments of 10 deg. Each curve is the average of 4096 scans and contains 256 points. Note that a log scale is used for the x-axis as the data cover several orders of magnitude in time, but a linear scale has been retained for the y-axis. The solid lines are the data, and the broken lines are fits to a stretched exponential plus a sum of exponentials (model I, see Discussion for details). - I ' 8 8 , , , , , , , "-
I , O F
0.81
O ' I 0.4
n nC
i
i
" " I , , , , , / , , I , , , , , , , , I , , , , , , , , , , , , , , , I , , , , , , , , I , , , , , ,
IO-* IO-^ IO-(' IO l o 4 IO-^ TIME (seconds)
FIGURE 2: Kinetics of recombination of CO to the human WT Mb. The broken lines are fits to the stretched exponential model, Model I, given by eq 9 at each temperature (see Discussion).
to those obtained from the global analysis.
RESULTS
A set of kinetic curves for CO recombination to human K45R Mb a t 10-deg intervals in the range 250-340 K in 75% glycerol-water a t p H 7 is shown in Figure 1. As the kinetics extend over many orders of magnitude in time, the data have been plotted on a log scale in time as suggested by Frauenfelder andco-workers (Austin et al., 1975). The absorption changes are clearly multiphasic a t all temperatures, as observed for S W MbCO by a number of groups (Austin et al., 1975; Henry et al., 1983; Cornelius et al., 1981). The kinetics a t temperatures below 290 K show three distinct phases: an initial nonexponential phase followed by twoexponential phases. The second process appears to have a strong temperature dependence, varying by 2 orders of magnitude between 250 and 280 K. At higher temperatures this process is not well resolved, and the curves appear to be biphasic. Roughly the same behavior is seen for other proteins in this study. For example, the kinetics of CO recombination to human W T Mb and the mutant V68A are shown in Figures 2 and 3, respectively. The same scale has been retained for Figures 1-3 to facilitate comparison. Even though the
CO Recombination to Human Myoglobin Mutants
0.6
3 - 0.4
Biochemistry, Vol. 32, No. 9, 1993 2205
I 8 " " " ' 1 " '"*'I 4
-
-
0.8
o,21 n n
V68A - Data --- Model
1 Y . V
I , , , , , , , , I , , , , , , , , I , , , ,,,,,I , , , , 1 1 1 1 1 8 i l l l l l l l I , , ,
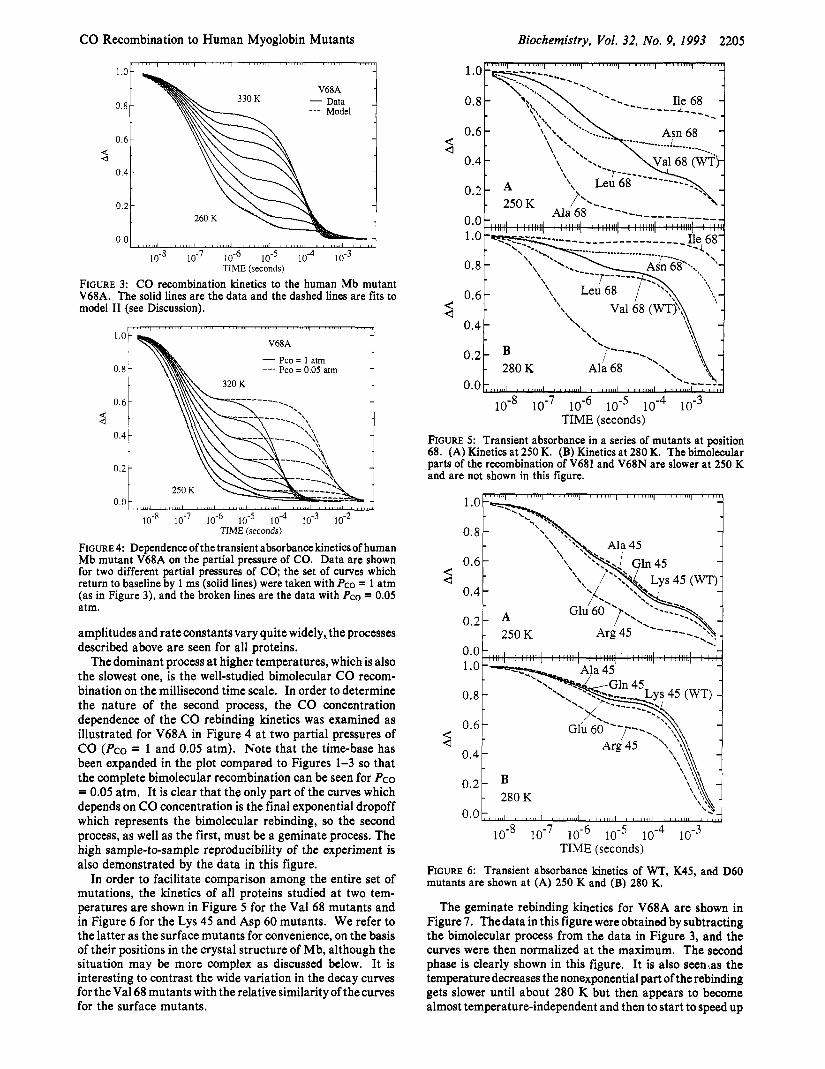
TIME (seconds) FIGURE 3: CO recombination kinetics to the human Mb mutant V68A. The solid lines are the data and the dashed lines are fits to model I1 (see Discussion).
I ' ' ' " ' ' ~ ' " " " ' ~ ' " ' ' ' ' ' 1 ' " ' ' ' ' ' ( ' " " " ' ~ " / " " ' ( ' " ' ' ' ' ' 1 ' " " Y
t 0.81
";c n n
V68A - Pco = 1 atm
Pco = 0.05 atm
V68A - Pco = 1 atm
Pco = 0.05 atm
"." I , , , , , , , , I , I , , , , , , I , ,,,,,,,I , , , , , , , , I , , , , 1 , 1 , 1 , , 11,11 ,1 *d
TIME (seconds)
FIGURE 4: Dependence of the transient absorbance kineticsof human Mb mutant V68A on the partial pressure of CO. Data are shown for two different partial pressures of CO; the set of curves which return to baseline by 1 ms (solid lines) were taken with PCO = 1 atm (as in Figure 3), and the broken lines are the data with PCO = 0.05 atm.
amplitudes and rate constants vary quite widely, the processes described above are seen for all proteins.
The dominant process a t higher temperatures, which is also the slowest one, is the well-studied bimolecular CO recom- bination on the millisecond time scale. In order to determine the nature of the second process, the CO concentration dependence of the CO rebinding kinetics was examined as illustrated for V68A in Figure 4 at two partial pressures of CO (Pco = 1 and 0.05 atm). Note that the time-base has been expanded in the plot compared to Figures 1-3 so that the complete bimolecular recombination can be seen for PCO = 0.05 atm. It is clear that the only part of the curves which depends on CO concentration is the final exponential dropoff which represents the bimolecular rebinding, so the second process, as well as the first, must be a geminate process. The high sample-to-sample reproducibility of the experiment is also demonstrated by the data in this figure.
In order to facilitate comparison among the entire set of mutations, the kinetics of all proteins studied at two tem- peratures are shown in Figure 5 for the Val 68 mutants and in Figure 6 for the Lys 45 and Asp 60 mutants. We refer to the latter as the surface mutants for convenience, on the basis of their positions in the crystal structure of Mb, although the situation may be more complex as discussed below. It is interesting to contrast the wide variation in the decay curves for the Val 68 mutants with the relative similarity of the curves for the surface mutants.
0.4
0.2
0.0
---_ Ala 68 ',,
10-8 10-6 IO-^ TIME (seconds)
FIGURE 5: Transient absorbance in a series of mutants at position 68. (A) Kinetics at 250 K. (B) Kinetics at 280 K. The bimolecular parts of the recombination of V68I and V68N are slower at 250 K and are not shown in this figure.
0.4 1
'\A 280 K 0.0 , , , , , , / , , , , , , , , I , , , ,,,,,, , , , , , , , , 1 , , , , , ( , , I , , , , , , , , 1 , , ,
IO-* IO-^ 10-6 10-5 IO-^ 10-3 TIME (seconds)
FIGURE 6: Transient absorbance kinetics of WT, K45, and D60 mutants are shown at (A) 250 K and (B) 280 K.
The geminate rebinding kinetics for V68A are shown in Figure 7. Thedata in this figure were obtained by subtracting the bimolecular process from the data in Figure 3, and the curves were then normalized at the maximum. The second phase is clearly shown in this figure. It is also seenras the temperature decreases the nonexponential part of the rebinding gets slower until about 280 K but then appears to become almost temperature-independent and then to start to speed up

2206 Biochemistry, Vol. 32, No. 9, 1993 Balasubramanian et al.
1 - 250K 260K
0 320 K
0 280K 0 300 K 1 G
a t 1 0.4}
I \\\ i 0.2 I \\\
I I , . I I
10-8 1 o - ~ 10-6 1 o - ~ 1 o-' TIME (seconds)
FIGURE 7 : Geminate part of the CO recombination curve for the mutant V68A. This was generated by taking the data from Figure 3 and subtracting the bimolecular process. The solid lines are fits to the time-dependent barrier model, model I1 (eq 14). See text for details.
again as the temperature decreases further. Similar behavior has been observed a t lower temperatures for S W Mb as the temperature is increased above the glass transition of the solvent (Steinbach et al., 1991). The second phase does not show this behavior and appears to slow down monotonically with decreasing temperature.
ANALYSIS AND DISCUSSION
I . Qualitative Features. The results yield some immediate observations regarding the effects of the structural pertur- bations on the kinetics of ligand recombination. A striking aspect of the results is the wide variation in the amplitude of the geminate phase with mutant and with temperature (Figures 5 and 6). The end of thegeminate phase occurs approximately where the decay curve first levels off; the exponential falloff after this phase represents the bimolecular recombination. The bimolecular phase has been truncated in both figures so as to expand the geminate curve. The observed geminate amplitude is about 95% for V68A at 250 K, while it is only -20% for V68I a t the same temperature. Interestingly, the recombination rate and the geminate amplitude increase as the residue a t position 68 becomes smaller in the order Ile > Val (WT) > Ala. A surprising result is that leucine, which has the same volume as isoleucine, displays very different kinetic behavior, having a much faster geminate rate and a larger geminate amplitude. Roughly the same trends are seen a t the higher temperature, but clearly the dependencies on temperature are quite different. Also note that at 280 K the bimolecular amplitudes of all the mutants are more than twice as large as the corresponding amplitudes a t 250 K.
The situation is quite different with the surface mutants at positions 45 and 60 (Figure 6). The recombination curves of all these mutants are very similar, with the notable exception of K45R. I t is known from X-ray crystallography that the residue a t position 45 in S W M b (Arg) (Kuriyan et al., 1986) as well as in the human M b mutant K45R (Hubbard et al., 1990) is involved in a salt-bridge interaction with Asp 60 and a heme proprionate. The involvement of this salt bridge in modulating ligand access to the heme pocket has been extensively debated (Nobbs, 1966; Case & Karplus, 1979; Ringe et al., 1984; Lecomte & LaMar, 1985; Kottalam & Case, 1988; Lambright et al., 1989; Westrick et al, 1990;
Carver et al., 1991). The substitutions Lys - Ala or Gln do not appreciably perturb the kinetics, but the Lys - Arg mutation appears to increase both the geminate rate and the geminate yield in comparison to WT. This is unexpected because in sperm whale Mb, which also has an arginine a t position 45, the geminate rate and amplitude are lower than those in W T human Mb. There does appear to be a small but definite trend in the geminate amplitudes a t both temperatures shown: Ala 45 - Gln 45 C Lys 45 C Arg 45. Note that while this is roughly the order of increasing residue size a t this position, the largest change occurs on going from Lys to Arg. At both temperatures shown, as well as a t the others we have measured (data not shown), D60E falls between W T and Arg 45, indicating that polarity may play a role, but this effect is small.
2. Three-State Model f o r Ligand Recombination. In order to make sense of the data presented above, one needs a model that is flexible enough to fit a wide variety of kinetic curves. A specific example is the three-state model (Alberding et al., 1976; Henry et al., 1983) that we used earlier to describe the rebinding of C O to human Mb in aqueous solution (Lambright et al., 1989):
k12 k 2 3 MbCO = M b C O Mb + CO ( 5 )
~ 3 2 3 2
k2l 1
State 1 is bound MbCO, state 2 is a geminate state or states from which the CO recombines without exchanging with free CO in solution, and state 3 is the equilibrium deoxy state. This model postulates two barriers to rebinding of C O a t the heme iron: an inner barrier which is a combination of electronic and steric factors, and an outer barrier to the passage of the ligand in and out of the protein. Assuming a steady-state population of the geminate state, the microscopic rates can be related to observations as
Henry et al. (1983) demonstrated that the geminate process for S W M b in aqueous solution a t 295 K could be fit well with the assumption that all the rates were exponential. In this case, the observed M ( t ) is given by the expression
u ( t ) = @gem exP(-k,,,t) + ( 1 - @gem) exp(-k,,t) (7) The geminate yield in S W Mb at 298 K is only 4%, and it was difficult to analyze further. While the geminate yield in K45R or W T is similar in aqueous buffer a t 300 K, in glycerol- water solution a t low temperatures, the geminate yield is as much as 90%, and the geminate process is clearly nonexpo- nential. This is true for some of the other mutants even a t high temperatures. Thus, we need a suitable description of the geminate kinetics that incorporates these features.
3. Nonexponential Kinetics: Background. There is con- siderable evidence that the cleavage of the iron-ligand bond in Mb is followed by a series of protein motions on time scales ranging from picoseconds to nanoseconds a t high temperatures (Petrich et al., 1991; Genberg et al., 1991; Xie & Simon, 1991; Lambright et al., 1991). While the observations in M b are relatively recent, such motions following photolysis have been noted in H b for a number of years (Friedman et al., 1983; Scott & Friedman, 1984); these authors established the

C O Recombination to Human Myoglobin Mutants
Table I: Fits of CO Recombination Data to Model I
Biochemistry, Vol. 32, No. 9, 1993 2201
protein amplitude, A I rate, kl (X10-6 s-') exponent, a amplitude, A2 rate, k~ (X104 s-I) amplitude, A3 rate, k3 (s-')
A. Fits of Data to Model I at 260 K O
WT 0.26 2.33 0.64 0.23 6.87 0.5 1 42 1 K45A 0.25 2.41 0.64 0.22 6.02 0.53 38 1 K45Q 0.26 2.08 0.71 0.22 6.41 0.53 374 D60E 0.29 2.16 0.65 0.26 6.94 0.45 460 K45R 0.49 3.06 0.69 0.24 8.47 0.28 593 V68A 0.80 6.07 0.72 0.16 16.5 0.06 1450 V68N 0.29 4.57 0.59 0.04 5.28 0.67 52.7 V68L 0.60 3.97 0.43 O.OOb 0.00 0.45 404 V68I 0.16 0.64 0.52 O.OOb 0.00 0.85 23.3
WT 0.06 6.35 0.80 0.09 78.9 0.85 868 K45A 0.05 5.00 0.87 0.07 71.4 0.87 766 K45Q 0.07 5.22 0.78 0.07 66.8 0.86 748 D60E 0.08 5.81 0.76 0.10 72.2 0.82 967 K45R 0.14 9.70 0.73 0.14 82.3 0.72 1460 V68A 0.39 11.9 0.83 0.25 1 IO 0.37 6270 V68N 0.08 9.62 0.52 0.01 1.34 0.92 140 V68L 0.18 7.80 0.72 O.OOb 0.00 0.82 1020 V68I 0.03 3.83 1 .o O.OOb 0.00 0.98 44.1
B. Fits of Data to Model I at 290 Kc
Parameters are defined in eq 9 under model I. Errors are obtained from the covariance matrix and were less than +3%, with the exceptions of k2 (V68N) and A3 (V68A) which were i 9 % and i 7 % , respectively. Amplitudes smaller than 0.01 were set to zero. Parameters are defined in eq 9 under model I. Errors are obtained from the covariance matrix and were less than +20% for the geminate parameters and less than 3% for the bimolecular parameters.
connection experimentally between tertiary relaxation, as monitored by the Fe-proximal His stretching frequency and the barrier to ligand recombination. Such processes make the recombination kinetics dependent upon the dynamics of tertiary relaxation and conformer interconversion; thus, nonexponential recombination kinetics in such situations can arise from several factors such as a structural inhomogeneity in the ensemble of reactive molecules that gives rise to a noninterconverting distribution of barrier heights after pho- tolysis, or, even if the interconversion is fast, there could be a relaxation process that is triggered by the bond cleavage and changes the barrier to rebinding as a function of time, as the protein structure changes from the ligand-bound state to the deoxy state.2 In either case, some modification of the simple three-state scheme (eq 5 ) is required. The following scheme helps to clarify the ensuing discussion:
f Mb*C01
M Y 0 = 1 1 Mb + CO (8) 3 Mb-CO
2
In this scheme, Mb*CO represents the state@) formed immediately after the flash with the C O still within the protein matrix. The intermediate 2 in the scheme above is no longer a single state; it is either (i) a static inhomogeneous distribution of states with the distribution of rebinding barrier heights g(H) leading to a distribution of rebinding rates k21 [g(H)] or (ii) a dynamic state in which the barrier to rebinding changes as a function of time, written as H(t) . The rebinding rate is written as k2l(H,t) to signify these possibilities. In either case, Mb-CO represents the equilibrated, relaxed state that
This issue arises in many problems in chemical dynamics. Approaches to resolving this issue have been recently examined in the analysis of time-resolved fluorescence from organic dyes in polar solvents (Maroncelli & Fleming, 1987; Nagarajan et al., 1987; Agmon, 1990; Maroncelli et al., 1991), where it was concluded that while the static inhomogeneity was indeed important at low temperatures, at higher temperatures the data could be accounted for by solvent relaxation around the dipolar excited state.
is formed on a time scale microseconds after the initial photodissociation. C O then escapes from state 2 to recombine from solvent; this has been assumed to occur when the states have equilibrated among themselves in picture (i) or after the protein is fully relaxed in picture (ii) (Steinbach et al., 1991).
This situation has been examined in great detail in glycerol- water glasses below 180 K, where the C O is trapped within the protein matrix after photolysis (Ansari et al., 1985,1986; Srajer et al., 1986), and, consequently, the equilibrium deoxy state 3 is not accessible. In this case, the available evidence suggests that relaxation and interconversion among protein substates are slow on the time scale of the rebinding of the ligand, as evidenced by the observation of kinetic hole burning [Campbell et al., (1987); Ansari et al. (1989, reinterpreted in Agmon (1988); Agmon (1990); Steinbach et al., (1991); Srajer & Champion, (1991)]. Above the glass transition temperature (-200 K), the substates can interconvert and a relaxation process that takes the protein from theinitial MbCO structure into the equilibrium deoxy structure can also occur, thereby altering the barrier to ligand recombination as a function of time after photolysis. The existence of such a relaxation process a t temperatures up to 220 K is indicated by (i) a slowing down of the rebinding as the temperature increases (Steinbach et al., 1991), (ii) theobservationof band shifts under continuous illumination (Nienhaus et al., 1992), and (iii) the observation of shifts in Raman bands as a function of time and temperature (Ahmed et al., 1991). There are less data addressing these issues a t temperatures above 220 K. It appears that the low temperature relaxation of certain Raman modes seen by Ahmed et al. (1991) are too fast (<30 ps; Findsen et al., 1985) to contribute to the relaxation processes seen on the nanosecond time scale. The existence of multiple conformations of MbCO at room temperature was shown by the presence of four slightly differing bands in the CO stretch region of the infrared spectrum (Makinen et al., 1979; Caughey et al., 198 l ) , but only one time-averaged conformer was seen for bound C O by 13C N M R (La Mar et al., 1978). Time- resolved measurements of the C O stretch band of the conformer at 1966 cm-l reveal a loss of population between 0.1 ms and 1 ms at 250 K (Young et al., 1991). This gives

2208 Biochemistry, Vol. 32, No. 9, 1993 Balasubramanian et al.
7 - K45R V68A
an idea of the time scale of this interconversion; however, it is not clear if this process and the kinetics probed in the Soret region correspond to each other.3 Moreover, the kinetics for each conformer detected in the IR also appear to be nonexponential (Young et al., 1991), indicating that a t least part of the nonexponentiality stems from other sources. We have found that at pH 7, human W T MbCO and many of its mutants exhibit only one major IR conformer (S. Balasubra- manian, D. G. Lambright, and S. G. Boxer, in preparation) and yet the kinetics are distinctly nonexponential.
More direct evidence for spectral relaxation in the Soret region a t high temperatures was obtained in this laboratory (Lambright et al., 1991) and in others (Tian et al., 1992; Ansari et al., 1992). The data in Figure 7 also show an inversion in the geminate rebinding rates as the temperature is lowered, also suggestive of a relaxation effect. The kinetics probed in the Soret region were also used recently to examine the question of relaxation at higher temperatures by a double- pulse experiment (Tian et al., 1992). These authors dem- onstrated that at pH 7 the kinetics of thesubpopulationselected by the second pulse resembled that of the full population, which argues for complete fluctuational averaging within the subpopulation; the small difference between the two curves increased when the pH was lowered to 5. This was attributed to changes in populations of the conformers revealed in the IR, suggesting that interconversion between these conformers occurs on a slower time scale than the fluctuational averaging within each conformer. This was supported by the finding that the nonexponential parts of the kinetics were always similar when rescaled. The formation of an exponential phase in the geminate rebinding would then indicate that both the interconversion and the end of the relaxation were complete. Such an exponential phase is well resolved in our data after a few microseconds following the flash (Figures 1-3). The data in Figure 4 clearly show that this phase is still a geminate process.
Thus, the question of relaxation vs a static distribution at these temperatures, as well as the role of the IR conformers in the Soret kinetics, is not yet settled even for S W or human W T Mb. The introduction of a large array of site-specific mutants adds another dimension. In this paper, we are concerned primarily with the differences in kinetics between the mutants examined; however, in order to make quantitative comparisons, we need to fit the data to a simple model that works for all the proteins, so that the parameters can be meaningfully compared. In the following, we address these issues by considering two different models: model I, in which the nonexponential phase is fit to an empirical function without major assumptions regarding the molecular nature of the process; and model 11, in which we suggest that the relaxation model is sufficiently general to accomodate all the data from these mutants in the high temperature range.
4 . Nonexponential Kinetics: Model I . In order to explain the nonexponential geminate kinetics, a model with more complexity than a single inner barrier is needed. An empirical approach that has been tested extensively is to fit the nonexponential process to a function f(t) and use the inverse
V68I does show a small increase in absorbance at 440 nm at about 1 s s at temperatures above 290 K. The relative amplitude of this process is -0.01 and is barely visible a t 280 K (Figure 5 ) but becomes more visible, but not much larger, a t higher temperatures where there is very little rebinding. A similar effect has been noted in H b (Alpert et al., 1979). Since the CO-bound population is very small on this time scale, this is probably due to some other conformational change in the deoxy form of this mutant; here, we note that this effect clearly indicates dynamic processes on this time scale.
3.4 3.6 3.8 4.0 1 ooo/T
FIGURE 8: Rate constants obtained from fits to model I such as those in Figures 1-3 and listed in Table I plotted against 1000/T(K-') for K45R and V68A. Units a r e s-' for k23 and kzl and s-l M-' for k32. The solid lines a r e best fits to the da ta .
Laplace transform to obtain a distribution of activation enthalpies, assuming Arrhenius behavior of the rates. f(t) can be a power law (1 + kot)-a (Austin et al., 1975; Ansari et al., 1986, and references therein), or the Kohlrausch- Williams-Watt (KWW) function, exp[-(kot)"], also called a stretched exponential (Plonka, 1988; Plonka et al., 1988; Steinbach et al., 1991). Here, ko is a characteristic rate and a! is a parameter, 0 C cy C 1. This function has been used to analyze a variety of experimental data in the condensed state (Williams & Watts, 1970; Alvarez et al., 1991) and can be regarded as a superposition of independent simple exponential processes (Klafter & Blumen, 1984). The underlying dis- tribution of rates can be obtained by an inverse Laplace transform of the exp[- (k~t )~] , either analytically for certain values of a! (Helfand, 1983) or numerically otherwise (Lindsay & Patterson, 1980; Kauffman et al., 1990; Alvarez et al., 1991). Both functions provide good fits to our data; however, the stretched exponential form yields lower x2 values. We have obtained excellent fits at all temperatures, as shown in Figures 1-3 using a stretched exponential for the earliest component, and two single exponentials for the later com- ponents, as follows:
AA(t) = A , exp[-(k,t)"] + A, exp(-k,t) + A, exp(-k3t)
The parameters from these fits for all the mutants at two temperatures are given in Table I. The fits from model I above yield estimates of the rates k23 and k32 in eqs 6, with the assumptions that the second exponential rate kZ (when clearly resolved) corresponds to kgem, and k3 corresponds to ken. The resulting rate constants show good adherence to the Arrhenius equation, as shown in Figure 8 for K45R and V68A.
5. Nonexponential Kinetics: Model II. Model I1 is a time- dependent barrier model, similar to models described in detail elsewhere (Steinbach et al., 1991; Petrich et al., 1991). We briefly present the salient features and extend it to include escape and bimolecular rebinding together with a few simplifying assumptions based on the discussion in Section 3. This model postulates that the barrier to rebinding increasesas a function of time as the protein relaxes toward the equilibrium deoxy state. This can be written as
(9)
H(t,T) = Hf + (Hi - H,) +(t,T) (10) where Hi is the initial rebinding barrier, Hf is the final barrier in the relaxed protein, and +(t,T) is a relaxation function that was assumed to be a stretched exponential in Steinbach, et

CO Recombination to Human Myoglobin Mutants
al. (1991):
dJ(t,T) = exP{-[K(T)r18) (1 1) In fitting our data, /3 is always close to 1, so we set ,6 = 1, which results in an exponential form for dJ(t,T). The relaxation rate K(T) is given by the Arrhenius relation
K(T) = A, exp(-H,/RT) (12) where A, and H, are the prefactor and barrier height, respectively, for the relaxation. The expression for the rebinding rate k2l[H(t,T),Tl is then
k21[H(t,T),Tl = A,, exp[-H(t,T)/RTl (13)
AA(t,T) = exp[-Sk2,W(t,T),T) dtl (14)
and the absorption change due to this process becomes
To incorporate this result into the three state model, the time integralJk21[H(t,T),Tl dtissubstitutedfor kzlt ineq7.Then, by writing the expressions for the other rate constants in terms of Arrhenius parameters
k23 = exp(-H23/RT)
eq 7 becomes
AA(t) = age,,, exp[-Sk2,[H(t,T),Tl dt - k2,tl +
where age,,, and k,, are given by eq 6 in terms of the microscopic rates.
The transient absorbance data over the temperature range of interest were simultaneously fit to eq 16. The fits for the mutants K45A and V68L, together with the global fit (dotted lines), are shown in Figure 9. The model reproduces the data well over the 260-320 K time range. This is quite remarkable, considering the complexity of the data and the wide variation in the kinetic behavior exhibited by this set of mutants, particularly those at position 68. The geminate data could also fit separately with eq 14, as shown by the lines in figure 7 for V68A; however, to generate these fits the final barrier was allowed to vary a t each temperature. This is because the escape rate (with a very different temperature dependence) dominates the AA near the end of the geminate phase and must be taken into account. The rates k23 and k32 obtained from these fits show similar trends to those obtained from the stretched exponential fits using the three-state model. This supports the conclusion that whatever process is responsible for the early nonexponential kinetics, the processes following these are well described by a simple threes ta te model. We note that the model presented here does not deal explicitly with the viscosity dependence of the rate constants. I t has been noted that separation of the temperature dependence of the solvent from that of the proteins can lead to smaller enthalpies and prefactors (Beece et al., 1980). We are currently examining the kinetics for all the mutants as a function of solvent viscosity. Preliminary results indicate that in this model the escape rate is the most sensitive to solvent viscosity. However, the viscosity dependence of each rate constant does not vary greatly in the mutants examined so far, and thus for the purposes of this paper we can meaningfully compare the differences in the barrier heights between them.
The parameters from these global fits for all the mutants in this study are presented in Table 11. In what follows, we
(1 - @gem) exP(-kJ) (16)
Biochemistry, Vol. 32, No. 9, 1993 2209
0.8 la0l 0.4 O * I
0.21 t A
I
10-8 IO-^ IO-^ IO-^ IO-^ IO-^ TIME (seconds)
FIGURE 9: Global fits to the time-dependent barrier model, model 11, are shown in the temperature range 260-310 K for the mutants K45A in panel A and V68L in panel B. The solid lines are the data, and the dashed lines are the fits. The parameters from such fits for all the proteins studied are displayed in Table 11.
analyze the results, first for the geminate parameters, and then for the outer barrier parameters.
6. Interpretation: Inner Barrier. For all the proteins, the exponent a! increases with temperature. For WT, it changes from 0.49 a t 240 K to 1 above 300 K. Since the exponent in the KWW function is a measure of the width of the underlying distribution of rates (Lindsay & Patterson, 1980; Kauffman et al., 1990), this indicates that thedistributionof rates narrows as temperature increases. Table I shows that a! for the surface mutants is similar to that for W T at a given temperature but is always smaller for the V68 mutants, with the exception of V68A, where a! is larger. This indicates that a larger residue a t position 68 is correlated with a broader distribution of rates. This is also shown by the relative amplitude of the exponential geminate phase (A2 in Table I). This is very small for V68I and V68L. This phase is also small in S W Mb and was attributed to slow equilibrium fluctuations (EF1) among the different conformations present by Frauenfelder and co- workers (Steinbach et al., 1991). We emphasize that a similar result could arise from a slow relaxation process, with a competing escape rate. In any case, the above trends in our site-specific mutants clearly indicate that a larger residue at 68 significantly slows the formation of a relaxed, equilibrated protein. This agrees with recent results on the time evolution of the deoxy Soret band shape for some of these mutants (D.G. Lambright, S. Balasubramanian, and S.G. Boxer, in preparation).
The geminate kinetics in the high temperature range are dominated by the escape rate as demonstrated in Figure 8. The cross-over from k21 to k23 shown in Figure 8 occurs between 280 K and 260 K for most of the proteins, except for V68N and V681, where it occurs at a lower temperature. This figure also shows that in this temperature range the activation enthalpy, given by the slope of the lines, is clearly larger for

2210 Biochemistry, Vol. 32, No. 9, 1993 Balasubramanian et al.
Table 11: Parameters from Global Fits to Model 11"
inner barrier relaxation barrier outer barrier
protein A21 ( s - I ) H,' HP A , ( s - ' ) H,b A23 ( S - ' ) H23' A J ~ (S-I/M-') H32b
WT K45A K45Q D60E K45R V68A V68L V68N V681
0.69 X 10'O 18.0 26.0 5.2 X 10" 28.8 8.0 X 10l6 61.3 3.00 X 1O1O 21.5 30.1 6.9 X lo1* 34.7 2.8 X I O 1 ? 64. I 4.00 x 10'0 22.3 30.7 7.6 X 10l2 35.4 3.4 x 10" 64.6 2.40 X 1O'O 21.2 28.8 7.6 X I O ' ? 34.8 1.6 X I O ' ? 63.1 1.50 X 10¹⁰ 18.8 26.6 2.5 X 10¹² 32.2 3.6 X 10" 65.3 0.38 X 1 O l o 14.5 20.5 7.6 X I O " 28.8 1.7 X l0l8 70.3 1.00 x 10'0 15.4 22.7 2.9 x 10'J 34.6 8.8 X 10l4 46.5 2.20 x 10'0 18.4 31.4 1.5 X I O ' ? 32.1 2.6 X 10l6 57.4 6.04 X IO 'O 23.7 32.0 2.9 X 1O1O 24. I 7.2 X 1O2O 77.5
1.7 x 10¹⁴ 1.9 x 10¹⁴
1.4 x 10¹⁴
4.6 x 10¹³ 1.6 x 10¹³
1.2 x 10'4 7.7 x 10lJ
8.8 X I O I 4 5.7 x 10'6
40.0 40.1 39.5 39.0 38.2 35.7 34.3 45.0 55.3
Parameters are defined under model 11 in the text. Errors in the parameters are discussed under Materials and Methods. The temperature range used for the fits was 260-310 K . Samples were equilibrated with CO at 298 K. Barrier heights are in kilojoules per mole.
k23 than for k32. Thus, there is a significant binding enthalpy for C O in the geminate state, about 15-20 kJ/mol depending on the protein. This is larger than that calculated for S W Mb (Steinbach et al., 1991); however, these authors used a non- Arrhenius temperature dependence.
It is immediately apparent that the mutants in the first half of either Table I or I1 quite closely resemble WT, and the differences become increasingly larger going down the table. While this trend is clearly obvious from a visual inspection of the data at any temperature, for instance, in Figure 5 and 6, the temperature dependence makes it possible to obtain entropies and activation energies. For instance, Figures 5 and 6 show that both K45R and V68A show faster geminate recombination than WT. Looking a t the k2l parameters in Table 11, it is seen that this occurs for different reasons: K45R, like the other surface mutants, has a larger prefactor than W T but similar barrier heights, while V68A has a similar prefactor but smaller barrier heights than WT. It is interesting that Lys or Arg at position 45 leads to the same inner barrier heights, but removal of the positive charge as in K45A and K45Q appears to result in an increase in the inner barriers by 3-4 kJ/mol.
These results indicate that the surface mutations are somehow coupled to processes in the interior of the protein. A possible mechanism for this coupling is via His 64, the distal histidine. It has been suggested (Nobbs, 1966; Case & Karplus, 1979) that one possible route for ligand escape after dissociation first requires a rotation of the valine at 68; the histidine then swings out toward the solvent, opening up an escape route. This mechanism requires that the residue a t position 45, which in these studies was arginine, move aside as well. It was proposed that this resulted in the second conformation found by X-ray crystallographic studies, where the amino groups were found to be in proximity to Phe 46 and Asp 60 (Ringe et al., 1984; Kuriyan et al., 1986). Removal of the arginine (or lysine, as in human Mb) would then appear to facilitate this motion of the distal histidine and therefore lower the barrier for rotation of the valine as well. In fact, the data on these mutants show that removal of lysine or arginine results in a consistently larger inner barrier, thus seemingly hindering this sequence of motions. It may be that removal of the positive charge destabilizes the solvent-exposed conformation of the distal histidine, thus favoring the closed conformation in which Val 68 is more restricted. The barrier for the rotation of Val 68 in myoglobin is not known, but a measure of this might be estimated by the difference in barrier heights between W T and V68A, about 4-5 kJ/mol. It must be noted that there could be other pathways of ligand escape, such as the other trajectories seen in the similations of Case and Karplus (1979). More recent simulations by Elber and Karplus (1990) suggest that there may be several pathways
with similar barrier heights; which one is actually taken may depend on small changes in temperature or structure. We have examined this scenario more carefully in a study on CO recombination to a number of mutants a t position 64 (D.G. Lambright, S . Balasubramanian, and S. G. Boxer, in prep- aration); the results do suggest that if the shortest path is blocked, as for example, by a large hydrophobic substitution, the ligand may exit by another path. However, the notion that the distal histidine couples the surface residues to the inner barrier is supported by recent experiments on double mutants in our laboratory which show that in the absence of the distal histidine surface mutations do not perturb the rebinding rate (S. Balasubramanian, D. G. Lambright, and S . G. Boxer, in preparation).
The assignment of the residue a t 68 as a major contributor to the final barrier is further supported by the remarkable difference between V68L and V68I: while the former has barriers similar to V68A, suggesting that the extra methine of the leucine increases the flexibility and lowers the rotational barrier (Tame et al. 1991), V68I has barriers that are much larger than even those of WT. This suggests that the rotational barrier may depend upon the presence of the methyl group on the @-carbon. A further contribution in the case of V68I may arise from the difference in the geometry of these residues with respect to the iron; the methyl group of the isoleucine probably extends close to the iron atom. This is consistent with the X-ray crystallographic work of Nagai and co-workers on the corresponding mutations in the a- and 0-subunits of human hemoglobin (Tame et al., 1991; Nagai et al., 1987). In the @-subunit, they found that the 6-methyl group of the isoleucine was forced to extend over the oxygen binding site, which they proposed was due to the steric hindrance provided by the methyl group on the @-carbon. They also found that the oxygen affinity of this mutant was very much reduced compared to that of WT. The side chain of the leucine mutant, however, did not extend to the oxygen binding site, and its oxygen affinity was found to be quite similar to that of WT (Nagai et al., 1987). The dramatic differences in the ligand binding properties of these two mutants in human myoglobin make it likely that the conformations of these residues in the heme pocket are similar to those of the @-subunit of human Hb. This would provide a structural basis for the arguments made above.
7 . Interpretation: Outer Barrier. The expectations from previous work, based on the model involving concerted motions of residues 64 and 45 causing a breakage of the salt bridge as described above, would have been that arginine at position 45 would increase the barrier to escape of the ligand and that alanine position 45 would decrease it, with K45Q and D60E falling somewhere in between. This is not the case as seen in Table 11, where the barrier to escape, H23, is not greatly affected

C O Recombination to Human Myoglobin Mutants
by the changes on the surface. Even the small changes observed are not consistent with this model. The barrier increases slightly in the order W T C D60E C K45R, but K45A and K45Q, rather than decreasing the barrier with respect to WT, instead increase it. To add to the complexity, the mutants at position 68 also perturb this barrier, and much more drastically; V68A has a larger barrier to escape than WT, even larger than K45R, while V68N and V68L have smaller barriers. Again, V68I is quite different from the others, having not only a large barrier but also a much larger prefactor, which appears to indicate a large volume change required for this process. Thus, there exists some strong correlation between the motions of the residue at 68 and some other residues(s) that govern the exit of the ligand from the heme pocket and presumably are closer to the surface of the protein. We note that the results presented above indicate that as the residue size at 68 increases in the order Ala C Val C Asn C Leu, the exit of the ligand is facilitated. To explain this, we resort again to the model in which the most direct exit path of the ligand involves the outward motion of the distal histidine. The results are consistent with an increased steric interaction with the distal histidine that causes the imidazole group to swing outward into solution, thus lowering the exit barrier. The anomalous behavior of V68I would suggest that in this mutant, even if the outward motion of the histidine is facilitated by the isoleucine, as suggested by comparison with the structure of the analogous j3-HbA mutant (Nagai et al., 1987), the conformation adopted by this residue may itself cause an increased escape barrier; however, there is a large increase in entropy accompanying this motion that is sufficient to drive the reaction faster than in WT. In summary, in order to interpret most of the data, we are forced to consider the concerted motion of more than one residue. Single-site mutations can only provide indirect information in the form of trends. However, these trends lead to specific predictions which can be tested by making multiple changes which allow coordinated motions. An extensive body of data from such multiple-site mutants has been collected and will be presented in a subsequent paper (S. Balasubramanian, D.G. Lambright, and S.G. Boxer, in preparation).
8. Comparison with Other Results. Some of the substi- tutions discussed here were made in S W M b by site-directed mutagenesis (Carver et al., 1990; Egeberget al., 1990). Only limited comparisons are possible because these authors studied the rebinding of ligands in water at room temperature. Under these conditions, and with the signal-to-noise of the data, it was not possible to observe the geminate recombination of C O for most of the mutants. Given these constraints, these authors concluded that there was no change in the outer kinetic barrier with the mutations at position 68, with the exception of Phe 68, which had a larger barrier, for which there was not satisfactory explanation. Carver et al. (1990) did observe that Ile 68 had a much increased inner barrier relative to native S W Mb, which is what we observe for human Mb. However, the contributions of this change to the outer barrier are very large as well (Table 11). This lends credence to our assertion that the outer barrier is linked to the residues in the interior of the protein, and while the residues at 45 and 60 do perturb this barrier somewhat, the breaking of the salt-bridge linkage does not constitute a major portion of this barrier. In the context of the model for ligand escape discussed above, it is possible that the motion of another residue, possibly the distal histidine which is in contact with both Val 68 and Lys 45 in WT, forms the major barrier to escape. While it is likely that replacement of the distal histidine by a smaller
Biochemistry, Vol. 32, No. 9, 1993 221 1
residue would decrease both the inner and outer barrier heights, the effects of other substitutions could be quite complex. Furthermore, if the mechanism discussed above is correct, removal of the histidine should effectively uncouple any changes on the protein surface from the inner barrier; this has been recently verified in our laboratory. A mutant of S W Mb, H64G, was studied by microsecond flash photolysis (Braunstein et al., 1988), and it was concluded that the inner barrier height in a frozen matrix was indeed lower than for native S W Mb. The dependence of the escape and entry rates on solvent viscosity should also be significantly less than that predicted by a Kramers-type dependence for a solvent-exposed barrier. The viscosity dependence of the rates for these mutants as well as for mutants at other positions, and the contributions of the IR conformers to these rates, will be the subjects of forthcoming publications from this laboratory.
ACKNOWLEDGMENT
We thank Roderick McCoy for performing some of the DNA work on the Lys 45 mutations and Pam Patek for the synthesis of oligonucleotides.
REFERENCES
Ackerman, E., & Berger, R. L. (1963) Biophys. J . 3,493-505. Agmon, N. (1988) Biochemistry 27, 3507-351 1. Agmon, N. (1990) J . Phys. Chem. 94, 2959-2963. Agmon, N., & Hopfield, J. J. (1983a) J. Chem. Phys. 79,2042-
2053. Agmon, N., & Hopfield, J. J. (1983b) J. Chem. Phys. 78,6947-
6959. Ahmed, A. M., Campbell, B. F., Caruso, D., Chance, M. R.,
Chavez, M. D., Courtney, S. H., Friedman, J. M., Iben, I. E. T., Ondrias, M. R., & Yang, M. (1991) Chem. Phys. 158,
Alberding, N., Austin, R., Chan, S. S., Eisenstein, L., Frauen- felder, H., Gunsalus, I. C., & Nordlund, T. M. (1986) J . Chem. Phys. 65, 4701-4711.
Alpert, B., El Mohsni, S., Lindqvist, L., & Tfibel, F. (1979) Chem. Phys. Lett. 64, 11-16.
Alvarez, F., Alegria, A., & Colmenero, J. (1991) Phys. Rev. B. (Condensed Matter) 44, 7306-7312.
Ansari, A., Berendzen, J., Bowne, S. F., Frauenfelder, H., Iben, I. E. T., Sauke, T. B., Shyamsunder, E., & Young, R. D. (1 985) Proc. Natl. Acad. Sei. U.S.A. 82, 5000-5004.
Ansari, A., DiIorio, E. E., Dlott, D. D., Frauenfelder, H., Iben, I. E. T., Langer, P., Roder, H., Sauke, T. B., & Shyamsunder, E. (1986) Biochemistry 25, 3139-3146.
Ansari, A., Jones, C. M., Henry, E. R., Hofrichter, J., & Eaton, W. A. (1992) Science 256, 1796-1798.
Antonini, E., & Brunori, M. (1 97 1) Hemoglobin and Myoglobin and their Reactions with Ligands, North-Holland Publishing Co., Amsterdam.
Austin, R. H., Beeson, K. W., Eisenstein, L., Frauenfelder, H., & Gunsalus, I. C. (1975) Biochemistry 14, 5355-5373.
Beece, D., Eisenstein, L., Frauenfelder, H., Good, D., Marden, M. C., Reinisch, L., Reynolds, A. H., Sorensen, L. B., & Yue, K. T. (1980) Biochemistry 19, 5147-5157.
Bevington, P. R., & Robinson, K. R. (1992) Data Reduction and Error Analysis for the Physical Sciences, 2nd 4, McGraw Hill, New York.
Braunstein, D., Ansari, A., Berendzen, J., Cowen, B. R., Egeberg, K. D., Frauenfelder, H., Hong, M. K., Ormos, P., Sauke, T. B., Scholl, R., Schulte, A., Sligar, S. G., Springer, B. A,, Steinbach, P. J., & Young, R. D. (1988) Proc. Natl. Acad. Sei. U.S.A. 85, 8497-8501.
Buhks, E., & Jortner, J. (1985) J . Chem. Phys. 83,4456-4462. Campbell, B. F., Chance, M. R., & Friedman, J. M. (1987)
329-35 1.
Science 238, 373-376.

2212
Carver, T. E., Rohlfs, R. J., Olson, J. S., Gibson, Q. H., Blackmore, R. J., Springer, B. A,, & Sligar, S. G. (1990) J . Biol. Chem.
Carver,T. E.,Olson, J. S.,Smerdon,S. J., Krzywda,S., Wilkinson, A. J., Gibson, Q. H., Blackmore, R. S., Ropp, J. D., & Sligar, S. G. (1991) Biochemistry 30, 4697-4705.
Case, P. A., & Karplus, M. (1979) J . Mol. Biol. 132, 343-368. Caughey, W. S., Shimada, H., Choc, M. G., & Tucker, M. P.
(1981) Proc. Natl. Acad. Sci. U.S.A. 78, 2903-2907. Chen, Y. M., & Pearlstein, A. J. (1987) Ind. Eng. Chem. Res.
26, 1670-1672. Cornelius, P. A., Steele, A. W., Chernoff, D. A., & Hochstrasser,
R. M. (1981) Proc. Natl. Acad. Sci. U.S.A. 78, 7526-7529. Cotes, N. J., & Sceats, M. G. (1987) Chem. Phys. Lett. 141,
405-410. Doster, W., Beece, D., Bowne, S. F., DiIorio, E. E., Eisenstein,
L., Frauenfelder, H., Reinisch, L., Shyamsunder, E., Win- terhalter, K. H., & Yue, K. T. (1982) Biochemistry 21,483 1- 4839.
Egeberg, K. D., Springer, B. A., Sligar, S. G., Carver, T. E., Rohlfs, R. J., & Olson, J. S. (1990) J . Biol. Chem. 265,11788- 11795.
Elber, R., & Karplus, M. (1990) J. Am. Chem. SOC. 112,9161- 9175.
Findsen, E. W., Scott, T. W., Chance, M. R., Friedman, J. M., & Ondrias, M. R. (1985) J . Am. Chem. SOC. 107,3355-3357.
Friedman, J. M., Scott, T. W., Stepnoski, R. A., Ikeda, S. M., & Yonetani, T. (1983) J . Biol. Chem. 258, 10564-10572.
Genberg, L., Richard, L., McLendon, G., & Miller, R. J. D. (1991) Science 251, 105 1.
Gibson, Q. H. (1956) J . Physiol. (London) 134, 112. Helfand, E. (1983) J. Chem. Phys. 78, 1931-1934. Henry, E. R., Sommer, J. H., Hofrichter, J., & Eaton, W. A.
(1 983) J. Mol. Biol. 166, 443-45 1. Hubbard, S. R., Hendrikson, W. A., Lambright, D. G., & Boxer,
S. G. (1990) J . Mol. Biol. 213, 215-218. Janes, S. M., Dalickas, G. A., Eaton, W. A,, & Hochstrasser, R.
M. (1988) Chem. Phys. Lett. 151, 4-5. Kauffman, H. F., Landl, G., & Engl, H. W. (1 990) in Dynamical
Processes in Condensed Molecular Systems: Proceedings of the Emil Warburg Symposium, pp 90-101, World Scientific, Singapore.
Kendrew, J. C., Dickerson, R. E., Strandberg, B. E., Hart, R. G., Davies, D. R., Phillips, D. C., & Shore, V. C. (1960) Nature 185, 422.
Biochemistry, Vol. 32, No. 9, 1993
265, 20007-20020.
Klafter, J., & Blumen, A. (1984) J . Chem. Phys. 80, 875. Kottalam, J., & Case, D. A. (1988) J . Am. Chem. SOC. 110,
Kuriyan, J., Wilz, S., Karplus, M., & Petsko, G. A. (1986) J .
La Mar, G. N., Viscio, D. B., Budd, D. L., & Gersonde, K.
Lambright, D. G., Balasubramanian, S., & Boxer, S. G. (1989)
Lambright, D. G., Balasubramanian, S., & Boxer, S. G. (1991)
Lecomte, J. t. J., & LaMar, G. N. (1985) Biochemistry 24,7388-
Lindsay, C. P., & Patterson, G. D. (1980) J . Chem. Phys. 73,
Makinen, M. W., Houtchens, R. A., & Caughey, W. S. (1979)
Marden, M. C. (1982) Eur. J . Biochem. 128, 399-404.
380-387.
Mol. Biol. 192, 133-154.
(1978) Biochem. Biophys. Res. Commun. 82, 19.
J . Mol. Biol. 207, 289-299.
Chem. Phys. 158, 249-260.
7395.
3348.
Proc. Natl. Acad. Sci. U.S.A. 76, 6042-6046.
Balasubramanian et al.
Marden, M. C., Hazard, E. S., Leclerc, L., & Gibson, Q. H. (1989) Biochemistry 28, 4422-4426.
Maroncelli, M., & Fleming, G. R., (1987) J . Chem. Phys. 86, 6221.
Maroncelli, M., Fee, R. S., Chapman, C. F., & Fleming, G. R. (1991) J . Chem. Phys. 95, 1012-1014.
Martin, J. L., Migus, A., Poyart, C., Lecarpentier, Y., Astier, R., & Antonetti, A. (1983) Proc. Natl. Acad. Sci. U.S.A. 79,173- 177.
Nagai, K., Luisi, B., Shih, D., Miyazaki, G., Imai, K., Poyart, C., Young, A. D., Kwiatkowsky, L., Noble, R. W., Lin, S. H., & Yu, N. T. (1987) Nature 329, 858-860.
Nagarajan, V., Brearley, A. M., Kang, T. J., & Barbara, P. F. (1987) J. Chem. Phys. 86, 3183.
Nienhaus, G. U., Mourant, J. R., & Frauenfelder, H. (1992) Proc. Natl. Acad. Sci. U.S.A. 89, 2902-2906.
Nobbs, C. L. (1966) in Hemes and Hemoproteins (Chance, B., Eastbrook, R. W., & Yonetani,T., Eds.) pp 143-147, Academic Press, New York.
Petrich, J. W., Poyart, C., & Martin, J. L. (1988) Biochemistry 27, 40494060.
Petrich, J. W., Lambry, J. C., Kuczera, K., Karplus, M., Poyart, C., & Martin, J. L. (1991) Biochemistry 30, 3975-3987.
Plonka, A. (1988) Chem. Phys. Lett. 151, 466-468. Plonka, A., Kroh, J., & Berlin, Y. A. (1988) Chem. Phys. Lett.
153, 433435 . Press, W. H., Flannery, B. P., Teukolsky, S. A., & Vetterling,
W. T. (1989) Numerical Recipes, Cambridgeuniversity Press, Cambridge.
Reynolds, A. H., & Renzepis, P. M. (1982) Biophys. J . 38, 15- 18.
Ringe, D., Petsko, G. A., Kerr, D., & Ortiz de Montellano, P. R. (1984) Biochemistry 23, 2-4.
Sato, F., Shiro, Y., Sakaguchi, Y., Suzuki, T., Iizuka, T., & Hayashi, H. (1990) J . Biol. Chem. 265, 2004-2010.
Scott, T. W., & Friedman, J. M. (1984) J . Am. Chem. SOC. 106,
Srajer, V., & Champion, P. M. (1991) Biochemistry 30, 7390-
Srajer, V., Schomaker, K. T., & Champion, P. M. (1986) Phys.
Srajer, V., Reinisch, L., & Champion, P. M. (1988) J . Am. Chem.
Steinbach, P. J., Ansari, A., Berendzen, J., Braunstein, D., Chu, K., Cowen, B. R., Ehrenstein, D., Frauenfelder, H., Johnson, J. B., Lamb, D. C., Luck, S., Mourant, J. R., Nienhaus, G. U., Ormos, P., Philipp, R., Xie, A., & Young, R. D. (1991) Biochemistry 30, 3988-4001.
Tame, J., Shih, D. T., Pagnier, J., Fermi,G., & Nagai, K. (1991) J . Mol. Biol. 218, 761-767.
Tian, W. D., Sage, J. T., Srajer, V., & Champion, P. M. (1992) Phys. Rev. Lett. 68, 408-41 1.
Varadarajan, R., Szabo, A., & Boxer, S. G. (1985) Proc. Natl. Acad. Sci. U.S.A. 82, 5681-5684.
Varadarajan, R., Lambright, D. G., & Boxer, S. G. (1989) Biochemistry 28, 3771-3781.
Westrick, J. A., Peters, K. S., Ropp, J. D., & Sligar, S. G. (1990) Biochemistry 29, 6741-6746.
Williams, G., & Watts, D. C. (1970) Trans. Faraday SOC. 66, 80.
Xie, X., & Simon, J. D. (1991) Biochemistry 30, 3682. Young, R. D., & Bowne, S. F. (1984) J . Chem. Phys. 81,3730-
3137. Young, R. D., Frauenfelder, H., Johnson, J. B., Lamb, D. C.,
Neinhaus, G. U., Philipp, R., & Scholl, R. (1991) Chem. Phys.
5677-5687.
7402.
Rev. Lett. 57, 1267-1270.
SOC. 11 0, 6656-6670.
158, 315-327.