Co-opted Boards - Temple University Sites · PDF fileCo-opted Boards Jeffrey L. Coles David...
46
Co-opted Boards Jeffrey L. Coles David Eccles School of Business, University of Utah Naveen D. Daniel LeBow College of Business, Drexel University Lalitha Naveen Fox School of Business, Temple University We develop two measures of board composition to investigate whether directors appointed by the CEO have allegiance to the CEO and decrease their monitoring. Co-option is the fraction of the board comprised of directors appointed after the CEO assumed office. As Co-option increases, board monitoring decreases: turnover-performance sensitivity diminishes, pay increases (without commensurate increase in pay-performance sensitivity), and investment increases. Non-Co-opted Independence—the fraction of directors who are independent and were appointed before the CEO—has more explanatory power for monitoring effectiveness than the conventional measure of board independence. Our results suggest that not all independent directors are effective monitors. (JEL G32, G34. K22) The board of directors of a corporation is meant to perform the critical functions of monitoring and advising top management (Mace 1971). Conventional wisdom holds that monitoring by the board is more effective when the board consists of majority of independent directors. The empirical evidence on the connection between board independence and firm performance, however, is mixed and weak, as is the evidence on the relation between board independence and other organizational and governance attributes, such as managerial ownership. 1 One potential reason for the paucity of consistent, significant results is that many directors are co-opted and the board is captured. In practice, CEOs are For helpful comments, the authors are grateful to an anonymous referee, Renee Adams, Christa Bouwman, Vidhi Chhaochharia, Rachel Diana, Dave Denis, Diane Denis, Ben Hermalin, Yan Li, Antonio Macias, David Maber, John McConnell, Darius Palia, Raghu Rau, David Reeb, Oleg Rytchkov, Partha Sengupta, Mike Weisbach (the editor), and JunYang, as well as seminar participants at Case Western Reserve University, Lehigh University, Northeastern University, Purdue University, Rutgers University, the Securities and Exchanges Commission, Villanova University, the 2008 American Financial Association meeting, the 2008 Conference on Corporate Governance and Fraud Prevention at George Mason University, the 2008 Financial Management Association meeting, the 2008 Summer Research Conference at Indian School of Business, the 2010 Weinberg Center for Corporate Governance Conference at the University of Delaware, the 2011 SFS Finance Cavalcade, and the 2011 Finance Down Under Conference at the University of Melbourne. Send correspondence to Lalitha Naveen, Fox School of Business, Temple University, Philadelphia, PA19122, USA; telephone: (610) 642-2748. E-mail: [email protected]. Coles thanks the W. P. Carey School of Business, Arizona State University for partial financial support. 1 See, for example, Coles, Daniel, and Naveen (2008), Adams, Hermalin, and Weisbach (2010), and Coles, Lemmon, and Wang (2011). © The Author 2014. Published by Oxford University Press on behalf of The Society for Financial Studies. All rights reserved. For Permissions, please e-mail: [email protected]. doi:10.1093/rfs/hhu011 RFS Advance Access published April 1, 2014 by guest on May 7, 2014 http://rfs.oxfordjournals.org/ Downloaded from
Transcript of Co-opted Boards - Temple University Sites · PDF fileCo-opted Boards Jeffrey L. Coles David...
[18:14 26/3/2014 RFS-hhu011.tex] Page: 1 1–46
Co-opted Boards
Jeffrey L. ColesDavid Eccles School of Business, University of Utah
Naveen D. DanielLeBow College of Business, Drexel University
Lalitha NaveenFox School of Business, Temple University
We develop two measures of board composition to investigate whether directors appointedby the CEO have allegiance to the CEO and decrease their monitoring. Co-option is thefraction of the board comprised of directors appointed after the CEO assumed office.As Co-option increases, board monitoring decreases: turnover-performance sensitivitydiminishes, pay increases (without commensurate increase in pay-performance sensitivity),and investment increases. Non-Co-opted Independence—the fraction of directors whoare independent and were appointed before the CEO—has more explanatory power formonitoring effectiveness than the conventional measure of board independence. Our resultssuggest that not all independent directors are effective monitors. (JEL G32, G34. K22)
The board of directors of a corporation is meant to perform the critical functionsof monitoring and advising top management (Mace 1971). Conventionalwisdom holds that monitoring by the board is more effective when the boardconsists of majority of independent directors. The empirical evidence onthe connection between board independence and firm performance, however,is mixed and weak, as is the evidence on the relation between boardindependence and other organizational and governance attributes, such asmanagerial ownership.1
One potential reason for the paucity of consistent, significant results is thatmany directors are co-opted and the board is captured. In practice, CEOs are
For helpful comments, the authors are grateful to an anonymous referee, Renee Adams, Christa Bouwman, VidhiChhaochharia, Rachel Diana, Dave Denis, Diane Denis, Ben Hermalin, Yan Li, Antonio Macias, David Maber,John McConnell, Darius Palia, Raghu Rau, David Reeb, Oleg Rytchkov, Partha Sengupta, Mike Weisbach (theeditor), and Jun Yang, as well as seminar participants at Case Western Reserve University, Lehigh University,Northeastern University, Purdue University, Rutgers University, the Securities and Exchanges Commission,Villanova University, the 2008 American Financial Association meeting, the 2008 Conference on CorporateGovernance and Fraud Prevention at George Mason University, the 2008 Financial Management Associationmeeting, the 2008 Summer Research Conference at Indian School of Business, the 2010 Weinberg Center forCorporate Governance Conference at the University of Delaware, the 2011 SFS Finance Cavalcade, and the2011 Finance Down Under Conference at the University of Melbourne. Send correspondence to Lalitha Naveen,Fox School of Business, Temple University, Philadelphia, PA 19122, USA; telephone: (610) 642-2748. E-mail:[email protected]. Coles thanks the W. P. Carey School of Business, Arizona State University for partialfinancial support.
1 See, for example, Coles, Daniel, and Naveen (2008), Adams, Hermalin, and Weisbach (2010), and Coles,Lemmon, and Wang (2011).
© The Author 2014. Published by Oxford University Press on behalf of The Society for Financial Studies.All rights reserved. For Permissions, please e-mail: [email protected]:10.1093/rfs/hhu011
RFS Advance Access published April 1, 2014 by guest on M
ay 7, 2014http://rfs.oxfordjournals.org/
Dow
nloaded from

[18:14 26/3/2014 RFS-hhu011.tex] Page: 2 1–46
The Review of Financial Studies / v 0 n 0 2014
likely to exert considerable influence on the selection of all board members,including nonemployee directors. Carl Icahn, activist investor, asserts quitedirectly (Business Week Online, November 18, 2005) that “. . . members ofthe boards are cronies appointed by the very CEOs they’re supposed to bewatching.” Likewise, Finkelstein and Hambrick (1989) allege that CEOs canco-opt the board by appointing “sympathetic” new directors. Hwang and Kim(2009) suggest that CEOs favor appointees who share similar views or socialties or because there is some other basis for alignment with the CEO.
Reflecting similar concerns about board capture, subsequent to the SarbanesOxley Act of 2002 (SOX), NYSE and NASDAQ adopted listing requirementsthat substantially reduced the direct influence of the CEO in the nominatingprocess. Nonetheless, CEOs are likely to continue to be able to exert someinfluence on the board nomination process. At the very least, they approvethe slate of directors, and this slate is almost always voted in by shareholders(Hermalin and Weisbach 1998; Cai, Garner, and Walkling 2009).2
In this paper, we propose and implement two new measures of boardcomposition, which we term Co-option and Non-Co-opted Independence. Co-option is meant to capture board capture. Non-Co-opted Independence, on theother hand, is meant to refine the traditional measure of board independence asa proxy for the monitoring effectiveness of the board.
We define Co-option as the ratio of the number of “co-opted” (or captured)directors, meaning those appointed after the CEO assumes office, to boardsize. The idea is that such co-opted directors, regardless of whether they areclassified as independent using traditional definitions, are more likely to assigntheir allegiance to the CEO because the CEO was involved in their initialappointment. Our measure is meant to reflect the additional behavioral latitudeand managerial discretion afforded a CEO when that CEO has significantinfluence over some directors on the board.Arelated interpretation of Co-optionis that it captures the disutility to the board from monitoring the CEO. Alongthese lines, Hermalin and Weisbach (1998), in their model of CEO bargainingwith the board, specify director utility as a function of, among other things, adistaste for monitoring (κ in their model), which for a director is reflected ina “. . . lack of independence, at least in terms of the way he or she behaves”(101). Co-option can be thought of as capturing director aversion to monitoringand lack of independence aggregated to the board level. Intuitively, Co-optionreflects what the CEO can get away with.
Co-option ranges from 0 to 1, with higher values indicating greater co-optionand board capture and greater insulation of the CEO from various efficiencypressures. In our sample, mean Co-option is 0.47, indicating that on averagenearly half of the directors on a board joined the board after the CEO assumedoffice.
2 Of course, CEO influence on the nomination process is substantially lower in the relatively few instances inwhich directors are put up for election by dissident shareholders in proxy fights.
2
by guest on May 7, 2014
http://rfs.oxfordjournals.org/D
ownloaded from

[18:14 26/3/2014 RFS-hhu011.tex] Page: 3 1–46
Co-opted Boards
We predict that a CEO who has co-opted a greater fraction of the board willbe less likely to be fired following poor performance, will receive higher pay,will have lower sensitivity of pay to performance, and will be able to implementpreferred or pet projects even if they are suboptimal from a shareholder-valueperspective. Our findings generally are consistent with these hypotheses.
First, we find that the sensitivity of forced CEO turnover to firm performancedecreases with co-option. For example, our parameter estimates indicate thatCEO-turnover-performance sensitivity is attenuated by about two-thirds for aone-standard-deviation increase in Co-option. Second, we find that CEO paylevels increase with board co-option. Of course, higher pay being associatedwith higher co-option is not symptomatic of entrenchment if it is compensationfor higher risk borne by the CEO through higher pay-performance sensitivity.Additional evidence, however, suggests that this is not the case: we findthat the sensitivity of CEO pay to firm performance is generally unrelatedto board co-option and even is negatively related to co-option in somespecifications. Finally, we find that investment in tangible assets (the ratioof capital expenditure to assets) increases with co-option. This is consistentwith the idea that CEOs who have co-opted the board can invest in waysthey otherwise would not. For example, in the absence of effective boardmonitoring, executives are likely to satisfy their preferences for scale andspan of control, preferences that arise in larger firms for reasons of highercompensation, control over more resources, and enhanced stature in the industryand community (Jensen 1986). Overall, the evidence on turnover, pay, andinvestment is consistent with the idea that co-option reduces the monitoringeffectiveness of the board.
In all specifications we control for the proportion of independent directors onthe board (Independence), which traditionally has been understood to be a mea-sure of board monitoring.3 We find that Independence has little power to explainCEO turnover-performance-sensitivity, CEO pay, CEO pay-performance-sensitivity, and investment. If there were a statistical horse race betweenCo-option and Independence, Co-option would appear to be more successful.
In light of this result, a natural question is whether independent directorswho are co-opted by the CEO are different in monitoring effectiveness fromthose who are not co-opted. To address this question, we calculate the fractionof the board that is comprised of independent directors appointed after the CEOassumed office (“Co-opted Independence”). Our results using this measure as anexplanatory variable are similar to what we find with Co-option. Specifically,we find that Co-opted Independence is associated with lower sensitivity ofCEO turnover to performance, higher pay levels, lower sensitivity of pay toperformance, and greater investment. Thus, co-opted independent directors,
3 See, for example, Weisbach (1988), Byrd and Hickman (1992), Brickley, Coles, and Terry (1994), Dahya,McConnell, and Travlos (2002), Hermalin and Weisbach (2003), Dahya and McConnell (2007), Coles, Daniel,and Naveen (2008), and Dahya, Dimitrov, and McConnell (2008).
3
by guest on May 7, 2014
http://rfs.oxfordjournals.org/D
ownloaded from
[18:14 26/3/2014 RFS-hhu011.tex] Page: 4 1–46
The Review of Financial Studies / v 0 n 0 2014
though independent of the CEO in the conventional and legal sense, behave asthough they are not independent in the function of monitoring management.This is likely to explain why the literature has not found consistent evidencewith respect to the monitoring effectiveness of independent directors.
To formally test the monitoring effectiveness of independent directors whoare not co-opted, we introduce a second new measure of board composition:Non-Co-opted Independence. We define this measure as the fraction of theboard comprised of independent directors who were already on the board whenthe CEO assumed office. In our sample, mean Non-Co-opted Independenceis 0.35, indicating that on average about a third of the board is comprised ofindependent directors who are truly independent, having not been co-opted bythe CEO. Of course, on most issues faced by the board, the majority rules, sothere is a significant possibility that the subset of independent directors whoare not co-opted is not influential. Nonetheless, consistent with our conjecturethat independent directors who are not co-opted are the monitors that matter,we find that Non-Co-opted Independence is associated with higher sensitivityof CEO turnover to performance, lower pay levels, higher sensitivity of pay toperformance, and lower investment.
In sum, not all independent directors are equally effective at monitoring.Those who are co-opted by the CEO are associated with weaker monitoring,whereas the independent directors who join the board before the CEO assumesoffice, that is, the directors who hired the CEO, are associated with strongermonitoring.
Our results on board capture are robust to two alternative definitions ofCo-option. Our first alternative proxy, Tenure-Weighted Co-option (TW Co-option), accounts for the possibility that directors appointed by the CEO becomeeven more co-opted through time and that the influence of co-opted directorsincreases with their tenure on the board.4 We define TW Co-option as the sum ofthe tenure of co-opted directors divided by the total tenure of all directors, so anincrease likely indicates higher board co-option. Our second alternative proxy isdesigned to address the possible concern that co-option increases mechanicallywith CEO tenure and that our results on co-option may be capturing theeffect of CEO tenure. We estimate Residual Co-option as the residual froma regression of Co-option on CEO tenure. We similarly estimate Residual TWCo-option as the residual from a regression of TW Co-option on CEO tenure.By construction, these residual measures are uncorrelated with CEO tenure. Wefind qualitatively similar results using these alternative definitions of co-option.
Our results also are robust to our best attempts to address endogeneity. Allof our base case regressions include firm fixed effects to control for biasesintroduced by unobserved, firm-specific, time-invariant, omitted variables thatare correlated with co-option. Endogeneity could still arise, however, either
4 Per Nell Minow, quoted in Hymowtiz and Green (2013), “What you want from directors is for them to reallypush the CEO for answers and, just by human nature, that gets harder the longer they’re on a board.”
4
by guest on May 7, 2014
http://rfs.oxfordjournals.org/D
ownloaded from

[18:14 26/3/2014 RFS-hhu011.tex] Page: 5 1–46
Co-opted Boards
because the omitted variable is not firm-specific or varies through time, orbecause reverse causation runs from our firm policy variables, such as pay,to co-option. We exploit exchange-rule changes enacted in 2002 to addresssuch concerns. Because these rules were adopted shortly after the passage ofSarbanes-Oxley (SOX), we refer to the postrules period as the post-SOX period.Firms that pre-SOX were not compliant with subsequent listing requirementsto have a majority of independent directors on the board chose to appointnew independent directors (Linck, Netter, and Yang 2009), thereby causing anexogenous increase in board co-option for such firms. To isolate the causalimpact of co-option, we apply a modified difference-in-differences approach.We continue to find results on the effects of co-option that by-and-large areconsistent with the evidence described above.
1. Motivation, Related Literature, and Hypotheses Development
1.1 CEO turnover-performance sensitivityOne of the key functions of the board is to evaluate the CEO and to replacehim if his performance is poor (Mace 1971). Whereas early studies find that thelikelihood of CEO turnover decreases in firm performance, subsequent studiessuggest that this relation between turnover and performance is weaker whenthe firm’s governance is weaker.5 Along similar lines, Hermalin and Weisbach(2003) suggest that turnover-performance sensitivity is weaker if the CEOcaptures the board. This implies that, for a given level of performance, CEOsof firms with more co-opted boards should be less likely to be fired. Thus, weexpect that
H1: All else equal, the sensitivity of forced CEO turnover to firmperformance decreases with co-option.
1.2 CEO pay levelA second important function of the board is to set the structure of CEO pay.Many studies argue that entrenched CEOs and CEOs of firms with weakermonitoring receive higher pay (Borokhovich, Brunarski, and Parrino 1997;Core, Holthausen, and Larcker 1999). We extend this reasoning to argue thatif co-opted boards are more sympathetic to the CEO, then CEO pay shouldincrease with co-option. This leads to our second hypothesis:
H2: All else equal, CEO pay level increases with co-option.
1.3 CEO pay-performance sensitivityPay contingent on performance is a means to align executive incentives withshareholder interests (e.g., Jensen and Murphy 1990; Bizjak, Brickley, and
5 See Coughlan and Schmidt (1985), Warner, Watts, and Wruck (1988), Weisbach (1988), Huson, Parrino, andStarks (2001), Kang and Shivdasani (1995), and Kaplan and Minton (2012).
5
by guest on May 7, 2014
http://rfs.oxfordjournals.org/D
ownloaded from

[18:14 26/3/2014 RFS-hhu011.tex] Page: 6 1–46
The Review of Financial Studies / v 0 n 0 2014
Coles 1993). Thus, we also examine the impact of co-option on CEO pay-performance sensitivity (PPS or “delta”). Hartzell and Starks (2003) show thatthe CEO pay-performance sensitivity is higher when institutions hold moreshares and argue that this is consistent with higher institutional holdings beinggood for shareholders. Falaye (2007) finds lower PPS for CEOs of firms withstaggered boards and argues that staggered boards are associated with CEOentrenchment. Thus, we expect that, if co-option results in lower efficiencypressures on the management team, then pay-performance sensitivity shoulddecrease in co-option.6
H3: All else equal, CEO pay-performance sensitivity decreases with co-option.
1.4 Investment policyA large body of literature addresses managerial incentives to overinvest and toengage in empire building. Jansen (1986, 323), for example, notes that “growthincreases managers’ power by increasing the resources under their control. It isalso associated with increases in managers’ compensation, because changes incompensation are positively related to the growth (see Kevin Murphy 1985).”Moreover, the scale and span of control can enhance the stature of the CEOin the industry and community. When the CEO has significant influence oversome directors on the board and, accordingly, is permitted additional behaviorallatitude and managerial discretion, such overinvestment is more likely. All elseequal, co-option will be associated positively with investment.
H4: All else equal, firm investment increases with co-option.
2. Data and Summary Statistics
We start with the RiskMetrics database, with coverage of directors of S&P500, S&P MidCap, and S&P SmallCap firms over the period 1996–2010.RiskMetrics does not provide a unique firm-level or director-level identifierover the entire time period. In the Appendix we describe how we associateunique identifiers with each record on RiskMetrics.7 We obtain compensationdata from Execucomp, accounting data from Compustat, and stock return datafrom CRSP. We exclude firms incorporated outside the United States. We definebelow our key variables.
6 Empirically, the papers mentioned in this subsection use varying methodologies to capture PPS. For example,Hartzell and Starks (2003) use PPS from new option grants only as the dependent variable. Coles, Lemmon, andWang (2011) use the pay performance sensitivity derived from the total portfolio of accumulated stock and optionholdings net of dispositions. Falaye (2007) uses Aggarwal, and Samwick-type (1999) regressions of changes inannual pay on dollar returns and interprets the coefficient on dollar returns as PPS.
7 RiskMetrics provides two different director identifiers, neither of which is fully populated for all directors.Between 23%–27% of director-years have missing identifiers. We combine both to create a unique identifierfor all director-year observations. Importantly, if only one of these identifiers is used, it will result in incorrectestimates of board size, independence, co-option, etc. Upon request, the authors can provide the unique directoridentifier created, as well as the unique firm identifiers (GVKEY and PERMNO) for each record on RiskMetrics.
6
by guest on May 7, 2014
http://rfs.oxfordjournals.org/D
ownloaded from

[18:14 26/3/2014 RFS-hhu011.tex] Page: 7 1–46
Co-opted Boards
2.1 CEO forced turnoverThe logic underlying our measure of co-option is most applicable for forcedturnover. Unfortunately, classifying turnover as forced or voluntary is difficult.Very often, even forced turnovers are reported to the press as voluntary.Nevertheless, we use an approximate classification scheme, similar to that usedin other papers (such as Denis and Denis 1995) to separate turnovers into forcedor voluntary. We define Forced Turnover as one if the departing CEO is lessthan 60 years old, and zero otherwise.
2.2 CEO payOur measure of CEO pay is total annual compensation (Execucomp variableTDC1). This includes the value of annual stock option grants, salary and bonus,value of annual restricted stock grants, other annual compensation, long-termincentive payouts, and all other compensation. We discuss in the Appendixhow the changes in compensation reporting following FAS 123R and new SECdisclosure requirements affect the reporting of pay. We compute an adjustedpay measure (discussed in more detail in the Appendix) that accounts for thesechanges in reporting. Our results are similar using this adjusted pay measure.
2.3 CEO pay-performance sensitivityPay performance sensitivity is estimated as the sensitivity of CEO wealth tostock price, otherwise termed as CEO delta, based on the entire portfolio ofstock and options held by the CEO. Specifically, the semielasticity form ofdelta is the expected dollar change in CEO wealth for a 1% change in stockprice. We calculate delta using the approach of Core and Guay (2002) but withadjustments to Execucomp data as specified in the Appendix. Also see Coles,Daniel, and Naveen (2013) for details on data and on calculation of incentivemeasures in the presence of changing financial reporting requirements andformats.
2.4 InvestmentOur proxy for investment is capital expenditures scaled by book value of assets.
2.5 Co-optionOur principal measure of co-option is based on the number of directors electedafter the CEO takes office. We refer to such directors as “co-opted” directors.
Co-option=#Co-opted directors
Board size
This variable ranges from 0 to 1, with higher values indicating greaterco-option.8
8 In contemporaneous work independent of ours, Morse, Nanda, and Seru (2011) develop a measure of CEO powerbased on three elements, one of which is similar to our measure of co-option. They show that more powerful
7
by guest on May 7, 2014
http://rfs.oxfordjournals.org/D
ownloaded from

[18:14 26/3/2014 RFS-hhu011.tex] Page: 8 1–46
The Review of Financial Studies / v 0 n 0 2014
In some specifications, we use an alternative measure of co-option, Tenure-Weighted Co-option (TW Co-option), which is the sum of the tenure of co-opteddirectors divided by the total tenure of all directors. Thus,
T W Co-option=
board size∑
i=1T enurei ×Co-optedDirectorDummyi
board size∑
i=1T enurei
,
where Co-opted Director Dummyi equals one if the director “i” is a co-opteddirector, and equals zero otherwise. Tenurei refers to the tenure of the director“i” on the board. This alternative measure accounts for the increase of influenceof co-opted directors on board decisions through time, as such directors workalongside the CEO and previously appointed directors. This measure assumesthat the greater the tenure of co-opted directors, the greater their influence onboard decisions. Again, this measure can vary from 0 to 1, with a higher valueindicating greater board capture.
Our third measure of co-option is Residual Co-option, which is defined asthe residual from a regression of Co-option on CEO tenure. Our final measureof co-option is Residual TW Co-option, which is the residual from a regressionof TW Co-option on CEO tenure. These two measures remove the positivecorrelation between CEO tenure and co-option.
For each firm-year, RiskMetrics provides the date of the annual meetingand the slate of directors up for election. The directors on the slate almostalways obtain sufficient support to be elected (Hermalin and Weisbach 1998;Cai, Garner, and Walkling (2009)). The majority of the sample firms hold theirannual meeting during the first 3–4 months of the fiscal year. Thus, becausethese directors constitute the board for the majority of the fiscal year, we assigndirectors on the slate at the annual meeting in a given fiscal year as the directorsfor that year.
For CEO turnover events, we are careful to identify the board in place beforethe CEO was dismissed because this board is the one responsible for replacingthe CEO. Thus, the CEO turnover date relative to the meeting date is importantfor our purpose. Figure 1 illustrates the time line. If a CEO turnover occurredafter the annual meeting date, then the board that determined the replacementwas the board elected for that year. That is, turnover and co-option are measuredcontemporaneously. If a CEO turnover occurred before the annual meetingdate, then the board responsible for replacing the CEO is the one elected inthe previous year, so we use lagged measures of co-option in the turnoverregression. In nonturnover years, because both the lagged and contemporaneous
CEOs (CEOs who have the titles of Chairman, CEO, and President, CEOs of firms with insider-dominatedboards, or CEOs with a greater proportion of directors appointed during their tenure) rig their pay contracts byincreasing the weights on the better performing measures.
8
by guest on May 7, 2014
http://rfs.oxfordjournals.org/D
ownloaded from

[18:14 26/3/2014 RFS-hhu011.tex] Page: 9 1–46
Co-opted Boards
March 2001: Annual Meeting
March 2002: Annual Meeting
Dec 2001 Dec 2002Dec 2000
Aug 2002: CEO Turnover
Feb 2002: CEO Turnover
Figure 1Time lineThe example above illustrates how we estimate the relevant board co-option associated with any given outcome(such as turnover-performance sensitivity, pay, pay-performance sensitivity, and investment). Consider a firmthat has a December fiscal year-end and has its annual meeting in March. Co-option for year 2001 is basedon the slate of directors presented at the March 2001 annual meeting, because this is the board in place forthe majority of the year. Thus, by definition, co-option is based on the board prevailing at the end of the yearrather than at the beginning of the year. Similarly, co-option for the year 2002 is based on the slate of directorspresented at the March 2002 meeting. Assume that a CEO turnover event occurs after the annual meetingdate (say, August 2002). Then the board that determined the CEO turnover is the board in place since March2002, and hence turnover and co-option are measured contemporaneously. If the turnover occurs before theannual meeting (say, February 2002), then the board that determined the turnover is the board elected as ofMarch 2001, and the lagged co-option measure is used in regressions. For nonturnover years, because both thelagged and contemporaneous boards decide on the CEO’s “nonreplacement,” we use the average of the laggedand contemporaneous values of co-option. For regressions of CEO pay, CEO pay-performance sensitivity, andinvestment, we use the contemporaneous co-option measure because this is based on the board that is in placefor the majority of the year and also because performance-based pay will be decided by the board at the end ofthe fiscal year.
boards decide on the CEO’s “nonreplacement,” we use the average of the laggedand contemporaneous values of co-option.
For regressions explaining variation in CEO pay, CEO delta, and investment,we use the contemporaneous co-option measure, because this is based on theboard that is in place for the majority of the year and also because performance-based pay (which is a significant component of overall pay) will be decided bythe board at the end of the fiscal year.
2.6 IndependenceIndependence is the ratio of the number of independent directors on the boardto total board size. Independent directors are those who are neither inside norgray directors (Weisbach 1988; Byrd and Hickman 1992; Brickley, Coles, andTerry 1994).
2.7 Summary statisticsTable 1 provides the summary statistics. Throughout the paper, we winsorize allvariables at the 1st and 99th percentiles to minimize the influence of outliers.9
9 Our results are similar if we winsorize all variables at the 0.5 and 99.5 percentiles instead. Our results are alsosimilar if we drop the observations in the top and bottom 0.5 percentiles from the analyses.
9
by guest on May 7, 2014
http://rfs.oxfordjournals.org/D
ownloaded from

[18:14 26/3/2014 RFS-hhu011.tex] Page: 10 1–46
The Review of Financial Studies / v 0 n 0 2014
Table 1Summary statistics
Obs. Mean Median SD
Firm-level variablesSales ($ million) 18,987 5,341 1,505 11,426Investment 18,405 0.052 0.038 0.051
Board-related variablesBoard Size 18,987 9.6 9.0 2.7Co-option 18,196 0.47 0.44 0.32TW (Tenure-weighted) Co-option 18,196 0.31 0.17 0.33Residual Co-option 18,196 0.00 −0.03 0.22Residual TW Co-option 18,196 0.00 −0.07 0.23Co-opted Independence 18,196 0.35 0.33 0.25Co-opted Non-Independence 18,196 0.12 0.09 0.15Non-Co-opted Independence 18,196 0.34 0.33 0.26Independence 18,987 0.69 0.71 0.17
CEO-related variablesForced Turnover 18,860 0.025 0.000 0.156CEO Pay ($ ‘000s) 18,870 4,934 2,853 6,088CEO pay-performance sensitivity (Delta; $ ‘000s) 17,436 789 250 1,802CEO Tenure (years) 18,401 8.1 6.0 7.1
Co-option is the number of directors appointed after the CEO assumed office (“co-opted” directors) dividedby the board size. TW Co-option is the sum of tenure of co-opted directors divided by the sum of tenure ofall directors. Residual Co-option and Residual TW Co-option are the residuals from regressions of Co-optionon CEO tenure and TW Co-option on CEO tenure. Co-opted Independence is the proportion of the board thatconsists of co-opted directors who are independent. Co-opted Non-Independence is the proportion of the boardthat consists of co-opted directors who are not independent. Non-Co-opted Independence is the proportion ofthe board that consists of independent directors who were already on the board when the CEO assumed office.Independence is the proportion of the board that consists of independent directors. Forced Turnover equals oneif the CEO departs and is younger than 60 years of age and equals zero otherwise. CEO Pay is the total annualpay (Execucomp: TDC1). CEO Delta is the expected dollar change in CEO wealth for a 1% change in stockprice, where components of pay-performance sensitivity (delta) arise from CEO holdings of own-firm stock andoptions, per Core and Guay (2002). Investment is capital expenditure scaled by assets. Reported values are basedon data winsorized at the 1st and 99th percentiles.
The average firm in the sample is large, with sales of $5.3 billion. This isnot surprising given that our sample is S&P 1500 firms. The average boardhas about ten directors. Co-option has a mean value of 0.47, whereas meanIndependence is 0.69. Thus, on average, although more than two-thirds of thedirectors are technically independent, our calculations indicate that nearly halfof the board has been co-opted by the CEO. Average Tenure-Weighted (TW)Co-option is 0.31, implying that whereas co-opted directors make up nearly halfthe board, their influence, after accounting for their tenure on the board, is a bitlower at 31%. Not surprisingly, Co-option and TW Co-option are similar, witha correlation of 0.93 (p <0.0001). Co-option and TW Co-option are dissimilarto board independence (ρ =−0.07 and ρ =−0.09, respectively).
The unconditional rate of forced turnover is 0.025. For comparison, theequivalent number is 0.019 in Hazarika, Karpoff, and Nahata (2012) (inferredfrom their Table 1) and is 0.030 in Mobbs (forthcoming). On average, CEOsreceive $4.9 million in total annual compensation, have a delta of $789,000,and have about eight years of tenure. On average, investment is 5.2% of totalbook assets.
10
by guest on May 7, 2014
http://rfs.oxfordjournals.org/D
ownloaded from

[18:14 26/3/2014 RFS-hhu011.tex] Page: 11 1–46
Co-opted Boards
3. Co-option and Monitoring Ineffectiveness: Empirical Results
3.1 Co-option and CEO turnover-performance sensitivityOur first hypothesis, H1, is that the sensitivity of CEO turnover to performancedecreases with co-option. To test this, we estimate the following logisticregression:
ln[Prob(Forced Turnover)/(1 - Prob(Forced Turnover))]
=α0 +α1Co-option×Performance
+α2Performance+α3Co-option+α4Independence + f(Other Controls)+ε1.
Our proxy for performance is Prior Abnormal Return. For turnover years, thisis measured as the firm stock return (including dividends) in the year leadingto the actual date of CEO turnover minus the value-weighted market returnover that period. For nonturnover years, this is measured as the stock returnover the previous fiscal year minus the value-weighted market return overthat period. It is well-documented that, in practice, performance is negativelyrelated to the likelihood of CEO turnover or that α2is negative (Weisbach 1988;Warner, Watts, and Wruck 1988; Parrino 1997; Kaplan and Minton 2012). Ourhypothesis is that turnover-performance sensitivity is attenuated by co-optionor that α1is positive. All specifications include Independence. Other controlvariables (Other Controls) include firm size, CEO tenure, and governancevariables. The governance variables are CEO ownership; CEO duality, anindicator variable that equals one if the CEO also has the title of chairman;outside director ownership; GIM index, the governance index of Gompers,Ishii, and Metrick (2003); board size; female director, an indicator variable thatequals one if the firm has a female director on board; and (in some models)terms interacting governance variables with prior performance.10 We includefirm fixed effects to control for any omitted firm-specific and time-invariantvariables that are correlated with co-option. We include year fixed effects tocontrol for variation in common influences through time. In general, our controlvariables are based on those in Adams and Ferreira (2009), Hwang and Kim(2009), Fich and Shivdasani (2007), and Dittmar and Mahrt-Smith (2007).
Table 2 reports the results. In models 1 and 2, the key independent variableis the interaction term of Co-option with Prior Abnormal Return. For eachindependent variable, we report the coefficient estimates (Row 1), z-statistics(Row 2), and the marginal effects (Row 3). We report the marginal effectsbecause there is no ready economic interpretation of the coefficients in nonlinearregressions. The marginal effect is presented in semi-elasticity form. Forcontinuous variables, the marginal effect represents the percentage change inthe probability of Forced Turnover for a one unit change in the underlyingvariable, holding all other variables at their mean values. For indicator variables,
10 For the four CEO-related variables, the values correspond to the departing CEO in the year of turnover. Also,we do not include CEO age because Forced Turnover is automatically zero when the CEO is over 60.
11
by guest on May 7, 2014
http://rfs.oxfordjournals.org/D
ownloaded from

[18:14 26/3/2014 RFS-hhu011.tex] Page: 12 1–46
The Review of Financial Studies / v 0 n 0 2014
Table 2Effect of co-option on CEO turnover-performance sensitivity
Dependent variable = Forced Turnover
Co-option measure used:
TW TW Residual Residual TWCo-option Co-option Co-option Co-option Co-option Co-option
(1) (2) (3) (4) (5) (6)
Co-option measure × 2.021∗∗∗ 1.610∗∗ 2.304∗∗∗ 2.557∗∗∗ 1.558∗ 2.250∗∗∗Prior Abnormal Return (α1) (3.4) (2.5) (4.4) (4.1) (1.8) (3.4)
0.856 0.535 0.961 0.751 0.327 0.407
Prior Abnormal Return (α2) −2.153∗∗∗ −2.473∗∗∗ −2.062∗∗∗ −2.974∗∗ −1.163∗∗∗ −1.337∗∗∗(−5.3) (−2.6) (−6.1) (−2.6) (−5.6) (−5.7)−1.331 −1.257 −1.539 −1.550 −1.165 −1.347
Co-option measure 3.817∗∗∗ 3.804∗∗∗ 2.475∗∗∗ 2.517∗∗∗ 3.832∗∗∗ 2.539∗∗∗(6.9) (6.9) (3.8) (3.8) (6.9) (3.8)3.797 3.723 2.571 2.628 3.854 2.629
Independencet−1 −0.674 −0.723 −0.555 −0.555 −0.655 −0.527(−0.8) (−0.9) (−0.6) (−0.6) (−0.8) (−0.6)−0.650 −0.597 −0.545 −0.462 −0.643 −0.517
Firm Sizet −0.264 −0.235 −0.289 −0.296 −0.248 −0.274(−0.9) (−0.8) (−0.9) (−1.0) (−0.9) (−0.9)−0.255 −0.221 −0.284 −0.288 −0.244 −0.269
CEO Tenuret 0.018 0.021 0.106∗∗∗ 0.106∗∗∗ 0.132∗∗∗ 0.174∗∗∗(0.7) (0.8) (3.2) (3.2) (6.8) (7.3)0.018 0.020 0.104 0.103 0.130 0.171
CEO Ownershipt −0.053 −0.090∗ −0.066 −0.071 −0.042 −0.054(−1.2) (−1.7) (−1.5) (−1.5) (−1.0) (−1.3)−0.051 −0.078 −0.064 −0.067 −0.041 −0.053
CEO Dualityt −1.148∗∗∗ −1.127∗∗∗ −1.344∗∗∗ −1.370∗∗∗ −1.162∗∗∗ −1.370∗∗∗(−5.3) (−5.2) (−5.8) (−5.8) (−5.4) (−5.9)−1.110 −1.066 −1.321 −1.378 −1.140 −1.350
Outside Director ownershipt−1 0.015 0.016 0.023 0.023 0.016 0.025(0.8) (0.8) (1.2) (1.2) (0.9) (1.3)0.015 0.014 0.022 0.023 0.016 0.024
GIM Indext−1 −0.079 −0.085 −0.093 −0.091 −0.085 −0.099(−0.7) (−0.8) (−0.8) (−0.8) (−0.8) (−0.9)−0.076 −0.078 −0.091 −0.083 −0.084 −0.097
Board Sizet−1 −0.009 −0.006 −0.032 −0.021 −0.011 −0.026(−0.1) (−0.1) (−0.4) (−0.3) (−0.2) (−0.4)−0.009 0.001 −0.032 −0.012 −0.011 −0.026
Female Directort−1 −0.072 −0.087 0.069 0.057 −0.031 0.101(−0.3) (−0.3) (0.2) (0.2) (−0.1) (0.3)−0.070 −0.092 0.068 0.038 −0.03 0.099
Independencet−1 × 0.295 0.278Prior Abnormal Return (0.3) (0.2)
0.108 0.082
CEO Ownershipt−1 × 0.099∗ 0.013Prior Abnormal Return (1.8) (0.2)
0.259 −0.003
CEO Dualityt−1 × 0.100 −0.449Prior Abnormal Return (0.3) (−1.0)
0.059 −0.490
Outside Director Ownershipt−1 × −0.035 −0.023Prior Abnormal Return (−1.2) (−0.7)
−0.198 −0.116
GIM Indext−1 × −0.012 0.039Prior Abnormal Return (−0.2) (0.4)
−0.003 0.142
Board Sizet−1 × 0.045 0.056Prior Abnormal Return (0.5) (0.5)
0.010 0.192
(Continued)
12
by guest on May 7, 2014
http://rfs.oxfordjournals.org/D
ownloaded from

[18:14 26/3/2014 RFS-hhu011.tex] Page: 13 1–46
Co-opted Boards
Table 2Continued
Dependent variable = Forced Turnover
Co-optionmeasure used:
TW TW Residual Residual TWCo-option Co-option Co-option Co-option Co-option Co-option
(1) (2) (3) (4) (5) (6)
Female Directort−1 × −0.051 −0.020Prior Abnormal Return (−0.1) (−0.0)
−0.108 −0.104
Fixed effect firm, year firm, year firm, year firm, year firm, year firm, yearObservations 2,152 2,152 1,899 1,899 2,152 1,899Turnover-PerformanceSensitivity at Co-optionmeasure = max value −0.092 −0.203 0.213 0.415 −0.088 0.465
The table presents results from logistic regressions of Forced Turnover, which equals one if the CEO departs andis younger than 60 years of age and equals zero otherwise. Co-option is the number of directors appointed afterthe CEO assumed office (“co-opted” directors) divided by the board size. TW Co-option is the sum of tenureof co-opted directors divided by the sum of tenure of all directors. For a departing CEO, co-option effectivelyis the co-option of the board at the time of dismissal. In the year in which turnover occurs, if the turnoveroccurs after the date of the firm’s annual meeting, then the contemporaneous co-option measure is used; if theturnover occurs before the firm’s annual meeting date, then the lagged co-option measure is used. In nonturnoveryears, we take the average of contemporaneous and lagged values of co-option measure. Residual Co-optionand Residual TW Co-option are the residuals from regressions of Co-option on CEO tenure and TW Co-optionon CEO tenure. For turnover years, Prior Abnormal Return is measured as the annual stock returns in the yearleading up to the actual date of CEO turnover minus the value-weighted market returns over that period. Fornonturnover years, Prior Abnormal Return is measured as the stock returns over the previous fiscal year minusthe value-weighted market returns over that period. In the year of turnover, all CEO variables correspond to thatof the departing CEO; in nonturnover years, they are measured contemporaneously. All other control variablesare defined in the Appendix. For each independent variable, we present the coefficient estimate (row 1), the z-statistics (in parentheses; row 2), and the marginal effect (in italics; row 3). The marginal effect for a continuousvariable is the percentage change in the conditional expected probability of Forced Turnover for a 1% change inthe continuous variable, holding all other variables at their means (i.e., it is the elasticity). The marginal effectfor an indicator variable is the percentage change in the conditional expected probability of Forced Turnoverwhen the indicator variable goes from 0 to 1, holding all other variables at their means. The marginal effectfor the interaction term of Prior Abnormal Return with a continuous variable is the change in the elasticity ofForced Turnover with Prior Abnormal Return when the continuous variable moves by one standard deviationfrom its mean value, holding all other variables at their means. The marginal effect for the interaction term ofPrior Abnormal Return with an indicator variable is the change in the elasticity of Forced Turnover with PriorAbnormal Return when the indicator variable moves from zero to one, holding all other variables at their means.The last row of the table gives the elasticity of Forced Turnover with Prior Abnormal Return for a fully co-optedboard (i.e., at Co-option = 1 for Columns 1 and 2, TW Co-option =1 for Columns 3 and 4, Residual Co-option= 0.67 for Column 5, and Residual TW Co-option = 0.84 for Column 6). ***, **, and * indicate statisticalsignificance at the 1%, 5%, and 10% levels.
we report the percentage change in the probability of Forced Turnover whenthe indicator variable moves from zero to one (holding other variables at theirmean values).11
Consistent with our hypothesis, the coefficient on the interaction term of Co-option and Prior Abnormal Returns (α1) is positive and statistically significant(= 2.021, z-statistic = 3.4), indicating that an increase in Co-option is associatedwith a decrease in the sensitivity of CEO turnover to firm performance. Toestimate the effect of the interaction term, we compute the marginal effect of
11 Ai and Norton (2003) note that interpretation of interacted variables in nonlinear models is not straightforward.Stata (v. 11) has since introduced the margins statement, which correctly computes the marginal effects innonlinear models with interaction terms. We use this statement to compute all reported marginal effects.
13
by guest on May 7, 2014
http://rfs.oxfordjournals.org/D
ownloaded from

[18:14 26/3/2014 RFS-hhu011.tex] Page: 14 1–46
The Review of Financial Studies / v 0 n 0 2014
Prior Abnormal Return at two different levels of Co-option: at the mean as wellas mean plus one standard deviation (holding all other variables at their meanvalues). The difference indicates how the sensitivity of turnover to performancechanges with co-option. As can be seen in model 1, the sensitivity of turnoverto firm performance decreases by 0.856, from –1.331 at the mean value of Co-option, to –0.476 when Co-option increases by one standard deviation from itsmean value (for ease of presentation in the table, we report only the difference).In other words, the sensitivity of turnover to performance goes down by almosttwo-thirds when Co-option moves by one standard deviation from its meanvalue. If Co-option increases even further to the maximum possible value ofone, then the sensitivity of forced turnover to performance is even smaller(= –0.092; see the last row of Table 2).12 Thus, the results in model 1 areconsistent with H1. Turnover-performance sensitivity decreases as co-optionincreases.
In model 1, we allow only Co-option to affect the turnover-performancesensitivity (i.e., we include only the interaction term of Co-option with PriorAbnormal Return). In model 2 we allow all governance-related variables(Independence, CEO ownership, CEO duality, outside director ownership,GIM index, board size, and female director) to affect the turnover-performancesensitivity. Two results are worth noting. First, the coefficient on the interactionof Co-option with Prior Abnormal Return remains significantly positive.Second, Independence does not appear to have a significant impact on turnover-performance sensitivity. Board co-option, rather than board independence, hasexplanatory power for turnover-performance sensitivity.
In models 3 and 4, we use the same specifications as in models 1 and 2,respectively, but include TW Co-option, rather than Co-option. The estimatedcoefficient on the interaction of TW Co-option with Prior Abnormal Returnremains significantly positive in both specifications. In terms of economicsignificance, the results in model 3 indicate that when TW Co-option increasesby one standard deviation from its mean value, the sensitivity of turnover toperformance changes from –1.539 to –0.577 (the table reports the difference= 0.962) . The last row in the table shows that when TW Co-option increasesto one, the sensitivity of turnover to performance is altered further to 0.213,which is positive. Results from model 4 are similar.
A potential issue arises because our two co-option measures (Co-optionand TW Co-option) are positively correlated with CEO tenure. Thus,multicollinearity could be a concern. To address this concern, we replace Co-option with Residual Co-option, which is the residual from a regression ofCo-option on CEO tenure. Model 5 reports the results. The coefficient on theinteraction of Residual Co-option with Prior Abnormal Returns is significantly
12 In the model, α2 represents the effect of Prior Abnormal Return on Forced Turnover when Co-option is zero.When STATA reports the marginal effect of Prior Abnormal Return, however, it reports the total effect of PriorAbnormal Return on Forced Turnover at the mean of all variables.
14
by guest on May 7, 2014
http://rfs.oxfordjournals.org/D
ownloaded from

[18:14 26/3/2014 RFS-hhu011.tex] Page: 15 1–46
Co-opted Boards
positive, indicating that the effect of Co-option on CEO turnover-performancesensitivity documented in model 1 is not due to the correlation between Co-option and CEO tenure. Finally, in model 6, we replace Co-option with ResidualTW Co-option, which is the residual from a regression of TW Co-option on CEOtenure. Once again, our results are similar to those in model 3.13
In terms of the other control variables, our results across the various modelsshow that CEO duality is significantly negatively related to CEO turnover (as inGoyal and Park 2002). In contrast, the other governance variables, in general,are not consistently significant across the various specifications.
The number of observations is much smaller in our turnover regressionsbecause the use of firm fixed effects means that firms that never had a forcedturnover during the sample period are excluded from the regression. To ensurethat our results are not driven by any sample selection, we estimate the sameregression models without firm fixed effects, but with industry fixed effects, andobtain very similar results for all six specifications on a much larger sample.
In all tables that follow, we report t-statistics based on standard errorsadjusted for heteroscedasticity and clustering at the firm level (Petersen 2009).This option, however, is not available for the fixed effects logistic regressionmodels in Table 2.As a robustness check, we bootstrap the standard errors using200 replications. We find qualitatively similar results using the bootstrap.
Overall, the results indicate that, consistent with H1, turnover-performancesensitivity is attenuated as measures of board co-option increase.
3.2 Co-option and CEO pay levelOur second hypothesis, H2, predicts that CEO pay increases with co-option.To test this, we estimate regressions of CEO pay on co-option and controls.
CEO Pay=θ0 +θ1Co-option+θ2Independence+g(Other Controls)+ε2.
H2 asserts that the coefficient on Co-option (θ1) will be positive. The controlvariables, based on prior literature (see Murphy 1999 for a comprehensivereview of CEO compensation), include board independence, firm size, firmperformance (both stock and accounting), CEO tenure, governance variables,and firm and year dummies.14 We do not include CEO turnover years andrequire that the CEO’s tenure be at least one year. This is because CEO pay ina turnover year is likely to reflect compensation only for part of the year. Also,CEOs in their first year may receive higher than average stock compensation
13 We also estimate models 5 and 6, including interactions of all governance variables with prior abnormal returns(as in models 2 and 4). When we re-estimate model 6 in this manner, the results are statistically and economicallysimilar to our main results. When we re-estimate model 5, the results are economically similar but are statisticallyweaker. The sensitivity of turnover to performance decreases from –1.62 at the maximum value of Residual Co-option to –0.26 at the minimum value. The interaction of Residual Co-option with prior abnormal returns ispositive but is insignificant (p = 0.195).
14 The results are robust to using industry and year fixed effects instead.
15
by guest on May 7, 2014
http://rfs.oxfordjournals.org/D
ownloaded from

[18:14 26/3/2014 RFS-hhu011.tex] Page: 16 1–46
The Review of Financial Studies / v 0 n 0 2014
Table 3Effect of co-option on CEO pay
Dependent variable = logarithm of CEO Pay
Co-option measure used:
Residual ResidualCoefficient estimate Co-option TW Co-option Co-option TW Co-option(t-statistic) (1) (2) (3) (4)
Co-option measuret (θ1) 0.223∗∗∗ 0.133∗ 0.227∗∗∗ 0.130∗(3.9) (2.0) (3.9) (1.9)
Independencet 0.141 0.163∗ 0.141 0.163∗(1.5) (1.7) (1.5) (1.7)
Firm Sizet 0.327∗∗∗ 0.324∗∗∗ 0.327∗∗∗ 0.324∗∗∗(10.1) (9.9) (10.1) (9.9)
Stock Returnt 0.103∗∗∗ 0.104∗∗∗ 0.103∗∗∗ 0.104∗∗∗(5.9) (5.9) (5.9) (5.9)
ROAt 1.220∗∗∗ 1.226∗∗∗ 1.220∗∗∗ 1.226∗∗∗(7.2) (7.2) (7.2) (7.2)
CEO Tenuret −0.008∗∗ −0.004 −0.001 −0.000(−2.4) (−1.3) (−0.4) (−0.1)
CEO Ownershipt −0.012∗∗ −0.013∗∗∗ −0.012∗∗ −0.013∗∗∗(−2.6) (−2.6) (−2.6) (−2.6)
CEO Dualityt 0.037 0.045∗ 0.037 0.045∗(1.5) (1.9) (1.5) (1.9)
Outside Director Ownershipt −0.001 −0.001 −0.001 −0.001(−1.4) (−1.3) (−1.4) (−1.3)
GIM Indext 0.011 0.011 0.011 0.011(1.0) (1.0) (1.0) (1.0)
Board Sizet −0.005 −0.003 −0.005 −0.003(−0.7) (−0.4) (−0.7) (−0.4)
Female Directort 0.013 0.014 0.013 0.014(0.5) (0.5) (0.5) (0.5)
Fixed effects firm, year firm, year firm, year firm, yearObservations 12,036 12,036 12,036 12,036R2 0.167 0.166 0.168 0.166
The table presents regression results where the dependent variable is logarithm of CEO Pay. We drop firm-yearsin which a turnover occurred and require that the CEO’s tenure be at least one year. This ensures that we donot consider pay for fractional years. CEO Pay is the total annual pay (Execucomp: TDC1). Co-option is thenumber of directors appointed after the CEO assumed office (“co-opted” directors) divided by the board size.TW Co-option is the sum of tenure of co-opted directors divided by the sum of tenure of all directors. ResidualCo-option and Residual TW Co-option are the residuals from regressions of Co-option on CEO tenure and TWCo-option on CEO tenure. All other control variables are defined in the Appendix. Intercept is included butnot reported. t-statistics, given in parentheses, are based on standard errors corrected for heteroscedasticity andfirm-level clustering. ***, **, and * indicate statistical significance at the 1%, 5%, and 10% levels.
(to align their incentives) and higher bonus (including signing bonuses).We use the logarithm of annual compensation as the dependent variable becausecompensation data are skewed.15
Table 3 presents the results. In model 1, the coefficient on Co-option issignificantly positive, implying that CEO pay increases with co-option.16 Thecoefficient of 0.223 on Co-option indicates that moving from zero to full co-option would be associated with an increase in CEO pay of 22.3%. A less
15 We obtain similar results using unlogged compensation.
16 This result is consistent with Core, Holthausen, and Larcker (1999), who, using a sample of 495 firm-years from1982–1984, find that CEO total pay is positively related to the proportion of the board composed of new outside(both independent and affiliated) directors.
16
by guest on May 7, 2014
http://rfs.oxfordjournals.org/D
ownloaded from

[18:14 26/3/2014 RFS-hhu011.tex] Page: 17 1–46
Co-opted Boards
extreme measure of economic significance is the change in pay when Co-option increases by one standard deviation. In this case, we find that CEO payincreases by 7% relative to the mean pay. This corresponds to about $345,380annually for the CEO.
In model 2, we use TW Co-option rather than Co-option. As with Co-option,we find that the coefficient on TW Co-option is significantly positive. Finally,in models 3 and 4, we use Residual Co-option and Residual TW Co-option,and the results are similar. The coefficients on both measures are significantlypositive, indicating that co-option is associated with higher pay, and this effectis not driven by the positive correlation between co-option and tenure.
Board independence has no explanatory power for CEO pay in two of thefour specifications. In the other two models, the coefficient on Independenceis positive, which is inconsistent with greater independence leading to bettermonitoring of rent extraction.17 For the other control variables, as expectedfirm size and performance are strongly positively associated with pay. Overall,the evidence is consistent with CEO pay increasing in co-option (H2).
3.3 Co-option and CEO pay-performance sensitivityPay-performance-sensitivity—otherwise known as delta—is seen as aligningthe incentives of managers with the interests of shareholders. Higher delta canmean that managers will work harder or more effectively because managersshare gains and losses. Thus, we now examine the influence of co-option onCEO delta. The representative specification is
CEO Pay-Performance Sensitivity=γ0 +γ1Co-option+γ2Independence
+h(Other Controls)+ε3.
Our control variables are based on the prior literature on the determinantsof delta (Core and Guay 1999; Coles, Daniel, and Naveen 2006) and thegovernance variables used in the preceding regressions.
Table 4 presents the results. As in Table 3, our independent variables areCo-option (model 1), TW Co-option (model 2), Residual Co-option (model3), and Residual TW Co-option (model 4). In models 1 and 3, the estimatedcoefficients on Co-option and Residual Co-option are negative (consistent withour hypothesis) but insignificant at conventional levels (p = 0.107 and 0.103,respectively). In models 2 and 4, the estimated coefficient on TW Co-optionand Residual TW Co-option are negative and significant, albeit at the 10%level. The coefficient on Co-option in model 1 indicates that when Co-optionincreases by one standard deviation from its mean, pay-performance sensitivitydecreases by 12% from its mean value. When Co-option increases from zero to
17 As a robustness check, instead of using contemporaneous values of our co-option measures, we also use theaverage of the contemporaneous and the lagged values, because the lagged board also may be partly responsiblefor CEO compensation. Our results are robust to this change.
17
by guest on May 7, 2014
http://rfs.oxfordjournals.org/D
ownloaded from

[18:14 26/3/2014 RFS-hhu011.tex] Page: 18 1–46
The Review of Financial Studies / v 0 n 0 2014
Table 4Effect of co-option on CEO pay-performance sensitivity (CEO delta)
Dependent variable = CEO Pay-performance sensitivity
Co-option measure used:
Residual ResidualCo-option TW Co-option Co-option TW Co-option
(1) (2) (3) (4)
Co-option measuret (γ 1) −296.485 −366.150∗ −299.503 −363.054∗(−1.6) (−1.7) (−1.6) (−1.8)
Independencet −558.298∗∗ −578.303∗∗ −558.695∗∗ −578.854∗∗(−2.4) (−2.5) (−2.4) (−2.5)
Firm Sizet 199.686∗∗∗ 201.071∗∗∗ 199.643∗∗∗ 201.065∗∗∗(3.1) (3.1) (3.1) (3.1)
Tobin’s qt 378.526∗∗∗ 378.745∗∗∗ 378.469∗∗∗ 378.609∗∗∗(7.1) (7.2) (7.1) (7.2)
R&D/Assetst −1,644.191 −1,729.813 −1,640.445 −1,722.186(−1.4) (−1.5) (−1.4) (−1.5)
Investmentt 1,338.528∗ 1,355.289∗ 1,337.425∗ 1,350.299∗(1.7) (1.7) (1.7) (1.7)
Leveraget −200.384 −197.445 −200.717 −197.515(−1.0) (−1.0) (−1.0) (−1.0)
Log(Unsystematic Riskt ) −93.625∗∗∗ −91.989∗∗∗ −93.651∗∗∗ −91.938∗∗∗(−2.9) (−2.9) (−2.9) (−2.9)
CEO Tenuret 82.321∗∗∗ 83.992∗∗∗ 72.924∗∗∗ 72.232∗∗∗(5.1) (5.2) (6.5) (6.6)
CEO Dualityt 156.116∗∗∗ 152.332∗∗∗ 156.272∗∗∗ 151.993∗∗∗(2.7) (2.7) (2.7) (2.7)
Outside Director Ownershipt 0.083 0.062 0.084 0.060(0.1) (0.1) (0.1) (0.1)
GIM Indext 11.241 9.324 11.222 9.349(0.3) (0.3) (0.3) (0.3)
Board Sizet 2.524 −1.028 2.514 −1.058(0.1) (−0.1) (0.1) (−0.1)
Female Directort −11.763 −14.439 −11.837 −14.363(−0.2) (−0.3) (−0.2) (−0.3)
Fixed effects firm, year firm, year firm, year firm, yearObservations 11,539 11,539 11,539 11,539R2 0.196 0.196 0.196 0.196
The table presents regressions of CEO Pay-performance sensitivity (or Delta), defined as the expected dollarchange in CEO wealth for a 1% change in stock price, where components of delta arise from current CEO holdingsof own-firm stock and options, per Core and Guay (2002). Co-option is the number of directors appointed afterthe CEO assumed office (“co-opted” directors) divided by the board size. TW Co-option is the sum of tenure ofco-opted directors divided by the sum of tenure of all directors. Residual Co-option and Residual TW Co-optionare the residuals from regressions of Co-option on CEO tenure and TW Co-option on CEO tenure. Other controlvariables are defined in the Appendix. Intercept is included but not reported. t-statistics, given in parentheses,are based on standard errors corrected for heteroscedasticity and firm-level clustering.***, **, and * indicatestatistical significance at the 1%, 5%, and 10% levels.
one, sensitivity of pay to performance decreases by $296,485 or by 38% fromits mean value.
The coefficient on board independence is negative and significant in models1–4. This result, which is similar to that in Coles, Lemmon, and Wang (2011),suggests that board monitoring and CEO delta may well be substitutes inorganization design.
For robustness, as we do with CEO pay, we use the average of thecontemporaneous and the lagged values of the co-option measures instead ofthe contemporaneous values alone. Also, we use industry year fixed effects
18
by guest on May 7, 2014
http://rfs.oxfordjournals.org/D
ownloaded from

[18:14 26/3/2014 RFS-hhu011.tex] Page: 19 1–46
Co-opted Boards
instead of firm year fixed effects. The results in both cases are similar to ourbase case result, in that the coefficient on the co-option measures continues tobe negative but insignificant at conventional levels.
In sum, we find weak evidence in support of the hypothesis (H3) that higherco-option is associated with lower CEO pay-performance sensitivity (PPS).CEO pay and PPS, however, cannot be viewed as independent of each other.CEOs would demand higher pay if greater risk is imposed on them in the formof higher PPS. Instead, if anything, co-option is associated with lower exposureof CEO wealth to risk. Thus, our finding that co-option is associated with higherpay, but similar or even lower PPS, is consistent with co-opted boards adoptingmore liberal compensation policies that are favorable to the CEO.
3.4 Co-option and investmentH4 proposes that co-option is positively associated with investment. Weexamine this using the following specification:
Investment=μ0 +μ1Co-option+μ2Independence+ j(Other Controls)+ε4.
The dependent variable is capital expenditure scaled by assets. In addition toboard independence, the other key independent variables are based on Coles,Daniel, and Naveen (2006) and include vega, delta, cash compensation, CEOtenure, Tobin’s q, firm size, free cash flow to assets, sales growth, leverage, andstock return.
Table 5 shows the results. In model 1, we use Co-option as our key variableof interest. The coefficient on Co-option is positive and statistically significant(= 0.005, p-value = 0.014). In terms of economic significance, the coefficientindicates that when Co-option increases by one standard deviation, investmentincreases by 3% relative to the mean. When Co-option increases from zero toone, investment increases by 10% relative to its mean value.
In model 2, as the dependent variable we use TW Co-option instead of Co-option. Once again, the coefficient on TW Co-option is positive and statisticallysignificant. In the last two columns we use Residual Co-option and ResidualTW Co-option, respectively. Our results are similar in sign and significance.
In all specifications, we find that the fraction of independent directors isnegatively associated with investment. The results on the other control variablesare consistent with prior literature. Consistent with Coles, Daniel, and Naveen(2006), we find the coefficient on vega is negative (although not significant atconventional levels), and the coefficient on delta is positive. Higher Tobin’s qand higher free cash flow are associated with more investment.
As with CEO pay and pay-performance sensitivity, we confirm that the resultsare qualitatively similar if we use the average of the contemporaneous and thelagged values of the co-option measures instead of the contemporaneous valuesalone.When we use industry-year fixed effects instead of firm-year fixed effects,however, we find that the coefficient on co-option is not significant.
19
by guest on May 7, 2014
http://rfs.oxfordjournals.org/D
ownloaded from

[18:14 26/3/2014 RFS-hhu011.tex] Page: 20 1–46
The Review of Financial Studies / v 0 n 0 2014
Table 5Effect of co-option on investment
Dependent variable = Investment
Co-option measure used:
Residual ResidualCo-option TW Co-option Co-option TW Co-option
(1) (2) (3) (4)
Co-option measuret (μ1) 0.005∗∗ 0.006∗∗ 0.005∗∗ 0.006∗∗(2.5) (2.2) (2.4) (2.0)
Independencet −0.007∗ −0.006∗ −0.007∗ −0.006∗(−1.9) (−1.8) (−1.9) (−1.7)
CEO Vegat−1(×10−6) −2.730 −2.60 −2.730 −0.260(−1.2) (−1.2) (−1.2) (−1.2)
CEO Deltat−1(×10−6) 0.830∗∗ 0.830∗∗ 0.831∗∗ 0.825∗∗(2.0) (2.0) (2.0) (2.0)
CEO Tenuret −0.000 −0.000 0.000 0.000(−1.5) (−1.4) (0.0) (0.2)
CEO Cash Compensationt (×10−6) 0.509∗∗ 0.504∗∗ 0.509∗∗ 0.506∗∗(2.2) (2.2) (2.2) (2.2)
Tobin’s qt 0.005∗∗∗ 0.005∗∗∗ 0.005∗∗∗ 0.005∗∗∗(8.6) (8.5) (8.6) (8.5)
Firm Sizet 0.002 0.002 0.002 0.002(1.6) (1.6) (1.6) (1.6)
FCF/Assetst 0.034∗∗∗ 0.034∗∗∗ 0.034∗∗∗ 0.034∗∗∗(5.3) (5.3) (5.3) (5.3)
Sales Growtht 0.001 0.001 0.001 0.001(0.9) (0.9) (0.9) (0.9)
Leveraget −0.017∗∗∗ −0.017∗∗∗ −0.017∗∗∗ −0.017∗∗∗(−3.6) (−3.6) (−3.6) (−3.6)
Stock Returnst −0.010∗∗∗ −0.010∗∗∗ −0.010∗∗∗ −0.010∗∗∗(−14.4) (−14.4) (−14.4) (−14.4)
Fixed effects firm, year firm, year firm, year firm, yearObservations 16,041 16,041 16,041 16,041R2 0.148 0.147 0.147 0.147
The table presents regressions of Investment, defined as capital expenditure scaled by assets. Co-option is thenumber of directors appointed after the CEO assumed office (“co-opted” directors) divided by the board size.TW Co-option is the sum of tenure of co-opted directors divided by the sum of tenure of all directors. ResidualCo-option and Residual TW Co-option are the residuals from regressions of Co-option on CEO tenure and TWCo-option on CEO tenure. Other control variables are defined in the Appendix. Intercept is included but notreported. t-statistics, given in parentheses, are based on standard errors corrected for heteroscedasticity andfirm-level clustering. ***, **, and * indicate statistical significance at the 1%, 5%, and 10% levels.
Overall, the results in this subsection support the hypothesis that CEOs thathave captured the board to a greater extent are able to invest more than otherwisewould have been the case. At this juncture, based on our results, we are unableto discern whether such investment, which likely increases firm size and theeconomic span of control of top management, is necessarily inconsistent withshareholder interests. On this question, however, in separate, independentlydeveloped work, Pan et al. (2013) document that investment increases with theextent of CEO control of the board, as proxied by a measure of co-option similarto ours. They also find that the quality of investment (captured by the marketreaction to acquisition announcements) deteriorates over the CEO’s tenureand that this deterioration is related to the CEO’s control of the board. Thus,the relation we document between CEO investment and Co-option potentiallyarises because “. . . the CEO overinvests when he gains more control over hisboard” (Pan et al. 2013, their abstract).
20
by guest on May 7, 2014
http://rfs.oxfordjournals.org/D
ownloaded from

[18:14 26/3/2014 RFS-hhu011.tex] Page: 21 1–46
Co-opted Boards
4. Endogeneity
Endogeneity is an important concern in any study on corporate governance(Coles, Lemmon, and Wang 2011). In particular, it is possible that both co-option and pay are high because of an unobserved (and hence omitted) variable.Because we include firm fixed effects in all our specifications, we controlfor omitted variables that are firm-specific and time-invariant. If the omittedvariable is time-varying or not firm-specific, however, and is correlated with co-option, this would cause the error term in the outcome equation to be correlatedwith co-option, rendering OLS invalid. Another source of endogeneity is thatboth co-option and our variables of interests, such as pay, are determined inequilibrium simultaneously. One solution would be a valid instrument for theendogenous variable (Co-option). It is difficult, however, to find an instrumentthat is related to co-option but is not related to CEO pay or the other outcomeswe examine. As an alternative to firm fixed effects specifications, we turn to anatural experiment to help us address endogeneity concerns.
We exploit the rules enacted in 2002 by NASDAQ and NYSE, requiringall listed firms to have a majority of independent directors on their board.18
Because these rules were adopted shortly after the passage of SOX, werefer to the period following the proposal of the new stock exchange rules(2002–2010) as the post-SOX period. Pre-SOX noncompliant firms wererequired to increase board independence after implementation of the new listingrequirements, and these firms chose to add new independent directors to theboard (Linck, Netter, and Yang 2009). This resulted in an exogenous increasein co-option.19
To isolate the causal impact of co-option, we somewhat modify the Bertrandand Mullainathan (2003) difference-in-differences (DID) methodology. Thekey difference is that we allow for the possibility that SOX and associatedexchange provisions have a direct effect on turnover-performance-sensitivity,pay, pay-performance-sensitivity, and investment, as well as an effect throughco-option. This is because other regulations and political pressure arising fromSOX were likely to have affected monitoring through numerous channels.20
For example, under SOX and the associated exchange provisions: completeindependence was mandated for the compensation, audit, and monitoringcommittees; a director with financial expertise was required on the auditcommittee; in addition to their regular sessions, boards were required to meetwithout management; CEO/CFO certification of accounting statements wasrequired; and there was a general increase in media scrutiny of all firms.
18 A detailed time line is available in Chhaochharia and Grinstein (2007).
19 We are particularly grateful to the referee for suggesting this specific line of attack and for shaping some of theother aspects of our approach to ameliorating endogeneity concerns.
20 Indicative evidence on the effects of SOX on pay and turnover is presented in Chhaochharia and Grinstein (2007),Carter, Lynch, and Zechman (2009), and Kaplan and Minton (2012).
21
by guest on May 7, 2014
http://rfs.oxfordjournals.org/D
ownloaded from
[18:14 26/3/2014 RFS-hhu011.tex] Page: 22 1–46
The Review of Financial Studies / v 0 n 0 2014
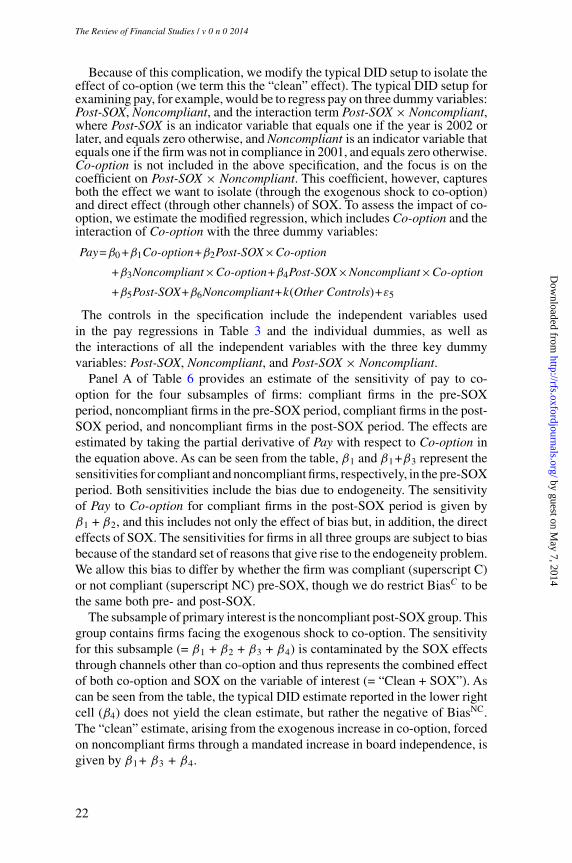
Because of this complication, we modify the typical DID setup to isolate theeffect of co-option (we term this the “clean” effect). The typical DID setup forexamining pay, for example, would be to regress pay on three dummy variables:Post-SOX, Noncompliant, and the interaction term Post-SOX × Noncompliant,where Post-SOX is an indicator variable that equals one if the year is 2002 orlater, and equals zero otherwise, and Noncompliant is an indicator variable thatequals one if the firm was not in compliance in 2001, and equals zero otherwise.Co-option is not included in the above specification, and the focus is on thecoefficient on Post-SOX × Noncompliant. This coefficient, however, capturesboth the effect we want to isolate (through the exogenous shock to co-option)and direct effect (through other channels) of SOX. To assess the impact of co-option, we estimate the modified regression, which includes Co-option and theinteraction of Co-option with the three dummy variables:
Pay=β0 +β1Co-option+β2Post-SOX×Co-option
+β3Noncompliant×Co-option+β4Post-SOX×Noncompliant×Co-option
+β5Post-SOX+β6Noncompliant+k(Other Controls)+ε5
The controls in the specification include the independent variables usedin the pay regressions in Table 3 and the individual dummies, as well asthe interactions of all the independent variables with the three key dummyvariables: Post-SOX, Noncompliant, and Post-SOX × Noncompliant.
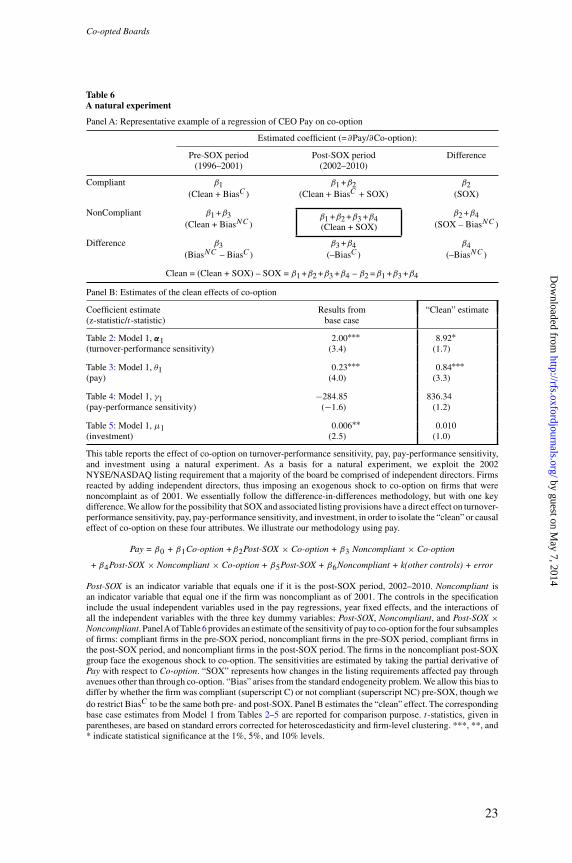
Panel A of Table 6 provides an estimate of the sensitivity of pay to co-option for the four subsamples of firms: compliant firms in the pre-SOXperiod, noncompliant firms in the pre-SOX period, compliant firms in the post-SOX period, and noncompliant firms in the post-SOX period. The effects areestimated by taking the partial derivative of Pay with respect to Co-option inthe equation above. As can be seen from the table, β1 and β1+β3 represent thesensitivities for compliant and noncompliant firms, respectively, in the pre-SOXperiod. Both sensitivities include the bias due to endogeneity. The sensitivityof Pay to Co-option for compliant firms in the post-SOX period is given byβ1 + β2, and this includes not only the effect of bias but, in addition, the directeffects of SOX. The sensitivities for firms in all three groups are subject to biasbecause of the standard set of reasons that give rise to the endogeneity problem.We allow this bias to differ by whether the firm was compliant (superscript C)or not compliant (superscript NC) pre-SOX, though we do restrict BiasC to bethe same both pre- and post-SOX.
The subsample of primary interest is the noncompliant post-SOX group. Thisgroup contains firms facing the exogenous shock to co-option. The sensitivityfor this subsample (= β1 + β2 + β3 + β4) is contaminated by the SOX effectsthrough channels other than co-option and thus represents the combined effectof both co-option and SOX on the variable of interest (= “Clean + SOX”). Ascan be seen from the table, the typical DID estimate reported in the lower rightcell (β4) does not yield the clean estimate, but rather the negative of BiasNC.The “clean” estimate, arising from the exogenous increase in co-option, forcedon noncompliant firms through a mandated increase in board independence, isgiven by β1+ β3 + β4.
22
by guest on May 7, 2014
http://rfs.oxfordjournals.org/D
ownloaded from
[18:14 26/3/2014 RFS-hhu011.tex] Page: 23 1–46
Co-opted Boards
Table 6A natural experiment
Panel A: Representative example of a regression of CEO Pay on co-option
Estimated coefficient (=∂Pay/∂Co-option):
Pre-SOX period Post-SOX period Difference(1996–2001) (2002–2010)
Compliant β1 β1 +β2 β2(Clean + BiasC ) (Clean + BiasC + SOX) (SOX)
NonCompliant β1 +β3 β1 +β2 +β3 +β4(Clean + SOX)
β2 +β4(Clean + BiasNC ) (SOX – BiasNC )
Difference β3 β3 +β4 β4(BiasNC – BiasC ) (–BiasC ) (–BiasNC )
Clean = (Clean + SOX) – SOX = β1 +β2 +β3 +β4 – β2 =β1 +β3 +β4
Panel B: Estimates of the clean effects of co-option
Coefficient estimate Results from “Clean” estimate(z-statistic/t-statistic) base case
Table 2: Model 1, α1 2.00∗∗∗ 8.92∗(turnover-performance sensitivity) (3.4) (1.7)
Table 3: Model 1, θ1 0.23∗∗∗ 0.84∗∗∗(pay) (4.0) (3.3)
Table 4: Model 1, γ1 −284.85 836.34(pay-performance sensitivity) (−1.6) (1.2)
Table 5: Model 1, μ1 0.006∗∗ 0.010(investment) (2.5) (1.0)
This table reports the effect of co-option on turnover-performance sensitivity, pay, pay-performance sensitivity,and investment using a natural experiment. As a basis for a natural experiment, we exploit the 2002NYSE/NASDAQ listing requirement that a majority of the board be comprised of independent directors. Firmsreacted by adding independent directors, thus imposing an exogenous shock to co-option on firms that werenoncomplaint as of 2001. We essentially follow the difference-in-differences methodology, but with one keydifference. We allow for the possibility that SOX and associated listing provisions have a direct effect on turnover-performance sensitivity, pay, pay-performance sensitivity, and investment, in order to isolate the “clean” or causaleffect of co-option on these four attributes. We illustrate our methodology using pay.
Pay = β0 + β1Co-option +β2Post-SOX × Co-option + β3 Noncompliant × Co-option
+ β4Post-SOX × Noncompliant × Co-option + β5Post-SOX + β6Noncompliant + k(other controls) + error
Post-SOX is an indicator variable that equals one if it is the post-SOX period, 2002–2010. Noncompliant isan indicator variable that equal one if the firm was noncompliant as of 2001. The controls in the specificationinclude the usual independent variables used in the pay regressions, year fixed effects, and the interactions ofall the independent variables with the three key dummy variables: Post-SOX, Noncompliant, and Post-SOX ×Noncompliant. PanelAofTable 6 provides an estimate of the sensitivity of pay to co-option for the four subsamplesof firms: compliant firms in the pre-SOX period, noncompliant firms in the pre-SOX period, compliant firms inthe post-SOX period, and noncompliant firms in the post-SOX period. The firms in the noncompliant post-SOXgroup face the exogenous shock to co-option. The sensitivities are estimated by taking the partial derivative ofPay with respect to Co-option. “SOX” represents how changes in the listing requirements affected pay throughavenues other than through co-option. “Bias” arises from the standard endogeneity problem. We allow this bias todiffer by whether the firm was compliant (superscript C) or not compliant (superscript NC) pre-SOX, though wedo restrict BiasC to be the same both pre- and post-SOX. Panel B estimates the “clean” effect. The correspondingbase case estimates from Model 1 from Tables 2–5 are reported for comparison purpose. t-statistics, given inparentheses, are based on standard errors corrected for heteroscedasticity and firm-level clustering. ***, **, and* indicate statistical significance at the 1%, 5%, and 10% levels.
23
by guest on May 7, 2014
http://rfs.oxfordjournals.org/D
ownloaded from

[18:14 26/3/2014 RFS-hhu011.tex] Page: 24 1–46
The Review of Financial Studies / v 0 n 0 2014
Panel B of Table 6 provides the results. For brevity, we present only theclean estimates for the total impact of co-option on each of the four variablesof interest (turnover-performance sensitivity, pay, pay-performance sensitivity,and investment). For ease of comparison, we report results from the base caseregressions (model 1 of Tables 2–5). In terms of the notation in the regressionspecifications defined above, we report clean estimates of α1,θ1,γ 1, and μ1.
For turnover and pay level, relative to the base case, the estimates basedon an exogenous shock to co-option have the same sign and similar (thoughnot quite as strong) statistical significance. The clean estimate pertaining tothe effect of co-option on CEO PPS, like that in the base case, is statisticallyinsignificant. The clean effect of co-option on investment policy is still positive,but statistically weaker (t-statistic = 1.0 vs. 2.5) than the estimated coefficientfrom the base case.
5. Are All Independent Directors Equally Relevant for Board Monitoring?
In this section, we examine whether the monitoring effectiveness of directorsvaries depending on whether or not they are independent and by whether or notthey are co-opted.
5.1 Co-option: Independent versus nonindependent directorsOur results thus far indicate that board capture is associated with weakermonitoring. The measures of co-option used above, however, do notdifferentiate between directors who are independent versus those who are not.Indeed, the notion that employee and affiliated directors are co-opted is the basisfor using board independence as a measure of monitoring (e.g., Weisbach 1988;Byrd and Hickman 1992). The question remains as to whether co-option bluntsthe monitoring effectiveness of independent directors. If we find that co-opteddirectors who are independent are also weak monitors, then it would suggest thatthe independence measure traditionally used in the literature does not capturethe disposition of the board to provide effective oversight and monitoring andthus can be improved. To examine this question, we further refine Co-option.Co-opted Independence is defined as the proportion of the board that consists ofco-opted directors who are independent, whereas Co-opted Non-independenceis defined as the proportion of the board that consists of co-opted directors whoare not independent. These two measures differentiate between directors whoare employees or affiliated versus those who are supposedly independent.
Table 7 documents the results. In Panel A, for ease of comparison, wereproduce our base case results on Co-option (model 1 of Tables 2–5).We report the coefficients and associated t-statistics only for our primaryvariables. Panels B and C report our results wherein we replace Co-optionby Co-opted Independence and Co-opted Non-Independence, respectively.In Panel B, we find that Co-opted Independence is associated with attenuatedturnover-performance sensitivity, higher pay, lower CEO delta, and higherinvestment. Per Panel C, Co-opted Non-Independence is associated with
24
by guest on May 7, 2014
http://rfs.oxfordjournals.org/D
ownloaded from
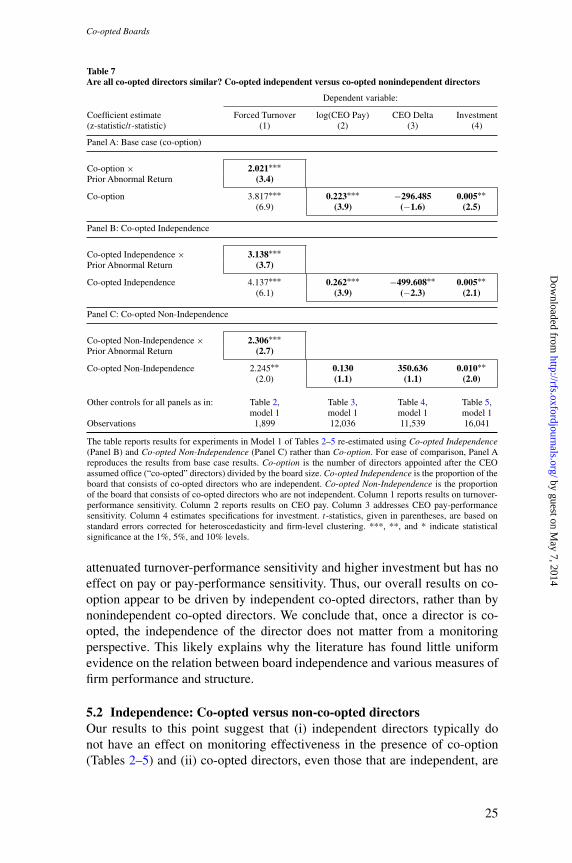
[18:14 26/3/2014 RFS-hhu011.tex] Page: 25 1–46
Co-opted Boards
Table 7Are all co-opted directors similar? Co-opted independent versus co-opted nonindependent directors
Dependent variable:
Coefficient estimate Forced Turnover log(CEO Pay) CEO Delta Investment(z-statistic/t-statistic) (1) (2) (3) (4)
Panel A: Base case (co-option)
Co-option × 2.021∗∗∗Prior Abnormal Return (3.4)
Co-option 3.817∗∗∗ 0.223∗∗∗ −296.485 0.005∗∗(6.9) (3.9) (−1.6) (2.5)
Panel B: Co-opted Independence
Co-opted Independence × 3.138∗∗∗Prior Abnormal Return (3.7)
Co-opted Independence 4.137∗∗∗ 0.262∗∗∗ −499.608∗∗ 0.005∗∗(6.1) (3.9) (−2.3) (2.1)
Panel C: Co-opted Non-Independence
Co-opted Non-Independence × 2.306∗∗∗Prior Abnormal Return (2.7)
Co-opted Non-Independence 2.245∗∗ 0.130 350.636 0.010∗∗(2.0) (1.1) (1.1) (2.0)
Other controls for all panels as in: Table 2, Table 3, Table 4, Table 5,model 1 model 1 model 1 model 1
Observations 1,899 12,036 11,539 16,041
The table reports results for experiments in Model 1 of Tables 2–5 re-estimated using Co-opted Independence(Panel B) and Co-opted Non-Independence (Panel C) rather than Co-option. For ease of comparison, Panel Areproduces the results from base case results. Co-option is the number of directors appointed after the CEOassumed office (“co-opted” directors) divided by the board size. Co-opted Independence is the proportion of theboard that consists of co-opted directors who are independent. Co-opted Non-Independence is the proportionof the board that consists of co-opted directors who are not independent. Column 1 reports results on turnover-performance sensitivity. Column 2 reports results on CEO pay. Column 3 addresses CEO pay-performancesensitivity. Column 4 estimates specifications for investment. t-statistics, given in parentheses, are based onstandard errors corrected for heteroscedasticity and firm-level clustering. ***, **, and * indicate statisticalsignificance at the 1%, 5%, and 10% levels.
attenuated turnover-performance sensitivity and higher investment but has noeffect on pay or pay-performance sensitivity. Thus, our overall results on co-option appear to be driven by independent co-opted directors, rather than bynonindependent co-opted directors. We conclude that, once a director is co-opted, the independence of the director does not matter from a monitoringperspective. This likely explains why the literature has found little uniformevidence on the relation between board independence and various measures offirm performance and structure.
5.2 Independence: Co-opted versus non-co-opted directorsOur results to this point suggest that (i) independent directors typically donot have an effect on monitoring effectiveness in the presence of co-option(Tables 2–5) and (ii) co-opted directors, even those that are independent, are
25
by guest on May 7, 2014
http://rfs.oxfordjournals.org/D
ownloaded from

[18:14 26/3/2014 RFS-hhu011.tex] Page: 26 1–46
The Review of Financial Studies / v 0 n 0 2014
Table 8Are non-co-opted independent directors more effective monitors?
Panel A: Comparison of co-option and independence measures
Co-opted?yes no
Inde
pend
ent? yes Co-opted Independence + Non-Co-opted Independence = Independence
+
no Co-opted Non-Independence Non-Co-opted Non-Independence
= Co-option
Panel B: Results for Model 1 (Tables 2–5) using Non-Co-opted Independence as primary explanatory variable
Dependent variable:
Forced Turnover log(CEO Pay) CEO Delta Investment(1) (2) (3) (4)
Non-Co-opted Independence × −2.899∗∗∗Prior Abnormal Return (−3.4)
Non-Co-opted Independence −4.314∗∗∗ −0.210∗∗∗ 358.878∗ −0.006∗∗(−6.2) (−3.2) (1.9) (−2.4)
Other controls as in: Table 2, model 1 Table 3, model 1 Table 4, model 1 Table 5, model 1Observations 1,899 12,036 11,539 16,041
Panel A depicts the overlap and dissimilarity between co-option and independence. Co-option is the numberof directors appointed after the CEO assumed office (“co-opted” directors) divided by the board size.Independence is the proportion of the board that consists of independent directors. Co-opted Independence is theproportion of the board that consists of co-opted directors who are independent. Co-opted Non-Independenceis the proportion of the board that consists of co-opted directors who are not independent. The sum ofCo-opted Independence and Co-opted Non-Independence equals Co-option. Non-Co-opted Independence isthe proportion of the board that consists of independent directors who were already on the board when the CEOassumed office. The sum of Co-opted Independence and Non-Co-opted Independence equals Independence.Non-Co-opted Non-Independence is the proportion of the board that consists of nonindependent directors whowere already on the board when the CEO assumed office. Panel B reports results for experiments in Model1 of Tables 2–5 re-estimated by replacing Co-option and Independence using Non-Co-opted Independence asthe key explanatory variable. Column 1 reports results on turnover-performance sensitivity. Column 2 reportsresults on CEO pay. Column 3 addresses CEO pay-performance sensitivity. Column 4 estimates specificationsfor investment. t-statistics, given in parentheses, are based on standard errors corrected for heteroscedasticityand firm-level clustering. ***, **, and * indicate statistical significance at the 1%, 5%, and 10% levels.
weak monitors (Table 7). It is likely, therefore, that only independent directorswho are not co-opted by the CEO are effective monitors. To test this formally,we introduce a second new measure of board composition, Non-Co-optedIndependence. We define this as the proportion of the board that consists ofindependent directors who were already on the board when the CEO assumedoffice.
Panel A of Table 8 depicts the overlap and dissimilarity between ourmeasures of co-option and independence. As can be seen, the sum of Co-optedIndependence and Co-opted Non-Independence equals Co-option, whereasthe sum of Co-opted Independence and Non-Co-opted Independence equalsIndependence.
Figure 2 plots how the various board composition measures described abovechange over CEO tenure. As expected, Co-option increases with CEO tenure.This is because in each director election cycle the CEO has the opportunity to
26
by guest on May 7, 2014
http://rfs.oxfordjournals.org/D
ownloaded from

[18:14 26/3/2014 RFS-hhu011.tex] Page: 27 1–46
Co-opted Boards
0
0.2
0.4
0.6
0.8
1
0 1 2 3 4 5 6 7 8 9 10 11
Boa
rd C
ompo
sitio
n
CEO Tenure
Co-optionIndependence
Co-opted Independence
Non-Co-opted Independence
+≤
Figure 2Board composition and CEO tenureThe figure plots various measures of board composition and co-option against CEO tenure. Co-option is thenumber of directors appointed after the CEO assumed office (“co-opted” directors) divided by the board size.Independence is the proportion of the board that consists of independent directors. Co-opted Independence is theproportion of the board that consists of co-opted directors who are independent. Non-Co-opted Independenceis the proportion of the board that consists of independent directors who were already on the board when theCEO assumed office. The sum of Co-opted Independence and Non-Co-opted Independence equals Independence.CEOs are put in eleven groups based on their tenure, where CEO tenure is measured as fiscal year-end date minusthe date at which the executive became the CEO. All CEOs with �1 year are put in the first group, . . . , CEOswith tenure greater than 9 years but �10 years are put in the tenth group, and CEOs with greater than 10 yearsare put in the eleventh group.
affect the nomination of directors to the board. Independence, however, remainsmore or less constant (at around 69% in our sample). Thus, while on the surfaceit appears that board independence is high, the composition of the board asrepresented by co-option gradually tilts in the CEO’s favor over time. Further,a closer look at the two components of Independence indicates that as CEOtenure increases, Co-opted Independence increases, whereas Non-Co-optedIndependence decreases. This arises as the CEO replaces previously appointedindependent with new independent directors. This suggests that the monitoringeffectiveness of the board weakens over the CEO’s tenure. We explore this issueby estimating our base case regressions with both Co-option and Independencereplaced by Non-Co-opted Independence as the key dependent variable.
Panel B of Table 8 reports the results. Consistent with the idea thatindependent directors who are not co-opted are better monitors, we find Non-Co-opted Independence is associated with higher sensitivity of CEO turnoverto performance, lower pay levels, higher sensitivity of pay to performance, andlower investment.
27
by guest on May 7, 2014
http://rfs.oxfordjournals.org/D
ownloaded from

[18:14 26/3/2014 RFS-hhu011.tex] Page: 28 1–46
The Review of Financial Studies / v 0 n 0 2014
Overall, these results are consistent with non-co-opted directors beingeffective monitors. Moreover, it appears that not all independent directors arethe same. Differentiating among independent directors by whether or not theyare co-opted appears to be a more incisive way to explain monitoring intensityof the board. Independent directors whose selection was influenced by the CEOappear to be more sympathetic to the CEO. On the other hand, non-co-optedindependent directors appear to be effective monitors. Relative to aggregateboard independence, the representation of non-co-opted independent directorson the board appears to be a sharper measure of monitoring effectiveness.
6. Alternative Interpretations and Other Robustness Checks
6.1 Is Co-option capturing the effect of CEO tenure?Figure 2 shows that Co-option increases over the CEO’s tenure. It is likely thatCEO power increases with tenure (e.g., see Weisbach 1988; Ryan and Wiggins2004). Thus, CEO tenure may be correlated with both power and Co-option, andit is possible that our results on the effect of co-option are due to the positiveassociation between co-option and CEO tenure. We perform three tests andconclude that CEO tenure is not causing our results.
First, our base case specifications already include CEO tenure as a controlvariable in all our regression specifications. Thus, the effect of co-option thatwe document earlier is after controlling for CEO tenure.
Second, in the specifications in Tables 2–5 (model 1), instead of Co-option,we use Residual Co-option, which is the residual from a regression of Co-option on CEO tenure. The residual now no longer proxies for power arisingfrom tenure but is a proxy for power related to co-option of the board. We findthat all results on Residual Co-option are similar to our results on Co-option.21
Third, we drop Co-option from all specifications and use only tenure as ourmeasure of the CEO’s power over the board. If it is true that our results onCo-option somehow obtain only because of the positive correlation betweentenure and Co-option, and do not reflect the true effect of board capture, thenwhen we drop Co-option from the regressions, our results on tenure shouldbe similar to what we reported earlier with Co-option. That is, we should findthat tenure decreases CEO turnover-performance sensitivity, increases CEOpay, decreases CEO pay-performance sensitivity, and increases investment.The results, however, do not support the idea that co-option is only capturingthe effect of CEO tenure on monitoring. We find that CEO tenure has a positiveeffect on turnover-performance sensitivity, similar to the effect of co-option.In contrast to the effect of co-option, however, CEO tenure has no effect onpay or investment and a positive association with pay-performance sensitivity.
21 The results are similar when we use Residual TW Co-option (the residual from a regression of TW Co-option onCEO tenure) instead. In the interests of conciseness, we do not tabulate the results here or below. All results areavailable from the authors on request.
28
by guest on May 7, 2014
http://rfs.oxfordjournals.org/D
ownloaded from

[18:14 26/3/2014 RFS-hhu011.tex] Page: 29 1–46
Co-opted Boards
Overall, the analysis in this section suggests that our results on Co-optionare not driven by the effects of CEO tenure.
6.2 Is Co-option capturing the effect of director inexperience?Another possibility is that our measures of co-option reflect the inexperienceof co-opted directors, as indicated by the average tenure of directors on theboard. Higher co-option could mean that there are several new directors andthese new directors are less experienced (at least on that board). They maynot be sympathetic to the CEO but, perhaps, they are slower to react to poorperformance and more ready to award favorable pay packages and approveinvestment projects proposed by the CEO. Average director tenure, thus, wouldbe correlated with co-option as well as with director inexperience. To isolate theeffect of co-option, as with CEO tenure, we perform three different tests. First,we include average director tenure in our baseline specifications. The resultsare similar to our base case regressions. Second, we estimate the residual from aregression of Co-option on average director tenure and then include this residual(termed “Director-Tenure-Adjusted Co-option”) in the regressions instead ofCo-option, along with necessary interactions. We find that our results on theadjusted co-option measure are similar to our results on Co-option. Finally,we exclude Co-option from our baseline specifications but include averagedirector inexperience, as well as the necessary interaction terms. We find thataverage director tenure has no effect on turnover-performance sensitivity, pay-performance sensitivity, or investment, and has a negative effect on pay.
Overall, there is no evidence that director inexperience causes a spuriousrelation between co-option and monitoring effectiveness.
6.3 Is Co-option capturing the “Involved CEO” effect of Shivdasani andYermack?
Shivdasani and Yermack (1999) construct an indicator variable, Involved CEO,which equals one if the firm has a nominating committee and the CEO is part ofthe committee or if the firm has no nominating committee. In the latter instance,the presumption is that if there is no nominating committee the CEO will bemore centrally involved in director selection. Shivdasani and Yermack showthat when a CEO is involved in director selection as part of the nominatingcommittee, then he or she tends to appoint more gray outside directors andfewer independent outside directors. Shivdasani and Yermack do not examinethe effect of Involved CEO on CEO turnover-performance sensitivity, pay, pay-performance sensitivity, or firm investment. It is possible, however, that ourco-option variable does not provide additional explanatory power relative toInvolved CEO because both variables proxy for the same underlying construct,the extent of the CEO’s influence on the board.
The data do not support this conjecture. First, following the 2002 NYSEand the NASDAQ listing requirements for completely independent nominatingcommittees, the Shivdasani-Yermack measure should, by definition, be zero for
29
by guest on May 7, 2014
http://rfs.oxfordjournals.org/D
ownloaded from

[18:14 26/3/2014 RFS-hhu011.tex] Page: 30 1–46
The Review of Financial Studies / v 0 n 0 2014
all firms. Consistent with this, we find that the mean of Involved CEO dropsfrom about 54% in 1998 (the first year for which RiskMetrics has data onsubcommittees) to 1.9% in 2010, and the correlation between Co-option andInvolved CEO over the entire time interval is only 0.11.
To verify that our co-option measure provides additional explanatory powerrelative to Involved CEO, we perform three different tests. First, we includeInvolved CEO as an additional explanatory variable in all our regressions.We find that the results on Co-option are qualitatively similar. Second, weestimate the residual from a regression of Co-option on Involved CEO. Theresidual, which we term Involved-CEO-Adjusted Co-option, is uncorrelatedwith Involved CEO by construction. We include this residual along withthe usual interactions in model 1 of Tables 2–5. We find that the resultsusing Involved-CEO-Adjusted Co-option are qualitatively similar to our resultsusing Co-option. Third, we drop Co-option from our regressions but includeInvolved CEO and relevant interactions. We find that Involved CEO isnot associated with turnover-performance sensitivity, pay levels, and pay-performance sensitivity but is positively associated with investment. Overall,the evidence does not support the notion that Involved CEO drives ourresults. This in no way negates the results found in Shivdasani and Yermack.Indeed, our findings on co-option are consistent with the premise of theirpaper. Our results suggest that rule changes enacted subsequent to the sampleperiod they analyze reduce the relevance and explanatory power of theirmeasure.
7. Conclusion
The economics of director selection and performance are more complex thanstandard, widely used measures of board structure, such as board independence,would suggest. Director co-option, by way of loyalty and allegiance to the CEOwho is associated with appointment of a director, is likely to affect what thatdirector actually does. Directors who are appointed by a CEO, regardless ofwhether they are independent in the legal sense, are more sympathetic to thatCEO (Mace 1971; Lorsch and MacIver 1989; Shivdasani and Yermack 1999).
We propose and empirically examine two new measures of boardcomposition that reflect the extent of the CEO’s influence on directors. Co-option is the fraction of the board comprised of directors appointed afterthe CEO assumes office. We provide evidence that co-option reduces themonitoring effectiveness of the board of directors. We find that (i) the sensitivityof CEO turnover to performance decreases with co-option, (ii) CEO payincreases with co-option, but the sensitivity of CEO pay to firm performanceis unaffected, and (iii) investment increases with co-option.
Testing robustness, the results are similar for various alternative measures ofco-option. These results obtain after we control for the traditional measureof board independence (the fraction of independent directors). Our results
30
by guest on May 7, 2014
http://rfs.oxfordjournals.org/D
ownloaded from

[18:14 26/3/2014 RFS-hhu011.tex] Page: 31 1–46
Co-opted Boards
are robust to our best attempts to address endogeneity. We use firm fixedeffects in our main specifications. Alternatively, we use the changes in NYSEand NASDAQ listing requirements, which led to an exogenous increase inco-option in firms that were noncompliant as of the announcement. Using thisclean source of identification, we find qualitatively similar results on the effectsof co-option on turnover, pay, and pay-performance sensitivity, although wefind a weaker estimated effect on investment.
Further analysis reveals that independent directors that are co-opted behaveas though they are not independent. Thus, we refine the conventional measureof board independence to be the proportion of board members who areindependent directors but are not co-opted. This second measure, Non-Co-opted Independence, focuses on independent directors who are most likely to betruly independent. We find that boards with a higher proportion of non-co-optedindependent directors provide more effective monitoring. Higher Non-Co-opted Independence is associated with higher sensitivity of CEO turnover toperformance, lower pay levels, higher sensitivity of pay to performance, andlower investment.
In terms of future research, it is possible that there are offsetting economicbenefits to co-option. For example, CEOs with more co-opted boards may bemore insulated from the threat of dismissal and, consequently, may invest morein firm-specific human capital (Burkart, Gromb, and Panunzi 1997) or in riskyprojects with long term payoffs (Deangelo and Rice 1983; Stein 1988). Proxiesfor such human capital intensity (HCI) include within-industry heterogeneityin growth rates, R&D intensity, and firm-specific risk. In regression results notreported here, we find some preliminary evidence that Co-option is positivelyassociated with these HCI proxies and that Tobin’s q increases in Co-option forhigh-HCI firms. We defer presenting those empirical results in detail until wedevelop defensible conceptual and econometric foundations for the empiricalanalysis.
More broadly, beyond turnover-performance sensitivity, pay level, executivepay-performance-sensitivity, and investment policy—the issues we examineherein—there is a large literature on the importance of board monitoringin empirical corporate finance. When appropriate, researchers can re-examine prior research questions and the corresponding experiments usingnew measures, Co-option and Non-Co-opted Independence. For example,experiments that regress structure on structure would relate our measuresof board capture to takeover bids (hostile or friendly, as bidder or target),takeover defenses (such as poison pills, antitakeover charter amendments,staggered boards, blank-check preferred stock, and supermajority votingrules), state takeover law (as determined by domicile), product marketcharacteristics (including monopoly power and regulatory structure), financialpolicy (e.g., capital structure, cash holdings, and hedging), institutionalownership, investment policy (such as firm focus and asset intangibility),dividend policy, and other firm characteristics (such as size and whether
31
by guest on May 7, 2014
http://rfs.oxfordjournals.org/D
ownloaded from
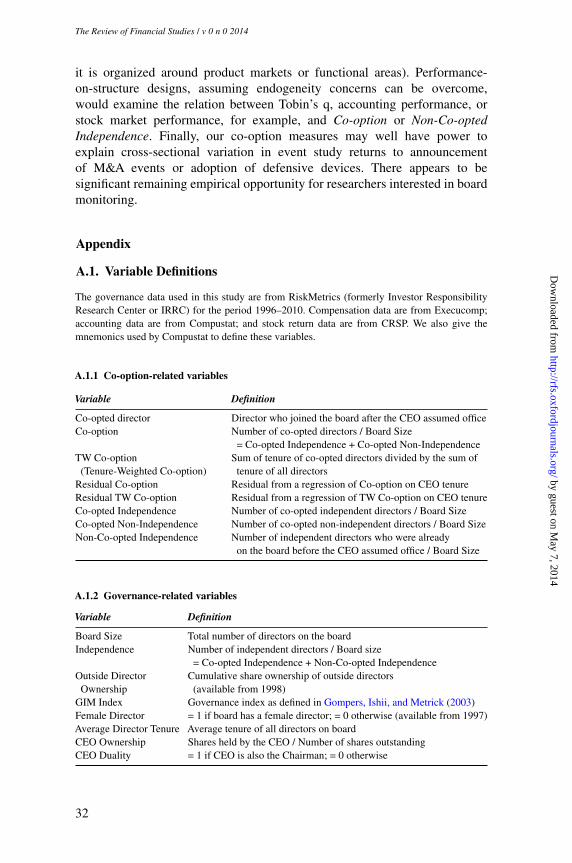
[18:14 26/3/2014 RFS-hhu011.tex] Page: 32 1–46
The Review of Financial Studies / v 0 n 0 2014
it is organized around product markets or functional areas). Performance-on-structure designs, assuming endogeneity concerns can be overcome,would examine the relation between Tobin’s q, accounting performance, orstock market performance, for example, and Co-option or Non-Co-optedIndependence. Finally, our co-option measures may well have power toexplain cross-sectional variation in event study returns to announcementof M&A events or adoption of defensive devices. There appears to besignificant remaining empirical opportunity for researchers interested in boardmonitoring.
Appendix
A.1. Variable Definitions
The governance data used in this study are from RiskMetrics (formerly Investor ResponsibilityResearch Center or IRRC) for the period 1996–2010. Compensation data are from Execucomp;accounting data are from Compustat; and stock return data are from CRSP. We also give themnemonics used by Compustat to define these variables.
A.1.1 Co-option-related variables
Variable Definition
Co-opted director Director who joined the board after the CEO assumed officeCo-option Number of co-opted directors / Board Size
= Co-opted Independence + Co-opted Non-IndependenceTW Co-option Sum of tenure of co-opted directors divided by the sum of
(Tenure-Weighted Co-option) tenure of all directorsResidual Co-option Residual from a regression of Co-option on CEO tenureResidual TW Co-option Residual from a regression of TW Co-option on CEO tenureCo-opted Independence Number of co-opted independent directors / Board SizeCo-opted Non-Independence Number of co-opted non-independent directors / Board SizeNon-Co-opted Independence Number of independent directors who were already
on the board before the CEO assumed office / Board Size
A.1.2 Governance-related variables
Variable Definition
Board Size Total number of directors on the boardIndependence Number of independent directors / Board size
= Co-opted Independence + Non-Co-opted IndependenceOutside Director Cumulative share ownership of outside directors
Ownership (available from 1998)GIM Index Governance index as defined in Gompers, Ishii, and Metrick (2003)Female Director = 1 if board has a female director; = 0 otherwise (available from 1997)Average Director Tenure Average tenure of all directors on boardCEO Ownership Shares held by the CEO / Number of shares outstandingCEO Duality = 1 if CEO is also the Chairman; = 0 otherwise
32
by guest on May 7, 2014
http://rfs.oxfordjournals.org/D
ownloaded from

[18:14 26/3/2014 RFS-hhu011.tex] Page: 33 1–46
Co-opted Boards
A.1.3 CEO-related variables
Variable Definition
Forced Turnover = 1 if the departing CEO was younger than 60 years of age; = 0otherwise
CEO Pay Total annual pay (Execucomp: TDC1)CEO Pay-Performance Expected dollar change in CEO wealth for a 1% change in stock
Sensitivity (Delta) price (using entire portfolio of stocks and options) computed as inCore and Guay (2002)
CEO Vega Expected dollar change in CEO wealth for a 0.01 change in stockreturn volatility (using entire portfolio of options) computed as inGuay (1999)
CEO Tenure Tenure as CEO of the firm = fiscal year end date minus datebecame CEO
CEO Cash Compensation Sum of salary and bonus (Execucomp: TCC)Involved CEO = 1 if the firm has no nominating committee, or if the firm has a
nominating committee and the CEO is a member; = 0 otherwise
A.1.4 Firm-level variables
Variable Definition Mnemonic
Investment Capital Expenditure / Assets capx / atReturn Stock return over the fiscal year RET variable in ExecucompROA Return on Assets = EBITDA/Assets oibdp / atFCF/Assets Free cash flow / Assets (oancf – dvc – dvp) / atLeverage Total Debt / Assets (dltt + dlc) / atFirm Size Log(sales) Log(sale)Tobin’s q (Assets – Book equity + (at – ceq + prcc_f×csho) / at
Market equity) / AssetsUnsystematic Risk Standard deviation of residuals from
Fama-French regression using dailystock returns
R&D/Assets R&D expenditure / Assets xrd / atSales Growth Sales / Lagged Sales sale / Lagged(sale)
A.2. RiskMetrics Adjustment
Our governance data are drawn from RiskMetrics. One complication with this dataset is thatthere is no unique firm identifier or unique director identifier across all the years. AlthoughRiskMetrics has CUSIP, TICKER, NAME, and RT_ID as company identifiers, none of theseare unique across the entire sample period. Similarly, RiskMetrics has LEGACY_DIRECTOR_IDand DIRECTOR_DETAIL_ID as director identifiers, but these are also not unique or consistentacross the entire sample period. The Wharton Research Data Services (WRDS) states on its website“Each time IRRC - ISS - RiskMetrics was acquired, new identification methods were introduced .. . Constructing a complete time series in the directors data is not easy. There is no single variablethat is populated for all companies and all years.” We explain below how we resolve the lack ofunique firm and director identifiers. In the process, we also associate each firm-year with uniquePERMNO and GVKEY, enabling us to merge the RiskMetrics dataset with CRSP and Compustat.In what follows below, variables we create are indicated in italics, whereas variables drawn fromstandard databases are in uppercase.
33
by guest on May 7, 2014
http://rfs.oxfordjournals.org/D
ownloaded from

[18:14 26/3/2014 RFS-hhu011.tex] Page: 34 1–46
The Review of Financial Studies / v 0 n 0 2014
The authors are happy to provide the exact GVKEY – PERMNO – YEAR – CUSIP –MEETINGDATE – LEGACY_DIRECTOR_ID – DIRECTOR_DETAIL_ID – Our Director IDcombinations on request, where
YEAR =fiscal year of data (from Compustat)
CUSIP=firm CUSIP (from RiskMetrics)
MEETINGDATE=annual meeting date (from RiskMetrics)
LEGACY_ DIRECTOR_ID, DIRECTOR_DETAIL_ID
=Director ID variables (from RiskMetrics)
Our Director ID=unique director ID that we create
Researchers can then merge our dataset with the RiskMetrics dataset using CUSIP –MEETINGDATE – LEGACY_DIRECTOR_ID – DIRECTOR DETAIL ID to obtain director data,use GVKEY – YEAR to merge with Compustat, use PERMNO (and MEETINGDATE if required)to merge with CRSP, use GVKEY or PERMNO to uniquely identify firms, and use Our DirectorID to uniquely identify directors.
A.2.1 Issues with firm identifierStarting in 2007, RiskMetrics changed the methodology used to collect data. As a result,data on directors are provided in two datasets in WRDS: a “Directors Legacy” dataset thatprovides data from 1996–2006 and a “Directors” dataset that provides information from 2007and onward.
For records from 1996–2006, the CUSIP provided is the 6-digit CUSIP (we refer to this asCusip6) and for records on or after 2007, the CUSIP provided is the 9-digit CUSIP. We use onlythe first 8 digits of this (we refer to this as Cusip8) because CRSP provides only 8-digit CUSIP.Additionally, Cusip6 is the header CUSIP, which means that each time the database was updatedthe most recent CUSIP was applied to the entire history for each company. Since this dataset wasnot updated after 2007, the Cusip6 was the 6-digit CUSIP for the firm as of 2006 (or, as of the lastdate the firm was included in the database). Cusip8, on the other hand, is the actual CUSIP for thefirm for that year. In both datasets, RiskMetrics also provides the ticker (TICKER) and companyname (NAME) associated with the firm for that year. We use these in addition to CUSIP to identifyfirms.22
We obtain the PERMNOs from CRSP for each firm using the methodology below. We startwith the dataset DSENAMES from CRSP, which contains, for each PERMNO, the full historyof changes in NCUSIP (the historic CUSIP), firm ticker (TICKER), and firm name (COMNAM).From this dataset, we create a dataset of unique NCUSIP-PERMNO combinations along with thecorresponding date range over which this combination is valid (which we denote as Start Date andEnd Date). These dates are obtained using NAMEDT and NAMEENDT variables from CRSP. Wedo this separately for 8-digit NCUSIPs (NCusip8 – PERMNO – Start Date – End Date) as well asfor 6-digit NCUSIPS (NCusip6 – PERMNO – Start Date – End Date). Similarly, we obtain, foreach PERMNO, all the tickers associated with it and its relevant date range (TICKER – PERMNO– Start Date – End Date) and all the firm names associated with it and its relevant date range(COMNAM – PERMNO – Start Date – End Date).
22 RiskMetrics includes 2 company identifiers: LEGACY_PPS_ID (before 2004) and RT_ID (after 2004). Neitherof these uniquely identify firms across the entire time period. Further, they cannot be used to merge with otherdatabases such as CRSP etc. because they are created by IRRC and by WRDS. Therefore we do not use theseIDs.
34
by guest on May 7, 2014
http://rfs.oxfordjournals.org/D
ownloaded from

[18:14 26/3/2014 RFS-hhu011.tex] Page: 35 1–46
Co-opted Boards
We start with 23,242 unique firm-year observations in the RiskMetrics dataset (downloaded asof November 2011; recent downloads will clearly have a different number of observations). Ofthis, 5,810 observations correspond to the post-2007 period. We match the post-2007 RiskMetricsdata with the NCusip8 - PERMNO – Start Date – End Date dataset that we created above usingCusip8 and MEETINGDATE variables of RiskMetrics. We obtain a unique PERMNO for eachfirm by ensuring that MEETINGDATE is between the Start Date and End Date. We obtain a matchfor 5,366 of the 5,810 observations.
For the remaining 444 (= 5,810 – 5,366) observations that do not match using Cusip8, we matchusing Cusip6. Specifically, we match the RiskMetrics data with the NCusip6 - PERMNO – StartDate – End Date dataset. Again, we impose the condition that the MEETINGDATE should bebetween the Start Date and End Date for which the NCusip6 is valid. We find duplicate matchesfor firms that have multiple traded securities, particularly dual class shares. We identify the correctPERMNO in these cases using data on dual-class shares from Gompers, Ishii, and Metrick (2010)(available through WRDS) and through Web searches. This yields 109 firm-year observations thatmatch on Cusip6.
For the remaining 335 (= 444 - 109) observations, we match using RiskMetrics variableTICKER. We then identify firms for which the RiskMetrics TICKER matches with the CRSPTICKER.23 After imposing the condition that MEETINGDATE should be between the Start Dateand End Date for which the TICKER is valid, and eliminating duplicates as before, we obtain amatch for 319 firm-year observations.
Finally, for the remaining 16 (= 335 - 319) observations, we match the RiskMetrics companyname (NAME) with the CRSP name (COMNAM). We do not find any matches after imposingthe condition that MEETINGDATE should be between the Start Date and End Date for whichCOMNAM is valid.
We attempt to populate these 16 observations as follows. If two firm-years have the same Cusip8around the year for which we have not been able to find a PERMNO, then we assign the PERMNOof the adjoining year for the missing observation. This procedure yields a match for another 10observations.
For the pre-2007 period, we start with 17,432 firm-year observations on RiskMetrics. We followa very similar procedure as we did for the post-2007 data, but with one minor difference. Becausethe Cusip6 is the header CUSIP, we cannot match based on the actual MEETINGDATE as wedid with the post-2007 data. We therefore first identify the last year for which the firm was in theRiskMetrics legacy dataset. We label this as LastMeetingDate and we assign this for all years forthat firm.
We then merge the RiskMetrics data with our NCusip6 - PERMNO – Start Date – End Datedataset and require the LastMeetingDate to be between the Start Date and End Date. We obtain amatch for 17,089 observations. We pick up duplicates (308 firms on RiskMetrics match with morethan one PERMNO on CRSP) because of dual-class shares. As before, we check each of thesemanually to identify the correct PERMNO and eliminate all duplicates.
We next match the 343 (= 17,432 - 17,089) remaining observations using TICKER. We requirethe MEETINGDATE to be between the Start Date and End Date (unlike Cusip6, which is theheader CUSIP on RiskMetrics, TICKER and NAME are historic). After eliminating duplicatematches by manually checking the observations, we identify the correct PERMNOs for 312 firm-years. That leaves 31 observations, which we match using NAME and MEETINGDATE. We findone match here. Finally, as before, for the 30 observations for which we could not find a match, weidentify the correct PERMNOs for 23 observations by imposing the condition that if two firm-yearshave the same NCusip6, then they should have the same PERMNO.
23 RiskMetrics ticker includes a period character in the case of dual class securities. For example, BerkshireHathaway’s ticker is BRK.B. CRSP does not follow the same nomenclature. We therefore remove the period andany characters after the period (“.B” in the Berkshire example) from the RiskMetrics ticker before matching withCRSP ticker. Also, before matching by name, we remove the following characters – space, period, ampersand,and comma – in both CRSP and RiskMetrics names.
35
by guest on May 7, 2014
http://rfs.oxfordjournals.org/D
ownloaded from

[18:14 26/3/2014 RFS-hhu011.tex] Page: 36 1–46
The Review of Financial Studies / v 0 n 0 2014
Overall, we are able to find a unique PERMNO for 5,804 of the 5,810 firm-year observationspost-2007 and for 17,425 of the 17,432 observations pre-2007. We check these 13 unmatchedobservations by hand and find that many of them do not match because of data entry errors byRiskMetrics, and in some cases, the MEETINGDATE precedes the Start Date by a few days. Oncewe correct for these, we are able to obtain matching PERMNOs for all 13 of these observations.Thus, our procedure finds a matching PERMNO for every observation on RiskMetrics.
We finally match this data with the CRSP-Compustat combined database to obtain GVKEYand YEAR (fiscal year of the data) associated with each firm-year on RiskMetrics usingPERMNO and MEETINGDATE by ensuring that MEETINGDATE falls between the fiscal yearbeginning and ending dates. Either the GVKEY or PERMNO then uniquely identifies the samplefirms.
A.2.2 Issues with director identifierThere is no unique director identifier (ID) across the two RiskMetrics directors’ datasets. Twosets of director IDs are maintained. The first is LEGACY_DIRECTOR_ID, and the second isDIRECTOR_DETAIL_ID. The latter variable is supplied by WRDS from 2004 and onward.All directors in the RiskMetrics database as of 2004 (both directors who started in 2004and directors who started prior to 2004 but are still on the board as of 2004) have a validDIRECTOR_DETAIL_ID from 2004 and onward. WRDS assigned the same ID to directors inearlier years, where possible, through matching names, director age, etc. Directors in the databasewho quit before 2004 do not have a valid DIRECTOR_DETAIL_ID. Thus, prior to 2004, somedirectors have no DIRECTOR_DETAIL_ID. Over the sample period, 23% of the director-yearobservations have missing DIRECTOR_DETAIL_ID.
Pre-2004, the unique director ID is LEGACY_DIRECTOR_ID. In contrast to DIREC-TOR_DETAIL_ID, this variable is populated only for those directors who were on thedatabase prior to 2004. For all years, the directors are on the database, they will continueto have LEGACY_DIRECTOR_ID. Directors who joined on or after 2004 will not haveLEGACY_DIRECTOR_ID. Over the sample period, 27% of the director-year observations havemissing LEGACY_DIRECTOR_ID. Eventually, as more years of data are added and directors whostarted serving prior to 2004 are no longer on the boards of firms, this data item will not be relevant.
In sum, for directors who enter the database on or after 2004, only DIRECTOR_DETAIL_IDis available. For directors who exit the database before 2004, only LEGACY_DIRECTOR_ID isavailable. For directors who joined before 2004 and are still on the board after 2004, both IDs areavailable. Thus, it is imperative that both IDs are used to create a unique director ID to ensure thatall directors are included in the study.
We first confirm that for directors for whom both IDs are available, there is a one-for-one matchbetween the two IDs. Second, when both IDs should be available, but only one is given in thedatabase, we make necessary adjustments. There are times in which WRDS should have been ableto assign a DIRECTOR_DETAIL_ID to a given director based on the director’s name and age,but it does not do so. For example, director Joe Smith may have served on firm ABC, Inc., from2003–2005. Suppose his LEGACY_DIRECTOR_ID is 5555 and his DIRECTOR_DETAIL_IDis 6666. Then WRDS should have assigned this DIRECTOR_DETAIL_ID for Joe Smithfor every year from 2003–2005. But we find that this is not always true; for example, JoeSmith has a missing DIRECTOR_DETAIL_ID in 2004. We know he is the same directorbecause the LEGACY_DIRECTOR_ID is the same. Therefore, we assign Joe Smith the sameDIRECTOR_DETAIL_ID of 6666 in 2004.
Year LEGACY_DIRECTOR_ID DIRECTOR_DETAIL_ID Corrected DIRECTOR_DETAIL_ID
2003 5555 6666 66662004 5555 – 66662005 5555 6666 6666
36
by guest on May 7, 2014
http://rfs.oxfordjournals.org/D
ownloaded from

[18:14 26/3/2014 RFS-hhu011.tex] Page: 37 1–46
Co-opted Boards
The reverse is also true: sometimes the LEGACY_DIRECTOR_ID is not filled in completelyeven though DIRECTOR_DETAIL_ID is available for all the years. For these director-yearobservations, we do a similar assignment and correct the LEGACY _DIRECTOR_ID (we callthis Corrected LEGACY_DIRECTOR_ID).
We then create our own unique director ID, which we term as Our Director ID, as follows:if Corrected DIRECTOR_DETAIL_ID is available, then we use this as the unique ID, becausethis is the ID that WRDS will maintain going forward. If Corrected DIRECTOR_DETAIL_ID isnot available (which implies the director exited the database prior to 2004), we define an ID thatis Corrected LEGACY_DIRECTOR_ID × 100. The multiplication by 100 ensures that the IDwe create is unique and will not clash with the WRDS ID. An example of what we do followsbelow.
Joe Smith, director at ABC Inc., from 2003–2005
Year Corrected LEGACY_ Corrected DIRECTOR_ Our Director IDDIRECTOR_ID DETAIL_ID
2003 5555 6666 66662004 5555 6666 66662005 5555 6666 6666
Jane Adams, director at ABC Inc., from 2004–2006
Year Corrected LEGACY_ Corrected DIRECTOR_ Our director IDDIRECTOR_ID DETAIL_ID
2004 – 6667 66672005 – 6667 66672006 – 6667 6667
John Doe, director at ABC Inc., from 2001–2003
Year Corrected LEGACY_ Corrected DIRECTOR_ Our Director IDDIRECTOR_ID DETAIL_ID
2001 5556 – 5556002002 5556 – 5556002003 5556 – 555600
By using both IDs, we ensure that we account for all directors in the database. The final dataset(after cleaning) has 220,963 director-years. If a researcher uses only LEGACY_DIRECTOR_ID,she would have only 195,547 director-year observations. Similarly, if a researcher uses onlyDIRECTOR_DETAIL_ID, she would have only 170,068 director-year observations. Importantly,if one does not consider both IDs, then board size and co-option and all of the board measures(independence, busyness) will be incorrectly estimated as we would be ignoring a large sample ofdirectors.
A.2.3 Other issues with DIRECTOR_DETAIL_IDThere are some problems specifically with the DIRECTOR_DETAIL_ID of 35025. It appears tohave been wrongly assigned in certain years. We find that this ID appears in 772 observations, ofwhich 719 are in 2004, 43 are in 2005, and the remaining 10 occur in years 2006–2010. We examinethese ten observations and find that they all belong to the same director, H. Paulett Eberhart (orslight variations of this name, such as H. Eberhart).
37
by guest on May 7, 2014
http://rfs.oxfordjournals.org/D
ownloaded from

[18:14 26/3/2014 RFS-hhu011.tex] Page: 38 1–46
The Review of Financial Studies / v 0 n 0 2014
To fix this, we flag observations in which the firm (identified using GVKEY), director name(FULLNAME), and the director’s joining year (DIRSINCE) are the same in two consecutiveyears, but the DIRECTOR_DETAIL_ID is different. This happens because there is incorrectassignment of DIRECTOR_DETAIL_ID of 35025 to directors other than H. Paulett Eberhart.For example, in Metlife and General Dynamics, director JOHN M KEANE appears in 2004 with aDIRECTOR_DETAIL_ID of 35025, but in subsequent years with a DIRECTOR_DETAIL_ID of35937. For this director, we assign a Corrected DIRECTOR_DETAIL_ID of 35937 in 2004. Wherewe are not able to correct this mistake, we drop the firm completely from the analysis. Finally,there are data entry errors in RiskMetrics. For example, MARY L GOOD, director of ACXIOMCorp. is named as MARY L GOOD PHD in one year and MARY L GOOD in another, but sheis given different DIRECTOR_DETAIL_IDs of 112331 and 9612. We correct such data errorsto the best of our ability. The manual correction provides the correct DIRECTOR_DETAIL_IDto some of the directors who are mistakenly assigned a DIRECTOR_DETAIL_ID of 35025and also corrects mistakes in which the same director in the same firm is assigned multipleDIRECTOR_DETAIL_IDs.
A.2.4 Issues with MEETINGDATERiskMetrics provides two variables to identify the year for which the observation is valid. Oneis the MEETINGDATE (date of the annual meeting), and the other is YEAR. In theory, YEARin RiskMetrics is the year of the MEETINGDATE (this is not to be confused with YEAR inCompustat mentioned earlier in the Appendix, which refers to the fiscal year). We find that482 director-year observations have the YEAR variable not equal to the year indicated by theMEETINGDATE. Of this, 427 observations have the year of MEETINGDATE equal to 1960,whereas the YEAR is given as 2008. For example, for Zimmer Holdings, the YEAR is givenas 2008, but the MEETINGDATE is given as 1/1/1960. We correct the year indicated by theMEETINGDATE variable for such observations to be 2008. That is, in this example we replaceMEETINGDATE by 1/1/2008. This is important because when we obtain PERMNOs from CRSP,we use the MEETINGDATE variable. The remaining 55 observations (= 482 - 427) have adifference of either one year or three years between the year indicated by MEETINGDATEand YEAR. We check each of these and find that the YEAR variable is correct, but not theMEETINGDATE. We therefore change the year of the MEETINGDATE to be the same as YEAR.
A.3. Discussion of Changes in Reporting of Annual Pay (TDC1)
Execucomp recently changed its compensation data reporting in line with accounting changesimposed by the Financial Accounting Standards Board (FASB) as well as expanded compensationdisclosure requirements (for pension, severance, change-in-control payouts, and equity basedcompensation) imposed by the Securities and Exchanges Commission (SEC). For fiscal years1992–2005, all companies on Execucomp report using the old reporting format. The data formatreporting code is identified using the Execucomp variable OLD_DATAFMT_FLAG. For fiscalyears 2007 and later, all firms on Execucomp report compensation using the new format. For 2006,16% of firms report using the old format, whereas the remainder report under the new format.We loosely refer to these different reporting formats as the pre-2006 format (OLD_DATAFMT_FLAG = 1) and the post-2006 format (OLD_DATAFMT_FLAG = 0).
The annual compensation (TDC1) pre- and post-2006 is not strictly comparable for at least threereasons. (i) The components and the composition of the components included in TDC1 differ pre-and post-2006. (ii) Pre-2006, equity-based long-term (multi-year) incentive awards were reportedbased on actual payouts during the fiscal year, whereas post-2006, they are reported based on target(or expected) levels of payout. (iii) Pre-2006, Execucomp computed the Black-Scholes value ofoption grants (which is one component of TDC1), whereas post-2006, Execucomp provides thefair value (which may or may not be the Black-Scholes value) of option grants as reported by
38
by guest on May 7, 2014
http://rfs.oxfordjournals.org/D
ownloaded from

[18:14 26/3/2014 RFS-hhu011.tex] Page: 39 1–46
Co-opted Boards
firms. Unfortunately, reconciling pre- and post-2006 TDC1 numbers without making some majorassumptions is impossible. We elaborate below.
Pre−2006, the Execucomp definition of TDC1 was
TDC1=SALARY+BONUS+LTIP+RSTKGRNT
+OPTION_AWARDS_BLK_VALUE+OTHANN+ALLOTHTOT (A1)
Post−2006, Execucomp definition of TDC1 is
TDC1=SALARY+BONUS+NONEQ_INCENT+STOCK_AWARDS_FV
+OPTION_AWARDS_FV+OTHCOMP+DEFER_RPT_AS_COMP_TOT (A2)
We provide below a quick recap of the key changes in each of these components from pre- topost-2006. Our understanding is based on talks with Standard & Poor officials (who supply theExecucomp database), on “A User’s Guide to the SEC’s New Rules for Reporting Executive Pay”issued by Moody’s Investors Service (2007), and on explanations provided by WRDS.
Execucomp variable Pre-2006 definition Post-2006 definition
SALARY Base annual salary Base annual salary
BONUS Performance-based pay that is
• earned during the year;• based on nonformulaic (also
called “discretionary” or“guaranteed”) as well asformulaic plans;
• based on annual (as opposedto multi-year) performancetargets; and
• cash-based (as opposed toequity-based).
Performance-based pay that is
• earned during the year;• based on nonformulaic
plans;• based on annual perfor-
mance targets; and• cash-based.
NONEQ_INCENT Not reported pre-2006 Performance-based pay that is
• earned during the year;• based on formulaic plans;• based on annual as well
as multi-year performancetargets; and
• cash-based.
LTIP Performance-based pay that is
• earned during the year;• based on formulaic plans;
and• cash-based when using mul-
tiyear performance targetsor equity-based when usingeither annual or multiyearperformance targets.
Not reported post-2006
(Continued)
39
by guest on May 7, 2014
http://rfs.oxfordjournals.org/D
ownloaded from
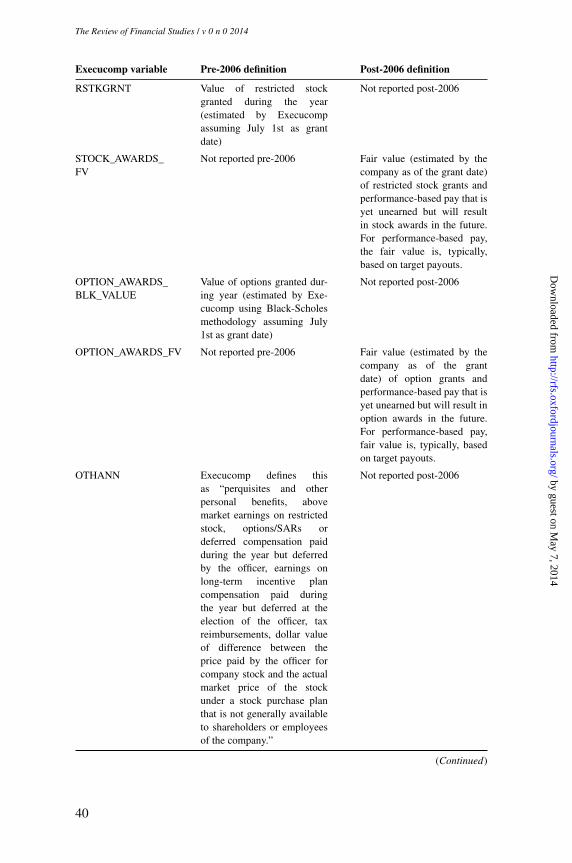
[18:14 26/3/2014 RFS-hhu011.tex] Page: 40 1–46
The Review of Financial Studies / v 0 n 0 2014
Execucomp variable Pre-2006 definition Post-2006 definition
RSTKGRNT Value of restricted stockgranted during the year(estimated by Execucompassuming July 1st as grantdate)
Not reported post-2006
STOCK_AWARDS_FV
Not reported pre-2006 Fair value (estimated by thecompany as of the grant date)of restricted stock grants andperformance-based pay that isyet unearned but will resultin stock awards in the future.For performance-based pay,the fair value is, typically,based on target payouts.
OPTION_AWARDS_BLK_VALUE
Value of options granted dur-ing year (estimated by Exe-cucomp using Black-Scholesmethodology assuming July1st as grant date)
Not reported post-2006
OPTION_AWARDS_FV Not reported pre-2006 Fair value (estimated by thecompany as of the grantdate) of option grants andperformance-based pay that isyet unearned but will result inoption awards in the future.For performance-based pay,fair value is, typically, basedon target payouts.
OTHANN Execucomp defines thisas “perquisites and otherpersonal benefits, abovemarket earnings on restrictedstock, options/SARs ordeferred compensation paidduring the year but deferredby the officer, earnings onlong-term incentive plancompensation paid duringthe year but deferred at theelection of the officer, taxreimbursements, dollar valueof difference between theprice paid by the officer forcompany stock and the actualmarket price of the stockunder a stock purchase planthat is not generally availableto shareholders or employeesof the company.”
Not reported post-2006
(Continued)
40
by guest on May 7, 2014
http://rfs.oxfordjournals.org/D
ownloaded from

[18:14 26/3/2014 RFS-hhu011.tex] Page: 41 1–46
Co-opted Boards
Execucomp variable Pre-2006 definition Post-2006 definition
ALLOTHTOT Execucomp defines this as“severance payments, debtforgiveness, imputed interest,payouts for cancellation ofstock options, payment forunused vacation, tax reim-bursements, signing bonuses,401K contributions, and lifeinsurance premiums.”
Not reported post-2006
OTHCOMP Not reported pre-2006 Execucomp defines this as“other compensation receivedby the executive includingperquisites and other personalbenefits, termination orchange-in-control payments,contributions to definedcontribution plans (e.g.401K plans), life insurancepremiums, gross-ups andother tax reimbursements,discounted share purchases,etc.”
DEFER_RPT_AS_COMP_TOT
Not reported pre-2006 Execucomp defines this as“deferred compensation earn-ings as reported in “summarycompensation table.”
As seen from the discussion above, the only component of compensation that is directlycomparable across the two reporting regimes is SALARY.
A.3.1 Performance-based pay
A big difference pre- and post-2006 is in the reporting of performance-based pay. Below for easeof understanding, we present the information in a different manner, where the focus is on how thevarious components of performance-based pay are reported pre- and post-2006.
Component of performance-based pay(Plan, performance target, payout type) Pre-2006 Post-2006
Nonformulaic, annual, cash BONUS BONUSFormulaic, annual, cash BONUS NONEQ_INCENTFormulaic, multiyear, cash LTIP NONEQ_INCENTFormulaic, annual/multiyear, stock LTIP STOCK_AWARDS_FVFormulaic, annual/multiyear, option LTIP OPTION_AWARDS_FV
Clearly comparing pre- and post-2006 is difficult. BONUS is comparable across the two periodsonly if we assume that all cash-based payments from formulaic annual plans are zero post-2006.Similarly BONUS pre-2006 is comparable to BONUS + NONEQ_INCENT post-2006 only if weassume that cash-based payments from formulaic multiyear plans are zero in the pre-2006 and/orin the post-2006 period. There is no way to compare performance-based pay that is paid in theform of shares or options because pre-2006 such noncash performance-based pay was recorded in
41
by guest on May 7, 2014
http://rfs.oxfordjournals.org/D
ownloaded from
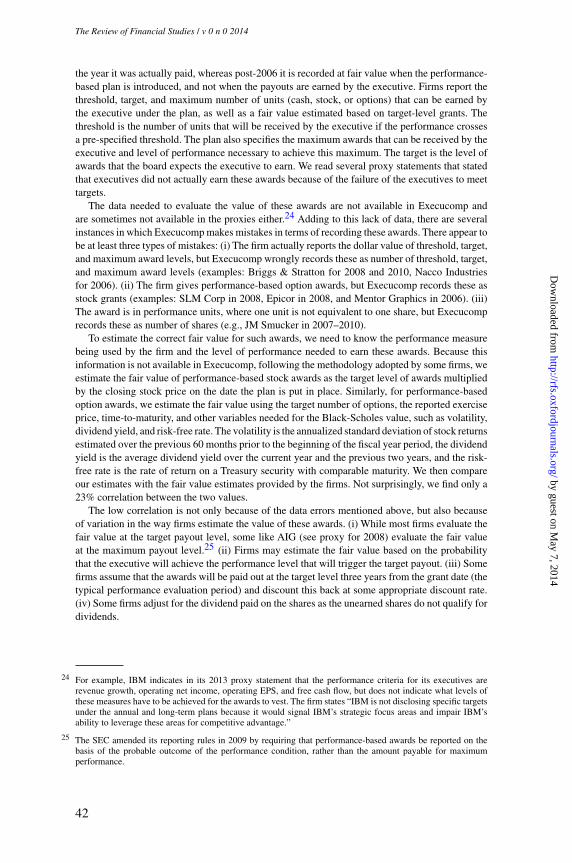
[18:14 26/3/2014 RFS-hhu011.tex] Page: 42 1–46
The Review of Financial Studies / v 0 n 0 2014
the year it was actually paid, whereas post-2006 it is recorded at fair value when the performance-based plan is introduced, and not when the payouts are earned by the executive. Firms report thethreshold, target, and maximum number of units (cash, stock, or options) that can be earned bythe executive under the plan, as well as a fair value estimated based on target-level grants. Thethreshold is the number of units that will be received by the executive if the performance crossesa pre-specified threshold. The plan also specifies the maximum awards that can be received by theexecutive and level of performance necessary to achieve this maximum. The target is the level ofawards that the board expects the executive to earn. We read several proxy statements that statedthat executives did not actually earn these awards because of the failure of the executives to meettargets.
The data needed to evaluate the value of these awards are not available in Execucomp andare sometimes not available in the proxies either.24 Adding to this lack of data, there are severalinstances in which Execucomp makes mistakes in terms of recording these awards. There appear tobe at least three types of mistakes: (i) The firm actually reports the dollar value of threshold, target,and maximum award levels, but Execucomp wrongly records these as number of threshold, target,and maximum award levels (examples: Briggs & Stratton for 2008 and 2010, Nacco Industriesfor 2006). (ii) The firm gives performance-based option awards, but Execucomp records these asstock grants (examples: SLM Corp in 2008, Epicor in 2008, and Mentor Graphics in 2006). (iii)The award is in performance units, where one unit is not equivalent to one share, but Execucomprecords these as number of shares (e.g., JM Smucker in 2007–2010).
To estimate the correct fair value for such awards, we need to know the performance measurebeing used by the firm and the level of performance needed to earn these awards. Because thisinformation is not available in Execucomp, following the methodology adopted by some firms, weestimate the fair value of performance-based stock awards as the target level of awards multipliedby the closing stock price on the date the plan is put in place. Similarly, for performance-basedoption awards, we estimate the fair value using the target number of options, the reported exerciseprice, time-to-maturity, and other variables needed for the Black-Scholes value, such as volatility,dividend yield, and risk-free rate. The volatility is the annualized standard deviation of stock returnsestimated over the previous 60 months prior to the beginning of the fiscal year period, the dividendyield is the average dividend yield over the current year and the previous two years, and the risk-free rate is the rate of return on a Treasury security with comparable maturity. We then compareour estimates with the fair value estimates provided by the firms. Not surprisingly, we find only a23% correlation between the two values.
The low correlation is not only because of the data errors mentioned above, but also becauseof variation in the way firms estimate the value of these awards. (i) While most firms evaluate thefair value at the target payout level, some like AIG (see proxy for 2008) evaluate the fair valueat the maximum payout level.25 (ii) Firms may estimate the fair value based on the probabilitythat the executive will achieve the performance level that will trigger the target payout. (iii) Somefirms assume that the awards will be paid out at the target level three years from the grant date (thetypical performance evaluation period) and discount this back at some appropriate discount rate.(iv) Some firms adjust for the dividend paid on the shares as the unearned shares do not qualify fordividends.
24 For example, IBM indicates in its 2013 proxy statement that the performance criteria for its executives arerevenue growth, operating net income, operating EPS, and free cash flow, but does not indicate what levels ofthese measures have to be achieved for the awards to vest. The firm states “IBM is not disclosing specific targetsunder the annual and long-term plans because it would signal IBM’s strategic focus areas and impair IBM’sability to leverage these areas for competitive advantage.”
25 The SEC amended its reporting rules in 2009 by requiring that performance-based awards be reported on thebasis of the probable outcome of the performance condition, rather than the amount payable for maximumperformance.
42
by guest on May 7, 2014
http://rfs.oxfordjournals.org/D
ownloaded from

[18:14 26/3/2014 RFS-hhu011.tex] Page: 43 1–46
Co-opted Boards
A.3.2 Stock grants and option grants
Not only is performance-based pay not comparable, the value of stock and option grantsis also not comparable. RSTKGRNT cannot be compared to STOCK_AWARDS_FV andOPTION_AWARDS_BLACK_VALUE cannot be compared to OPTION_AWARDS_FV becauseof two reasons. (i) RSTKGRNT and OPTION_AWARDS_BLACK VALUE are the value of annualstock and options grants only. STOCKS_AWARDS_FV includes the value of annual stock grantsas well as unearned stock (which will be earned only when certain performance conditions aremet). Similarly, OPTION_AWARDS_FV includes the value of annual option grants as well asunearned options. This strictly is not a problem because firms break out fair values of earned andunearned awards separately.26 (ii) Pre-2006, Execucomp estimated the value of grants, whereaspost-2006, firms estimate and report the fair value themselves. This creates problems because themethodology used by firms need not be the same across firms and need not be consistent withinfirms over time. For options, even if all firms used the most widely used Black-Scholes model,firms could use different assumptions about maturity because some firms could give a maturityhaircut to reflect early exercise (e.g., due to executive risk aversion). Moreover, firms could usedifferent assumptions about volatility.
To understand the magnitude of the problem, we first identify the restricted stock grants portionof STOCK_AWARDS_FV. We then value these restricted stock grants as the number of stocksgranted times the closing stock price as on grant date. We find a 92% correlation between ourestimates and the corresponding fair values reported by firms. Similarly, we first identify theoption grants portion of OPTION_AWARDS_FV. We then estimate the Black-Scholes value ofthese option grants as described earlier. We find a 91% correlation between our estimates and thefair values reported by firms for option grants.
A.3.3 Adjusted TDC1
Finally, we compute an adjusted measure of TDC1. We use Equations (A1) and (A2) given earlierfor TDC1 computation. For firm-years using the pre-2006 reporting format, we compute our ownestimate of the value of restricted stock grants (in lieu of RSTKGRNT) and the value of optiongrants (in lieu of OPTION_AWARDS_BLK_VALUE) as discussed in Section A.3.2. The values ofother variables needed for TDC1 are taken from Execucomp. For firm-years using the post-2006reporting format, we estimate the fair value of stock grants and unearned stock awards (in lieu ofSTOCK_AWARDS_FV) and the fair value of option grants and unearned option awards (in lieuof OPTION_AWARDS_FV) using the method discussed in Sections A.3.1 and A.3.2. Again, thevalues of other variables are taken from Execucomp. Overall, the correlation between our adjustedTDC1 estimate and the TDC1 reported by Execucomp is over 99% in the pre-2006 period and 44%in the post-2006 period.
That TDC1 in the pre- and post-2006 periods are so differently defined matters if the annualchange in TDC1 is of interest to the researcher. In 2006, with the vast majority of firms (86%)switching to the new reporting format, the change in TDC1 relative to the previous year ismisleading. This is true even in 2007, when the remaining 14% of firms reported under the newformat. One way around this issue is to compute the adjusted TDC1 as we describe here. But weacknowledge that this measure still has drawbacks, particularly, our inability to estimate the valueof performance-based pay using Execucomp data. Another way is to ignore 2006 altogether, aswell as 2007, if the firm had reported in the old format in 2006.
26 Execucomp provides details of each type of award (stock grants, option grants, and unearned stock awards,unearned option awards) in the “Plan Based Awards” table along with their fair value (FAIR_VALUE). The sumof this variable across all stock grants and unearned stock awards is indicated as STOCK_AWARDS_FV and thesum across all option grants and unearned option awards is indicated as OPTION_AWARDS_FV in the “AnnualCompensation” table.
43
by guest on May 7, 2014
http://rfs.oxfordjournals.org/D
ownloaded from

[18:14 26/3/2014 RFS-hhu011.tex] Page: 44 1–46
The Review of Financial Studies / v 0 n 0 2014
References
Adams, R., and D. Ferreira. 2009. Women in the boardroom and their impact on governance and performance.Journal of Financial Economics 94:291–309.
Adams, R., B. Hermalin, and M. Weisbach. 2010. The role of boards of directors in corporate governance: Aconceptual framework and survey. Journal of Economic Literature 48:58–107.
Aggarwal, R., and A. Samwick. 1999. The other side of the trade-off: The impact of risk on executivecompensation. Journal of Political Economy 107:65–105.
Ai, C., and E. Norton. 2003. Interaction terms in logit and probit models. Economics Letters 80:123–9.
Bertrand, M., and S. Mullainathan. 2003. Enjoying the quiet life? Corporate governance and managerialpreferences. Journal of Political Economy 111:1043–75.
Bizjak, J., J. Brickley, and J. Coles. 1993. Stock-based incentive compensation and investment behavior. Journalof Accounting and Economics 16:349–72.
Borokhovich, K., K. Brunarski, and R. Parrino. 1997. CEO contracting and antitakeover amendments. Journalof Finance 52:1495–517.
Brickley, J., J. Coles, and R. Terry. 1994. Outside directors and the adoption of poison pills. Journal of FinancialEconomics 35:371–90.
Burkart, M., D. Gromb, and F. Panunzi. 1997. Large shareholders, monitoring, and the value of the firm. QuarterlyJournal of Economics 112:693–728.
Byrd, J., and K. Hickman. 1992. Do outside directors monitor managers? Evidence from tender offer bids.Journal of Financial Economics 32:195–222.
Cai, J., J. Garner, and R. Walkling. 2009. Electing directors. Journal of Finance 64:2389–421.
Carter, M. E., L. Lynch, and S. Zechman. 2009. Changes in bonus contracts in the post-Sarbanes-Oxley era.Review of Accounting Studies 14:480–506.
Chhaochharia, V., and Y. Grinstein. 2007. Corporate governance and firm value: The impact of the 2002governance rules. Journal of Finance 62:1789–825.
Coles, J., N. Daniel, and L. Naveen. 2006. Managerial incentives and risk-taking. Journal of Financial Economics79:431–68.
———. 2008. Boards: Does one size fit all? Journal of Financial Economics 87:329–56.
———. 2013. Calculation of compensation incentives and firm-related wealth using Execucomp: Data, program,and explanation. Working Paper, SSRN.
Coles, J., M. Lemmon, and Y. Wang. 2011. The joint determinants of managerial ownership, board independence,and firm performance. Working Paper, University of Utah.
Core, J., and W. Guay. 1999. The use of equity grants to manage optimal incentive levels. Journal of Accountingand Economics 28:151–84.
———. 2002. Estimating the value of employee stock option portfolios and their sensitivities to price andvolatility. Journal of Accounting Research 40:613–30.
Core, J., R. Holthausen, and D. Larcker. 1999. Corporate governance, chief executive officer compensation andfirm performance. Journal of Financial Economics 51:371–406.
Coughlan, A., and R. Schmidt. 1985. Executive compensation, management turnover, and firm performance: anempirical investigation. Journal of Accounting and Economics 7:43–66.
Dahya, J., O. Dimitrov, and J. McConnell. 2008. Dominant shareholders, corporate boards and corporate value:A cross-country analysis. Journal of Financial Economics 87:73–100.
44
by guest on May 7, 2014
http://rfs.oxfordjournals.org/D
ownloaded from

[18:14 26/3/2014 RFS-hhu011.tex] Page: 45 1–46
Co-opted Boards
Dahya, J., and J. McConnell. 2007. Board composition, corporate performance, and the Cadbury Committeerecommendation. Journal of Financial and Quantitative Analysis 42:535–64.
Dahya, J., J. McConnell, and N. Travlos. 2002. The Cadbury Committee, corporate performance, and topmanagement turnover. Journal of Finance 57:461–83.
Deangelo, H., and E. Rice. 1983. Antitakeover charter amendments and stockholder wealth. Journal of FinancialEconomics 11:329–60.
Denis, D., and D. Denis. 1995. Performance changes following top management dismissals. Journal of Finance50:1029–57.
Dittmar,A., and J. Mahrt-Smith. 2007. Corporate governance and the value of cash holdings. Journal of FinancialEconomics 83:599–634.
Falaye, O. 2007. Classified boards, firm value, and managerial entrenchment. Journal of Financial Economics83:501–29.
Fich, E., and A. Shivdasani. 2007. Financial fraud, director reputation, and shareholder wealth. Journal ofFinancial Economics 86:306–36.
Finkelstein, S., and D. Hambrick. 1989. Chief executive compensation: A study of the intersection of marketsand political processes. Strategic Management Journal 10:121–34.
Gompers, P., J. Ishii, and A. Metrick. 2003. Corporate governance and equity prices. Quarterly Journal ofEconomics 118:107–55.
———. 2010. Extreme governance: an analysis of dual-class firms in the United States. Review of FinancialStudies 23:1051–88.
Goyal, V., and C. Park. 2002. Board leadership structure and chief executive turnover. Journal of CorporateFinance 8:49–66.
Guay, W. 1999. The sensitivity of CEO wealth to equity risk: An analysis of the magnitude and determinants.Journal of Financial Economics 53:43–71.
Hartzell, J., and L. Starks. 2003. Institutional investors and executive compensation. Journal of Finance 58:2351–74.
Hazarika, S., Karpoff, J., and R. Nahata. 2012. Internal corporate governance, CEO turnover, and earningsmanagement. Journal of Financial Economics 104:44–69.
Hermalin, B., and M. Weisbach. 1998. Endogenously chosen boards of directors and their monitoring of theCEO. American Economic Review 88:96–118.
———. 2003. Boards of directors as an endogenously determined institution. Federal Reserve Bank of New YorkEconomic Policy Review 9:1–20.
Huson, M., R. Parrino, and L. Starks. 2001. Internal monitoring mechanisms and CEO turnover: A long-termperspective. Journal of Finance 56:2265–97.
Hwang, B., and S. Kim. 2009. It pays to have friends. Journal of Financial Economics 93:138–58.
Hymowtiz, C., and J. Green. 2013. Not going anywhere. Business Week, May 27 – June 2, 23–24.
Jensen, M. 1986. The agency costs of free cash flow: Corporate finance and takeovers. American EconomicReview 76:323–9.
Jensen, M., and K. Murphy. 1990. Performance pay and top-management incentives. Journal of PoliticalEconomy 98:225–64.
Kang, J., and A. Shivdasani. 1995. Firm performance, corporate governance, and top executive turnover in Japan.Journal of Financial Economics 38:29–58.
Kaplan, S., and B. Minton. 2012. How has CEO turnover changed? International Review of Finance 12:57–87.
45
by guest on May 7, 2014
http://rfs.oxfordjournals.org/D
ownloaded from

[18:14 26/3/2014 RFS-hhu011.tex] Page: 46 1–46
The Review of Financial Studies / v 0 n 0 2014
Linck, J., J. Netter, and T. Yang. 2009. Effects and unintended consequences of the Sarbanes-Oxley Act oncorporate boards. Review of Financial Studies 22:3287–328.
Lorsch, J., and E. MacIver. 1989. Pawns or potentates: The reality of America’s corporate boards. Boston:Harvard Business School Press.
Mace, M. 1971. Directors, myth, and reality. Boston: Harvard Business School Press.
Mobbs, S. Forthcoming. CEOs under fire: The effects of directors on CEO compensation and turnover. Journalof Financial and Quantitative Analysis.
Morse, A., V. Nanda, and A. Seru. 2011. Are incentive contracts rigged by powerful CEOs? Journal of Finance66:1779–821.
Murphy, K. 1999. Executive compensation. In Handbook of labor economics, vol. 3. Eds. O. Ashenfelter, andD. Cards. North Holland: New York.
Pan, Y., T. Wang, and M. Weisbach. 2013. CEO investment cycles. Working Paper, University of Utah, Universityof Minnesota, and Ohio State University.
Parrino, R. 1997. CEO turnover and outside succession: A cross-sectional analysis. Journal of FinancialEconomics 46:165–97.
Petersen, M. 2009. Estimating standard errors in finance panel data sets: Comparing approaches. Review ofFinancial Studies 22:435–80.
Ryan, H. E., Jr., and R. A. Wiggins, III. 2004. Who is in whose pocket? Director compensation, boardindependence, and barriers to effective monitoring. Journal of Financial Economics 73:497–524.
Shivdasani, A., and D. Yermack. 1999. CEO involvement in the selection of new board members: An empiricalanalysis. Journal of Finance 54:1829–53.
Stein, J. 1988. Takeover threats and managerial myopia. Journal of Political Economy 96:61–80.
Warner, J., R. Watts, and K. Wruck. 1988. Stock prices and top-management changes. Journal of FinancialEconomics 20:461–92.
Weisbach, M. 1988. Outside directors and CEO turnover. Journal of Financial Economics 20:421–60.
46
by guest on May 7, 2014
http://rfs.oxfordjournals.org/D
ownloaded from