CO-OPERATIVE BANK OF KENYA LTD · PDF fileCo-operative Bank of South Sudan Co-op Consultancy &...
37
CO-OPERATIVE BANK OF KENYA LTD GROUP FINANCIAL RESULTS ANALYST BRIEFING Q2 2017 18 th August 2017
-
Upload
nguyendiep -
Category
Documents
-
view
236 -
download
1
Transcript of CO-OPERATIVE BANK OF KENYA LTD · PDF fileCo-operative Bank of South Sudan Co-op Consultancy &...
CO-OPERATIVE BANK OF KENYA LTD
GROUP FINANCIAL RESULTS
ANALYST BRIEFING
Q2 2017
18th August 2017

22
Macro Economic Update

3
144
Branches
4
Branches
Macro Economic Update: GDP
Kenya’s Q1 GDP growth rate remained relatively resilient in the face a drought, slow down due to the 2017 general elections
and reduced private sector credit uptake.

4
144
Branches
4
Branches
Macro Economic Update: Inflation
Overall inflation has started falling as earlier projected from a high of 11.7% in May to 9.2% in June.
Food inflation has fallen from 21.5% in May to 15.8% in June driven by lower vegetable and maize flour prices.
Looking ahead, we expect overall inflation rate to take a gradual fall due to reduced pressure from sugar and maize prices,
stable oil price and stable money supply growth.

5
144
Branches
4
Branches
Macro Economic Update: Currency
The KES has remained relatively stable in Q2 in a range of KES 103.5 to KES 103.9
The KES was however volatile at the end of June and in July due to demand from cereal and sugar importers, import of
transport equipment and precautionary purchases before the general elections.
The current account deficit is projected to only deteriorate slightly from 5.2% in 2016 to 5.8% indicating low pressure on the
currency from the import bill. CBK has been active in the exchange rate market in June by selling USD.
6
144
Branches
4
Branches
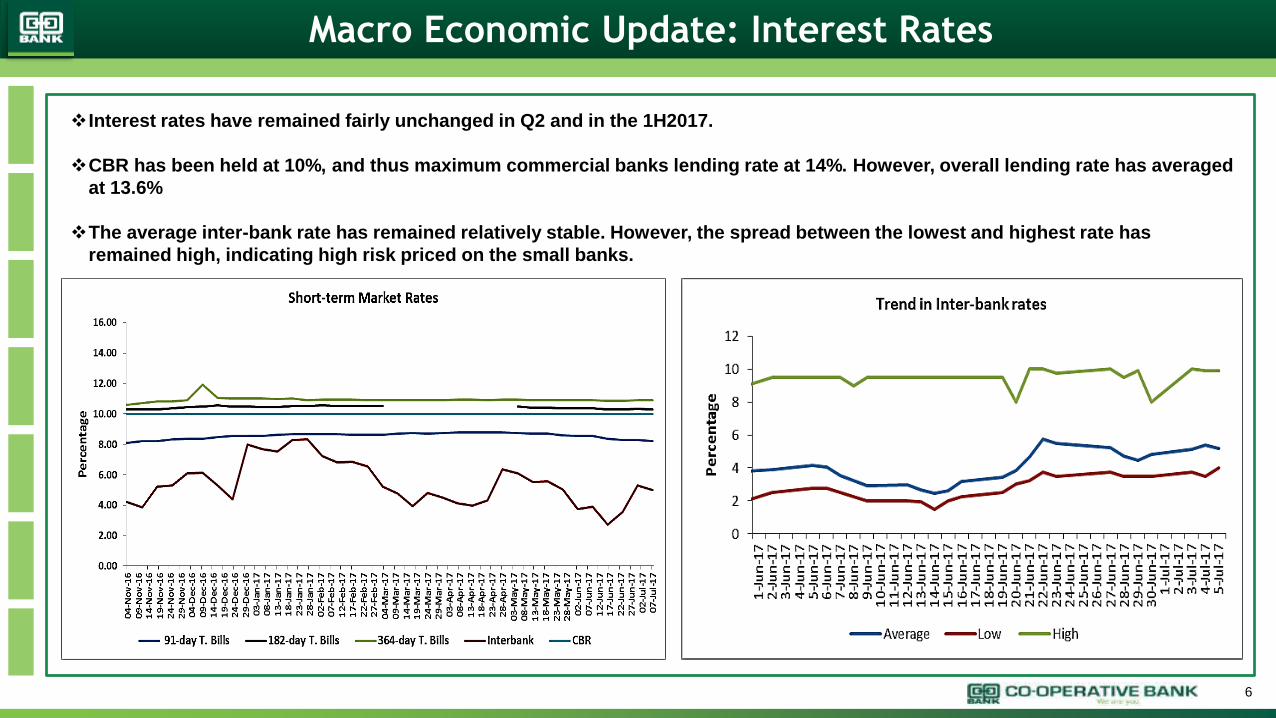
Macro Economic Update: Interest Rates
Interest rates have remained fairly unchanged in Q2 and in the 1H2017.
CBR has been held at 10%, and thus maximum commercial banks lending rate at 14%. However, overall lending rate has averaged
at 13.6%
The average inter-bank rate has remained relatively stable. However, the spread between the lowest and highest rate has
remained high, indicating high risk priced on the small banks.
7
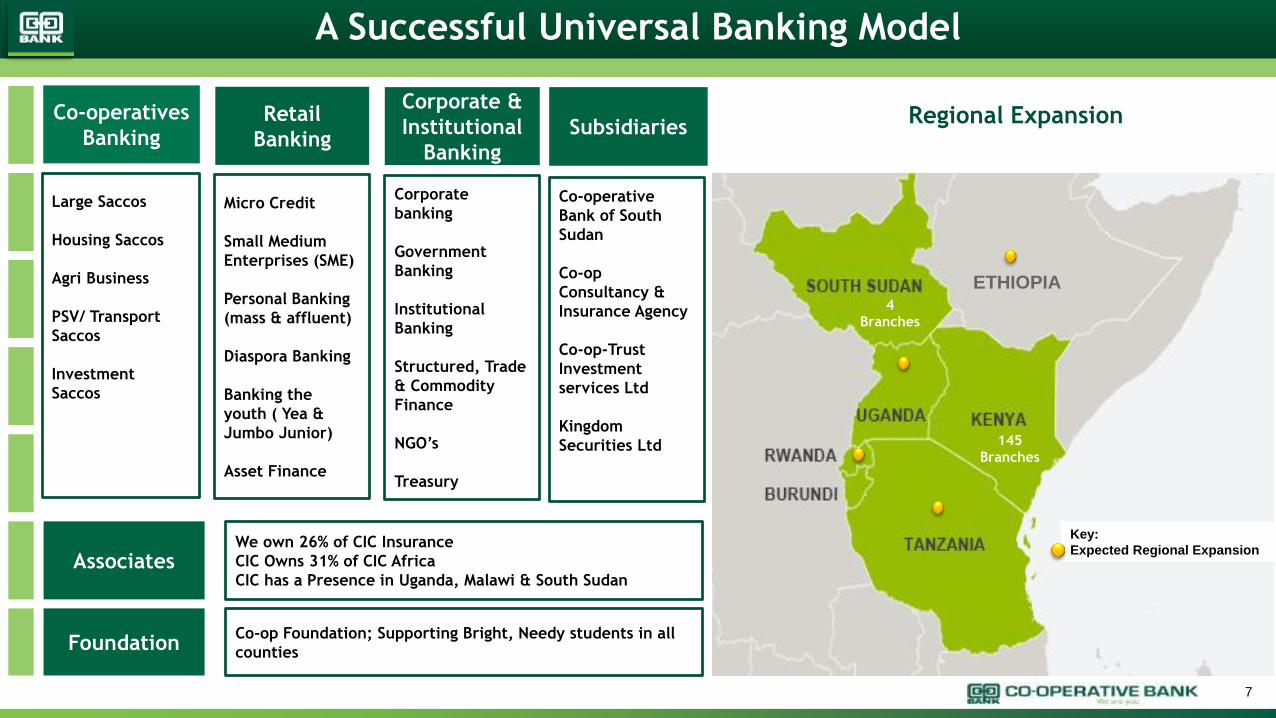
A Successful Universal Banking Model
Retail
Banking
Corporate &
Institutional
Banking
Subsidiaries
Associates
Foundation
Co-operatives
Banking
Micro Credit
Small Medium
Enterprises (SME)
Personal Banking
(mass & affluent)
Diaspora Banking
Banking the
youth ( Yea &
Jumbo Junior)
Asset Finance
Corporate
banking
Government
Banking
Institutional
Banking
Structured, Trade
& Commodity
Finance
NGO’s
Treasury
Co-operative
Bank of South
Sudan
Co-op
Consultancy &
Insurance Agency
Co-op-Trust
Investment
services Ltd
Kingdom
Securities Ltd
We own 26% of CIC Insurance
CIC Owns 31% of CIC Africa
CIC has a Presence in Uganda, Malawi & South Sudan
Co-op Foundation; Supporting Bright, Needy students in all
counties
Large Saccos
Housing Saccos
Agri Business
PSV/ Transport
Saccos
Investment
Saccos
Regional Expansion
145
Branches
4
Branches
ETHIOPIA
Key:
Expected Regional Expansion

8
Innovative Customer Delivery Platforms
Our channels Our customers
Over 6.53 Million growing direct account holders
Over 3.33 Million Mcoop Cash Customers
Over 75,077 Internet banking Customers
Over 1,020,434 Saccolink Customers
Over 12,420 Diaspora Banking Customers
Over 1.1 million Facebook followers
Over 169,000 Twitter followers
Instagram followers, You Tube subscribers
Telegram self service customers
149 Branches
Mcoop cash mobile banking
(All telco, all products)
Co-op Kwa Jirani-Over 8000 agents
CoopNet- Internet Banking (Corporate & Retail)
Over 580 ATMs, leading debit card issuer
24 Hour Contact Centre
Dedicated Diaspora Banking Department
Self service Kiosks in all our branches
560 FOSAs
Subsidiaries offering advisory and investment
services
Social Media Banking
99
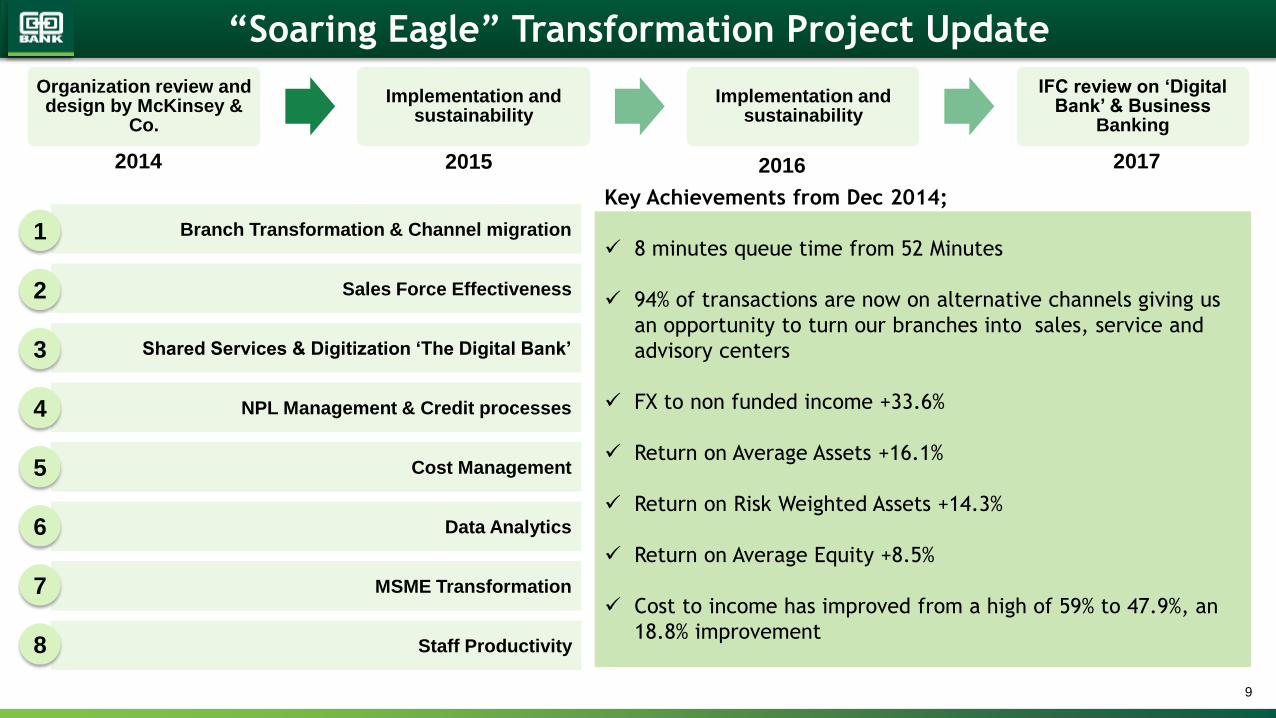
“Soaring Eagle” Transformation Project Update
Branch Transformation & Channel migration
Sales Force Effectiveness
Shared Services & Digitization ‘The Digital Bank’
NPL Management & Credit processes
Data Analytics
Staff Productivity
Key Achievements from Dec 2014;
8 minutes queue time from 52 Minutes
94% of transactions are now on alternative channels giving us
an opportunity to turn our branches into sales, service and
advisory centers
FX to non funded income +33.6%
Return on Average Assets +16.1%
Return on Risk Weighted Assets +14.3%
Return on Average Equity +8.5%
Cost to income has improved from a high of 59% to 47.9%, an
18.8% improvement
MSME Transformation
Cost Management
1
2
3
4
8
5
6
7
Organization review and design by McKinsey &
Co.
Implementation and sustainability
Implementation and sustainability
IFC review on ‘Digital Bank’ & Business
Banking
2014 2015 2016 2017

1010
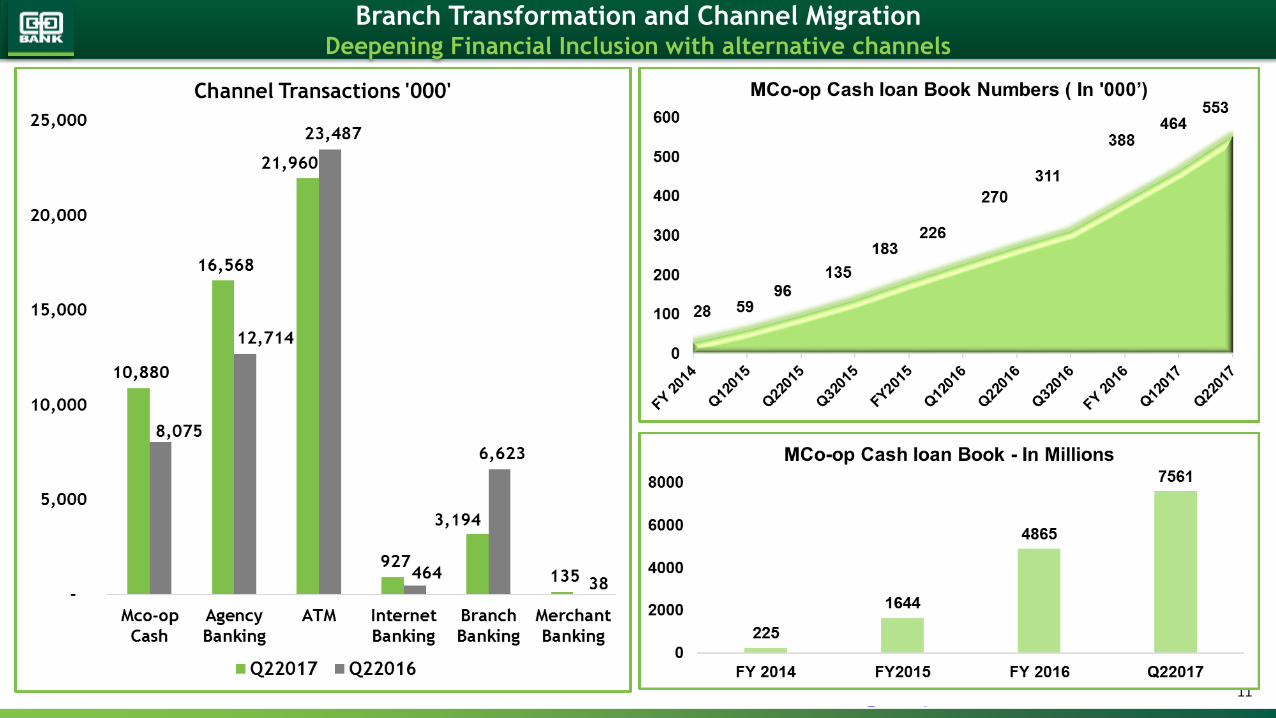
Branch Transformation( BT 2.0.) and Channel Migration
Impact of initiatives
Growth in Transactions 2Q2017- 2Q2016
Mco-op Cash +35%
Agency Banking +30%
Internet Banking +100%
Merchant Banking +253%
Over 600,000 customers being served by our call center
Business to Business (B2B) real time transactions have
grown exponentially +96% from Q12017
E-Flexi (Mobile loan) value has grown by 166% for
employed customers and 11% for business customers
Instant card issuance +38% from 1Q2017
8 Minutes Queue time
Gains achieved through migration and automation
has freed up time for Tellers and Service champions
The role of Teller and Service Champion has been
merged into one : Sales and Service Advisors
BT Phase 1
• Completed
BT Phase 2
• Under Implementation
BT Phase 3
• Scheduled
“To make our branches Centers of Excellence in Sales, Service and Advisory”
Benefits
1111
Branch Transformation and Channel MigrationDeepening Financial Inclusion with alternative channels
1212
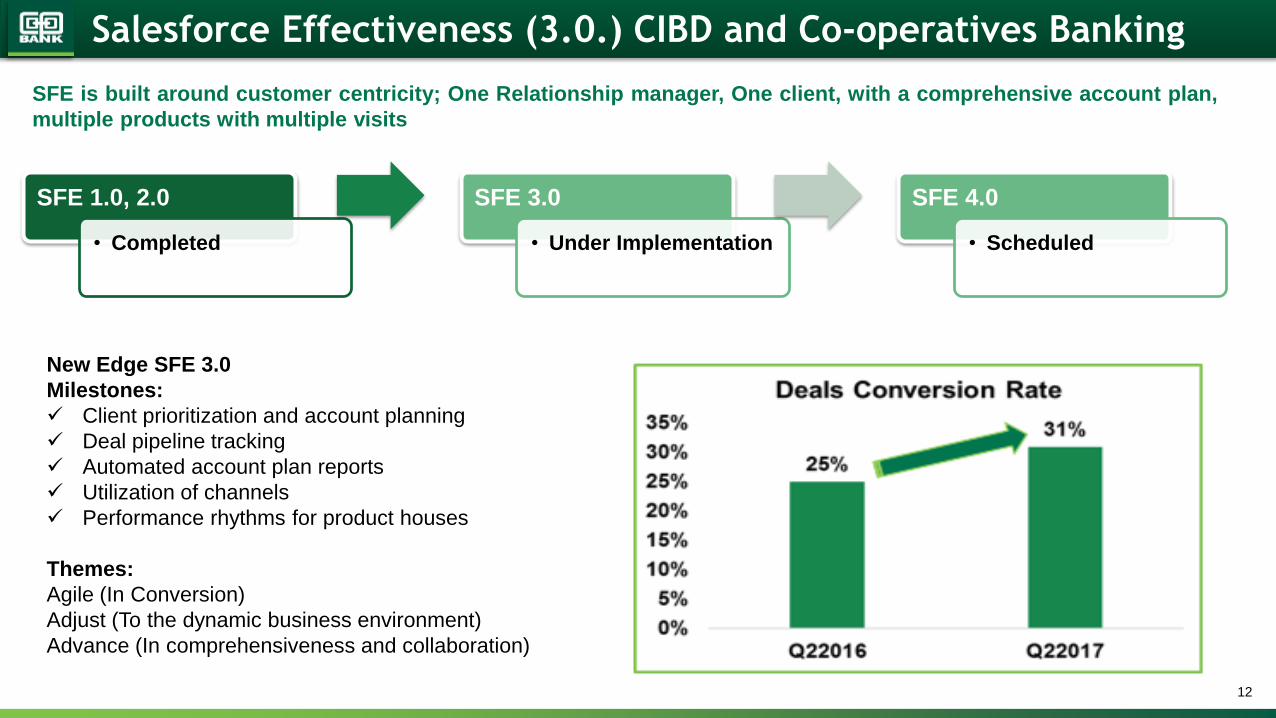
Salesforce Effectiveness (3.0.) CIBD and Co-operatives Banking
SFE 1.0, 2.0
• Completed
SFE 3.0
• Under Implementation
SFE 4.0
• Scheduled
New Edge SFE 3.0
Milestones:
Client prioritization and account planning
Deal pipeline tracking
Automated account plan reports
Utilization of channels
Performance rhythms for product houses
Themes:
Agile (In Conversion)
Adjust (To the dynamic business environment)
Advance (In comprehensiveness and collaboration)
SFE is built around customer centricity; One Relationship manager, One client, with a comprehensive account plan,
multiple products with multiple visits
1313
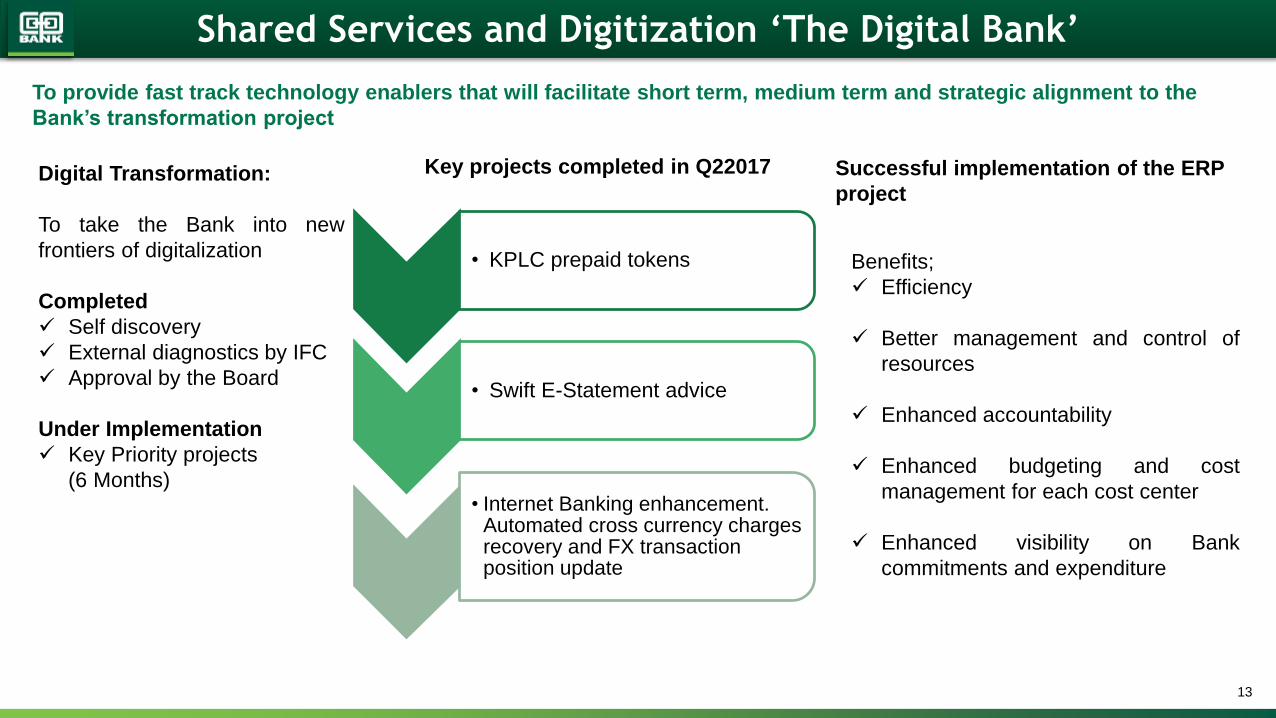
Shared Services and Digitization ‘The Digital Bank’
To provide fast track technology enablers that will facilitate short term, medium term and strategic alignment to the
Bank’s transformation project
Key projects completed in Q22017 Successful implementation of the ERP
projectDigital Transformation:
To take the Bank into new
frontiers of digitalization
Completed
Self discovery
External diagnostics by IFC
Approval by the Board
Under Implementation
Key Priority projects
(6 Months)
• KPLC prepaid tokens
• Swift E-Statement advice
• Internet Banking enhancement. Automated cross currency charges recovery and FX transaction position update
Benefits;
Efficiency
Better management and control of
resources
Enhanced accountability
Enhanced budgeting and cost
management for each cost center
Enhanced visibility on Bank
commitments and expenditure
1414
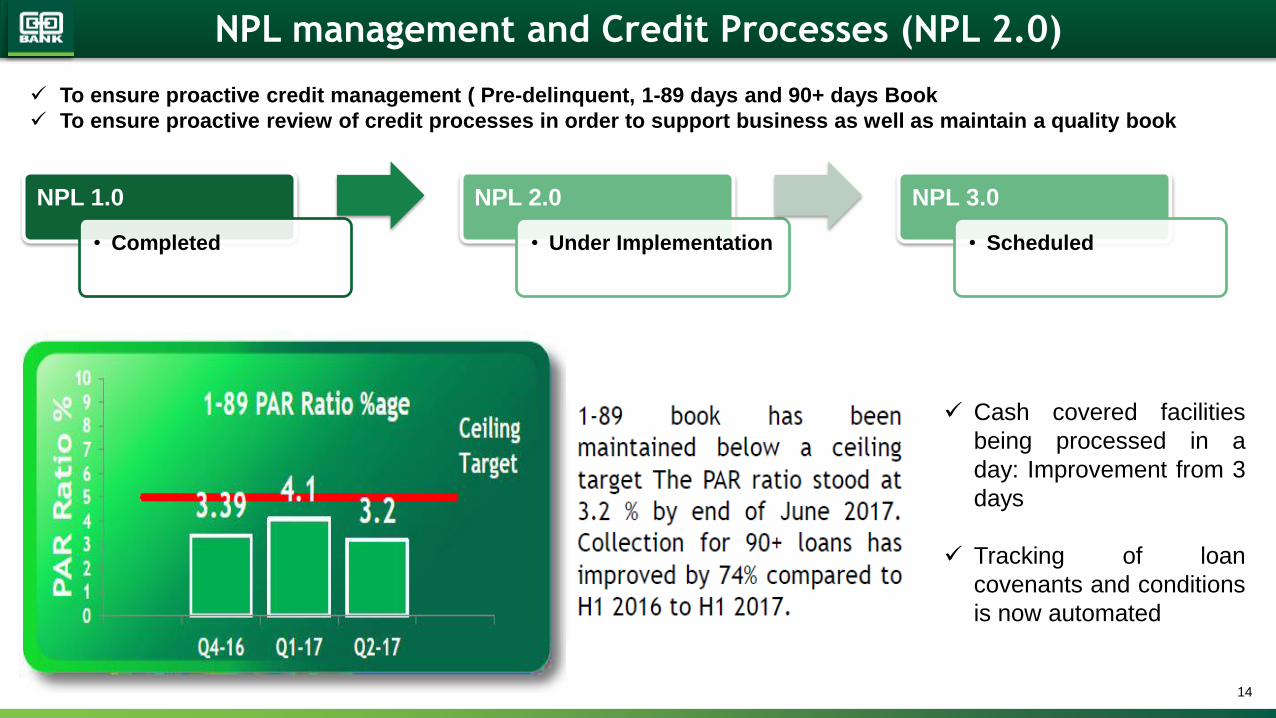
NPL management and Credit Processes (NPL 2.0)
To ensure proactive credit management ( Pre-delinquent, 1-89 days and 90+ days Book
To ensure proactive review of credit processes in order to support business as well as maintain a quality book
NPL 1.0
• Completed
NPL 2.0
• Under Implementation
NPL 3.0
• Scheduled
Cash covered facilities
being processed in a
day: Improvement from 3
days
Tracking of loan
covenants and conditions
is now automated

15
Data Analytics ‘the big data’
Data and analytic initiatives involve;
Development of reports( use-cases)
Data governance( Quality and ownership of data)
Data architecture ( New infrastructure to support analytics)

1616
MSME Transformation
To be the dominant bank in Kenya in MSME Segment
Key Initiatives;
Credit Scoring
SCF- Supply Chain
Financing
CVP- Customer Value
Proposition Model
Segmentation
Credit Process
Review
Product Offering
Review
Non Financial Service
(NFS) offering
6 Key Streams;
Sales referrals by
service team
Leverage Agents for
sales- Accounts &
Banc Assurance
Segmentation
Supply chain financing
Rolled out in all branches
Included as a KPI in sales role
Roll out done in 4 regions
Business Banking segmented under
MSME
Pilot with 2 newly on-boarded customers
Outbound Contact
center
Successful pilot in 2 branches
Progress;

1717
Staff Productivity
Achieving the Best with our People.
Facilitating success of our people. Inspiring leadership. Right culture. Driving high performance practices. Reward our best. Employee
engagement. Workforce stabilization
High Performing Teams initiatives
Optimal Resourcing & Organization design initiatives
Organizational Culture re-alignment program
Total Rewards & EVP initiatives
Build High Impact learning & Strategic capabilities
2
3
1
4
5
Employee Engagement & Wellbeing Initiatives
Transformation Agenda partnering initiatives
Talent Agenda & Proactive retention initiatives
7
8
6
Over 600 staff deployed as 60% sales and 40% service staff as Sales and
Service Advisors - expected to release at least 20% productivity in the sales
staff. This is a first in the market
KPI alignment discussions and alignment with Divisional Heads done for all
divisions and KPIs ‘locked’ for each quarter
84% of staff rated ‘achieving’ and ‘exceeding’ targets
Staff Wellness program – on track for 100% scale up. Over 200 wellness
champions trained by our partner AON in readiness for 100% scale up
Mentorship programs for Bankers, Branch managers and Service Managers
currently ongoing.
Coaching & Feedback Framework developed and currently in operation for
Coach Certification for leaders as well as >400 leaders trained on Coaching
for Performance
Tailored Transformation experiential support programs ongoing

18
Key strategies;
Implementation of the SAP Enterprise Resource Planning (ERP) solution
Automation of the various key processes for costs optimization.
Enhanced Expenditure Management Committee (EMC)
Market price comparison every 3 to 6 months
Prequalification of suppliers every 6 months
Renegotiated contracts with vendors especially systems
Q22017 Q22016 FY 2016 FY2015 FY - 2014
Cost to Income Ratio 47.9% 45.30% 52.1% 53.2% 59%
18
Cost Management and Efficiency

1919
Sustainable Financing from our Development Partners
LONG TERM FUNDING (Kshs. Million)
DEVELOPMENT PARTNER 2Q2017 2Q2016 PURPOSE
IFAD30.00 30.00
To finance the Eastern Province Horticultural
and Traditional Food crops project
EUROPEAN INVESTMENT BANK 1,628.92 2,713.25
To fund SMEs
AFD3,826.60 3,375.63
To fund energy efficient and renewable energy
projects
INTERNATIONAL FINANCE
CORPORATION(IFC)13,674.50 4,399.88
To fund SME’s and agribusiness, construction
and mortgage segments
D.E.G -(K.F.W) 3,799.26 4,764.25
To finance SME and Corporate customers
GOVERNMENT OF KENYA- 62.50
Informal Sector Enterprises
TOTAL22,959.27 15,345.51
2020
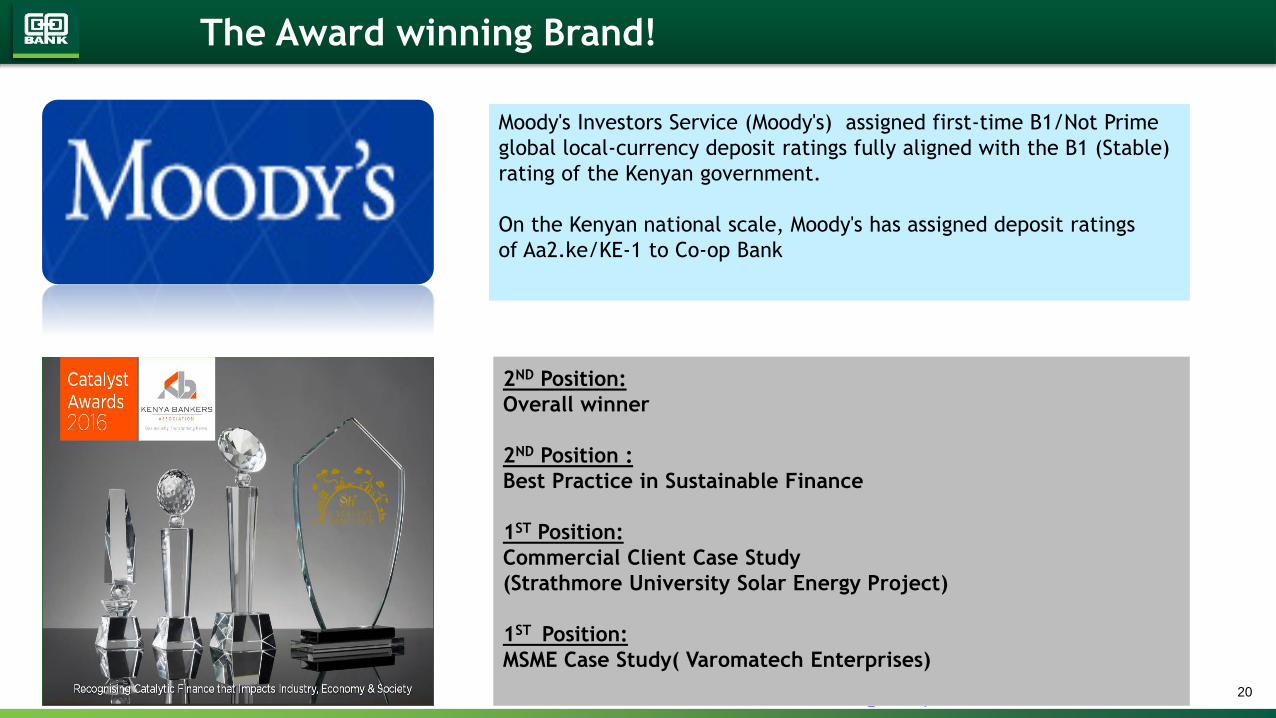
The Award winning Brand!
Moody's Investors Service (Moody's) assigned first-time B1/Not Prime
global local-currency deposit ratings fully aligned with the B1 (Stable)
rating of the Kenyan government.
On the Kenyan national scale, Moody's has assigned deposit ratings
of Aa2.ke/KE-1 to Co-op Bank
2ND Position:
Overall winner
2ND Position :
Best Practice in Sustainable Finance
1ST Position:
Commercial Client Case Study
(Strathmore University Solar Energy Project)
1ST Position:
MSME Case Study( Varomatech Enterprises)
21
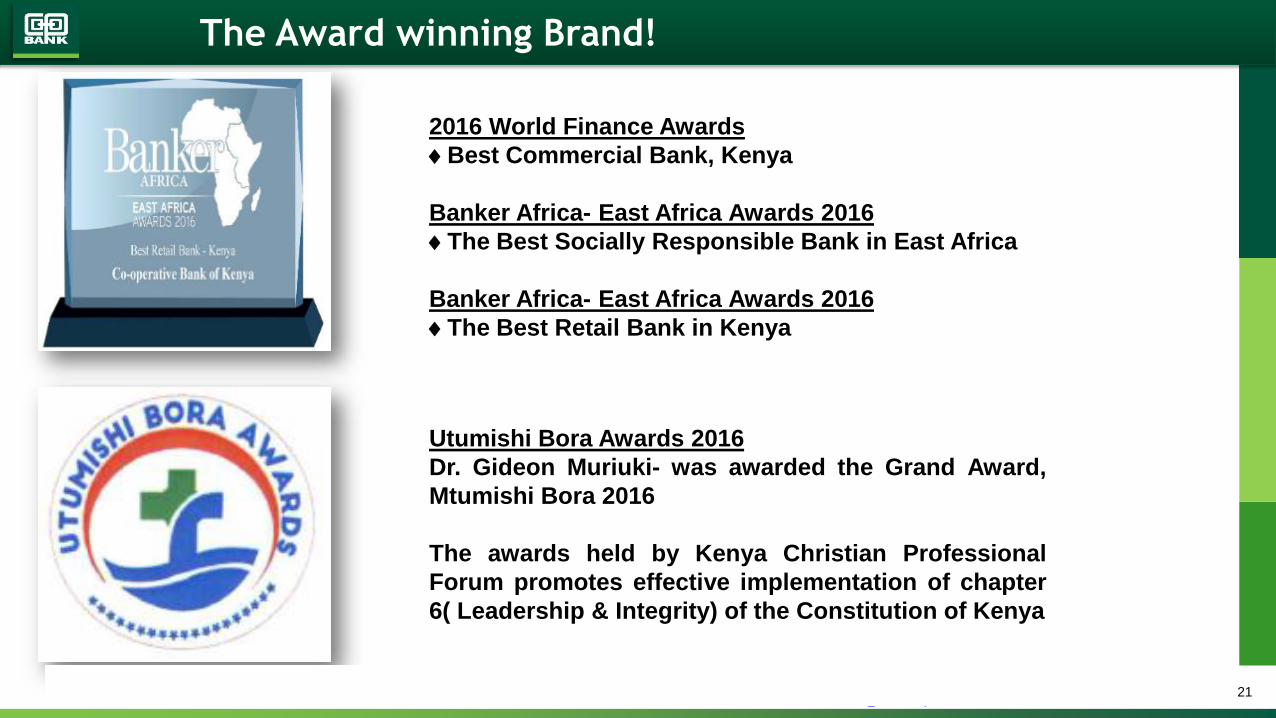
The Award winning Brand!
2016 World Finance Awards
Best Commercial Bank, Kenya
Banker Africa- East Africa Awards 2016
The Best Socially Responsible Bank in East Africa
Banker Africa- East Africa Awards 2016
The Best Retail Bank in Kenya
Utumishi Bora Awards 2016
Dr. Gideon Muriuki- was awarded the Grand Award,
Mtumishi Bora 2016
The awards held by Kenya Christian Professional
Forum promotes effective implementation of chapter
6( Leadership & Integrity) of the Constitution of Kenya
21
The Award winning Brand!
2222
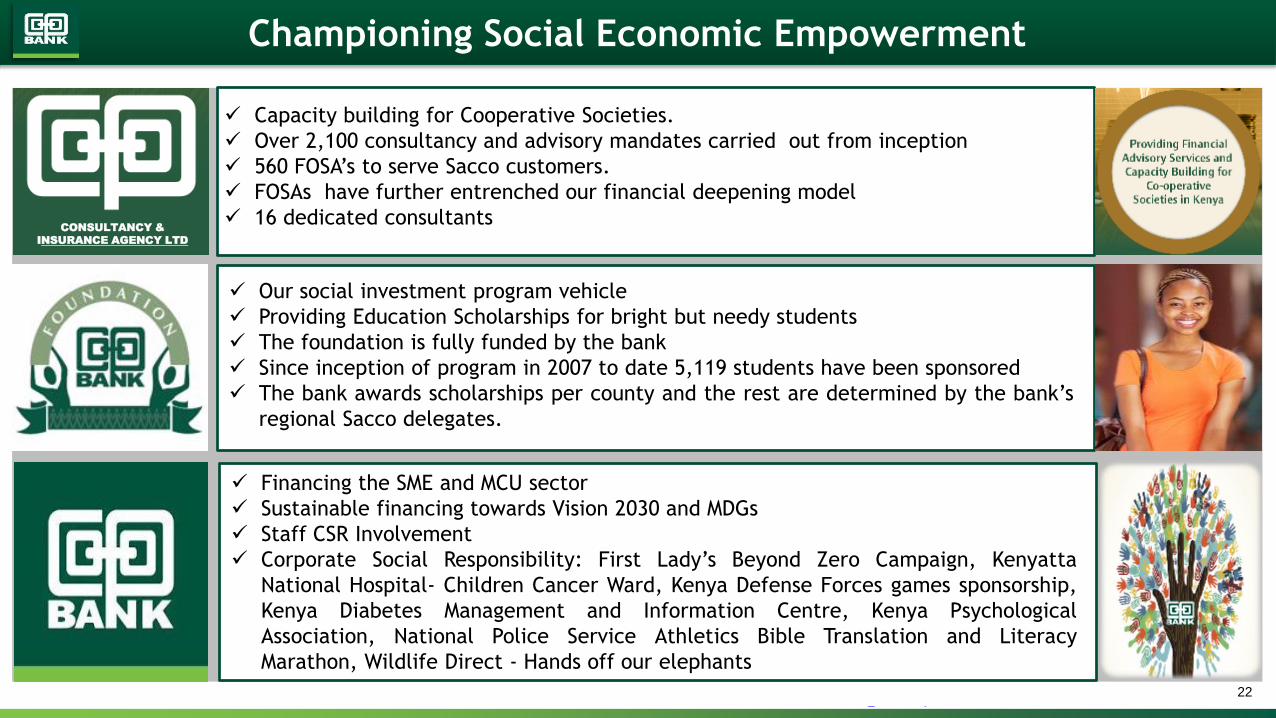
Championing Social Economic Empowerment
CONSULTANCY &
INSURANCE AGENCY LTD
Our social investment program vehicle
Providing Education Scholarships for bright but needy students
The foundation is fully funded by the bank
Since inception of program in 2007 to date 5,119 students have been sponsored
The bank awards scholarships per county and the rest are determined by the bank’s
regional Sacco delegates.
Financing the SME and MCU sector
Sustainable financing towards Vision 2030 and MDGs
Staff CSR Involvement
Corporate Social Responsibility: First Lady’s Beyond Zero Campaign, Kenyatta
National Hospital- Children Cancer Ward, Kenya Defense Forces games sponsorship,
Kenya Diabetes Management and Information Centre, Kenya Psychological
Association, National Police Service Athletics Bible Translation and Literacy
Marathon, Wildlife Direct - Hands off our elephants
Capacity building for Cooperative Societies.
Over 2,100 consultancy and advisory mandates carried out from inception
560 FOSA’s to serve Sacco customers.
FOSAs have further entrenched our financial deepening model
16 dedicated consultants
2323
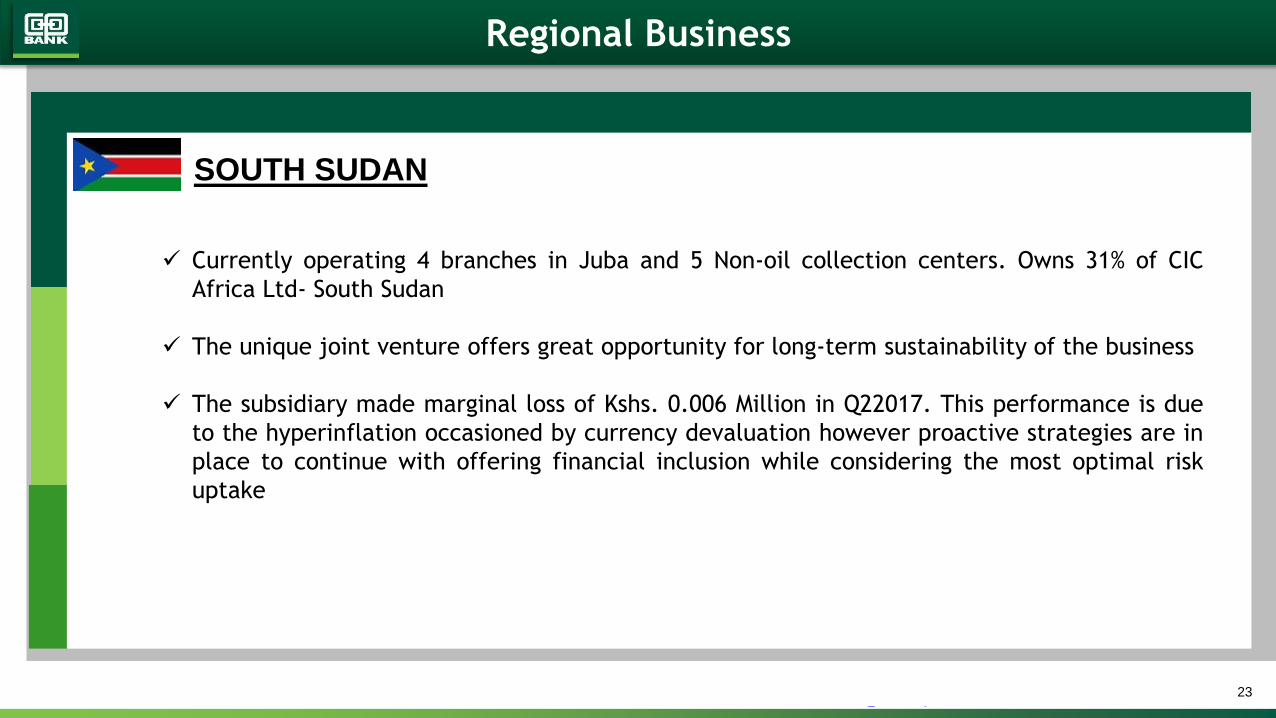
Regional Business
SOUTH SUDAN
Currently operating 4 branches in Juba and 5 Non-oil collection centers. Owns 31% of CIC
Africa Ltd- South Sudan
The unique joint venture offers great opportunity for long-term sustainability of the business
The subsidiary made marginal loss of Kshs. 0.006 Million in Q22017. This performance is due
to the hyperinflation occasioned by currency devaluation however proactive strategies are in
place to continue with offering financial inclusion while considering the most optimal risk
uptake

2424
New Business: Leasing
Approval by regulator, Central Bank of Kenya, to enter into a leasing business joint
venture with Super Group of South Africa.
The joint venture will take advantage of key strengths by the two partners and
focus on the emerging opportunities in leasing business with the bank providing a
6.5 million customer base and Super Group providing proven products, technology
and the expertise on running a scalable leasing business.
The joint venture comes at a time when there are significant market opportunities
in the growing Kenyan economy and the region as hereunder;
Major infrastructure projects.
Government setting the pace with leasing (especially vehicles).
Exploration and mining activities including oil and gas.
Other sector demands including manufacturing, construction, transport, ICT
among others.
The joint venture will also leverage on the support of the Co-operative movement
with over 14 Million customers and over 18,000 co-operative societies.
The joint venture is being operationalized immediately.
Listed on the Johannesburg
Securities exchange
Market capitalization of
Ksh. 100.4B
Operations in South Africa,
Australia, New Zealand,
Germany and United
Kingdom.
Provides world class fleet
solutions to their global
client base focusing on the
containment of costs and
operational risks associated
with fleet ownership.
At 30 June 2017, Super
Group had over 100,000
vehicles and trucks under
management.

2525
Key Financial Highlights

26
Kshs. Billions Q22017 Q22016% Change
(YoY)FY2016
Total Assets 383.3 363.0 5.6% 351.9
Loan book (Net) 252.6 221.3 14.2% 236.9
Government Securities 70.5 76.6 -7.9% 57.8
Total Deposits 287.2 279.6 2.7% 263.6
Borrowed Funds 24.3 14.8 64.6% 19.8
Shareholders Funds 64.5 57.9 11.3% 61.3
No. of account holders (Millions)6.53 5.97 9.4% 6.22
26
A Soaring Bank

2727
A Soaring Bank - Loan Distribution

2828
A Well-diversified Liability Portfolio
2929
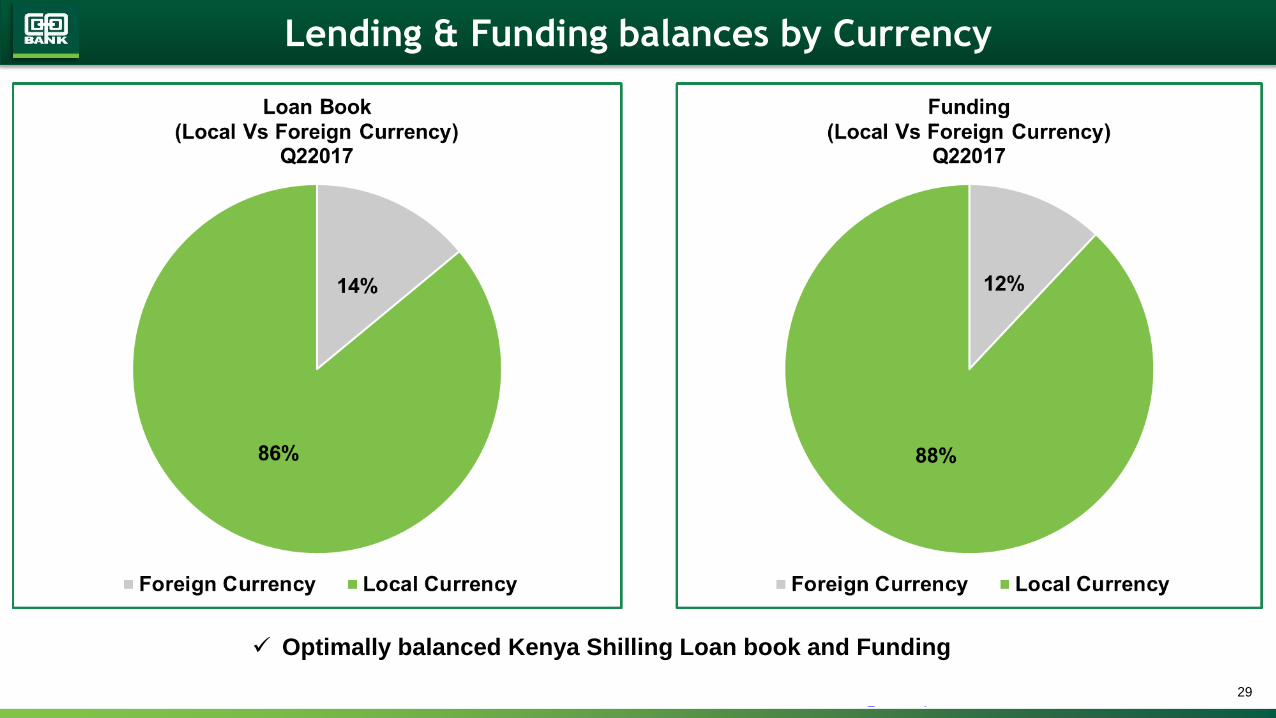
Lending & Funding balances by Currency
Optimally balanced Kenya Shilling Loan book and Funding

30
Q22017 % Q22016 % FY2016 %
Normal214,026 82.2% 199,036 88.1% 196,708 80.5%
Watch34,110 13.1% 16,652 7.4% 36,475 14.9%
Substandard7,924 3.0% 5,903 2.6% 5,857 2.4%
Doubtful3,646 1.4% 3,675 1.6% 4,741 1.9%
Loss653 0.3% 675 0.3% 675 0.3%
TOTAL
260,359 100.0% 225,942 100.0% 244,456 100.0%
30
Portfolio Trends (Ksh. Millions)

31
Q22017 Q22016 FY2016
Core Capital / Total Deposits (10.5%) 19.5% 16.9% 19.7%
Core Capital / Total Risk weighted Assets (10.5%) 15.9% 15.2% 16.1%
Total Capital / Total Risk Weighted Asset (14.5%) 22.8% 20.2% 22.7%
Coverage (Loan loss prov+int in sus /Gross NPL) -IFRS 39.9% 41.8% 38.1%
Coverage(Loss loan+int in sus+gen prov)/Gross NPL- CBK 68.1% 76.3% 65.4%
Liquidity (20%) 34.7% 41.0% 33.2%
NPL / Total Loans 4.5% 4.1% 4.3%
Loans to Deposits 88.0% 79.2% 89.9%
Loans to Deposits & Borrowed Fund 81.1% 75.2% 83.6%
31
Capital adequacy

3232
Profitability
Kshs. Billions (except for EPS) Q22017 Q22016 % Change (Y/Y) FY2016
Interest Income 19.3 21.5 -10.3% 42.3
Interest Expense 5.8 7.0 -16.7% 12.8
Net Interest Income 13.4 14.5 -7.2% 29.5
Fees & Commissions 5.3 5.0 6.1% 9.8
Forex Income 1.2 1.0 28.3% 1.8
Other Income 0.6 0.9 -34.7% 1.2
Total Operating Income 20.5 21.3 -3.7% 42.3
Loan Loss Provision 1.5 1.3 15.2% 2.6
Staff Costs 4.7 4.3 8.7% 9.4
Other Operating Expenses 5.1 5.3 -3.7% 12.6
Profit Before Tax and Exceptional Items 9.2 10.3 -11.3% 17.6
Exceptional Items - - - - 0.004
Share of profit of associate 0.1 0.1 -5.3% 0.1
Profit Before Tax 9.3 10.4 -11.3% 17.7
Tax 2.6 3.0 -13.3% 5.0
Profit After Tax 6.6 7.4 -10.4% 12.7
Basic EPS* 1.1 1.5 -25.4% 2.6* The drop in eps is as a result of dilution due to the Bonus Share Issue of one ordinary share for every five ordinary shares held

3333
COMPANY
PROFIT BEFORE TAX
2Q2017
PROFIT BEFORE TAX
2Q2016 %
KShs’000 KShs’000 KShs’000
The Co-operative Bank of Kenya Limited 8,926,677 10,186,316 -12.4%
Co-op Consultancy & Ins Agency Limited 233,322 115,612 101.8%
Co-op trust Investments Limited 19,529 21,879 -10.7%
Kingdom Securities Limited (2,401) (4,573) -47.5%
Co-Operative Bank of South Sudan (6) 29,223 -100.0%
Total PBT before eliminations 9,177,121 10,348,457 -11.3%
Add: Share of profit from associates 92,299 97,477 -5.3%
Group profit before tax 9,269,421 10,445,933 -11.3%
Income tax expense 2,632,009 3,035,849 -13.3%
Group profit after tax 6,637,412 7,410,084 -10.4%

34
Q22017 Q22016 FY2016
Cost to Income(Excluding Provisions) 47.9% 45.3% 52.1%
Cost to Income (Including Provisions) 55.3% 51.4% 58.3%
Cost of funds 3.9% 5.0% 4.5%
Staff Cost to Total Income 23.0% 20.4% 22.2%
Debt to Equity 37.8% 25.5% 32.3%
Average Return on Equity 21.7% 28.2% 22.7%
Average Return on assets 3.6% 4.3% 3.7%
FX to Non Funded income 17.5% 14.2% 14.1%
Non - Funded to Total Income 34.6% 32.1% 30.2%
Net Interest Margin(loans) 9.0% 10.8% 10.5%
Net Interest Margin(Earning Assets) 8.1% 9.7% 9.8%
Effective Corporate Tax Rate 28.4% 29.1% 31.6%
34
Key Profit & Loss Ratios
Cost to Income : With the ongoing transformation strategy the ratio is expected to continue improving
NIM : Stable and in line with the bank’s projections
35
Actual
Q2 2017
Projections
FY 2017
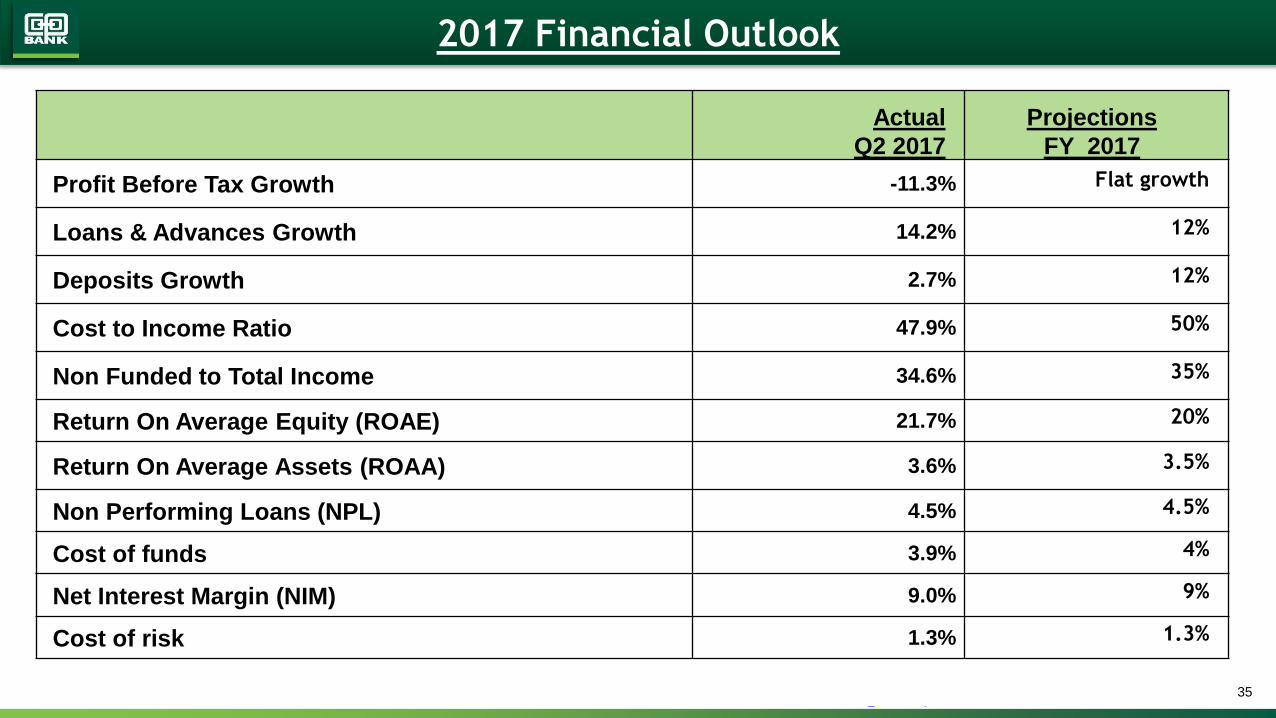
Profit Before Tax Growth -11.3% Flat growth
Loans & Advances Growth 14.2% 12%
Deposits Growth 2.7% 12%
Cost to Income Ratio 47.9% 50%
Non Funded to Total Income 34.6% 35%
Return On Average Equity (ROAE) 21.7% 20%
Return On Average Assets (ROAA) 3.6% 3.5%
Non Performing Loans (NPL) 4.5% 4.5%
Cost of funds 3.9% 4%
Net Interest Margin (NIM) 9.0% 9%
Cost of risk 1.3% 1.3%
35
2017 Financial Outlook

3636
Conclusion
Co-operative Bank will continue to show resilience in the Balance sheet and
profitability growth.
The political environment is expected to improve with the just concluded August 8th
General elections. This will have a positive impact on the economic environment
and the Bank is well positioned to take the opportunities that will arise as the
Government continues to carry out Vision 2030 projects in infrastructure, ICT,
Energy Generation etc.
We will leverage on our strong balance sheet, a cost effective operating structure
anchored on the ongoing ‘Soaring Eagle’ Transformation project and a highly
motivated team.

37
Talk to Us
Tel: 3276000
Our Contact Centre
numbers: 0703 027 000
020 277 6000
SMS: 16111
E-mail:
customerservice@co-
opbank.co.ke
WhatsApp: 0736690101
Thank You
Other
Media