Co-localization of major quantitative trait loci for pod...
12
RESEARCH ARTICLE Open Access Co-localization of major quantitative trait loci for pod size and weight to a 3.7 cM interval on chromosome A05 in cultivated peanut (Arachis hypogaea L.) Huaiyong Luo 1 , Xiaoping Ren 1 , Zhendong Li 1 , Zhijun Xu 1 , Xinping Li 1 , Li Huang 1 , Xiaojing Zhou 1 , Yuning Chen 1 , Weigang Chen 1 , Yong Lei 1 , Boshou Liao 1 , Manish K. Pandey 2 , Rajeev K. Varshney 2 , Baozhu Guo 3 , Xiangguo Jiang 4 , Fei Liu 1 and Huifang Jiang 1* Abstract Background: Cultivated peanut (Arachis hypogaea L.), an important source of edible oil and protein, is widely grown in tropical and subtropical areas of the world. Genetic improvement of yield-related traits is essential for improving yield potential of new peanut varieties. Genomics-assisted breeding (GAB) can accelerate the process of genetic improvement but requires linked markers for the traits of interest. In this context, we developed a recombinant inbred line (RIL) mapping population (Yuanza 9102 × Xuzhou 68-4) with 195 individuals and used to map quantitative trait loci (QTLs) associated with three important pod features, namely pod length, pod width and hundred-pod weight. Results: QTL analysis using the phenotyping data generated across four environments in two locations and genotyping data on 743 mapped loci identified 15 QTLs for pod length, 11 QTLs for pod width and 16 QTLs for hundred-pod weight. The phenotypic variation explained (PVE) ranged from 3.68 to 27.84%. Thirteen QTLs were consistently detected in at least two environments and three QTLs (qPLA05.7, qPLA09.3 and qHPWA05.6) were detected in all four environments indicating their consistent and stable expression. Three major QTLs, detected in at least three environments, were found to be co-localized to a 3.7 cM interval on chromosome A05, and they were qPLA05.7 for pod length (16.89–27.84% PVE), qPWA05.5 for pod width (13.73–14.12% PVE), and qHPWA05.6 for hundred-pod weight (13.75–26.82% PVE). This 3.7 cM linkage interval corresponds to ~2.47 Mb genomic region of the pseudomolecule A05 of A. duranensis, including 114 annotated genes related to catalytic activity and metabolic process. Conclusions: This study identified three major consistent and stable QTLs for pod size and weight which were co-localized in a 3.7 cM interval on chromosome A05. These QTL regions not only offer further investigation for gene discovery and development of functional markers but also provide opportunity for deployment of these QTLs in GAB for improving yield in peanut. Keywords: Peanut, QTL, Pod length, Pod width, Hundred-pod weight, Yield * Correspondence: [email protected] 1 Key Laboratory of Biology and Genetic Improvement of Oil Crops, Ministry of Agriculture, Oil Crops Research Institute of the Chinese Academy of Agricultural Sciences, Wuhan 430062, China Full list of author information is available at the end of the article © The Author(s). 2017 Open Access This article is distributed under the terms of the Creative Commons Attribution 4.0 International License (http://creativecommons.org/licenses/by/4.0/), which permits unrestricted use, distribution, and reproduction in any medium, provided you give appropriate credit to the original author(s) and the source, provide a link to the Creative Commons license, and indicate if changes were made. The Creative Commons Public Domain Dedication waiver (http://creativecommons.org/publicdomain/zero/1.0/) applies to the data made available in this article, unless otherwise stated. Luo et al. BMC Genomics (2017) 18:58 DOI 10.1186/s12864-016-3456-x
Transcript of Co-localization of major quantitative trait loci for pod...

RESEARCH ARTICLE Open Access
Co-localization of major quantitative traitloci for pod size and weight to a 3.7 cMinterval on chromosome A05 in cultivatedpeanut (Arachis hypogaea L.)Huaiyong Luo1, Xiaoping Ren1, Zhendong Li1, Zhijun Xu1, Xinping Li1, Li Huang1, Xiaojing Zhou1, Yuning Chen1,Weigang Chen1, Yong Lei1, Boshou Liao1, Manish K. Pandey2, Rajeev K. Varshney2, Baozhu Guo3, Xiangguo Jiang4,Fei Liu1 and Huifang Jiang1*
Abstract
Background: Cultivated peanut (Arachis hypogaea L.), an important source of edible oil and protein, is widely grown intropical and subtropical areas of the world. Genetic improvement of yield-related traits is essential for improving yieldpotential of new peanut varieties. Genomics-assisted breeding (GAB) can accelerate the process of genetic improvementbut requires linked markers for the traits of interest. In this context, we developed a recombinant inbred line (RIL) mappingpopulation (Yuanza 9102 × Xuzhou 68-4) with 195 individuals and used to map quantitative trait loci (QTLs) associatedwith three important pod features, namely pod length, pod width and hundred-pod weight.
Results: QTL analysis using the phenotyping data generated across four environments in two locations and genotypingdata on 743 mapped loci identified 15 QTLs for pod length, 11 QTLs for pod width and 16 QTLs for hundred-pod weight.The phenotypic variation explained (PVE) ranged from 3.68 to 27.84%. Thirteen QTLs were consistently detected in at leasttwo environments and three QTLs (qPLA05.7, qPLA09.3 and qHPWA05.6) were detected in all four environments indicatingtheir consistent and stable expression. Three major QTLs, detected in at least three environments, were foundto be co-localized to a 3.7 cM interval on chromosome A05, and they were qPLA05.7 for pod length (16.89–27.84% PVE),qPWA05.5 for pod width (13.73–14.12% PVE), and qHPWA05.6 for hundred-pod weight (13.75–26.82% PVE). This 3.7 cMlinkage interval corresponds to ~2.47 Mb genomic region of the pseudomolecule A05 of A. duranensis, including 114annotated genes related to catalytic activity and metabolic process.
Conclusions: This study identified three major consistent and stable QTLs for pod size and weight which wereco-localized in a 3.7 cM interval on chromosome A05. These QTL regions not only offer further investigation for genediscovery and development of functional markers but also provide opportunity for deployment of these QTLs in GABfor improving yield in peanut.
Keywords: Peanut, QTL, Pod length, Pod width, Hundred-pod weight, Yield
* Correspondence: [email protected] Laboratory of Biology and Genetic Improvement of Oil Crops, Ministryof Agriculture, Oil Crops Research Institute of the Chinese Academy ofAgricultural Sciences, Wuhan 430062, ChinaFull list of author information is available at the end of the article
© The Author(s). 2017 Open Access This article is distributed under the terms of the Creative Commons Attribution 4.0International License (http://creativecommons.org/licenses/by/4.0/), which permits unrestricted use, distribution, andreproduction in any medium, provided you give appropriate credit to the original author(s) and the source, provide a link tothe Creative Commons license, and indicate if changes were made. The Creative Commons Public Domain Dedication waiver(http://creativecommons.org/publicdomain/zero/1.0/) applies to the data made available in this article, unless otherwise stated.
Luo et al. BMC Genomics (2017) 18:58 DOI 10.1186/s12864-016-3456-x
BackgroundCultivated peanut or groundnut (Arachis hypogaea L.) isan allotetraploid (2n = 4x = 40) legume crop and iswidely grown worldwide in >100 countries with globalannual production of 42.32 million tonnes (FAOSTAT,2014). Peanut is an important oil crop and has a key rolein human nutrition [1]. Improving yield has been one ofthe major objectives in peanut breeding programs, whichis directly influenced by pod-related traits (PRTs) [2–4].Quantitative traits, including PRTs, show complex inter-action with environment leading to varied productivityunder different environments. In order to select a prom-ising line for varietal release, breeders need to assess itspotential in multiple environments to check its stableperformance to achieve higher adoption in the farmers’field. In a breeding program, it is very difficult and ex-pensive to screen large number of lines across multipleenvironments for yield assessment. Genomics-assistedbreeding (GAB) has potential to accelerate the processof achieving higher genetic gain in less time and withminimum resources using molecular markers [4, 5]. Inorder to deploy GAB, linked markers for PRTs is essen-tial for developing high yielding peanut varieties.Quantitative trait locus (QTL) mapping using bi-
parental population has been widely conducted success-fully to identify the genomic regions associated withquantitative traits in several crop plants [6, 7] includingpeanut. In recent years, QTLs associated with economic-ally important traits such as disease resistance [8, 9],drought tolerance [10, 11], seed and oil quality [12, 13],agronomic and yield traits [14, 15] were identified inpeanut crop. Molecular markers tightly linked to QTLsafter validation can be further deployed in GAB [5, 16].For example, one major QTL for rust resistance wasintrogressed from resistant cultivar ‘GPBD 4’ into threeearly maturing elite varieties through marker-assistedbackcrossing (MABC) [17].Limited efforts were made in identifying QTLs con-
trolling PRTs in peanut which did not provided signifi-cant results deployable in breeding program. Forexample, Selvaraj et al. [4] identified two SSR markers,PM375 and Seq8D09, linked with pod length usingbulked segregant analysis. Similarly, Shirasawa et al. [18]identified three QTLs for pod length and two for podwidth in an F2 population while Fonceka et al. [19]mapped three QTLs for pod length, six for pod widthand two for hundred-pod weight in an advanced back-cross population. More recently, Huang et al. [15] de-tected one QTL for pod length, two QTLs for pod widthand three QTLs for hundred-pod weight in an F2:3population. In addition to above, Chen et al. [3] detected22 QTLs for pod length and width in two F2:3 popula-tions. However, quantitative traits are highly influencedby environments and QTLs identified at one specific
location may not be valid for another location withvaried environmental conditions [14]. Majority of thestudies identified QTLs in segregating populations andnot in fixed population such as RIL population.The RIL population can be repeatedly used for gener-
ation of phenotyping data in multiple environmentswhich is a key factor in doing genetic dissection of com-plex and quantitative traits, thereby helping in preciseidentification of consistent and stable QTLs. The varietyYuanza 9102 is small-podded with low pod weight whilethe variety Xuzhou 68-4 has large pods and higher podweight. In this study, a RIL population was developedfrom the cross between Yuanza 9102 and Xuzhou 68-4and used to identify QTLs controlling yield-related traitssuch as pod length (PL), pod width (PW), and hundred-pod weight (HPW) across four environments.
MethodsPlant materialsA recombinant inbred line (RIL) population in F5 gener-ation was developed from a cross between Yuanza 9102and Xuzhou 68-4 using single seed decent method toconstruct a dense genetic linkage map and conductingQTL analysis for pod features. The female parent,Yuanza 9102, belongs to A. hypogaea subsp. hypogaea var.vulgaris and is derived from interspecific hybridizationbetween the cultivated peanut Baisha1016 and wild spe-cies A. chacoense. The male parent, Xuzhou 68-4, belongsto A. hypogaea subsp. hypogaea var. hypogaea and hassignificantly larger pods than the female parent, Yuanza9102. A total of 195 recombinant inbred lines (RILs) wereused in the present study for generating genotyping andphenotyping data followed by genetic map constructionand QTL analysis.
Field trials for generating phenotyping dataPhenotyping data was generated on the RIL populationfor four environments i.e., three environments at Wuhan(WH), China (F5 generation during 2013, F6 generationduring 2014 and F7 generation during 2015) while singleenvironment at Xiangyang (XY), China (F7 generationduring 2015). These experiments were designated asWH2013, WH2014, WH2015 and XY2015, respectively.Each environment was a field trial conducted at a loca-tion in a year in this paper. The random block design(RBD) with three replications was adopted for generatingphenotyping data during all the four environments. EachRIL was planted in a 2.5 m long single-row and row-to-row space was 33 cm. There were 12 plants in each rowwith plant-to-plant distance of 20 cm. Of these 12plants, 8 plants in the middle of each row wereharvested for trait measurement. Three important podrelated traits (PRTs), pod length (PL), pod width (PW)and hundred-pod weight (HPW), were measured three
Luo et al. BMC Genomics (2017) 18:58 Page 2 of 12

times for each replication according to previously de-scribed standard procedures [15, 20]. To reduce the in-fluence of environmental factors, the mean trait value ineach trial was used in analysis.
Statistical analysis of phenotyping dataStatistical analysis for the phenotypic data of PRTs wasconducted using IBM SPSS Statistics Version 22 soft-ware [21]. The Shapiro-Wilk (w) statistic was used totest the null hypothesis that the phenotypic data werenormally distributed. The univariate variance analyseswere performed using standard GLM method and vari-ance components were estimated using restrictedmaximum likelihood (REML) method. The broad-senseheritability for each trait across the four environmenttrials was calculated based on the estimated variance
components with the following formula: H2 ¼ σ2g=
σ2g þ σ2g�e þ σ2e
� �based on plot mean and H2 ¼ σ2g=
σ2g þ σ2g�e=r þ σ2e=rn� �
based on entry mean, where σ2g
is the genotypic variance component among RILs, σ2g�e
is the RILs × environment interaction variance compo-nent, σ2e is the residual (error) variance component, andr is the number of environment trials, n is the numberof replications in each field experiment [22]. Correlationcoefficients between each pair of the three traits werealso calculated using IBM SPSS Statistics Version 22software [21].
Genotyping of mapping populationA total of 8,112 SSR markers from either publishedreports [18, 23–38] or newly developed SSR markers(unpublished) from the genome sequences of diploid an-cestors [1] were used to screen the polymorphism be-tween parental genotypes of the RIL population.Polymorphic markers were used to genotype completeRIL population along with parental genotypes. GenomicDNA was extracted from young leaves collected fromRILs in F5 generation using a modified CTAB method[39]. The integrity and quality of the DNA was evaluatedon a 1% agarose gel by comparison with uncut lambdaDNA. PCR amplification was conducted in a 10 μlvolume, containing 20 ng DNA template, 0.5 μM eachprimer, 1× PCR buffer, 1 mM MgCl2, 0.2 mM dNTP and0.5 U Taq polymerase. PCR was performed with aBio-Rad T100 Thermal Cycler using the standard PCRprogram with little modification i.e., 95 °C for 4 min;35 cycles of 94 °C for 55 s, 55–58 °C (varies for eachprimer pair) for 45 s, and 72 °C for 1 min; and a finalextension step of 72 °C for 10 min. The PCR productswere separated on a 6% polyacrylamide gel and visual-ized by silver staining [40].
Construction of genetic linkage mapPearson’s Chi square test was used to assess the goodnessof fit to the expected segregation ratio 15:2:15 for co-dominant marker or 17:15 for dominant marker (P < 0.05).A genetic linkage map was constructed using the JoinMap4.0 [41] with a maximum recombinant frequency of 0.4.The recombination ratio was converted to genetic distanceby the Kosambi mapping function [42]. The linkage groups(LGs) were designated as chromosome A01-A10 and B01-B10 based on the common markers as a previouslypublished integrated consensus map [43]. This consensusmap was constructed based on 16 genetic linkage maps[43] and used as reference in other publications [3, 15, 44].The graphical presentation of genetic linkage map wasgenerated with the MapChart 2.3 software [45].
QTL analysisGenome-wide QTL mapping was performed using themean value of each trait in each environment. QTLanalysis was conducted using the composite intervalmapping (CIM) method [46] in the Windows QTLCartographer 2.5 software [47]. The standard CIMmodel (model 6) and forward regression method wereselected. The number of control markers, window sizeand walk speed were 5, 10 and 2 cM, respectively.The threshold of LOD for declaring the presence of aQTL was determined by 1000 permutation tests.When separated by a minimum distance of 20 cM,two peaks on one chromosome were considered astwo different QTLs [10]. Otherwise, the higher peakwas chosen to more closely approximate the positionof the QTL. If QTLs for the same trait detected indifferent environments had overlapping 2-LOD sup-port intervals, they were considered to be the sameQTL and also been designated as consistent QTLs.Similarly, if the same QTL appeared in both the loca-tions (Wuhan and Xiangyang), such QTLs were refer-eed as stable QTLs. QTLs were designated with aninitial letter ‘q’ followed by the trait name and theLG corresponding chromosome, similar to the previ-ously described nomenclature [48]. After the linkagegroup, a number was added if more than one QTLwas detected for the same trait and linkage group.For example, if two QTLs for pod length were de-tected on chromosome A05, they were named asqPLA05.1 and qPLA05.2, respectively. If QTLs fordifferent traits had overlapping 2-LOD support inter-vals, they were clustered in specific co-localizedchromosomal regions. Genome sequences and annota-tions of the diploid ancestors of cultivated peanutwere downloaded from PeanutBase [1]. Molecularmarkers were positioned on the chromosomal pseudo-molecules using BLAST and ePCR (electronic PCR) withhigh similarity parameters (taking the top hits only, with
Luo et al. BMC Genomics (2017) 18:58 Page 3 of 12

placement by BLAST (evalue < 1� 10�10 ) given prefer-ence over ePCR where both were available) [1].
ResultsPhenotypic variation of Pod Related Traits (PRTs)Significant differences were found between the two par-ents for various PRTs across four environments i.e.,WH2013, WH2014, WH2015 and XY2015 (Table 1).Large phenotypic variations for the PRTs were observedamong RILs in all the four environments, showing con-tinuous distributions with transgressive segregation(Table 1, Fig. 1). The normality test indicated that thephenotypic data were normally distributed for PRTs,except pod weight (PW) in WH2013 trial, pod length(PL) in WH2015 trial and hundred-pod weight (HPW)in XY2015 trial (Table 1, Fig. 1). Variance analysis forthe PRTs across the four trials showed significant differ-ences among RILs, environments and RILs × environmentinteractions (Table 2). The values of broad sense heritabil-ity were estimated to be 0.70 for pod length, 0.51 for podweight and 0.66 for hundred-pod weight based on plotmean while these estimates were much higher based onentry mean, such as 0.92 for pod length, 0.83 for podweight and 0.90 for hundred-pod weight. Correlationanalysis indicated that the three PRTs had significant posi-tive association between each other (Table 3) and there-fore positive relationship with potential yield.
Molecular marker polymorphisms and genetic mapconstructionOut of 8,112 SSR markers screened on the parentalgenotypes of the RIL population, 729 markers showedpolymorphisms in the parents as well as in the RILpopulation (Additional file 1: Table S1). Among them,
one marker AHGS0729 amplified three genetic loci and12 markers amplified two loci, while the remaining 716markers amplified a single locus. Among these 743 gen-etic loci, 660 loci were co-dominant and 83 loci weredominant. The Chi square analysis identified 356 loci(47.91%) with segregation distortion. A genetic linkagemap containing 743 loci was constructed spanning1,232.57 cM with an average inter-marker distance of1.66 cM (Table 4, Additional file 2: Table S2). All the743 loci were assigned to 22 LGs whose length variedfrom 9.47 cM to 119.48 cM and number of mapped lociranged from 3 to 97 marker loci (Table 4, Additional file 3:Figure S1). Based on 292 common markers which were alsoincluded in a previously published integrated consensusmap [43], 19 of the 22 LGs were assigned to 17chromosomes of the A and B subgenomes (Table 4,Additional file 4: Figure S2). Chromosome A01 wasfound to be divided into two LGs (LG01 and LG02)due to insufficient linkage between them. Similarly,chromosome A08 was divided into LG08 and LG09.
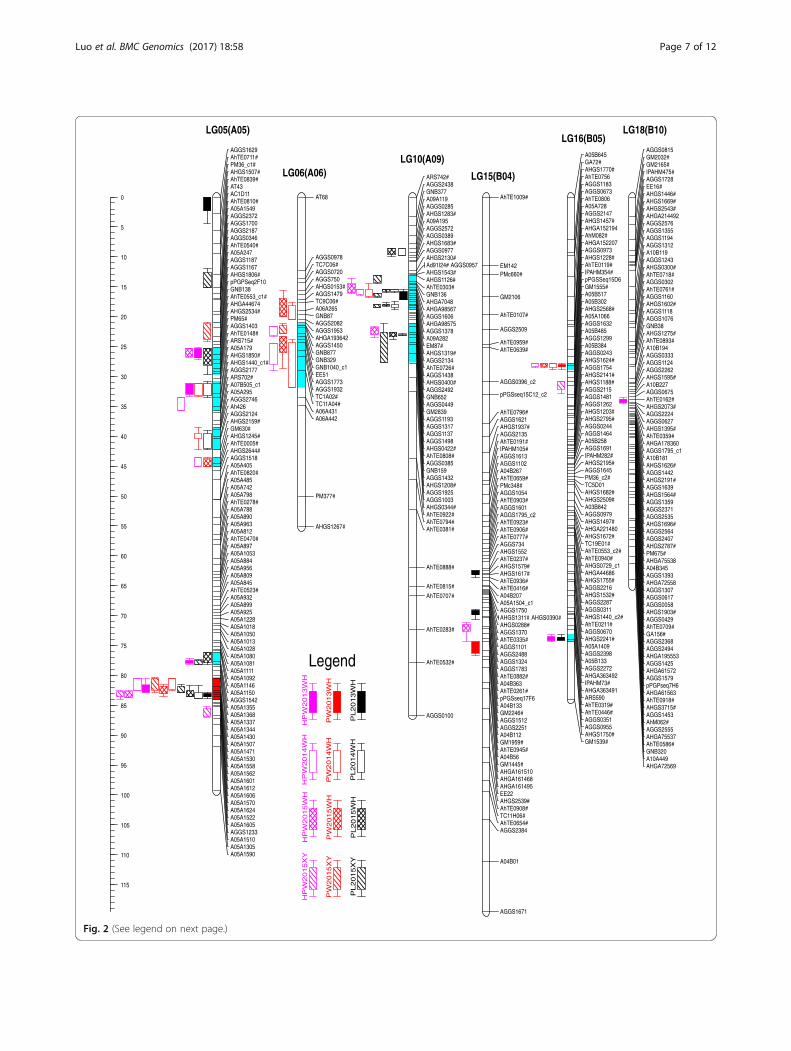
Detection of QTLs for Pod Related Traits (PRTs)QTL analysis using phenotyping and genotyping dataidentified a total of 65 QTLs with 3.68 to 27.84% pheno-typic variation explained (PVE) associated with the PRTs inthe four environments (Fig. 2, Additional file 5: Table S3).For pod length, six QTLs were detected in WH2013 trial(5.45–16.89% PVE), seven QTLs in WH2014 trial (5.27–27.84% PVE), seven QTLs in WH2015 trial (9.33–23.91%PVE), and seven QTLs in XY2015 trial (3.68–25.68% PVE).For pod width, two QTLs were detected in WH2013 trial(5.88–8.90% PVE), seven QTLs in WH2014 trial (5.26–14.03% PVE), five QTLs in WH2015 trial (6.42–13.73%PVE), and three QTLs in XY2015 trial (5.40–14.12% PVE).For hundred-pod weight, six QTLs were detected in
Table 1 Descriptive statistical analysis of phenotypes of pod-related traits in the RIL population
Env Trait P1 P2 Range Mean SD Skew Kurt w(Sig)
WH2013 PL(cm) 3.07 3.59 2.57–3.91 3.16 0.27 0.24 −0.25 0.99(0.304)
PW(cm) 1.49 1.71 1.25–1.85 1.52 0.12 0.47 −0.23 0.97(0.003)
HPW(g) 178.31 222.26 126.6–281.52 195.84 28.46 0.19 0.01 0.99(0.891)
WH2014 PL(cm) 2.90 3.70 2.62–3.97 3.26 0.27 0.09 −0.46 0.99(0.582)
PW(cm) 1.58 1.87 1.35–2.07 1.68 0.14 0.13 −0.31 0.99(0.635)
HPW(g) 190.06 273.19 155.23–297.5 218.45 30.30 0.23 −0.59 0.99(0.066)
WH2015 PL(cm) 2.87 3.55 2.78–4.18 3.28 0.26 0.52 0.33 0.98(0.009)
PW(cm) 1.60 1.78 1.38–2.04 1.69 0.12 0.12 −0.02 0.99(0.926)
HPW(g) 179.90 267.33 153–306.94 215.30 28.55 0.22 −0.10 0.99(0.410)
XY2015 PL(cm) 3.61 4.07 2.89–4.61 3.63 0.31 0.32 0.35 0.99(0.289)
PW(cm) 1.49 1.73 1.32–1.95 1.66 0.11 0.14 0.00 0.99(0.641)
HPW(g) 195.63 248.84 172.13–354.7 239.75 32.84 0.63 0.23 0.97(0.000)
Env Environment, P1 female parent Yuanza 9102, P2 male parent Xuzhou 68-4, SD standard deviation, Skew Skewness, Kurt Kurtosis, w Shariro-Wilk statistic value,Sig Significance, WH Wuhan, XY Xiangyang, PL Pod length, PW pod width, HPW hundred-pod weight
Luo et al. BMC Genomics (2017) 18:58 Page 4 of 12

PL2013WH
2.5 3.0 3.5 4.0
0.0
0.5
1.0
1.5
PL2014WH
2.6 3.0 3.4 3.8
0.0
0.4
0.8
1.2
PL2015WH
3.0 3.5 4.0
0.0
0.5
1.0
1.5
PL2015XY
3.0 3.5 4.0 4.5
0.0
0.5
1.0
1.5
PW2013WH
1.3 1.4 1.5 1.6 1.7 1.8
01
23
PW2014WH
1.4 1.6 1.8 2.0
0.0
1.0
2.0
PW2015WH
1.4 1.6 1.8 2.0
0.0
1.0
2.0
3.0
PW2015XY
1.3 1.5 1.7 1.9
01
23
4
HPW2013WH
150 200 250
0.00
00.01
0
HPW2014WH
150 200 250 300
0.00
00.00
60.01
2
HPW2015WH
150 200 250 3000.00
00.01
0HPW2015XY
200 250 300 350
0.00
00.01
0
Fig. 1 Phenotype distribution of pod length, pod width and hundred-pod weight. The y-axis represented density, while the x-axis representedvalues of each trait. The normal distribution curve in each graph represented the expected density. WH Wuhan, XY Xiangyang, PL Pod lentth,PW pod width, HPW hundred-pod weight. PL2013WH means pod length in Wuhan 2013, etc
Table 2 Analysis of variance for pod-related traits in the RILpopulation across four environment trials
Trait Variables df Mean square F-value P-value
PL RILs 194 0.498 49.257 <0.001
Evironments 3 16.382 1620.365 <0.001
RILs × Evironments 572 0.040 3.933 <0.001
Error 768 0.010
PW RILs 194 0.077 26.852 <0.001
Evironments 3 3.323 808.951 <0.001
RILs × Evironments 572 0.013 4.499 <0.001
Error 768 0.003
HPW RILs 194 5470.988 70.586 <0.001
Evironments 3 125432.506 1618.314 <0.001
RILs × Evironments 572 567.502 7.322 <0.001
Error 768 77.508
PL Pod length, PW pod width, HPW hundred-pod weight
Table 3 Correlation analysis for pod-related traits in the RILpopulation
Env Trait PL PW HPW
WH2013 PL 1
PW 0.725a 1
HPW 0.738a 0.669a 1
WH2014 PL 1
PW 0.736a 1
HPW 0.789a 0.910a 1
WH2015 PL 1
PW 0.610a 1
HPW 0.814a 0.805a 1
XY2015 PL 1
PW 0.489a 1
HPW 0.674a 0.635a 1aCorrelation is significant at the 0.01 levelWH Wuhan, XY Xiangyang, PL pod length, PW pod width, HPWhundred-pod weight
Luo et al. BMC Genomics (2017) 18:58 Page 5 of 12

WH2013 trial (4.81–21.74% PVE), seven QTLs inWH2014 trial (5.72–21.29% PVE), five QTLs in WH2015trial (4.12–26.82%), and three QTLs in XY2015 trial(6.52–13.75% PVE).As shown in Fig. 2, some QTLs detected in different
environments for the same trait had overlapping 2-LODsupport intervals, and they were considered to be oneQTL which could be repeatedly detected. Therefore, the65 loci detected in four environment trials were desig-nated as 15 QTLs for pod length, 11 QTLs for pod width,and 16 QTLs for hundred-pod number (Additional file 5:Table S3).For pod length, the 15 QTLs were identified on chro-
mosomes A05, A09, B04 and B05. Two QTLs, qPLA05.7and qPLA09.3, were found to be consistent and stable asthey were detected in all four environments. Flanked bythe marker A05A1430 and A05A1601 on chromosomeA05, the QTL for pod length, qPLA05.7, explained16.89, 17.84, 23.91 and 25.68% of the phenotypic vari-ance in WH2013, WH2014, WH2015 and XY2015environments, respectively. Similarly, another QTL for
pod length, qPLA09.3, flanked by AGGS1606 andAGGS2134 on chromosome A09 explained 5.45, 17.76,14.47 and 12.41% of the phenotypic variance in four en-vironments, respectively. Further, two additional QTLsfor pod length, qPLA09.4 (AGGS2134 - AGGS2492) andqPLA09.5 (AGGS1137 - AGGS1925), were mapped onchromosome A09 in three environments (WH2014,WH2015 and XY2015) with 12.05–16.91% and 11.33–16.86% PVE, respectively.For pod width, of the 11 QTLs identified on five chro-
mosomes (A05, A06, A09, B04 and B05), two QTLs,qPWA05.5 and qPWB05, were consistent and stable inexpression as they were detected in three environments(WH2014, WH2015 and XY2015). The first QTLqPWA05.5 (A05A1344 - A05A1562) had showed 13.73–14.12% PVE while the second QTL qPWB05(AHGA152207 - AHGS1228) showed 5.88–7.30% PVEin WH2014, WH2015 and XY2015 trials.Similarly for hundred-pod weight, the 16 QTLs were
identified on chromosomes A05, A06, A09, B04, B05and B10. A major QTL on chromosome A05, designatedas qHPWA05.6, was detected in all four environmentsand hence consistent and stable. Interestingly, it wasflanked by the same markers (A05A1430 - A05A1601)as the major QTL qPLA05.7 for pod length and hadshown 21.74, 21.29, 26.82 and 13.75% PVE in WH2013,WH2014, WH2015 and XY2015, respectively.
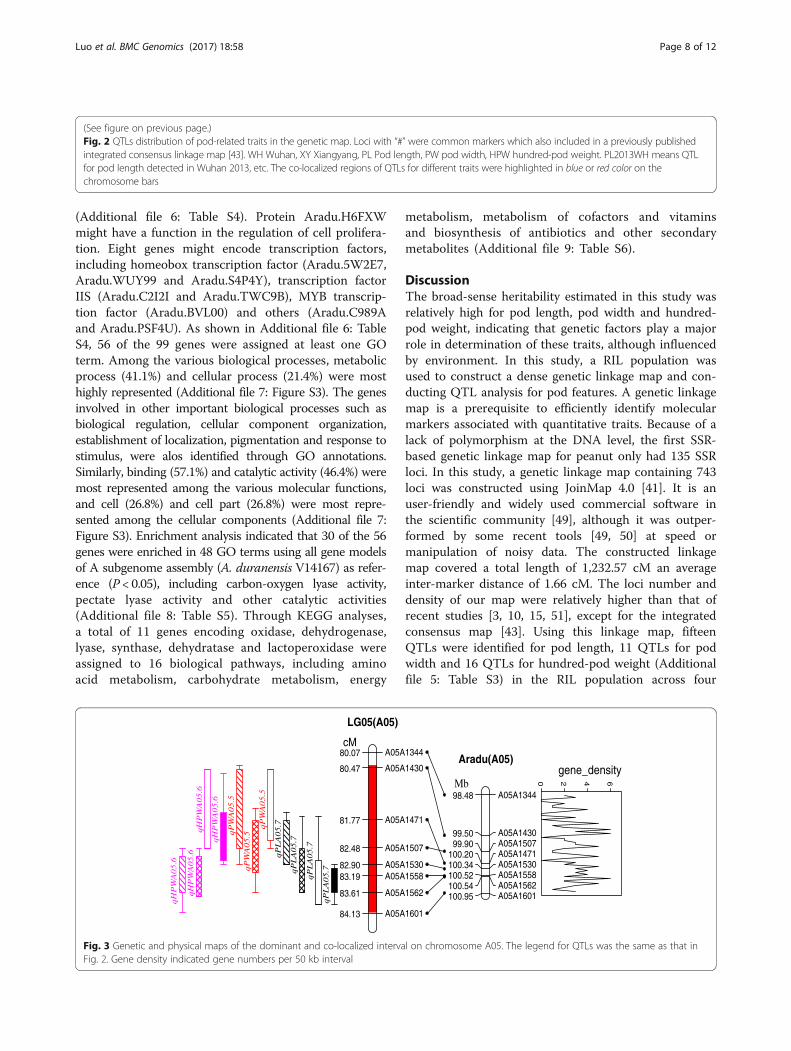
A co-localized region of stable and major QTLs for PRTson chromosome A05A total of 11 chromosomal regions harbored QTLs fordifferent traits where multiple QTLs were mapped(Fig. 2). This phenomenon was not unexpected given thestrong positive correlations among the three traits(Table 3), indicating the existing of pleiotropic effects ofsingle gene or tight linkage. A co-localized QTL intervalclose to the end region of chromosome A05 was signifi-cantly more dominant than others. It was located at80.4–84.1 cM map position on chromosome A05 andcovering around 3.7 cM in length with flanking markersA05A1344 and A05A1601 (Figs. 2 and 3). This regionharbored the major QTLs for pod length (qPLA05.7),pod width (qPWA05.5), and hundred-pod weight(qHPWA05.6) (Fig. 3, Table 5). Each QTL was detectedat least in three environments and hence more consist-ent and stable in expression.BLAST searching and ePCR of eight markers mapped
in this region could be traced to the pseudomoleculeA05 of A subgenome (A. duranensis V14167) [1] (Fig. 3).The corresponding position of 3.7 cM on the geneticmap was about 2.47 Mb in the physical map i.e.,98,478,303 bp to 100,945,376 bp containing 114 putativegenes [1]. Fifteen novel genes encoded unknown pro-teins, while the other 99 genes had reported homologs
Table 4 Description of the genetic linkage map constructed inthis study
LGs Chrom Length(cM) Locia Common locib
LG01 A01 86.62 61 23
LG02 A01 39.84 6 4
LG03 A03 42.98 10 6
LG04 A04 20.47 6 2
LG05 A05 99.27 97 24
LG06 A06 55.05 26 7
LG07 A07 46.26 38 19
LG08 A08 50.86 23 12
LG09 A08 15.43 3 1
LG10 A09 86.68 56 24
LG11 A10 13.78 3 2
LG12 B01 67.91 64 33
LG13 B02 80.57 77 32
LG14 B03 72.29 7 4
LG15 B04 119.48 71 34
LG16 B05 83.97 81 33
LG17 B09 42.56 7 3
LG18 B10 63.95 85 29
LG19 - 106.19 11 0
LG20 - 16.12 5 0
LG21 - 9.47 3 0
LG22 - 12.82 3 0
Total - 1,232.57 743 292aNumber of loci in each linkage groupbNumber of common markers which were contained in a previously publishedintegrated consensus linkage map [43]
Luo et al. BMC Genomics (2017) 18:58 Page 6 of 12
AGGS1629AhTE0711#PM36_c1#AHGS1507#AhTE0839#AT43AC1D11AhTE0810#A05A1549AGGS2372AGGS1700AGGS2187AGGS0346AhTE0540#A05A247AGGS1187AGGS1167AHGS1806#pPGPSeq2F10GNB138AhTE0553_c1#AHGA44674AHGS2534#PM65#AGGS1403AhTE0148#ARS715#A05A179AHGS1850#AHGS1440_c1#AGGS2177ARS702#A07B505_c1A05A295AGGS2746Ah426AGGS2124AHGS2159#GM630#AHGS1245#AhTE0005#AHGS2644#AGGS1518A05A405AhTE0820#A05A485A05A742A05A798AhTE0278#A05A788A05A890A05A963A05A812AhTE0470#A05A897A05A1053A05A884A05A956A05A809A05A845AhTE0523#A05A932A05A899A05A925A05A1228A05A1018A05A1050A05A1013A05A1028A05A1080A05A1081A05A1111A05A1092A05A1146A05A1150AGGS1542A05A1355A05A1368A05A1337A05A1344A05A1430A05A1507A05A1471A05A1530A05A1558A05A1562A05A1601A05A1612A05A1606A05A1570A05A1624A05A1522A05A1605AGGS1233A05A1510A05A1305A05A1590
LG05(A05)
AT68
AGGS0978TC7C06#AGGS0720AGGS750AHGS0153#AGGS1479TC9C06#A06A265GNB87AGGS2082AGGS1953AHGA193642AGGS1450GNB877GNB329GNB1040_c1EE51AGGS1773AGGS1932TC1A02#TC11A04#A06A431A06A442
PM377#
AHGS1267#
LG06(A06) ARS742#AGGS2438GNB377A09A119AGGS0285AHGS1283#A09A195AGGS2572AGGS0389AHGS1683#AGGS0977AHGS2130#Ad91I24# AGGS0957AHGS1543#AHGS1126#AhTE0303#GNB136AHGA7048AHGA98567AGGS1606AHGA98575AGGS1378A09A282EM87#AHGS1319#AGGS2134AhTE0726#AGGS1438AHGS0400#AGGS2492GNB652AGGS0449GM2839AGGS1193AGGS1317AGGS1137AGGS1498AHGS0422#AhTE0808#AGGS0385GNB159AGGS1432AHGS1208#AGGS1925AGGS1003AHGS0344#AhTE0922#AhTE0794#AhTE0381#
AhTE0888#
AhTE0815#
AhTE0707#
AhTE0283#
AhTE0532#
AGGS0100
LG10(A09)
AhTE1009#
EM142PMc660#
GM2106
AhTE0107#
AGGS2509
AhTE0959#AhTE0639#
AGGS0396_c2
pPGSseq15C12_c2
AhTE0796#AGGS1621AHGS1937#AGGS2135AhTE0191#IPAHM105#AGGS1613AGGS1102A04B267AhTE0659#PMc348#AGGS1054AhTE0903#AGGS1601AGGS1795_c2AhTE0923#AhTE0906#AhTE0777#AGGS734AHGS1552AhTE0237#AHGS1579#AHGS1617#AhTE0936#AhTE0416#A04B207A05A1504_c1AGGS1750AHGS1311# AHGS0390#AHGS0288#AGGS1370AhTE0335#AGGS1101AGGS2488AGGS1324AGGS1783AhTE0882#A04B363AhTE0261#pPGSseq17F6A04B133GM2246#AGGS1512AGGS2251A04B112GM1959#AhTE0945#A04B56GM1445#AHGA161510AHGA161468AHGA161495EE22AHGS2539#AhTE0908#TC11H06#AhTE0654#AGGS2384
A04B01
AGGS1671
LG15(B04)
A05B645GA72#AHGS1770#AhTE0756AGGS1183AGGS0673AhTE0806A05A728AGGS2147AHGS1457#AHGA152194AhM082#AHGA152207AGGS0973AHGS1228#AhTE0119#IPAHM354#pPGSSeq15D6GM1555#A05B517A05B302AHGS2568#A05A1066AGGS1632A05B485AGGS1299A05B384AGGS0243AHGS1624#AGGS1754AHGS2141#AHGS1188#AGGS2115AGGS1481AGGS1262AHGS1203#AHGS2795#AGGS0244AGGS1464A05B258AGGS1691IPAHM282#AHGS2195#AGGS1645PM36_c2#TC5D01AHGS1682#AHGS2509#A03B842AGGS0979AHGS1497#AHGA221480AHGS1672#TC19E01#AhTE0553_c2#AhTE0940#AHGS0729_c1AHGA44686AHGS1755#AGGS2216AHGS1532#AGGS2287AGGS0311AHGS1440_c2#AhTE0211#AGGS0670AHGS2241#A05A1409AGGS2398A05B133AGGS2272AHGA363492IPAHM73#AHGA363491ARS590AhTE0319#AhTE0446#AGGS0351AGGS0955AHGS1750#GM1539#
LG16(B05)AGGS0815GM2032#GM2165#IPAHM475#AGGS1728EE16#AHGS1446#AHGS1669#AHGS2543#AHGA214492AGGS2576AGGS1355AGGS1194AGGS1312A10B119AGGS1243AHGS0300#AhTE0718#AGGS0302AhTE0761#AGGS1160AHGS1602#AGGS1118AGGS1076GNB38AHGS1275#AhTE0893#A10B194AGGS0333AGGS1124AGGS2262AHGS1595#A10B227AGGS0675AhTE0162#AHGS2073#AGGS2224AGGS0627AHGS1395#AhTE0359#AHGA178360AGGS1795_c1A10B181AHGS1626#AGGS1442AHGS2191#AGGS1639AHGS1564#AGGS1359AGGS2371AGGS2535AHGS1696#AGGS2564AGGS2407AHGS2787#PM675#AHGA75538A04B345AGGS1393AHGA72558AGGS1307AGGS0617AGGS0058AHGS1903#AGGS0429AhTE0709#GA156#AGGS2368AGGS2494AHGA195553AGGS1425AHGA61572AGGS1579pPGPseq7H6AHGA61563AhTE0918#AHGS3715#AGGS1453AhM062#AGGS2555AHGA75537AhTE0586#GNB320A10A449AHGA72569
LG18(B10)
0
5
10
15
20
25
30
35
40
45
50
55
60
65
70
75
80
85
90
95
100
105
110
115
PL2014WH
PW2014WH
HPW2014WH
PL2013WH
PW2013WH
HPW2013WH
PL2015XY
PW2015XY
HPW2015XY
PL2015WH
PW2015WH
HPW2015WH
Legend
Fig. 2 (See legend on next page.)
Luo et al. BMC Genomics (2017) 18:58 Page 7 of 12
(Additional file 6: Table S4). Protein Aradu.H6FXWmight have a function in the regulation of cell prolifera-tion. Eight genes might encode transcription factors,including homeobox transcription factor (Aradu.5W2E7,Aradu.WUY99 and Aradu.S4P4Y), transcription factorIIS (Aradu.C2I2I and Aradu.TWC9B), MYB transcrip-tion factor (Aradu.BVL00) and others (Aradu.C989Aand Aradu.PSF4U). As shown in Additional file 6: TableS4, 56 of the 99 genes were assigned at least one GOterm. Among the various biological processes, metabolicprocess (41.1%) and cellular process (21.4%) were mosthighly represented (Additional file 7: Figure S3). The genesinvolved in other important biological processes such asbiological regulation, cellular component organization,establishment of localization, pigmentation and response tostimulus, were alos identified through GO annotations.Similarly, binding (57.1%) and catalytic activity (46.4%) weremost represented among the various molecular functions,and cell (26.8%) and cell part (26.8%) were most repre-sented among the cellular components (Additional file 7:Figure S3). Enrichment analysis indicated that 30 of the 56genes were enriched in 48 GO terms using all gene modelsof A subgenome assembly (A. duranensis V14167) as refer-ence (P < 0.05), including carbon-oxygen lyase activity,pectate lyase activity and other catalytic activities(Additional file 8: Table S5). Through KEGG analyses,a total of 11 genes encoding oxidase, dehydrogenase,lyase, synthase, dehydratase and lactoperoxidase wereassigned to 16 biological pathways, including aminoacid metabolism, carbohydrate metabolism, energy
metabolism, metabolism of cofactors and vitaminsand biosynthesis of antibiotics and other secondarymetabolites (Additional file 9: Table S6).
DiscussionThe broad-sense heritability estimated in this study wasrelatively high for pod length, pod width and hundred-pod weight, indicating that genetic factors play a majorrole in determination of these traits, although influencedby environment. In this study, a RIL population wasused to construct a dense genetic linkage map and con-ducting QTL analysis for pod features. A genetic linkagemap is a prerequisite to efficiently identify molecularmarkers associated with quantitative traits. Because of alack of polymorphism at the DNA level, the first SSR-based genetic linkage map for peanut only had 135 SSRloci. In this study, a genetic linkage map containing 743loci was constructed using JoinMap 4.0 [41]. It is anuser-friendly and widely used commercial software inthe scientific community [49], although it was outper-formed by some recent tools [49, 50] at speed ormanipulation of noisy data. The constructed linkagemap covered a total length of 1,232.57 cM an averageinter-marker distance of 1.66 cM. The loci number anddensity of our map were relatively higher than that ofrecent studies [3, 10, 15, 51], except for the integratedconsensus map [43]. Using this linkage map, fifteenQTLs were identified for pod length, 11 QTLs for podwidth and 16 QTLs for hundred-pod weight (Additionalfile 5: Table S3) in the RIL population across four
(See figure on previous page.)Fig. 2 QTLs distribution of pod-related traits in the genetic map. Loci with “#” were common markers which also included in a previously publishedintegrated consensus linkage map [43]. WH Wuhan, XY Xiangyang, PL Pod length, PW pod width, HPW hundred-pod weight. PL2013WH means QTLfor pod length detected in Wuhan 2013, etc. The co-localized regions of QTLs for different traits were highlighted in blue or red color on thechromosome bars
A05A134480.07
A05A143080.47
A05A147181.77
A05A150782.48
A05A153082.90A05A155883.19
A05A156283.61
A05A160184.13
qPLA05.7
qPLA05.7
qPLA05.7
qPLA05.7qPWA05.5
qPWA05.5qPWA05.5
qHPWA05.6
qHPWA05.6
qHPWA05.6
qHPWA05.6
LG05(A05)
A05A134498.48
A05A143099.50A05A150799.90A05A1471100.20A05A1530100.34A05A1558100.52A05A1562100.54A05A1601100.95
0 2 4 6
Aradu(A05)gene_density
Mb
cM
Fig. 3 Genetic and physical maps of the dominant and co-localized interval on chromosome A05. The legend for QTLs was the same as that inFig. 2. Gene density indicated gene numbers per 50 kb interval
Luo et al. BMC Genomics (2017) 18:58 Page 8 of 12

environments. The LOD values of these QTLs rangedfrom 3.2 to 22.7 and were higher than the threshold ofLOD for declaring the presence of a QTL which wasdetermined by 1000 permutation tests. All the linkedmarkers identified for pod related traits after validationcan be deployed in breeding for marker-based selectionto improve yield in peanut.
QTLs for pod related traits with stable performanceBesides identification of QTLs, it is very important toassess their stable performance across varied environ-ments. A similar study conducted by Chen et al. [3]detected six QTLs for pod length and eight QTLs forpod width in a F2:3 populations in two environments,but none of them were detected in both environments.Despite the significant G × E interactions (P < 0.001)present in the four trials conducted in this study, threemajor QTLs (qHPWA05.6 for hundred-pod weight,qPLA05.7 and qPLA09.3 for pod length) have shownstable performance across four environments and twolocations. In addition, four QTLs for pod length, fourQTLs for pod width and two QTLs for HPW weredetected in two or three trials. Such QTLs with stableperformance for pod related traits have been identifiedfor the first time in peanut and will be very useful forfurther fine mapping of the QTL region and develop-ment of diagnostic markers to use in breeding.The present study reports 15 QTLs for pod length
mapped on chromosomes A05, A09, B04 and B05, thethree QTLs (qPLB04.1, qPLB04.2 and qPLB05) were notdetected in earlier studies, hence, novel QTLs. The chro-mosomes A05 and A09 might harbor important genesfor pod length as seven QTLs from this study and sixQTLs from earlier studies [3, 18] were mapped on A05,and five QTLs from this study and six QTLs from previ-ous studies [3, 4, 18, 19] were identified on A09. Ofthese QTLs, two QTLs, qPLA05.7 and qPLA09.3,
identified in this study had stable expression acrossenvironments.Similarly, of the 11 QTLs identified for pod width in
this study on chromosomes A05, A06, A09, B04 andB05, QTLs identified on chromosomes A06 (qPWA06.1,qPWA06.2, qPWA06.3) and B04 (qPWB04) were novelQTLs. Chromosome A05 seems very important andmight harbor important genes for pod width, as fiveQTLs from present study and six QTLs from previousstudies [3, 15] were mapped on this chromosome. TheQTL qPWA05.5 explained the largest phenotypic varia-tions and consistently expressed across environments.The two QTLs reported by previous study conducted byChen et al. [3] and one QTL, qPWA09, identified in thisstudy were mapped on the chromosome A09. Similarly,two QTLs identified by Fonceka et al. [19] and oneQTL, qPWB05, detected in this study were mapped onthe chromosome B05.The 16 QTLs detected in the present study for
hundred-pod weight were mapped on the chromosomesA05, A06, A09, B04, B05 and B10, while the five QTLsreported in previous studies [15, 19] were located onchromosomes A07, B02, B03 and B05. Therefore, the 16QTLs identified in the present study were novel innature. Of these QTLs, the QTL qHPWA05.6 was themost consistent and stable one. The above resultssuggested that these pod-related traits are quantitative innature controlled by multiple genomic regions and theireffects were often affected by the environment.
Co-localized region on chromosome A05 play a majorrole in controlling pod related traitsThe present study identified a co-localized genomicregion on A05 harboring QTLs for pod related traits.This region harbored one important QTL for each podrelated traits i.e., qPLA05.7 for pod length, qPWA05.5for pod width, and qHPWA05.6 for hundred-pod weight.
Table 5 QTLs harbored in the dominant and co-localized interval on chromosome A05
Trait QTL Marker interval Location & year LOD Additive PVE(%)
PL qPLA05.7 A05A1430-A05A1601 Wuhan 2013 11.1 0.1154 16.89
Wuhan 2014 22.7 0.1490 27.84
Wuhan 2015 19.4 0.1297 23.91
Xiangyang 2015 18.6 0.1595 25.68
PW qPWA05.5 A05A1344-A05A1562 Wuhan 2014 9.9 0.0541 14.03
Wuhan 2015 9.0 0.0538 13.73
Xiangyang 2015 8.0 0.0441 14.12
HPW qHPWA05.6 A05A1430-A05A1601 Wuhan 2013 13.0 13.6342 21.74
Wuhan 2014 14.6 14.6633 21.29
Wuhan 2015 16.3 15.6463 26.82
Xiangyang 2015 7.5 12.8723 13.75
PL pod length, PW pod width, HPW hundred-pod weight, PVE phenotypic variation explained
Luo et al. BMC Genomics (2017) 18:58 Page 9 of 12

This region also provided a significant level of contribu-tion to phenotypic variation explained by these QTLsi.e., 16.89–27.84% PVE for pod length and 13.75–26.82%PVE for hundred-pod weight across all the four environ-ments, and 13.73–14.12% PVE for pod width in three ofthe four environments. The above results indicate im-portance of this co-localized region for improving podrelated traits through GAB. Further, this importantgenomic region also provides opportunity for fine map-ping and development of diagnostic markers for use inimproving these traits.In addition to above mentioned further possible studies,
the recently completed genome sequences of the diploidancestors of cultivated peanut [1] provides a physical mapof the highest resolution and allows the possibility toexamine the co-localized region at the end of chromo-some A05. The 3.7 cM genetic map distance was corre-sponding to the 2.47 Mb physical map region whichhouses 114 candidate genes. Thirteen percent of thesegenes are novel genes with unknown function and seemsto be an enrichment of genes involved in catalytic activityand metabolic process. Eight genes were transcriptionfactors and protein Aradu.H6FXW seems to have a func-tion in the regulation of cell proliferation. The applicationof the genome sequences of wild peanut provided us anoverview of candidate genes in the chromosome region ofinterest; however, these genes remain candidates untilshown to be causally associated with the phenotypicvariations in further studies.
ConclusionsThe present study identified 15 QTLs for pod length, 11QTLs for pod width and 16 QTLs for hundred-pod weightusing a RIL population across four environments in twolocations. Multiple stable and major QTLs for pod relatedtraits were co-located at the end of chromosome A05.These QTLs needs further investigation to fine map anddevelop diagnostic markers for these traits to use them inroutine breeding program using GAB in peanut.
Additional files
Additional file 1: Table S1. Detailed information of SSR markers usedfor genotyping the RIL population. (XLSX 49 kb)
Additional file 2: Table S2. Genetic linkage map constructed based on743 polymorphic loci in the RIL population. (XLSX 28 kb)
Additional file 3: Figure S1. Graphical presentation of genetic linkagemap constructed in this study. (PDF 207 kb)
Additional file 4: Figure S2. Common markers between the newlyconstructed linkage map and the previously published integratedconsensus map. (PDF 321 kb)
Additional file 5: Table S3. QTLs detected for pod-related traits in fourenvironments. (XLSX 15 kb)
Additional file 6: Table S4. Functional annotations of putative genes inthe dominant and co-localized interval on chromosome A05. (XLSX 19 kb)
Additional file 7: Figure S3. GO annotations of genes in the dominantand co-localized interval on chromosome A05. (TIF 597 kb)
Additional file 8: Table S5. Enriched GO terms for putative genes in thedominant and co-localized interval on chromosome A05. (XLSX 29 kb)
Additional file 9: Table S6. KEGG pathways for putative genes in thedominant and co-localized interval on chromosome A05. (XLSX 12 kb)
AbbreviationsCIM: Composite interval mapping; HPW: Hundred-pod weight; LGs: Linkagegroups; PL: Pod length; PRTs: Pod-related traits; PVE: Phenotypic varianceexplained; PW: Pod width; QTLs: Quantitative trait loci; RILs: Recombinantinbred lines; WH: Wuhan; XY: Xiangyang
AcknowledgementsNot applicable.
FundingThis study was supported by the National Natural Science Foundations of China(31271764, 31371662, 31471534 and 31461143022), the China AgricultureResearch System (CARS-14), and the Crop Germplasm Resources Project ofChina (NB2012-2130135-28). The work reported in this article was undertaken asa part of the CGIAR Research Program on Grain Legumes. ICRISAT is a memberof the CGIAR. The funders had no role in study design, data collection andanalysis, decision to publish, or preparation of the manuscript.
Availability of data and materialsThe datasets supporting the conclusions of this article are included withinthe article and its additional files.
Author’ contributionsHL XZ YC YL BL BG FL and HJ conceived and designed the experiments. XRand HJ developed the RIL population. XR XZ YC YL FL and XJ conductedfield trials and data collections. ZL ZX XL WC and LH performed genotyping.HL and HJ constructed the genetic linkage map and performed QTL analysis.HL BL BG MKP RKV and HJ interpreted the results. HL prepared the first draftof the manuscript and HL BL BG MKP RKV and HJ contributed to the finalediting of manuscript. All authors contributed in the interpretation of resultsand approved the final manuscript.
Competing interestsThe authors declare that they have no competing interests.
Consent for publicationNot applicable.
Ethics approval and consent to participateNot applicable.
Author details1Key Laboratory of Biology and Genetic Improvement of Oil Crops, Ministryof Agriculture, Oil Crops Research Institute of the Chinese Academy ofAgricultural Sciences, Wuhan 430062, China. 2International Crops ResearchInstitute for the Semi-Arid Tropics (ICRISAT), Hyderabad 502324, India. 3CropProtection and Management Research Unit, USDA-ARS, Tifton, GA 31793,USA. 4Xiangyang Academy of Agricultural Sciences, Xiangyang 461057,China.
Received: 16 September 2016 Accepted: 22 December 2016
References1. Bertioli DJ, Cannon SB, Froenicke L, Huang G, Farmer AD, Cannon EK, et al.
The genome sequences of Arachis duranensis and Arachis ipaensis, thediploid ancestors of cultivated peanut. Nat Genet. 2016;4:438–46.
2. Gomes RLF, Lopes ÂCDA. Correlations and path analysis in peanut. CropBreed Appl Biotehnol. 2005;1:105–12.
3. Chen W, Jiao Y, Cheng L, Huang L, Liao B, Tang M, et al. Quantitative traitlocus analysis for pod- and kernel-related traits in the cultivated peanut(Arachis hypogaea L.). BMC Genet. 2016;1:25.
Luo et al. BMC Genomics (2017) 18:58 Page 10 of 12
4. Selvaraj MG, Narayana M, Schubert AM, Ayers JL, Baring MR, Burow MD.Identification of QTLs for pod and kernel traits in cultivated peanut bybulked segregant analysis. Electron J Biotechnol. 2009;2:10.
5. Janila P, Variath MT, Pandey MK, Desmae H, Motagi BN, Okori P, et al.Genomic tools in groundnut breeding program: status and perspectives.Front Plant Sci. 2016;7:289.
6. Gondo T, Sato S, Okumura K, Tabata S, Akashi R, Isobe S. Quantitative traitlocus analysis of multiple agronomic traits in the model legume Lotusjaponicus. Genome. 2007;7:627–37.
7. Zhang G, Zhou W. Genetic analyses of agronomic and seed quality traits ofsynthetic oilseed Brassica napus produced from interspecific hybridization ofB. campestris and B. oleracea. J Genet. 2006;1:45–51.
8. Shoha D, Manivannan N, Vindhiyavarman P, Nigam SN. Identification ofquantitative trait loci (Qtl) for Late leaf spot disease resistance in groundnut(Arachis Hypogaea L.). Legum Res. 2013;5:467–72.
9. Leal-Bertioli SC, Moretzsohn MC, Roberts PA, Ballen-Taborda C, Borba TC,Valdisser PA, et al. Genetic mapping of resistance to Meloidogyne arenaria inArachis stenosperma: a new source of nematode resistance for peanut. G3.2015;2:377–90.
10. Ravi K, Vadez V, Isobe S, Mir RR, Guo Y, Nigam SN, et al. Identification ofseveral small main-effect QTLs and a large number of epistatic QTLs fordrought tolerance related traits in groundnut (Arachis hypogaea L.). TheorAppl Genet. 2011;6:1119–32.
11. Gautami B, Pandey MK, Vadez V, Nigam SN, Ratnakumar P, Krishnamurthy L,et al. Quantitative trait locus analysis and construction of consensus geneticmap for drought tolerance traits based on three recombinant inbred linepopulations in cultivated groundnut (Arachis hypogaea L.). Mol Breed.2012;2:757–72.
12. Pandey MK, Wang ML, Qiao L, Feng S, Khera P, Wang H, et al. Identificationof QTLs associated with oil content and mapping FAD2 genes and theirrelative contribution to oil quality in peanut (Arachis hypogaea L.). BMCGenet. 2014;15:133.
13. Mondal S, Phadke RR, Badigannavar AM. Genetic variability for totalphenolics, flavonoids and antioxidant activity of testaless seeds of a peanutrecombinant inbred line population and identification of their controllingQTLs. Euphytica. 2015;2:311–21.
14. Faye I, Pandey MK, Hamidou F, Rathore A, Ndoye O, Vadez V, et al.Identification of quantitative trait loci for yield and yield related traits ingroundnut (Arachis hypogaea L.) under different water regimes in Niger andSenegal. Euphytica. 2015;3:631–47.
15. Huang L, He HY, Chen WG, Ren XP, Chen YN, Zhou XJ, et al. Quantitativetrait locus analysis of agronomic and quality-related traits in cultivatedpeanut (Arachis hypogaea L.). Theor Appl Genet. 2015;6:1103–15.
16. Sukruth M, Paratwagh SA, Sujay V, Kumari V, Gowda MVC, Nadaf HL,et al. Validation of markers linked to late leaf spot and rust resistance,and selection of superior genotypes among diverse recombinant inbredlines and backcross lines in peanut (Arachis hypogaea L.). Euphytica.2015;2:343–51.
17. Varshney RK, Pandey MK, Janila P, Nigam SN, Sudini H, Gowda MV, et al.Marker-assisted introgression of a QTL region to improve rust resistance inthree elite and popular varieties of peanut (Arachis hypogaea L.). Theor ApplGenet. 2014;8:1771–81.
18. Shirasawa K, Koilkonda P, Aoki K, Hirakawa H, Tabata S, Watanabe M, et al.In silico polymorphism analysis for the development of simple sequencerepeat and transposon markers and construction of linkage map incultivated peanut. BMC Plant Biol. 2012;12:80.
19. Fonceka D, Tossim HA, Rivallan R, Vignes H, Faye I, Ndoye O, et al. Fosteredand left behind alleles in peanut: interspecific QTL mapping revealsfootprints of domestication and useful natural variation for breeding.BMC Plant Biol. 2012;12:26.
20. Jiang H, Duan N, Ren X. Descriptors and data standard for peanut(Arachis spp.). Beijing: China Agriculture Press; 2006.
21. IBM Corp. Statistical Package for Social Sciences (IBM SPSS) 22.0 version.Armonk: IBM United States; 2013. Accessed.
22. Holl JB, Nyquist WE. Estimating and interpreting heritability for plantbreeding: an update. In: Janick J, editor. Plant breeding reviews, vol. 22.2010. p. 9–112.
23. Wang H, Penmetsa RV, Yuan M, Gong L, Zhao Y, Guo B, et al. Developmentand characterization of BAC-end sequence derived SSRs, and theirincorporation into a new higher density genetic map for cultivated peanut(Arachis hypogaea L.). BMC Plant Biol. 2012;1:1–11.
24. Macedo SE, Moretzsohn MC, Leal-Bertioli SC, Alves DM, Gouvea EG, AzevedoVC, et al. Development and characterization of highly polymorphic long TCrepeat microsatellite markers for genetic analysis of peanut. BMC Res Notes.2012;5:86.
25. Koilkonda P, Sato S, Tabata S, Shirasawa K, Hirakawa H, Sakai H, et al.Large-scale development of expressed sequence tag-derived simplesequence repeat markers and diversity analysis in Arachis spp. MolBreed. 2012;1:125–38.
26. Nagy ED, Chu Y, Guo Y, Khanal S, Tang S, Li Y, et al. Recombination issuppressed in an alien introgression in peanut harboring Rma, a dominantroot-knot nematode resistance gene. Mol Breed. 2010;2:357–70.
27. Moretzsohn MC, Barbosa AV, Alves-Freitas DM, Teixeira C, Leal-Bertioli SC,Guimaraes PM, et al. A linkage map for the B-genome of Arachis (Fabaceae)and its synteny to the A-genome. BMC Plant Biol. 2009;9:40.
28. Leal-Bertioli SC, Jose AC, Alves-Freitas DM, Moretzsohn MC, Guimaraes PM,Nielen S, et al. Identification of candidate genome regions controllingdisease resistance in Arachis. BMC Plant Biol. 2009;9:112.
29. Guo B, Chen X, Hong Y, Liang X, Dang P, Brenneman T, et al. Analysis ofgene expression profiles in leaf tissues of cultivated peanuts anddevelopment of EST-SSR markers and gene discovery. Int J Plant Genomics.2009;2009:14.
30. Naito Y, Suzuki S, Iwata Y, Kuboyama T. Genetic diversity and relationshipanalysis of peanut germplasm using SSR markers. Breed Sci. 2008;3:293–300.
31. Cuc LM, Mace ES, Crouch JH, Quang VD, Long TD, Varshney RK. Isolationand characterization of novel microsatellite markers and their application fordiversity assessment in cultivated groundnut (Arachis hypogaea). BMC PlantBiol. 2008;1:1–11.
32. Gimenes MA, Hoshino AA, Barbosa AV, Palmieri DA, Lopes CR.Characterization and transferability of microsatellite markers of thecultivated peanut (Arachis hypogaea). BMC Plant Biol. 2007;7:9.
33. Moretzsohn MC, Leoi L, Proite K, Guimaraes PM, Leal-Bertioli SC, GimenesMA, et al. A microsatellite-based, gene-rich linkage map for the AA genomeof Arachis (Fabaceae). Theor Appl Genet. 2005;6:1060–71.
34. Ferguson ME, Burow MD, Schulze SR, Bramel PJ, Paterson AH, Kresovich S,et al. Microsatellite identification and characterization in peanut ( A.hypogaea L.). Theor Appl Genet. 2004;6:1064–70.
35. He G, Meng R, Newman M, Gao G, Pittman RN, Prakash C. Microsatellites as DNAmarkers in cultivated peanut (Arachis hypogaea L.). BMC Plant Biol. 2003;1:1–6.
36. Hopkins MS, Casa AM, Wang T, Mitchell SE, Dean RE, Kochert GD, et al.Discovery and characterization of polymorphic Simple Sequence Repeats(SSRs) in peanut. Crop Sci. 1999;4:1243–7.
37. Huang L, Wu B, Zhao J, Li H, Chen W, Zheng Y, et al. Characterization andtransferable utility of microsatellite markers in the wild and cultivatedArachis species. PLoS One. 2016;5:15.
38. Zhou X, Dong Y, Zhao J, Huang L, Ren X, Chen Y, et al. Genomic surveysequencing for development and validation of single-locus SSR markers inpeanut (Arachis hypogaea L.). BMC Genomics. 2016;1:420.
39. Doyle J. Isolation of plant DNA from fresh tissue. Focus. 1990;12:13–5.40. Fountain JC, Qin H, Chen C, Dang P, Wang ML, Guo B. A note on
development of a low-cost and high-throughput SSR-based genotypingmethod in peanut (Arachis hypogaea L.). Peanut Science. 2011;2:122–7.
41. JoinMap 4. Software for the calculation of genetic linkage maps inexperimental populations. Wageningen: Kyazma B.V; 2006. Accessed.
42. Kosambi DD. The estimation of map distances from recombination values.Ann Hum Genet. 2011;1:172–5.
43. Shirasawa K, Bertioli DJ, Varshney RK, Moretzsohn MC, Leal-Bertioli SC, ThudiM, et al. Integrated consensus map of cultivated peanut and wild relativesreveals structures of the A and B genomes of Arachis and divergence of thelegume genomes. DNA Res. 2013;2:173–84.
44. Zhou XJ, Xia YL, Ren XP, Chen YL, Huang L, Huang SM, et al. Constructionof a SNP-based genetic linkage map in cultivated peanut based on largescale marker development using next-generation double-digest restriction-site-associated DNA sequencing (ddRADseq). BMC Genomics. 2014;15:14.
45. Voorrips RE. MapChart: software for the graphical presentation of linkagemaps and QTLs. J Hered. 2002;1:77–8.
46. Zeng ZB. Precision mapping of quantitative trait loci. Genetics. 1994;4:1457–68.47. Windows QTL Cartographer 2.5. Department of Statistics, North Carolina
State University, Raleigh, NC. 2012. http://statgen.ncsu.edu/qtlcart/WQTLCart.htm. Accessed 1 Dec 2015.
48. Udall JA, Quijada PA, Lambert B, Osborn TC. Quantitative trait analysis ofseed yield and other complex traits in hybrid spring rapeseed (Brassica
Luo et al. BMC Genomics (2017) 18:58 Page 11 of 12
napus L.): 2. Identification of alleles from unadapted germplasm. Theor ApplGenet. 2006;4:597–609.
49. Wu Y, Bhat PR, Close TJ, Lonardi S. Efficient and accurate construction ofgenetic linkage maps from the minimum spanning tree of a graph. PLoSGenet. 2008;10:11.
50. Preedy KF, Hackett CA. A rapid marker ordering approach for high-densitygenetic linkage maps in experimental autotetraploid populations usingmultidimensional scaling. Theor Appl Genet. 2016;11:2117–32.
51. Qin H, Feng S, Chen C, Guo Y, Knapp S, Culbreath A, et al. An integratedgenetic linkage map of cultivated peanut (Arachis hypogaea L.) constructedfrom two RIL populations. Theor Appl Genet. 2012;4:653–64.
• We accept pre-submission inquiries
• Our selector tool helps you to find the most relevant journal
• We provide round the clock customer support
• Convenient online submission
• Thorough peer review
• Inclusion in PubMed and all major indexing services
• Maximum visibility for your research
Submit your manuscript atwww.biomedcentral.com/submit
Submit your next manuscript to BioMed Central and we will help you at every step:
Luo et al. BMC Genomics (2017) 18:58 Page 12 of 12


![arXiv:1904.04290v1 [cs.CV] 8 Apr 2019hhoppe.com/neuralrendering.pdfMoustafa Meshry 1, Dan B Goldman2, Sameh Khamis2, Hugues Hoppe2, Rohit Pandey2, Noah Snavely2, Ricardo Martin-Brualla2](https://static.fdocuments.us/doc/165x107/60cbf97b22811f14986d28ab/arxiv190404290v1-cscv-8-apr-moustafa-meshry-1-dan-b-goldman2-sameh-khamis2.jpg)