CO EMISSIONS FROM CARS: the facts
53
CO 2 EMISSIONS FROM CARS: the facts A report by
Transcript of CO EMISSIONS FROM CARS: the facts

CO2 EMISSIONS FROM CARS:
the facts
A report by

Transport & Environment Published: April 2018
© 2018 European Federation for Transport and Environment AISBL
Editeur responsable: William Todts, Executive Director
Further information Florent Grelier Clean Vehicles Engineer
Transport & Environment
Office: +32 2 851 02 14 Mobile: +32 488 92 84 11
Square de Meeûs, 18 – 2nd floor | B-1050 | Brussels | Belgium
www.transportenvironment.org | @transenv | fb: Transport & Environment
Acknowledgements Transport & Environment (T&E) acknowledges the work of François Cuenot in providing the data and the
analysis regarding the life cycle analysis of fleet renewals in section 5.4 of this report. The other parts of this report are the result of an in-house analysis done by T&E, with collective effort from the staff, including:
Greg Archer, Thomas Earl, Eoin Bannon, Julia Poliscanova, Nico Muzi and Sofia Alexandridou.

2
a report by
Executive summary
1. Transport is Europe’s biggest source of CO2, responsible for the emission of over a quarter of all greenhouse gases. Transport emissions have increased by a quarter since 1990 and are
continuing to rise with 2017 oil consumption in the EU increasing at its fastest pace since
2001.1 Unless transport emissions are brought under control national 2030 climate goals will be missed. To meet the 2050 Paris climate commitments cars and vans must be entirely decarbonised. This requires ending sales of cars with an internal combustion engine by 2035. Such a transformation requires wholesale changes, not only to vehicles but also how they are
owned, taxed and driven.
2. To date measures to tackle emissions from cars and vans have largely been a failure. If the lifecycle emissions of biofuels were properly accounted for (instead of being considered fully
renewable), greenhouse gas emissions from cars and vans would be on average 10% higher than official statistics. New car CO2 regulations have delivered only about a 10% reduction in
on-road emissions in the 20 years since the first Voluntary Agreement was established in 1998; and there has been effectively no improvement in the last five years. In spite of this, all
carmakers achieved their 2015 new car CO2 targets and most are on track to achieve 2020/1 goals. This has been achieved in very large part by exploiting the flexibilities in the testing
procedure which has meant the gap between test results and real-world performance has grown from 9% to 42%, equivalent to 31gCO2/km of fake savings.
3. Despite test cheating, about half of carmakers still need to accelerate the progress made to
date in order to achieve their 2021 target – and the acceleration is needed because of their decision to not deploy sufficient fuel efficiency technologies on vehicles. Recent figures suggest that the fleet average CO2 emissions from new cars is set to rise when the European
Environment Agency shortly
publishes its data
for 2017. There are
several factors
contributing to the rise but steep increases in the
size and weight of
cars is a leading reason. SUV sales
have rocketed from 4% in 2001 to
26% in 2016, and the average SUV
has emissions of 132gCO2/km
compared to
118gCO2/km for a medium segment car. The increase in the average
weight of new cars
by 124kg from
1 International Energy Agency (IEA), Global Energy and CO2 status report 2017, March 2018
Minimum level Moderate level Maximum level
Volvo 2017 2017 2017 2017
Mitsubishi 2018 2018 2017 2017
Toyota-Lexus 2019 2018 2017 2017
Daimler 2020 2019 2019 2017
Jaguar-Land Rover* 2020 2019 2019 2018
Peugeot 2020 2019 2018 2017
Citroën-DS 2020 2019 2018 2017
Nissan-Infiniti 2020 2019 2018 2017
Renault Group 2021 2020 2019 2017
Volkswagen Group 2022 2021 2020 2018
BMW Group 2023 2022 2021 2018
Ford 2023 2022 2021 2018
Suzuki* 2025 2024 2022 2020
Mazda* 2026 2024 2023 2021
Opel-Vauxhall 2027 2026 2024 2021
Kia 2028 2026 2025 2022
Subaru* 2028 2026 2025 2022
Honda 2029 2028 2026 2023
Fiat-Chrysler 2030 2028 2026 2022
Hyundai 2033 2030 2028 2024
Without using
flexibilities
With using flexibilities
*Manufacturers with a niche derogation target
Dates before 2020 are illustrative - super-credits cannot be earned and used before 2020
Note: Minimum level = 3.5g/km - Moderate level = 7g/km - Maximum level = 14.5g/km

3
a report by
2000 to 2016 has helped to bring about a rise in average emissions of around 10g/km. The power of new cars has also increased sharply by 28%, increasing fuel consumption and
emissions. Such changes in the cars being sold have helped improve industry profitability but
should have necessitated carmakers shifting – at the same time – to much more efficient technologies such as hybrids. Most have declined to do so.
4. Dieselisation, the carmakers’ principal strategy to reduce CO2 emissions, has resulted in the
share of diesel cars growing from 36% in 2001 to a peak of 55% in 2011. Following the
Dieselgate scandal, sales have slumped and the EU market share is expected to slip to around 45% in 2017, and is continuing to fall. The decline in diesel sales makes a small impact in CO2 emissions, although the effect is more than compensated for by the rise in alternative fuelled
vehicles with much lower carbon intensity. On a life-cycle basis, diesel cars are higher
emitting than equivalent gasoline cars. This is because diesels have higher embedded emissions, diesels use high-carbon biodiesel, refining the diesel fuel requires more energy and diesels are driven a little more as fuel is cheaper. Electric cars are significantly lower
carbon throughout the EU, even taking into account the higher emissions in manufacturing
and the emissions from electricity generation.
5. A raft of model upgrades from 2019, as well as the use of flexibilities in the current car CO2 flexibilities (super-credits, eco-innovations and pooling), will enable almost all carmakers to
achieve their 2021 goals, despite claims to the contrary. However, as a result of the limited
deployment of fuel efficient technologies on engined cars, many carmakers will need to increase sales of sub-50g CO2/km vehicles (battery electric and plug-in hybrid vehicles) in
order to achieve their targets. This is likely to increase the share of sales of new electric and
plug-in hybrid vehicles in Europe significantly by 2021 to 5-7%. Just three carmaker groups –
Fiat-Chrysler, Honda and Hyundai-Kia – are at significant risk of incurring fines annually from 2020.
6. Another common misunderstanding is that a fast fleet turnover is essential to lower CO2
emissions. There is a trade-off between measures to improve the efficiency of new cars and keeping cars cheap to encourage their early replacement. However, on a lifecycle basis, rapid fleet renewal actually increases emissions due to the additional releases during manufacture
and recycling/disposal. A vehicle lifetime of 15-20 years is optimal to minimise lifecycle emissions – the typical lifetime of cars today. Lifetimes shorter than 15 years are only lower
carbon if there is a very rapid improvement in in-use emissions.
7. There are three underlying reasons for the failure to tackle car and van CO2 emissions:
a. Governments are, almost universally, unwilling to constrain demand for mobility and, in particular, car use and ownership.
b. The car industry circumvents emissions regulations by all possible means – and has
successfully done so for decades. Despite the Dieselgate scandal and the exposure of CO2
testing manipulation, new evidence is emerging of ways to manipulate the results of the new
Worldwide harmonised Light vehicles Test Procedure (WLTP) Emerging evidence suggest carmakers are inflating WLTP values whilst keeping New European Driving Cycle (NEDC) values low. This would help them maximise test flexibilities for the NEDC-based 2021 CO2 target whilst simultaneously inflating the WLTP 2021 starting point for the 2025 and 2030 regulation. In addition, the industry consistently fits technology to cars that will deflate
emissions far more in the lab than on the road, such as short range plug-in hybrids, stop-start
and cylinder deactivation.

4
a report by
c. The unhealthy political influence the industry exerts over some member states with
important car industries (Germany, Italy, Spain, Slovakia, Hungary and Romania) and also,
on occasion, the European Commission, leads to regulations that are not fit for purpose, such
as the new car CO2 regulation for post-2020.
8. There are no silver bullets, but past policy failures can be reversed to not only slash emissions but also create jobs, improve energy security and reduce the costs of mobility.
9. The first key development must be to accelerate the shift to electro-mobility. To meet the goals of the Paris agreement, transport emissions must be reduced by more than 90% by 2050. Such a radical change cannot be achieved through incremental improvements to
existing vehicles, a shift to fossil gas or through advanced biofuels and synthetic fuels that
cannot be produced in the volumes needed to power all mobility. To claim so is a smokescreen designed to perpetuate engined cars. Future cars will be electric, chargeable in minutes with ranges of 500km and powered from smart renewable grids. At present the car
industry is failing to provide adequate choice, constraining supply, not actively marketing or
incentivising showrooms to sell electric cars – therefore regulation is essential to kick start the market.
10. The second key policy required is an ambitious new car CO2 target for 2025. The weak
Commission proposal, following successful industry lobbying, failed in three key respects:
11. The 30% reduction from 2021 to 2030 is far below the 60% trajectory needed to achieve the
Paris goals. A 20% target for 2025 is needed, along with a target of 0gCO2/km for 2035. A target
between 50 and 60% should be finally agreed in a 2022 review.
12. The regulation fails to require the supply of zero emission vehicles – instead this has only incentivised the weakening of an already insufficient target. The solution is a target of 20%
zero emission vehicles (ZEVs) by 2025, which would reward carmakers surpassing this
benchmark and penalising those failing to meet the goal by requiring a bigger reduction in overall CO2.
13. There is no mechanism to ensure emissions reductions are delivered on the road – not just in the laboratory. This can be fixed through defining the gap between test and real-world
performance in 2021 using real world data obtained from a fuel economy meter, or a real world test. This gap should then be fixed and not allowed to grow.
14. The third key area of policy development is road pricing and the reform of vehicle taxation. If
adopted, the recently proposed Eurovignette Directive would help to drive the uptake of cleaner vehicles and promote more efficient transport behaviour (e.g. carpooling, modal
shift, etc.).
15. Member states could also help shift the market in favour of lower carbon vehicles and
discourage unnecessary car ownership and use through taxation policies which have been
very effective in some countries, such as the Netherlands, but are being largely under-utilised. Company car tax schemes also need urgent reform in order to discourage car ownership.
16. Sharing of vehicles, coupled with congestion charging, road pricing, parking constraints and
reducing road space for private vehicles represents a huge opportunity to tackle urban congestion and pollution, as illustrated by recent modelling from the International Transport Forum (ITF) which suggests that more than 90% of cars could be removed from the road in
Lisbon and Helsinki through ride sharing.

5
a report by
17. Preventing dangerous climate change cannot be achieved only through incremental change
– in less than 20 years from now, Europe needs to have sold its last new car with an engine.
The last two decades have ineffectively focused on encouraging efficiency improvements
which have utterly failed to keep pace with the growth in motorisation. There are no silver bullets, but to tackle CO2 emissions, low and zero carbon vehicle technology must be integrated with initiatives to connect and share vehicles in order to improve the efficiency of the road network. Pricing roads must be combined with better public transport and
infrastructure for walking and cycling. We need every tool to tackle CO2 emissions from cars
and vans, and we must now prioritise the transformative changes which can deliver the
requisite huge cuts in emissions.

6
a report by
Contents
1. Introduction 8
2. CO2 emissions from vehicles 11
2.1. Transport emissions in the EU 11
2.2. The role of biofuels 13
2.3. Comparison of European countries 14
2.4. Transport forecasts and modelling the associated emissions 16
3. Progress towards 2020/1 car CO2 targets 18
3.1. Progress in the laboratory 18
3.2. Progress on the road 19
3.3. WLTP test is an improvement but not a panacea 20
3.4. Progress towards 2020/1 targets 21
3.4.1. Flexibilities in the regulation 22 3.4.2. Projections of compliance with the 2020/1 targets 23
3.4.3. Potential fines 25 3.4.4. Compliance in 2020 26
3.4.5. Can carmakers earn sufficient flexibilities to avoid fines? 27 3.5. Assessing uncertainty 28
4. Bigger, heavier and higher performance – the trends offsetting efficiency improvements 31
4.1. Bigger and heavier 31
4.2. Increased power – increased profits – increased emissions 33
4.3. Bigger fleets means more congestion and bigger risks for vulnerable road users 34
5. The effects of dieselisation and fleet renewal rates 36
5.1. Impact of the diesel decline 36
5.2. National and company diesel share 37
5.3. Lifecycle diesel emissions 38
5.4. Why selling more cars is not the way to lower CO2 emissions 38
6. Why are we failing to tackle car CO2 emissions? 42
6.1. The uncontrolled demand for mobility and car ownership 42
6.2. Cheating and manipulating test results 42
6.3. Political influence in member states and the European Commission 44
7. Conclusions and policy recommendations 47

7
a report by
7.1. Electrification of transport 47
7.2. Ambitious new car CO2 targets 48
7.2.1. CO2 targets post-2020 48 7.2.2. Driving supply of zero emission solutions 49
7.2.3. Delivering emissions reductions on the road 49 7.3. Road pricing and reform of vehicle taxation 51
7.4. Final thoughts 52

8
a report by
1. Introduction Transport is Europe’s biggest source of carbon emissions, contributing 27% to the EU’s total CO2 emissions, with cars and vans representing more than two thirds of these, according to the European Environment
Agency (EEA).2 Transport is the only sector in which emissions have grown since 1990,3 contributing to the increase in the EU’s overall emissions in 2015.4 Transport related emissions further increased in 2016 and in
2017 EU oil consumption – a good proxy for transport CO2 – increased at its fastest pace since 2001.5
If we are to achieve the Paris climate goals, it is likely that transport emissions must be reduced by 94% from 2005 levels,6 much more than the 60% suggested by the European Commission in its outdated and discredited 2011 Transport White Paper.7 Given the challenges of fully decarbonising aviation and shipping
by 2050, light duty vehicles, i.e. cars and vans, will need to be entirely decarbonised by 2050. Such a
reduction cannot be achieved through incremental improvements to existing vehicles. There is a limit to
the efficiency improvements possible with internal combustion engines and low carbon drop-in replacement fuels for oil (either advanced biofuels or synthetic fuels) cannot, realistically, be produced in the volumes needed to power all mobility.8,9 Instead, a transformation is needed in the way that personal
mobility is delivered, including a shift to electro-mobility.
2 European Environment Agency (EEA), EEA greenhouse gas – data viewer, 06/06/2017 3 EEA, EU greenhouse gas emissions at lowest level since 1990, 06/12/2016 4 EEA, EU greenhouse gas emissions from transport increase for the second year in a row, 01/06/2017 5 IEA, Global Energy and CO2 status report 2017, Oil section, March 2018 6 Transport & Environment (T&E), Europe needs to slash its transport emissions by 94% by 2050 - Effort Sharing Regulation,
21/12/2016 7 European Commission, DG MOVE, White paper, Roadmap to a single European transport area, 2011 8 T&E, A target for advanced biofuels, 06/06/2017 9 T&E, The role of electrofuel technologies in Europe's low-carbon transport future, 21/11/2017
Figure 2 – Indexed evolutions of EU GHG emissions per sector compared with the 95% reduction target trajectory
Figure 1 – EU greenhouse gas (GHG) emissions per sector in 2016

9
a report by
Figure 3 – T&E’s vision of future personal mobility in 2040
This report examines the progress Europe is making towards decarbonising personality mobility –
particularly cars. It presents indicators from a wide range of sources which show that progress has stalled
and many of the underlying trends are contrary to what is needed.
Chapter 2 presents the historical trends in CO2 emissions from vehicles (cars, vans and trucks). The chapter
investigates the biggest users of road fuel in Europe, and analyses biofuel consumption on a well-to-wheel basis. Finally, a critique of projections derived from the European Commission’s regulatory baseline is
undertaken, with discussion of the implications for the level of policy ambition.
Chapter 3 presents the most recent figures on new car CO2 regulation and examines the progress towards the 2020/1 targets. The chapter specifically looks at the extent to which carmakers will need to make use of
flexibilities in the regulation in order to meet the 2020/1 targets and the level of fines which companies are likely to face. It contrasts emission reductions measured in distorted laboratory tests with those measured
in the real-world, drawing parallels with the Dieselgate scandal. Chapter 4 explores the underlying reasons for the lack of improvement in new cars CO2 emissions –
specifically how the drive to increase profits has driven the industry to produce bigger, heavier and ever more powerful vehicles along with a reluctance to provide or market either zero or ultra-low emission vehicles.
Chapter 5 considers if a faster fleet renewal offers genuine CO2 benefits and how the impact of declining diesel sales is being offset by a greater share of alternative fuelled, including electric, vehicles. It also
presents a lifecycle analysis of the effect of more diesel.

10
a report by
Chapter 6 reviews why we are failing to tackle the CO2 emissions from cars and vans, and Chapter 7
presents conclusions and policy recommendations. Twenty years ago (1998) the car industry agreed a voluntary commitment to reduce new car emissions
by 25% by 2008.10 Then, CO2 emissions on the road from new cars were around 203g/km.11 Today, they are still around 170g/km and unlikely to reach 140g/km until after 2020. ON THE ROAD, THE CAR INDUSTRY HAS REDUCED EMISSIONS BY JUST 1% PER ANNUM – 17% IN 20 YEARS – A DISMAL
PERFORMANCE! With increasing rates of motorisation, especially in central and eastern Europe, GHG emissions from cars remain out of control.
Since the Dieselgate scandal broke in September 2015, the automotive industry has been under increased
media and regulatory scrutiny for its contribution to the urban air pollution crisis in our cities. From the
initial focus on the defeat devices fitted to Volkswagen vehicles sold in the US, the scandal spread globally to almost every company, and every market, selling diesel cars. In response, the EU has strengthened
regulations, including introducing a new real-world emissions test – a strengthened system for approving cars. For two years the focus has understandably been on how to tackle the noxious emissions from
exhausts. The imminent CO2 regulatory target of a fleet average of 95g/km for 2020/1 now looms on the horizon together with potentially crippling fines for companies that chose not to ensure they met the goals.
Together with the European Commission proposal for 2025 and 2030 standards, there is a renewed focus
and debate on CO2 emissions from cars that this timely report responds to.
10 From 1995 levels – Official Journal of the European Union, Regulation n°443/2009 11 Based upon NEDC emissions of 186g/km in 1996 and a 9% gap between test and real-world emissions using ICCT data.

11
a report by
2. CO2 emissions from vehicles This chapter analyses historical emission trends from road transport in the EU with a particular focus on cars and vans. It shows emissions are rising again as demand for mobility outstrips the minimal
improvement in efficiency. The chapter also analyses the impact of biofuel consumption and shows that biofuel policies have not led to a decrease in emissions on a well-to-wheel basis. Finally, a critique of
projections of transport emissions is undertaken, and the implications of these projections for policy discussed.
2.1. Transport emissions in the EU TRANSPORT IS THE BIGGEST CONTRIBUTOR TO EU GHG EMISSIONS, GENERATING 27% OF EMISSIONS. CARS AND
VANS CONTRIBUTE AROUND HALF OF THESE.
The latest data from the EEA12 shows that in 2016 transport sector GHG emissions (including international
maritime and aviation emissions, ‘bunkers’) in the EU was 1,205Mt CO2 equivalent – the largest sector at 27% of total EU emissions, as shown by Figure 1 in the introduction. Passenger cars alone account for 41%
of these transport emissions, or 11% of the total (including bunkers). Transport is currently highly dependent on oil, of which 93% is imported, with Russia the main source.13 GHG emissions are produced by the combustion of these fossil derived, petroleum-based products, which include petrol, diesel fuel,
kerosene and fuel oils. Of the total final consumption of petroleum products in the EU, the transport sector
consumed 66%, or 345Mtoe.14 Demand for oil is continuing to increase – the most recent IEA figures show OECD Europe’s oil demand increased by 2% in 2017,15 and it is anticipated to rise by a further 1% in 2018,
with transport the dominant cause. Surface transport emissions in the EU have risen by 18% since 1990, as shown by the indexed emissions in
Figure 5. Despite a downward trend from the peak emissions of 938.4Mt in 2007, as shown in Figure 2, emissions from 2013 have been on the rise. The latest emissions data for 2016 released by the EEA point to
a continuation of this trend.16
For cars, the growth in emissions can be attributable to a growth in passenger activity, measured in
passenger kilometres. In contrast, trains have reduced their emissions by more than 50% despite seeing an increase of 6% in passenger kilometres. Vans have seen the largest growth in emissions, with an increase of more than 45% since 1990. Vans tend to be under-regulated compared to trucks,17 and this has led to vans increasingly replacing small trucks. 18 , 19 Vans have also had favourable tax reductions compared to
passenger cars. SINCE 1990 EMISSIONS FROM CARS AND VANS HAVE RISEN. AFTER A DIP DURING THE ECONOMIC CRISIS THEY ARE
RISING AGAIN AND ARE PROJECTED TO RISE INTO 2018.
12 EEA, Approximated EU greenhouse gas inventory 2016, 07/11/2017 13 T&E, Europe increasingly dependent on risky oil imports, 11/07/2016 14 Eurostat, Sankey diagram dataset - annual data, Latest update: February 2018 – Note: Compares net imports and production,
Mtoe means million tons of oil equivalent. 15 IEA, Global Energy and CO2 status report 2017, CO2 emissions section, March 2018 16 EEA, Approximated EU greenhouse gas inventory 2016, 07/11/2017 17 T&E, CO2 emissions from vans: time to put them back on track, 15/02/2018 18 Kraftfahrt-Bundesarnt (KBA), Statistik, Neuzulassungen von Lkw in den Jahren 2007 bis 2016 nach zulässiger Gesamtmasse 19 Shell Deutschland, Shell Lkw-Studie, Fakten, Trends und Perspektiven im Straßengüterverkehr bis 2030, 04/2010

12
a report by
Figure 6 shows the share of N1 van sales by class, where class I are vans less than 1305kg, class II are those between 1305kg and 1760kg, and class III
heavier than 1760kg. Further analysis of these data
shows that vans with a technical permissible maximum laden mass (TPMLM) over 3.4t account for 22.3% of sales. While empty mass has largely
remained constant over the five years where data
is available, the sales weighted average TPMLM has
increased by 50kg. Increasing sales and increasing TPMLM help to explain increasing van emissions.
VAN EMISSIONS ARE OUT OF CONTROL, HAVING RISEN
NEARLY 50% SINCE 1990.
Figure 4 – Evolution of transport emissions by mode Figure 5 – Indexed growth of road transport modes
Figure 6 – Sales distribution of N1 vans per class

13
a report by
2.2. The role of biofuels Biofuels were once touted as the green solution to decarbonising fuel. The idea was that the CO2 emitted
from combusting the fuel had been absorbed by growing the crop, closing the carbon cycle. There are obvious shortcomings to this assumption: crop based biofuels generate agriculture emissions (from fertiliser use, nitrification and denitrification of soils, harvesting, etc.); energy crops take up fertile land
which could have otherwise been used to produced food – therefore demand for fertile land increases, often
resulting in deforestation and the drainage of peat lands (both of which release large stores of soil carbon); there are emissions associated with the refining and transport of the feedstocks and final fuels, and; it relies on the assumption that same energy crops will be grown again the following year.
Burning biofuels is zero-counted when member states calculate their GHG inventories under the United Nations Framework Convention on Climate Change (UNFCCC) framework. In this section, we consider the GHG implications under two scenarios, one where the direct emissions associated with the upstream
farming, processing and distribution of the fuel is considered, and a second scenario where direct and
indirect land-use change is accounted for. In 2015, biofuel consumption was 14Mtoe, of which 11.3Mtoe (81%) was biodiesel, whereas fossil fuel
consumption was 277.7Mtoe in road transport. Therefore, 4.8% of energy consumed in road transport was
from biofuels. A previous T&E analysis, based on the Globiom and Mirage studies, found the EU averages for direct and indirect emissions of biofuels.20 Combined with the total consumption of biofuels, Table 1 below shows the emissions factors and resulting emissions from the use of biofuels.
Considering only the direct
emissions attributed to fuel production, the CO2 emissions
from transport would have been 27.6Mt CO2 equivalent more,
representing an increase of 3.2%. Taking account of CO2
emitted from direct and indirect land use change, the CO2
amounts would be higher by
88Mt CO2 equivalent, or an increase of 10.2% than the
levels reported in the national inventories.
IF THE FULL EFFECTS OF GROWING AND PRODUCING BIOFUELS FOR ROAD TRANSPORT ARE TAKEN INTO ACCOUNT,
EMISSIONS WOULD BE 10% HIGHER STILL. Figure 8 shows that if the real GHG emissions of biofuels are taken into account, current emissions are close
to the 2007 peak. In this figure, road transport emissions are grouped together and represent the emissions resulting only from combusting the fuel in the engine (i.e. the tank to wheel, or TTW, emissions) – these are the road transport emissions shown in Figure 5. Then above are the emissions attributed to the production and refining of these fuels (i.e. the well-to-tank, or WTT, emissions). Finally, the indirect and direct WTT
emissions from biofuels are added again. The uptake of biofuels began to increase from very low mixes of
less than 1% v/v% at the turn of the century.
20 T&E, Biodiesel increasing EU transport emissions by 4% instead of cutting CO2, 04/05/2016
Table 1 – Direct and indirect emissions factors and emissions of biofuels in the EU

14
a report by
The consumption of biofuel is not uniformly spread across the EU. Figure 7 shows that the consumption weighted average of biofuel consumption, by volume, is about 5%. The countries are ordered in terms of total consumption of biofuel. Sweden and Finland have the block’s largest share of biofuel, as a result of
strong policy regimes to increase the uptake of biofuel, and larger than average inputs and biomass availability from the large and established domestic forestry industries in those countries.
2.3. Comparison of European countries Emissions from cars are proportional to the wealth of the country. Figure 9 plots emissions per capita from
road transport compared to GDP per capita for countries in the EU-26 (excluding Cyprus and Malta). The trend is clear: CO2 emissions per capita are correlated with the GDP per capita of the country. It can also be
seen that car emissions per capita are typically below 1 MtCO2eq for the Central and Eastern Europe countries (Estonia, Latvia, Lithuania, Czech Republic, Slovakia, Poland, Hungary, Slovenia, Romania and
Bulgaria) and 1-2 Mt for the wealthier nations, although there are wide variations. Luxembourg is the outlier in terms of both emissions and wealth at 4MtCO2eq per capita. This is likely the
result of the leakage of the allocation of emissions from trucks from fuel sales (as Luxembourg encourages fuel tourism through its very low fuel taxes); some fuel tourism from border towns from passenger cars; the highest motorisation rates in the EU, and; because the Luxembourgish buy heavier vehicles than the EU average.
Figure 8 – Well-to-wheel emissions in road transport Figure 7 – Biodiesel and bioethanol mix per country
in the EU

15
a report by
T&E’s diesel report21 highlights that emissions per vehicle increase in line with a vehicle’s mass, and
in chapter 3 we also see that wealthier citizens tend to buy heavier, more powerful, more fuel guzzling vehicles than their less wealthy
counterparts. These factors translate into a larger CO2 footprint. Finally, Figure 10 shows each country listed with
their average emissions per vehicle, and again showing Luxembourg to be an outlier. It has emissions five times those of the country with the lowest emissions per vehicle: Poland.
Looking at the geographical spread paints the
picture of a two-speed Europe: the eastern and
Mediterranean member states tend to emit less per vehicle compared to the northern and central
Europeans. Interestingly, this does not necessarily correspond with motorisation rates (Figure 11),
where countries such as Italy and Poland have high motorisation rates but low emissions per
vehicle, and Denmark and Ireland have
21 T&E, Diesel: the true (dirty) story, 18/09/2017
Figure 10 – Average annual emissions from cars in
2015
Figure 9 – EU member state wealth per capita and emissions from cars
Figure 11 – Motorisation rates in EU countries in 2015 in
cars/capita

16
a report by
comparatively low motorisation rates but high emissions per vehicle.
2.4. Transport forecasts and modelling the associated emissions The data presented in the previous section is based upon official statistics but T&E has also developed tools
to model future EU transport emissions for a range of policy scenarios. The T&E model is called the European transportation roadmap model (EUTRM), and is based on ICCT’s global transportation roadmap
model (GTRM). It models GHG emissions from the year 2000 to 2050 and makes use of the most recent available European-specific data (such as member state electricity grid mix and transfers of second hand vehicles). Transport and freight demand are based on purchasing power parity (PPP) adjusted GDP, which
is determined by historical and projected GDP, population and fuel price for each country. These inputs are
identical to those used by the European Commission’s model PRIMES-TREMOVE that produces the results for the Reference Scenarios. As a result, the projected transport demand from the EUTRM closely matches that of the European Commission.
T&E has modelled the impact of future emissions from cars and vans in the absence of policy beyond the
current 2020/1 CO2 standards for cars and vans. In the absence of further policy there is no incentive or obligation for OEMs to invest money to develop more efficient vehicles. T&E has found that the EUTRM baseline assumptions and those of the Commission presented in the Impact Assessment for the post 2020 car and van CO2 emissions widely deviate, as shown in Figure 12 above. The left figure shows EU transport
emissions (without maritime). The EUTRM shows an increase in emissions (which matches the observed
trends from 2013 onwards above), despite the 2020/1 car and van CO2 standards, which take the lion’s share of these emissions. Analysis of the Reference Scenario reveals that the Commission’s modelling assumes that cars continue to improve in efficiency beyond 2021 and likewise for heavy duty trucks despite a lack of
policy drivers. Similarly, there is a large ingress of hybrid vehicles. The effect of this can be seen in the car fleet efficiency, which by 2050 differs by around 40%. The apparently spontaneous uptake of cleaner vehicles such as BEVs without a policy (such as a ZEV mandate) runs counter to the market reality – where
Figure 12 – EUTRM and European Commission baseline scenario outputs

17
a report by
there has been slow and, over the last five years, no progress – and leads to the erroneous conclusion that future emissions are much lower. Therefore, there is no need to improve the efficiency of the new vehicle
fleet very significantly to help achieve 2030 climate goals. This flawed analysis underpins the Commission proposal for new car CO2 standards.

18
a report by
3. Progress towards 2020/1 car CO2 targets Chapter 2 examined real-world CO2 emissions for vehicles derived from inventories based upon fuel sales. Fuel use is currently the best way to estimate emissions, although proposals for mandatory fuel economy
meters will, in the future, make it possible to monitor emissions and potentially regulate new car emissions based upon individual fuel use in new, recently sold vehicles.
CO2 regulations for new cars and vans are based upon a test cycle, until recently the NEDC test. For some
new cars, this test has now been replaced by a better version, WLTP, although this is still conducted in a laboratory and under-estimates the real world emissions by about 20%.22 For the purpose of this chapter,
new car emissions based upon the NEDC test are used – although it is highly unrepresentative of real-world emissions that are typically 42% higher on average.
3.1. Progress in the laboratory Since 2000, the EEA has collated data regarding the
official CO2 performance of new cars sold in the EU using the NEDC test
procedure. Figure 13 shows
the most recent data drawing from the EEA that
records significant progress regarding the reduction of the average
CO2 emissions of brand new cars in the laboratory
by 31%, from
172.2gCO2/km in 2000 to
118.1gCO2/km in 2016.23
Following the adoption of the Kyoto Protocol in 1997, the EU was minded to
adopt regulations on new car CO2 emissions but
instead was persuaded by the car industry to accept a voluntary commitment to reduce CO2 emissions for new cars to 140g/km in 2008.24 However, the failure to make acceptable progress resulted in the European
Commission eventually making a regulatory proposal that came into force in 2009, 25 with first an
intermediate target of 130g/km in 2015 and later a final target of 95g/km for 2020. The target was
subsequently relaxed to 95% of vehicles needing to comply in 2020 and 100% of sales by 2021. From 2000
to 2008, CO2 emissions dropped by 11%, with a marginal acceleration between 2008 and 2016 by which time emissions were 23% lower.
22 The ICCT and Element Energy, Quantifying the impact of real-world driving on total CO2 emissions from UK cars and vans, for the
UK Committee on Climate Change, September 2015 23 EEA, Monitoring CO2 emissions from new passenger cars and vans in 2016, Report n°19/2017, 18/01/2018 24 Per Kågeson, Reducing CO2 emissions from new cars, January 2005 25 Official Journal of the European Union, Regulation n°443/2009
Figure 13 – Evolution of the CO2 emissions of new cars sold in the EU from 2000 to 2016

19
a report by
HISTORY SHOWS ONLY REGULATION ENSURES THAT THE CAR INDUSTRY ACTS TO IMPROVE THE EFFICIENCY OF NEW
CARS.
3.2. Progress on the road In its series of Mind the Gap reports,26 T&E has shown that the gap between official test results and real-
world performance of new cars’ CO2 emissions has grown alarmingly. The average gap has jumped from 8% in 2001 to 28% in 2012 and 42% in 2016, as seen in Figure 14. The widening gap is not the result of cars being
driven in a significantly different way from the past, as motorists have hardly changed their driving style that drastically in the last 5-7 years. Nor can the widening gap be explained by the addition of auxiliary equipment (like heated seats) being fitted to the car, as this kind of equipment is only responsible for
around 4% points of the CO2 divergence between lab tests and real-world conditions.27
The widening gap is not a statistical anomaly as
the result of cars
becoming significantly
more efficient as the industry claims; nor does it arise from the use of an obsolete test –
the test has only recently changed to
WLTP and the gap is based upon the same NEDC test. The primary
cause, confirmed by the current emission
cheating revelations, is
carmakers
manipulating the undemanding and
poorly prescribed emissions tests; and
choosing to fit
technology to improve the efficiency of the car that works much better in the test than on the road.28 The
widening gap achieved through test manipulation has been the major contributor to the improvement in official (NEDC) average car CO2 emissions. Had the gap between test and real-world performance been
retained at 20% (the gap in the year that the car CO2 regulation came into force) the official NEDC test values
would be around 21g/km higher.
BY MANIPULATING THE NEDC TEST, THE CAR INDUSTRY HAS GAMED 21G/KM OF SAVINGS. THESE ARE CO2 SAVINGS
THAT HAVE BEEN CLAIMED BUT HAVE NOT DELIVERED ANY REAL-WORLD BENEFIT.
As Figure 15 illustrates, all the major carmakers have been increasingly exploiting flexibilities in the current
official tests. The gap is now so wide (over 50% for some models and manufacturers, e.g. Mercedes-Benz), that T&E and other experts are unable to explain how carmakers are able to achieve such remarkably low test results. New additional defeat devices may be the cause. In November 2016 in California, Volkswagen
26 Last report published: T&E, Mind the Gap 2016, 21/12/2016 27 The International Council on Clean Transportation (ICCT) and Element Energy, Quantifying the impact of real-world driving on
total CO2 emissions from UK cars and vans, for the UK Committee on Climate Change, September 2015 28 T&E, Mind the Gap 2016, 21/12/2016
Figure 14 – Evolution of the gap between official fuel economy tests and real-world driving
from 2006 to 2016

20
a report by
said Audi cars with automatic transmissions have technology capable of distorting CO2 emissions when they are tested.29 The progressive roll-out of cylinder deactivation – that has been used so far on a few luxury
cars – may also provide an opportunity for carmakers to manipulate future testing.
The losers from
manipulating tests are drivers, the EU economy and the environment. Fuel is the biggest
running cost of a car and drivers are not getting the benefit of the fuel economy improvements they have been
promised. Drivers also
cannot make informed
choices about the cars they buy, leading to a
loss of credibility for the whole of the EU’s car
labelling and regulatory system.
By 2030, the widening
gap will require drivers to cumulatively spend €1
trillion more on fuel and the EU to import six billion extra barrels of oil,30 worsening energy independence
and the EU’s balance of payments. As more fuel is burned, CO₂ emissions are also significantly raised
compared to expectations.
3.3. WLTP test is an improvement but not a panacea The WLTP test is a huge improvement over NEDC, the obsolete test it replaces. The WLTP is much longer
and the car driven much more dynamically (faster accelerations) but is still not realistic compared to real-
world driving. Compared to NEDC the car is moving for a much higher proportion of the test (i.e. fewer idling
phases) and the high speed section of the test is more representative of highway driving. More important than changes to the test are a much stronger test protocol. These eliminate many of the practices that
carmakers have used to artificially lower NEDC test results, such as charging the battery before the test,
over-inflating tyres, etc. 31 It also requires cars to be tested at the maximum and minimum weight (depending on the level of optional equipment fitted to the vehicle). All of these developments make the
WLTP test result more representative. However, the WLTP is still a laboratory test and does not accurately
represent real-world emissions that are estimated to be 23% higher.32 The gap arises from test flexibilities (10%), technologies that perform better in the test than on the road (8%) and the non-use of auxiliary
equipment during the test (5%). This gap is expected to grow to 31% by 2025 as more test flexibilities are
exploited (15%), technologies performing better in the test (10%) and more equipment fitted to cars (6%).
29 Reuters, Audi software can distort emissions in tests, VW says, 13/11/2016 30 T&E, Mind the Gap 2016, 21/12/2016 31 Ibid. 32 The ICCT and Element Energy, Quantifying the impact of real-world driving on total CO2 emissions from UK cars and vans, for the
UK Committee on Climate Change, September 2015
Figure 15 – Gap between official fuel consumption and average real-world driving per manufacturer in 2016

21
a report by
THE WLTP TEST UNDERESTIMATES REAL-WORLD EMISSIONS BY AROUND A QUARTER AND THIS WILL GROW TO
NEARLY A THIRD BY 2025.
Part of the proposal of the European Commission for post 2020 car and van CO2 emissions are measures to tackle the gap between test and real-world performance, including the introduction of in-service
conformity checks that would repeat the WLTP lab test on cars already driven on the road. The proposal also introduces provisions on fuel consumption meters, but for monitoring purposes only. Neither of these proposals will stop the CO2 gap between real-world and laboratories from growing nor ensure CO2 reductions are reduced in the real-world as well. Like the Dieselgate scandal, the solution lies in real-world
checks for fuel consumption that have been successfully implemented for air pollution with the RDE tests. Such a test for CO2 has already been adopted by the PSA Group that was developed with T&E.33 Such a check on real-world CO2 emissions is essential to drive down CO2 emissions on the road that have been effectively flat for the past five years,34 in addition to strengthened legislation for fuel consumption meters. The new car CO2 regulation should be based upon the WLTP test, but a secondary real-world CO2 test should be
performed with a not-to-exceed limit similar to the RDE regulation. This not-to-exceed limit should be set
for each manufacturer as the gap between the fleet average WLTP values and fleet average real world
emissions, measured in 2021 on all new cars. T&E’s proposal is further explained in the section 7.2.3.
An additional control could be to use the real-world fuel consumption and CO2 emissions data obtained from Fuel Economy Meters (FEMs). These will provide detailed information on the gap between the new
WLTP test and real-world performance. Once this data is available the average gap for each carmaker should be fixed. Carmakers should then be required to ensure the gap does not grow in the future – if it did
the company 2025 and 2030 targets would be adjusted accordingly to ensure the anticipated CO2 reductions
remained constant.
3.4. Progress towards 2020/1 targets All major carmakers achieved the weak 130g/km target for 2015 and are now working towards the 2020/1
targets. For these two years, the binding average target is 95g/km but the difference is about the number of
vehicles considered to calculate the CO2 performance of each carmaker’s fleet: in 2020, only 95% of the vehicles are considered (i.e. the 5% of worst performing CO2 emissions vehicles are ignored); in 2021, 100%
of sales are counted. Each carmaker has a different target as the 95g/km value is adjusted for each depending on the difference between the average fleet mass of the given manufacturer for a given year and
the reference mass that corresponds to the average mass of the EU fleet.35
Methodology
For this analysis, T&E compiled data from the EEA’s Monitoring of car CO2 emissions databases36 in order
to calculate the CO2 fleet performance of each carmaker’s pool, as described in the latest EEA 2017 report.37 The results were determined from 2008 to 2016, without taking into account the flexibilities
allowed in the regulation (eco-innovations and super-credits). The observed trend for each manufacturer pool was than extrapolated forward to estimate the emissions without flexibilities for 2021. Ranges were
also assigned to take account that past performance may not be an indication of future performance.
33 PSA Group, The Groupe PSA, NGOs T&E and FNE, and Bureau Veritas publish the protocol for measuring real-world fuel
consumption, 10/10/2016 34 T&E, Mind the Gap 2016, 21/12/2016 35 EEA, Monitoring CO2 emissions from new passenger cars and vans in 2016, Report n°19/2017, 18/01/2018 36 EEA, Monitoring of CO2 emissions from passenger cars – Regulation 443/2009, 19/01/2018 37 EEA, Monitoring CO2 emissions from new passenger cars and vans in 2016, Report n°19/2017, 18/01/2018

22
a report by
Projections were also made for the average mass of cars sold in each pool in order to calculate the likely pool target and compared to the EU reference mass value taken from the European Commission’s post-
2020 cars and vans CO2 proposal, i.e. 1,379.88kg.38 To calculate the level of any possible fines, the 2016 sales of each pool were assumed for 2020 and 2021.
The methodology used to estimate the CO2 compliance in 2020 was similar, with a correction applied to each pool to derive the 95% best-performing cars based upon all the cars registered in 2016.
The methodology provides an indication of the progress of different carmakers towards their
targets as past performance is not necessarily an indication of how they will perform in reducing CO2 emissions in the future. The CO2 emissions of future new models is closely guarded commercial information, but the work done still represents the best publicly available estimates that are available.
3.4.1. Flexibilities in the regulation
The exact average company CO2 emissions in 2020 and 2021 depends on the emissions of cars sold in each
year and will change as a result of new model releases between now and 2020/1, as well as shifting market trends. As a result, past performance is not always a predictor of future emissions. Furthermore, the introduction of the new test is an additional confounding factor. The 95g/km target is based upon the NEDC but the new WLTP test is now being used to measure car CO2 emissions. The WLTP test results will be
converted into an NEDC equivalent value using the CO2MPAS tool developed by the European Commission. The CO2MPAS tool is designed to “maintain regulatory stringency” through the process of introducing the
new test. T&E believes that, based upon the choices made in the design of the tool and which flexibilities in the testing procedure were incorporated into the correlation, there should be regulatory equivalence. However, there is insufficient data at present to determine whether this is the case or the target has, in
effect, been made more or less stringent through the introduction of the new test.
If the CO2MPAS tool is making the regulation less stringent this will help the carmaker to achieve its targets
more easily. However, if CO2MPAS in effect makes the regulation more stringent, it is very likely carmakers
will resort to double testing cars, measuring the emissions using both tests and using the actual NEDC test
results for the purpose of the regulation. Double testing enables the carmaker to potentially manipulate the NEDC test result to optimise the test conditions in order to produce a very low NEDC result that will be used for compliance purposes with the 2020/1 target. However, the carmaker will also be able to optimise
the WLTP test value if they wish to produce an artificially high value to achieve a high starting point for the post 2020 regulations.
There is emerging evidence that the car industry is currently testing very conservatively on WLTP. In one member state already the CO2 emissions of over 100 newly registered cars were found to be significantly
higher than the 15% difference experts had been expecting. The wide gap could result from testing conservatively and not fully optimising vehicle performance initially in order to artificially increase test
values so as to build in a safety margin to be certain to comply with the new conformity of production requirements, as this can be as great as 5 to 10 grams.
THERE IS EMERGING EVIDENCE CARMAKERS WILL DOUBLE TEST CARS ON THE WLTP AND NEDC TESTS, AND THIS
PRESENTS A SIGNIFICANT RISK TO WEAKENING BOTH THE 95G/KM TARGET FOR 2020/1 AND THE 2025 TARGET. But there could also be another reason for this. This is because the proposed post-2020 regulation targets
are a percentage reduction from 2021 levels measured using the WLTP test. High WLTP test values could
38 European Commission, DG CLIMA, Proposal for post-2020 CO2 targets for cars and vans, November 2017

23
a report by
make meeting the proposed 2025 and 2030 targets much easier, as once the targets have been set the carmaker will then optimise the WLTP test to produce a CO2 value as low as possible. In effect, test
optimisation enabled through double testing will weaken both the 2020/1 targets and the future 2025 and 2030 goals.
The only potential problem in this scenario would be if national governments would not adapt their car taxation policies from NEDC to WLTP – that would increase taxes on WLTP vehicles with significantly higher CO2. But several governments have already announced they are looking at adapting policies to make sure the transition from NEDC to WLTP is budget neutral.
Solutions to prevent carmakers from abusing the NEDC-WTLP conversion could include expressing the 2025 target in a fixed WLTP value (so not -15%, but 93.5g/km WLTP), using fuel economy meters or RDE CO2 to fix the gap between real work and WLTP (explained in more detail in section 7.2.1), or for the Commission to close the CO2MPAS escape route.
There are also two important flexibilities in the 2020/1 regulations to assist manufacturers in the meeting
of their targets: super-credits and eco-innovations.39 Super-credits are a multiplier to the numbers of low-carbon vehicles40 sold in order to give them a greater weighting in the final calculations. This factor is set as
1 today but will be 2 in 2020, 1.67 in 2021, 1.33 in 2022 and back to 1 from 2023. However, the super-credit flexibility is capped at a maximum claim of 7.5gCO2/km for each manufacturer over the period of the
regulation.
The eco-innovation flexibility was introduced in 2011 to encourage manufacturers to develop new
advanced CO2-saving technologies that delivers savings on the road and not in the laboratory. Suppliers
and carmakers must get the Commission’s approval in order to claim reduced CO2 emissions for vehicles fitted with these eco-innovations. Seven kinds of technology have been approved so far, including solar roofs and LED lights for instance.41 This flexibility is capped by a maximum claim of 7gCO2/km for each
manufacturer.
3.4.2. Projections of compliance with the 2020/1 targets
T&E estimates that if carmakers make no use of flexibilities, about half of the pools they established to meet
the goal, including Peugeot-Citroën and Toyota, would be able to meet their 2021 EU CO2 target on time, as summarised in Table 2. Daimler is also in a good position to respect the target, contradicting the company’s public statements.42 A small group of companies (BMW, Ford and Volkswagen), would be one or two years late, assuming there is no accelerated progress towards the targets in the next few years and no use of
flexibilities. However, eight manufacturers will be seriously late in meeting their targets, notably Fiat-Chrysler, Hyundai-Kia and Opel-Vauxhall. It has to be noted that if Opel-Vauxhall was pooled with Peugeot & Citroën, the PSA Group would be only one year late, which would reduce significantly the potential fines.
39 EEA, Monitoring CO2 emissions from new passenger cars and vans in 2016, Report n°19/2017, 18/01/2018 40 For the super credit scheme, low-carbon vehicles are cars and vans with CO2 emissions lower than 50g/km on NEDC. 41 European Commission, DG CLIMA, Reducing CO2 emissions from passenger cars, Implementing legislation, Approved eco-
innovation, 24/01/2018 42 The Financial Times, Fiat and Daimler warn on Europe’s emissons targets, 15/01/2018

24
a report by
(Minimum level of flexibilities = 3.5g/km; Moderate level of flexibilities = 7g/km; Maximum level of flexibilities = 14.5g/km)
CLAIMS BY MOST CARMAKERS THAT THEY ARE AT SIGNIFICANT RISK OF MISSING 2021 TARGETS ARE NOT SUPPORTED
BY THE EVIDENCE. T&E has analysed the extent to which flexibilities are needed by each manufacturer pool to meet targets
and avoid fines (assuming progress to reduce emissions continues in the future at the same rate as in the
past). The results are summarised in Table 2, which shows:
- a minimum use of flexibility with a reduction of 3.5gCO2/km thanks to eco-innovations only (no sales
of sub-50g/km vehicles to earn super-credits); - a moderate use of flexibility with a reduction of 7gCO2/km shared by eco-innovations and super-
credits; - the maximum allowed use of flexibility with a reduction of 14.5gCO2/km;
- a comparison is also made with the scenario where no flexibilities have been used.
Table 2 clearly illustrates the nine pools on track to achieve 2020 and 2021 targets on time: Volvo, Mitsubishi, Toyota-Lexus, Daimler, Jaguar-Land Rover, Peugeot, Citroën-DS, Nissan-Infiniti and Renault Group. In reality, most of these companies will also use flexibilities to enable them to meet goals earlier.
Table 2 – Influence of the use of flexibilities on the CO2 compliance year

25
a report by
Table 2 also illustrates a middle group of companies that includes Volkswagen Group, BMW Group and Ford.
A minimum or moderate level of flexibilities will allow these companies to meet their targets on time.
Figure 16 compares the improvement from 2008 to 2016 with the required improvement from 2016-21. The top ten performing carmakers have a smaller future annual rate of improvement to achieve than their past
performance (BMW is an outlier); the bottom te manufacturers must accelerate annual progress compared to past performance. As a consequence, some carmakers will need to make a significant use of the flexibilities (eco-innovations and super-credits) to
avoid fines for non-compliance.
Of the companies that have failed to make sufficient progress to date, Opel & Vauxhall could also pool with
Peugeot & Citroën, which coupled with the new plug-in hybrid and electric models coming from 2019 and the
strong performance of the French carmakers to date should ensure targets are met. PSA have demanded a
rebate on the price paid to General Motors for the
company because of the potential fines.43
Despite their derogation, Mazda and Suzuki 44 would need to use the flexibilities at their fullest in order to be
on time. For the other carmakers, it will be essential to
sell significant numbers of sub-50g/km vehicles and zero emission models to avoid fines.
3.4.3. Potential fines
Meeting CO2 targets is not optional for carmakers given the high level of fines (€95 per over gCO2/km per vehicle). The fines were deliberately set at a level that is
higher than the (marginal) cost of achieving the regulation (and that cost has come down compared to initial estimates). This means it is a very risky and costly strategy for carmakers to choose to miss the targets.
Table 3 shows the level of fines that could potentially be
incurred in 2021 for those carmakers at risk of missing their targets, according to the different levels of
flexibility described in the previous section. Hyundai and Kia would not get any penalty reduction if the two
Korean brands pool together. However, the PSA Group would better pool Peugeot and Citroën with Opel-
Vauxhall plus use some flexibilities in order to eliminate the Opel-Vauxhall penalty.
43 Reuters, PSA seeks Opel refund from GM over CO2 emissions, 29/11/2017 44 According to the EEA, a niche derogation target can be asked by car manufacturers with annual EU sales between 10,000 and
300,000 vehicles. In this case, the target is a reduction of 45% compared to the 2007 fleet CO2 average. Four OEMs are using this
derogation for 2020/1: Jaguar-Land Rover, Mazda, Subaru and Suzuki.
Figure 16 – Comparison of the average annual
improvement in CO2 fleet emissions for each pool for
the periods 2008-2016 and 2016-2021

26
a report by
Potential annual fines in million euros
(2021)
Without using
flexibilities
With using flexibilities
Minimum level Moderate level Maximum level
Volkswagen Group 713 0 0 0
BMW Group 425 95 0 0
Ford 490 146 0 0
Suzuki* 175 110 46 0
Mazda* 252 179 106 0
Opel-Vauxhall 1,295 973 651 0
Kia 606 465 325 25
Subaru* 49 39 29 8
Honda 259 209 159 51
Fiat-Chrysler 1,346 1,035 723 56
Hyundai 888 725 562 212
*Manufacturers with a niche derogation target
Table 3 – Potential fines for pools missing their 2021 CO2 target in million euros
MOST CARMAKERS ONLY NEED TO MAKE MODERATE USE OF FLEXIBILITIES (SUPER-CREDITS, ECO-INNOVATIONS AND
POOLING) IN ORDER TO AVOID FINES.
3.4.4. Compliance in 2020
Pools could be fined in 2020, 2021 and every subsequent year that they fail to comply. Pools on track to
meet their targets in 2021 will be able to meet the 95th percentile goal in 2020. The 2020 CO2 target is supposed to be easier to meet because only the best-performing cars are counted. This means that it is
expected that the potential fines would also be smaller in 2020 than in 2021. However, if no flexibilities are
used, T&E’s projections show that the projected CO2 performance would be slightly higher in 2020 and 2021, except for Fiat-Chrysler, Ford and Hyundai. In other words, most carmakers that would be fined in 2021 may have to pay even bigger penalties in 2020.
27
a report by
3.4.5. Can carmakers earn
sufficient flexibilities to avoid
fines?
Table 2 shows how critical it will be for some carmakers to earn sufficient flexibilities to avoid fines. But earning sufficient credits through eco-innovations
and super-credits will be challenging for
some of them. To date, the eco-innovation scheme has not been widely used by the industry (just
over 2% of cars sold in 2016 according to the EEA 45 ) but changes to the approval
process, recently entered into force
(including generic decisions and reducing
the minimum compulsory CO2 savings from 1g/km to 0.5g/km46), are designed to increase its use by 2021. T&E estimates that
with more widespread adoption
carmakers could earn 1-3 g/km towards 2020/1 goals, sufficient to help some carmakers just achieve their goals. It is
highly unlikely any pool will be able to earn the maximum number of eco-innovations
(7g/km) and therefore highly unlikely any pool could earn the maximum 14.5g/km of
flexibilities.
Super-credits are earned on all sub-50g/km vehicles sales (effectively ZEVs and
PHEVs). The number of sub-50g/km vehicles that need to be sold by carmakers to meet their targets varies depending on
the gap that remains to be closed. The mix
of ZEVs and PHEVs in 2016 can be assessed thanks to the EEA’s 2016 final CO2 database to calculate the number of over-50g/km
vehicles sold, their expected average CO2 emissions in 2021.
For the purpose of the analysis, it is assumed most carmakers sell one-third BEVs (0g/km) and two-thirds
PHEVs (49g/km). Exceptions were applied where there is evidence the BEV/PHEV ratio is likely to be significantly different (Fiat-Chrysler, Mazda, Mitsubishi, Subaru and Suzuki: 100% PHEV; Nissan and Renault: 100% BEV). The following results also take into account savings of 3.5g thanks to eco-
innovations that would be used on over-50g/km vehicles.
45 EEA, Monitoring of CO2 emissions from passenger cars – Regulation 443/2009, 2016 final database, 19/01/2018 46 Official Journal of the European Union, Regulation n°2018/258
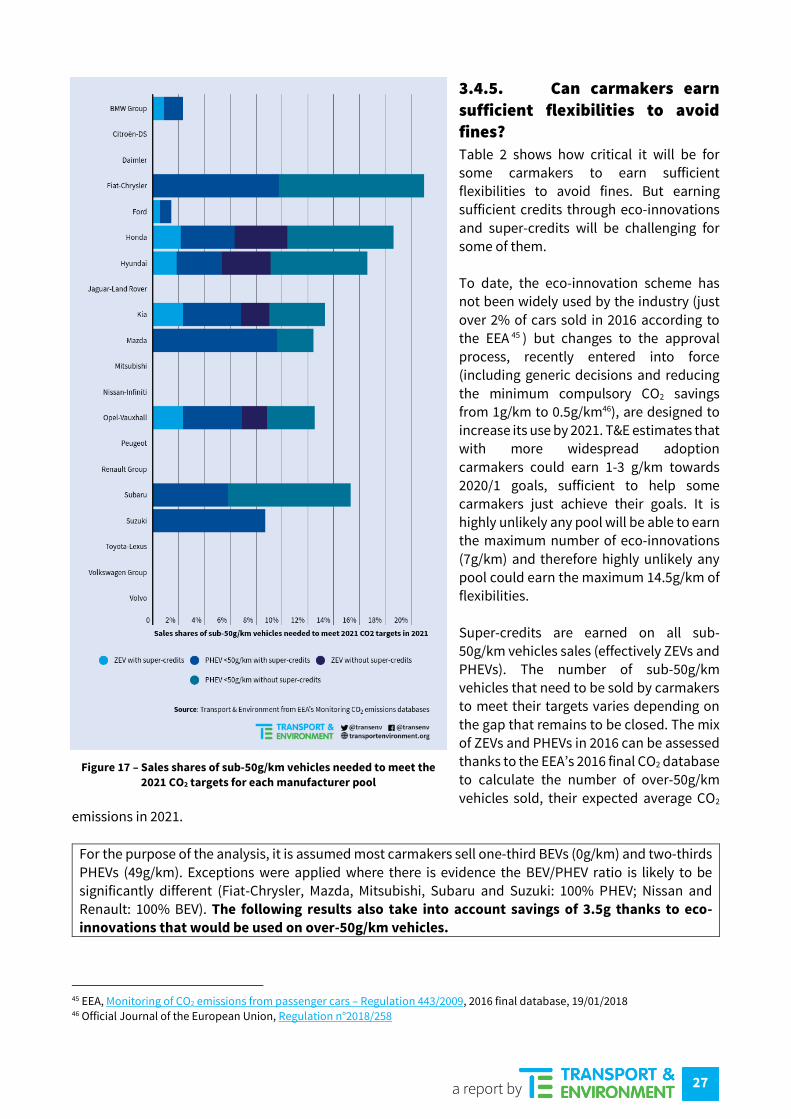
Figure 17 – Sales shares of sub-50g/km vehicles needed to meet the
2021 CO2 targets for each manufacturer pool
28
a report by
At the EU level, to earn a moderate level of super-credits (3.5g/km), 1.5% of ZEVs and 2.5% of PHEVs would need to be sold in 2021 (respectively 1.2% and 2.0% for 2020). To give some perspective to these figures,
the 2016 ZEV and PHEV sales both need to increase by around a factor of 4.5 in 2021. For a maximum level of super-credits with 7.5g/km of CO2 savings, the sales of ZEVs would need to represent 3.1% and PHEVs 5.3% of the car market in 2021 (respectively 2.5% and 4.3% for 2020). Figure 17 shows the share of sub-
50g/km vehicles each manufacturer needs to sell in 2021 in order to meet their targets on time, based upon a continuation of past trends in emissions reductions. Ten carmakers out of 20 will not need to sell any sub-50g/km vehicles to meet their targets: Citroën-DS,
Daimler, Jaguar-Land Rover, Mitsubishi, Nissan-Infiniti, Peugeot, Renault Group, Toyota-Lexus, Volkswagen Group and Volvo. BMW Group and Ford need a modest share of sub-50g/km vehicles. Whilst some growth in current sales is necessary, the targets appear to be reachable if supply is increased.
Opel-Vauxhall is expected to pool with PSA. If this happens, the percentage of sub-50g/km vehicles it needs
to sell will fall from 12.5% to 0% for both 2020 and 2021, in line with what has been found for Peugeot and Citroën-DS.
Some carmakers have fallen so far behind what is required that the gap they need to close to achieve targets
cannot be met through using super-credits alone. But Fiat-Chrysler has anyway very limited plans for ZEV and PHEV vehicles, and the required sales look to be hard to achieve without major additional efforts.
Hyundai-Kia and Honda are also struggling. Other manufacturers should benefit from small volume
derogations.
MOST EUROPEAN CARMAKERS (BUT NOT FIAT) ONLY NEED TO SELL SMALL NUMBERS OF PLUG-IN VEHICLES IN ORDER
TO ACHIEVE THEIR TARGETS. SOME JAPANESE AND KOREAN CARMAKERS HAVE MUCH MORE TO DO.
Carmakers plan to launch a significant number of both new battery electric and plug-in hybrid vehicles in the forthcoming years in order to help earn the required level of super-credits and lower their fleet average emissions. At present there are around 20 battery electric cars on sale in Europe, and this is expected to
nearly double by 2021, with most launches scheduled for 2018 and 2019. An increase in plug-in hybrids is
also foreseen. This supports the evidence that carmakers have been holding back technology to both make
cars more efficient and electric models until they need to sell them in order to meet 2020/1 targets. By 2025 around 80 battery electric models have been pre-announced, indicating a very strong push for
electrification during this period.
3.5. Assessing uncertainty A considerable number of assumptions are needed in order to assess the sub-50g/km sales needed for
carmakers to meet their targets – the most important being progress in lowering the emissions from
conventional vehicles between 2017 and 2020/1. This assessment assumes past progress is continued in the future but there are several reasons why this may not be the case. Some factors lead to higher future emissions, others to lower future emissions, as illustrated below:

29
a report by
Table 4
T&E has reviewed the past and planned model launches for the 50 biggest selling models in the EU that
represent 57% of total sales. We found only two models received a full upgrade in 2017 – that undoubtedly
Figure 19 – Uncertainty analysis of how many plug-in vehicles
carmakers need to sell
Figure 18 – New models expected to be launched on the
market by 2018/2021

30
a report by
contributed to the lack of progress in this year. But in future years the pace of model upgrades quickens considerably. On balance it is likely that the various conflicting impacts on the decline in CO2 will result in
at least the past trajectory being maintained overall and, for some carmakers, accelerated progress. Figure 18 summarises the scheduled upgrades.
NEARLY HALF OF THE TOP SELLING 50 MODELS WILL BE UPGRADED IN 2019 AND 2020 TO HELP MANUFACTURERS
COMPLY WITH THE REGULATIONS. In order to assess uncertainty, T&E examined a range of future projections ±5g/km on the EU fleet average
2021 emissions. In effect this meant we assigned the same range of future improvement rates for each carmaker and then assessed how many sub-50g/km vehicles they needed to sell to meet their target. Figure 19 shows carmakers that need to sell plug-in vehicles in order to achieve their targets only. The worst placed European carmakers Fiat and Opel may make use of the pooling flexibility. The next worst placed
European Company is BMW, which needs to sell 2-6% plug-in vehicles, a small increase on its current sales.
For most Korean and Japanese carmakers, a radical shift in approach is needed. The announcements of Hyundai-Kia may be sufficient if these translate into sales of hybrid, PHEV and ZEVs.
However, other carmakers complaining that targets may be missed seem to be doing so as part of a strategy
to weaken the proposed 2025 target – an approach the industry repeatedly deploys – and policymakers should ignore. It is also clear that carmakers are not choosing a linear trajectory to achieve their targets but
are back-ending the effort, both in terms of efficiency improvements and sales of sub-50g plug-in vehicles.
This emphasises the importance of setting in 2025 a new car target in the post 2020 regulation to ensure
continuous improvement through the 2020’s in order to deliver a significant overall emissions reductions from the fleet by 2030.

31
a report by
4. Bigger, heavier and higher performance – the trends offsetting
efficiency improvements Chapter 3 highlighted the inadequate improvement in new car CO2 emissions on the road and the recent
slowdown in fleet average emissions reductions measured in the laboratory. This chapter examines the underlying reasons – that cars have become bigger, heavier and higher performance in the pursuit of higher profit margins.
4.1. Bigger and heavier Data from the ICCT show that the mass of cars sold in Europe over the last 15 years grew by 10% on average, from 1,268 kg to 1,392 kg.47 The peak was reached in 2012, since when the average mass of car started to
slowly decrease for a few years, and then rose again in 2016. The mass of a vehicle impacts on the energy
needed to move because of inertia and the higher rolling resistance caused by the contact of the tyres on the road as well as the gradient resistance caused by gravity when the vehicle is driven on a slope.
The European Aluminium Association estimates that a mass saving of 100kg can deliver an average saving of
5.4gCO2/km on a vehicle
powered with a conventional internal combustion engine
(ICE). 48 However, light-weighting allows many further
design optimisations that can lead to better CO2 emission improvements. Indeed, smaller
parts can be fitted to the
vehicle, such as the powertrain, as less power is needed from the engine for the same level of
performance, as well as less energy to cool it down; the
gearbox has less torque to deliver to the wheels; but also
non-powertrain parts, such as brakes, suspensions, etc. For
the same mass reduction of
100kg with an optimised powertrain, the European Aluminium Association’s CO2 average saving estimation goes up to 6.9gCO2/km.
The increase in average mass has contributed to around an 8.5g/km increase in CO2 emissions overall.
The overall rise in mass relates to an increase in the overall size of cars within segments of the market; the shift to larger, heavier and less aerodynamic SUVs; and the growing share of diesel are the most important drivers. SUVs and diesel cars are more profitable49 so there are strong commercial drivers behind the
changes that are broadly consistent across the industry, as shown by Figure 20.
47 The ICCT, European vehicle market statistics, Pocketbook 2017/18, 28/11/2017 48 European Aluminium Association, IFEU study: Energy savings by light-weighting - 2016 Update, 27/04/2017. Note: the results have
been converted from l/100km into gCO2/km by using the conversion factors from T&E’s EUTRM model. The figures are an average
of the results for petrol and diesel passenger cars. 49 Automotive News Europe, Crossover commitment, Volume 8, Issue 5, May 2017
Figure 20 – Evolution of the average mass in running order for cars per brand in
Europe from 2001 to 2016

32
a report by
The heaviest vehicles are unsurprisingly produced by the premium manufacturers: Audi, BMW, Mercedes-
Benz and Volvo. Fiat and Dacia (not illustrated) are the lightest but weight has been increasingly quickly (21% and 14% respectively) and both carmakers are now close to the European average. Citroën has seen the average mass of cars sold slightly decrease since 2001 (-2%).
SUV sales boomed from 4% of the EU market in 2001 to 26% in 2016,50 becoming the biggest car segment on the market.51 This growth is expected to continue, and forecasts expect that a third of EU car sales could be SUVs by 2020.52 Nowadays, every manufacturer has a least one SUV in its range, even down to the small
B segment (e.g. Nissan Juke). SUVs are typically around up to 250kg heavier than a conventional hatchback53 and, being taller have worse aerodynamics as a result of the bigger frontal area, leading to higher fuel consumption and, therefore, higher CO2 emissions.54 It is tempting to blame car-buyers for the rising CO2 but the market for SUVs has to a large extent been
created by carmakers’ skilful marketing and pursuit of higher profits. Carmakers have been aware of 2020/1
CO2 targets since 2009 and could, and should, have factored their growth into their compliance plans
ensuring a higher proportion of these vehicles were equipped with hybrid systems that would greatly increase efficiency. Instead carmakers have benefited from strong sales in this market segment without
taking responsibility for their greater environmental footprint and higher emissions. The lack of progress in recent years in reducing emissions as a result of the shift to SUVs is therefore carmakers’ own responsibility
due to their own poor planning.
New technology also increases the mass of cars – although not by as much as the shift to SUVs. For example,
turbo-charging to deliver more power also add mass (although new engines have a smaller engine block).
Automatic gearboxes, whose sales have more than doubled from 12% to 29% since 2001,55 also add mass, especially with more torque to deliver from new turbo-charged engines. For instance, a dual-clutch gearbox, one of the biggest selling technologies in Europe, consists of two linked manual gearboxes in order
to allow a quicker transition between odd and even gears without jolt. In addition, more equipment is being
fitted to premium models and is becoming more available for lower segments. All of these new features need additional sensors, cameras or Electronic Control Units (ECU) to work properly, making the vehicle heavier. In the past, safety equipment was also blamed for the rising weight although in practice it
contributes very little.
Light-weighting can be done by optimising the vehicle design in order to have fewer, lighter and stronger parts that still answer to the same technical performance.56 The use of computer-aided design (CAD) to
optimise the amount of needed material for a given part or by using new assembly processes (bonding
instead of welding, for instance) is now widespread across the industry and material substitution, either
with metals (high-strength steel, aluminium, magnesium) or non-metallic materials (composites, plastics) increasingly being deployed.57 But the increased size of cars is offsetting most of these efforts and the design of the car CO2 regulation – which allows higher targets for carmakers producing higher weight cars –
penalises light-weighting approaches compared to other ways to reduce CO2 emissions. This is because as
the average weight of cars produced decreases the manufacturer faces a tougher target. This is addressed
in Section 3.3.
50 The ICCT, European vehicle market statistics, Pocketbook 2017/18, 28/11/2017 51 Automotive News Europe (ANE), SUVs will continue to dominate in Europe, 11/08/2017 52 Ibid. 53 Derived from technical specifications from the specialised website La Centrale. 54 Global Fuel Economy Initiative (GFEI), Wider, taller, heavier: Evolution of light duty vehicle size over generations, Working Paper
17, October 2017 55 The ICCT, European vehicle market statistics, Pocketbook 2017/18, 28/11/2017 56 The ICCT, Lightweighting technology developments, Technical brief no.6, March 2017 57 GFEI, Wider, taller, heavier: Evolution of light duty vehicle size over generations, Working Paper 17, October 2017

33
a report by
4.2. Increased power – increased profits – increased emissions Along with the shift to SUVs, rising engine power is also driving increased CO2 emissions, offsetting much of
the improvement in efficiency. Data from the ICCT show that engine power increased by 28% from 2001 to 2016, up to an average of 95 kW.58 This industry wide trend is again being driven by commercial reasons – higher power engines generally deliver higher profits and make new sold models more attractive.
Unnecessary power means that engines work with lower efficiency most of the time, therefore drivers use
more fuel in order to get the same power at the wheel. They also increase emissions if the additional power is used to achieve faster accelerations. Higher performance cars must also be equipped with suspensions and brakes appropriate to the power, leading to additional mass. The increase in engine power is
significantly more than has been needed to compensate for higher vehicle weight and size but has resulted
in a significant increase in the power-to-weight ratio.
Figure 21 shows the four premium
brands – Audi, BMW, Mercedes-Benz and
Volvo – have the highest average power. Fiat and Dacia (not illustrated) have seen large power increases compared to the
EU average (34% and 40% respectively).
Škoda has the biggest increase (105%) as the Czech brand was transformed by Volkswagen from an entry-level to a
mass-market manufacturer.
When comparing power between vehicle segments, mini, small, lower medium
and medium segment cars have increased power by around 25% since
2001. Upper medium car average power increased by 29%; vans and MPVs by
33%; luxury cars by 37% and by almost 50% for sport cars. This suggests greater
power is a feature throughout the
market but is especially focused at the premium market. Amongst the mass-market
manufacturers, power has increased in the range of 12% to 44%, with Toyota the notable exception – it is
the only company to have kept an almost constant average engine power (+1%) over the last 15 years, with its growing sales of hybrid powertrains being designed to favour efficiency over engine power. It is notable that Toyota will have no problem in achieving its car CO2 targets.
Carmakers have historically always been able to make higher margins for higher performance engines and power has become a key message in the marketing of new cars. This is legitimate commercial activity but comes at a cost in terms of requiring more technology to be fitted to the car to manage the CO2 emissions –
these technologies have simply not been deployed on vehicles in sufficient numbers and have resulted in
minimal improvements in on-road efficiency.
58 The ICCT, European vehicle market statistics, Pocketbook 2017/18, 28/11/2017
Figure 21 – Evolution of average engine power for cars per brand in Europe from 2001 to 2016

34
a report by
Ever more powerful vehicles serve minimal practical function and encourage more aggressive driving, causing higher emissions on the road.59 Driving in cities across Europe tends to involve heavy congestion
and the dense road network has many intersections causing low speed and stop-start driving where power serves no practical benefit. On rural roads and motorways, speed limits are ubiquitous (except on a few German motorways60) and the power of modern cars goes largely unused when they are being driven at
steady and capped speeds. High power simply encourages inappropriate accelerations and overtaking with safety risks or speeding. As long ago as 1991, the Council of the European Ministers of Transport61 made a clear call to stop the increase of engine power.62 Since then the situation has become much worse.
4.3. Bigger fleets means more congestion and bigger risks for vulnerable road users
MOTORISATION RATES IN EUROPE CONTINUE TO GROW.
Table 5 shows motorisation growing faster than the European population, with the strongest growth taking place in central and eastern Europe.
From 2001 to 2015, the fleet in western Europe
(EU-14) increased by 16%, whilst that in central
and eastern Europe (EU-13)63 was 62%. Western Europe is a mature market with a much higher
motorisation rate compared to central and
eastern Europe. But the high growth in the EU-
13 is expected to continue closing the gap as national economies continue to expand.
According to the EEA, vehicle occupancy has been constant at around 1.5 passenger/vehicle in western
Europe over two decades (1990-2008) but has been dropping in central Europe from 1.9 to 1.7 over a 5-year period (2004-2008).64 By way of comparison, vehicle occupancy in Europe was around 2.0-2.1 in the early 1970s, according to the IEA.65
MORE CARS BRING MORE CONGESTION.
According to the European Commission, the annual time lost in road congestion rose by 4% from 2014 to
2016, to reach almost 32 hours for an average European driver.66 Congestion has multiple negative impacts,
contributing to stress and wasted time as well as losses of €100bn a year for the European economy.
Data from the European Transport Safety Council (ETSC) show that, across Europe, pedestrian and cyclist deaths mainly occur when a collision happens with a passenger car or taxi,67 as summarized in Table 7 and
Table 7 below.
59 Inter-Environnement Wallonie, Pierre Courbe, LISA car - la voiture de demain, December 2016 60 European Commission, DG MOVE, Road safety – Going abroad, 08/09/2017 61 Known today as the International Transport Forum (ITF) 62 Inter-Environnement Wallonie, Pierre Courbe, LISA car - la voiture de demain, December 2016 63 Derived from Eurostat (Motorisation rate, Latest update: March 2018 & Average annual population, Latest update: February 2018)
& BOVAG-RAI, Mobility in figures 2017-2018, Vehicles in use, Passenger cars in 2015 – NB: No data for Denmark 64 EEA, Car occupancy rates, 02/09/2010 65 EEA, Occupancy rates, 19/04/2016 66 European Commission, DG MOVE, Hours spent in road congestion annually, 22/09/2017 67 European Transport Safety Council (ETSC), Making walking and cycling on Europe’s roads safer, PIN Flash Report 29, June 2015
Table 5 – Evolution of the number of cars per 1,000 inhabitants
in the EU

35
a report by
Table 6 – Shares of pedestrian fatalities according to the different type of users
involved (EU-21)
Table 7 – Shares of cyclist fatalities according to the different type of users involved
(EU-19)
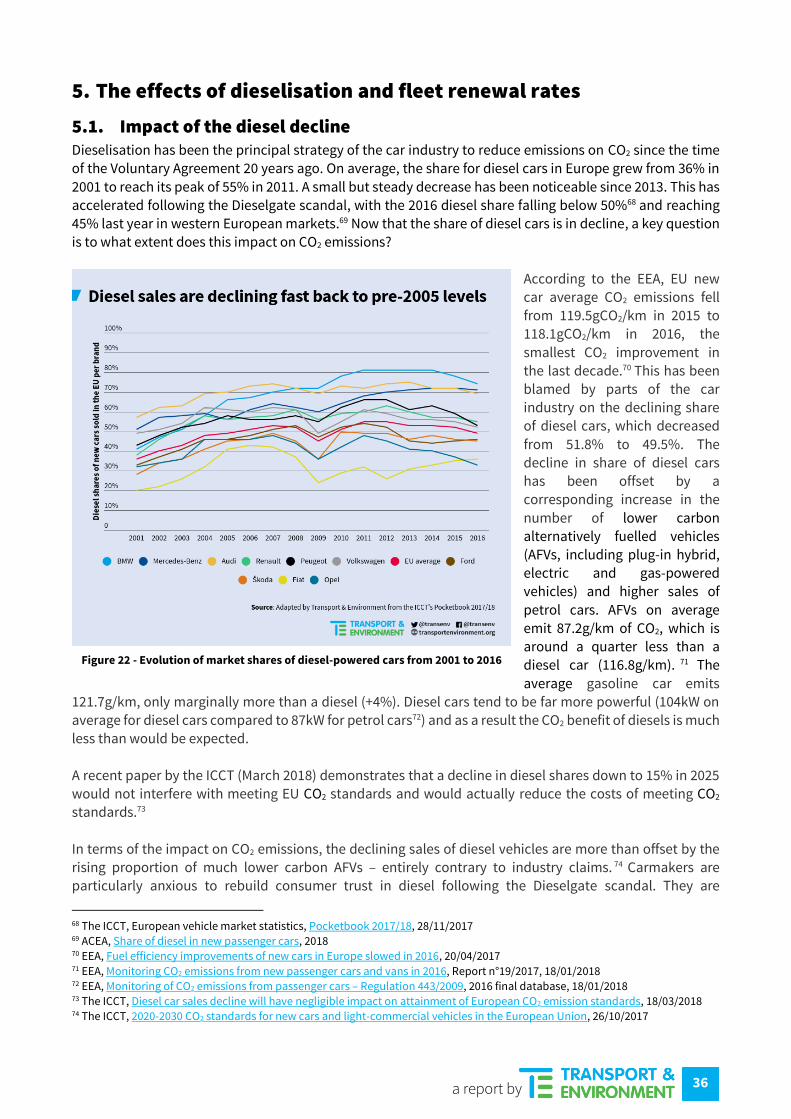
36
a report by
5. The effects of dieselisation and fleet renewal rates
5.1. Impact of the diesel decline Dieselisation has been the principal strategy of the car industry to reduce emissions on CO2 since the time
of the Voluntary Agreement 20 years ago. On average, the share for diesel cars in Europe grew from 36% in
2001 to reach its peak of 55% in 2011. A small but steady decrease has been noticeable since 2013. This has accelerated following the Dieselgate scandal, with the 2016 diesel share falling below 50%68 and reaching 45% last year in western European markets.69 Now that the share of diesel cars is in decline, a key question is to what extent does this impact on CO2 emissions?
According to the EEA, EU new car average CO2 emissions fell from 119.5gCO2/km in 2015 to 118.1gCO2/km in 2016, the
smallest CO2 improvement in the last decade.70 This has been
blamed by parts of the car industry on the declining share of diesel cars, which decreased
from 51.8% to 49.5%. The decline in share of diesel cars
has been offset by a corresponding increase in the
number of lower carbon
alternatively fuelled vehicles (AFVs, including plug-in hybrid,
electric and gas-powered
vehicles) and higher sales of
petrol cars. AFVs on average emit 87.2g/km of CO2, which is
around a quarter less than a diesel car (116.8g/km). 71 The
average gasoline car emits 121.7g/km, only marginally more than a diesel (+4%). Diesel cars tend to be far more powerful (104kW on average for diesel cars compared to 87kW for petrol cars72) and as a result the CO2 benefit of diesels is much
less than would be expected.
A recent paper by the ICCT (March 2018) demonstrates that a decline in diesel shares down to 15% in 2025 would not interfere with meeting EU CO2 standards and would actually reduce the costs of meeting CO2 standards.73
In terms of the impact on CO2 emissions, the declining sales of diesel vehicles are more than offset by the
rising proportion of much lower carbon AFVs – entirely contrary to industry claims. 74 Carmakers are particularly anxious to rebuild consumer trust in diesel following the Dieselgate scandal. They are
68 The ICCT, European vehicle market statistics, Pocketbook 2017/18, 28/11/2017 69 ACEA, Share of diesel in new passenger cars, 2018 70 EEA, Fuel efficiency improvements of new cars in Europe slowed in 2016, 20/04/2017 71 EEA, Monitoring CO2 emissions from new passenger cars and vans in 2016, Report n°19/2017, 18/01/2018 72 EEA, Monitoring of CO2 emissions from passenger cars – Regulation 443/2009, 2016 final database, 18/01/2018 73 The ICCT, Diesel car sales decline will have negligible impact on attainment of European CO2 emission standards, 18/03/2018 74 The ICCT, 2020-2030 CO2 standards for new cars and light-commercial vehicles in the European Union, 26/10/2017
Figure 22 - Evolution of market shares of diesel-powered cars from 2001 to 2016

37
a report by
desperate to promote diesel as lower carbon even though in practice their emissions are far higher than hybrid, plug-in hybrid and electric cars of which carmakers provide little or no supply in the market.75
As was discussed in chapter 4.1, the principal reason for the slowdown in CO2 reductions is the sharp increase in SUV sales, with SUV market share reaching 26% in the EU in 2016, compared to less than 10% in
2010. This was recently admitted by Daimler.76 SUVs have become the biggest car segment being bought in preference to more aerodynamic sedans and hatchbacks. 77 The average new SUV had emissions of 131.7g/km in 2016 across the EU compared to 117.5g/km for a medium segment car (Mercedes-Benz C-Class, for example), 111.5g/km for a lower medium segment car (Volkswagen Golf, for example) or
107.2g/km for a small segment car (Renault Clio, for example).78
5.2. National and company diesel share
If high diesel share was a prerequisite for low emissions we would expect to see those companies and
countries with the lowest diesel share having the lowest emissions. In fact, neither is true. Figure 23 shows countries with a high diesel share actually have higher new car CO2 emissions.
There is also no correlation between the diesel share of companies and new car CO2 emissions either, as
shown in Figure 24. The reality is that the high share of diesel has supported the shift to high performance cars and SUVs which are less fuel efficient.
75 T&E, Carmakers failing to hit their own goals for sales of electric cars, 05/09/2017 76 Spiegel Online, SUV-Boom wird für Hersteller zum Problem, 05/02/2016 77 ANE, SUVs will continue to dominate in Europe, 11/08/2017 78 The ICCT, European vehicle market statistics, Pocketbook 2017/18, 28/11/2017
Figure 23 – Market shares of diesel cars vs average CO2 fleet
emissions per member state in 2016
Figure 24 – Market shares of diesel cars vs average CO2 fleet
emission per carmaker in 2016

38
a report by
5.3. Lifecycle diesel emissions On a life-cycle basis, EU wide, diesel cars are actually higher emitting than equivalent gasoline cars.79 This
is because: diesels have higher embedded emissions, use high-carbon biodiesel, refining the diesel fuel requires more energy and diesels are driven a little more as the fuel is cheaper. Electric cars are significantly lower carbon, even taking into account the higher emissions in manufacturing and emissions from
electricity generation.80
The Dieselgate scandal has seriously, and
probably irreparably,
damaged the appeal of diesel cars after it exposed these as much
less clean than
previously claimed. It is a scandal entirely of the car industry's own
making, and their
cheating and deceit is the primary cause of the loss of consumer trust
along with the long
overdue action of cities
and governments to clean up the air.
Instead of making
inaccurate complaints that the diesel decline is
having a significant impact on CO2 emissions, carmakers should instead fit more efficient technology to new cars that would radically lower their emissions and fuel costs for buyers. 81 Furthermore, by taking
advantage of falling battery prices82 and providing more choice in plug-in vehicles, as well as marketing
these cars more aggressively, sales in electric vehicles will rise.83 It is time to end the misinformation that is endemic in the industry. Instead, carmakers should start providing and marketing the plug-in cars that are needed to tackle our toxic air and climate crisis, and which are fit for the 21st century.
5.4. Why selling more cars is not the way to lower CO2 emissions Carmakers’ first response to emissions legislation is usually to argue the costs are too high, cars will become more expensive and fewer people will buy them. They argue that accelerating fleet turnover (selling more
new cars) rather than tighter emissions controls will deliver the greatest environmental benefit. This section analyses this claim and considers whether faster fleet renewal is beneficial for the environment. It
specifically examines the emissions from vehicles on a lifecycle basis for both CO2 and NOx emissions to ascertain the optimum renewal frequency.
79 T&E, Diesel: the true (dirty) story, 18/09/2017 80 T&E, Electric vehicle life cycle analysis and raw material availability, 26/10/2017 81 BEUC, Making clean cars work for consumers in the 2020s, 05/05/2017 82 Bloomberg, The latest bull case for electric cars: the cheapest batteries ever, 05/12/2017 83 T&E, Carmakers failing to hit their own goals for sales of electric cars, 05/09/2017
Figure 25 – Comparison of life-cycle GHG emissions from an average EU diesel car and an average EU electric car depending on electricity mixes

39
a report by
Emissions from cars are usually measured in terms of g/km (CO2), with a focus on the tailpipe emissions of the vehicle per unit of distance driven. This only describes the environmental performance of cars when
used, under test conditions. Such an approach ignores the impact of the driver and their individual driving style, the distance really covered by the vehicle and the emissions to produce the fuel or the energy, to manufacture and to dispose of the vehicle.
Emissions also arise during the production process from the energy needed to extract the materials, through mining machinery, to transform the raw material to an industry-ready material (for instance, from bauxite – iron ore – to steel) and to process the material to assemble a vehicle. At the end of its life,
dissembling and recycling parts of the vehicle also require energy which generates emissions. Today, the production and disposal phases typically emit about 5tCO2 of GHGs compared to about 36tCO2 during its expected 15-year lifetime.
In order to calculate the emissions over the lifecycle of the vehicle, several assumptions have been made:
- The average CO2 fleet emissions from
new cars are based upon official test results
(NEDC) and sales compiled by the EEA until
2015.84 Emissions are assumed to improve to
reach 95gCO2/km in 2021, requiring an annual
improvement rate of 3.8%. This rate of
improvement is assumed to continue after
2020, ultimately leading to an average new car
that emits 20gCO2/km in 2060.
- Real-world CO2 emissions are based
upon the results described in T&E’s Mind the
Gap reports. 85 The average vehicle emitted
183gCO2/km in 2001 and 167gCO2/km in 2015,
meaning an annual improvement rate of 0.6%
per year. Real-world CO2 emissions have been
used in most scenarios in order to be as close
as possible to reality. Future projections are
based upon the work done by the ICCT and
Element Energy.86
- Several life-cycle analysis (LCA) studies
have calculated the carbon embedded in
vehicle manufacturing and disposal and show that producing vehicles emits approximately
4tCO2, while disposing of the vehicle emits around 1tCO2.87 As manufacturing techniques improve
and as power and energy carbon content decreases, such emissions from manufacturing also
decrease over time at an assumed 1% annual improvement rate, going from 5tCO2 in 2001 down
to 2.7tCO2 in 2060.
84 EEA, Monitoring of CO2 emissions from passenger cars – Regulation 443/2009, 2016 final database, 18/01/2018 85 Last report published: T&E, Mind the Gap 2016, 21/12/2016 86 The ICCT and Element Energy, Quantifying the impact of real-world driving on total CO2 emissions from UK cars and vans, for the
UK Committee on Climate Change, September 2015 87 Agence de l’Environnement et de la Maîtrise de l’Énergie (ADEME), Élaboration selon les principes des ACV des bilans
énergétiques, des émissions de gaz à effet de serre et des autres impacts environnementaux, November 2013
Figure 26 – Evolution of the average annual mileage versus the
vehicle age

40
a report by
- New cars are driven significantly further than older ones. Data from the Handbook of Emission
Factors for Road Transport (HBEFA) show that the mileage of a 10-year-old vehicle is about half
the one of a new car, as detailed in Figure 26.88
- However, in order to compare renewal rates, it is more appropriate to keep the annual mileage
constant and independent of the age of the vehicle. A case where the mileage reduces as the
vehicle gets older has nonetheless been explored, and annual mileage is reset when the vehicle
is renewed.
- The average age of vehicles currently in western Europe is about nine years old today. If a normal
distribution of vehicle scrappage is assumed, the expected lifetime of vehicles is about 18 years.
Figure 27 shows the optimum vehicle renewal frequency, taking into account the emissions incurred in both production and use. Three different scenarios are considered:
- Case 1 reflects the decrease in annual
mileage that is typically experienced as second
and third owners drive much less than the first
owner. In such a case,
vehicles would need to be replaced every 22 years to minimise
emissions. Most
vehicles are likely to
disappear from the
western European market before this time
– although some will be used in central and eastern Europe beyond 20 years. There is very
little difference in the
cumulative emissions in vehicles replaced after 15 and 25 years.
- Case 2 is the closest to the current situation, with modest improvement in production processes, and fuel economy improvement in line with real-world historical trends. In this case, vehicles would
need to be replaced every 19 years to minimise the CO2 emissions. Renewal rates less than 15 years would significantly increase emissions.
88 The Handbook of Emission Factors for Road Transport (HBEFA), Version 2.1, Released in February 2004
Figure 27 – Optimal renewal rate for a set of annual improvement rates

41
a report by
- Case 3 assumes that the reduction of
real-world emissions is in line with the trend happening in
laboratories, representative of a fast improvement. In this case, the optimal
replacement rate is 16 years but renewal rates below 13 years would lead to significantly higher
emissions.
- Case 4 is the most
optimistic and assumes a fast
improvement in both fuel economy needed
to reach the 2021 target on NEDC (and that vehicles follow such a trend once driven on the road) and an aggressive improvement in manufacturing emissions. In this case, vehicles could be
replaced every 13 years to minimise emissions.
The analysis shows that a significant increase in the rate of fleet renewal – as proposed by the car industry – would actually lead to an increase in lifecycle CO2 emissions.
Overall, a more intensive use of the vehicle and a higher annual improvement in fuel economy (and
manufacturing emissions) would reduce the optimal renewal frequency to reduce CO2 emissions, as shown in Figure 27. It shows that the optimal renewal rate never goes below 10 years regardless of the annual improvement rate. As annual improvement increases, optimal renewal rate goes down from 20 years to 18
years. Scrapping schemes that propose to dispose of vehicles older than 10 years lead to a net increase in
CO2 emissions over the lifetime of vehicles. The issue is different for NOx emissions from diesel cars where
there is a benefit from removing older and highly polluting vehicles from the fleet so long as the replacement cars are low or zero emission.
For conventional internal combustion engine-powered vehicles, opportunities to reduce the CO2 emissions
from the same vehicle over its lifetime are very limited. Upgrade or retrofit options are not usually possible and efforts to decarbonise fuels are very limited as indirect land use change effects make biodiesel more carbon intensive than diesel and limit the savings of ethanol. However, in the case of BEVs, the situation is
different as the carbon contained in the energy generation will fall significantly. BEVs are already highly
efficient (around 85%) compared to 25% for an internal combustion engine vehicle and future
improvements are largely reliant on decarbonising the electricity. BEVs are also more carbon intensive to manufacture and renewing the vehicle (including the battery) has a relatively high carbon penalty.
RAPID FLEET RENEWAL DOES NOT LEAD TO LOWER LIFECYCLE CO2 EMISSIONS – VEHICLE LIFETIMES AROUND 15-20
YEARS ARE OPTIMAL, CLOSE TO TODAY’S CARS.
Figure 28 – Optimum vehicle renewal frequencies for different scenarios

42
a report by
6. Why are we failing to tackle car CO2 emissions? To achieve the Paris Climate goals, transport emissions must be reduced by 94% from 2005 levels,89 but emissions are again rising. So why is progress so painfully slow? There are three underlying reasons:
1. Governments are, almost universally, unwilling to constrain the insatiable demand for mobility and,
in particular, car ownership. 2. The car industry looks upon emissions regulations as something to be circumvented by all possible
means rather than met fairly – and has successfully done this for decades. 3. The unhealthy political influence of the car industry has resulted in regulations that are not fit for
purpose.
6.1. The uncontrolled demand for mobility and car ownership Wider questions about the demand for mobility and car ownership are not the focus of this report. However,
the reluctance of governments to implement road pricing or constrain car use are telling. The Commission’s recent Eurovignette proposal 90 is an important development towards road pricing in Europe. The
Commission proposes to phase out time-based systems for cars across Europe so that member states would charge cars per kilometre from 2028. Furthermore, these tolls would need to be differentiated based on the environmental performance of the vehicle (both Euro and CO2 classes). If adopted, the Eurovignette
Directive would help to drive the uptake of cleaner vehicles and promote more efficient transport behaviour
(e.g. carpooling, modal shift, etc.).
But there remain strong incentives to encourage car ownership through generous company car tax allowances in many countries that are a de facto government subsidy to the car industry and are considered in Section 7. Whilst there are some positive signs in the form of a new focus on sharing cars and using
ridesharing services, the market in Europe is smaller than that in the US and China and often constrained by local regulations. Similarly, development of Mobility as a Service is also being held back by a refusal to
share data. The reluctance of governments to invest in mass transit solutions, buses and active transport
options also ensures the car remains the most convenient and attractive alternative in many locations,
including cities, where it does not need to be.
6.2. Cheating and manipulating test results T&E and the ICCT have highlighted the way the car industry manipulates emissions tests for both air
pollution and CO2 emissions in numerous reports. The skill and imagination of their engineers to find ways to reduce test results in laboratories, and now in on-road test, appears infinite.
The manipulation of test results ranges from: taking advantage of margins in testing procedures; to blatant misuse of poorly drafted test procedures (like removing parts to lightweight a car prior to test); through to
the illegal use of defeat devices and practices of detecting test cycles and controlling after-treatment
systems that is at the heart of the Dieselgate scandal.
The car industry has also focused on developing and deploying technology that operates far more effectively in a test than on the road. Stop-start technology that switches off the engine when the car is stationary is a good example. This has had a large impact on NEDC test results because the car is stationary
for nearly a quarter of the test.
89 T&E, Europe needs to slash its transport emissions by 94% by 2050 - Effort Sharing Regulation, 21/12/2016 90 European Commission, DG MOVE, Revision of the Eurovignette Directive 1999/62, Public consultation, 05/2017

43
a report by
A recent example of technologies designed for the test is cylinder deactivation, in which the car operates on less cylinders at low speeds and accelerations thereby consuming less fuel. Test cycles are usually fairly
undynamic in driving style – the NEDC is an extreme example of this, but the WLTP driving dynamics are also more passive than much real-world driving. This is an important reason the WLTP overestimates real-world fuel efficiency by over 20% (although the low share of urban driving compared to many car users is
also a contributor). The benefit of cylinder deactivation is seen in
Table 8 for the new Ford Fiesta and the current Volkswagen Golf. These versions of the Fiesta are very
sporty models, yet in
the test the 2018
model year achieves 114g CO2/km
compared to 140gCO2/km for the 2017 version. For the Volkswagen Golf, with the same variants, the benefit is lower at 7g CO2/km. But in practice such cars, especially the Fiesta ST, will be driven in a much more
dynamic way than during the test. The cylinder deactivation will not operate much of the time on the road and the emissions will be much higher. Indeed, the previous cylinder deactivation system by Volkswagen is
active for a range of torque until 100Nm, meaning half of what the engine is capable.91 This is not cheating
per se, but the deployment of such
technologies on cars where they are only likely to have a significant impact in the test, not on the road. This is a key weakness of the
car CO2 regulation that needs to be tackled –
and which the Commission proposal entirely fails to do. This highlights the importance of designing regulations without loopholes –
something both the Commission and
member states seem reluctant to do.
A further reason why the car industry has
been able to manipulate and cheat emissions
tests is the regulatory capture of the testing
and approval system that has been so exposed by the Dieselgate scandal. The ability of carmakers to select their own testing
services and Type Approval Authorities has
not been addressed through the
improvements to the Type Approval Framework Regulation. Neither was an
independent EU agency established.
However, there are many improvements to the way cars are tested and approved built
into the final regulation – although it will not come into force until 2020.
91 Volkswagen UK, Active Cylinder Technology (ACT), Mode of operation
Figure 29 – T&E’s map of manufacturers’ European facilities
Table 8 – Comparison of CO2 emissions from Ford Fiesta and Volkswagen Golf fitted or not with
cylinder deactivation – Note: FL means facelift

44
a report by
6.3. Political influence in member states and the European Commission Regulatory capture arises from the
political influence of carmakers over member states that are responsible for approving cars for sale. Globally, the
European automotive industry is 16%
bigger than agriculture and 12% smaller than the food and beverage industry. It also represents more than three times the
textile or steel and iron industry. The
automotive industry is a large employer that almost every country seeks to attract, and the industry has
manufacturing sites in almost every
member state. 92 Economic importance helps the industry achieve its political influence.
THE INFLUENCE OF THE CAR INDUSTRY HAS
SPREAD WELL BEYOND ITS TRADITIONAL
MANUFACTURING CENTRES IN FRANCE,
GERMANY AND ITALY TO BE ESPECIALLY
STRONG IN CENTRAL AND EASTERN EUROPE.
An analysis of the value added of the industry93 (and other sectors) with the national Gross Value Added
(GVA, i.e. GDP minus taxes)94 illustrates the economic importance to different countries. Figure 30 shows the economic weight of the automotive industry (including commercial vehicles, buses and trailers95 in
2015, the latest data available in Eurostat for all countries.) The figures explain the political influence of the automotive industry in Germany where the weight of the industry is 2.5 times bigger than the European
average. The German automotive industry is as economically important as the construction industry (a singularity in Europe shared with Hungary and the Czech Republic) and is almost three times bigger than
the food and beverage industry.
In other historical automotive countries like France, Italy and the UK, the weight of the industry is from one-third to a half respectively of the European average, showing a more diversified national economy compared to Germany. The weight of the automotive industry in Finland and the Netherlands is negligible
as these two countries have only one third-party manufacturer each to produce vehicles on behalf of OEMs.
92 Including engineering facilities, engine factories and assembly lines. Derived from manufacturers’ corporate websites, ANE, JAMA
and various press articles. 93 Eurostat, National accounts aggregates by industry, Latest update: March 2018. Note: the automotive industry is stated as
“Manufacture of motor vehicles, trailers and semi-trailers” in Eurostat, which also includes the production of parts and accessories 94 Eurostat, Annual national accounts, Reference Metadata in Euro SDMX Metadata Structure 95 Eurostat, NACE Rev. 2, Structure and explanatory notes
Figure 30 – Ratio of the value added of the automotive industry by the
total Gross Value Added per member state in 2015

45
a report by
The automotive industry has grown considerably in the Czech Republic,
Hungary and Slovakia, where the automotive industry’s economic weight is as important as, or even more so than, in
Germany. The current situation in Poland, Romania and Slovenia is close to the European average but it is expected to follow the same path as their neighbours
thanks to further local investments (Toyota and Fiat-Chrysler in Poland, Ford in Romania 96 ) and the opening of new factories (Mercedes-Benz and Volkswagen in Poland, Magna in
Slovenia97). The picture is even stronger
when the focus is made on direct
employment, as shown by Figure 31. Germany and countries from central and
eastern Europe have the highest shares, much above the European average.
Despite the biggest absolute value in terms of employment, Germany is behind
Czech Republic, Slovakia, Romania and
Hungary. The figure for Italy might be slightly underestimated because of the lack of employment data from
Fiat-Chrysler’s corporate website. Different countries are the focus of different OEMs and activities. Engineering facilities, regrouping design,
development and testing, are still mainly in the historical car producing countries of western Europe
(Germany, France, the UK and Italy). The industry in central and eastern Europe has been focusing so far on the manufacture of parts and vehicles, with the exception of Czech Republic and Romania thanks to the presence of a national carmaker (Škoda and Dacia respectively). As these two companies are owned by a
foreign OEM, it is also a way for the parent companies to outsource engineering for low margin applications
from their home bases.
Figure 32 shows the distribution of direct employment per OEM in each member state. This provides a good
indication of which companies are most influential where. The situation is predictable in Germany, France,
Italy and Sweden with influential domestic carmakers. But Volkswagen has huge influence in the Czech
Republic, Slovakia and Hungary. Renault in Romania and Jaguar-Land Rover (Tata), where it contributes a third of direct employment. The industry influence is more dispersed between different carmakers in Poland, although in Spain it is Seat (Volkswagen Group) that is the focus of national attention.
ECONOMIC IMPORTANCE ENSURES POLITICAL INFLUENCE
There are many recent examples of where carmakers have successfully exerted their political muscle over
member states to weaken environmental regulations. Notable recent examples include:
- 2008 – Germany and France push back the proposed 2012 limit of 130gCO2/km to 2015;98
96 Toyota’s press release (20/10/2016); Reuters (25/11/2016) and ANE (06/03/2017) for Fiat-Chrysler; Ford’s press release
(12/10/2017) 97 Press release from Mercedes-Benz (13/10/2016), Reuters for Volkswagen (18/03/2014) and ANE for Magna (05/10/2017) 98 Reuters, EU Commission welcomes Franco-German car CO2 plan, 20/07/2008
Figure 31 – Ratio of direct automotive employment by labour force per
member state

46
a report by
- 2013 – Germany weakened the 2020 car CO2 regulation, effectively securing a one year delay;99 - 2015 – Germany, France & the UK argue to double and delay the NOx limit for Euro 6 cars;100
- 2017 – Council opposed strengthening rules on testing and approving cars after Dieselgate.101 The political influence of the car industry also
extends to the upper reaches of the European Commission. The content of the recent proposal on post-2020 car and van CO2 regulations was significantly weakened at the last minute
following a call between President Juncker’s office and Matthias Wissmann, head of the German car lobby association (VDA).102 Notably the vans target was relaxed from 40% to 30% for 2030 – a target for sales and low- and zero-
emission vehicles became only an incentive.
99 T&E, ‘A weak cars CO2 deal better than no deal’, 01/12/2013 100 T&E, Governments double and delay air pollution limits for diesel cars, 28/10/2015 101 T&E, For Member States, Dieselgate never happened, 25/04/2017 102 T&E, Juncker’s early Christmas present to the car industry undermines climate goals, 08/11/2017
Figure 32 – Distribution of direct employment per OEMs’
parent company for a sample of member states

47
a report by
7. Conclusions and policy recommendations This report has examined CO2 emissions from cars and paints a depressing picture of policy failure. New cars are getting bigger and more powerful but the technology to ensure they are also more efficient has
simply not been deployed. For example, the number of models and sales of hybrid cars has stagnated. In the last 12 months the CO2 emissions measured on the official test (NEDC) have risen; but for more than five
years there has been no significant improvement in the emissions from new cars driven on the road. When the limited improvement in the efficiency of new cars is combined with increasing motorisation, the
inevitable consequence is rising CO2 emissions. However, the report also shows the key driver for progress on new car CO2 performance is EU regulation. Indeed, without the 2021 targets the planned model upgrades
and roll out of plug-in models would likely not take place. The industry’s proposed solutions,103 more diesels and faster fleet renewal (more sales), will deliver higher
profits but do little to tackle the climate crisis our cars are creating. This chapter proposes some of the solutions.
7.1. Electrification of transport Sales of new cars and vans with engines must end by 2035 to ensure that by 2050 the fleet is fully decarbonised. To achieve the Paris climate goals transport emissions must be reduced by more than 90%
and it is not currently feasible to fully decarbonise aviation and shipping by 2050, so this has to happen for
cars and vans.
Such a radical change cannot be achieved through incremental improvements to existing vehicles. There is a limit to the efficiency improvements possible with internal combustion engines and low carbon drop-in replacement fuels for oil, either advanced biofuels or synthetic fuels cannot, realistically, be produced in
the volumes needed to power all mobility.104,105 By 2030, advanced biofuels are expected to contribute about 3% of transport fuels and their growth beyond this date is likely to be constrained due to land availability.
To produce sufficient P2X fuels to power transport would require renewable electricity production 1.5 times
the size of the current EU-grid, due to its inefficiency. Instead, a transformation is needed in the way that
personal mobility is delivered, including a shift to electro-mobility. The gas industry recently forecast a huge
increase in gas-vehicles to represent 10% of new car sales by 2030. However, it cannot produce nearly enough bio-methane sustainably from wastes and residues to power a fleet of this size, and fossil gas is not an option if cars are to be decarbonised. It is a smokescreen to claim e-fuels (power to liquids/gas) or advanced biofuels can be produced in the volumes needed to power all transport. Therefore, these fuels
will be niche and their use must be directed towards aviation. In contrast, the price and performance of batteries will improve by around one hundred times between 2010 and the early 2020s. The range of new cars is increasing rapidly to 500km or more and, with ultrafast
charging, cars will be recharged in minutes. The electricity industry has committed to decarbonising
electricity and the price of renewables is falling – electric cars will become a complement to smart,
renewable grids.
But electric cars will only be bought if there is good choice, if they are available in showrooms to buy with a
respectable lead time, and if they are actively marketed and priced competitively.106 At present the car industry is failing in every key indicator. Just 20 battery models are presently available compared to over 400 with engines. Marketing spend is typically 1-2% of total spend – way below the level needed to promote
103 ACEA, Position Paper: European Commission proposal on post-2021 CO2 targets for cars and vans, 23/03/2018 104 T&E, A target for advanced biofuels, 06/06/2017 105 T&E, The role of electrofuel technologies in Europe's low-carbon transport future, 21/11/2017 106 T&E, Carmakers failing to hit their own goals for sales of electric cars, 05/09/2017

48
a report by
a new technology. You can’t see electric cars in most showrooms, salesmen are not incentivised to sell them, and you will wait more than six months for your new car – often much longer. Regulation is essential
to kick start the market. Section 3 showed this will happen in 2020 and 2021 as companies scramble to meet their CO2 targets and this is why ambitious targets for 2025 are also needed to continue to drive the shift to lower carbon cars.
7.2. Ambitious new car CO2 targets The European Commission’s proposal for 2025 and 2030 CO2 targets for cars and vans, announced in November 2017, was an early Christmas present for the car industry107 and fails in 3 key respects:
1. The 30% reduction from 2021 to 2030 is far below the trajectory needed to achieve the Paris goals. 2. The regulation fails to require the supply of zero emission vehicles – instead this is only incentivised,
weakening the already insufficient target 3.
3. There is no mechanism to ensure emissions reductions are delivered on the road – not just in the
laboratory – or that the 2021 baseline is not manipulated.
The following sections consider how to address each of these points.
7.2.1. CO2 targets post-2020
The Commission targets of a 15% and 30% reduction on 2021 levels by 2025 and 2030 respectively falls well
below a trajectory to meet the Paris Climate goals, for which a 60% 2030 reduction is required. The Commission impact assessment is flawed for several reasons:
- It is based on meeting 2030 climate targets that pre-date the Paris agreement and are insufficient
to meet this goal. It is estimated that 2030 targets need to be raised to more than 40% from 30% in the non-ETS sector at present to be on track.
- It is insufficient to enable western European and Scandinavian member states to meet their 2030
Effort Sharing goals since the flawed Commission modelling instead requires unfeasibly large cuts
in domestic emissions. - It assumes a significant improvement in CO2 emissions in the absence of future policy – as a result,
it assumes emissions in 2030 are much lower than in a more reasonable reference scenario.
These flaws in modelling assumptions are significant: to be on track to meet climate targets, a 60% reduction is needed by 2030 – double what is proposed. Such a massive reduction in emissions will require
a massive shift to zero emission vehicles by 2030. T&E is therefore proposing the following goals:
1. A 20% reduction in fleet average new car CO2 for each carmaker from 2021 to 2025, to apply to both cars and vans.
2. A 50-60% reduction by 2030 – the target to be reviewed in 2022 to allow sufficient lead time.
3. A 0gCO2/km target for 2035 to indicate to the industry the required direction and speed for
improvement.
The inclusion of a 2025 target is essential since it doubles anticipated carbon savings by 2030. In the absence of such a target, much less improvement is envisaged in new car and van CO2 emissions between 2021 and 2025 and, as a result, the fleet consumes substantially more fuel in 2030.
107 T&E, Juncker’s early Christmas present to the car industry undermines climate goals, 08/11/2017

49
a report by
7.2.2. Driving supply of zero emission solutions
Section 7.1 highlighted the importance of a shift to electro-mobility to ensure cars and vans are entirely
decarbonised by 2050 since none of the alternative options can scale to deliver the required volumes of renewable liquid or gaseous fuels sustainably. It is therefore important that the regulation drive the shift to zero emissions mobility.
The Commission proposal for a one-way adjustment is, in effect, a super-credit by another name, rewarding
carmakers who sell more than the equivalent of 15% ZEVs in 2025 and 30% in 2030 with a more relaxed CO2 target. There are several flaws in the Commission approach:
1. It does not require sales of ZEVs for 2025. Carmakers could achieve the equivalent of 81gCO2/km
(NEDC) without selling any ZEVs by deploying conventional hybrid models and other efficiency improvements.
2. It does not set a target for sales of ZEVs, only a reward for selling these vehicles in sufficient
numbers. There is no carrot to accompany the stick.
The Commission Impact Assessment proposed a better approach (that was changed at the last minute), a two way adjustment that would significantly improve the regulation. In this system carmakers achieving more than the 20% benchmark would be rewarded by a more relaxed fleet average value, while those who fail to meet the benchmark would be required to reduce fleet average emissions by more. Figure 33
illustrates a similar T&E proposal.
For 2025, T&E proposed to set a benchmark of 20% sales of low and zero emissions vehicles. Low
emission vehicles would be counted in the way proposed by
the Commission, with a ZEV
counting one and low emission
vehicles counting less than one,
up to a maximum emission of 50g CO2/km on WLTP.
Figure 33 illustrates that the proposed two-way adjustment would result in carmakers having
the equivalent of a target based on NEDC of between 70-80g
CO2/km close to the range originally proposed by the
European Parliament. Notably the dotted line shows the emissions (based upon NEDC) for ICE cars that are permissible as a result of reaching different levels of ZEV sales and the target to be met. This shows that
meeting the 20% target enables carmakers to produce cars with engines with average emissions of 95g
CO2/km. Selling more than 20% ZEVs allows these emissions to rise to 115gCO2/km (for 30% sales of ZEVs). This is generous compensation for those companies seriously trying to create a market for ZEVs.
7.2.3. Delivering emissions reductions on the road
The failure of the current regulation to deliver emissions reductions on the road is the biggest failing of the current regulation. The industry has achieved 21gCO2/km of weakening through test manipulation. The
Commission proposals to address this issue are weak and will be ineffective: a reporting system using fuel
Figure 33 – Proposed two-way adjustment establishing a target for low and zero
emissions vehicles for 2025

50
a report by
economy meters that will monitor the gap in the data from which the Commission proposes to review this in 2025. This is too late and can only respond to the problem rather than preventing it from occurring.
There is strong evidence that the gap between the WLTP test and real-world performance will grow from around 23% in 2020 to 31% in 2025. This will be driven by: increasing sales of plug-in hybrids; using special
test drive modes; air conditioning; transmission optimisation; using different tyres for testing than for real-world sales; etc. 108 To stop the gap widening, monitoring is not sufficient – enforcement is required. Enforcement can be achieved through setting a Not-to-Exceed Limit (NTEL) between the WLTP test value and the real-world emissions. Real-world emissions can be derived using either a real-world test, similar to
that implemented for NOx emissions and developed by T&E, FNE and PSA Group.109 In this case, either a real-world test would be derived by the European Commission based upon the RDE test and other existing real-world tests.110 The fleet average real world emissions for each manufacturer could then be calculated during Type Approval along with the WLTP values.
In the case of using Fuel Economy meters, the Commission proposal includes a requirement to report the
data and to review the gap in 2025, but do nothing to use the data to stop the gap growing. T&E proposes
that, in 2021, fleet average emissions are measured for all new cars on a real-world basis and the average real-world emissions calculated for each manufacturer.
Beyond 2021, carmakers would be required to ensure that the gap between their fleet average WLTP values
and fleet average real world emissions (measured using a real-world test and/or fuel economy meters) is constant or reduces (the gap could not increase). This has many benefits:
1. Carmakers could
not manipulate the baseline 2021 WLTP values using double testing or cars on the
NEDC and WLTP tests. This is
a serious risk as most carmakers plan not to use the CO2MPAS tool designed
for this purpose.
2. It encourages
carmakers to fit technology to the cars that delivers
savings on the road, not only
in the laboratory.
3. It prevents future manipulation of the WLTP test.
Figure 34 shows the approach. The gap between the real-world and WLTP values are fixed in 2021 and cannot grow after this. In the figure the forecasted additional gap (red arrow) would not be permitted to
develop.
108 The ICCT and Element Energy, Quantifying the impact of real-world driving on total CO2 emissions from UK cars and vans, for the
UK Committee on Climate Change, September 2015 109 T&E, A real-world fuel consumption test protocol developed by Groupe PSA, T&E, FNE and Bureau Veritas provides accurate
information for drivers, 05/09/2017 110 PSA Group, The PSA Group, NGOs T&E and FNE, and Bureau Veritas publish the protocol for measuring real-world fuel
consumption, Press release, 10/10/2016 and Emissions Analytics, EQUA CO2 Index
Figure 34 – Preventing manipulation of targets through real world measurements

51
a report by
Carmakers that failed to deliver the required emissions reductions on the road would need to reduce their
fleet average emissions more in the laboratory to make up the difference. For example, if the measured gap between WLTP and real-world performance in 2021 was 15%, and by 2021 this had grown to 20%, the manufacturer fleet average emissions would be uplifted by 5%. They would therefore need to reduce their
emissions by an additional amount in the laboratory or pay a penalty.
7.3. Road pricing and reform of vehicle taxation The Commission’s recent Eurovignette proposal111 is an important development towards road pricing in
Europe. The Commission proposes to phase out time-based systems for cars across Europe so that member
states would charge cars per kilometre from 2028. Furthermore, these tolls would need to be differentiated based on the environmental performance of the vehicle (both Euro and CO2 classes). If adopted, the Eurovignette Directive would help to drive the uptake of cleaner vehicles and promote more efficient
transport behaviour (e.g. carpooling, modal shift, etc.).
The early reaction from member states is not constructive as they seek to retain the ability to sell time-based annual/monthly stickers that have less administration but also fail to discourage unnecessary vehicle kilometres. Sticker systems (i.e. time-based vignettes) generate less revenue for member states and do not effectively address the issues of congestion, transport efficiency, or the uptake of cleaner vehicles. Member
states will need to move towards distance-based systems in the future as fuel tax revenue drops and the cost of car use declines as a result of more car sharing, as well as vehicle autonomy.
Member states could also help shift the market in favour of lower carbon vehicles and discourage unnecessary car ownership and use through taxation policies. Registration taxes based upon CO2
emissions, such as the French Bonus-Malus system, can be a strong driver to low and zero emission vehicles sales. But in many countries the charge is small or non-existent, and in few is it strongly graduated to
discourage gas guzzlers, as few finance ministries are willing to give money away, even to encourage good
behaviour.
In contrast, many countries have excessively generous company car tax schemes that operate when
individuals have private use of a company-provided car outside working hours. This is usually treated as a benefit in kind and often includes free fuel. The generous tax breaks widely offered, in effect, are a subsidy
to the car industry leading to more and bigger cars on the roads and encouraging them to be driven further.
The Organisation for Economic Co-operation and Development (OECD) 112 recently observed that
“environmental outcomes across the OECD would be greatly improved by ending the under-taxation of company cars, particularly the distance component”. Increased contributions to climate change, local air
pollution, health ailments, congestion and road accidents from the under-taxation of company cars in
OECD countries are estimated to cost €116 billion.
Vehicle circulation taxes in most countries comprise an annual fee and are widely graduated according to
a range of vehicle characteristics, including its CO₂ emissions. However, the level of tax paid is rarely sufficient to make a sizable impact in terms of encouraging the use of more fuel efficient models.
Recommendations on the reform of vehicle taxation will be part of a forthcoming T&E report.
111 European Commission, DG MOVE, Revision of the Eurovignette Directive 1999/62, Public consultation, 05/2017 112 Organisation for Economic Co-operation and Development (OECD), Environment Directorate, Tax benefits from company cars
52
a report by
7.4. Final thoughts Within the next 20 years, Europe needs to have sold its last new car with an engine if it is to decarbonise
cars and vans and have any possibility of meeting its Paris targets. The last 20 years have been spent largely encouraging efficiency improvements that have failed to even keep pace with the growth in motorisation. As a result, emissions are 20% higher than in 1990, in part because of a continuing preponderance of
investments in high, not low, carbon infrastructure.
The share of renewable transport fuels is minimal and most of those supplied to date (biodiesel) do more harm than good. Up to 2030, advanced biofuels and power to liquids will not make a sizeable contribution
and will be constrained in the medium term by land availability and renewable power to produce synthetic
fuels. We cannot continue with a failing policy of efficiency improvements only and unrealistically hope renewable liquid or gaseous fuels will be produced in sufficient volumes to power our cars and vans at some point in the future. Fortunately, electro-mobility is available now and the performance and cost of batteries
is improving rapidly. A cost-effective solution is in sight and Europe needs to seize the opportunity to be a
world leader in this emerging technology to preserve its important car industry. If developments in renewable fuels happen quickly the internal combustion engine may continue to play a role – but we should not lessen the support for e-mobility in the meantime.
There are no silver bullets. If we are to tackle CO2 emissions then efficient, low and zero carbon vehicle technology must be integrated with those for connected and shared vehicles to improve the efficiency of the road network. Measures to encourage use of public transport, walking and cycling are also crucial. We
need every tool to tackle CO2 from cars and vans, and must now prioritise the transformative changes that
can deliver the huge emissions cuts needed.