Co-Benefits Risk Assessment (COBRA) Health Impacts ... · What is COBRA? • • • The...
10
Estimating the Co-Benefits of Clean Energy Policies Co-Benefits Risk Assessment (COBRA) Health Impacts Screening and Mapping Tool: How COBRA Works Air Quality | Human Health | Societal Benefits September 2017
Transcript of Co-Benefits Risk Assessment (COBRA) Health Impacts ... · What is COBRA? • • • The...

Estimating the Co-Benefits of Clean Energy Policies
Co-Benefits Risk Assessment (COBRA) Health Impacts Screening and Mapping
Tool: How COBRA Works
Air Quality | Human Health | Societal Benefits
September 2017

What is COBRA?
•
•
•
The Co-Benefits Risk Assessment (COBRA) Health Impacts Screening and Mapping Tool is a peer reviewed screening tool that inexpensively and quickly estimates the air quality, human health, and associated economic impacts of various state- and county-level emission reduction scenarios.– The model estimates and maps the health effects and related
economic value of the effects by county for state, region, U.S.
COBRA is based on rigorous methods used by EPA health benefits assessments and adapted for use as a screening model.
COBRA enables users to obtain a first order approximation of costs and benefits of different emission scenarios that can be used to narrow a long set of promising options to a smaller list which can be evaluated using more sophisticated air quality models.
2
How Does COBRA Work?Users enter emissions
change(s) and discount rate for 2017 or 2025
- PM2.5, SO2, NOx, NH3, VOCs COBRA:
Quantifies Changes in Air Quality
- Uses a simple air quality model, the Source Receptor (S-R) Matrix, to estimate effects of
changes on ambient particulate matter.
link
Calculates Change in Health Outcomes
- Uses “canned” concentration response functions to the changes in particulate matter to
epidemiological studies1
Calculates Monetary Value
- Uses “canned” values based on willingness-to-pay, cost of illnesses , value of a statistical life
and direct medical costs.
Outputs = Tables and maps of illnesses and deaths avoided and
the related economic value.1 COBRA excludes benefits beyond particulate matter-related ones and may be conservative in that respect.
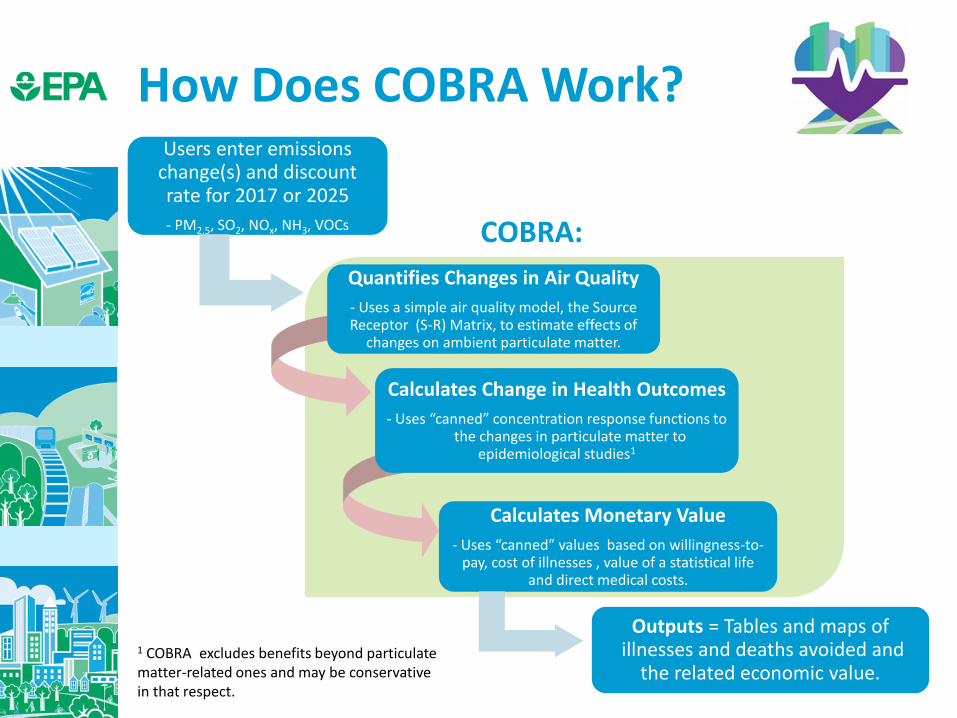
Human Health Effects in COBRA
• COBRA estimates the number of health incidences avoided AND the related economic value for the following: –
–
–
–
–
–
–
–
–
–
–
–
Adult Mortality,
Infant Mortality,
Non-fatal Heart Attacks,
Respiratory Hospital Admissions,
Cardiovascular-related Hospital Admissions,
Acute Bronchitis,
Upper Respiratory Symptoms,
Lower Respiratory Symptoms,
Asthma Exacerbations (attacks, shortness of breath, & wheezing),
Asthma Emergency Room visits,
Minor Restricted Activity Days,
Work Loss Days
4
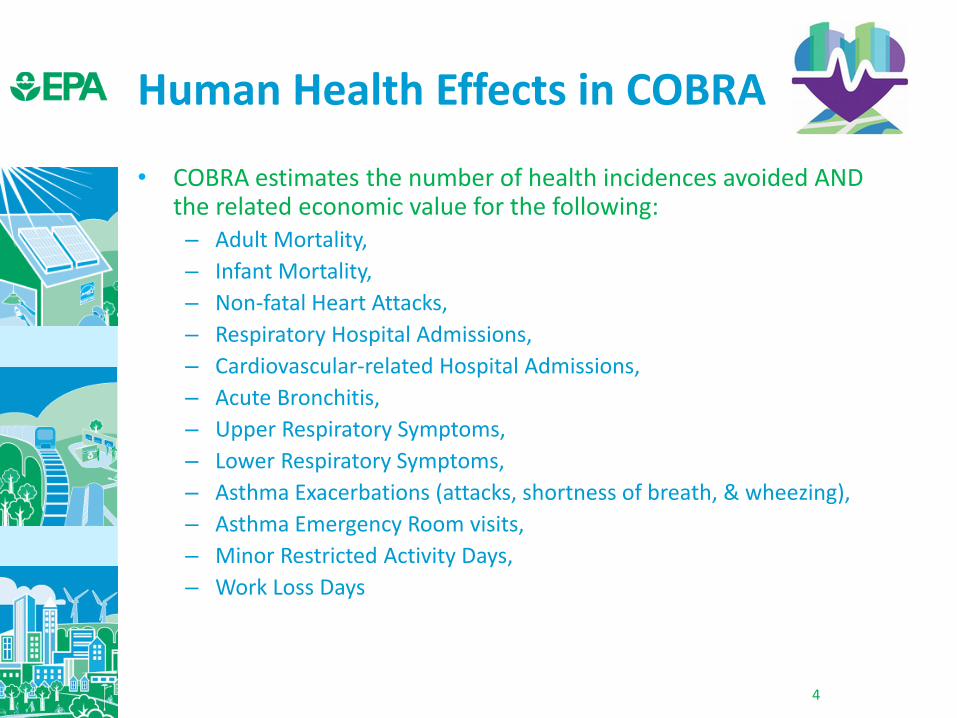
Economic Values of Effects in 2025: Unit Values
Health Incident AvoidedEconomic Value ($2010)
3% discount rate 7% discount rate
Adult Mortality $8,863,205 $7,894,316
Infant Mortality $9,879,048 $9,879,048
Non-Fatal Heart Attacks $33,259 - $263,795 $31,446 - $253,247
Hospital Admissions $19,741 - $40,358 $19,741 - $40,358
Asthma ER Visits $388 - $464 $388 - $464
Acute Bronchitis $485 $485
Respiratory Symptoms $21 - $34 $21 - $34
Asthma Exacerbations $58 $58
Minor Restricted Activity Days $69 $69
Work Loss Days $160 $160
5

Economic Values of Effects: Sources
Health Incident Avoided Source of ValueAdult Mortality Value of a Statistical Life (VSL)*Infant Mortality VSL*
Non-Fatal Heart AttacksCost of Illness (COI) = Direct medical costs, opportunity cost (OC)
Hospital Admissions COI = Hospital charges, OCAsthma ER Visits COI = Costs to the hospital
Acute BronchitisWillingness To Pay (WTP) = Coughing and chest tightness (CT) or restricted activity day
Respiratory SymptomsWTP = Symptoms such as coughing, head/sinus congestion, eye irritation, CT, coughing up phlegm, and/or wheeze
Asthma Exacerbations WTP = Bad asthma day
Minor Restricted Activity DaysWTP = Combination of coughing, throat congestion, and sinusitis
Work Loss Days WTP = Median annual earnings divided by (5 × 52)
* For more background on the VSL, see:
https://www.epa.gov/environmental-economics/mortality-risk-valuation 6
Strengths of COBRA
•
•–
–
–
•–
–
–
–
–
Enriches discussion of co-benefits and supports a balanced decision-making process that considers both the potential costs and benefits of policy choices.
Easy-to-Use screening toolRequires minimal inputs
Includes “canned” equations and approaches generally consistent with EPA practices
Detailed User’s Guide describes all assumptions and equations
Flexible for UserCan enter data for a single county, statewide, group of counties, outside of state, and/or group of states
Can enter reductions in absolute terms or as percentage change
Can import custom databases on emissions, population, and disease incidence, which allows the user to vary time timeframe for analysis
Can import custom equations (C-R functions, economic values)
Can save scenarios to reuse or modify later
7
Strengths of COBRA
•
•
•
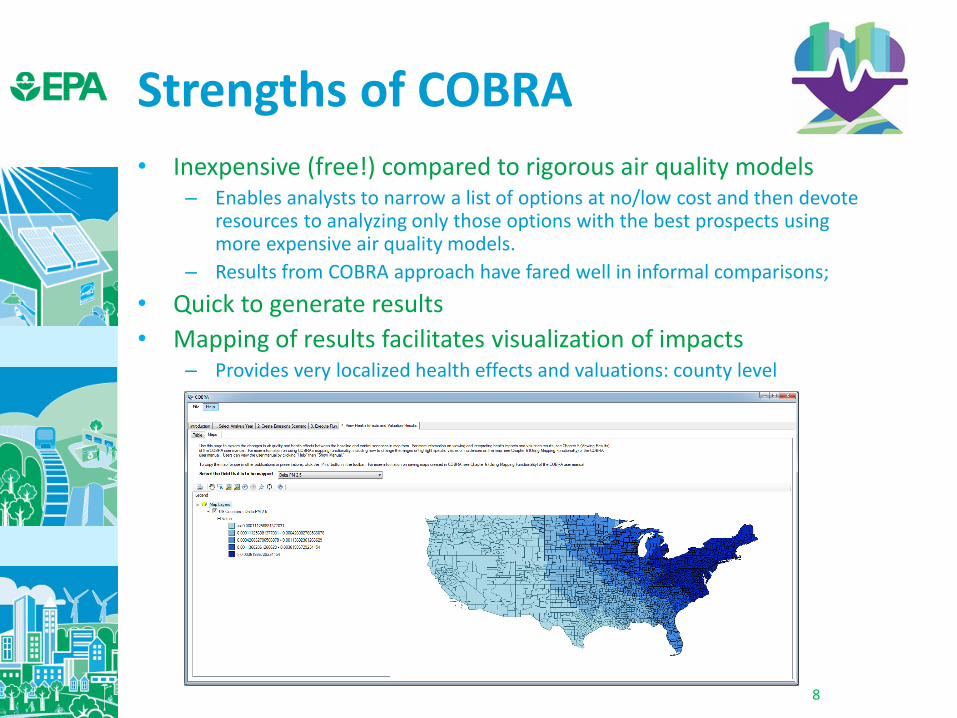
Inexpensive (free!) compared to rigorous air quality models–
–
Enables analysts to narrow a list of options at no/low cost and then devote resources to analyzing only those options with the best prospects using more expensive air quality models.
Results from COBRA approach have fared well in informal comparisons;
Quick to generate results
Mapping of results facilitates visualization of impacts– Provides very localized health effects and valuations: county level
8

Limitations of COBRA
•
•
COBRA is a free, screening tool not a highly sophisticated air quality model.–
–
Air Quality (AQ) model aspect of COBRA is “quick and dirty”• COBRA is best used as screening tool, followed up with
comprehensive AQ analysis and health impact assessment
Relies upon inputs generated elsewhere• Assumptions about statewide % reductions may be an
oversimplification
While there are limitations that users should understand, technical peer reviewers found COBRA to be “a valuable model that produces a screening tool that can contribute to policy analysis and public dialogue.”
9

How can I learn more?
Visit Our Website to find all of the documentation for COBRA and to download the model:
https://www.epa.gov/statelocalenergy/co-benefits-risk-assessment-cobra-screening-model
Contact EPA:Denise Mulholland
EPA State and Local Energy and Environment Program
(202) 343-9274 [email protected]
10