CO 2 reduction and energy efficiency in German road freight traffic © Willi Betz Dr. Jacques...
34
CO 2 reduction and energy efficiency in German road freight traffic © Willi Betz Dr. Jacques Leonardi MPI – Max Planck Institute for Meteorology, Hamburg, Germany [email protected]
-
date post
19-Dec-2015 -
Category
Documents
-
view
213 -
download
0
Transcript of CO 2 reduction and energy efficiency in German road freight traffic © Willi Betz Dr. Jacques...

CO2 reduction and energy efficiency in German road freight traffic
© Willi Betz
Dr. Jacques Leonardi
MPI – Max Planck Institute forMeteorology, Hamburg, [email protected]

Contents
1. Trends 2. Baseline survey3. Case study container transportation 4. Scheduling and telematics survey5. Research needs and policy
recommandations

Case Study Germany, Project NESTOR
• Duration: 7/2002-09/2005
• Aknowledgements: – Prof. Dr. Hartmut Grassl
– Michael Baumgartner, Dr. Ingo Möller, Oliver Krusch
– All the firms involved

1970 2001
Road
Short seashipping
Freight transport in EU-15 Modal performance in bn tkm/year Source: EU DG Tren (2004): Transport statistics
1200
1000
800
600
400
200
0
Rail
Inland waterways
Pipeline

Inland air traffic2%
rail traffic1%
Inland shipping1%
Passenger transport, road
67%
Road freight traffic 29%
CO2 emissions according to traffic sectors
Germany 2000 (Source: UBA 2003)

Fuel consumption trends in road transportation Germany 1991-2001(Source: DIW 2003)
0
10000
20000
30000
40000
50000
60000
1991 1992 1993 1994 1995 1996 1997 1998 1999 2000 2001
Passenger Transport
Freight Transport
mio. liter

NESTOR baseline survey & analysis
Objectives: - On site measurements of CO2 efficiency
- Identification/quantification of factors of influence
- Potential analysis
Sample and Survey:– 220 companies questioned (Feb.-May 2003)– 363 driver and 65 manager questionnaires sent– Responses from 38 companies = 46% returns– 168 driver datasets obtained (one dataset = one tank filling) – 153 valid datasets with complete coupled information on t, km, fuel
consumption and volume capacity utilisation as a %
Performance in sample Germany road freight 20001,668,193 tkm 347,000 million tkm
tkm = metric tonne × km sample / total = 1 / 219,000

CO2 efficiency in tkm / kg CO2
0
5
10
15
20
25
30
tkm
/kg
CO
2
least efficient transport0.81
most efficient transport: 26
transports with low efficiency (< 5 tkm/kg CO2)
are responsible for 6 % of total CO2 emissions,8,4% of km and 1,6% of tkm performance
mean CO2 efficiency: 10.4
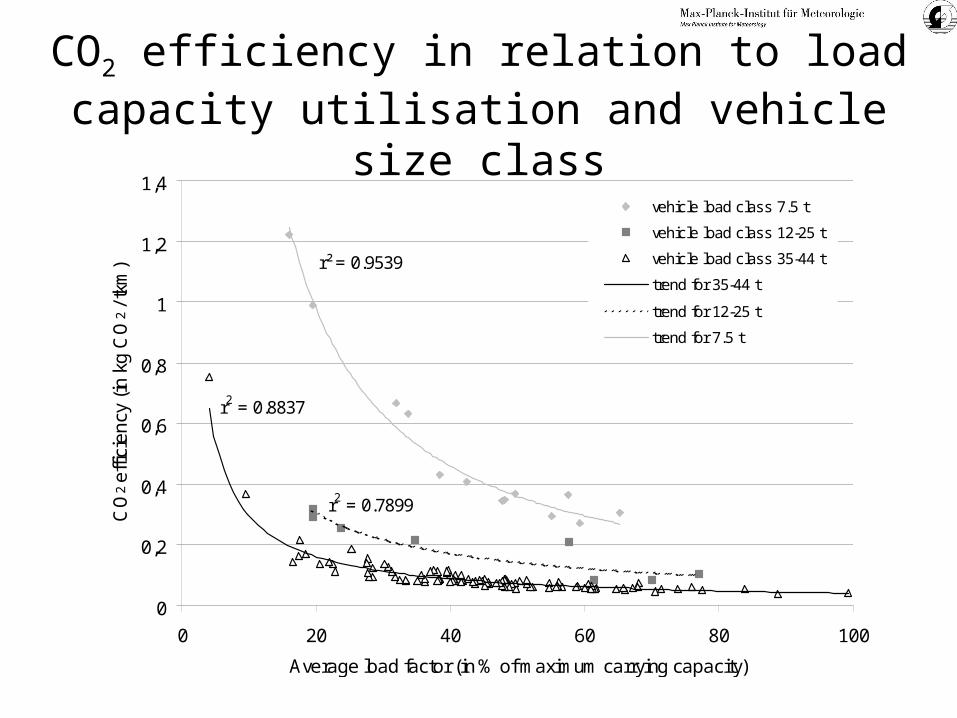
CO2 efficiency in relation to load capacity utilisation and vehicle size class
r2 = 0.8837
r2 = 0.7899
r² = 0.9539
0
0,2
0,4
0,6
0,8
1
1,2
1,4
0 20 40 60 80 100
Average load factor (in % of maximum carrying capacity)
CO
2 e
ffici
en
cy (
in k
g C
O 2
/ tkm
)
vehicle load class 7.5 t
vehicle load class 12-25 t
vehicle load class 35-44 t
trend for 35-44 t
trend for 12-25 t
trend for 7.5 t

Average CO2 efficiency per economic sectors
0
0,1
0,2
0,3
0,4
0,5
0,6
0,7
0,8
0,9
1
Parcel Serv. Container Trade Others Not specified Average
kg CO2/km kg CO2/tkm

Average CO2 emissions and size of companies
0,0
0,1
0,2
0,3
0,4
0,5
0,6
0,7
0,8
0,9
1,0
small <11 vehicles medium <51 large > 51 vehicles
kg CO2/km
kg CO2/tkm

Driver evaluation of volume capacity utilisation and CO2 efficiency
0
5
10
15
20
25
30
CO
2 e
ffic
ien
cy in
tkm
/ k
g C
O 2
0
20
40
60
80
100
Vo
lum
e u
tilis
atio
n r
atio
in %
-
CO2 efficiency in tkm / kg CO2
Mean volume utilisation in %

0
10
20
30
40
50
60
70
80
90
100
0 10 20 30 40 50 60 70 80 90 100
Volume
Gewicht
Utilisation ratio for volume and weight
High efficiency potential

Efficiency of vehicle use in freight transport
New indicator mass-kilometers (mkm) and new ratio tkm/mkm were defined as values for measuring efficient vehicle use (Evu).
To calculate Evu and tkm/mkm (mass-kilometers):
Evu = tkm/[(t2 + t1) × km]
t1 = payload
t2 = empty load

Efficiency of vehicle use (Evu)
0
5
10
15
20
25
30
vertically coupled vehicle data
tkm
pe
r kg
CO
2
0
0,1
0,2
0,3
0,4
0,5
0,6
0,7
tkm
/mkm
i
CO2-efficiency in tkm/kg CO2
Efficiency of vehicle use in tkm/mkm

Efficiency of vehicle use (Evu)
r2 = 0,8626
0
0,1
0,2
0,3
0,4
0,5
0,6
0,7
0 5 10 15 20 25 30
tkm/ kg CO2
tkm
/ m
km i

CO2 efficiency (E) is a factor strongly influenced by the
efficiency of vehicle usage (Evu), driver behaviour (d), speed
(s) and route (r) parameters.
E = Evu × d × s × r
In our sample, data from heavy trucks shows a high correlation (r²=0.91) for E and Evu.
CO2 efficiency and efficiency of vehicle use
(No systematically coupled data on “time“ and “financial“ efficiency available)
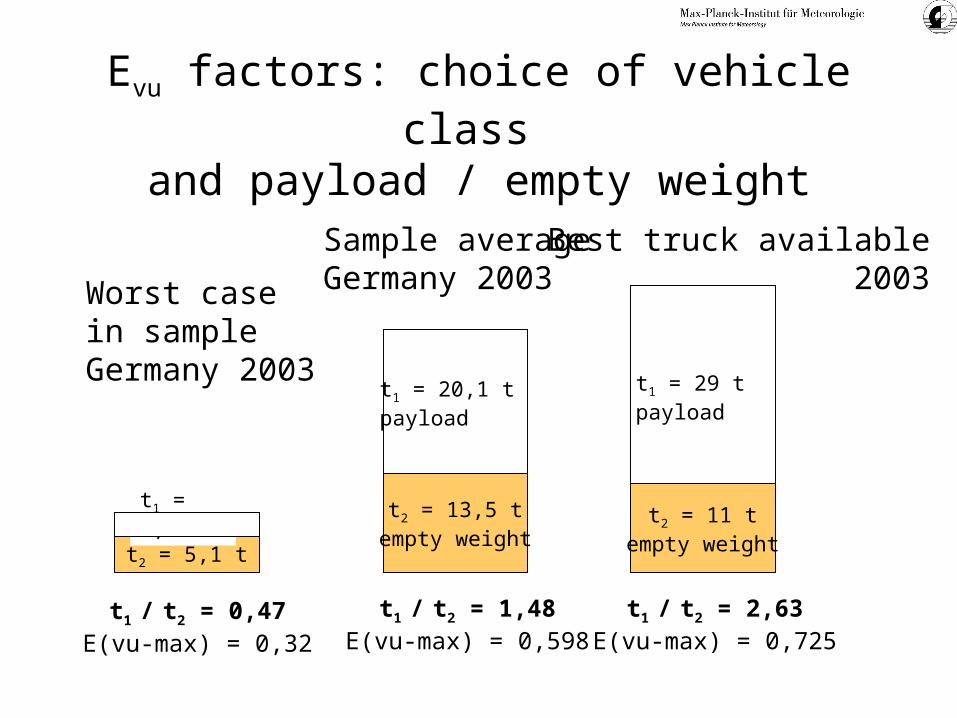
Evu factors: choice of vehicle class and payload / empty weight
t2 = 13,5 tempty weight
t1 = 20,1 t payload
t1 / t2 = 1,48E(vu-max) = 0,598
t2 = 11 tempty weight
t1 = 29 t payload
t1 / t2 = 2,63E(vu-max) = 0,725
Sample averageGermany 2003
Best truck available2003
t1 / t2 = 0,47E(vu-max) = 0,32
t2 = 5,1 t
t1 = 2,4 t
Worst casein sample Germany 2003

Implementation of existing CO2 reduction measures in 52 German road freight firms
measure type % of firms
Technical improvements 53.8
Driver training 51.9
Informal co-operation 40.4
Scheduling with IT 23.1
On-board systems 17.3
others 15.4
Shift to rail/ship 15.4
Scheduling with IT and telematics 9.6
Stacking area optimisation software 5.8
Formal co-operation 3.8

0
5000
10000
15000
20000
25000
30000
35000
40000
45000
< 0,2 0.2-0.25 0.25-0.3 0.3-0.35 0.35-0.4 0.4-0.45 0.45-0.5 0.5-0.55 > 0.550
10
20
30
40
50
60
70
80
Total distance in km (left scale)
Total performance in tonne-km (/10) (left scale)
Total CO2-emissions in kg (left scale)
Efficiency of vehicle use in tkm/mkm (x100) (right scale)
CO2-efficiency in tonne-km per kg CO2 (right scale)
Classes of efficiency in vehicle use, in tkm/mkm
mkm = (empty load + payload)*km
Potential for improving efficiency (1)

Potential for improving efficiency (2) and decoupling emissions from GDP
• Assumption: If all companies below 0.5 tkm/mkm mean were to implement efficiency measures, they could reach the mark of 0.5– Best company in survey has an average mark of 0.56– e.g. lightest vehicle for parcel delivery: 11 t
and load factor: 70% (=German average 2003) 0.5
• Result:Potential overall reduction of CO2 emissions (and fuel use) of 20.8% for heavy trucks

Fuel consumption in short and long haulage Case study Hamburg, container hinterland traffic
0
5
10
15
20
25
30
35
40
short haulage trucks long haulage trucks
19 companies, market share 38%, mean values for 2002
l/100km

Fuel costs in short and long haulage Case study Hamburg, container hinterland traffic
• short distance– 10-15% of total annual costs
• long distance– 10-30% of total annual costs

Container transportation chain (1) Physical transport harbour - hinterland
upstream / downstreamfrom / to the HINTERLAND
Container packing station
Port stack areaFull Container
Load
Container depot
Kai
Sea-Sea Transhipment center
OverseasContainer
Ports
EU Short SeaPorts
Shipper
Recipient
HARBOUR areaLandSea

Sea Transport Land Transport
Port System ForwardingRecieving
ShipperRecipient
Terminal Operators
Agent
ShipOwner
Carrier
Traditional organisation form
Actual integrated forms
Agent
TerminalOperators Shipper
Recipient Carrier
ShipOwner
Container transportation chain (2) Information and control

Scheduling andtelematics survey
Objective: Quantify impacts on transport efficiency and CO2 efficiency in German trucking companies in 2003
© Mercedes Fleetboard gmbH

Survey design and sample
79 firms with IT system questioned. Not including firms with major changes in efficiency as a result of other measures such as goods change, co-operation etc.
7 respondents with all needed data + 11 companies with IT schedule but partial data
7 companiesPerformance: 36 million km and 1.1 million t /year Fuel consumption: 12.5 million liter /year Market share: about 0.5 % of total German road freight transport 2002

Effect of IT scheduling on t, km and fuel use
Sample with ITscheduling
ReferenceGerman mean 30-40 t trucks
94
96
98
100
102
104
106
108
110
Before After
94
96
98
100
102
104
106
108
110
2000 2001
Total load (t)Total distance (km)Total fuel use (l)Mean fuel use (l/100km)
% changes

3 types of scheduling systems in use
• Manual scheduling without IT• IT based scheduling• IT based scheduling with telematics
for data communication and routing
• indicators tkm/mkm or CO2/tkm missing need for further R&D

Advantages offered by IT based scheduling system
• Enhances the transparency of companies and vehicle activities
• Functions as management information system • Allows higher vehicle capacity utilisation rate• Reduces average transport distance• Helps identify less profitable clients• Accounts the real origins of variable costs

Perceived advantages of an IT based logistic scheduling system with telematics
• Couples fuel consumption, mileage, vehicle, driver and time data
• Further increase of the vehicle capacity utilisation rate NEVER perceived: additional payload gains
• Further reduction of mean trip distance with routing information
• Reduced information transfer errors (codes etc.)• Improved driver training• Control of drivers

Necessary research into the factors influencing fuel consumption and transport efficiency
Vehicle Empty loadEURO NormTruck body components weightOther technology (tyres, oil, etc.)Fuel type (bio-diesel)Load class, age etc.
Organisation, Payload and payload factorlogistics Hauling capacity and traffic volume
Management decisions, service quality etc.Constraints, barriers such as time, finance, etc.
Road, trip and route Road type (highway, etc.)GradientItinerary choice, IT scheduling
Traffic Free traffic, traffic congestion, etc.Speed
Driver Driving behaviourVerification of maintenance
Weather Temperature, wind, precipitation
Instruments and measures proposed for decoupling road freight transport impacts and
economic growth
• Facilitate implementation and diffusion through enhanced market transparency would enable decoupling from GDP
• Incentives for CO2-efficient companies/drivers (?)
• Research on further technology effects on efficiency• Design a new policy approach for facilitating non-
technological efficiency measures in logistics (?)

Conclusions
• The level of efficiency is lower than expected • Increased fuel efficiency is a logistic challenge
• 20 % CO2 reduction is potentially feasible for heavy trucks in Germany


![[Jeffie Betz] Playing Piano](https://static.fdocuments.us/doc/165x107/577cd07b1a28ab9e78925f4b/jeffie-betz-playing-piano.jpg)