CNMP Elements and MMP - Home | NRCS€¦ · Bermuda Triangle. Let’s Take A Look At The Program....
70
CNMP Elements and MMP Jeff Porter Environmental Engineer Manure Management Team Greensboro, NC
Transcript of CNMP Elements and MMP - Home | NRCS€¦ · Bermuda Triangle. Let’s Take A Look At The Program....

CNMP Elements and MMP
Jeff PorterEnvironmental Engineer
Manure Management TeamGreensboro, NC

Potential Acres Available for Nutrient Management Planning
Cropland 400 million acres
Grazingland 525 million acres
Forestland 400 million acres
(over 257,000 AFO producer plans)

Required Elements
1. Background and Site Information2. Manure and Wastewater Handling and
Storage3. Farmstead Safety and Security4. Land Treatment Practices5. Soil and Risk Assessment6. Nutrient Management7. Record Keeping8. References

Optional Elements
1. Feed management
2. Other utilization
3. Air quality

-Example CNMP –What the example plan IS and IS Not
This example plan is a STARTING point !
This example plan is NOT perfect !
This plan IS a teaching tool.
This plan is based on a REAL facility.
This plan (like all CNMPs) is DYNAMIC !

Conservation Planning Process
Working Toward an RMS
Conservation Plan
Soil ErosionWaterQuality
RMS
CNMP
Soil
Water
Air
Plants
Animals
Humans

Let’s Take A Look At The Plan

CNMPFormat
Technical Criteria

Table of ContentsSection 1. Background and Site Information1.1. General Description of Operation1.2. Sampling, Calibration and Other Statements1.3. Resource Concerns

Section 2. Manure and Wastewater Handling and Storage2.1. Map(s) of Production Area2.2. Production Area Conservation Practices2.3. Manure Storage2.4. Animal Inventory2.5. Normal Mortality Management2.6. Planned Manure Exports off the Farm2.7. Planned Manure Imports onto the Farm2.8. Planned Internal Transfers of Manure
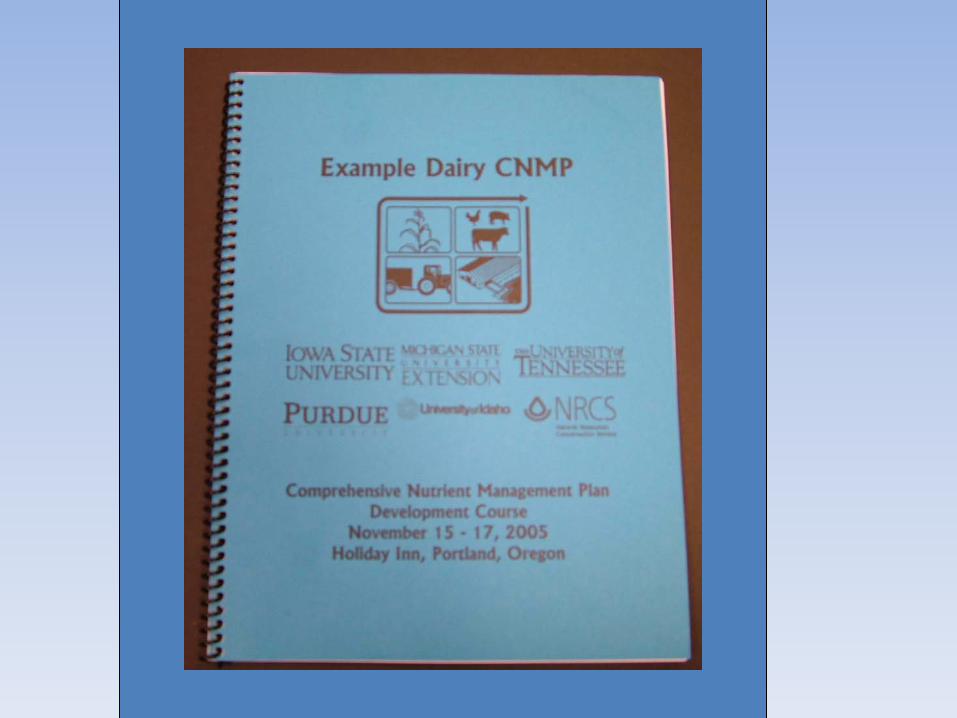
Section 3. Farmstead Safety and Security3.1. Emergency Response Plan3.2. Biosecurity Measures3.3. Catastrophic Mortality Management3.4. Chemical Handling

Section 4. Land Treatment4.1. Map(s) of Fields and Conservation Practices4.2. Land Treatment Conservation PracticesSection 5. Soil and Risk Assessment Analysis5.1. Soil Information5.2. Predicted Soil Erosion5.3. Nitrogen and Phosphorus Risk Analysis5.4. Additional Field Data Required by Risk Assessment Procedure

Section 6. Nutrient Management6.1. Field Information6.2. Manure Application Setback Distances6.3. Soil Test Data6.4. Manure Nutrient Analysis6.5. Planned Crops and Fertilizer Recommendations6.6. Manure Application Planning Calendar6.7. Planned Nutrient Applications6.8. Field Nutrient Balance6.9. Manure Inventory Annual Summary6.10. Fertilizer Material Annual Summary6.11. Whole-Farm Nutrient Balance

Section 7. Feed ManagementSection 8. Other Utilization OptionsSection 9. Recordkeeping Forms (see Producer Activity document)Section 10. References10.1. Publications10.2. Software and Data Sources
Producer Activity DocumentFormat
Technical Criteria
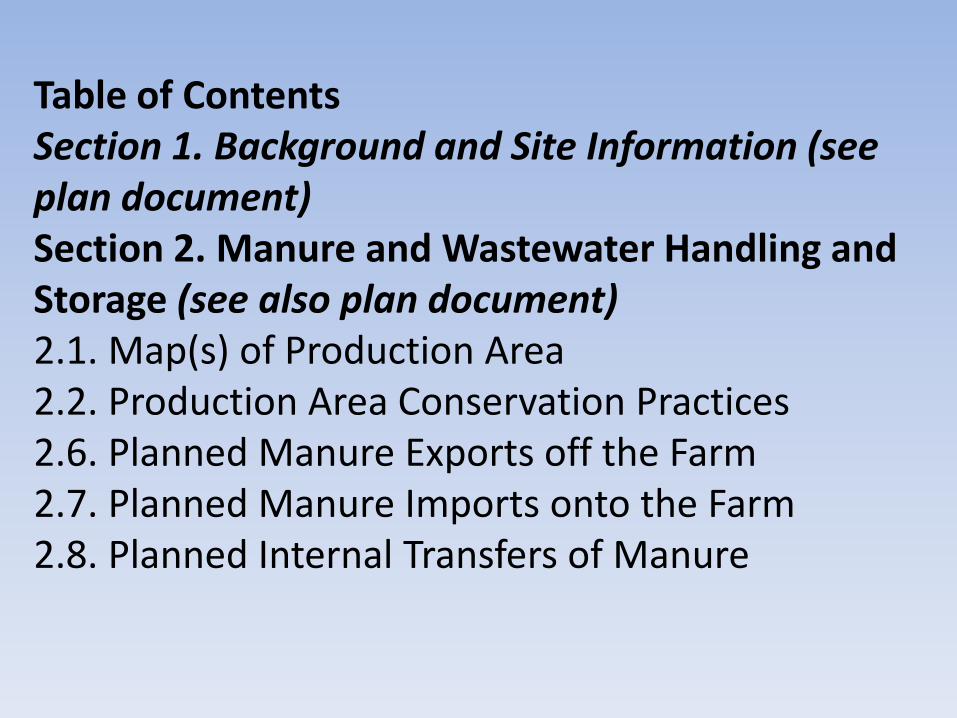
Table of ContentsSection 1. Background and Site Information (see plan document)Section 2. Manure and Wastewater Handling and Storage (see also plan document)2.1. Map(s) of Production Area2.2. Production Area Conservation Practices2.6. Planned Manure Exports off the Farm2.7. Planned Manure Imports onto the Farm2.8. Planned Internal Transfers of Manure

Section 3. Farmstead Safety and Security (see also plan document)3.1. Emergency Response Plan3.2. Biosecurity Measures3.3. Catastrophic Mortality ManagementSection 4. Land Treatment (see also plan document)4.1. Map(s) of Fields and Conservation Practices4.2. Land Treatment PracticesSection 5. Soil and Risk Assessment Analysis (see plan document)

Section 6. Nutrient Management (see also plan document)6.1. Field Information6.2. Manure Application Setback Distances6.6. Manure Application Planning Calendar6.7. Planned Nutrient Applications6.10. Fertilizer Material Annual SummarySection 7. Feed Management (see plan document, if applicable)Section 8. Other Utilization Options (see plan document, if applicable)

Section 9. Recordkeeping Forms9.1. Producer Activity Checklist9.2. Inspection/Monitoring Records9.3. Crop Records9.4. Manure Application Records9.5. Commercial Fertilizer and Irrigation Water Application Records9.6. Manure Exports off the Farm9.7. Manure Imports onto the Farm9.8. Internal Transfers of Manure9.9. Other Records Required by the StateSection 10. References (see also plan document)10.1. Publications


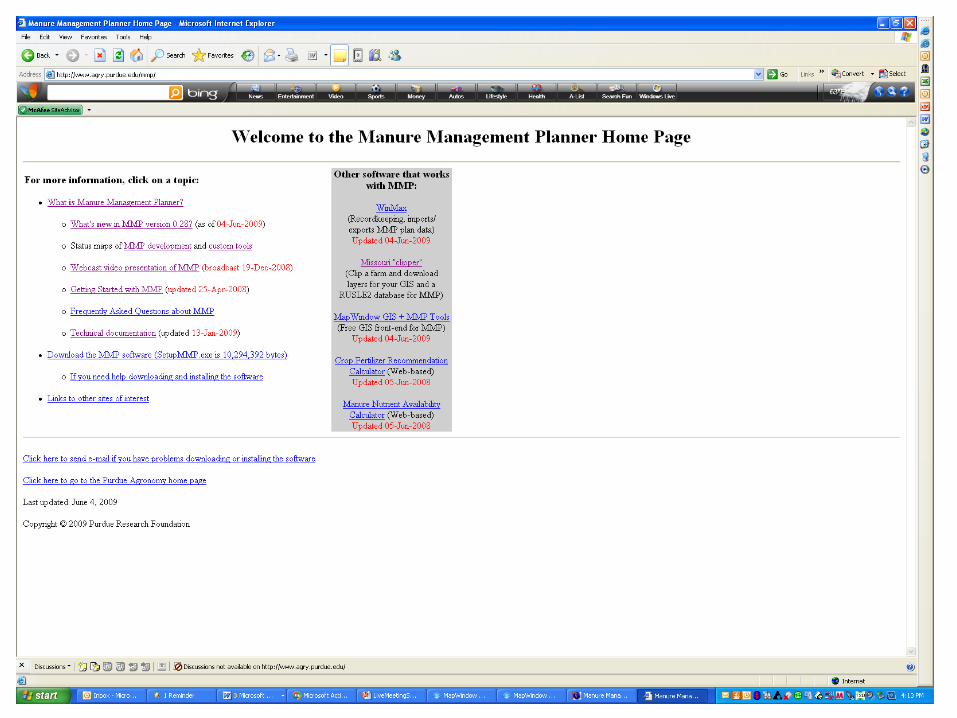
http://www.agry.purdue.edu/mmp/
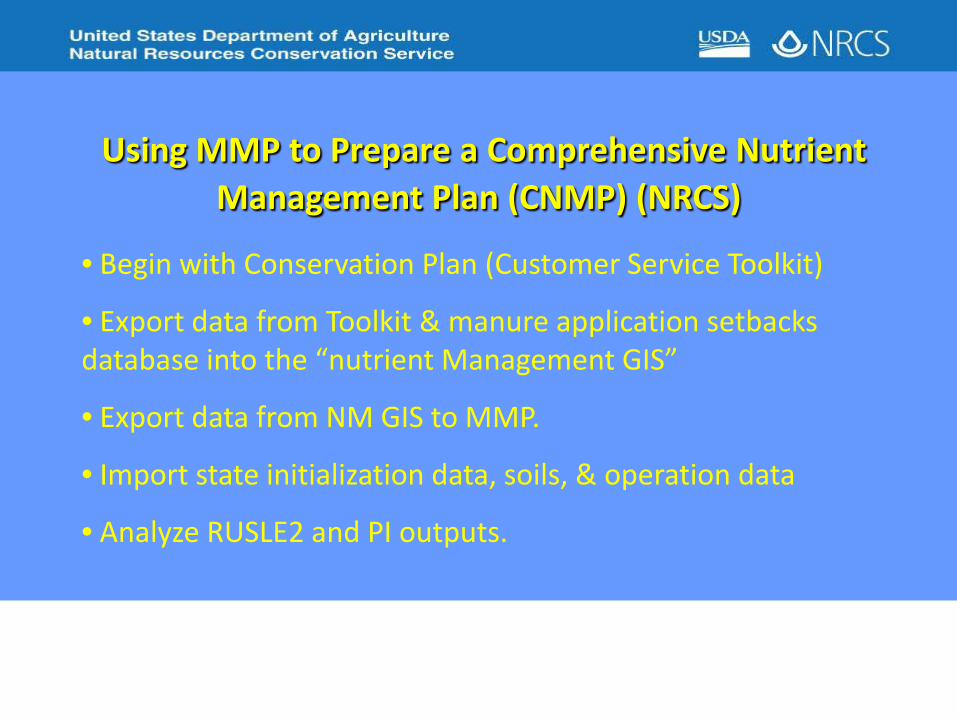
Using MMP to Prepare a Comprehensive Nutrient Management Plan (CNMP) (NRCS)
• Begin with Conservation Plan (Customer Service Toolkit)
• Export data from Toolkit & manure application setbacks database into the “nutrient Management GIS”
• Export data from NM GIS to MMP.
• Import state initialization data, soils, & operation data
• Analyze RUSLE2 and PI outputs.
Using MMP to Prepare a Comprehensive Nutrient Management Plan (CNMP) (NRCS)
(continued)
• Review and make needed adjustments to the conservation plan.
• Update exports to NM GIS (GNT) and MMP.
• Generate reports using the National/State templates.
• Archive reports and data in the customer’s Toolkit folder
Using MMP to Prepare a Comprehensive Nutrient Management Plan (CNMP) (NRCS)
Note: Development of the CNMP is not an exact sequenced movement through the “nine steps of planning”.
The steps must be revisited as more data is brought into the consideration until a nutrient plan is developed that:1. Meets all policy requirements2. Is feasible for the operation and the producer’s objectives
Note: Treating resource needs not required by the CNMP is important. However, these treatment measures should be addressed through the conservation plan only and not be imported into the CNMP.
Developing of CNMPs by TSPs
• TSPs will use “clipper” to generate maps.
• TSPs will export data to a commercially available nutrient management GIS program for plan development.
• Export data to MMP and generate reports.
• The TSP will provide an electronic copy of the CNMP and the database to NRCS which will be archived in the customer’s Toolkit folder.

Toolkit(ArcGIS)
Aerial photo,resource inventory data
(Clipper)
NM GIS
Conservation plan’s field boundaries, conservation practices, and FSA IDs
State-specific manure application setbacks
MMP
Producer field ID’s, total and spreadable acres, soil ID’s
Operation’sCNMP, NM Plan, etc. National Templates
(Word)
Output products
State specific requirements and/or templates
(Word)
State initialization data, soils, operation data
StatePI
RUSLE2
Risk Assessment data
“Streamlined”Nutrient Management Plan
Data & Development Workflow
Rev. 07/10/09
Conservation plan practices and narratives from Toolkit via
.xmlAWM
Bermuda Triangle

Let’s Take A Look At The Program

Is my livestock or poultry operation concentrating nutrients on the farm?
What is the underlying cause of nutrient concentrations?

Sustainable Nutrient Management
• 4 R’s of Nutrient Management1. Right form
2. Right Amount
3. Right time
4. Right placement
• Account of all source of nutrients in nutrient budgeting.
• Maintain cover to cycle nutrients.
• Manage grazing for uniform deposition of wastes.
• Control erosion and runoff.

Soil and Risk Assessment Components
• Soil Information
• Predicted Soil Erosion
• Nitrogen and Phosphorus Risk Analysis
• Additional Field Data Required by Risk Assessment Procedure(s)

Any State required risk assessment necessary for CNMP development shall be included to document the relative
risk of nutrient loss to the environment.

Risk Assessment
• With data collected, need to analyze the data to understand the risks.
– Some risks may be obvious, such as direct runoff into streams.
– Other risks, such as threats to ground water, may be less obvious.
• Many assessment tools areavailable to help determinethe risks of land applyingnutrients.
Soil Information
• Customer Service Toolkit
• Web Soil Survey
http://websoilsurvey.nrcs.usda.gov/app/WebSoilSurvey.aspx
• Soil Data Mart
http://soildatamart.nrcs.usda.gov/

Soil Erosion Assessment
• Water – Sheet and Rill Erosion – RUSLE2
• Water – Concentrated Flow (Gully)- Visual
• Wind – Currently WEPS

Whole Farm Nutrient Balance
FarmBoundary
Nutrient Imbalance(inputs - outputs)
Inputs ManagedOutputs
Feed
Animals
IrrigationWater
Fertilizer
Legume N
Meat/Milk/Eggs
Crops
Manure
Gas Emissions
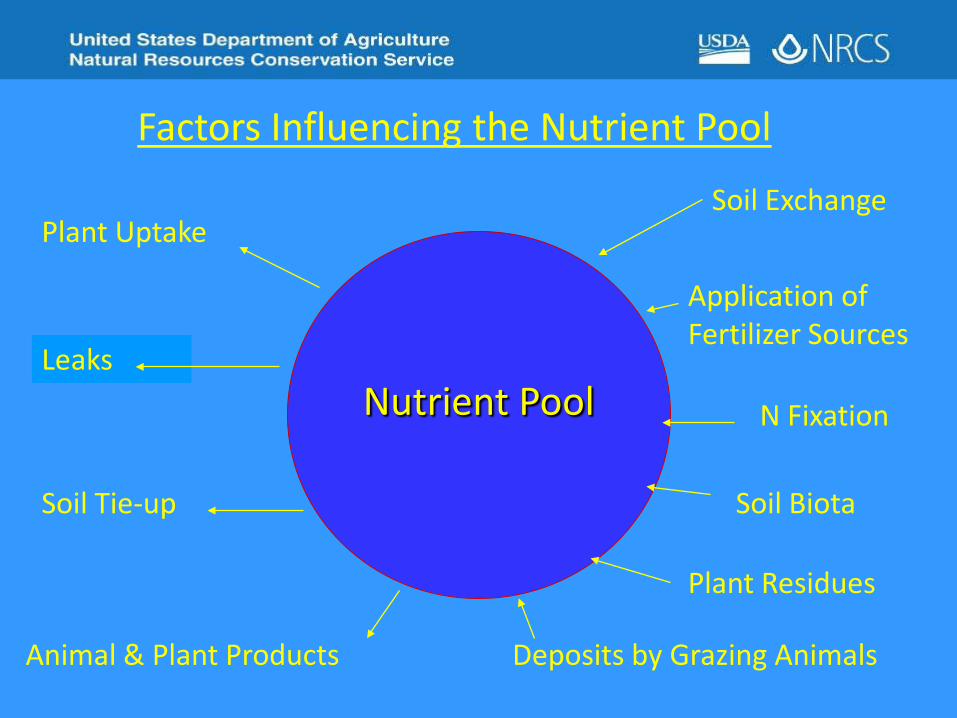
Nutrient PoolLeaks
Plant Uptake
Soil Tie-up
Plant Residues
Animal & Plant Products Deposits by Grazing Animals
Application of Fertilizer Sources
N Fixation
Soil Exchange
Factors Influencing the Nutrient Pool
Soil Biota

Risk Assessment
• P Management– Varies from state to state.
» P-Index
» P threshold levels
» Agronomic soil test P levels.
– P-Index reflects the potential for P movement or loss from a field.
– The answer from the P-index determines the maximum P application rate and/or the practices necessary to mitigate the risks from P application.

Risk Assessment
• Nitrate leaching index
• Available through RUSLE2
• Uses Data from the Climate Database and the Soils Database
Nitrate Leaching and Economic Analysis Package
(NLEAP)
A moderately complex field scale model that assess the potential for nitrate leaching under agricultural fields.

Corn Silage Wheat Cover ForageJanuary FebruaryMarch AprilMay June JulyAugustSeptemberOctoberNovemberDecember
Example Dairy Cropping System
Plant
Plant
Application
Application
Application
Application
Burn Down
ActiveGrowingPeriod
Harvest

Sources of Nutrients for Plant Growth
• Plant Residues
• Nitrogen Fixation (Legumes)
• Waste from Grazing Animals
• Soil Reserves
• Inorganic Fertilizers
• Manures and Other Organic Fertilizers
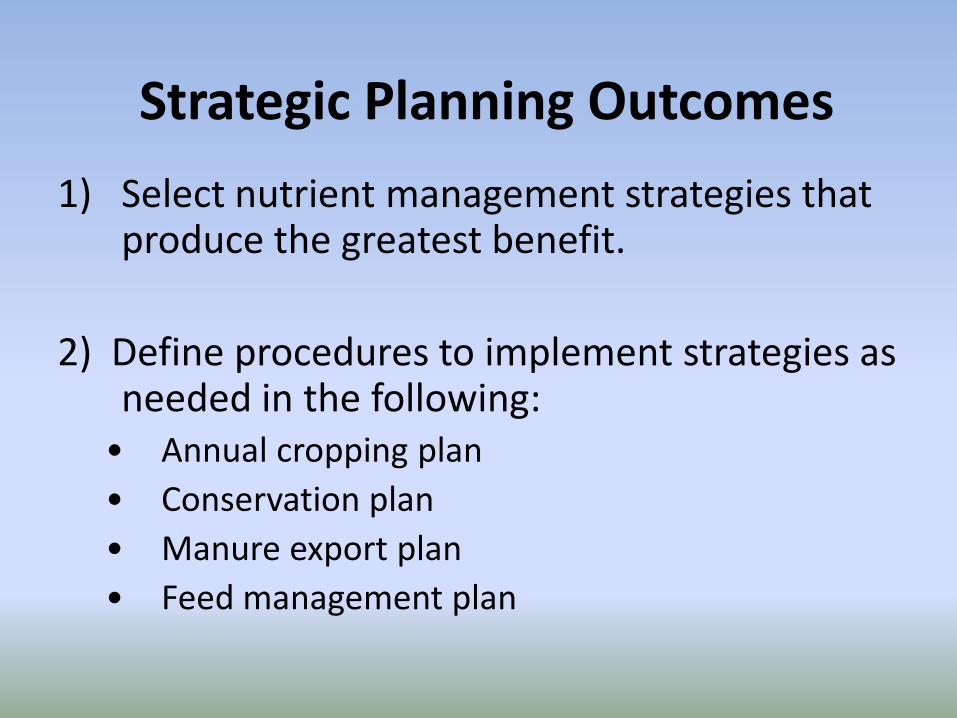
Strategic Planning Outcomes
1) Select nutrient management strategies that produce the greatest benefit.
2) Define procedures to implement strategies as needed in the following:• Annual cropping plan• Conservation plan• Manure export plan• Feed management plan

Strategic Planning Methods
Mass Balance
Nutrient Generation Estimates
Manure Analysis Records

Mass Balance Approach
Probably best approach
Difficult to do on nitrogen
Works well with phosphorus

Nitrogen Mass Balance
NO3 Losses
NH3 EmissionsN2O Emissions
N2 Emissions

Soil Organic
Nitrogen
Ammonium
NH4N+
Nitrate NO3-
Leachin
g
Manure
Ammonia gas
Fertilizer
MineralizationNitrification
Runoff
Nitrogen gas
Decomposition
Immobilization
Fixation
Den
itrification
Soil -
Soil-
Source: Nitrogen in the Environment, IB 218 Cornell

Phosphorus Mass Balance
Phosphorus conserved within system
Imbalance observed as increasing soil P levels;
Losses - Runoff is most likely; Leaching possible under some situations;

Nutrient Management
Components
• Whole Farm Nutrient Balance
• Field Information
• Manure Application Setbacks
(Spreadable acres in each field)
• Soil Test Data

Nutrient Management
Components (cont.)
• Manure Nutrient Analysis
(Nutrient and Moisture Content)
(Losses & mineralization Considered)
• Planned Crops and Fertilizer Recommendations(Based on reasonable yield expectations)
• Manure Application Planning Calendar
• Planned Nutrient Applications

Nutrient Management
Components (cont.)
• Field Nutrient Balance
1. Accounts for all sources of nutrients (e.g. crop residues, legume credits, starter fertilizer and other fertilizer applications, cycled by cover crops, irrigation water, etc.)
2. Time of nutrient need (App.Windows)(crop specific)
• Manure Inventory and Annual Summary(Includes additions to storage, transfers, imports & exports)
• Fertilizer Material Annual Summary

Approaches to Nutrient Budgeting
• Nitrogen Based
• Phosphorus Based
• Crop Removal
• Multiples of Crop Removal Rates
• Irrigation Limited
• In-season adjustments

Agronomic Rates
vs.
Crop Removal

N Recommendations
• For each combination of crop, yield, soil and field conditions, there is an optimum N rate
• Traditional soil tests have NOT tested for N
– Recommendations based on crop and yield goal
– Follow state specific recommendations, generally the land grant University
– NRCS 590 standard lists the approved resource

Realistic Yield Potential
• Example of NRCS 590 standards to determine yield potential– 3 out of 5 years yield is achieved
– 50% of the time yield can be achieved
– 50% of the time yield is achievable plus 10% to allow for genetic improvements
– Average over a number of years
– Etc.

Generalized Corn Yield Response Curve to Nitrogen
0 40 80 120 160 200 +
Nitrogen fertilized applied, pounds per acre
Yield
190 bu.
160 bu.
130 bu.
100 bu.
70 bu.
40 bu.
Economic N recommendation where yield drops off 95% of max yield.

Problem with Meeting the Full Nitrogen
Need with Manure
-----
Over Application of Phosphorus and Potassium

Managing Agricultural P
• Minimize P sources– Diet manipulation– Manure technologies - No reduction in P, but
may increase options for hauling greater distances or marketing
• Fertilizer Management• Conservation Practices• No direct application of P to water
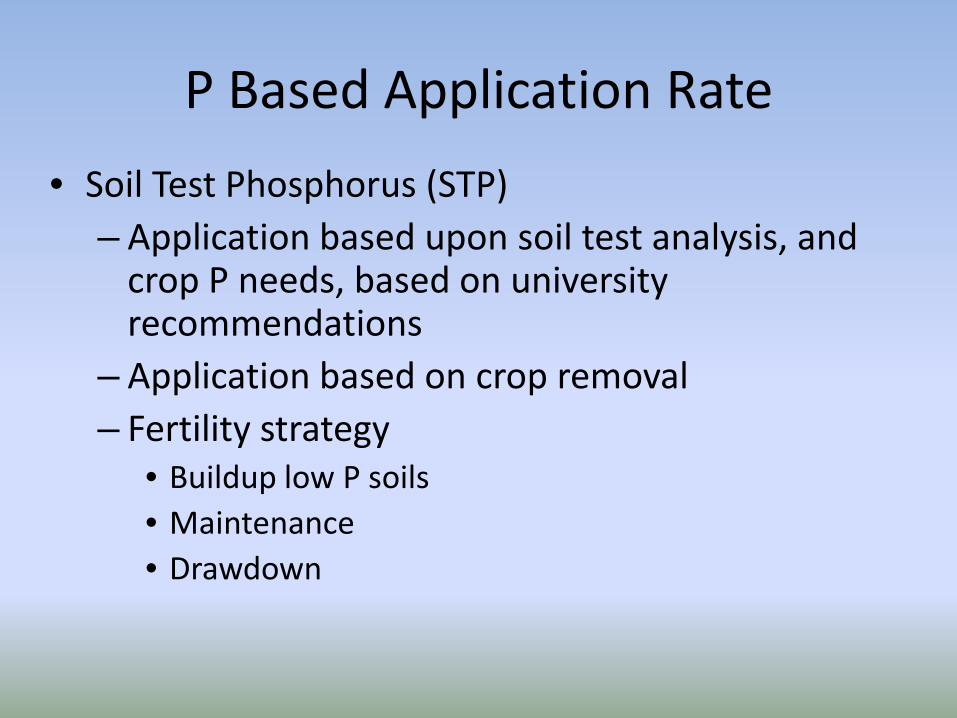
P Based Application Rate
• Soil Test Phosphorus (STP)– Application based upon soil test analysis, and
crop P needs, based on university recommendations
– Application based on crop removal– Fertility strategy
• Buildup low P soils• Maintenance• Drawdown

Corn bu 0.375 0.30

Phosphorus Removal• Corn removes 0.375 lbs P2O5 per bushel
• 150 bu x 0.375 = 56 lbs
• This corn crop would remove approximately 56 lbs of P2O5 per acre
Photo: University of Illinois
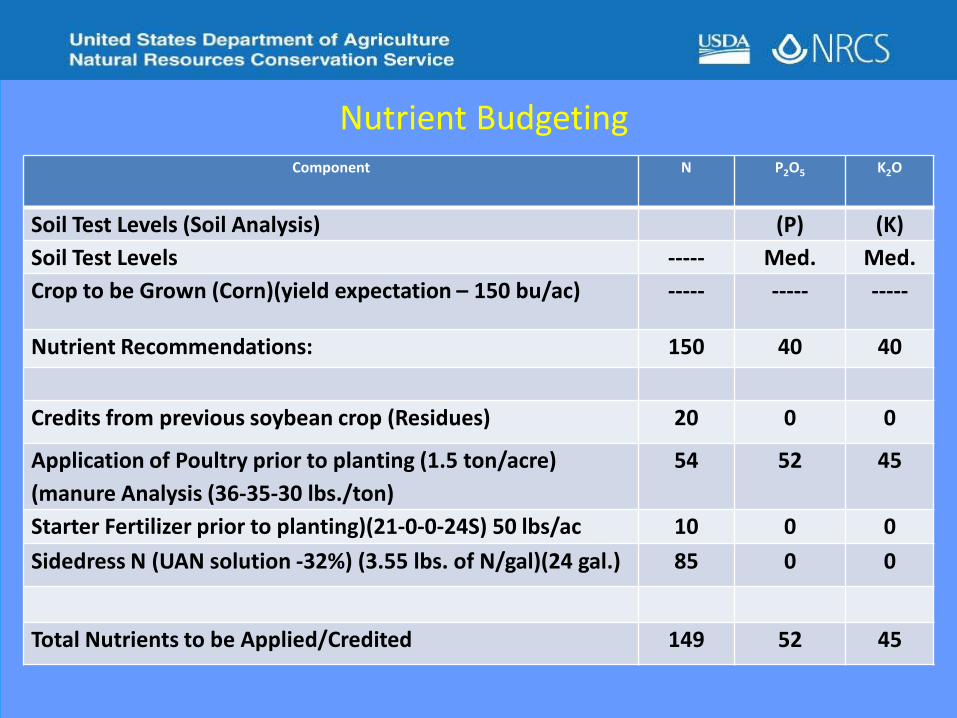
Nutrient BudgetingComponent N P2O5 K2O
Soil Test Levels (Soil Analysis) (P) (K)Soil Test Levels ----- Med. Med.Crop to be Grown (Corn)(yield expectation – 150 bu/ac) ----- ----- -----
Nutrient Recommendations: 150 40 40
Credits from previous soybean crop (Residues) 20 0 0
Application of Poultry prior to planting (1.5 ton/acre)(manure Analysis (36-35-30 lbs./ton)
54 52 45
Starter Fertilizer prior to planting)(21-0-0-24S) 50 lbs/ac 10 0 0
Sidedress N (UAN solution -32%) (3.55 lbs. of N/gal)(24 gal.) 85 0 0
Total Nutrients to be Applied/Credited 149 52 45

Nutrient BudgetingComponent N P2O5 K2O
Soil Test Levels (Soil Analysis) (P) (K)Soil Test Levels ----- Med. Med.Crop to be Grown (Corn)(yield expectation – 150 bu/ac)
----- ----- -----
Nutrient Recommendations: Based on Soil Test 150 40 40
Maximizing efficiency from manure application. ? ? ?
Maximum application of manure. ? ? ?
Sources to Meet Remaining Nutrient Needs ? ? ?
Total Nutrients to be Applied/Credited 150 45 45

Nutrient BudgetingComponent Applied
Amount/acN P2O5 K2O
Soil Test Levels (Soil Analysis) (P) (K)Soil Test Levels ----- Med. Med.Crop to be Grown (Corn)(yield expectation – 150 bu/ac) ----- ----- -----
Nutrient Recommendations: 150 40 40
Credits from previous soybean crop (Residues) 20 0 0
Application of Poultry prior to planting (1.5 ton/acre)(manure Analysis (30-30-30/ton)
1.5 ton 45 45 45
Popup Fertilizer at planting (20S) 100 lbs 20 0 0
Sidedress N (ANL solution)(32% solution) 203 lbs. 65 0 0
Total Nutrients to be Applied/Credited 150 45 45

Application Logistics:In concert with the producer
• Land Base Allocation
• Application Equipment
• Transport Distance
• Proximity of Application Areas
• Available Labor
• Cropping System
Waste Production Exceeds Nutrient Need
• Adjustments in Cropping System
• Other Utilization Options
• Feed Adjustments
• Reducing Animal Numbers
• Solids Separation and Other Manure Treatment
Nutrient Need Exceeds Waste Production- Consider in Prioritizing Application Areas -
• Fields which are the most compatible with the planned application method
• Fields with the lowest Environmental risks: i.e. lowest potential for movement of nutrients and pathogens from the site.