
CMS Physics Analysis Summary - CERNcds.cern.ch/record/2261499/files/SMP-16-018-pas.pdf ·...
23
Available on the CERN CDS information server CMS PAS SMP-16-018 CMS Physics Analysis Summary Contact: [email protected] 2017/04/28 Measurement of electroweak production of two jets in association with a Z boson in proton-proton collisions at √ s = 13 TeV The CMS Collaboration Abstract A measurement of the electroweak (EW) production of two jets in association with a Z boson in proton-proton collision at √ s = 13 TeV is presented, based on data recorded by the CMS experiment at the LHC corresponding to an integrated luminosity of 35.9 fb -1 . The measurement is performed using the ‘‘jj final state (with ‘ =e or μ and j representing the quarks produced in the hard interaction) in the kinematic region defined by M ‘‘ > 50 GeV, M jj > 120 GeV, transverse momentum p Tj > 25 GeV. The cross section of the process is found to be σ EW (‘‘jj)= 552 ± 19(stat) ± 55(syst) fb, in agreement with leading order standard model predictions. The associated jet activity of events in a signal-enriched region is also studied, and the measurements are found to be in agreement with QCD predictions.
Transcript of CMS Physics Analysis Summary - CERNcds.cern.ch/record/2261499/files/SMP-16-018-pas.pdf ·...
Available on the CERN CDS information server CMS PAS SMP-16-018
CMS Physics Analysis Summary
Contact: [email protected] 2017/04/28
Measurement of electroweak production of two jets inassociation with a Z boson in proton-proton collisions at√
s = 13 TeV
The CMS Collaboration
Abstract
A measurement of the electroweak (EW) production of two jets in association with a Zboson in proton-proton collision at
√s = 13 TeV is presented, based on data recorded
by the CMS experiment at the LHC corresponding to an integrated luminosity of35.9 fb−1. The measurement is performed using the ``jj final state (with ` =e or µ andj representing the quarks produced in the hard interaction) in the kinematic regiondefined by M`` > 50 GeV, Mjj > 120 GeV, transverse momentum pTj > 25 GeV. Thecross section of the process is found to be σEW(``jj) = 552± 19(stat)± 55(syst) fb, inagreement with leading order standard model predictions. The associated jet activityof events in a signal-enriched region is also studied, and the measurements are foundto be in agreement with QCD predictions.


1
1 IntroductionIn proton-proton (pp) collisions at the CERN LHC, the production of dileptons (``) consistentwith the Z boson invariant mass in association with two jets (jj) is dominated by a mixtureof electroweak (EW) and strong processes of order α2
EWα2S, known as Drell–Yan (DY) plus jets
events.
The pure electroweak production of the ``jj final state, at order α4EW, is less frequent [1], but
carries the distinctive signature of a Vector Boson Fusion (VBF) process: two jets with largeenergy and pseudorapidity separation produced in association with the dilepton pair. Thisprocess is referred to as EW Zjj and the two jets produced through the fragmentation of theoutgoing quarks are referred to as “tagging jets”.
Figure 1 shows signal representative Feynman diagrams for the EW Zjj processes, namely vec-tor boson fusion (VBF), bremsstrahlung-like, and multiperipheral production. Gauge cancella-tions lead to large negative interference between the VBF process and the two other categories.The interference contribution from the multiperipheral amplitudes accounts for a smaller ef-fect, under the Z mass peak.
d u
W−
W+
Zµ+
µ−
u d
dZ
d
Z
d
µ+
µ−
u u
d u
W−
νµ
W+
µ−
µ+
u d
Figure 1: Representative Feynman diagrams for dilepton production in association with twojets from purely electroweak amplitudes: vector boson fusion (left), bremsstrahlung-like (mid-dle), and multiperipheral production (right).
For inclusive ``jj final states, some of the diagrams, with identical initial and final states, caninterfere with those of the diagrams shown in Fig. 1, even if they do not involve exclusivelyEW interactions. This interference effect between the signal production and the main back-ground processes is relatively much smaller, compared to the interference effects among theEW production amplitudes, but needs to be taken into account when measuring the signalcontribution.
Figure 2 (left) shows one example of order α2S corrections to DY production that have the same
initial and final state as those in Fig. 1. A different order α2S correction that does not interfere
with the EW signal, is shown in Fig. 2 (right).
The study of EW Zjj processes is part of a more general investigation of standard model (SM)vector boson fusion and scattering processes that include the Higgs boson production [2–4]and searches for physics beyond the standard model [5]. When isolated from the backgrounds,the properties of EW Zjj events can be compared with SM predictions. Probing the jet activityin the selected events in particular can shed light in particular on the modeling of the selection(or vetoing) of additional parton radiation to the tagging jets [6, 7].
At the LHC, the EW Zjj process was first measured with Run 1 by the CMS experiment using

2 2 The CMS detector
d
d
Z
d
µ+
µ−g
u u
u
u
Z
u
µ+
µ−g
g g
Figure 2: Representative diagrams for order α2S corrections to DY production that comprise the
main background for the measurement.
pp collisions at√
s = 7 TeV [8], and then at√
s = 8 TeV by both the ATLAS [9] and CMS [10]experiments. All results have been found so far to agree with the expectations of the SM.
This work presents the measurement at CMS using pp collision data collected at√
s = 13 TeVduring 2016, corresponding to an integrated luminosity of 35.9 fb−1. A multivariate analysis,based on the methods developed for the Run 1 results [8, 10], is used to separate signal eventsfrom the large DY plus jets background. The analysis of the 13 TeV data, offers the opportunityto measure the cross section at a higher energy than previously done and to reduce the uncer-tainties of the Run 1 measurements, given both the larger integrated luminosity and the largerexpected total cross section.
This document is organized as follows: Section 2 describes the experimental apparatus andSection 3 the event simulations. Event selection procedures are described in Section 4, togetherwith the selection efficiencies and background models in control regions. Section 5 detailsthe strategy adopted to extract the signal from the data, and the corresponding systematicuncertainties are summarized in Section 6. The results obtained are presented in Section 7,and Section 8 concludes with a study of the additional hadronic activity in a EW Zjj-enrichedregion. Finally, a brief summary of the results is given in Section 9.
2 The CMS detectorThe central feature of the CMS apparatus is a superconducting solenoid of 6 m internal diame-ter, providing a magnetic field of 3.8 T. Within the solenoid volume are a silicon pixel and striptracker, a lead tungstate crystal electromagnetic calorimeter (ECAL), and a brass and scintilla-tor hadron calorimeter (HCAL), each composed of a barrel and two endcap sections. Forwardcalorimeters extend the pseudorapidity coverage provided by the barrel and endcap detectors.Muons are measured in gas-ionization detectors embedded in the steel flux-return yoke outsidethe solenoid.
The silicon tracker measures charged particles within the pseudorapidity range |η| < 2.5. Itconsists of 1440 silicon pixel and 15 148 silicon strip detector modules. For nonisolated particlesof 1 < pT < 10 GeV and |η| < 1.4, the track resolutions are typically 1.5% in pT and 25–90 (45–150) µm in the transverse (longitudinal) impact parameter [11]
The energy of electrons is measured after combining the information from the ECAL and thetracker, whereas their direction is measured by the tracker. The dielectron mass resolutionfor Z → ee decays when both electrons are in the ECAL barrel is 1.9%, and is 2.9% when

3
both electrons are in the endcaps. The electron momenta are estimated by combining energymeasurements in the ECAL with momentum measurements in the tracker [12].
Muons are measured in the pseudorapidity range |η| < 2.4, with detection planes made usingthree technologies: drift tubes, cathode strip chambers, and resistive plate chambers. Matchingmuons to tracks measured in the silicon tracker results in a relative transverse momentumresolution for muons with 20 < pT < 100 GeV of 1.3–2.0% in the barrel and better than 6%in the endcaps, The pT resolution in the barrel is better than 10% for muons with pT up to1 TeV [13].
Jet momentum is determined as the vectorial sum of all particle momenta in the jet, and isfound from simulation to be within 5 to 10% of the true momentum over the whole pT spectrumand detector acceptance. An offset correction is applied to jet energies to take into accountthe contribution from additional proton-proton interactions within the same or nearby bunchcrossings. Jet energy corrections are derived from simulation, and are confirmed with in situmeasurements of the energy balance in dijet and photon + jet events. Additional selectioncriteria are applied to each event to remove spurious jet-like features originating from isolatednoise patterns in certain HCAL regions. The jet energy resolution (JER) is typically ≈15% at10 GeV, 8% at 100 GeV, and 4% at 1 TeV [14].
A more detailed description of the CMS detector, together with a definition of the coordinatesystem used and the relevant kinematic variables, can be found in Ref. [15].
3 Simulation of signal and background eventsSignal events are simulated at leading order (LO) using the MADGRAPH5 AMC@NLO (v5.2.3.3)Monte Carlo (MC) generator [16, 17], interfaced to PYTHIA 8 [18, 19] for parton showering(PS) and hadronisation. The NNPDF30 (nlo as0118) [20] parton distribution functions (PDF)are used to generate the event. The underlying event (UE) is modelled using the CUETP8M1tune [21]. The simulation does not include the generation of extra partons at matrix-element(ME) level. The signal is defined in the kinematic region with dilepton mass M`` > 50 GeV,parton transverse momentum pTj > 25 GeV, and diparton mass Mjj > 120 GeV, wherethe cross section of the ``jj final state (with ` = e or µ) is expected to be σLO(EW ``jj) =543+7−9 (scale)± 22 (PDF) fb, where the first uncertainty is obtained by changing simultaneously
the factorisation (µF) and renormalisation (µR) scales by factors of 2 and 1/2, and the secondfrom the uncertainties in the PDFs. The LO signal cross section and kinematic distributions es-timated with MADGRAPH5 AMC@NLO are found to be in agreement with the next-to-leadingorder (NLO) predictions of the VBFNLO generator (v.2.6.3) [22–24], within the 5% level.
Background DY events are also generated with MADGRAPH5 AMC@NLO using (i) a NLOME calculation that includes up to three final state partons generated from quantum chromody-namics (QCD) interactions, and (ii) a LO ME calculation that includes up to four partons. TheME-PS matching is performed following the FXFX prescription [25] for the NLO ME case, andthe MLM prescription [26, 27] for the LO ME case. The NLO background simulation is used toextract the final results, while the LO samples are used to perform the multivariate discriminanttraining. The dilepton DY production for M`` > 50 GeV is normalized to σth(DY) = 6.024 nb,as computed at next-to-next-leading order (NNLO) with FEWZ [28].
The evaluation of the interference between EW Zjj and DY Zjj processes relies on the predic-tions obtained with MADGRAPH5 AMC@NLO. A dedicated sample of events arising forminterference terms is generated directly by selecting the contributions of order αSα3
EW, and fully

4 4 Reconstruction and selection of events
simulated in order to estimate the expected interference contribution to the analysis.
Other backgrounds are expected from events with two opposite-sign and same-flavour leptonswith accompanying jets in the final state. Production of tt events is generated with POWHEG
2.0 [29–31], and normalized to the NNLO with next-to-next-to-leading logarithm (NNLL) cor-rections inclusive cross section [32, 33]. Single-top processes are modelled at NLO with POWHEG [29–31, 34, 35] and normalized, respectively, to cross sections of 71.7± 2 pb, 217± 3 pb, and 10.32±0.2 pb for the tW, t-, and s- channel production [32, 36]. Diboson production processes WW,WZ, and ZZ are generated with PYTHIA 8 and normalized to NNLO cross sections computa-tions obtained with MCFM [37]. The abbreviation VV is used in this document when referringto the sum of the processes that yield two vector bosons.
The production of a W boson in association with jets, where the W decays to a charged leptonand a neutrino, is also generated with MADGRAPH5 AMC@NLO, and normalized to a totalcross section of 61.53 nb, computed at NNLO with FEWZ. Multijet QCD processes are alsostudied in simulation, but are found to yield negligible contributions to the selected events.
A detector simulation based on GEANT4 (v.9.4p03) [38, 39] is applied to all the generated signaland background samples. The presence of multiple pp interactions in the same beam crossing(pileup) is incorporated by simulating additional interactions (both in-time and out-of-timewith respect to the hard interaction) with a multiplicity that matches the luminosity profileobserved in data. The average number of pileup events is estimated as about 30 additionalinteractions per bunch crossing.
4 Reconstruction and selection of eventsAn event selection is performed to identify final states with two isolated, high-pT leptons, andat least two high-pT jets. Single-lepton triggers are used to acquire the data, where the lepton isrequired to have pT > 27 GeV for the electron trigger, and pT > 24 GeV for the muon trigger.
In the offline reconstruction, electrons are reconstructed from clusters of energy depositionsin the ECAL that match tracks extrapolated from the silicon tracker [12]. Offline muons arereconstructed by fitting trajectories based on hits in the silicon tracker and in the outer muonsystem [40]. Reconstructed electron or muon candidates are required to have pT > 20 GeV.Electron candidates are required to be reconstructed within |η| ≤ 2.4, excluding the CMSbarrel-to-endcap transition region of the ECAL [15]. Muon candidates are required to be re-constructed in the fiducial region |η| ≤ 2.4 of the tracker system. The track associated witha lepton candidate is required to have both its transverse and longitudinal impact parameterscompatible with the position of the main primary vertex (PV) of the event. The main PV foreach event is defined as the one with the largest ∑ p2
T, where the sum runs over all the tracksused to fit the vertex. A particle-based relative isolation parameter is computed for each lepton,and corrected on an event-by-event basis for contributions from pileup. The particle candidatesused to compute the isolation variable are reconstructed with the particle flow (PF) algorithmwhich is detailed below. The sum of the scalar pT of all particle candidates reconstructed in anisolation cone with radius R =
√(∆η)2 + (∆φ)2 < 0.4 around the lepton’s momentum vector
is required to be below 15 (25)% of the electron (muon) pT value. The two leptons with oppo-site electric charge and with highest pT are chosen to form the dilepton pair, and are requiredto have pT > 30 GeV and pT > 20 GeV for the pT-leading and subleading lepton, respec-tively. Same-flavour dileptons (ee or µµ) compatible with Z → `` decays are then selected byrequiring |MZ −M``| < 15 GeV, where MZ is the mass of the Z boson [41].

4.1 Discriminating gluons from quarks 5
The offline analysis uses reconstructed charged-particle tracks and candidates from the PF al-gorithm [42–44]. In the PF event reconstruction all stable particles in the event, i.e. electrons,muons, photons, and charged and neutral hadrons, are reconstructed as PF candidates usinginformation from all CMS subdetectors to obtain an optimal determination of their direction,energy, and type. The PF candidates are then used to reconstruct the jets and missing transverseenergy.
Jets are reconstructed by clustering PF candidates with the anti-kT algorithm [45, 46] with adistance parameter of 0.4. Jets reconstructed with pT > 15 GeV and |η| ≤ 4.7 are used inthe analysis. Reconstructed jets require a small additional energy correction, mostly due tothresholds on reconstructed tracks and clusters in the PF algorithm and various reconstructioninefficiencies [14]. Loose jet identification criteria are applied to reject misreconstructed jetsresulting from detector noise [47]. Additionally loose criteria are also applied to remove jetsheavily contaminated with pileup energy (clustering of energy deposits not associated with aparton from the primary pp interaction) [47, 48]. The efficiency of the jet identification criteriais greater than 99%, with a rejection of 90% of background pileup jets with pT ' 50 GeV.
The two jets of highest pT are defined as the tagging jets, and are required to have pT > 50 GeVand pT > 30 GeV respectively for the pT-leading and subleading jet. The invariant mass of thetwo tagging jets is required to satisfy Mjj > 200 GeV.
A multivariate analysis technique, described later in Sec. 5, is used to provide an optimal sep-aration of the DY Zjj and EW Zjj components of the inclusive ``jj spectrum. The main dis-criminating variables are the dijet invariant mass Mjj and pseudorapidity opening ∆ηjj. Othervariables used in the multivariate analysis are described below.
4.1 Discriminating gluons from quarks
Jets in signal events are expected to originate from quarks while for background events it ismore probable that jets are initiated by a gluon emitted from a QCD process. A quark-gluon(QGL) discriminant [8] is evaluated for the two tagging jets with the intent of distinguishingthe nature of each jet.
The QGL discriminant exploits differences in the showering and fragmentation of gluons andquarks, making use of the following internal jet-composition observables: (i) the jet particlemultiplicity, (ii) the jet constituents’ minor root-mean-square (RMS) distance in the η-φ plane,and (iii) the jet constituents’ pT distribution function, as defined in Ref. [49].
The variables are used as an input to a likelihood discriminant on gluon and quark jets con-structed from simulated dijet events. The performance of the QGL discriminant is evaluatedand validated using independent, exclusive samples of Z+jet and dijet data [49]. Comparisonsof simulation predictions and data distributions allow to derive data-driven corrections to theQGL distributions, and define a systematic uncertainty band, when using the QGL informa-tion.
4.2 Additional discriminating variables
To separate signal and background an event balance variable R(
phardT
)is used, defined as
R(
phardT
)=|~pTj1 + ~pTj2 + ~pTZ||~pTj1 |+ |~pTj2 |+ |~pTZ|
=|~phard
T ||~pTj1 |+ |~pTj2 |+ |~pTZ|
, (1)
where the numerator is the estimator of the pT for the hard process, i.e. phardT .

6 4 Reconstruction and selection of events
Angular based variables useful to separate the signal include the difference between the rapid-ity of the Z boson and the average rapidity of the two tagging jets, i.e.
y∗ = yZ −12(yj1 + yj2), (2)
and the z∗ Zeppenfeld variable [7] defined as
z∗ =y∗
∆yjj. (3)
Eve
nts
/ 60
GeV
1
10
210
310
410
510
610
(13 TeV)-135.9 fbCMS
Preliminary DielectronData
VV
Top
Z + jets
EWK Zjj
EWK Zjj
MC stat. unc.
Dielectron
(GeV)jjm0 500 1000 1500 2000 2500 3000D
ata
/ MC
- 1
-0.4-0.2
00.20.4
QCD scale up/down
JES up/down
Eve
nts
/ 0.0
4
1
10
210
310
410
510
610
(13 TeV)-135.9 fbCMS
Preliminary DielectronData
VV
Top
Z + jets
EWK Zjj
EWK Zjj
MC stat. unc.
Dielectron
)hard
TR(p
0 0.2 0.4 0.6 0.8 1Dat
a / M
C -
1
-0.4-0.2
00.20.4
QCD scale up/down
JES up/down
Eve
nts
/ 0.2
0
1
210
410
610
810
910 (13 TeV)-135.9 fbCMS
Preliminary DielectronData
VV
Top
Z + jets
EWK Zjj
EWK Zjj
MC stat. unc.
Dielectron
z*(Z)0 0.5 1 1.5 2 2.5 3D
ata
/ MC
- 1
-0.4-0.2
00.20.4
QCD scale up/down
JES up/down
Figure 3: Data and simulated distributions for the dielectron event selection: invariant massof the dijet system (top left), R
(phard
T
)(top right), and z∗ distribution (bottom). The contribu-
tions from the different background sources and the signal are shown stacked, with data pointssuperimposed. The expected signal-only contribution is also shown as an unfilled histogram.The lower panels show the relative difference between the data and expectations as well as theuncertainty envelopes for JES and QCD scales uncertainties.

4.2 Additional discriminating variables 7E
vent
s / 6
0 G
eV
1
10
210
310
410
510
610
(13 TeV)-135.9 fbCMS
Preliminary DimuonData
VV
Top
Z + jets
EWK Zjj
EWK Zjj
MC stat. unc.
Dimuon
(GeV)jjm0 500 1000 1500 2000 2500 3000D
ata
/ MC
- 1
-0.4-0.2
00.20.4
QCD scale up/down
JES up/down
Eve
nts
/ 0.0
4
1
10
210
310
410
510
610
(13 TeV)-135.9 fbCMS
Preliminary DimuonData
VV
Top
Z + jets
EWK Zjj
EWK Zjj
MC stat. unc.
Dimuon
)hard
TR(p
0 0.2 0.4 0.6 0.8 1Dat
a / M
C -
1
-0.4-0.2
00.20.4
QCD scale up/down
JES up/down
Eve
nts
/ 0.2
0
1
210
410
610
810
910
(13 TeV)-135.9 fbCMS
Preliminary DimuonData
VV
Top
Z + jets
EWK Zjj
EWK Zjj
MC stat. unc.
Dimuon
z*(Z)0 0.5 1 1.5 2 2.5 3D
ata
/ MC
- 1
-0.4-0.2
00.20.4
QCD scale up/down
JES up/down
Figure 4: Data and simulated distributions for the dimuon event selection: invariant mass ofthe dijet system (top left), R
(phard
T
)(top right), and z∗ distribution (bottom). The contributions
from the different background sources and the signal are shown stacked, with data points su-perimposed. The expected signal-only contribution is also shown as an unfilled histogram.The lower panels show the relative difference between the data and expectations as well as theuncertainty envelopes for JES and QCD scales uncertainties.
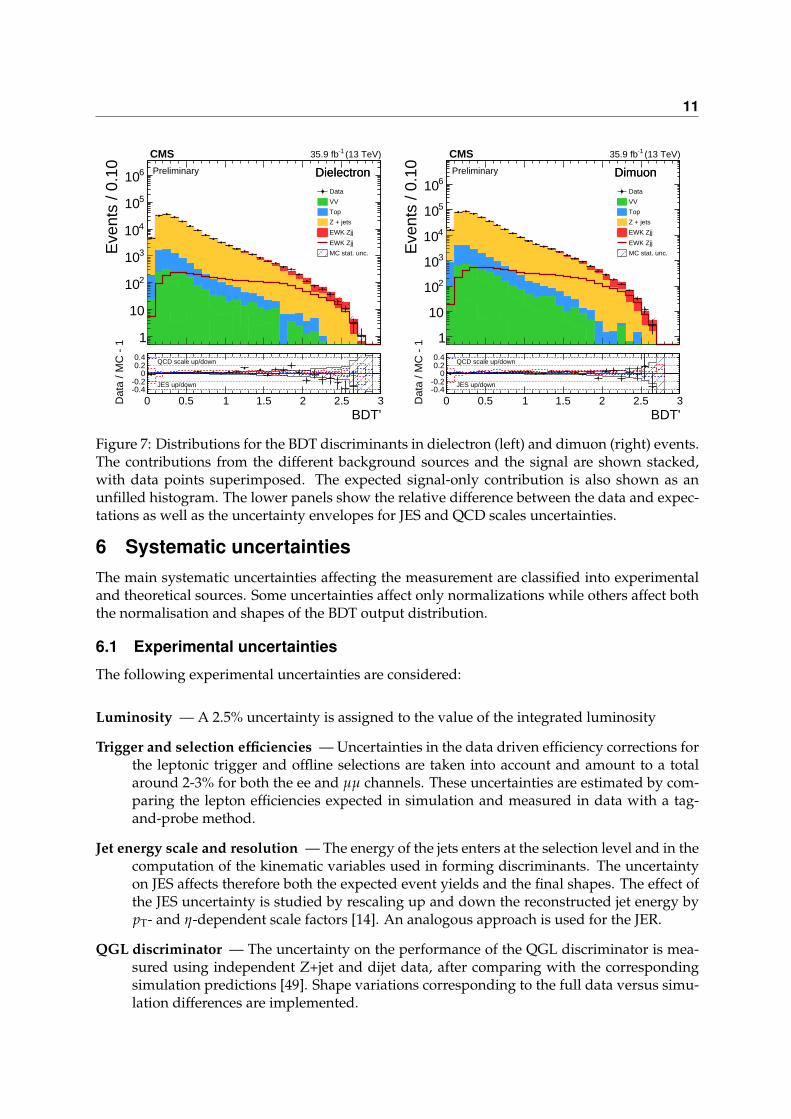
8 5 Signal discriminants and extraction procedure
The distributions for data and simulated samples of the dijet invariant mass (Mjj), the R(
phardT
)and z∗ variables are shown in Figs. 3 and 4, respectively for the dielectron and dimuon chan-nels. A good agreement between the data and the MC expectations is attained in both channels,taking into account also the experimental uncertainties on the jet energy scale (JES) and theo-retical QCD scales uncertainties, both shown in the lower panels of all plots.
5 Signal discriminants and extraction procedureAs discussed previously, the EW Zjj signal is characterized by a large pseudorapidity separationbetween the tagging jets due to the small-angle scattering of the two initial partons. Owingto both the topological configuration and the large energy of the outgoing partons, the Mjjvariable is also expected to be large. The evolution of ∆ηjj with Mjj is expected to be different insignal and background events and therefore these characteristics are expected to yield the bestseparation power between the EW Zjj and the DY Zjj productions. In addition, in signal events,it is expected that the Z boson candidate is produced centrally in the rapidity region definedby the two tagging jets and that the Zjj system is approximately balanced in the transverseplane. As a consequence the signal is expected to be found with lower values of both z∗ andphard
T , compared to the DY background. Other variables which are used to enhance the signal-to-background separation are related to the kinematics of the event (pT, rapidity, and distancebetween the jets and/or the Z boson) or to the properties of the jets that are expected to beinitiated by quarks. The variables that are finally used in the multivariate analysis are: (i)the dijet invariant mass Mjj; (ii) the dijet pseudorapidity opening ∆ηjj; (iii) the dijet transversemomentum pTjj; (iv) the two tagging jets QGL values; (v) the ``jj system R
(phard
T
)and z∗.
The discriminating output is built training a boosted decision tree (BDT) discriminator with theTMVA package [50] to achieve an optimal separation between the EW Zjj and DY Zjj processes.In order to achieve a better extraction of the signal component, the BDT output value, originallyin the [-1,+1] interval, is transformed with the BDT′ = tanh−1((BDT + 1)/2) function.
Figure 7 shows the distributions of the discriminants for the two lepton channels. Good agree-ment is observed overall in all distributions, and the signal presence is visible at high BDT’values.
A binned maximum likelihood is built from the expected rates for each process, as a function ofthe value of the discriminant, which is used to fit simultaneously the strength modifiers for theEW Zjj and DY Zjj processes, µ = σ(EW Zjj)/σLO(EW ``jj) and υ = σ(DY)/σth(DY). Nuisanceparameters are added to modify the expected rates and shapes according to the estimate of thesystematic uncertainties affecting the measurement.
The interference between the EW Zjj and the DY Zjj processes is taken into account in the fit pro-cedure, and its strength scales as
√µυ. The interference model is derived from the MADGRAPH
simulation described in Section 3.
The parameters of the model (µ and υ) are determined maximising the likelihood. The sta-tistical methodology used follows the one used in other CMS analyses [3] using asymptoticformulas [51]. In this procedure the systematic uncertainties affecting the measurement of thesignal strengths are partially constrained.

9E
vent
s / 1
0 G
eV
1
10
210
310
410
510
610 (13 TeV)-135.9 fbCMS
Preliminary DielectronData
VV
Top
Z + jets
EWK Zjj
EWK Zjj
MC stat. unc.
Dielectron
(GeV)T jj
p0 100 200 300 400 500 600 700 800D
ata
/ MC
- 1
-0.4-0.2
00.20.4
QCD scale up/down
JES up/down
Eve
nts
/ 0.1
01
10
210
310
410
510
(13 TeV)-135.9 fbCMS
Preliminary DielectronData
VV
Top
Z + jets
EWK Zjj
EWK Zjj
MC stat. unc.
Dielectron
|jj
η∆|0 1 2 3 4 5 6 7 8 9D
ata
/ MC
- 1
-0.4-0.2
00.20.4
QCD scale up/down
JES up/down
Eve
nts
/ 0.0
5
1
210
410
610
810
1010
(13 TeV)-135.9 fbCMS
Preliminary DielectronData
VV
Top
Z + jets
EWK Zjj
EWK Zjj
MC stat. unc.
Dielectron
-leading jet QGLT
p0 0.2 0.4 0.6 0.8 1D
ata
/ MC
- 1
-0.4-0.2
00.20.4
QCD scale up/down
JES up/down
Eve
nts
/ 0.0
5
1
210
410
610
810
1010
(13 TeV)-135.9 fbCMS
Preliminary DielectronData
VV
Top
Z + jets
EWK Zjj
EWK Zjj
MC stat. unc.
Dielectron
-subleading jet QGLT
p0 0.2 0.4 0.6 0.8 1D
ata
/ MC
- 1
-0.4-0.2
00.20.4
QCD scale up/down
JES up/down
Figure 5: Data and simulated distributions for the dielectron event selection: dijet systemtransverse momentum (top left), dijet pseudorapidity opening (top right), pT-leading jet QGL(bottom left) and pT-subleading jet QGL (bottom right). The contributions from the differentbackground sources and the signal are shown stacked, with data points superimposed. The ex-pected signal-only contribution is also shown as an unfilled histogram. The lower panels showthe relative difference between the data and expectations as well as the uncertainty envelopesfor JES and QCD scales uncertainties.

10 5 Signal discriminants and extraction procedureE
vent
s / 1
0 G
eV
1
10
210
310
410
510
610
(13 TeV)-135.9 fbCMS
Preliminary DimuonData
VV
Top
Z + jets
EWK Zjj
EWK Zjj
MC stat. unc.
Dimuon
(GeV)T jj
p0 100 200 300 400 500 600 700 800D
ata
/ MC
- 1
-0.4-0.2
00.20.4
QCD scale up/down
JES up/down
Eve
nts
/ 0.1
01
10
210
310
410
510
610 (13 TeV)-135.9 fbCMS
Preliminary DimuonData
VV
Top
Z + jets
EWK Zjj
EWK Zjj
MC stat. unc.
Dimuon
|jj
η∆|0 1 2 3 4 5 6 7 8 9D
ata
/ MC
- 1
-0.4-0.2
00.20.4
QCD scale up/down
JES up/down
Eve
nts
/ 0.0
5
1
210
410
610
810
1010
1110 (13 TeV)-135.9 fbCMS
Preliminary DimuonData
VV
Top
Z + jets
EWK Zjj
EWK Zjj
MC stat. unc.
Dimuon
-leading jet QGLT
p0 0.2 0.4 0.6 0.8 1D
ata
/ MC
- 1
-0.4-0.2
00.20.4
QCD scale up/down
JES up/down
Eve
nts
/ 0.0
5
1
210
410
610
810
1010
1110 (13 TeV)-135.9 fbCMS
Preliminary DimuonData
VV
Top
Z + jets
EWK Zjj
EWK Zjj
MC stat. unc.
Dimuon
-subleading jet QGLT
p0 0.2 0.4 0.6 0.8 1D
ata
/ MC
- 1
-0.4-0.2
00.20.4
QCD scale up/down
JES up/down
Figure 6: Data and simulated distributions for the dimuon event selection: dijet system trans-verse momentum (top left), dijet pseudorapidity opening (top right), pT-leading jet QGL (bot-tom left) and pT-subleading jet QGL (bottom right). The contributions from the different back-ground sources and the signal are shown stacked, with data points superimposed. The ex-pected signal-only contribution is also shown as an unfilled histogram. The lower panels showthe relative difference between the data and expectations as well as the uncertainty envelopesfor JES and QCD scales uncertainties.
11E
vent
s / 0
.10
1
10
210
310
410
510
610
(13 TeV)-135.9 fbCMS
Preliminary DielectronData
VV
Top
Z + jets
EWK Zjj
EWK Zjj
MC stat. unc.
Dielectron
BDT'0 0.5 1 1.5 2 2.5 3D
ata
/ MC
- 1
-0.4-0.2
00.20.4
QCD scale up/down
JES up/down
Eve
nts
/ 0.1
0
1
10
210
310
410
510
610
(13 TeV)-135.9 fbCMS
Preliminary DimuonData
VV
Top
Z + jets
EWK Zjj
EWK Zjj
MC stat. unc.
Dimuon
BDT'0 0.5 1 1.5 2 2.5 3D
ata
/ MC
- 1
-0.4-0.2
00.20.4
QCD scale up/down
JES up/down
Figure 7: Distributions for the BDT discriminants in dielectron (left) and dimuon (right) events.The contributions from the different background sources and the signal are shown stacked,with data points superimposed. The expected signal-only contribution is also shown as anunfilled histogram. The lower panels show the relative difference between the data and expec-tations as well as the uncertainty envelopes for JES and QCD scales uncertainties.
6 Systematic uncertaintiesThe main systematic uncertainties affecting the measurement are classified into experimentaland theoretical sources. Some uncertainties affect only normalizations while others affect boththe normalisation and shapes of the BDT output distribution.
6.1 Experimental uncertainties
The following experimental uncertainties are considered:
Luminosity — A 2.5% uncertainty is assigned to the value of the integrated luminosity
Trigger and selection efficiencies — Uncertainties in the data driven efficiency corrections forthe leptonic trigger and offline selections are taken into account and amount to a totalaround 2-3% for both the ee and µµ channels. These uncertainties are estimated by com-paring the lepton efficiencies expected in simulation and measured in data with a tag-and-probe method.
Jet energy scale and resolution — The energy of the jets enters at the selection level and in thecomputation of the kinematic variables used in forming discriminants. The uncertaintyon JES affects therefore both the expected event yields and the final shapes. The effect ofthe JES uncertainty is studied by rescaling up and down the reconstructed jet energy bypT- and η-dependent scale factors [14]. An analogous approach is used for the JER.
QGL discriminator — The uncertainty on the performance of the QGL discriminator is mea-sured using independent Z+jet and dijet data, after comparing with the correspondingsimulation predictions [49]. Shape variations corresponding to the full data versus simu-lation differences are implemented.

12 7 Measurement of the EW Zjj production cross section
Pileup — Pileup can affect the identification and isolation of the leptons or the corrected en-ergy of the jets. When the jet clustering algorithm is run, pileup can induce a distortionof the reconstructed dijet system due to the contamination of tracks and calorimetric de-posits. This uncertainty is evaluated by generating alternative distributions with differentdistributions of the number of pileup interactions, corresponding to a 5% uncertainty onthe total inelastic pp cross section at
√s = 13 TeV.
Statistics of simulation — For each signal and background simulation components shape vari-ations for the distributions are considered by shifting each bin content up or down by itsstatistical uncertainty. This generates alternatives to the nominal shape to be analysed.
6.2 Theoretical uncertainties
The following theoretical uncertainties are considered in the analysis:
PDF — The PDF uncertainties are evaluated by comparing by comparing the nominal distri-butions to those obtained when using the sub-PDFs of the NNPDF set.
QCD Factorisation and renormalisation scales — To account for QCD theoretical uncertain-ties signal and background shape variations are built by changing the values of µF andµR from their defaults by 2 or 1/2 in the matrix element calculation, simultaneously forµF and µR, but independently for each simulated sample.
Normalisation of residual backgrounds — Diboson and top-quark production processes aremodelled with MC simulations. An uncertainty in normalization is assigned based onthe PDF and QCD uncertainties, following calculations in Refs. [32, 33, 37].
Interference between EW Zjj and DY Zjj — An overall normalisation uncertainty and a shapeuncertainty are assigned to the interference term in the fit, based on an envelope of pre-diction with different QCD scales.
Parton shower model — The uncertainty on the parton shower (PS) model and the event tuneis acessed as the full difference of the acceptance and shape predictions using PYTHIA andHERWIG.
The uncertainties that have the largest impact on the signal determination are the JES and sim-ulation statistics on the experimental side, and the QCD scales uncertainties on the theoreticalside.
7 Measurement of the EW Zjj production cross sectionThe signal strength is extracted from the fit to the BDT output distribution as discussed inSection 5.
From the fit for the dielectron channel the signal strength is measured to be
µ = 1.02± 0.06 (stat)± 0.13 (syst) = 1.02± 0.14 (total),
corresponding to a measured signal cross section
σ(EW ``jj) = 554± 34 (stat)± 70 (syst) fb = 554± 78 (total) fb,

13
From the fit for the dimuon channel the signal strength is measured to be
µ = 1.00± 0.04 (stat)± 0.10 (syst) = 1.00± 0.11 (total),
corresponding to a measured signal cross section
σ(EW ``jj) = 540± 23 (stat)± 56 (syst) fb = 540± 61 (total) fb,
The results obtained are compatible among the dilepton channels, and in agreement with theSM prediction of unity.
From the combined fit of the two channels the signal strength is measured to be
µ = 1.017± 0.035 (stat)± 0.101 (syst) = 1.017± 0.106 (total),
corresponding to a measured signal cross section
σ(EW ``jj) = 552± 19 (stat)± 55 (syst) fb = 552± 58 (total) fb,
in agreement with the SM prediction σLO(EW ``jj) = 543± 24 fb.
Using the statistical methodology described in Section 5, the background-only hypothesis inthe dielectron, dimuon and combined channels are all excluded with significances well above5σ.
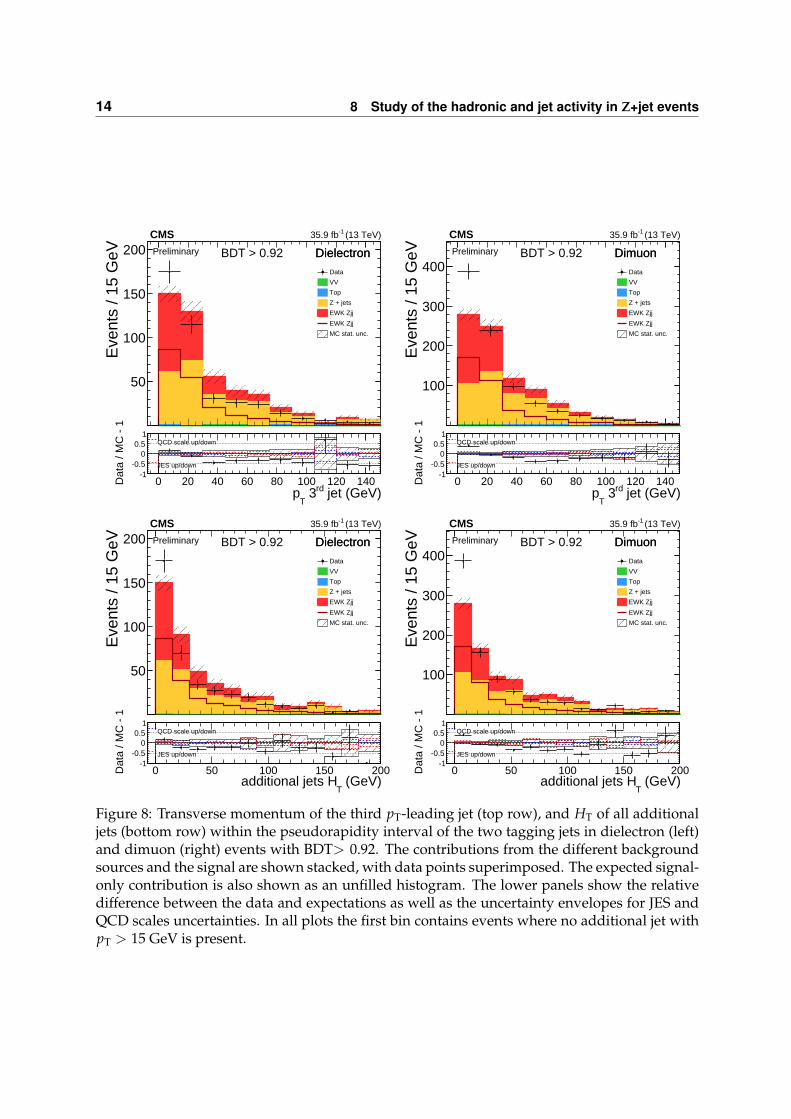
8 Study of the hadronic and jet activity in Z+jet eventsHaving established the presence of the signal the properties of the hadronic activity in theselected events are examined. The production of additional jets in a region with a larger contri-bution of EW Zjj processes is pursued in Section 8.1. Studies of the rapidity gap with track-onlyobservables are presented in Section 8.2. A significant suppression of the hadronic activity insignal events is expected because the final-state objects originate from pure electroweak interac-tions, in contrast with the radiative QCD production of jets in DY Zjj events. The reconstructeddistributions are compared directly to the prediction obtained with a full simulation of the CMSdetector.
8.1 Jet activity studies in a high-purity region
In this study, event distributions are shown with a cut on the output value at BDT> 0.92,that allows to select a signal-enriched sample with a similar fraction of signal and backgroundevents. Aside from the two tagging jets used in the preselection, all PF-based jets with a pT >
15 GeV found within the pseudorapidity gap of the tagging jets, ηtag jetmin < η < η
tag jetmax , are
used. The background contribution uses the normalisations obtained from the fit discussed inSection 7.
The pT of the pT-leading additional jet, as well as the scalar pT sum (HT) of all additional jets,are shown in Fig. 8. Data and expectations are generally in good agreement for all distributionsin the signal-enriched regions. A suppression of the emission of additional jets is observed indata, when taking into account the background-only predictions. Notice that in the simulationof the signal, the additional jets are produced by the PS model (see Section 3), so studying thesedistributions provides insight on the PS modelling in the rapidity gap region.
14 8 Study of the hadronic and jet activity in Z+jet eventsE
vent
s / 1
5 G
eV
50
100
150
200 (13 TeV)-135.9 fbCMS
Preliminary DielectronBDT > 0.92Data
VV
Top
Z + jets
EWK Zjj
EWK Zjj
MC stat. unc.
Dielectron
jet (GeV)rd 3T
p0 20 40 60 80 100 120 140D
ata
/ MC
- 1
-1-0.5
00.5
1QCD scale up/down
JES up/down
Eve
nts
/ 15
GeV
100
200
300
400
(13 TeV)-135.9 fbCMS
Preliminary DimuonBDT > 0.92Data
VV
Top
Z + jets
EWK Zjj
EWK Zjj
MC stat. unc.
Dimuon
jet (GeV)rd 3T
p0 20 40 60 80 100 120 140D
ata
/ MC
- 1
-1-0.5
00.5
1QCD scale up/down
JES up/down
Eve
nts
/ 15
GeV
50
100
150
200 (13 TeV)-135.9 fbCMS
Preliminary DielectronBDT > 0.92Data
VV
Top
Z + jets
EWK Zjj
EWK Zjj
MC stat. unc.
Dielectron
(GeV)T
additional jets H0 50 100 150 200D
ata
/ MC
- 1
-1-0.5
00.5
1QCD scale up/down
JES up/down
Eve
nts
/ 15
GeV
100
200
300
400
(13 TeV)-135.9 fbCMS
Preliminary DimuonBDT > 0.92Data
VV
Top
Z + jets
EWK Zjj
EWK Zjj
MC stat. unc.
Dimuon
(GeV)T
additional jets H0 50 100 150 200D
ata
/ MC
- 1
-1-0.5
00.5
1QCD scale up/down
JES up/down
Figure 8: Transverse momentum of the third pT-leading jet (top row), and HT of all additionaljets (bottom row) within the pseudorapidity interval of the two tagging jets in dielectron (left)and dimuon (right) events with BDT> 0.92. The contributions from the different backgroundsources and the signal are shown stacked, with data points superimposed. The expected signal-only contribution is also shown as an unfilled histogram. The lower panels show the relativedifference between the data and expectations as well as the uncertainty envelopes for JES andQCD scales uncertainties. In all plots the first bin contains events where no additional jet withpT > 15 GeV is present.
8.2 Study of the charged hadronic activity 15
8.2 Study of the charged hadronic activity
For this study, a collection is formed of high-purity tracks [52] with pT > 0.3 GeV, uniquelyassociated with the main PV in the event. Tracks associated with the two leptons or with thetagging jets are excluded from the selection. The association between the selected tracks andthe reconstructed PVs is carried out by minimising the longitudinal impact parameter whichis defined as the z-distance between the PV and the point of closest approach of the track helixto the PV, labeled dPV
z . The association is required to satisfy the conditions dPVz < 2 mm and
dPVz < 3δdPV
z , where δdPVz is the uncertainty on dPV
z .
A collection of “soft track-jets” is defined by clustering the selected tracks using the anti-kTclustering algorithm [46] with a distance parameter of R = 0.4. The use of track jets representsa clean and well-understood method [53] to reconstruct jets with energy as low as a few GeV.These jets are not affected by pileup, because of the association of their tracks with the hard-scattering vertex [54].
To study the central hadronic activity between the tagging jets, only track jets of low pT, andwithin η
tag jetmin < η < η
tag jetmax are considered. For each event, the scalar sum of the pT of soft-
track jets with pT > 1 GeV is computed, and defined as the soft HT variable. Figure 9 showsthe distribution of the soft HT in the BDT> 0.92 signal enriched region, for the dielectron anddimuon channels compared to predictions with PYTHIA and HERWIG PS models.
Overall, good agreement is observed between data and the simulation.
8.3 Study of gap activity vetoes
The efficiency of a gap activity veto corresponds to the fraction of events with a measured gapactivity below a given threshold. This efficiency can be studied as a function of the appliedthreshold, and for different gap activity observables.
Figure 10 shows the selection efficiency of combined dielecton and dimuon events in the signalenriched region with BDT> 0.92 for the application of a gap activity veto above the pT of theadditional third jet, or the total HT of all additional jets. Data points disfavour the backgroundonly predictions and are in reasonable agreement with the presence of the signal with both PSpredictions.
Figure 11 shows the selection efficiency of combined dielecton and dimuon events in the signalenriched region with BDT> 0.92 for the application of a gap activity veto above the pT of theleading soft jet, or the total soft HT. Data points disfavour the background only predictions andare in reasonable agreement with the presence of the signal with both PS predictions. Amongthe two considered signal models, the data seem to prefer the signal model with HERWIG partonshowering at low gap activity values, while the PYTHIA parton shower predictions seems to bepreferred by the data in the case of larger gap activities.
9 SummaryThe cross section for the electroweak production of a Z boson in association with two jets in the``jj final state, in proton-proton collisions at
√s = 13 TeV has been measured to be
σ(EW ``jj) = 552± 19 (stat)± 55 (syst) fb,
in agreement with the SM prediction. This is the first measurement of the EW Zjj cross sectionin proton-proton collisions at
√s = 13 TeV

16 9 SummaryE
vent
s / 1
0 G
eV
20
40
60
80 (13 TeV)-135.9 fbCMS
Preliminary DielectronBDT > 0.92Data
VV
Top
Z + jets
EWK Zjj
EWK Zjj
MC stat. unc.
Dielectron
(GeV)softTH
0 50 100 150 200Dat
a / M
C -
1
-1-0.5
00.5
1QCD scale up/down
JES up/down
Eve
nts
/ 10
GeV
50
100
150
200
(13 TeV)-135.9 fbCMS
Preliminary DimuonBDT > 0.92Data
VV
Top
Z + jets
EWK Zjj
EWK Zjj
MC stat. unc.
Dimuon
(GeV)softTH
0 50 100 150 200Dat
a / M
C -
1
-1-0.5
00.5
1QCD scale up/down
JES up/down
Eve
nts
/ 10
GeV
50
100
(13 TeV)-135.9 fbCMS
Preliminary DielectronBDT > 0.92Data
VV
Top
Z + jets
EWK Zjj
EWK Zjj
MC stat. unc.
Dielectron
(GeV)softTH
0 50 100 150 200Dat
a / M
C -
1
-1-0.5
00.5
1QCD scale up/down
JES up/down
Eve
nts
/ 10
GeV
50
100
150
200
(13 TeV)-135.9 fbCMS
Preliminary DimuonBDT > 0.92Data
VV
Top
Z + jets
EWK Zjj
EWK Zjj
MC stat. unc.
Dimuon
(GeV)softTH
0 50 100 150 200Dat
a / M
C -
1
-1-0.5
00.5
1QCD scale up/down
JES up/down
Figure 9: HT of additional soft track jets with pT > 1 GeV in dielectron (left) and dimuon(right) events with BDT> 0.92. Data is compared to MC expectations with the PYTHIA PSmodel (top row) or the HERWIG ++ PS model (bottom row). The contributions from the dif-ferent background sources and the signal are shown stacked, with data points superimposed.The expected signal-only contribution is also shown as an unfilled histogram. The lower pan-els show the relative difference between the data and expectations as well as the uncertaintyenvelopes for JES and QCD scales uncertainties.

17
(GeV)T
Third jet p0 50 100 150 200 250 300
Gap
vet
o ef
ficie
ncy
0.4
0.5
0.6
0.7
0.8
0.9
1
1.1CMS
BDT > 0.92Dilepton
(13 TeV)-135.9 fb
Data
DY (MG5_aMC NLO)
DY + EWK Zjj (MG5_aMC LO + Pythia8)
DY + EWK Zjj (MG5_aMC LO + Herwig)
(GeV)TH0 50 100 150 200 250 300 350 400 450
Gap
vet
o ef
ficie
ncy
0.4
0.5
0.6
0.7
0.8
0.9
1
1.1CMS
BDT > 0.92Dilepton
(13 TeV)-135.9 fb
Data
DY (MG5_aMC NLO)
DY + EWK Zjj (MG5_aMC LO + Pythia8)
DY + EWK Zjj (MG5_aMC LO + Herwig)
Figure 10: Efficiency of a gap activity veto in dielectron and dimuon events with BDT> 0.92,as a function of the additional jet pT (left), and of the total HT of additional jets (right). Datapoints are compared to MC expectations with only DY events, including signal the PYTHIA PSmodel, or the HERWIG ++ PS model. The bands represent the MC statistical uncertainty.
(GeV)T
Leading soft jet p0 20 40 60 80 100 120 140 160 180
Gap
vet
o ef
ficie
ncy
0.2
0.4
0.6
0.8
1
CMS
BDT > 0.92Dilepton
(13 TeV)-135.9 fb
Data
DY (MG5_aMC NLO)
DY + EWK Zjj (MG5_aMC LO + Pythia8)
DY + EWK Zjj (MG5_aMC LO + Herwig)
(GeV)TSoft H0 50 100 150 200 250
Gap
vet
o ef
ficie
ncy
0.2
0.4
0.6
0.8
1
CMS
BDT > 0.92Dilepton
(13 TeV)-135.9 fb
Data
DY (MG5_aMC NLO)
DY + EWK Zjj (MG5_aMC LO + Pythia8)
DY + EWK Zjj (MG5_aMC LO + Herwig)
Figure 11: Efficiency of a gap activity veto in dielectron and dimuon events with BDT> 0.92,as a function of the leading soft jet pT (left), and of the total soft HT (right). Data points arecompared to MC expectations with only DY events, including signal the PYTHIA PS model, orthe HERWIG ++ PS model. The bands represent the MC statistical uncertainty.

18 References
The increased cross section and integrated luminosity recorded at 13 TeV, and more precisemodelling of background processes have allowed to obtain a more precise measurement of theEW Zjj process relative to the Run 1 results.
In events with higher signal purity, the additional hadron activity has also been characterizedas well as the efficiencies for a gap activity veto, and good agreement is found between data andQCD predictions with either PYTHIA or HERWIG ++ parton shower and hadronization models.
References[1] C. Oleari and D. Zeppenfeld, “QCD corrections to electroweak `ν`jj and `+`−jj
production”, Phys. Rev. D 69 (2004) 093004, doi:10.1103/PhysRevD.69.093004,arXiv:hep-ph/0310156.
[2] ATLAS Collaboration, “Observation of a new particle in the search for the StandardModel Higgs boson with the ATLAS detector at the LHC”, Phys. Lett. B 716 (2012) 1,doi:10.1016/j.physletb.2012.08.020, arXiv:1207.7214.
[3] CMS Collaboration, “Observation of a new boson at a mass of 125 GeV with the CMSexperiment at the LHC”, Phys. Lett. B 716 (2012) 30,doi:10.1016/j.physletb.2012.08.021, arXiv:1207.7235.
[4] CMS Collaboration, “Observation of a new boson with mass near 125 GeV in ppcollisions at
√s = 7 and 8 TeV”, JHEP 06 (2013) 081,
doi:10.1007/JHEP06(2013)081, arXiv:1303.4571.
[5] G.-C. Cho et al., “Weak boson fusion production of supersymmetric particles at theCERN LHC”, Phys. Rev. D 73 (2006) 054002, doi:10.1103/PhysRevD.73.054002,arXiv:hep-ph/0601063.
[6] J. D. Bjorken, “Rapidity gaps and jets as a new physics signature in very high-energyhadron hadron collisions”, Phys. Rev. D 47 (1993) 101,doi:10.1103/PhysRevD.47.101.
[7] F. Schissler and D. Zeppenfeld, “Parton shower effects on W and Z production via vectorboson fusion at NLO QCD”, JHEP 04 (2013) 057, doi:10.1007/JHEP04(2013)057,arXiv:1302.2884.
[8] CMS Collaboration, “Measurement of the hadronic activity in events with a Z and twojets and extraction of the cross section for the electroweak production of a Z with two jetsin pp collisions at
√s = 7 TeV”, JHEP 10 (2013) 062,
doi:10.1007/JHEP10(2013)062, arXiv:1305.7389.
[9] ATLAS Collaboration, “Measurement of the electroweak production of dijets inassociation with a Z-boson and distributions sensitive to vector boson fusion inproton-proton collisions at
√s = 8 TeV using the ATLAS detector”, JHEP 04 (2014) 031,
doi:10.1007/JHEP04(2014)031, arXiv:1401.7610.
[10] CMS Collaboration, “Measurement of electroweak production of two jets in associationwith a Z boson in proton-proton collisions at
√s = 8 TeV”, Eur. Phys. J. C75 (2015), no. 2,
66, doi:10.1140/epjc/s10052-014-3232-5, arXiv:1410.3153.

References 19
[11] CMS Collaboration, “Description and performance of track and primary-vertexreconstruction with the CMS tracker”, JINST 9 (2014) P10009,doi:10.1088/1748-0221/9/10/P10009, arXiv:1405.6569.
[12] CMS Collaboration, “Performance of electron reconstruction and selection with the CMSdetector in proton-proton collisions at
√s = 8 TeV”, JINST 10 (2015) P06005,
doi:10.1088/1748-0221/10/06/P06005, arXiv:1502.02701.
[13] CMS Collaboration Collaboration, “Performance of CMS muon reconstruction in ppcollision events at
√s = 7 TeV”, JINST 7 (2012) P10002,
doi:10.1088/1748-0221/7/10/P10002, arXiv:1206.4071.
[14] CMS Collaboration, “Determination of jet energy calibration and transverse momentumresolution in CMS”, JINST 6 (2011) P11002,doi:10.1088/1748-0221/6/11/P11002, arXiv:1107.4277.
[15] CMS Collaboration, “The CMS experiment at the CERN LHC”, JINST 3 (2008) S08004,doi:10.1088/1748-0221/3/08/S08004.
[16] J. Alwall et al., “MadGraph 5: going beyond”, JHEP 06 (2011) 128,doi:10.1007/JHEP06(2011)128, arXiv:1106.0522.
[17] J. Alwall et al., “The automated computation of tree-level and next-to-leading orderdifferential cross sections, and their matching to parton shower simulations”, JHEP 07(2014) 079, doi:10.1007/JHEP07(2014)079, arXiv:1405.0301.
[18] T. Sjostrand, S. Mrenna, and P. Skands, “A brief introduction to PYTHIA 8.1”, Comput.Phys. Commun. 178 (2008) 852, doi:10.1016/j.cpc.2008.01.036,arXiv:0710.3820.
[19] T. Sjostrand et al., “An Introduction to PYTHIA 8.2”, Comput. Phys. Commun. 191 (2015)159–177, doi:10.1016/j.cpc.2015.01.024, arXiv:1410.3012.
[20] NNPDF Collaboration, “Unbiased global determination of parton distributions and theiruncertainties at NNLO and at LO”, Nucl. Phys. B855 (2012) 153–221,doi:10.1016/j.nuclphysb.2011.09.024, arXiv:1107.2652.
[21] CMS Collaboration, “Event generator tunes obtained from underlying event andmultiparton scattering measurements”, arXiv:1512.00815.
[22] K. Arnold et al., “VBFNLO: A parton level Monte Carlo for processes with electroweakbosons”, Comput. Phys. Commun. 180 (2009) 1661,doi:10.1016/j.cpc.2009.03.006, arXiv:0811.4559.
[23] J. Baglio et al., “VBFNLO: a parton level Monte Carlo for processes with electroweakbosons — manual for version 2.7.0”, (2011). arXiv:1107.4038.
[24] K. Arnold et al., “Release Note – VBFNLO-2.6.0”, (2012). arXiv:1207.4975.
[25] R. Frederix and S. Frixione, “Merging meets matching in MC@NLO”, JHEP 12 (2012)061, doi:10.1007/JHEP12(2012)061, arXiv:1209.6215.
[26] M. L. Mangano, M. Moretti, F. Piccinini, and M. Treccani, “Matching matrix elements andshower evolution for top-quark production in hadronic collisions”, JHEP 01 (2007) 013,doi:10.1088/1126-6708/2007/01/013, arXiv:hep-ph/0611129.

20 References
[27] J. Alwall et al., “Comparative study of various algorithms for the merging of partonshowers and matrix elements in hadronic collisions”, Eur. Phys. J. C 53 (2008) 473,doi:10.1140/epjc/s10052-007-0490-5, arXiv:0706.2569.
[28] K. Melnikov and F. Petriello, “Electroweak gauge boson production at hadron collidersthrough O(α2
S)”, Phys. Rev. D 74 (2006) 114017, doi:10.1103/PhysRevD.74.114017,arXiv:hep-ph/0609070.
[29] P. Nason, “A new method for combining NLO QCD with shower Monte Carloalgorithms”, JHEP 11 (2004) 040, doi:10.1088/1126-6708/2004/11/040,arXiv:hep-ph/0409146.
[30] S. Frixione, P. Nason, and C. Oleari, “Matching NLO QCD computations with partonshower simulations: the POWHEG method”, JHEP 11 (2007) 070,doi:10.1088/1126-6708/2007/11/070, arXiv:0709.2092.
[31] S. Alioli, P. Nason, C. Oleari, and E. Re, “A general framework for implementing NLOcalculations in shower Monte Carlo programs: the POWHEG BOX”, JHEP 06 (2010) 043,doi:10.1007/JHEP06(2010)043, arXiv:1002.2581.
[32] N. Kidonakis, “Differential and total cross sections for top pair and single topproduction”, in Proceedings of the XX International Workshop on Deep-Inelastic Scatteringand Related Subjects. Bonn, Germany, 2012. arXiv:1205.3453.doi:10.3204/DESY-PROC-2012-02/251.
[33] M. Czakon, P. Fiedler, and A. Mitov, “Total Top-Quark Pair-Production Cross Section atHadron Colliders Through O(α4
S)”, Phys. Rev. Lett. 110 (2013) 252004,doi:10.1103/PhysRevLett.110.252004, arXiv:1303.6254.
[34] S. Alioli, P. Nason, C. Oleari, and E. Re, “NLO single-top production matched withshower in POWHEG: s- and t-channel contributions”, JHEP 09 (2009) 111,doi:10.1088/1126-6708/2009/09/111, arXiv:0907.4076. [Erratum:doi:10.1007/JHEP02(2010)011].
[35] E. Re, “Single-top Wt-channel production matched with parton showers using thePOWHEG method”, Eur. Phys. J. C 71 (2011) 1547,doi:10.1140/epjc/s10052-011-1547-z, arXiv:1009.2450.
[36] N. Kidonakis, “Top Quark Production”, (2013). arXiv:1311.0283.
[37] J. M. Campbell and R. K. Ellis, “MCFM for the Tevatron and the LHC”, Nucl. Phys. BProc. Suppl. 205-206 (2010) 10, doi:10.1016/j.nuclphysbps.2010.08.011,arXiv:1007.3492.
[38] J. Allison et al., “Geant4 developments and applications”, IEEE Trans. Nucl. Sci. 53 (2006)270, doi:10.1109/TNS.2006.869826.
[39] GEANT4 Collaboration, “GEANT4—a simulation toolkit”, Nucl. Instrum. Meth. A 506(2003) 250, doi:10.1016/S0168-9002(03)01368-8.
[40] CMS Collaboration, “Performance of CMS muon reconstruction in pp collision events at√s = 7 TeV”, JINST 7 (2012) P10002, doi:10.1088/1748-0221/7/10/P10002,
arXiv:1206.4071.
References 21
[41] Particle Data Group Collaboration, “Review of Particle Physics”, Chin. Phys. C40 (2016),no. 10, 100001, doi:10.1088/1674-1137/40/10/100001.
[42] CMS Collaboration, “Particle–flow event reconstruction in CMS and performance for jets,taus, and Emiss
T ”, CMS Physics Analysis Summary CMS-PAS-PFT-09-001, 2009.
[43] CMS Collaboration, “Commissioning of the Particle-flow Event Reconstruction with thefirst LHC collisions recorded in the CMS detector”, CMS Physics Analysis SummaryCMS-PAS-PFT-10-001, 2010.
[44] CMS Collaboration, “Commissioning of the particle-flow reconstruction inminimum-bias and jet events from pp collisions at 7 TeV”, CMS Physics AnalysisSummary CMS-PAS-PFT-10-002, 2010.
[45] M. Cacciari and G. P. Salam, “Dispelling the N3 myth for the kt jet-finder”, Phys. Lett. B641 (2006) 57, doi:10.1016/j.physletb.2006.08.037, arXiv:hep-ph/0512210.
[46] M. Cacciari, G. P. Salam, and G. Soyez, “The anti-kt jet clustering algorithm”, JHEP 04(2008) 063, doi:10.1088/1126-6708/2008/04/063, arXiv:0802.1189.
[47] CMS Collaboration, “Jet algorithms performance in 13 TeV data”, CMS Physics AnalysisSummary CMS-PAS-JME-16-003, 2017.
[48] CMS Collaboration, “Pileup Jet Identification”, CMS Physics Analysis SummaryCMS-PAS-JME-13-005, 2013.
[49] CMS Collaboration, “Performance of quark/gluon discrimination using pp collision dataat√
s = 8 TeV”, CMS Physics Analysis Summary CMS-PAS-JME-13-002, 2013.
[50] H. Voss, A. Hocker, J. Stelzer, and F. Tegenfeldt, “TMVA, the Toolkit for Multivariate DataAnalysis with ROOT”, in XIth International Workshop on Advanced Computing and AnalysisTechniques in Physics Research (ACAT), p. 40. 2007. arXiv:physics/0703039.
[51] G. Cowan, K. Cranmer, E. Gross, and O. Vitells, “Asymptotic formulae forlikelihood-based tests of new physics”, Eur. Phys. J. C 71 (2011) 1554,doi:10.1140/epjc/s10052-011-1554-0, arXiv:1007.1727.
[52] CMS Collaboration, “Tracking and Primary Vertex Results in First 7 TeV Collisions”,CMS Physics Analysis Summary CMS-PAS-TRK-10-005, 2010.
[53] CMS Collaboration, “Commissioning of TrackJets in pp Collisions at√
s = 7 TeV”, CMSPhysics Analysis Summary CMS-PAS-JME-10-006, 2010.
[54] CMS Collaboration, “Performance of jet reconstruction with charged tracks only”, CMSPhysics Analysis Summary CMS-PAS-JME-08-001, 2009.


![[G] g a g o g u g u e g u i](https://static.fdocuments.us/doc/165x107/56815328550346895dc14ece/g-g-a-g-o-g-u-g-u-e-g-u-i-56a5bc856ce31.jpg)


