CMS National Patient Safety Initiative for Surgical Care National Patient Safety Initiative for...
23
1 CMS National Patient Safety Initiative for Surgical Care Ongoing Opportunities for Improvement Ongoing Opportunities for Improvement Dale W. Bratzler, DO, MPH President and CEO Oklahoma Foundation for Medical Quality An update – where are we at now?
Transcript of CMS National Patient Safety Initiative for Surgical Care National Patient Safety Initiative for...
1
CMS National Patient Safety Initiative for Surgical Care
Ongoing Opportunities for ImprovementOngoing Opportunities for Improvement
Dale W. Bratzler, DO, MPHPresident and CEO
Oklahoma Foundation for Medical Quality
An update – where are we at now?
2
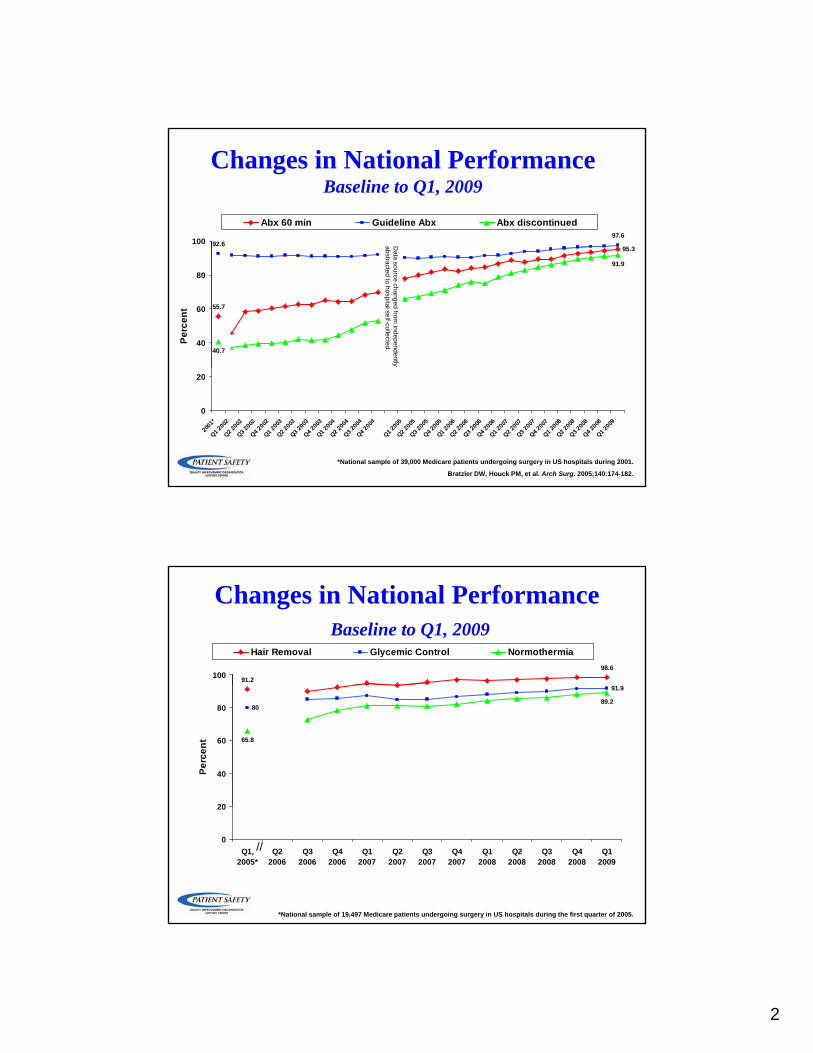
Changes in National PerformanceBaseline to Q1, 2009
95 3
97.692.6100
Abx 60 min Guideline Abx Abx discontinued
Da
95.3
55.7
91.9
40.740
60
80
Perc
ent
Data source changed from
independently abstracted to hospital self-collected.
0
20
2001
*
Q1 200
2
Q2 200
2
Q3 200
2
Q4 200
2
Q1 200
3
Q2 200
3
Q3 200
3
Q4 200
3
Q1 200
4
Q2 200
4
Q3 200
4
Q4 200
4
Q1 200
5
Q2 200
5
Q3 200
5
Q4 200
5
Q1 200
6
Q2 200
6
Q3 200
6
Q4 200
6
Q1 200
7
Q2 200
7
Q3 200
7
Q4 200
7
Q1 200
8
Q2 200
8
Q3 200
8
Q4 200
8
Q1 200
9
*National sample of 39,000 Medicare patients undergoing surgery in US hospitals during 2001.
Bratzler DW, Houck PM, et al. Arch Surg. 2005;140:174-182.
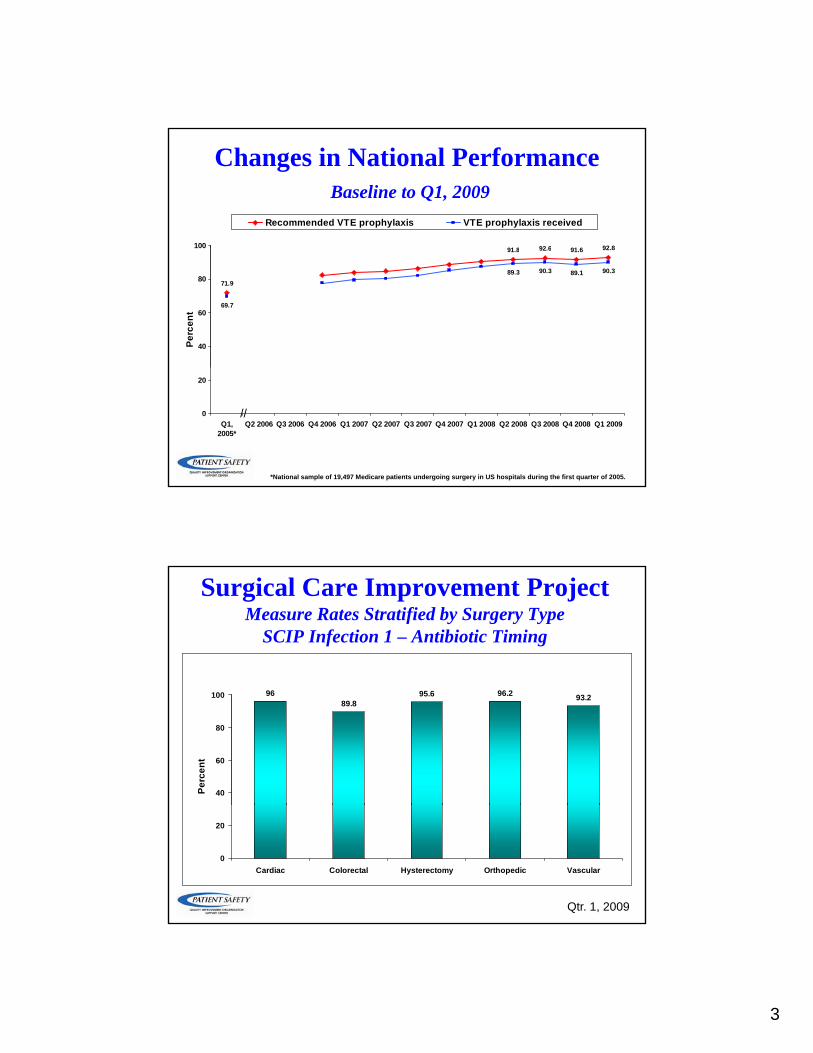
Changes in National PerformanceBaseline to Q1, 2009
98.6
91.2100
Hair Removal Glycemic Control Normothermia
91.9
89.280
65.8
20
40
60
80
Perc
ent
0
20
Q1,2005*
Q22006
Q32006
Q42006
Q12007
Q22007
Q32007
Q42007
Q12008
Q22008
Q32008
Q42008
Q12009
//
*National sample of 19,497 Medicare patients undergoing surgery in US hospitals during the first quarter of 2005.
3
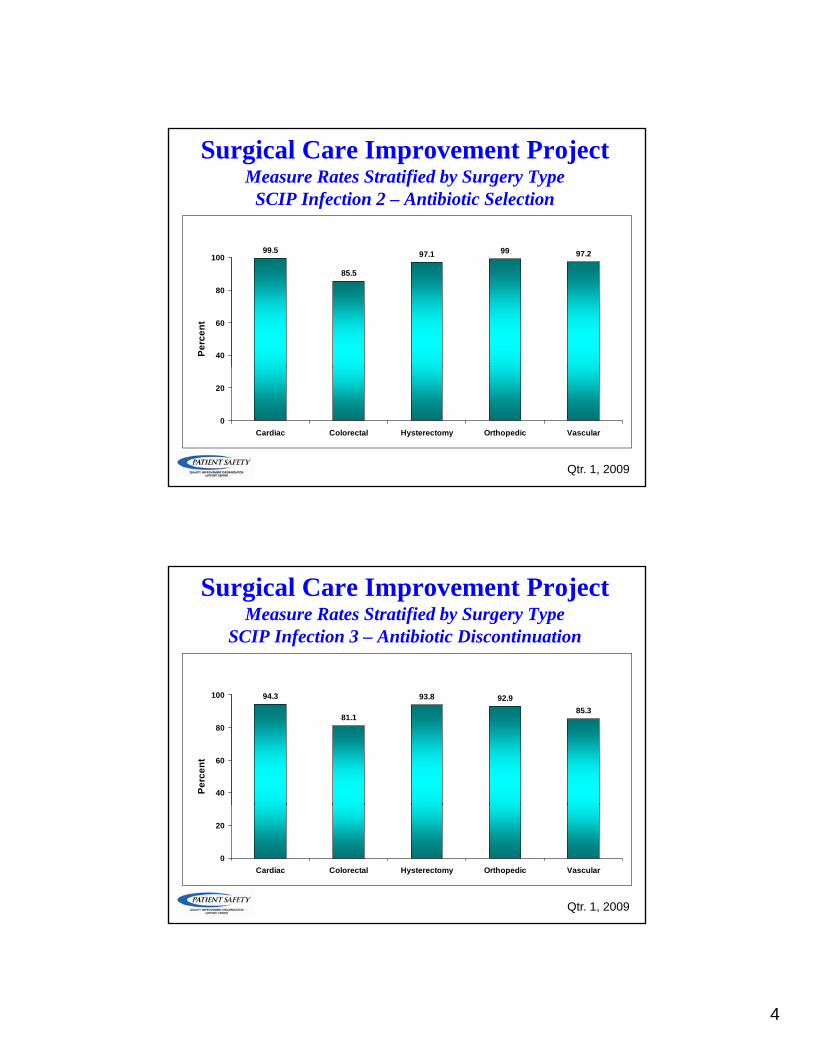
Changes in National PerformanceBaseline to Q1, 2009
92 6 91 6 92 891 8100
Recommended VTE prophylaxis VTE prophylaxis received
92.6 91.6 92.8
90.3 89.1 90.3
71.9
91.8
69.7
89.3
40
60
80
100
Perc
ent
0
20
Q1,2005*
Q2 2006 Q3 2006 Q4 2006 Q1 2007 Q2 2007 Q3 2007 Q4 2007 Q1 2008 Q2 2008 Q3 2008 Q4 2008 Q1 2009//
*National sample of 19,497 Medicare patients undergoing surgery in US hospitals during the first quarter of 2005.
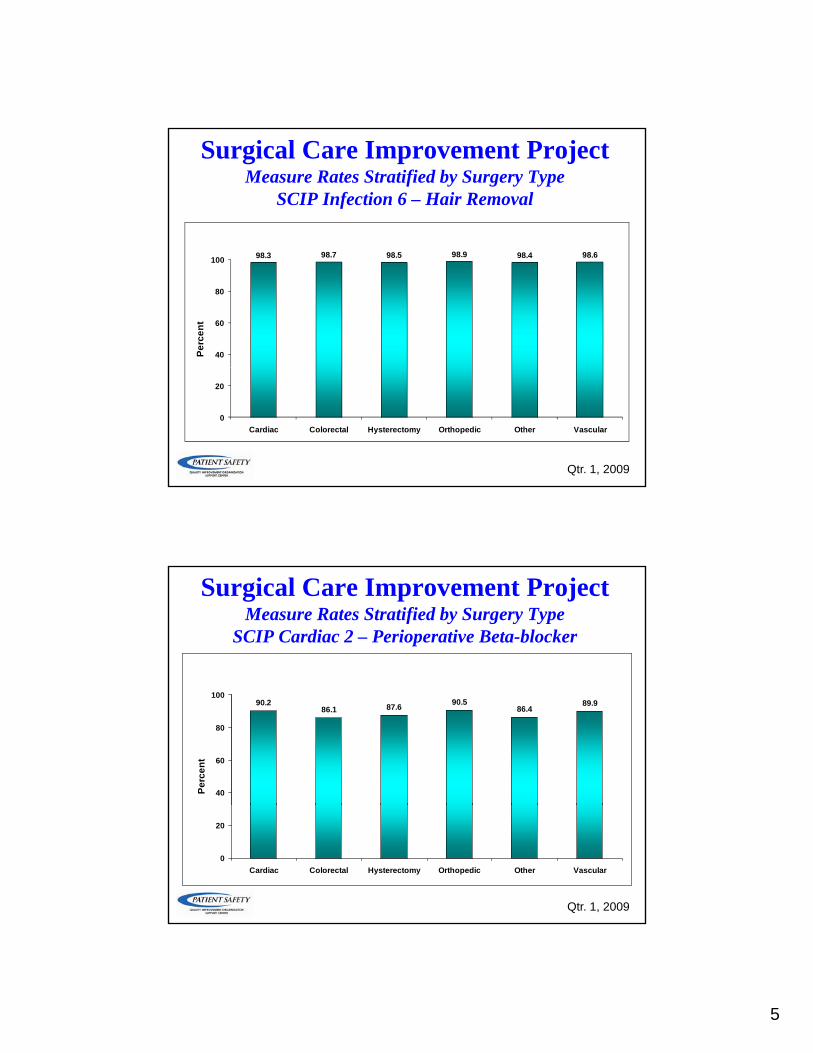
Surgical Care Improvement ProjectMeasure Rates Stratified by Surgery Type
SCIP Infection 1 – Antibiotic Timing
95.6 96.2 93.289.8
96
40
60
80
100
Perc
ent
0
20
Cardiac Colorectal Hysterectomy Orthopedic Vascular
Qtr. 1, 2009
4
99 5
Surgical Care Improvement ProjectMeasure Rates Stratified by Surgery Type
SCIP Infection 2 – Antibiotic Selection
97.1 99 97.2
85.5
99.5
40
60
80
100
Perc
ent
0
20
Cardiac Colorectal Hysterectomy Orthopedic Vascular
Qtr. 1, 2009
Surgical Care Improvement ProjectMeasure Rates Stratified by Surgery Type
SCIP Infection 3 – Antibiotic Discontinuation
93.8 92.985.3
81.1
94.3
40
60
80
100
Perc
ent
0
20
Cardiac Colorectal Hysterectomy Orthopedic Vascular
Qtr. 1, 2009
5
Surgical Care Improvement ProjectMeasure Rates Stratified by Surgery Type
SCIP Infection 6 – Hair Removal
98.3 98.7 98.5 98.9 98.4 98.6
40
60
80
100
Perc
ent
0
20
Cardiac Colorectal Hysterectomy Orthopedic Other Vascular
Qtr. 1, 2009
Surgical Care Improvement ProjectMeasure Rates Stratified by Surgery Type
SCIP Cardiac 2 – Perioperative Beta-blocker
87.6 90.586.4
89.986.1
90.2
40
60
80
100
Perc
ent
0
20
Cardiac Colorectal Hysterectomy Orthopedic Other Vascular
Qtr. 1, 2009
6
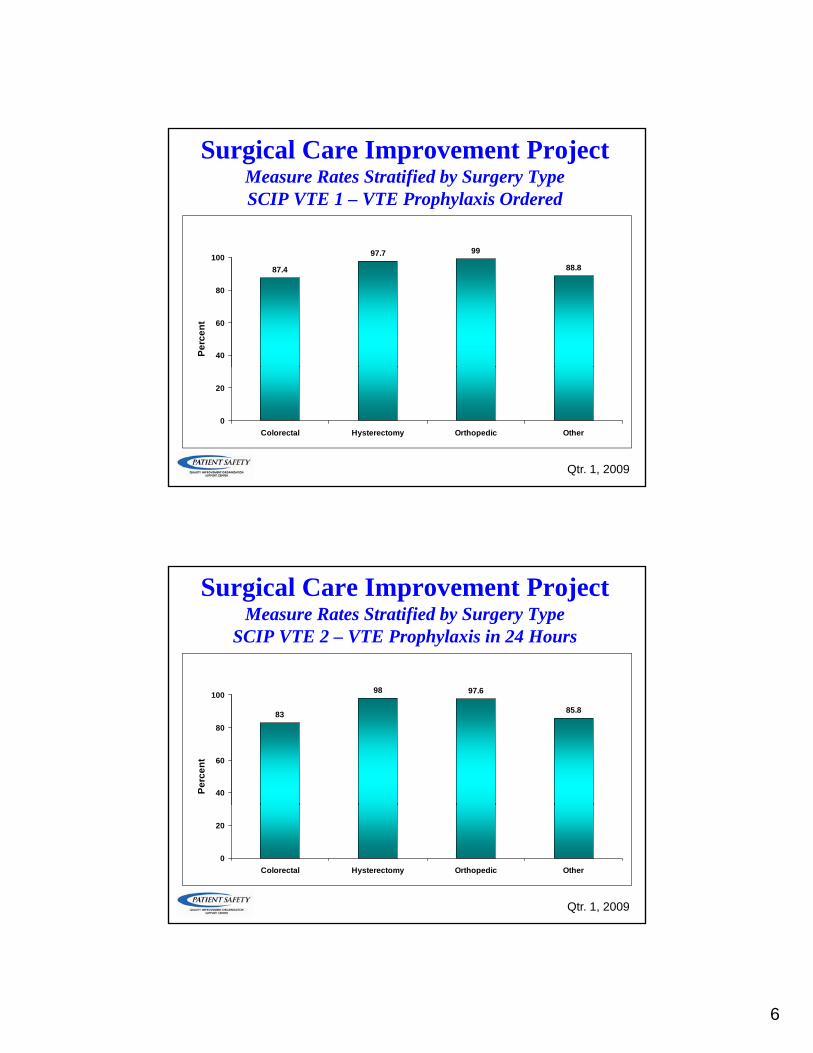
Surgical Care Improvement ProjectMeasure Rates Stratified by Surgery TypeSCIP VTE 1 – VTE Prophylaxis Ordered
99
88.8
97.7
87.4
40
60
80
100
Perc
ent
0
20
Colorectal Hysterectomy Orthopedic Other
Qtr. 1, 2009
Surgical Care Improvement ProjectMeasure Rates Stratified by Surgery Type
SCIP VTE 2 – VTE Prophylaxis in 24 Hours
97.6
85.8
98
83
40
60
80
100
Perc
ent
0
20
Colorectal Hysterectomy Orthopedic Other
Qtr. 1, 2009
7
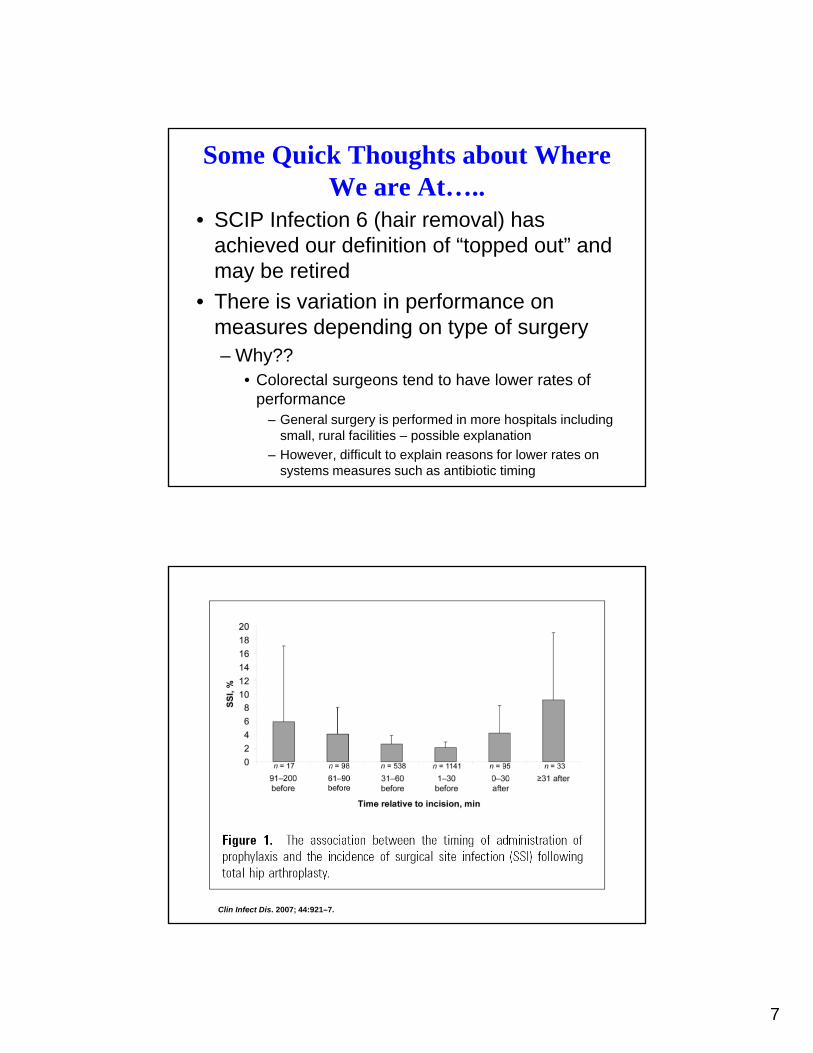
Some Quick Thoughts about Where We are At…..
• SCIP Infection 6 (hair removal) has achieved our definition of “topped out” andachieved our definition of topped out and may be retired
• There is variation in performance on measures depending on type of surgery– Why??
• Colorectal surgeons tend to have lower rates of performance
– General surgery is performed in more hospitals including small, rural facilities – possible explanation
– However, difficult to explain reasons for lower rates on systems measures such as antibiotic timing
Clin Infect Dis. 2007; 44:921–7.

8
Steinberg JP, et al. Ann Surg 2009;250: 10–16.
Song F, et al. Br J Surg. 1998 Sep;85(9):1232-41
9
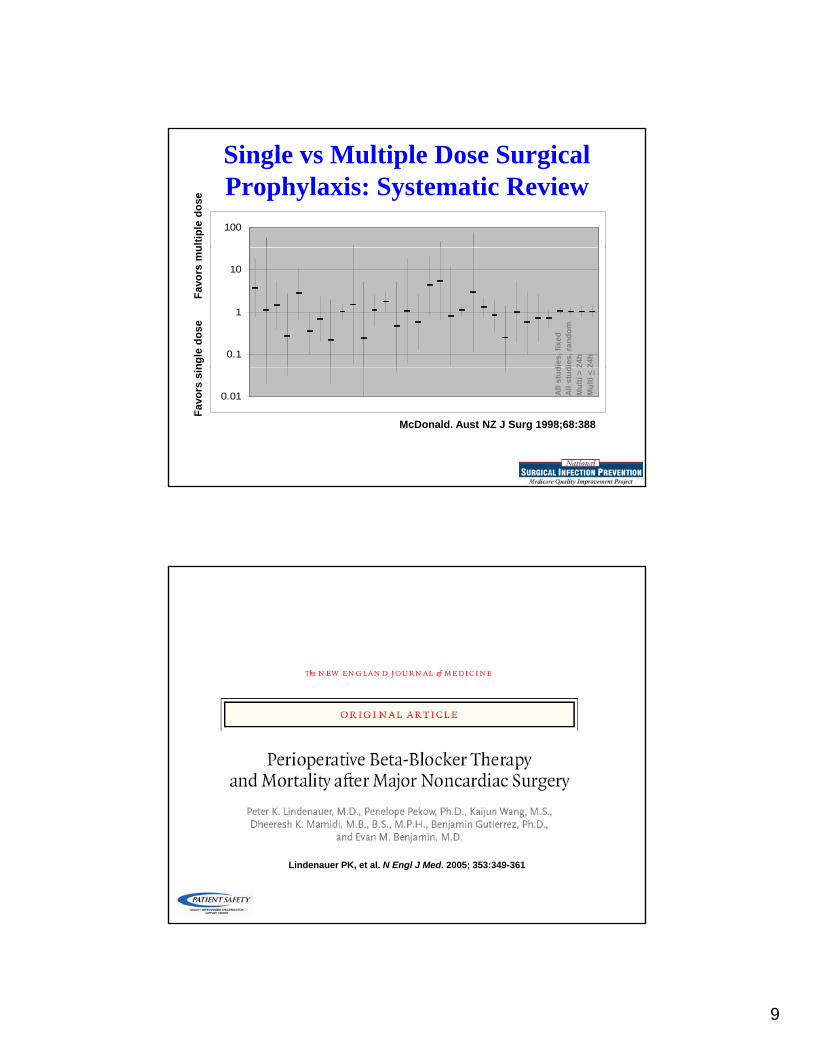
Single vs Multiple Dose Surgical Prophylaxis: Systematic Review100
ultip
le d
ose
0.1
1
10
dies
, fix
eddi
es, r
ando
m24
h24
h
ngle
dos
eFa
vors
mu
0.01
McDonald. Aust NZ J Surg 1998;68:388
All s
tud
All s
tud
Mul
ti >
2M
ulti
<2
Favo
rs s
in
Lindenauer PK, et al. N Engl J Med. 2005; 353:349-361

10
Revised Cardiac Index ScoreScore
• high-risk surgery
• ischemic heart disease
• cerebrovascular disease
• renal insufficiency
Lindenauer PK, et al. N Engl J Med. 2005; 353:349-361
• renal insufficiency
• diabetes
Beta-Blocker Withdrawal
Hoeks et al. Eur J Vasc Endovasc Surg 2006
11
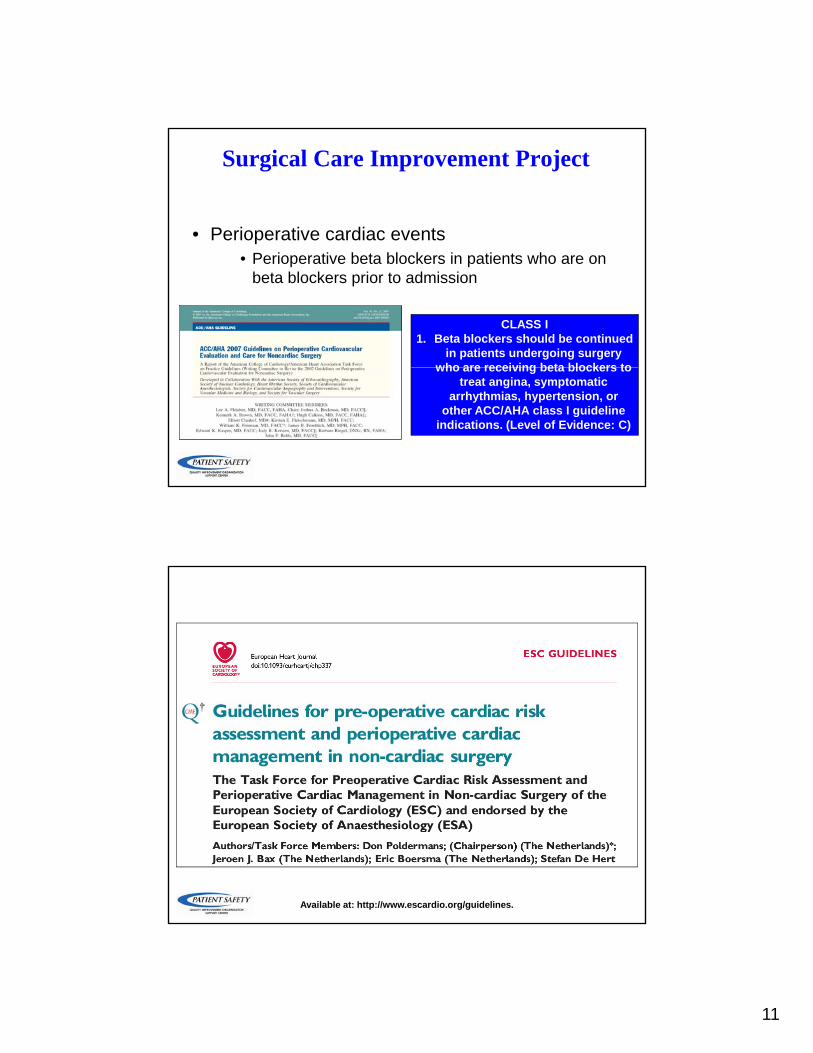
Surgical Care Improvement Project
• Perioperative cardiac events• Perioperative beta blockers in patients who are on
beta blockers prior to admission
CLASS I1. Beta blockers should be continued
in patients undergoing surgery who are receiving beta blockers towho are receiving beta blockers to
treat angina, symptomatic arrhythmias, hypertension, or
other ACC/AHA class I guideline indications. (Level of Evidence: C)
Available at: http://www.escardio.org/guidelines.

12
Treatment onset and the choice of the optimal dose ofb-blockers are closely linked. Perioperative myocardial ischaemia
and troponin release are reduced, and long-term outcome isimproved, in patients who have a lower heart rate. On the
other hand, bradycardia and hypotension should be avoided. Thishighlights the importance of preventing overtreatment with fixed
high initial doses.
13
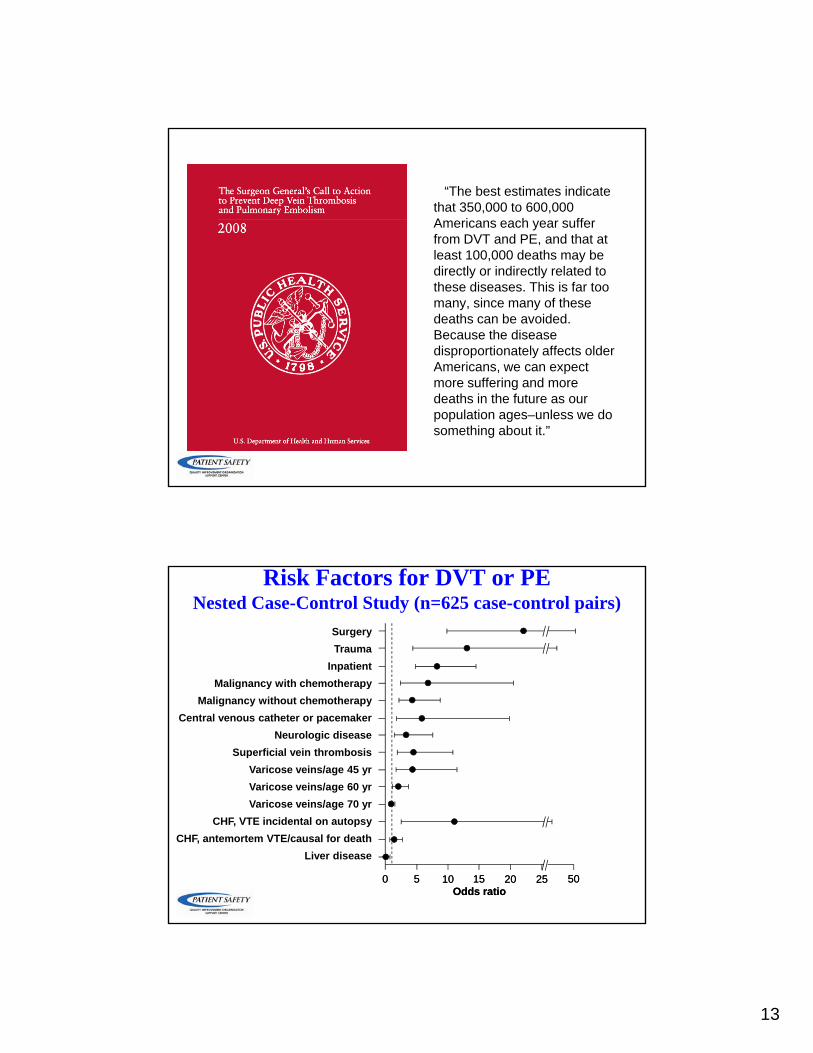
“The best estimates indicate that 350,000 to 600,000 Americans each year suffer from DVT and PE, and that at least 100,000 deaths may be directly or indirectly related to these diseases. This is far too many, since many of these deaths can be avoided. Because the disease disproportionately affects older Americans we can expectAmericans, we can expect more suffering and more deaths in the future as our population ages–unless we do something about it.”
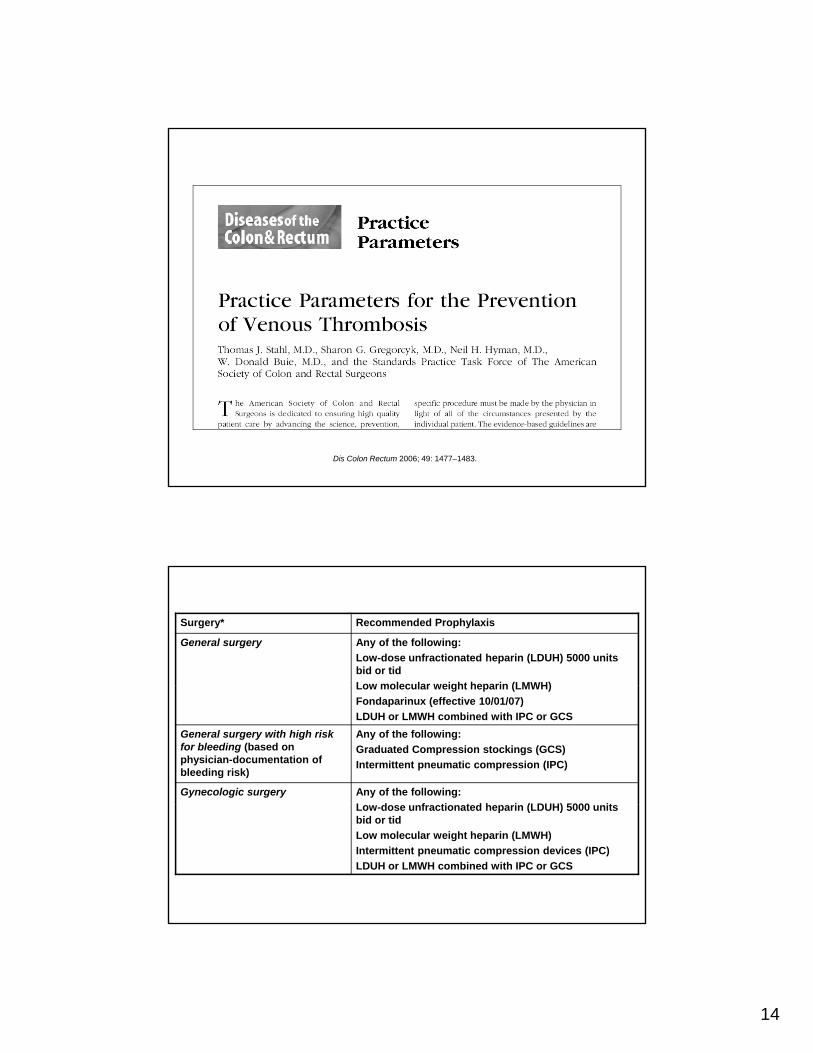
Risk Factors for DVT or PENested Case-Control Study (n=625 case-control pairs)
SurgeryTrauma
InpatientMalignancy with chemotherapyMalignancy with chemotherapy
Malignancy without chemotherapyCentral venous catheter or pacemaker
Neurologic diseaseSuperficial vein thrombosis
Varicose veins/age 45 yrVaricose veins/age 60 yrVaricose veins/age 70 yrVaricose veins/age 70 yr
CHF, VTE incidental on autopsyCHF, antemortem VTE/causal for death
Liver disease
00 55 1010 1515 2020 2525 5050Odds ratioOdds ratio
14
Dis Colon Rectum 2006; 49: 1477–1483.
Surgery* Recommended Prophylaxis
General surgery Any of the following:Low-dose unfractionated heparin (LDUH) 5000 units bid or tidLow molecular weight heparin (LMWH)Low molecular weight heparin (LMWH) Fondaparinux (effective 10/01/07)LDUH or LMWH combined with IPC or GCS
General surgery with high risk for bleeding (based on physician-documentation of bleeding risk)
Any of the following:Graduated Compression stockings (GCS)Intermittent pneumatic compression (IPC)
Gynecologic surgery Any of the following:L d f ti t d h i (LDUH) 5000 itLow-dose unfractionated heparin (LDUH) 5000 units bid or tidLow molecular weight heparin (LMWH) Intermittent pneumatic compression devices (IPC) LDUH or LMWH combined with IPC or GCS

15
The AAOS guidelines advocate mechanical compression devices and early mobilization in all patients. AAOS also says aspirin would not be the lone thromboprophylaxis measurebe the lone thromboprophylaxis measure, Norman Johanson, MD, chairman of the group that developed the AAOS guidelines, told OR Manager.
“Aspirin alone is not really acceptable to anybody ” he says noting that the issue really isanybody, he says, noting that the issue really is not use of aspirin alone but its use with mechanical prophylaxis.
Interview with Dale Bratzler and Norman Johanson. OR Manager. August 2009
New Measures for SCIP

16
Based on Medicare inpatients (N=35904) undergoing major surgery in 2001:– Eighty-six percent of patients undergoing major
operations had perioperative indwelling urinary catheters. Of these, 50% had catheters for longer th 2 d t ti l Th ti tthan 2 days postoperatively. These patients were twice as likely to develop urinary tract infections than patients with catheterization of 2 days or less.
Wald HL, Ma A, Bratzler DW, Kramer AM. Indwelling urinary catheter use in the postoperative period. Analysis of the National Surgical Infection Prevention Project data. Arch Surg. 2008143:551-557.
Physician’s Awareness of Urinary Catheters
Physician Unaware of ypatient’s catheter
(%)Student 21Intern 22Resident 27Attending physician 38
Saint S, et al. Am J Med. 2000;109:476-480.
17
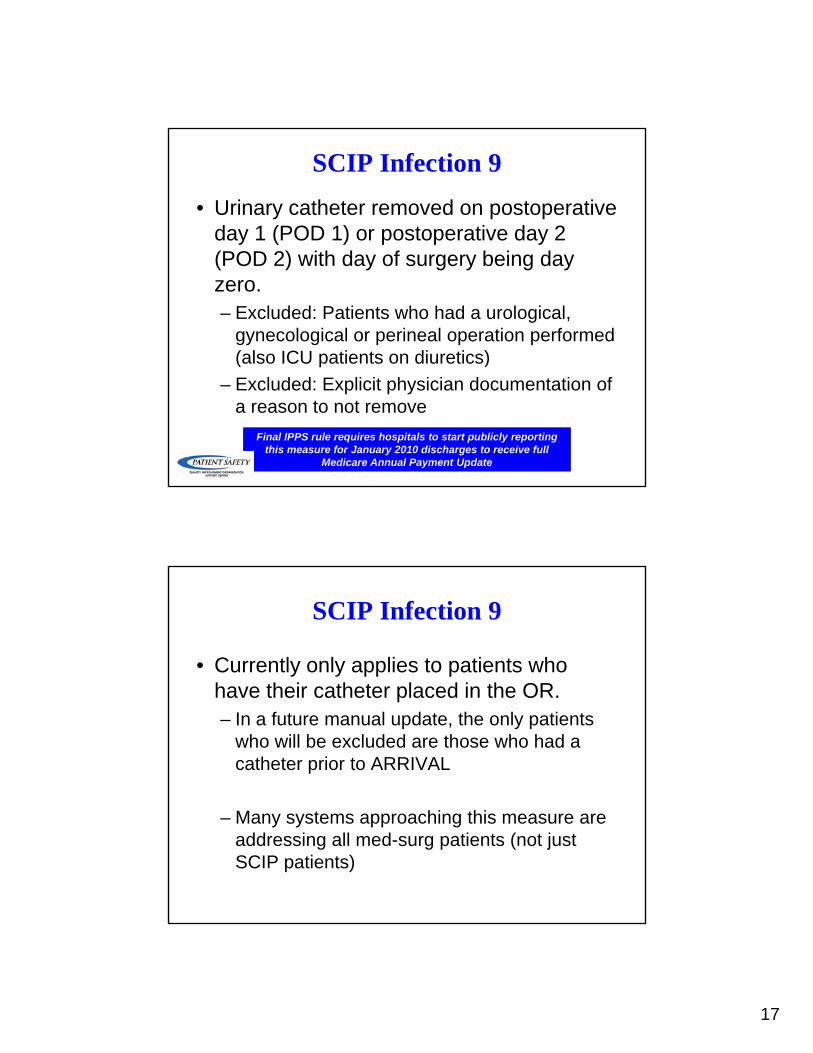
SCIP Infection 9• Urinary catheter removed on postoperative
day 1 (POD 1) or postoperative day 2 (POD 2) with day of surgery being day zero. – Excluded: Patients who had a urological,
gynecological or perineal operation performed (also ICU patients on diuretics)( )
– Excluded: Explicit physician documentation of a reason to not remove
Final IPPS rule requires hospitals to start publicly reporting this measure for January 2010 discharges to receive full
Medicare Annual Payment Update
SCIP Infection 9
• Currently only applies to patients who h th i th t l d i th ORhave their catheter placed in the OR.– In a future manual update, the only patients
who will be excluded are those who had a catheter prior to ARRIVAL
– Many systems approaching this measure are addressing all med-surg patients (not just SCIP patients)
18
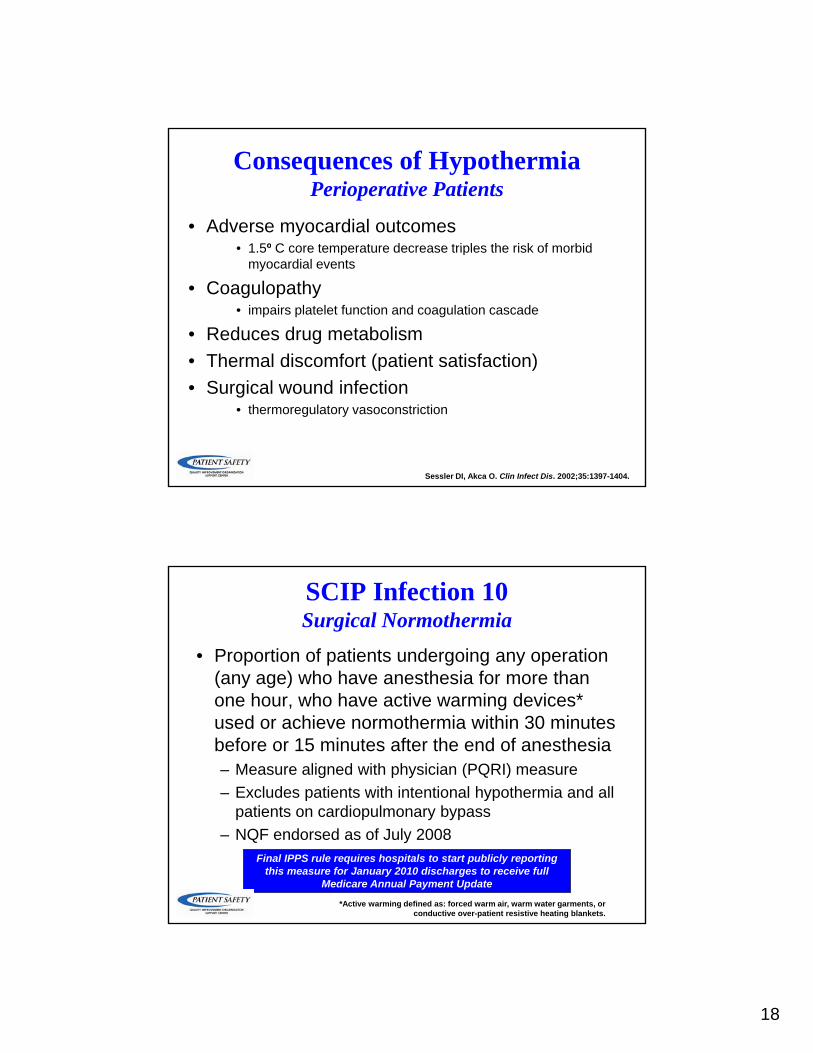
Consequences of HypothermiaPerioperative Patients
• Adverse myocardial outcomes• 1 5º C core temperature decrease triples the risk of morbid• 1.5º C core temperature decrease triples the risk of morbid
myocardial events
• Coagulopathy• impairs platelet function and coagulation cascade
• Reduces drug metabolism• Thermal discomfort (patient satisfaction)(p )• Surgical wound infection
• thermoregulatory vasoconstriction
Sessler DI, Akca O. Clin Infect Dis. 2002;35:1397-1404.
SCIP Infection 10Surgical Normothermia
• Proportion of patients undergoing any operation (any age) who have anesthesia for more than ( y g )one hour, who have active warming devices* used or achieve normothermia within 30 minutes before or 15 minutes after the end of anesthesia– Measure aligned with physician (PQRI) measure– Excludes patients with intentional hypothermia and all
patients on cardiopulmonary bypass– NQF endorsed as of July 2008
Final IPPS rule requires hospitals to start publicly reporting this measure for January 2010 discharges to receive full
Medicare Annual Payment Update
*Active warming defined as: forced warm air, warm water garments, or conductive over-patient resistive heating blankets.

19
Other Issues in Measurement and Reporting
Other Measurement Issues• Expanded focus on patient outcomes,
costs, and efficiencycosts, and efficiency– Move away from processes of care
• e.g., 30-day mortality and readmission rates for AMI, HF, and pneumonia
• Capture data on care management from electronic sourceselectronic sources– Claims and EHRs
• Focus on care across settings
20
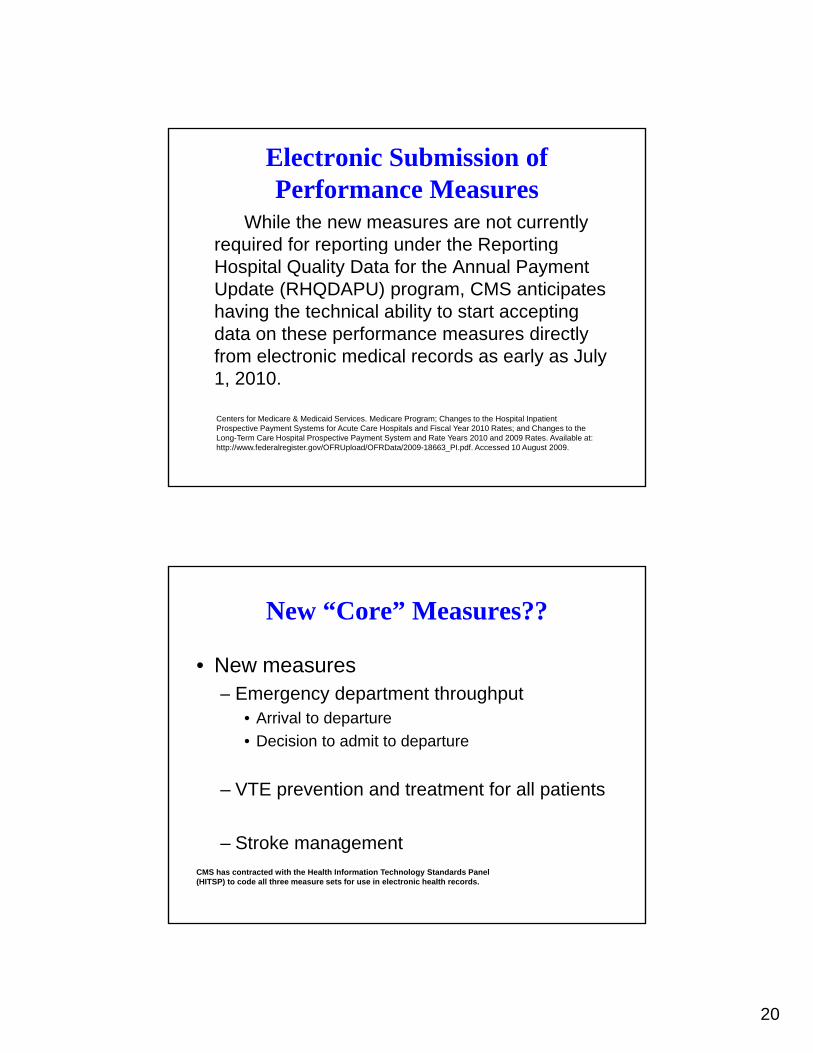
Electronic Submission of Performance Measures
While the new measures are not currently required for reporting under the Reportingrequired for reporting under the Reporting Hospital Quality Data for the Annual Payment Update (RHQDAPU) program, CMS anticipates having the technical ability to start accepting data on these performance measures directly from electronic medical records as early as July 1, 2010.
Centers for Medicare & Medicaid Services. Medicare Program; Changes to the Hospital Inpatient Prospective Payment Systems for Acute Care Hospitals and Fiscal Year 2010 Rates; and Changes to the Long-Term Care Hospital Prospective Payment System and Rate Years 2010 and 2009 Rates. Available at: http://www.federalregister.gov/OFRUpload/OFRData/2009-18663_PI.pdf. Accessed 10 August 2009.
New “Core” Measures??
• New measures– Emergency department throughput
• Arrival to departure• Decision to admit to departure
– VTE prevention and treatment for all patients
– Stroke managementCMS has contracted with the Health Information Technology Standards Panel (HITSP) to code all three measure sets for use in electronic health records.

21
Examples of “Topped Out” Measures
1 500
2,000
2,500AMI-1 ASA Arrival
1 500
2,000
2,500HF-4 Smoking Counsel
0
500
1,000
1,500
0-10 >10 -20
>20 -30
>30 -40
>40 -50
>50 -60
>60 -70
>70 -80
>80 -90
>90 -100
0
500
1,000
1,500
0-10 >10 -20
>20 -30
>30 -40
>40 -50
>50 -60
>60 -70
>70 -80
>80 -90
>90 -100
2,400
3,000
3,600PN-1 Oxygen Assess
2,000
2,500
3,000SCIP-6 Hair Removal
0
600
1,200
1,800
0-10 >10 -20
>20 -30
>30 -40
>40 -50
>50 -60
>60 -70
>70 -80
>80 -90
>90 -100
0
500
1,000
1,500
0-10 >10 -20
>20 -30
>30 -40
>40 -50
>50 -60
>60 -70
>70 -80
>80 -90
>90 -100
A measure was identified as "topped off" if its 75th percentile was within two standard errors of the 95th percentile and the truncated coefficient of variation (TCV) was smaller than 10. This definition was developed by the team at Brandeis University who are under contract to CMS to inform decisions related to composite measures of care and value-based purchasing.
Topped Off MeasuresMeasure # of hosp Stderr TCV 75th 95th Topped offAMI-1 2,720 0.1 3.3 100.0 100.0 Topped off AMI-2 2,518 0.1 5.0 99.5 100.0 NO AMI-3 1,650 0.2 5.8 100.0 100.0 Topped off AMI-4 1,668 0.1 2.6 100.0 100.0 Topped off AMI-5 2,527 0.1 4.0 100.0 100.0 Topped off AMI 6 2 657 0 2 5 6 98 100 0 NOAMI-6 2,657 0.2 5.6 98.5 100.0 NO AMI-7a 79 2.6 36.1 73.3 90.5 NO AMI-8a 1,331 0.5 17.9 88.2 96.7 NO HF-1 3,270 0.4 18.7 91.8 99.6 NO HF-2 3,284 0.2 6.6 99.0 100.0 NO HF-3 3,004 0.2 7.3 97.1 100.0 NO HF-4 2,679 0.2 5.4 100.0 100.0 Topped off PN-1 3,308 0.0 0.7 100.0 100.0 Topped off PN-2 3,282 0.3 13.0 94.3 98.9 NO PN-3a 2,706 0.2 6.2 100.0 100.0 Topped off PN-3b 3,203 0.1 5.3 96.1 98.9 NO PN-4 3,125 0.2 8.3 100.0 100.0 Topped off PN-5c 3,283 0.1 4.5 97.1 99.4 NO PN-6 3,256 0.2 6.2 93.2 97.2 NO PN-7 3,254 0.3 15.0 92.0 98.3 NO SCIP-1 3,189 0.2 8.2 95.6 98.5 NO SCIP-2 3,187 0.1 3.9 97.8 99.5 NO SCIP-3 3,185 0.2 10.1 93.4 97.8 NO SCIP-4 1,144 0.3 8.6 94.5 98.4 NO SCIP-6 3,249 0.2 4.5 100.0 100.0 Topped off SCIP-7 1,460 0.4 14.3 93.5 100.0 NO CARD-2 1,691 0.3 7.7 96.9 100.0 NO VTE-1 3,243 0.3 9.7 94.9 98.6 NO VTE-2 3,244 0.3 11.1 92.5 97.5 NO
22
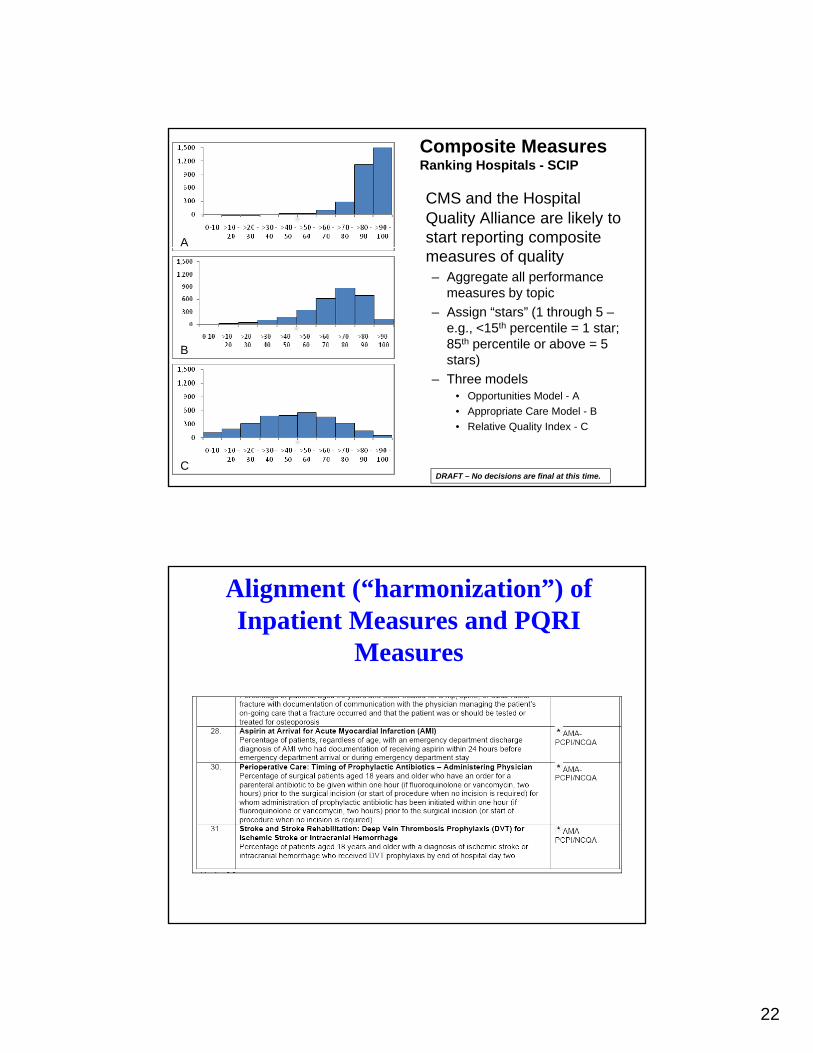
CMS and the Hospital Quality Alliance are likely to start reporting composite
Composite MeasuresRanking Hospitals - SCIP
Ameasures of quality– Aggregate all performance
measures by topic– Assign “stars” (1 through 5 –
e.g., <15th percentile = 1 star; 85th percentile or above = 5 stars)
B
– Three models• Opportunities Model - A• Appropriate Care Model - B• Relative Quality Index - C
CDRAFT – No decisions are final at this time.
Alignment (“harmonization”) of Inpatient Measures and PQRI
Measures