CMAQ Validation of Optical Parameters and PM...
32
CMAQ Validation of Optical Parameters and PM 10 Concentrations Based on LIDAR Experimental Campaign in the Metropolitan Area of Vitória - Brazil Taciana T. de A. Albuquerque, Uma Shankar, Erick Nascimento, Fabio Lopes, Gregori Moreira, Renato Sartório, Nadir Salvador, Ayres Loriato, Alexandre Magalhães, Eduardo Landulfo, Gehard Held, Neyval C. Reis Jr., Davidson Moreira. IPEN/USP GROUPS INVOLVED: Federal University of Espirito Santo (UFES), ES - Brazil. UNC - Institute for the Environment, Chapel Hill - NC, USA. Nuclear and Energy Research Institute (IPEN / USP), SP - Brazil. Meteorological Research Institute (IPMet / UNESP), SP - Brazil. 12th CMAS Conference 2013, Chapel Hill - NC
Transcript of CMAQ Validation of Optical Parameters and PM...
CMAQ Validation of Optical Parameters and PM10 Concentrations Based on LIDAR Experimental
Campaign in the Metropolitan Area of Vitória - Brazil
Taciana T. de A. Albuquerque, Uma Shankar, Erick Nascimento, Fabio Lopes, Gregori Moreira, Renato Sartório, Nadir Salvador, Ayres Loriato, Alexandre Magalhães, Eduardo Landulfo,
Gehard Held, Neyval C. Reis Jr., Davidson Moreira.
IPEN/USP
GROUPS INVOLVED:
Federal University of Espirito Santo (UFES), ES - Brazil.
UNC - Institute for the Environment, Chapel Hill - NC, USA.
Nuclear and Energy Research Institute (IPEN / USP), SP - Brazil.
Meteorological Research Institute (IPMet / UNESP), SP - Brazil.
12th CMAS Conference 2013, Chapel Hill - NC

OUTLINE
• Motivation
• Area of Study
• Experimental Campaing
• Modelling Tools
• Results
• Summary
2

Motivation
The Metropolitan Area of Vitória has a complex diversity of air pollutants from different kind of sources
3
MOTIVATION
4
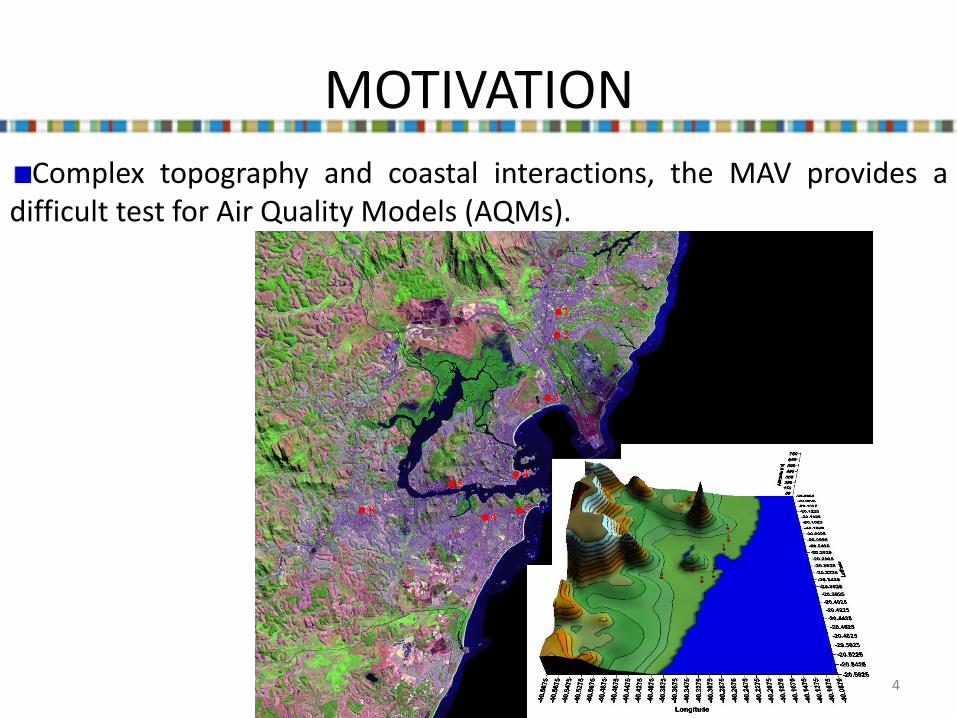
Complex topography and coastal interactions, the MAV provides a difficult test for Air Quality Models (AQMs).
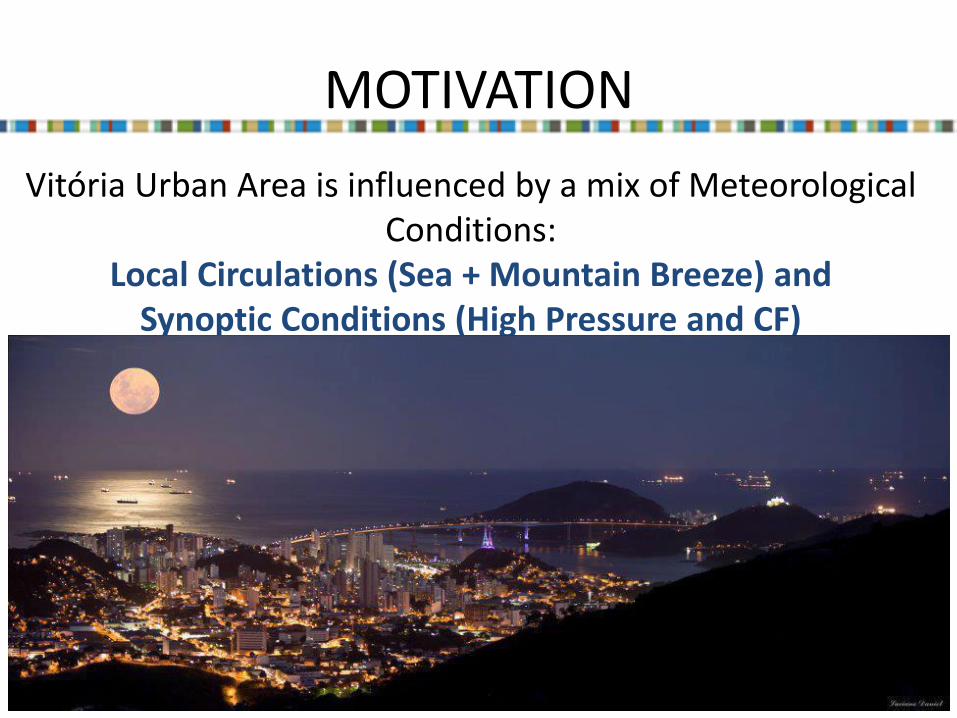
Vitória Urban Area is influenced by a mix of Meteorological Conditions:
Local Circulations (Sea + Mountain Breeze) and Synoptic Conditions (High Pressure and CF)
5
MOTIVATION

VITÓRIA
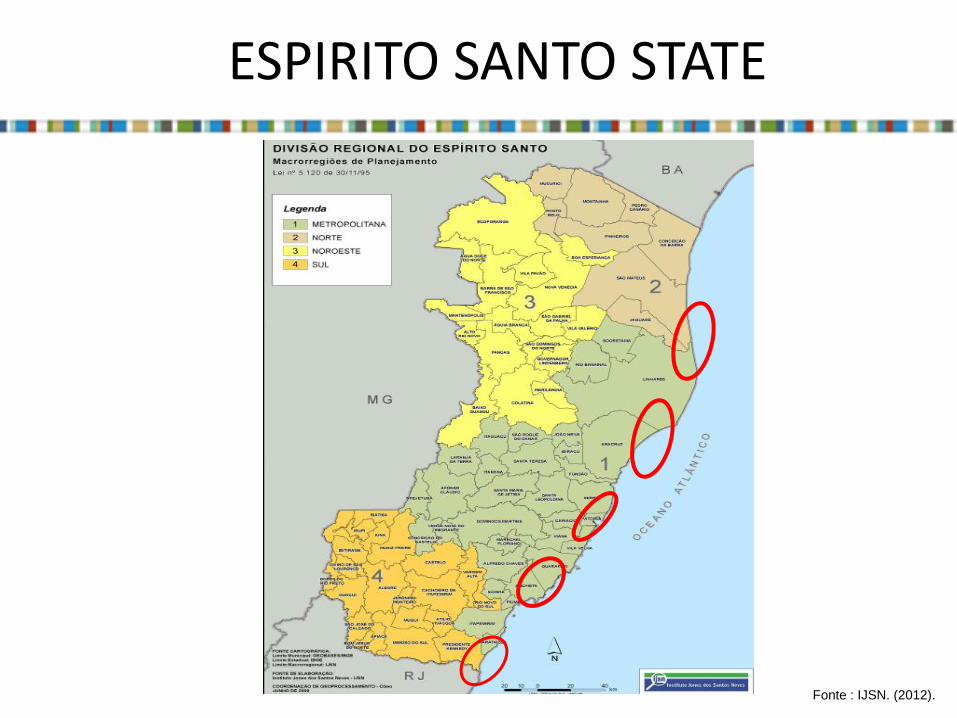
ESPIRITO SANTO STATE
Fonte : IJSN. (2012).
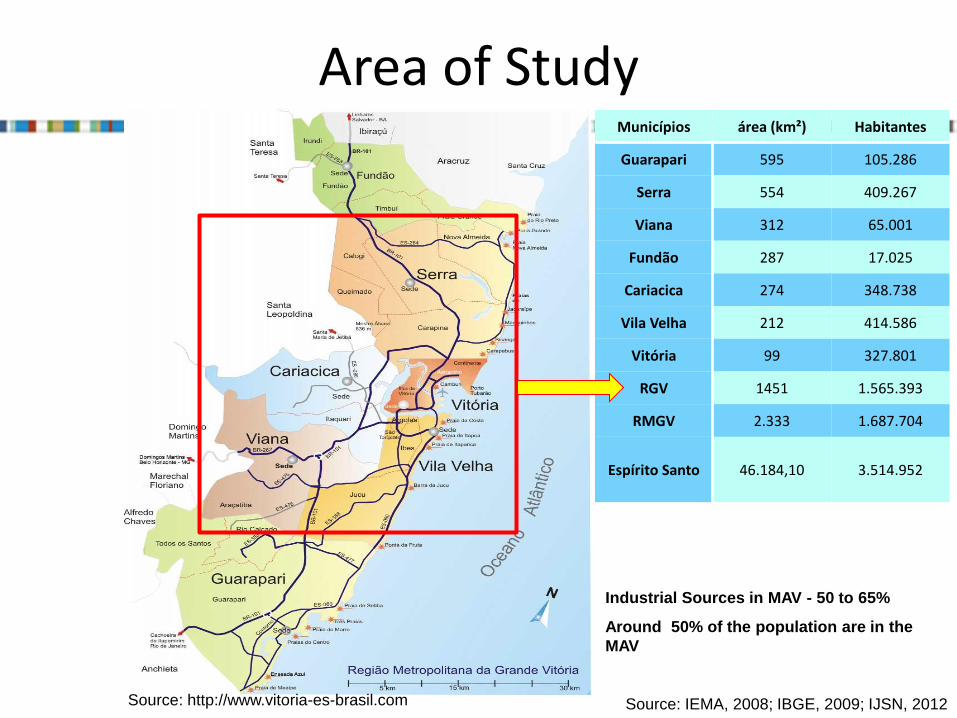
Area of Study
Source: IEMA, 2008; IBGE, 2009; IJSN, 2012
Municípios área (km²) Habitantes
Guarapari 595 105.286
Serra 554 409.267
Viana 312 65.001
Fundão 287 17.025
Cariacica 274 348.738
Vila Velha 212 414.586
Vitória 99 327.801
RGV 1451 1.565.393
RMGV 2.333 1.687.704
Espírito Santo 46.184,10 3.514.952
Source: http://www.vitoria-es-brasil.com
Industrial Sources in MAV - 50 to 65%
Around 50% of the population are in the
MAV

Metodologia
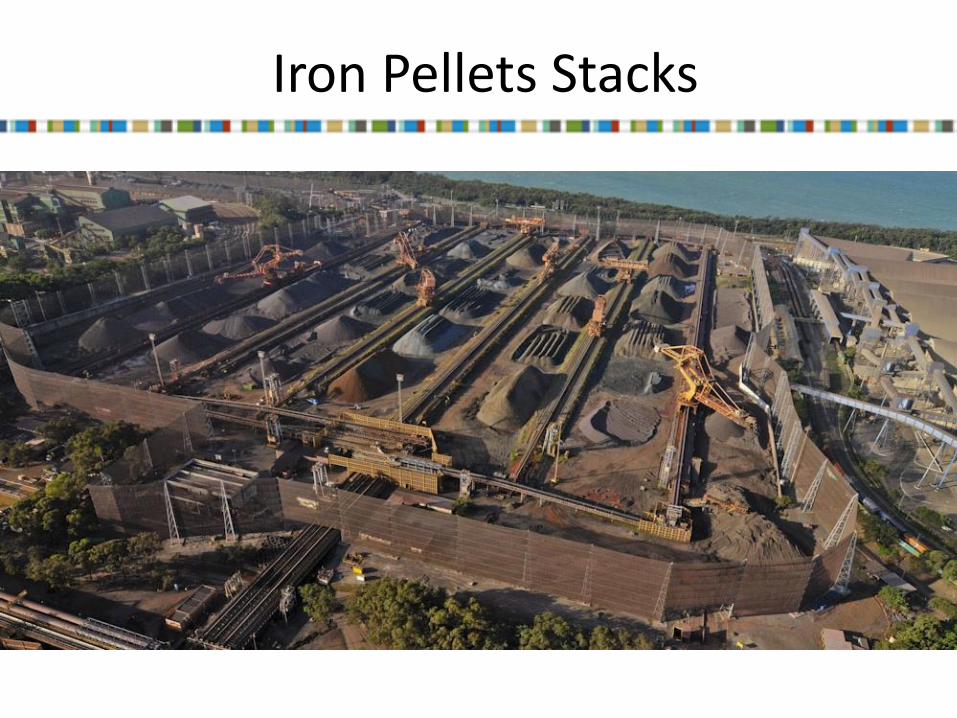
Iron Pellets Stacks

Stokeyard
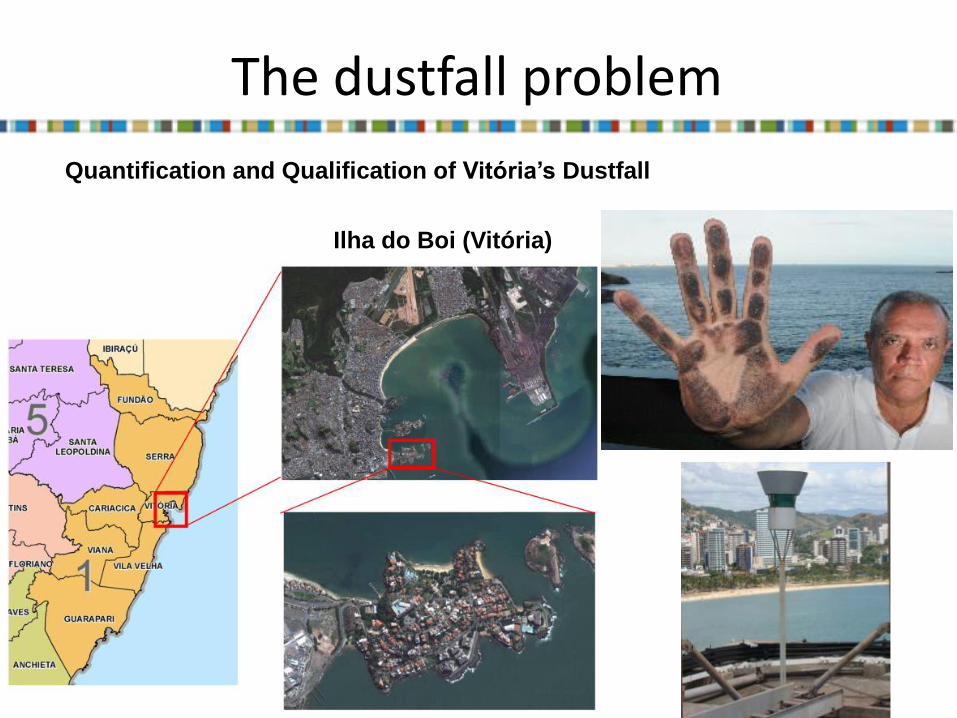
Ilha do Boi (Vitória)
Quantification and Qualification of Vitória’s Dustfall
The dustfall problem
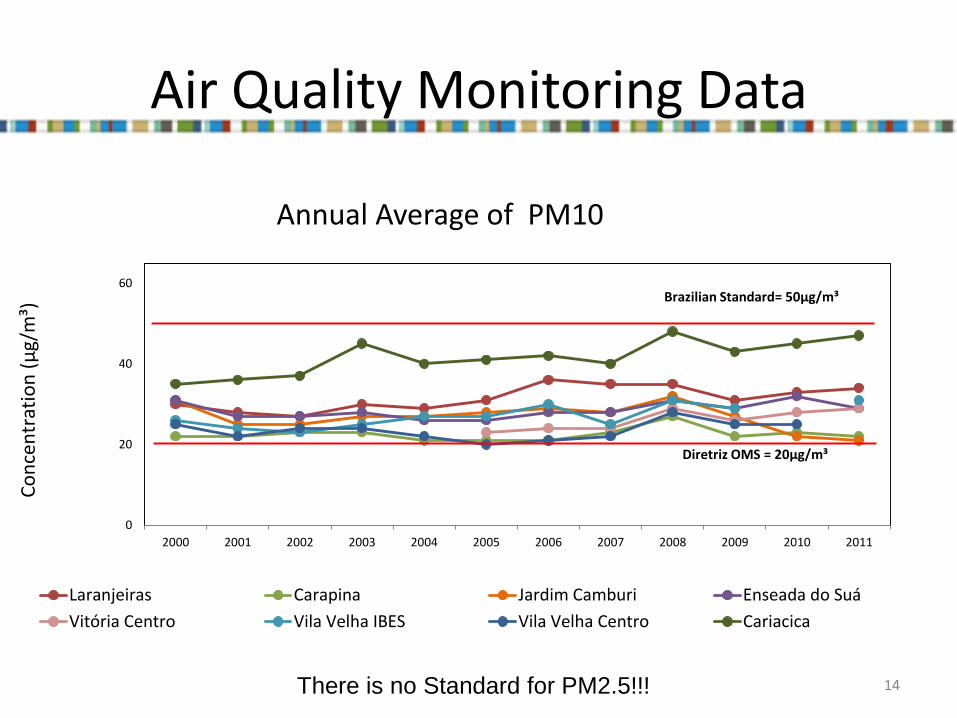
Air Quality Monitoring Data
14
0
20
40
60
2000 2001 2002 2003 2004 2005 2006 2007 2008 2009 2010 2011
Annual Average of PM10
Laranjeiras Carapina Jardim Camburi Enseada do Suá
Vitória Centro Vila Velha IBES Vila Velha Centro Cariacica
Co
nce
ntr
atio
n (
µg/
m³)
Brazilian Standard= 50µg/m³
Diretriz OMS = 20µg/m³
There is no Standard for PM2.5!!!

15
Official Inventory Emission Data
Source: IEMA (2011)

Official Inventory Emission Data
16
PERCENTUAL OF THE PM2.5 EMISSIONS
Source: IEMA (2011)
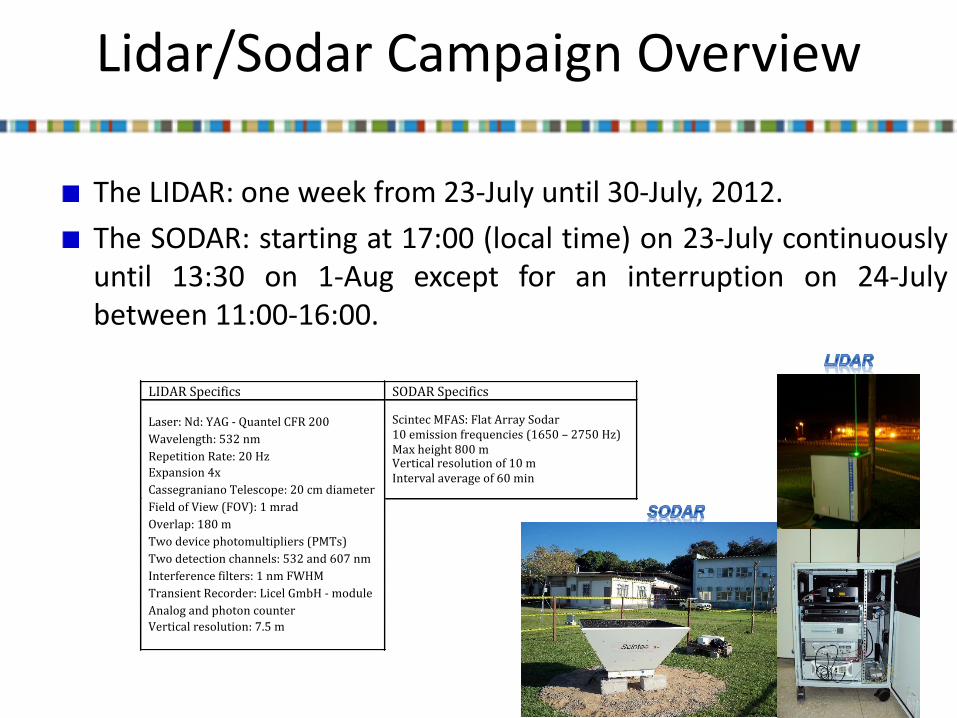
Lidar/Sodar Campaign Overview
The LIDAR: one week from 23-July until 30-July, 2012.
The SODAR: starting at 17:00 (local time) on 23-July continuously until 13:30 on 1-Aug except for an interruption on 24-July between 11:00-16:00.
17
LIDARSpecifics SODARSpecificsLaser:Nd:YAG-QuantelCFR200 ScintecMFAS:FlatArraySodar
10emissionfrequencies(1650–2750Hz)Maxheight800mVerticalresolutionof10mIntervalaverageof60min
Wavelength:532nm
RepetitionRate:20Hz
Expansion4x
CassegranianoTelescope:20cmdiameter
FieldofView(FOV):1mrad
Overlap:180m
Twodevicephotomultipliers(PMTs)
Twodetectionchannels:532and607nm
Interferencefilters:1nmFWHM
TransientRecorder:LicelGmbH-module
Analogandphotoncounter
Verticalresolution:7.5m
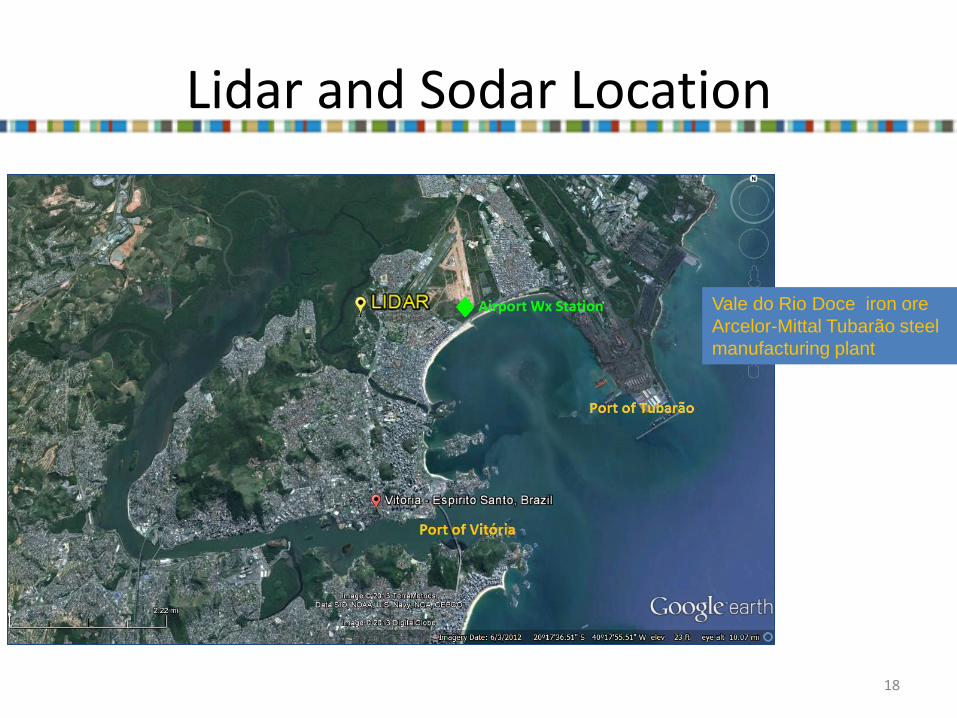
Lidar and Sodar Location
18
Vale do Rio Doce iron ore
Arcelor-Mittal Tubarão steel
manufacturing plant

Modelling Tools Meteorological Model: Weather Research and Forecasting (WRF) version 3.2.1
- Input Data: GFS data (1˚× 1˚) and USGS – Global Land Cover
Air Quality Model: CMAQ version 4.6
Emissions: SMOKE version 2.7
Physics option Scheme
Microphysics Thompson et al.
Long wave radiation
RRTM scheme
Short wave radiation
Dudhia scheme
Surface layer Pleim Xiu scheme
Land surface Pleim Xiu scheme
Planetary Boundary Layer
Pleim Xiu ACM2scheme
Cumulus Parameterization
Kain – Fritsh scheme
CMAQ WRF
Mechanism Option
Gas Phase Carbon Bond V
Aerosol module Aero4
Mechanism cb05_ae4_aq
20
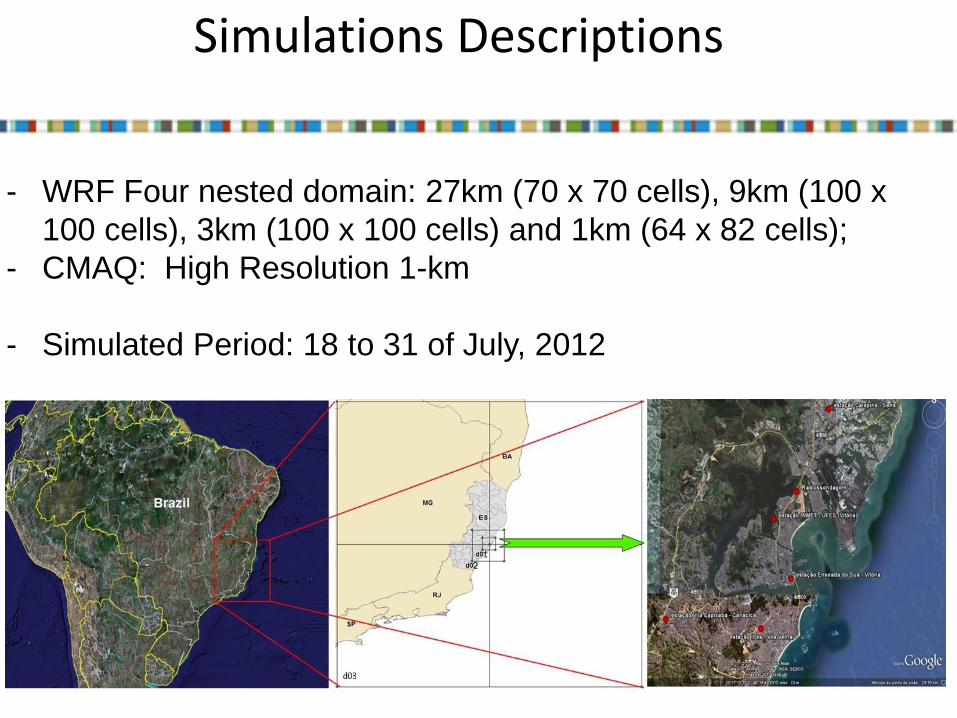
Simulations Descriptions
- WRF Four nested domain: 27km (70 x 70 cells), 9km (100 x
100 cells), 3km (100 x 100 cells) and 1km (64 x 82 cells);
- CMAQ: High Resolution 1-km
- Simulated Period: 18 to 31 of July, 2012

21
RESULTS

Synoptic Weather Conditions
22
Vitória
July 23, 2012 July 30, 2012
HP CF
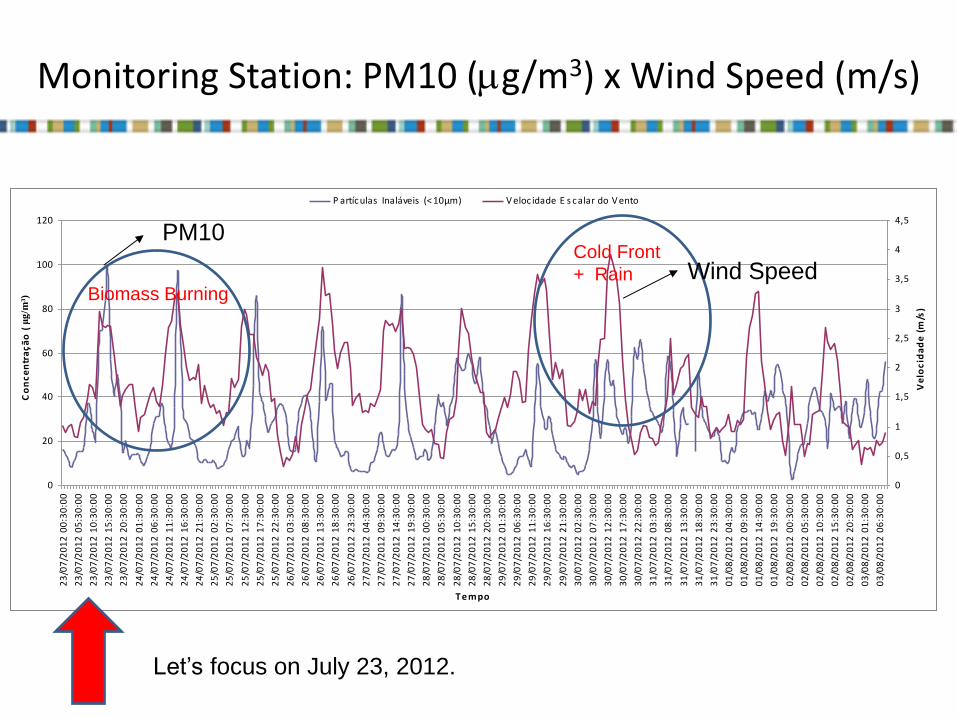
Monitoring Station: PM10 (mg/m3) x Wind Speed (m/s)
23
0
20
40
60
80
100
120
23
/07
/20
12
00
:30
:00
23
/07
/20
12
05
:30
:00
23
/07
/20
12
10
:30
:00
23
/07
/20
12
15
:30
:00
23
/07
/20
12
20
:30
:00
24
/07
/20
12
01
:30
:00
24
/07
/20
12
06
:30
:00
24
/07
/20
12
11
:30
:00
24
/07
/20
12
16
:30
:00
24
/07
/20
12
21
:30
:00
25
/07
/20
12
02
:30
:00
25
/07
/20
12
07
:30
:00
25
/07
/20
12
12
:30
:00
25
/07
/20
12
17
:30
:00
25
/07
/20
12
22
:30
:00
26
/07
/20
12
03
:30
:00
26
/07
/20
12
08
:30
:00
26
/07
/20
12
13
:30
:00
26
/07
/20
12
18
:30
:00
26
/07
/20
12
23
:30
:00
27
/07
/20
12
04
:30
:00
27
/07
/20
12
09
:30
:00
27
/07
/20
12
14
:30
:00
27
/07
/20
12
19
:30
:00
28
/07
/20
12
00
:30
:00
28
/07
/20
12
05
:30
:00
28
/07
/20
12
10
:30
:00
28
/07
/20
12
15
:30
:00
28
/07
/20
12
20
:30
:00
29
/07
/20
12
01
:30
:00
29
/07
/20
12
06
:30
:00
29
/07
/20
12
11
:30
:00
29
/07
/20
12
16
:30
:00
29
/07
/20
12
21
:30
:00
30
/07
/20
12
02
:30
:00
30
/07
/20
12
07
:30
:00
30
/07
/20
12
12
:30
:00
30
/07
/20
12
17
:30
:00
30
/07
/20
12
22
:30
:00
31
/07
/20
12
03
:30
:00
31
/07
/20
12
08
:30
:00
31
/07
/20
12
13
:30
:00
31
/07
/20
12
18
:30
:00
31
/07
/20
12
23
:30
:00
01
/08
/20
12
04
:30
:00
01
/08
/20
12
09
:30
:00
01
/08
/20
12
14
:30
:00
01
/08
/20
12
19
:30
:00
02
/08
/20
12
00
:30
:00
02
/08
/20
12
05
:30
:00
02
/08
/20
12
10
:30
:00
02
/08
/20
12
15
:30
:00
02
/08
/20
12
20
:30
:00
03
/08
/20
12
01
:30
:00
03
/08
/20
12
06
:30
:00
T empo
Co
nc
en
tra
çã
o (μ
g/m
³)
0
0,5
1
1,5
2
2,5
3
3,5
4
4,5
Ve
loc
ida
de
(m
/s)
P artículas Inaláveis (< 10µm) V eloc idade E s calar do V ento
Cold Front
+ Rain Biomass Burning
Wind Speed
PM10
Let’s focus on July 23, 2012.

LIDAR RESULTS: day time
24

HYSPLIT backward trajectories – 72 hours Start: 23 July 2012 - 13 UTC
25 Source lat: -20.2715, long:-40.3056
2000 m 2500 m 3000 m

July 23, 2012 – SMOKE PLUME
26 Source: www.cptec.inpe.br/queimadas

SODAR RESULTS
27
SODAR measured wind direction, wind speed, and w (vertical wind speed) beginning at 17:00.
Sea Breeze
Wind speed and w show
very calm winds (<3 m/s) in
the PBL (~200 m) - night
time.

28
SODAR RESULTS
NW N
NE

CMAQ PRELIMINARY RESULTS
29

The AOD (integration of the extinction coefficient) =
0.191
Validation of the CMAQ AOD Preliminary Results (July 23, 2012)
30
TERRA satellite Overpass time: 12:10 UTC
Development code from CMAS
for AOD by Binkowski and
Shankar (2012)
The AOD LIDAR was similar to CMAQ but it was much larger than
the AOD measured by the MODIS radiometer
LIDAR Extinction, Backscatter and
Lidar Ratio Profile Results
site coordinates:
Lat: -20.2715 Long: -40.3056
AOD CMAQ = 0.183 AOD MODIS = 0.086 *These measurements was conducted using only the elastic channel (532 nm)
Summary
The results of the instrument campaign show a regular occurrence of the sea breeze circulation during high pressure synoptic conditions with light synoptic winds and clear skies;
High PM10 concentrations were found mainly in the first days of the campaign because of the weather conditions;
In July 23 was observed by LIDAR a plume over the MAV around 2km in altitude. The HYSPLIT model results show a backward trajectory from the central area of Brazil indicating that it is arriving in Vitória region.
31

32
Thank you for your attention!