CMAQ Model Performance Evaluation with the updated CB4-2002
29
Center for Environmental Research and Technology/Air Quality Modeling University of California at Riverside CMAQ Model Performance Evaluation with the updated CB4-2002 Chao-Jung Chien, Gail Tonnesen, Bo Wang Tiegang Cao, Zion Wang, Mohammad Omary, Youjun Qin University of California – Riverside, CE-CERT Models-3 CMAS Workshop, Oct.27-29, 2003, RTP, NC
-
Upload
riley-bruce -
Category
Documents
-
view
34 -
download
1
description
CMAQ Model Performance Evaluation with the updated CB4-2002. Chao-Jung Chien, Gail Tonnesen, Bo Wang Tiegang Cao, Zion Wang, Mohammad Omary, Youjun Qin University of California – Riverside, CE-CERT. Models-3 CMAS Workshop, Oct.27-29, 2003, RTP, NC. - PowerPoint PPT Presentation
Transcript of CMAQ Model Performance Evaluation with the updated CB4-2002
Center for Environmental Research and Technology/Air Quality Modeling
University of California at Riverside
CMAQ Model Performance Evaluation with the updated
CB4-2002
Chao-Jung Chien, Gail Tonnesen, Bo Wang Tiegang Cao, Zion Wang,
Mohammad Omary, Youjun Qin
University of California – Riverside, CE-CERT
Models-3 CMAS Workshop, Oct.27-29, 2003, RTP, NC
Center for Environmental Research and Technology/Air Quality Modeling
University of California at Riverside
CB4 mechanism update
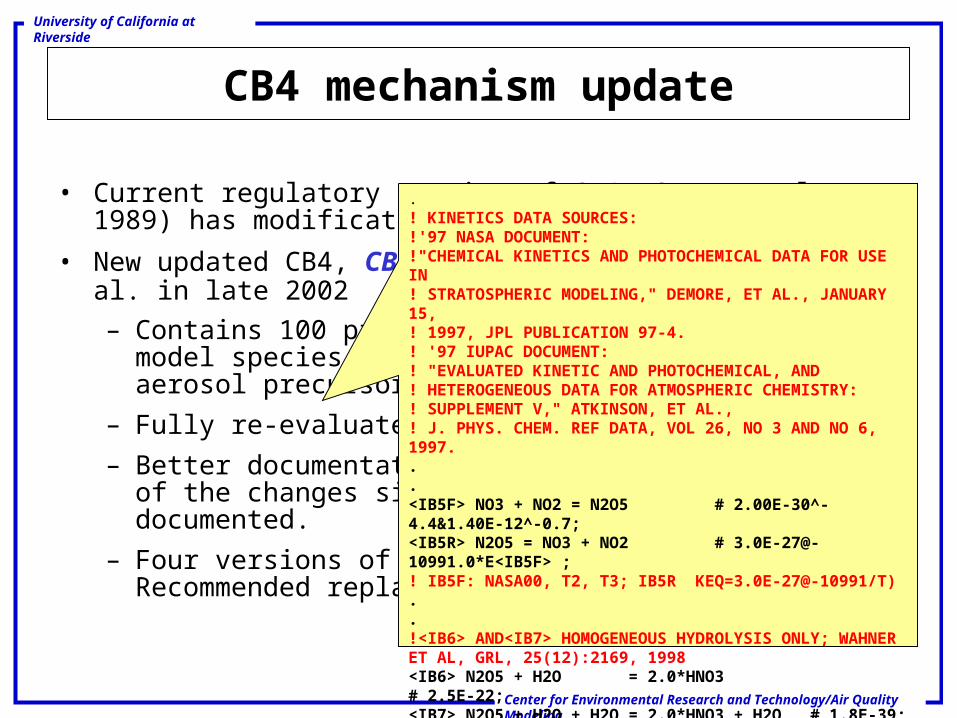
• Current regulatory version of CB4 (Gery et al. 1989) has modifications but is outdated.
• New updated CB4, CB4-2002, released by Jeffries et al. in late 2002
– Contains 100 principle reactions and same CB4 model species (excluding secondary organic aerosol precursor species and aqueous species)
– Fully re-evaluated with smog chamber data
– Better documentation; the old CB4 in which many of the changes since 1989 have not been well documented.
– Four versions of “swappable” olefin chemistry. Recommended replacement version is used.
.! KINETICS DATA SOURCES:!'97 NASA DOCUMENT:!"CHEMICAL KINETICS AND PHOTOCHEMICAL DATA FOR USE IN! STRATOSPHERIC MODELING," DEMORE, ET AL., JANUARY 15,
! 1997, JPL PUBLICATION 97-4.! '97 IUPAC DOCUMENT:! "EVALUATED KINETIC AND PHOTOCHEMICAL, AND! HETEROGENEOUS DATA FOR ATMOSPHERIC CHEMISTRY:! SUPPLEMENT V," ATKINSON, ET AL.,! J. PHYS. CHEM. REF DATA, VOL 26, NO 3 AND NO 6, 1997...<IB5F> NO3 + NO2 = N2O5 # 2.00E-30^-4.4&1.40E-12^-0.7; <IB5R> N2O5 = NO3 + NO2 # [email protected]*E<IB5F> ;! IB5F: NASA00, T2, T3; IB5R KEQ=3.0E-27@-10991/T).. !<IB6> AND<IB7> HOMOGENEOUS HYDROLYSIS ONLY; WAHNER ET AL, GRL, 25(12):2169, 1998 <IB6> N2O5 + H2O = 2.0*HNO3 # 2.5E-22;<IB7> N2O5 + H2O + H2O = 2.0*HNO3 + H2O # 1.8E-39;
Center for Environmental Research and Technology/Air Quality Modeling
University of California at Riverside
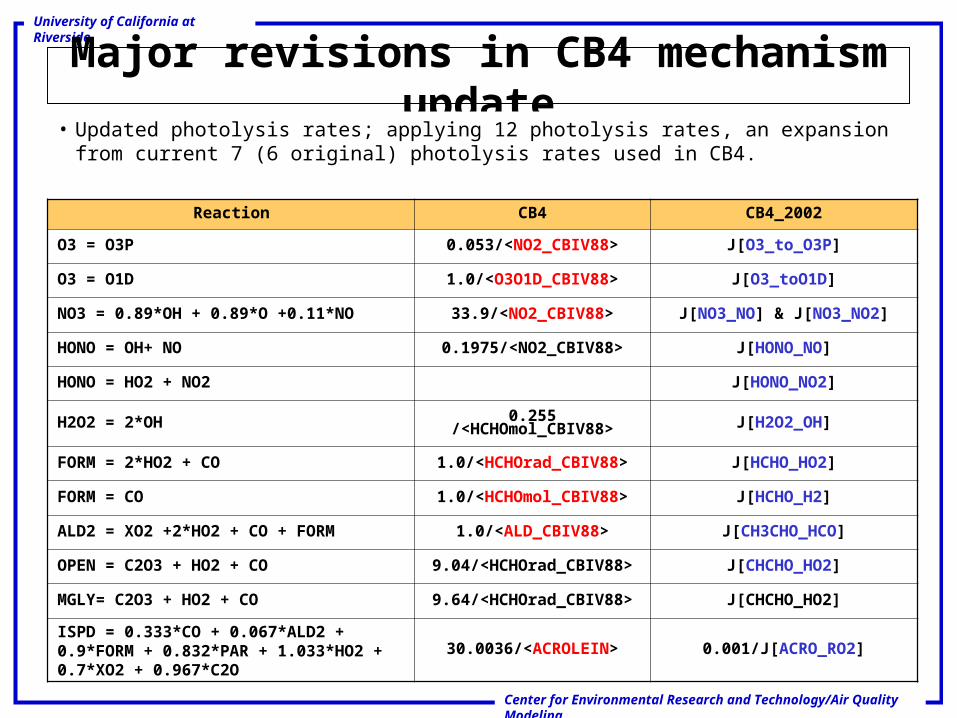
Major revisions in CB4 mechanism update• Updated photolysis rates; applying 12 photolysis rates, an expansion from current 7 (6
original) photolysis rates used in CB4.
Reaction CB4 CB4_2002
O3 = O3P 0.053/<NO2_CBIV88> J[O3_to_O3P]
O3 = O1D 1.0/<O3O1D_CBIV88> J[O3_toO1D]
NO3 = 0.89*OH + 0.89*O +0.11*NO 33.9/<NO2_CBIV88> J[NO3_NO] & J[NO3_NO2]
HONO = OH+ NO 0.1975/<NO2_CBIV88> J[HONO_NO]
HONO = HO2 + NO2 J[HONO_NO2]
H2O2 = 2*OH 0.255 /<HCHOmol_CBIV88> J[H2O2_OH]
FORM = 2*HO2 + CO 1.0/<HCHOrad_CBIV88> J[HCHO_HO2]
FORM = CO 1.0/<HCHOmol_CBIV88> J[HCHO_H2]
ALD2 = XO2 +2*HO2 + CO + FORM 1.0/<ALD_CBIV88> J[CH3CHO_HCO]
OPEN = C2O3 + HO2 + CO 9.04/<HCHOrad_CBIV88> J[CHCHO_HO2]
MGLY= C2O3 + HO2 + CO 9.64/<HCHOrad_CBIV88> J[CHCHO_HO2]
ISPD = 0.333*CO + 0.067*ALD2 + 0.9*FORM + 0.832*PAR + 1.033*HO2 + 0.7*XO2 + 0.967*C2O
30.0036/<ACROLEIN> 0.001/J[ACRO_RO2]
Center for Environmental Research and Technology/Air Quality Modeling
University of California at Riverside
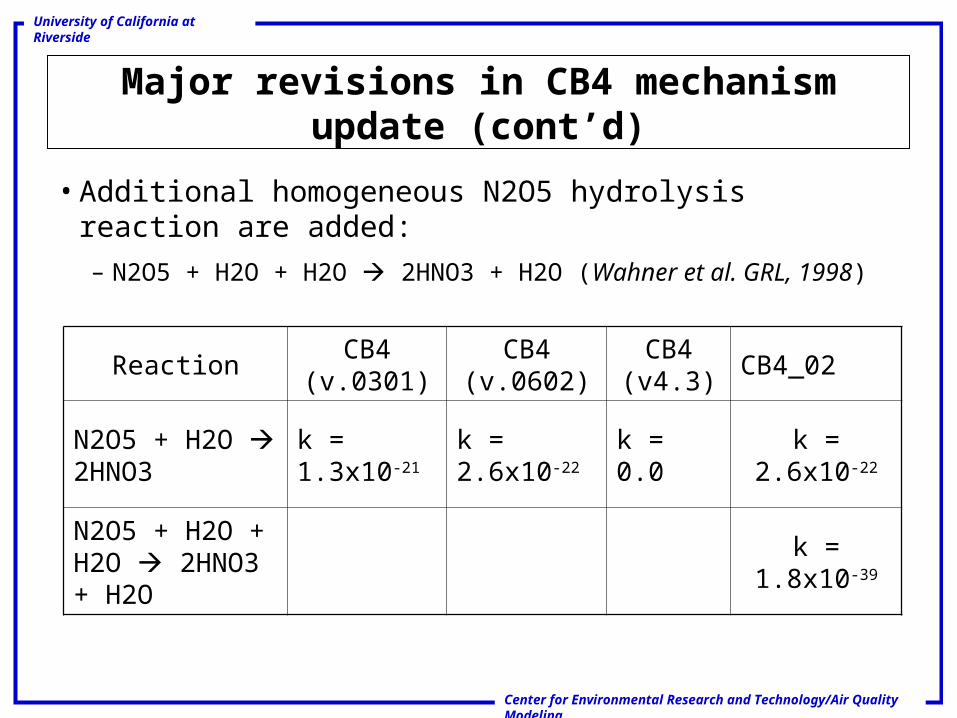
Major revisions in CB4 mechanism update (cont’d)
• Additional homogeneous N2O5 hydrolysis reaction are added:
– N2O5 + H2O + H2O 2HNO3 + H2O (Wahner et al. GRL, 1998)
ReactionCB4
(v.0301)CB4
(v.0602)CB4
(v4.3)CB4_02
N2O5 + H2O 2HNO3
k = 1.3x10⁻²¹ k = 2.6x10⁻²² k = 0.0 k = 2.6x10⁻²²
N2O5 + H2O + H2O 2HNO3 + H2O
k = 1.8x10-39
Center for Environmental Research and Technology/Air Quality Modeling
University of California at Riverside
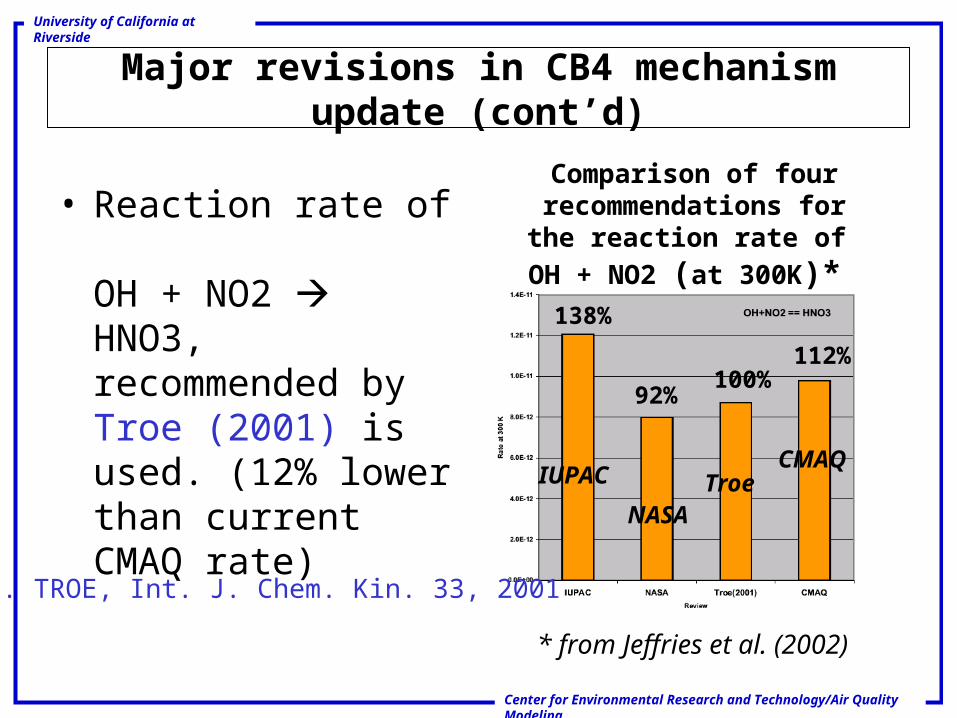
• Reaction rate of OH + NO2 HNO3, recommended by Troe (2001) is used. (12% lower than current CMAQ rate)
* from Jeffries et al. (2002)
Major revisions in CB4 mechanism update (cont’d)
Comparison of four recommendations for the
reaction rate of
OH + NO2 (at 300K)*
92%
138%
100%112%
J. TROE, Int. J. Chem. Kin. 33, 2001
IUPAC
NASATroe
CMAQ
Center for Environmental Research and Technology/Air Quality Modeling
University of California at Riverside
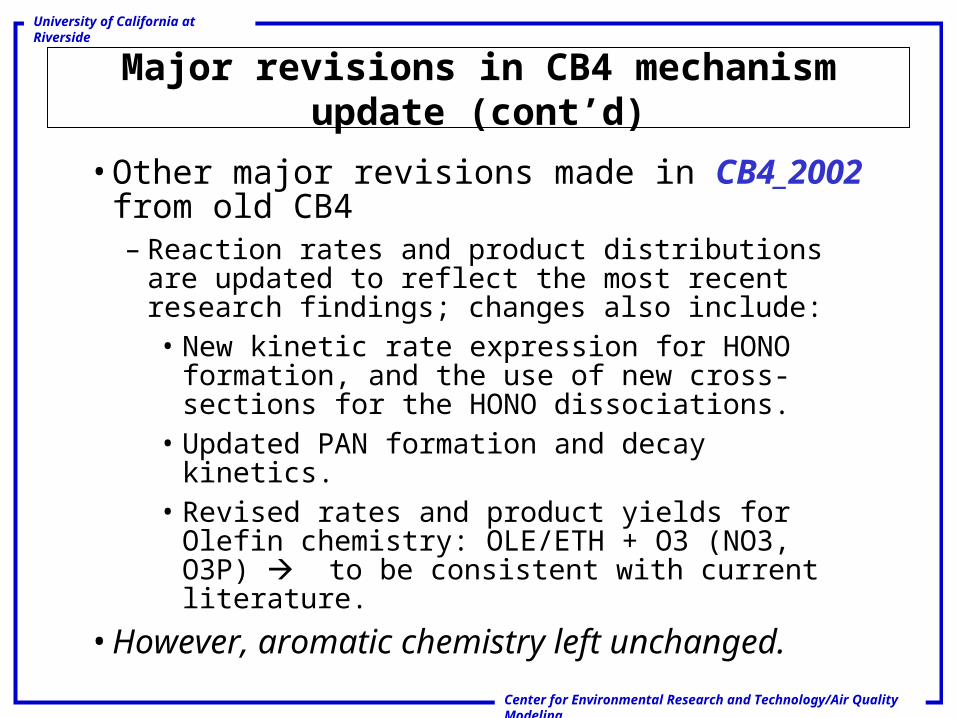
Major revisions in CB4 mechanism update (cont’d)
• Other major revisions made in CB4_2002 from old CB4– Reaction rates and product distributions are updated to
reflect the most recent research findings; changes also include:• New kinetic rate expression for HONO formation, and the
use of new cross-sections for the HONO dissociations.• Updated PAN formation and decay kinetics.• Revised rates and product yields for Olefin chemistry:
OLE/ETH + O3 (NO3, O3P) to be consistent with current literature.
• However, aromatic chemistry left unchanged.
Center for Environmental Research and Technology/Air Quality Modeling
University of California at Riverside
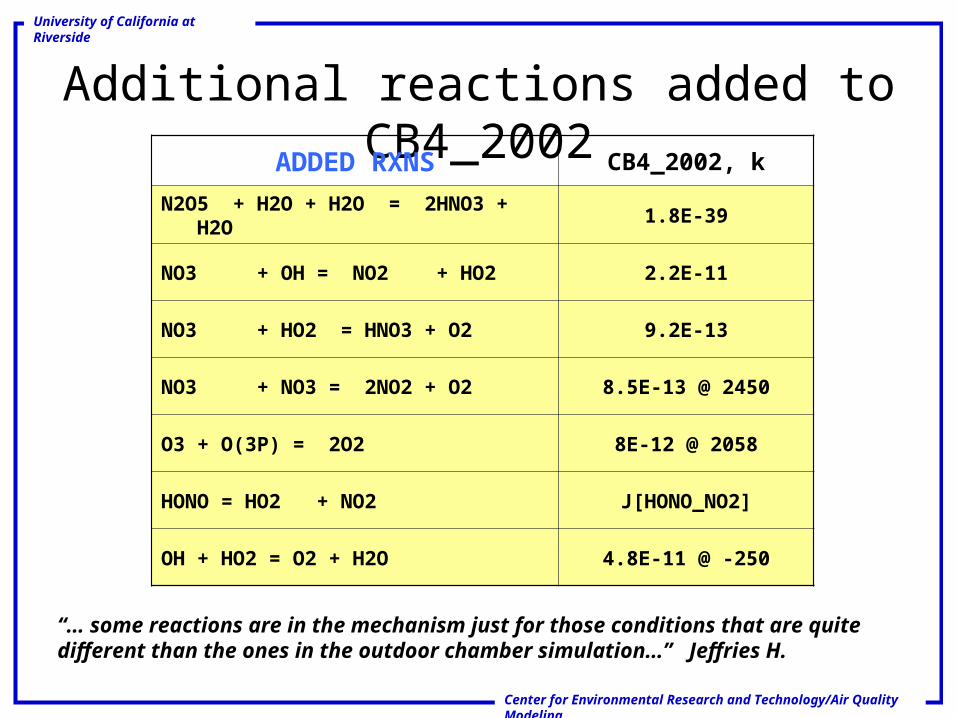
Additional reactions added to CB4_2002
ADDED RXNS CB4_2002, k
N2O5 + H2O + H2O = 2HNO3 + H2O
1.8E-39
NO3 + OH = NO2 + HO2
2.2E-11
NO3 + HO2 = HNO3 + O2 9.2E-13
NO3 + NO3 = 2NO2 + O2 8.5E-13 @ 2450
O3 + O(3P) = 2O2 8E-12 @ 2058
HONO = HO2 + NO2 J[HONO_NO2]
OH + HO2 = O2 + H2O 4.8E-11 @ -250
“… some reactions are in the mechanism just for those conditions that are quite different than the ones in the outdoor chamber simulation…” Jeffries H.
Center for Environmental Research and Technology/Air Quality Modeling
University of California at Riverside
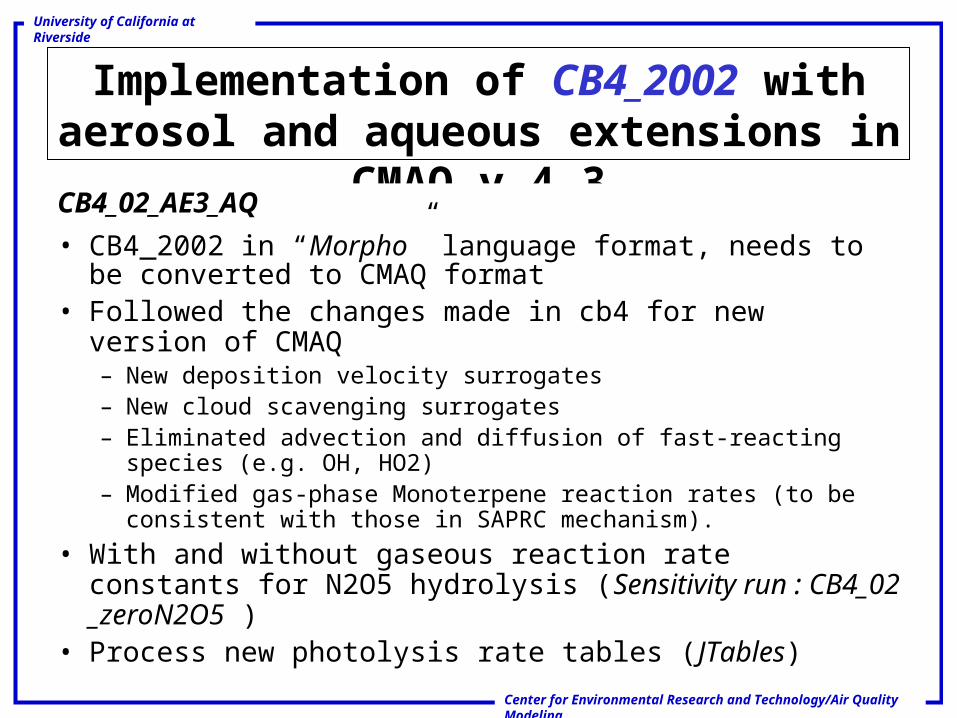
Implementation of CB4_2002 with aerosol and aqueous extensions in CMAQ v.4.3
CB4_02_AE3_AQ
• CB4_2002 in “Morpho” language format, needs to be converted to CMAQ format
• Followed the changes made in cb4 for new version of CMAQ– New deposition velocity surrogates – New cloud scavenging surrogates– Eliminated advection and diffusion of fast-reacting species (e.g. OH,
HO2)– Modified gas-phase Monoterpene reaction rates (to be consistent with
those in SAPRC mechanism).
• With and without gaseous reaction rate constants for N2O5 hydrolysis (Sensitivity run : CB4_02 _zeroN2O5 )
• Process new photolysis rate tables (JTables)
Center for Environmental Research and Technology/Air Quality Modeling
University of California at Riverside
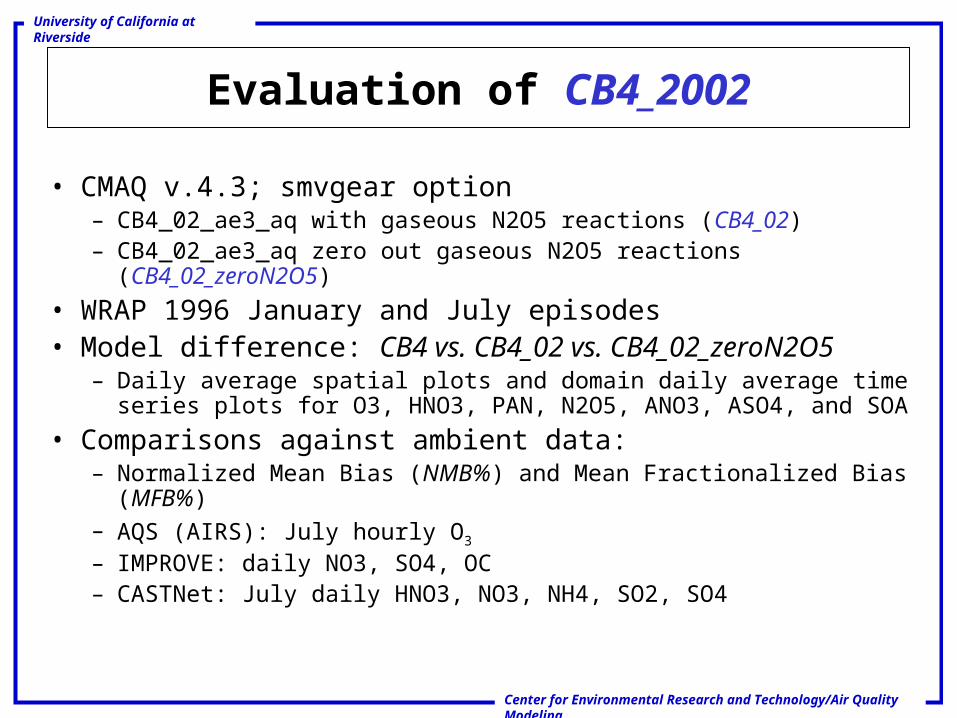
Evaluation of CB4_2002
• CMAQ v.4.3; smvgear option– CB4_02_ae3_aq with gaseous N2O5 reactions (CB4_02)– CB4_02_ae3_aq zero out gaseous N2O5 reactions (CB4_02_zeroN2O5)
• WRAP 1996 January and July episodes• Model difference: CB4 vs. CB4_02 vs. CB4_02_zeroN2O5
– Daily average spatial plots and domain daily average time series plots for O3, HNO3, PAN, N2O5, ANO3, ASO4, and SOA
• Comparisons against ambient data: – Normalized Mean Bias (NMB%) and Mean Fractionalized Bias (MFB%)– AQS (AIRS): July hourly O3 – IMPROVE: daily NO3, SO4, OC– CASTNet: July daily HNO3, NO3, NH4, SO2, SO4
Center for Environmental Research and Technology/Air Quality Modeling
University of California at Riverside
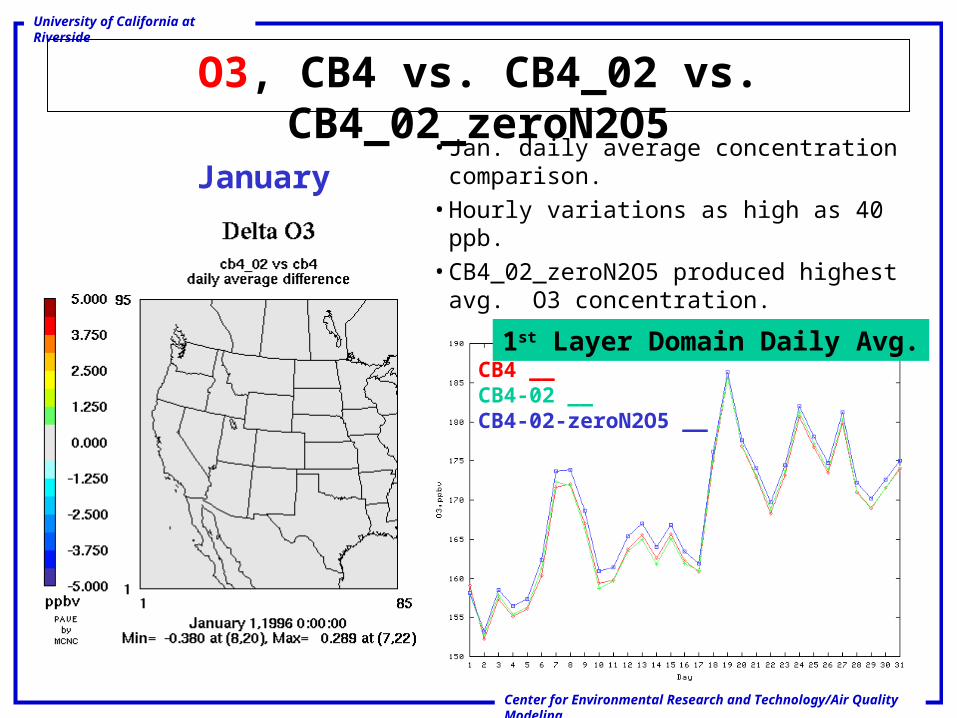
O3, CB4 vs. CB4_02 vs. CB4_02_zeroN2O5
January• Jan. daily average concentration comparison.
• Hourly variations as high as 40 ppb.
• CB4_02_zeroN2O5 produced highest avg. O3 concentration.
CB4 __CB4-02 __CB4-02-zeroN2O5 __
1st Layer Domain Daily Avg.
Center for Environmental Research and Technology/Air Quality Modeling
University of California at Riverside
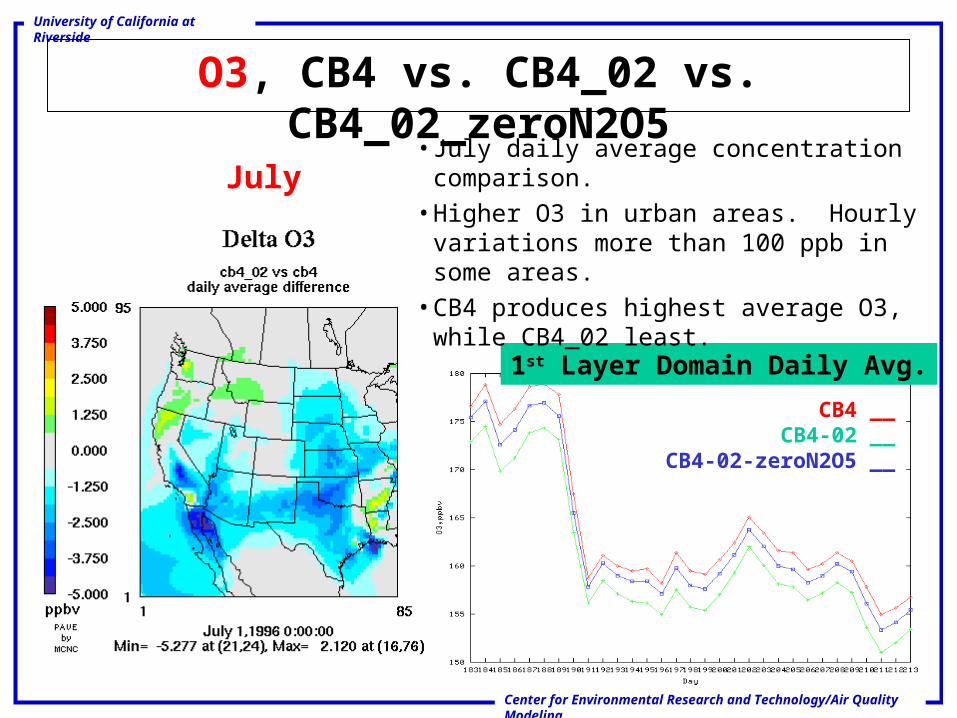
O3, CB4 vs. CB4_02 vs. CB4_02_zeroN2O5
July
1st Layer Domain Daily Avg.
CB4 __CB4-02 __
CB4-02-zeroN2O5 __
• July daily average concentration comparison.
• Higher O3 in urban areas. Hourly variations more than 100 ppb in some areas.
• CB4 produces highest average O3, while CB4_02 least.
Center for Environmental Research and Technology/Air Quality Modeling
University of California at Riverside
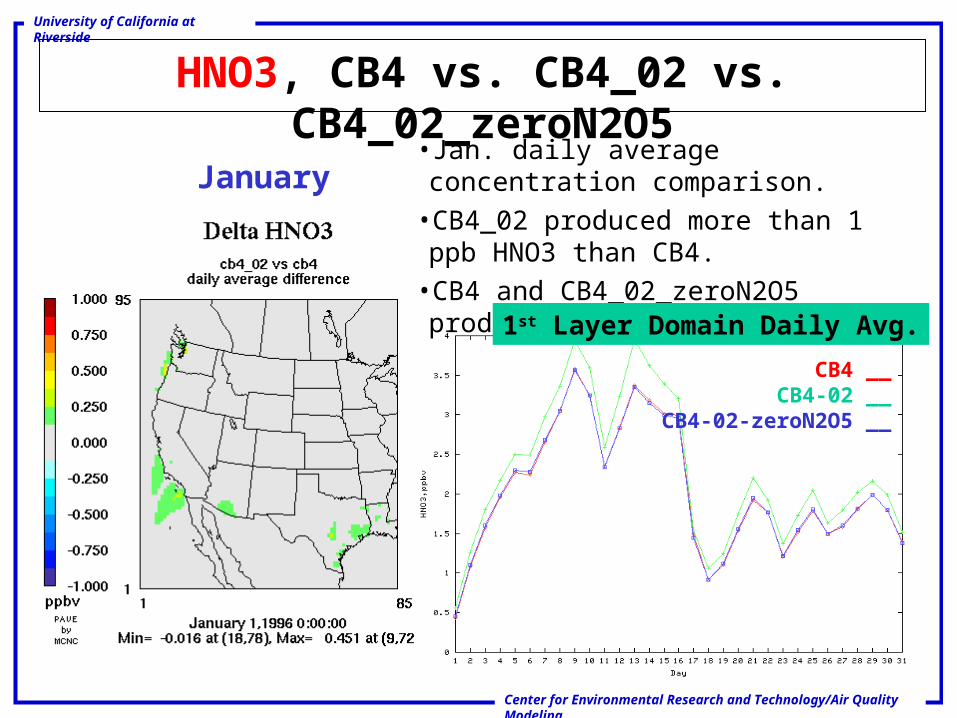
HNO3, CB4 vs. CB4_02 vs. CB4_02_zeroN2O5
January•Jan. daily average concentration comparison.
•CB4_02 produced more than 1 ppb HNO3 than CB4.
•CB4 and CB4_02_zeroN2O5 produces similar HNO3.
1st Layer Domain Daily Avg.
CB4 __CB4-02 __
CB4-02-zeroN2O5 __

Center for Environmental Research and Technology/Air Quality Modeling
University of California at Riverside
HNO3, CB4 vs. CB4_02 vs. CB4_02_zeroN2O5
July
CB4 __CB4-02 __
CB4-02-zeroN2O5 __
1st Layer Domain Daily Avg.
• July daily average concentration comparison.
• CB4_02 higher in urban areas. Hourly variations as high as 10 ppb.
• CB4_02 produces highest average HNO3, whereas CB4_02_zeroN2O5 least.
Center for Environmental Research and Technology/Air Quality Modeling
University of California at Riverside
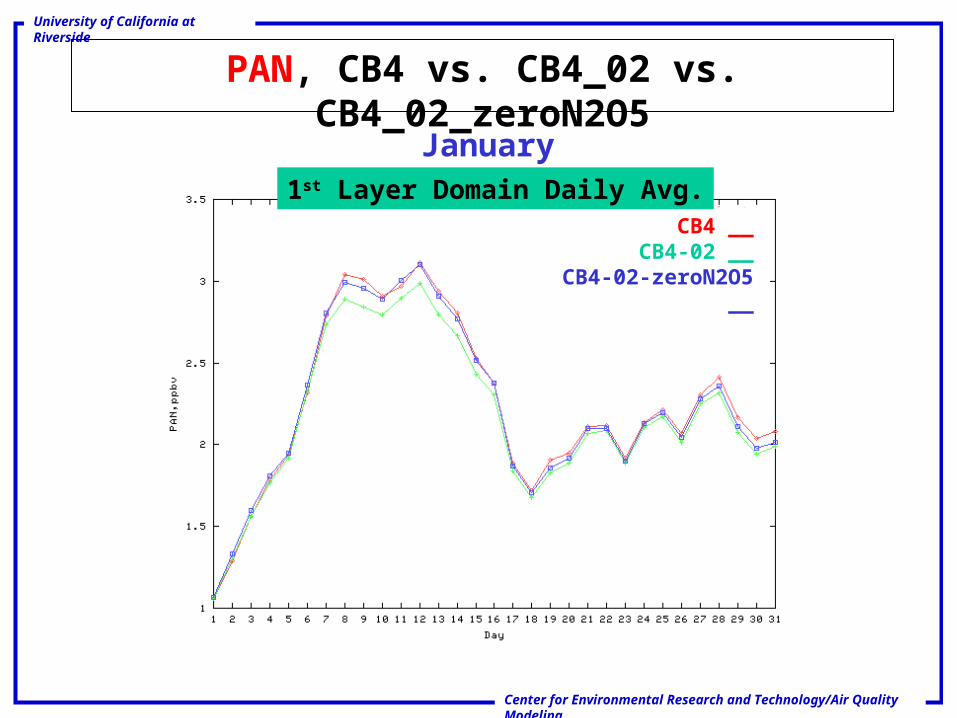
PAN, CB4 vs. CB4_02 vs. CB4_02_zeroN2O5
January
CB4 __CB4-02 __
CB4-02-zeroN2O5 __
1st Layer Domain Daily Avg.
Center for Environmental Research and Technology/Air Quality Modeling
University of California at Riverside
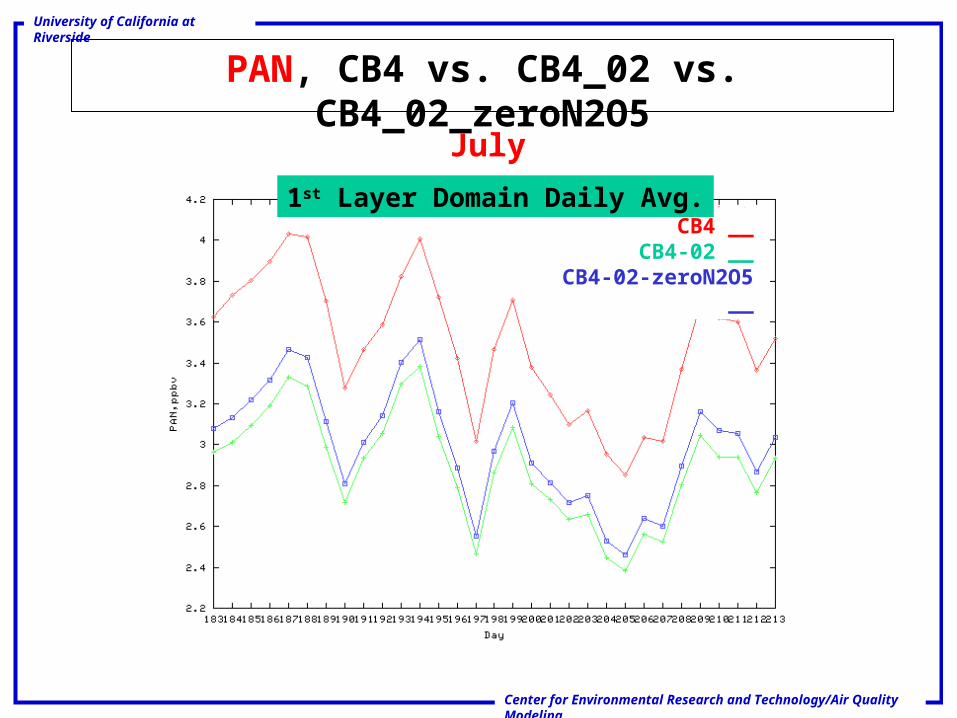
PAN, CB4 vs. CB4_02 vs. CB4_02_zeroN2O5
July
CB4 __CB4-02 __
CB4-02-zeroN2O5 __
1st Layer Domain Daily Avg.
Center for Environmental Research and Technology/Air Quality Modeling
University of California at Riverside
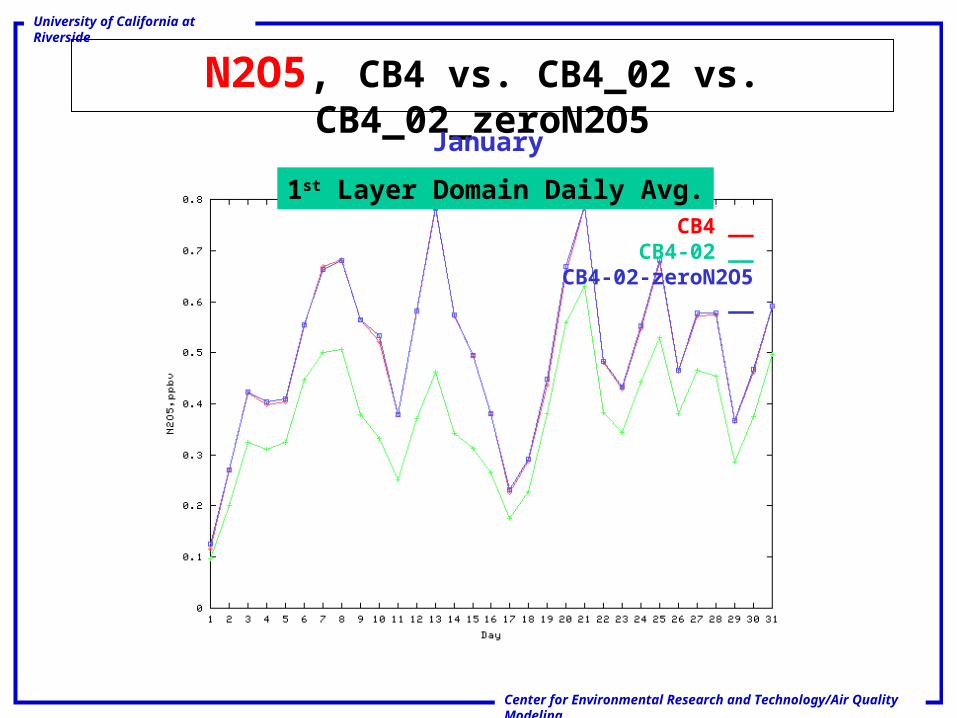
N2O5, CB4 vs. CB4_02 vs. CB4_02_zeroN2O5
January
CB4 __CB4-02 __
CB4-02-zeroN2O5 __
1st Layer Domain Daily Avg.
Center for Environmental Research and Technology/Air Quality Modeling
University of California at Riverside
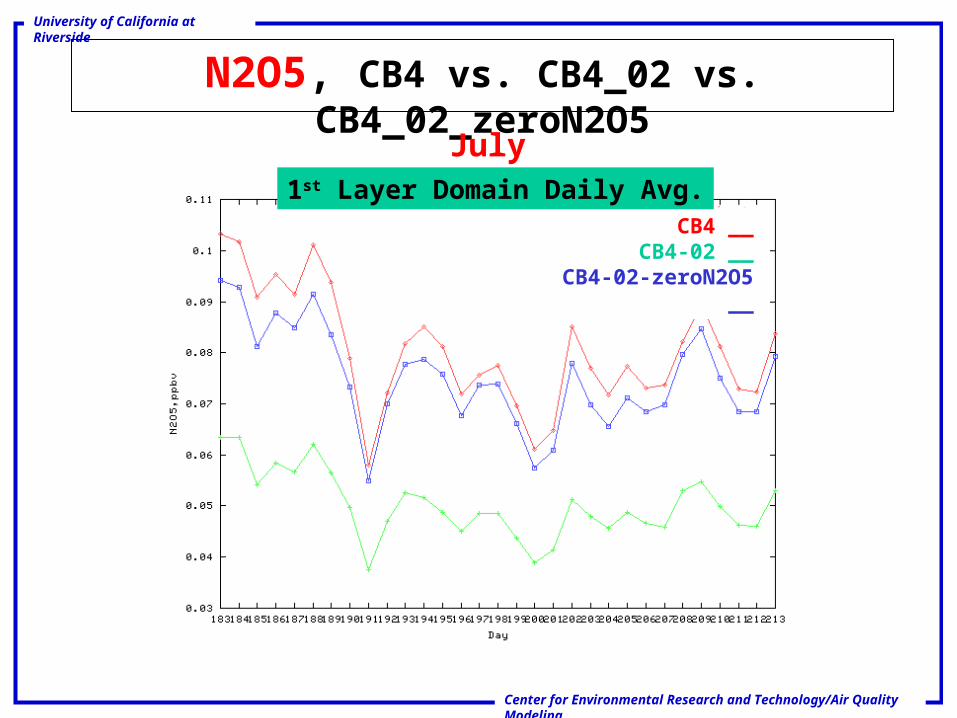
N2O5, CB4 vs. CB4_02 vs. CB4_02_zeroN2O5
July
CB4 __CB4-02 __
CB4-02-zeroN2O5 __
1st Layer Domain Daily Avg.
Center for Environmental Research and Technology/Air Quality Modeling
University of California at Riverside
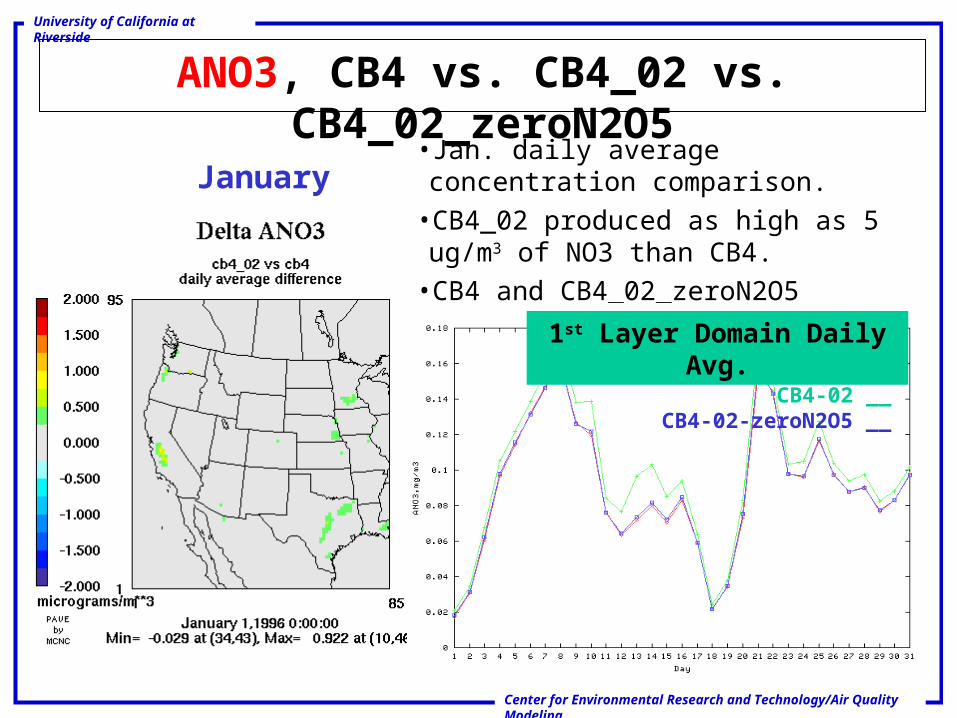
ANO3, CB4 vs. CB4_02 vs. CB4_02_zeroN2O5
January•Jan. daily average concentration comparison.
•CB4_02 produced as high as 5 ug/m3 of NO3 than CB4.
•CB4 and CB4_02_zeroN2O5 produces similar NO3.
CB4 __CB4-02 __
CB4-02-zeroN2O5 __
1st Layer Domain Daily Avg.
Center for Environmental Research and Technology/Air Quality Modeling
University of California at Riverside
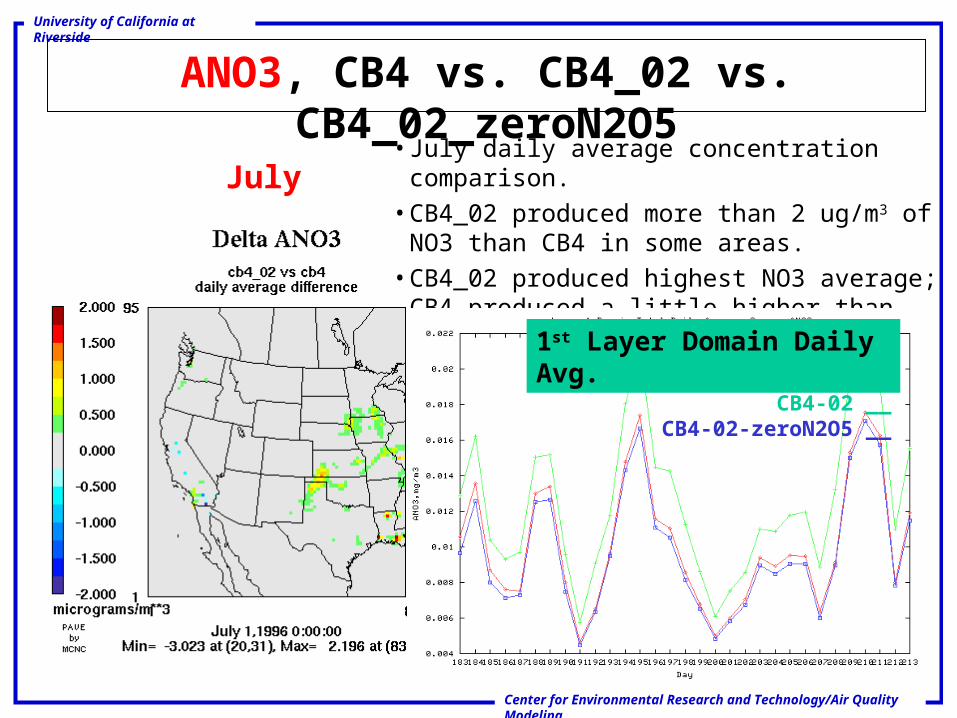
ANO3, CB4 vs. CB4_02 vs. CB4_02_zeroN2O5
July• July daily average concentration comparison.
• CB4_02 produced more than 2 ug/m3 of NO3 than CB4 in some areas.
• CB4_02 produced highest NO3 average; CB4 produced a little higher than CB4_02_zeroN2O5.
CB4 __CB4-02 __
CB4-02-zeroN2O5 __
1st Layer Domain Daily Avg.
Center for Environmental Research and Technology/Air Quality Modeling
University of California at Riverside
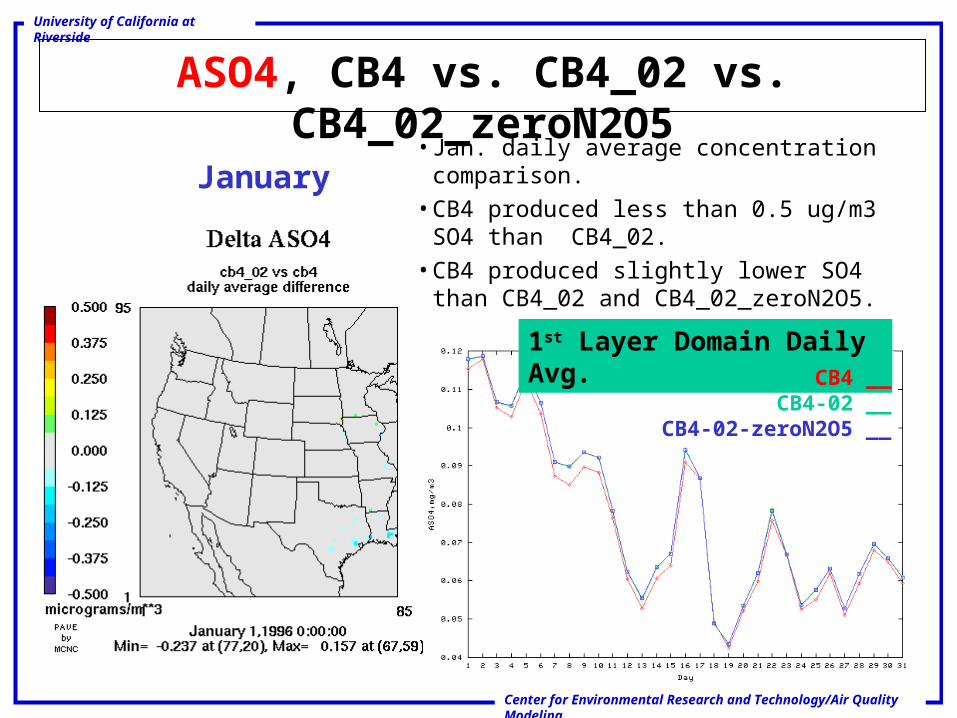
ASO4, CB4 vs. CB4_02 vs. CB4_02_zeroN2O5
January• Jan. daily average concentration comparison.
• CB4 produced less than 0.5 ug/m3 SO4 than CB4_02.
• CB4 produced slightly lower SO4 than CB4_02 and CB4_02_zeroN2O5.
1st Layer Domain Daily Avg.CB4 __
CB4-02 __CB4-02-zeroN2O5 __
Center for Environmental Research and Technology/Air Quality Modeling
University of California at Riverside
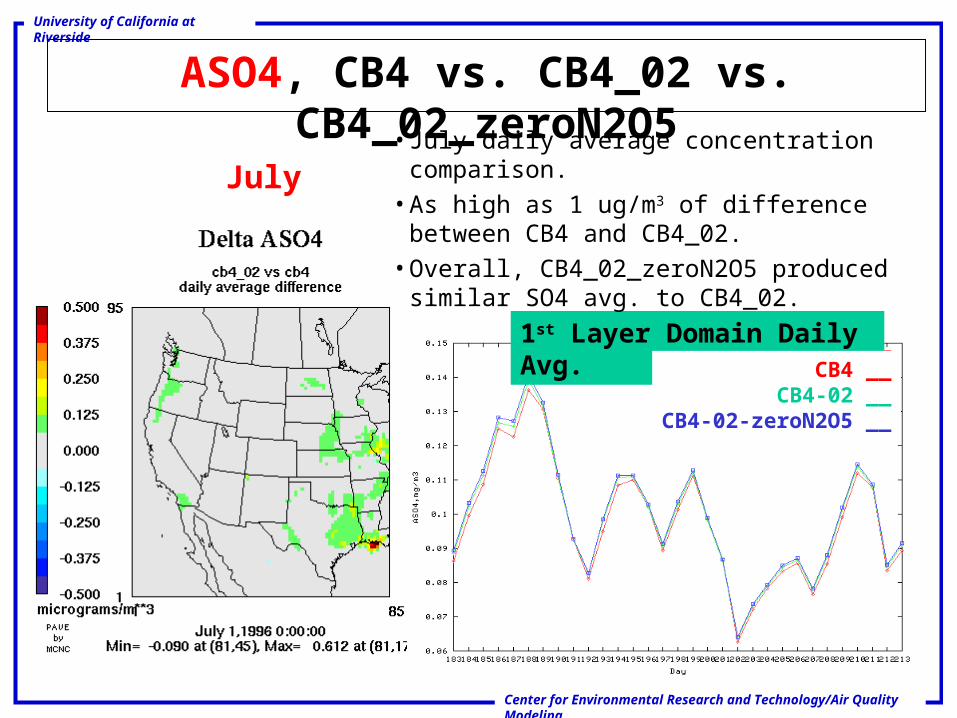
ASO4, CB4 vs. CB4_02 vs. CB4_02_zeroN2O5
July
1st Layer Domain Daily Avg.CB4 __
CB4-02 __CB4-02-zeroN2O5 __
• July daily average concentration comparison.
• As high as 1 ug/m3 of difference between CB4 and CB4_02.
• Overall, CB4_02_zeroN2O5 produced similar SO4 avg. to CB4_02.
Center for Environmental Research and Technology/Air Quality Modeling
University of California at Riverside
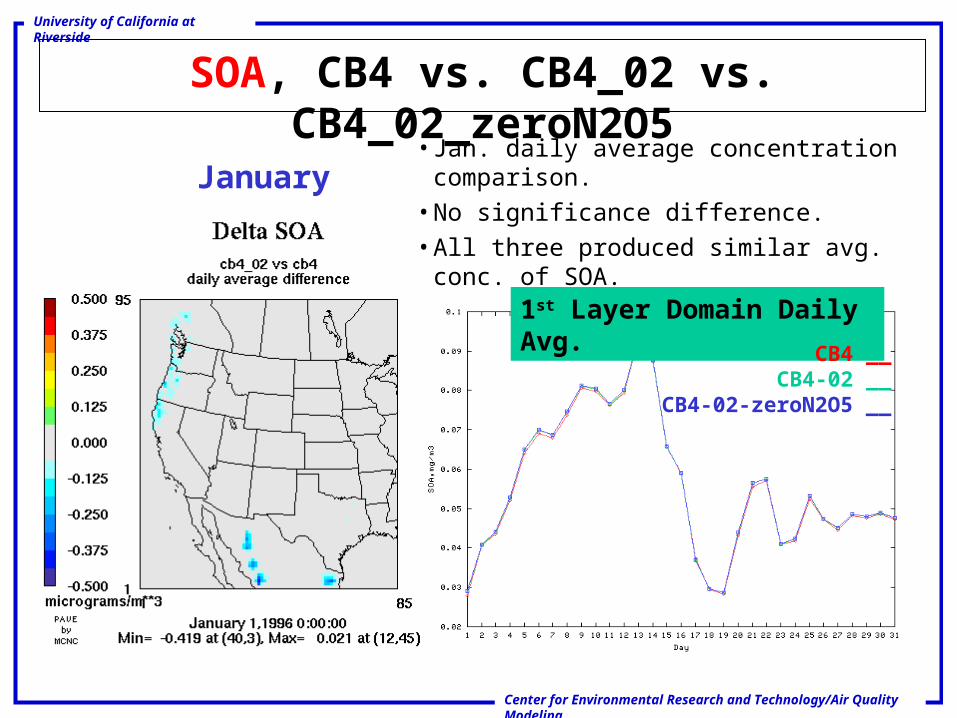
SOA, CB4 vs. CB4_02 vs. CB4_02_zeroN2O5
January• Jan. daily average concentration comparison.
• No significance difference.
• All three produced similar avg. conc. of SOA.
1st Layer Domain Daily Avg.
CB4 __CB4-02 __
CB4-02-zeroN2O5 __
Center for Environmental Research and Technology/Air Quality Modeling
University of California at Riverside
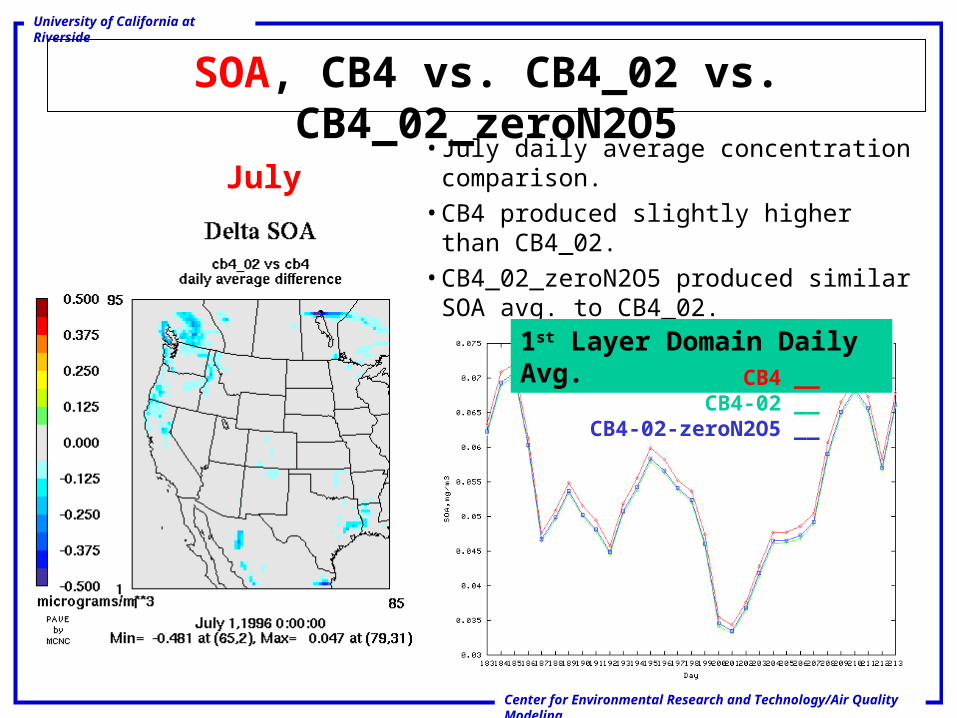
SOA, CB4 vs. CB4_02 vs. CB4_02_zeroN2O5
July• July daily average concentration
comparison.
• CB4 produced slightly higher than CB4_02.
• CB4_02_zeroN2O5 produced similar SOA avg. to CB4_02.
1st Layer Domain Daily Avg.CB4 __
CB4-02 __CB4-02-zeroN2O5 __
Center for Environmental Research and Technology/Air Quality Modeling
University of California at Riverside
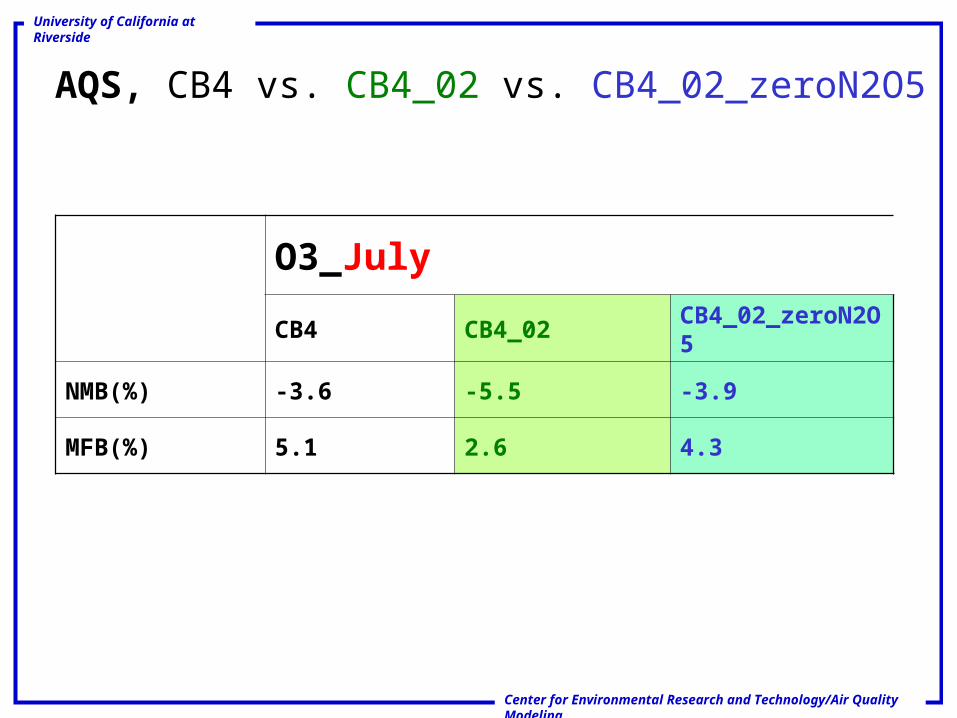
AQS, CB4 vs. CB4_02 vs. CB4_02_zeroN2O5
O3_July
CB4 CB4_02 CB4_02_zeroN2O5
NMB(%) -3.6 -5.5 -3.9
MFB(%) 5.1 2.6 4.3
Center for Environmental Research and Technology/Air Quality Modeling
University of California at Riverside
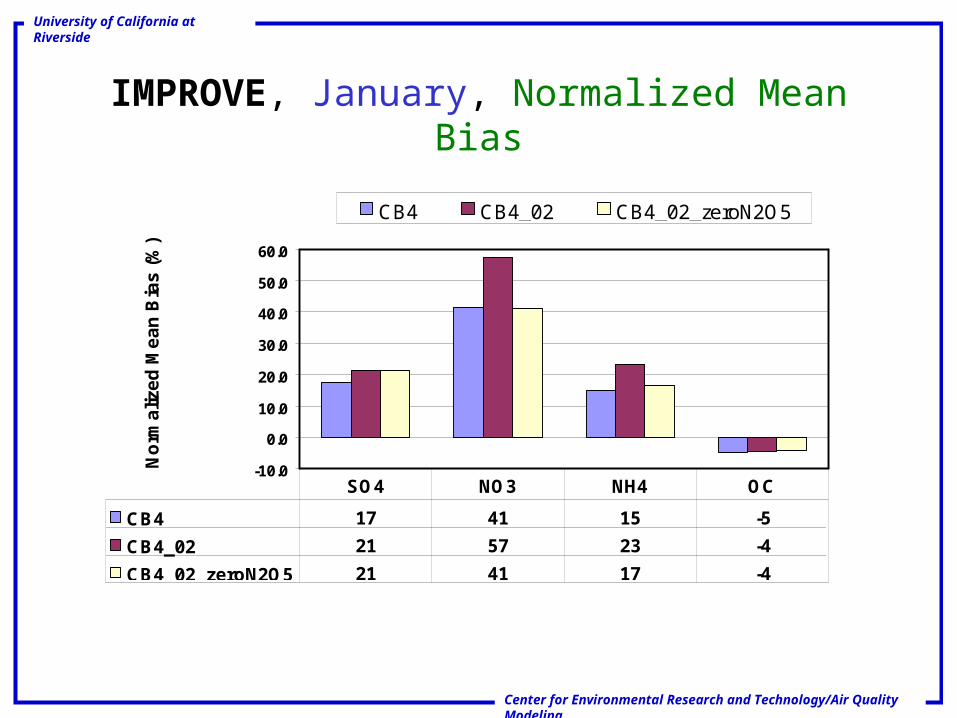
IMPROVE, January, Normalized Mean Bias
-10.0
0.0
10.0
20.0
30.0
40.0
50.0
60.0
No
rma
lize
d M
ea
n B
ias
(%
)
CB4 CB4_02 CB4_02_zeroN2O5
CB4 17 41 15 -5
CB4_02 21 57 23 -4
CB4_02_zeroN2O5 21 41 17 -4
SO4 NO3 NH4 OC
Center for Environmental Research and Technology/Air Quality Modeling
University of California at Riverside
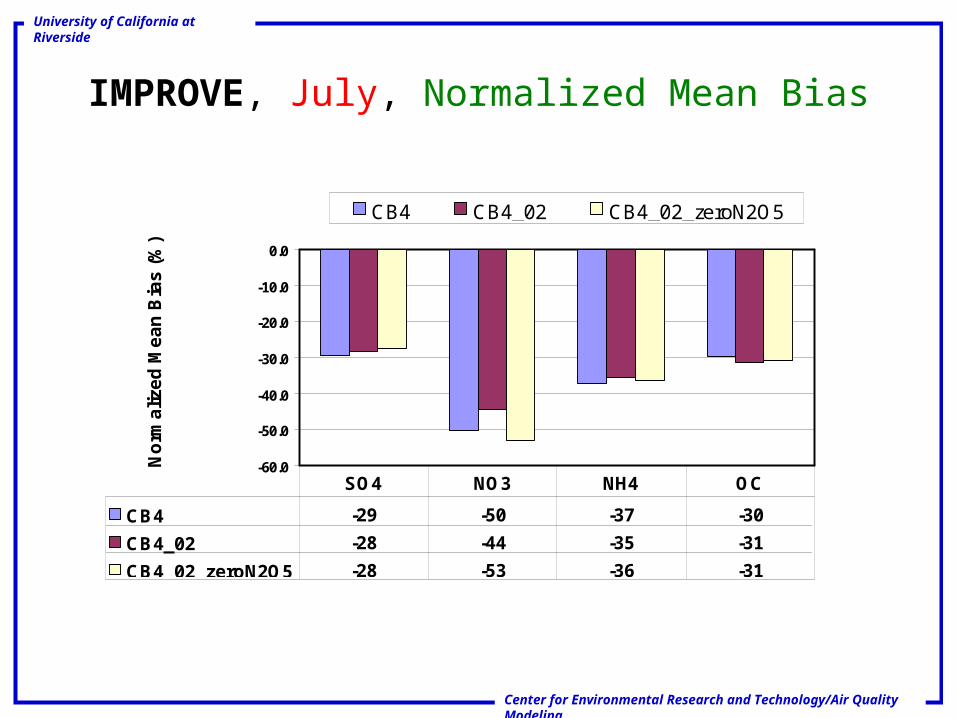
IMPROVE, July, Normalized Mean Bias
-60.0
-50.0
-40.0
-30.0
-20.0
-10.0
0.0
No
rma
lize
d M
ea
n B
ias
(%
)
CB4 CB4_02 CB4_02_zeroN2O5
CB4 -29 -50 -37 -30
CB4_02 -28 -44 -35 -31
CB4_02_zeroN2O5 -28 -53 -36 -31
SO4 NO3 NH4 OC
Center for Environmental Research and Technology/Air Quality Modeling
University of California at Riverside
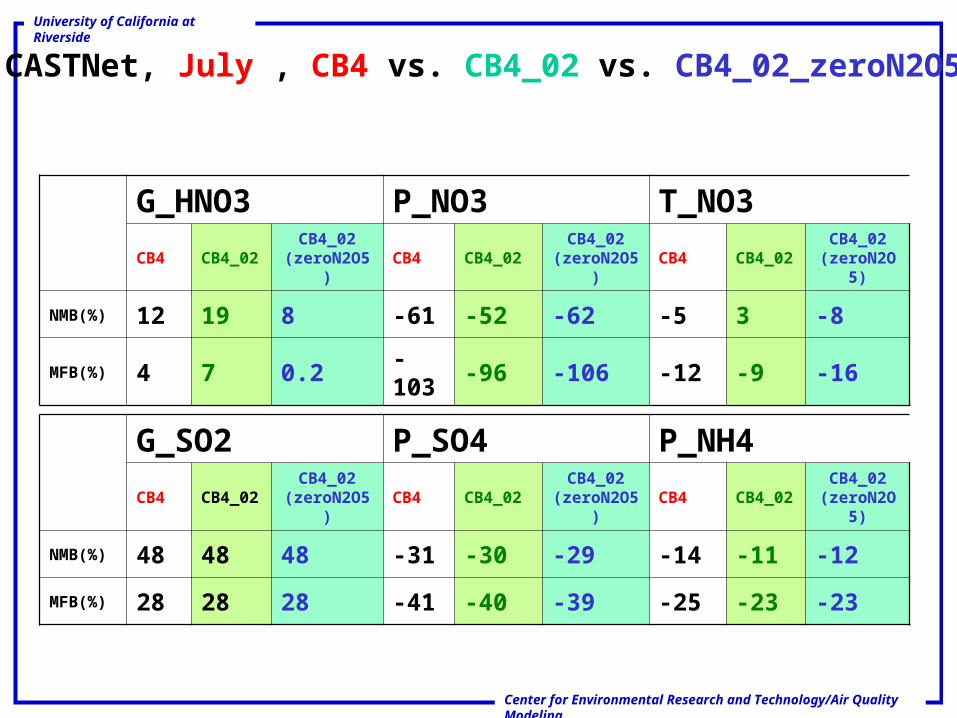
CASTNet, July , CB4 vs. CB4_02 vs. CB4_02_zeroN2O5
G_HNO3 P_NO3 T_NO3CB4 CB4_02
CB4_02(zeroN2O5)
CB4 CB4_02CB4_02
(zeroN2O5)CB4 CB4_02
CB4_02(zeroN2O5)
NMB(%) 12 19 8 -61 -52 -62 -5 3 -8
MFB(%) 4 7 0.2 -103 -96 -106 -12 -9 -16
G_SO2 P_SO4 P_NH4CB4 CB4_02
CB4_02(zeroN2O5)
CB4 CB4_02CB4_02
(zeroN2O5)CB4 CB4_02
CB4_02(zeroN2O5)
NMB(%) 48 48 48 -31 -30 -29 -14 -11 -12
MFB(%) 28 28 28 -41 -40 -39 -25 -23 -23
Center for Environmental Research and Technology/Air Quality Modeling
University of California at Riverside
Summary of CB4_2002 modeling results • Major difference found for O3, HNO3, ANO3
– Higher O3 concentration in urban area but lower in rural area. (probable cause: combined effect of OH+NO2 rate, less long range transport of PAN formation)
• Comparisons with ambient data: – Improvements are mixed and relatively small
• Should gaseous N2O5 reactions be taken out?• Would it sensitive to emission changes (control runs)?Next steps…• Process analysis to identify key contributors to the changes• Implement EBI/MEBI (Modified Euler Backward Iterative)
solver for CB4_02 • Implement paraffin secondary organic aerosol into CB4_02.• Improve aromatic chemistry mechanism.
Center for Environmental Research and Technology/Air Quality Modeling
University of California at Riverside
Summary of CB4_2002 modeling results
• Bottom line…– In spite of relatively small changes comparing the
ambient data, CB4_2002 has better science and should be included in future CMAQ release.