
ClusteringSuite Introductory Manual - BSC-CNS · The ClusteringSuite is the ... use the information...
21
-
Upload
nguyenkhuong -
Category
Documents
-
view
213 -
download
0
Transcript of ClusteringSuite Introductory Manual - BSC-CNS · The ClusteringSuite is the ... use the information...

2

Chapter 1
Quick start guide
The ClusteringSuite is the software package that includes the cluster analysis tool developed at theBarcelona Supercomputing Center Tools Team. It is composed by a set of binaries and librariesimplemented in C and C++. The main tool included in this package is BurstClustering, whichperforms the cluster analysis of Paraver traces (see section ??).
As a short summary, the cluster analysis tool �nds groups in the di�erent computations (CPUbursts, i.e. regions between call to the parallel runtime) a parallel application performs. To charac-terize these bursts we can use any information gathered in the input trace. In almost all cases weuse the information provided by the Performance Hardware Counters.
In this �rst chapter of this manual we detail the contents of the package as well as we guide howto run the �rst cluster analysis, following the example distributed with the ClusteringSuite package.
1.1 ClusteringSuite package
The package is distributed in compressed tar format (e.g., clusteringsuite.tar.gz). To unpack it,execute from the desired target directory the following command line :
> tar xvfz clusteringsuite.tar.gz
The unpacking process will create di�erent directories on the current directory (see table 1.1).We suggest adding the <clusteringsuite_dir>/bin directory to your PATH environment variable,so as to easily access to the tools included in the package.
Directory Contents
bin Contains the binary �les of the ClusteringSuite package.include Contains the di�erent library headers to extend the package.lib Contains the di�erent libraries �les to extend the package.share/doc Contains the ClusteringSuite manuals (pdf version).share/example Contains an example to illustrate the package operation.
Table 1.1: Package contents description
3

File Description
README Text �le with the same instructionsof this section.
cluster_explained.xml Clustering con�guration XML �lewith brief descriptions about the dif-ferent �elds.
cluster.xml Same clustering con�guration XML�le as the previous one, without thedescriptions.
su3.lat256_2it.16tasks.[prv|pcf|row] Paraver trace to be used in the ex-ample.
Table 1.2: Contents of share/example directory
1.2 Running the cluster analysis example
As listed in Table 1.1, in the ClusteringSuite package we include an example to illustrate the basicoperation of BurstClustering, the main analysis tool included in the package. If you move intothe directory share/example you will �nd the �les 6 listed in Table 1.2.
The XML con�guration �les provided use Completed Instructions hardware counter, PAPI_TOT_INSin PAPI terminology, and Instructions Per Cycle (IPC), derived using PAPI_TOT_INS / PAPI_TOT_CYCcounters, as clustering parameters. It sets a duration �lter of 1000µs and a Completed Instructions�lter of 3×10⁸. It con�gures the extrapolation of all the counters present in the input trace andde�nes a single output plot combining the two clustering metrics, depicting the raw values.
The input trace provided is a two iteration chop from an execution with 16 tasks of SU3_AHiggs,a lattice quantum chromodynamics code, part of the PRACE benchmark suite 1.
1.2.1 Executing BurstClustering tool
You can execute the cluster analysis with the provided XMLs without modi�cation running thefollowing command:
> BurstClustering -d cluster.xml -i su3.lat256_2it.16tasks.prv -o
su3.lat256_2it.16tasks.clustered.prv
As a result of this execution, the 'BurstClustering' tool will detect 14 clusters in the input data.
1.2.2 BurstClustering outputs
The BurstClustering tool will generate the following outputs:
• su3.lat256_2it.16tasks.clustered.[prv|pcf|row]: a Paraver trace with clusters infor-mation. You can load this trace in Paraver, and use the clustering con�guration �les toanalyse the clusters behaviour with the time context. In the default distribution of Paraver,these con�guration �les are installed in the directory $PARAVER_HOME/cfgs/clustering.
1http://www.prace-ri.eu/ueabs#QCD - Kernel B
4
• su3.lat256_2it.16tasks.clustered.clusters_info.csv: a CSV �le with clusters statis-tics, including the aggregated duration of each cluster, the average duration of the bursts ofeach cluster, and the average values of the cluster parameters and the extrapolation param-eters. You can import this �le to a regular spreadsheet application to analyse the clustersbehaviour as a group.
• su3.lat256_2it.16tasks.clustered.IPC.PAPI_TOT_INS.gnuplot: a GNUPlot script to ob-serve the resulting clusters in a 2D scatter plot. To visualize it, execute:
> gnuplot su3.lat256_2it.16tasks.clustered.IPC.PAPI_TOT_INS.gnuplot
• su3.lat256_2it.16tasks.clustered.DATA.csv: a CSV �le with the characterization of eachburst read from the input trace, including its clustering and extrapolation parameters value,as well as the timestamps and cluster id assigned. This �le is used by the GNUPlot script,but you can also load it in a spreadsheet or any other software to analyse the di�erent CPUburst instances that took part in the cluster analysis process.
1.3 About Extrae and Paraver
Extrae and Paraver are two of the core tools of the BSC Performance Analysis Tools ecosystem.Extrae is a dynamic instrumentation package to trace programs compiled and run with the shared
memory model (like OpenMP and pthreads), the message passing (MPI) programming model orboth programming models (di�erent MPI processes using OpenMP or pthreads within each MPIprocess). It generates trace �les that can be latter visualized with Paraver.
Paraver is a �exible parallel program visualization and analysis tool based on an easy-to-useGUI. Paraver was developed responding to the need of hacing a qualitative global perception of theapplication behavior by visual inspection and then to be able to focus on the detailed quantitativeanalysis of the problems. Paraver provides a large amount of information useful to decide the pointson which to invest the programming e�ort to optimize an application.
1.3.1 Where the Extrae and Paraver can be found?
The Extrae and Paraver distributions can be found at URL:
http://www.bsc.es/performance-tools/downloads
This tools are open-source (LGPL v2), so you can download both the source code and precom-piled packages for di�erent architectures and operating systems.
If you have any doubts about how to download these tools, you can send an e-mail to BSC Toolssupport at [email protected].
5

6

Chapter 2
The BustClustering tool
In the previous chapter we have seen how to unpack the contents of the ClusteringSuite package, andalso how to execute our �rst cluster analysis using the BurstClustering tool. In this chapter, wedeeply describe the operation of this tool, both the inputs it requires and the outputs it generates.For this reason, some descriptions of the previous chapter can be repeated in the current one.
2.1 BurstClutering operation
The BurstClustering tool receives two inputs, the Paraver trace where the information will beextracted and a XML con�guration �le, where the user indicates the clustering paramaters, extrap-olation parameters, etc. With this two inputs, the tool �rst extracts the data from the Paravertrace, as de�ned in the XML �le, then applies the cluster algorithm and �nally creates the di�erentoutputs.
In brief, the cluster analysis process its composed by 6 steps. First four steps are required togenerate the XML con�guration �le, while the last two are the execution of the BurstClustering
tool itself and the observation and analysis of the results.
1. Select of the clustering/extrapolation parameters.
2. De�ne the �lters and normalization applied to the input data
3. Select the cluster algorithm and its parameters
4. De�ne the output plots
5. Execute the cluster analysis
6. Analyse the tool outputs
The actual de�nition of the di�erent records in the XML �le are described in the followingchapter, while this one include the guidelines to detect the information it will contain.
1. Select the clustering parameters
The �rst decision to take when performing a cluster analysis is which of the data present in theinput trace will be used to describe each CPU burst, in the ClusteringSuite terminology, we callthem simply the parameters.
7

Using the Paraver vocabulary, a CPU burst is expressed in a trace as a State Record of value1 (Running State). The parameters available to characterize a CPU burst are those events thatappear at the end time of the given Running State. As a Paraver event is a pair event/value, in theXML �le we use the event type to indicate events we whose values will be stored in the di�erentbursts. We can also use Running State duration (di�erence between end time and begin time) as aCPU burst parameter.
In the XML we will express those parameters that will be used by the cluster algorithm, theclustering parameters, and those that will be used in the extrapolation process, the extrapolation
parameters. The parameters can be de�ned as single event reads (single events) or combinations ofpair of events (mixed events). In case we use the CPU burst duration, it will always be used as aclustering parameter.
It could be obvious, but to de�ne the di�erent parameters it is essential to know �rst whichones we want to use and which are the event type codi�cation present in the trace. To do thatwe need to go through to the Paraver Con�gutarion File (.pcf �le generated by Extrae) and checkwhich events appear in the trace and their event type encoding. Almost in all analyses we use thePerformance Hardware Counters events, being Completed Instructions and IPC the usual metricscombinations used by the cluster algorithm.
2. De�ne the �lters and normalizations
Once knowing which are the clustering parameters, we have to decide the possible �lters we wantto apply. The �lters prevent the cluster algorithm of analysing CPU bursts that can bias the resultor do not add any valuable information. We found two di�erent �lters: a duration �lter to discardthose burst whose duration is shorter than a given value, and a range �lter that can be de�ned toeach parameter and eliminates those bursts than are out of the boundaries.
To tune the duration �lter we use the stats tools provided by the CEPBA-Tools package. Usingthe -bursts_histo parameter this tool computes a plot as the one presented in Figure 2.1 for a givenParaver trace. This plot is an histogram where the x axis is the duration of the CPU bursts andquanti�es both the aggregated time of the CPU bursts, the green bars, and the number of bursts,the red line. Observing this plot we can select the duration that eliminates de maximum numberof bursts (red line at left of the select duration), while maintaining a high value of aggregated time(green bars at right of the selected point). For example, in the Figure 2.1, a reasonable duration�lter will be 10 miliseconds.
With respect to the normalizations, we provide the possibility of applying �rst a logarithmicnormalization, useful when the parameter range is wide and can bias the results of the clusteranalysis. The logarithmic normalization can be applied to each parameter independently. Thesecond normalization is a pure range normalization to set the parameter values in range [0, 1],following the formula range (∀ai ∈ A, ai ← (ai −min(A))/(max(A) −min(A))). When using therange normalization, it will be applied to each parameter used, so as to guarantee that all of themhave the same weight in the analysis. If we to add more weight one of the parameters used in thecluster analysis, we can apply a multiplicative factor.
To clarify how the di�erent normalizations and �lters work, this is the order as they are applied:when a CPU burst is read, its duration is checked and then the di�erent parameters that have range�lters de�ned; to those bursts that pass the �lters its performed the logarithmic normalization ofeach parameter that requires it and afterwards the range normalization. Finally, the scaling factoris applied.
8

0×100
1×10⁵
2×10⁵
3×10⁵
4×10⁵
5×10⁵
6×10⁵
7×10⁵
8×10⁵
1 µs10 µs
100 µs
1 ms
10 ms
100 ms
1s 10 s
0
20
40
60
80
100N
um
ber
of
burs
ts
% o
f co
mputa
tion t
ime
Number of bursts% of computing time
Figure 2.1: Bursts histogram produced by stats tool
3. Select the output plots
We can combine the parameters de�ned previous to generate GNUplot scripts of 2D and 3D scatter-plots. The plots can print both the normalized data or the raw data (before normalizations). Theuser can tune tune the ranges to print and also the axis-labels of the plots. In addition, users canlet the library to produce all 2D plots obtained combining all metrics de�ned.
Once having the parameters, �lters and plots, we can run the application ClusteringDataExtractorto extract the data and produce the plots described before runing the cluster algorithm. The re-sulting plots will show all the data available, distinguishing between the duration �ltered bursts,the range �ltered bursts and the ones that will take part in the cluster analyses. These plots are anuseful aid to �ne tune the parameter �lters and normalizations.
4. Select the cluster algorithm
Even though the Aggregative Cluster Re�nement and DBSCAN are the two basic algorithms o�eredby the ClusteringSuite package, there is a few more clustering algorithms o�ered to the user.Table 2.1 contains the list of these algorithms and their parameters. It is interesting to note thatthe Aggregative Cluster Re�nement is the only algorithm that does not require any parameter andit not have to be expressed in the XML con�guration �le.
For further information about the di�erent algorithms included in the package, we point tothe following papers: [1] for DBSCAN algorithm, [2] for GMEANS and [3] for CAPEK, PAM andXCLARA.
In case of DBSCAN we provide the application DBSCANParametersApproximation to help theparemeter selection, according to the technique described in [1].
9
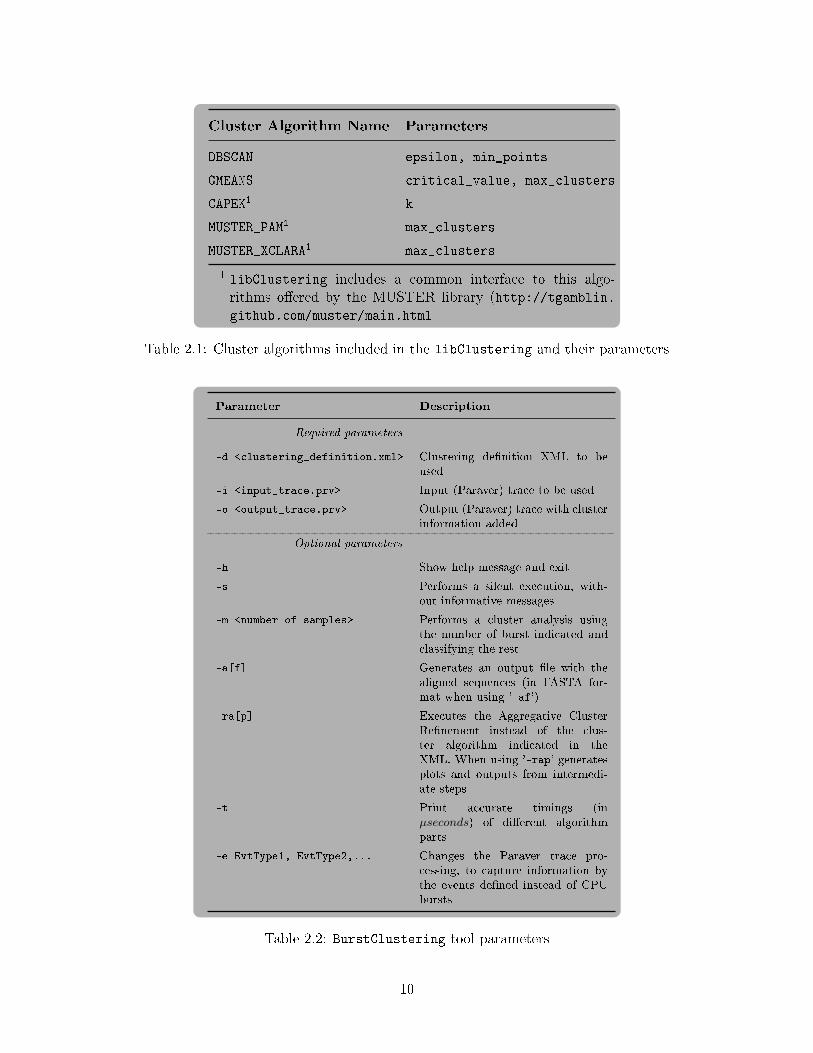
Cluster Algorithm Name Parameters
DBSCAN epsilon, min_points
GMEANS critical_value, max_clusters
CAPEK1 k
MUSTER_PAM1 max_clusters
MUSTER_XCLARA1 max_clusters
1 libClustering includes a common interface to this algo-rithms o�ered by the MUSTER library (http://tgamblin.github.com/muster/main.html
Table 2.1: Cluster algorithms included in the libClustering and their parameters
Parameter Description
Required parameters
-d <clustering_definition.xml> Clustering de�nition XML to beused
-i <input_trace.prv> Input (Paraver) trace to be used
-o <output_trace.prv> Output (Paraver) trace with clusterinformation added
Optional parameters
-h Show help message and exit
-s Performs a silent execution, with-out informative messages
-m <number_of_samples> Performs a cluster analysis usingthe number of burst indicated andclassifying the rest
-a[f] Generates an output �le with thealigned sequences (in FASTA for-mat when using '-af')
-ra[p] Executes the Aggregative ClusterRe�nement instead of the clus-ter algorithm indicated in theXML. When using '-rap' generatesplots and outputs from intermedi-ate steps
-t Print accurate timings (inµseconds) of di�erent algorithmparts
-e EvtType1, EvtType2,... Changes the Paraver trace pro-cessing, to capture information bythe events de�ned instead of CPUbursts
Table 2.2: BurstClustering tool parameters
10
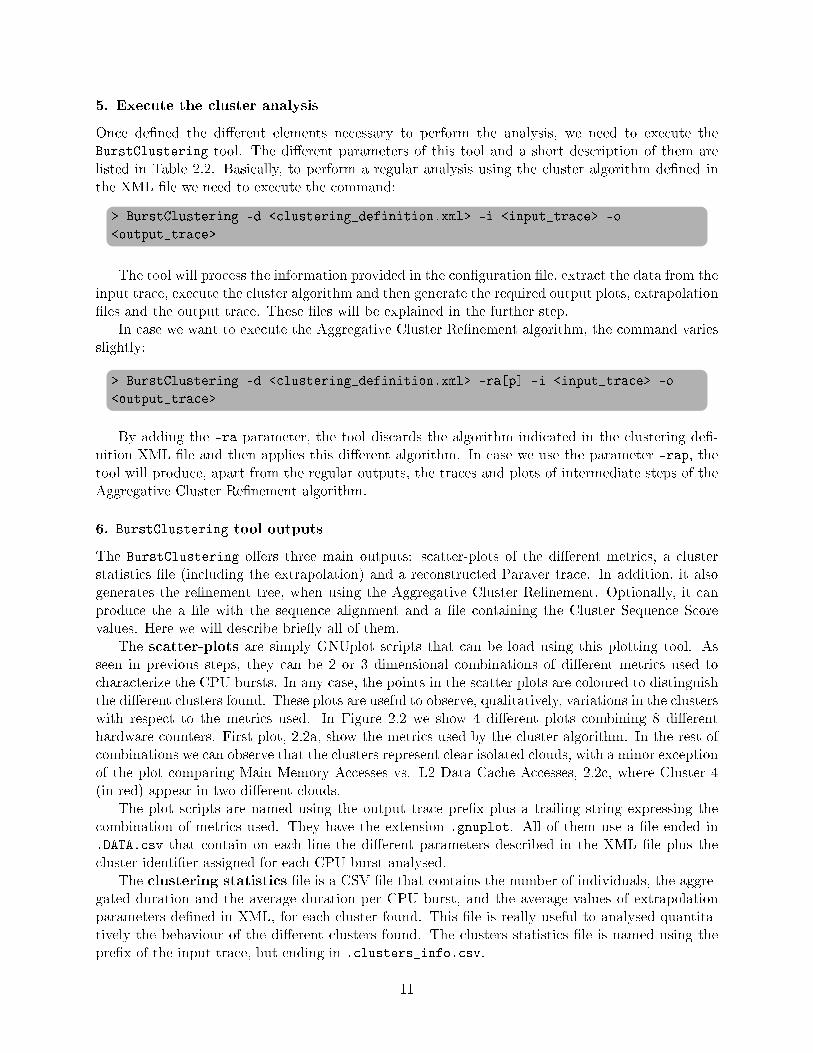
5. Execute the cluster analysis
Once de�ned the di�erent elements necessary to perform the analysis, we need to execute theBurstClustering tool. The di�erent parameters of this tool and a short description of them arelisted in Table 2.2. Basically, to perform a regular analysis using the cluster algorithm de�ned inthe XML �le we need to execute the command:
> BurstClustering -d <clustering_definition.xml> -i <input_trace> -o
<output_trace>
The tool will process the information provided in the con�guration �le, extract the data from theinput trace, execute the cluster algorithm and then generate the required output plots, extrapolation�les and the output trace. These �les will be explained in the further step.
In case we want to execute the Aggregative Cluster Re�nement algorithm, the command variesslightly:
> BurstClustering -d <clustering_definition.xml> -ra[p] -i <input_trace> -o
<output_trace>
By adding the -ra parameter, the tool discards the algorithm indicated in the clustering de�-nition XML �le and then applies this di�erent algorithm. In case we use the parameter -rap, thetool will produce, apart from the regular outputs, the traces and plots of intermediate steps of theAggregative Cluster Re�nement algorithm.
6. BurstClustering tool outputs
The BurstClustering o�ers three main outputs: scatter-plots of the di�erent metrics, a clusterstatistics �le (including the extrapolation) and a reconstructed Paraver trace. In addition, it alsogenerates the re�nement tree, when using the Aggregative Cluster Re�nement. Optionally, it canproduce the a �le with the sequence alignment and a �le containing the Cluster Sequence Scorevalues. Here we will describe brie�y all of them.
The scatter-plots are simply GNUplot scripts that can be load using this plotting tool. Asseen in previous steps, they can be 2 or 3 dimensional combinations of di�erent metrics used tocharacterize the CPU bursts. In any case, the points in the scatter plots are coloured to distinguishthe di�erent clusters found. These plots are useful to observe, qualitatively, variations in the clusterswith respect to the metrics used. In Figure 2.2 we show 4 di�erent plots combining 8 di�erenthardware counters. First plot, 2.2a, show the metrics used by the cluster algorithm. In the rest ofcombinations we can observe that the clusters represent clear isolated clouds, with a minor exceptionof the plot comparing Main Memory Accesses vs. L2 Data Cache Accesses, 2.2c, where Cluster 4(in red) appear in two di�erent clouds.
The plot scripts are named using the output trace pre�x plus a trailing string expressing thecombination of metrics used. They have the extension .gnuplot. All of them use a �le ended in.DATA.csv that contain on each line the di�erent parameters described in the XML �le plus thecluster identi�er assigned for each CPU burst analysed.
The clustering statistics �le is a CSV �le that contains the number of individuals, the aggre-gated duration and the average duration per CPU burst, and the average values of extrapolationparameters de�ned in XML, for each cluster found. This �le is really useful to analysed quantita-tively the behaviour of the di�erent clusters found. The clusters statistics �le is named using thepre�x of the input trace, but ending in .clusters_info.csv.
11

(a) Instructions vs. IPC (b) Stores vs. Loads
(c) Main memory accesses vs. L2 data cache acessess (d) Integer instructions vs. Floating point instructions
Figure 2.2: Output plots produced by BurstClustering tool combining di�erent metrics
12

Next output that is always produced is the output trace. Basically, this is exactly the sameinput trace where all the CPU burst have been surrounded using a certain events to identify them.Thanks to these events, we can take advantage of the vast analysis power of Paraver and Dimemasto perform further analyses and correlate the clusters with all the information present on the trace.For example, we can observe the time-line distribution of the di�erent computation regions detected.An example of Paraver time-line and its corresponding duration pro�le can be seen in Figure 2.3.We provide a set of Paraver con�guration �les with pre-de�ned views and histograms related tocluster events.
In case we executed the Aggregative Cluster Re�nement algorithm, the tool will also produce are�nement tree �le. This �le has the same pre�x as the output trace and the extension TREE.dot.It is a text �le that describes the re�nement tree using the DOT language. To visualize it we requirethe GraphViz1 software package. We also recommend using of the interactive tool xdot2 to navigatethrough the re�nement tree output. An example of a re�nement tree can be seen in Figure 2.4.
Finally, using the parameter -a, the tool will produce a CSV �le containing the sequencesobtained after applying the Cluster Sequence Score. This �le, named as the output trace withthe extension .seq, contains the sequence of the cluster identi�ers (numbers) and gaps (markedas hyphens) introduced by the alignment algorithm for each task and thread present on the inputtrace. If use the parameter -af, the �le will be generated in the FASTA format, transforming the�rst 21 clusters in an amino-acid identi�er. The FASTA �le can be load in any alignment software,such as ClustalX3 for its visualization. In Figure 2.5 we can see a ClustalX window with a set ofaligned sequences.
If we use any of these two last parameters, the tool will also produce a �le with the extensionSCORES.csv, that contains the numerical results of the Cluster Sequence Score.
When using the Aggregative Cluster Re�nement with the parameter -rap the tool will producethe plots, traces, re�nement trees, sequence �les and score �les for each re�nement step. Theintermediate statistics �les will not be generated and these intermediate trace �les will only containcluster events, to check the intermediate cluster distribution, but not to correlate them with otherinformation. The intermediate �les will have an inter-�x STEPX in their �le name, to distinguish atwhich step (iteration) of re�nement were produced.
Finally, it is interesting to note that we guarantee the colour coherence in all those outputsgenerated by the BurstClustering that use colour information to distinguish the cluster identi�ers.In case of ClustalX we provide a modi�ed version of software package with the required amino-acidcolouring.
1http://www.graphviz.org/2http://code.google.com/p/jrfonseca/wiki/XDot3http://www.clustal.org/
13

(a) Time-line distribution of discovered clusters
(b) Duration histogram of the clusters per application task
Figure 2.3: A Paraver time-line and pro�le showing information related to a cluster analysis
14
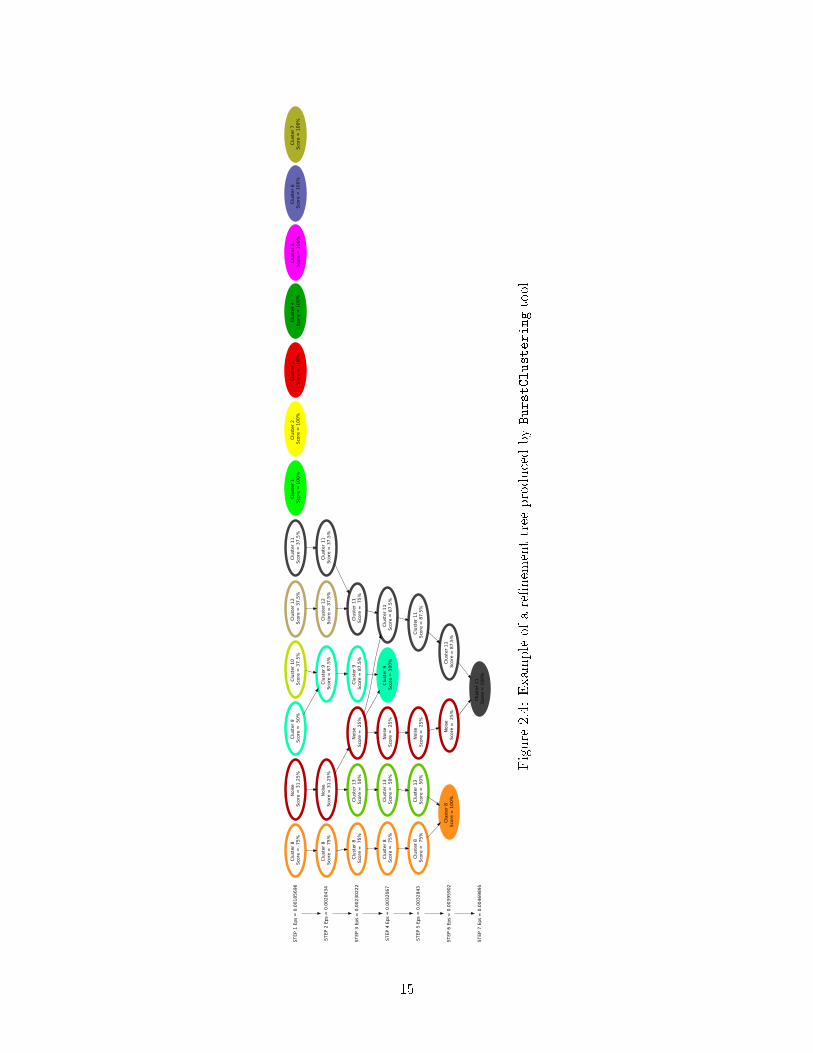
ST
EP
1 E
ps
= 0
.00
18
56
96
ST
EP
2 E
ps
= 0
.00
20
43
4
ST
EP
3 E
ps
= 0
.00
23
02
22
ST
EP
4 E
ps
= 0
.00
32
06
7
ST
EP
5 E
ps
= 0
.00
32
84
3
ST
EP
6 E
ps
= 0
.00
39
59
02
ST
EP
7 E
ps
= 0
.00
46
98
95
Nois
e
Sco
re =
31
.25
%
Nois
e
Sco
re =
31
.25
%
Clu
ster
1
Sco
re =
10
0%
Clu
ster
2
Sco
re =
10
0%
Clu
ster
3
Sco
re =
10
0%
Clu
ster
4
Sco
re =
10
0%
Clu
ster
5
Sco
re =
10
0%
Clu
ster
6
Sco
re =
10
0%
Clu
ster
7
Sco
re =
10
0%
Clu
ster
8
Sco
re =
7
5%
Clu
ster
8
Sco
re =
7
5%
Clu
ster
9
Sco
re =
5
0%
Clu
ster
9
Sco
re =
87
.5%
Clu
ster
10
S
core
= 3
7.5
%C
lust
er
11
S
core
= 3
7.5
%
Clu
ster
11
S
core
= 3
7.5
%
Clu
ster
12
S
core
= 3
7.5
%
Clu
ster
12
S
core
= 3
7.5
%
Nois
e
Sco
re =
2
5%
Clu
ster
13
S
core
=
50
%C
lust
er
9
Sco
re =
87
.5%
Clu
ster
8
Sco
re =
7
5%
Clu
ster
11
S
core
=
75
%
Nois
e
Sco
re =
2
5%
Clu
ster
9
Sco
re =
10
0%
Clu
ster
11
S
core
= 8
7.5
%C
lust
er
8
Sco
re =
7
5%
Clu
ster
13
S
core
=
50
%
Nois
e
Sco
re =
2
5%
Clu
ster
8
Sco
re =
7
5%
Clu
ster
11
S
core
= 8
7.5
%C
lust
er
13
S
core
=
50
%
Nois
e
Sco
re =
2
5%
Clu
ster
8
Sco
re =
10
0%
Clu
ster
11
S
core
= 8
7.5
%
Clu
ster
11
S
core
= 1
00
%
Figure
2.4:
Exam
pleof
are�nem
enttree
producedbyBurstClusteringtool
15

Figure 2.5: ClustalX sequence alignment window
16

Chapter 3
Creating the clustering de�nition XML
In this chapter we deeply describe the structure of the clustering de�nition XML.
3.1 Clustering de�nition XML description
In brief, the clustering de�nition XML �le contains the description of four elements of the clusteringprocess: the parameters associated to each CPU burst in the trace used by cluster analysis andthe extrapolation process; the �ltering ranges and normalizations applied to this data; the clusteralgorithm to be used; and �nally, the description of the di�erent output plots, generated as GNUplotscripts. We can see how these di�erent parts are distributed in the XML �le in Figure 3.1.
Following the current description of the �le it could be easily generated using a regular texteditor or a XML editor.
3.2 Parameter selection
There are two ways to de�ne how the parameters are read from a Paraver trace. First, the values ofindividual events situated at the end of the Running State, using single_event nodes. Second, com-bining the values of two di�erent events with a basic mathematical operation, using mixed_events
nodes.
A single_event node, see Figure 3.2a, contains �rst two attributes: apply_log that indicatesif a logarithmic normalization will be applied to its values; the name parameter is the label the willbe used in the di�erent output �le. The inner node event_type is mandatory, to de�ne the eventtype that appears in the Paraver trace. Optional nodes range_min and range_max are used to �lterthe CPU burst outside these boundaries. Finally, optional node factor is a multiplicative value soas to weight the parameter value.
A mixed_events node, see Figure 3.2b, is pretty similar to the previous one, but includestwo mandatory internal nodes event_type_a and event_type_b, to de�ne the two types of eventsinvolved, and the attribute operation to de�ne the mathematical operation applied to the valuesread. Possible operations are +, -, * and /. The operation is applied to the values of the two eventsde�ned, before the logarithmic normalization.
To de�ne the CPU bursts parameters that will be used by the cluster algorithm, they have tobe placed below the clustering_parameters node, see Figure 3.1. To de�ne those that will beused to characterize the resulting clusters (as averages in the .clusters_info.csv �le), we have toplace them below the extrapolation_parameters node.
17

<clustering_definition use_duration="no" apply_log="yes" normalize_data="yes" duration_filter="10000" threshold_filter="0">
<clustering_algorithm name="xxx"> <!-- specific cluster algorithm parameters --> </clustering_algorithm>
<clustering_parameters> <!-- 'single_event'/'mixed_events' nodes defining the CPU bursts parameters (dimensions) to be used by the cluster algorithm --> </clustering_parameters>
<extrapolation_parameters> <!-- 'single_event'/'mixed_events' nodes defining the CPU burst parameters (dimensions) to be used in the data extrapolation process --> </extrapolation_parameters>
<output_plots all_plots="no"> <!-- 'plot_definition' nodes defining 2D/3D plots combining the 'clustering_parameters'/'extrapolation_parameters' -- </output_plots>
</clustering_definition>
Definition of the output plots combining the CPU parameters
CPU bursts parameters to be extrapolated
CPU bursts parameters to be used by cluster algorithm
Cluster algorithm parametrization
End tag
Figure 3.1: Clustering de�nition XML �le structure
18

<single_event apply_log="yes" name="PM_INST_CMPL"> <event_type>42001090</event_type> <range_min>1e6</range_min> <range_max>1e8</range_max> <factor>1.0</factor></single_event>
(a) single_event node structure
<mixed_events apply_log="yes" name="IPC" operation="/"> <event_type_a>42001090</event_type_a> <event_type_b>42001008</event_type_b> <range_max>3</range_max> <factor>1.0</factor></mixed_events>
(b) mixed_events node structure
Figure 3.2: Nodes to de�ne the parameters extracted from a trace
If we want to use the duration of the CPU bursts as a parameter, we need to set to yes theattribute use_duration present in the root node (clustering_definition).
Filtering and normalization
The �ltering and normalization is expressed at two points of the XML �le. We have seen that theparameter de�nition nodes include both a range �ltering and also a logarithmic normalization. The�ltering information included in the extrapolation parameters is not taken into account.
The second point is the root node. In this node we �nd di�erent attributes, see Figure 3.1regarding �lters and normalizations. First one is apply_log, that indicates if logarithmic normal-ization will be applied to the burst duration, if used. Next one is normalize_data, that indicatesif a �nal range normalization will be applied to the values of all parameters (independently). Nextwe �nd the duration_filter, expressed in µs, to discard those burst with less duration than theindicated. Finally, the threshold_filter is a percentage to discard all the clusters found whoseaggregated duration represents less percentage of the total clusters duration than the indicated.
Output plots
Once de�ned the parameters used to characterize the CPU bursts, below the output_plots nodewe can de�ne the output plots combining the di�erent metrics.
If we set the attribute all_plots of this main node to yes, the libTraceClustering library willgenerate all possible 2D plots combining the parameters de�ned (clustering parameters and extrapo-lation parameters). If we want to manually de�ne the combinations we can use the plot_definitionstructure, see Figure 3.3.
What we �nd �rst in the plot_definition node is the attribute raw_metrics. In case weapplied normalization to the clustering parameters setting this attribute to �yes� indicates thatthe resulting plot will use the raw values of the parameters. Then we �nd three kind of nodes[x|y|z]_metric. Each of these nodes has a mandatory attribute title that will be used as theplot label for the corresponding axis. They have two optional attributes max and min to de�ne theaxis range. Finally, the content of each of these nodes must be the name attribute of any of theparameters de�ned previously (clustering parameter of extrapolation parameter). In case we want
19

<plot_definition raw_metrics="yes"> <x_metric title="IPC" min="0.1" max="2">IPC</x_metric> <y_metric title="Instr. Completed" min="4e7" max="5e7">PAPI_TOT_INS</y_metric> <z_metric title="Memory Instructions">Memory_Instructions</z_metric></plot_definition>
Figure 3.3: plot_definition node of the clustering de�ntion XML
to use the duration, as it is de�ned di�erently from regular parameters, it has to be referencedsimply using the text Duration.
We can combine up to three metrics to create a 3 dimensional scatter-plot, where the individualswill be distinguished in series according to the cluster identi�er assigned. The same is applicablewhen using just two metrics (x and y). If we just de�ne a single metric (x metric), the resultingplot will be a 2 dimensional plot using the cluster identi�er as y axis.
20

Bibliography
[1] M. Ester, Hans P. Kriegel, J. Sander, and X. Xu. A Density-Based Algorithm for DiscoveringClusters in Large Spatial Databases with Noise. In Evangelos Simoudis, Jiawei Han, and UsamaFayyad, editors, KDD96: Proceedings of the Second International Conference on Knowledge
Discovery and Data Mining, pages 226�231, Portland, Oregon, 1996. AAAI Press.
[2] Aislan Gomide Foina, Rosa M. Badia, and Javier Ramirez Fernandez. G-Means Improved forCell BE Environment. In Facing the Multicore-Challenge, pages 54�65, 2010.
[3] Todd Gamblin, Bronis R. de Supinski, Martin Schulz, Rob Fowler, and Daniel A. Reed. Clus-tering Performance Data E�ciently at Massive Scales. In ICS '10: Proceedings of the 24th
International Conference on Supercomputing, pages 243�252, Tsukuba, Japan, 2010. ACM.
21