Clustering With GIS: An Attempt to Classify Turkish ... · Clustering With GIS: An Attempt to...
16
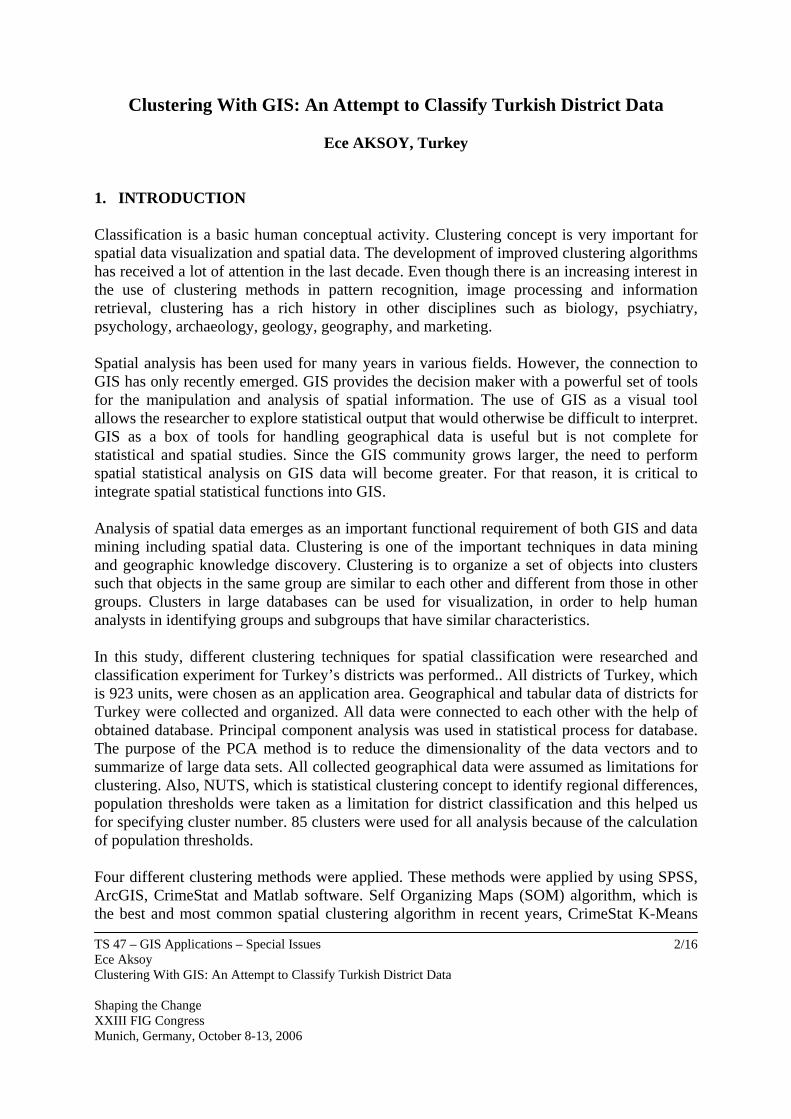
TS 47 – GIS Applications – Special Issues Ece Aksoy Clustering With GIS: An Attempt to Classify Turkish District Data Shaping the Change XXIII FIG Congress Munich, Germany, October 8-13, 2006 1/16 Clustering With GIS: An Attempt to Classify Turkish District Data Ece AKSOY, Turkey Key words: Spatial Clustering Techniques, Classification of Statistical Region Units, Geographical Information Systems (GIS), SOM Algorithm. SUMMARY There is no universally applicable clustering technique in discovering the variety of structures display in data sets. Also, a single algorithm or approach is not adequate to solve every clustering problem. There are many methods available, the criteria used differ and hence different classifications may be obtained for the same data. While larger and larger amounts of data are collected and stored in databases, there is increasing the need for efficient and effective analysis methods. Grouping or classification of measurements is the key element in these data analysis procedures. There are lots of non-spatial clustering techniques in various areas. However, spatial clustering techniques and software are not so common. This study aims comparing different software in non-spatial and spatial clustering techniques, which can be used for different aims such as forming regional politics, constructing statistical integrity or analyzing distribution of funds, in GIS environment and putting forward the facilitative usage of GIS in regional and statistical studies. All districts of Turkey, which is 923 units, were chosen as an application area in this study. Some limitations such as population were specified for clustering of Turkey’s districts. Firstly, different clustering techniques for spatial classification were researched. Afterward, database of Turkey’s statistical datum was formed and analyzed joining with geographical data in the GIS environment. Different clustering software, SPSS, ArcGIS, CrimeStat and Matlab, were applied according to conclusion of clustering techniques research. Self Organizing Maps (SOM) algorithm, which is the best and most common spatial clustering algorithm in recent years, and CrimeStat K-Means clustering were used in this study as spatial clustering methods. SPSS K-Means and ArcGIS reclassify were used for non-spatial examples.
Transcript of Clustering With GIS: An Attempt to Classify Turkish ... · Clustering With GIS: An Attempt to...
TS 47 – GIS Applications – Special Issues Ece Aksoy Clustering With GIS: An Attempt to Classify Turkish District Data Shaping the Change XXIII FIG Congress Munich, Germany, October 8-13, 2006
1/16
Clustering With GIS: An Attempt to Classify Turkish District Data
Ece AKSOY, Turkey
Key words: Spatial Clustering Techniques, Classification of Statistical Region Units, Geographical Information Systems (GIS), SOM Algorithm. SUMMARY There is no universally applicable clustering technique in discovering the variety of structures display in data sets. Also, a single algorithm or approach is not adequate to solve every clustering problem. There are many methods available, the criteria used differ and hence different classifications may be obtained for the same data. While larger and larger amounts of data are collected and stored in databases, there is increasing the need for efficient and effective analysis methods. Grouping or classification of measurements is the key element in these data analysis procedures. There are lots of non-spatial clustering techniques in various areas. However, spatial clustering techniques and software are not so common. This study aims comparing different software in non-spatial and spatial clustering techniques, which can be used for different aims such as forming regional politics, constructing statistical integrity or analyzing distribution of funds, in GIS environment and putting forward the facilitative usage of GIS in regional and statistical studies. All districts of Turkey, which is 923 units, were chosen as an application area in this study. Some limitations such as population were specified for clustering of Turkey’s districts. Firstly, different clustering techniques for spatial classification were researched. Afterward, database of Turkey’s statistical datum was formed and analyzed joining with geographical data in the GIS environment. Different clustering software, SPSS, ArcGIS, CrimeStat and Matlab, were applied according to conclusion of clustering techniques research. Self Organizing Maps (SOM) algorithm, which is the best and most common spatial clustering algorithm in recent years, and CrimeStat K-Means clustering were used in this study as spatial clustering methods. SPSS K-Means and ArcGIS reclassify were used for non-spatial examples.
TS 47 – GIS Applications – Special Issues Ece Aksoy Clustering With GIS: An Attempt to Classify Turkish District Data Shaping the Change XXIII FIG Congress Munich, Germany, October 8-13, 2006
2/16
Clustering With GIS: An Attempt to Classify Turkish District Data
Ece AKSOY, Turkey
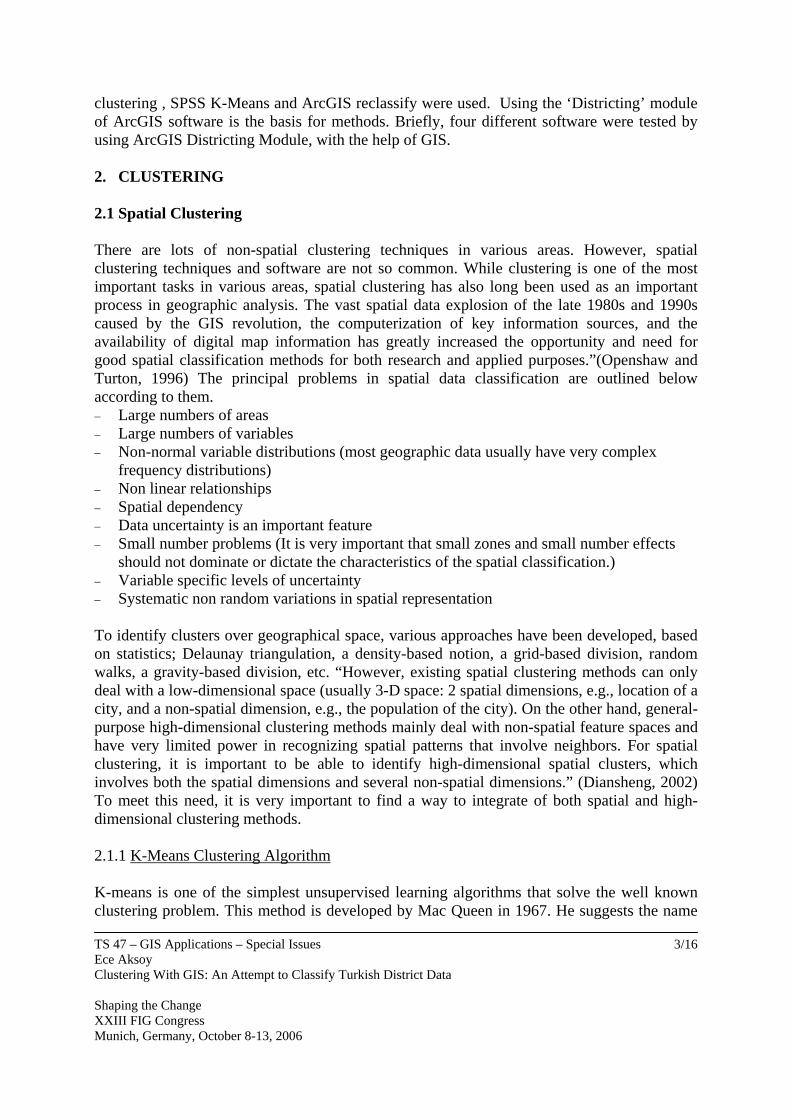
1. INTRODUCTION Classification is a basic human conceptual activity. Clustering concept is very important for spatial data visualization and spatial data. The development of improved clustering algorithms has received a lot of attention in the last decade. Even though there is an increasing interest in the use of clustering methods in pattern recognition, image processing and information retrieval, clustering has a rich history in other disciplines such as biology, psychiatry, psychology, archaeology, geology, geography, and marketing. Spatial analysis has been used for many years in various fields. However, the connection to GIS has only recently emerged. GIS provides the decision maker with a powerful set of tools for the manipulation and analysis of spatial information. The use of GIS as a visual tool allows the researcher to explore statistical output that would otherwise be difficult to interpret. GIS as a box of tools for handling geographical data is useful but is not complete for statistical and spatial studies. Since the GIS community grows larger, the need to perform spatial statistical analysis on GIS data will become greater. For that reason, it is critical to integrate spatial statistical functions into GIS. Analysis of spatial data emerges as an important functional requirement of both GIS and data mining including spatial data. Clustering is one of the important techniques in data mining and geographic knowledge discovery. Clustering is to organize a set of objects into clusters such that objects in the same group are similar to each other and different from those in other groups. Clusters in large databases can be used for visualization, in order to help human analysts in identifying groups and subgroups that have similar characteristics. In this study, different clustering techniques for spatial classification were researched and classification experiment for Turkey’s districts was performed.. All districts of Turkey, which is 923 units, were chosen as an application area. Geographical and tabular data of districts for Turkey were collected and organized. All data were connected to each other with the help of obtained database. Principal component analysis was used in statistical process for database. The purpose of the PCA method is to reduce the dimensionality of the data vectors and to summarize of large data sets. All collected geographical data were assumed as limitations for clustering. Also, NUTS, which is statistical clustering concept to identify regional differences, population thresholds were taken as a limitation for district classification and this helped us for specifying cluster number. 85 clusters were used for all analysis because of the calculation of population thresholds. Four different clustering methods were applied. These methods were applied by using SPSS, ArcGIS, CrimeStat and Matlab software. Self Organizing Maps (SOM) algorithm, which is the best and most common spatial clustering algorithm in recent years, CrimeStat K-Means
TS 47 – GIS Applications – Special Issues Ece Aksoy Clustering With GIS: An Attempt to Classify Turkish District Data Shaping the Change XXIII FIG Congress Munich, Germany, October 8-13, 2006
3/16
clustering , SPSS K-Means and ArcGIS reclassify were used. Using the ‘Districting’ module of ArcGIS software is the basis for methods. Briefly, four different software were tested by using ArcGIS Districting Module, with the help of GIS. 2. CLUSTERING 2.1 Spatial Clustering There are lots of non-spatial clustering techniques in various areas. However, spatial clustering techniques and software are not so common. While clustering is one of the most important tasks in various areas, spatial clustering has also long been used as an important process in geographic analysis. The vast spatial data explosion of the late 1980s and 1990s caused by the GIS revolution, the computerization of key information sources, and the availability of digital map information has greatly increased the opportunity and need for good spatial classification methods for both research and applied purposes.”(Openshaw and Turton, 1996) The principal problems in spatial data classification are outlined below according to them. − Large numbers of areas − Large numbers of variables − Non-normal variable distributions (most geographic data usually have very complex
frequency distributions) − Non linear relationships − Spatial dependency − Data uncertainty is an important feature − Small number problems (It is very important that small zones and small number effects
should not dominate or dictate the characteristics of the spatial classification.) − Variable specific levels of uncertainty − Systematic non random variations in spatial representation To identify clusters over geographical space, various approaches have been developed, based on statistics; Delaunay triangulation, a density-based notion, a grid-based division, random walks, a gravity-based division, etc. “However, existing spatial clustering methods can only deal with a low-dimensional space (usually 3-D space: 2 spatial dimensions, e.g., location of a city, and a non-spatial dimension, e.g., the population of the city). On the other hand, general-purpose high-dimensional clustering methods mainly deal with non-spatial feature spaces and have very limited power in recognizing spatial patterns that involve neighbors. For spatial clustering, it is important to be able to identify high-dimensional spatial clusters, which involves both the spatial dimensions and several non-spatial dimensions.” (Diansheng, 2002) To meet this need, it is very important to find a way to integrate of both spatial and high-dimensional clustering methods. 2.1.1 K-Means Clustering Algorithm K-means is one of the simplest unsupervised learning algorithms that solve the well known clustering problem. This method is developed by Mac Queen in 1967. He suggests the name
TS 47 – GIS Applications – Special Issues Ece Aksoy Clustering With GIS: An Attempt to Classify Turkish District Data Shaping the Change XXIII FIG Congress Munich, Germany, October 8-13, 2006
4/16
K-means for describing his algorithm that assigns each item to the cluster having the nearest centroid (mean). This process consists of three steps: − Partition the items into k initial clusters − Proceed through the list of items, assigning an item to the cluster whose centroid (mean) is
nearest. Recalculate the centroid for the cluster receiving in the new item and for the cluster losing the item.
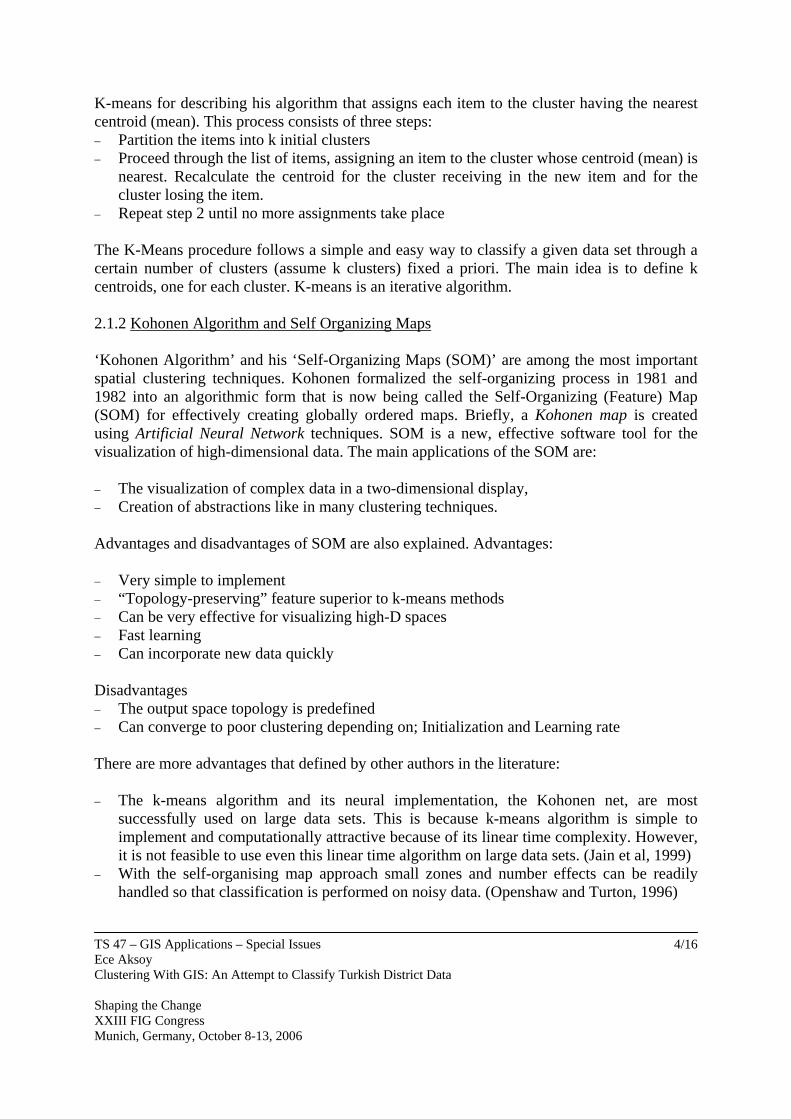
− Repeat step 2 until no more assignments take place The K-Means procedure follows a simple and easy way to classify a given data set through a certain number of clusters (assume k clusters) fixed a priori. The main idea is to define k centroids, one for each cluster. K-means is an iterative algorithm. 2.1.2 Kohonen Algorithm and Self Organizing Maps ‘Kohonen Algorithm’ and his ‘Self-Organizing Maps (SOM)’ are among the most important spatial clustering techniques. Kohonen formalized the self-organizing process in 1981 and 1982 into an algorithmic form that is now being called the Self-Organizing (Feature) Map (SOM) for effectively creating globally ordered maps. Briefly, a Kohonen map is created using Artificial Neural Network techniques. SOM is a new, effective software tool for the visualization of high-dimensional data. The main applications of the SOM are: − The visualization of complex data in a two-dimensional display, − Creation of abstractions like in many clustering techniques. Advantages and disadvantages of SOM are also explained. Advantages: − Very simple to implement − “Topology-preserving” feature superior to k-means methods − Can be very effective for visualizing high-D spaces − Fast learning − Can incorporate new data quickly Disadvantages − The output space topology is predefined − Can converge to poor clustering depending on; Initialization and Learning rate There are more advantages that defined by other authors in the literature: − The k-means algorithm and its neural implementation, the Kohonen net, are most
successfully used on large data sets. This is because k-means algorithm is simple to implement and computationally attractive because of its linear time complexity. However, it is not feasible to use even this linear time algorithm on large data sets. (Jain et al, 1999)
− With the self-organising map approach small zones and number effects can be readily handled so that classification is performed on noisy data. (Openshaw and Turton, 1996)
TS 47 – GIS Applications – Special Issues Ece Aksoy Clustering With GIS: An Attempt to Classify Turkish District Data Shaping the Change XXIII FIG Congress Munich, Germany, October 8-13, 2006
5/16
2.2 Clustering With GIS 2.2.1 Usage of GIS Packages in Clustering Analysis There are various GIS packages in the market. GIS packages, such as ArcInfo, have very good facilities for many types of analysis, but are currently weak in the statistical analysis of spatial data and the use of scientific visualisation techniques. In most GIS packages spatial analytical functionality, lies mainly in the ability to perform deterministic overlay and buffer functions. There is a need to develop clustering analysis function of GIS packages. The integration of GIS with analytical techniques will be a valuable addition in GIS toolbox. Progress in clustering area is inevitable and future developments will continue to place increasing emphasis upon the analytical capabilities of GIS. 2.2.1.1 ArcGIS-Districting Module The Districting Extension for ArcGIS allows you to create defined groupings of geographic data, such as Census tracts, ZIP Codes, and precincts, by creating a districting plan. The Districting Extension has a simple user interface for fast configuration of geographic representation and analysis of configuration alternatives. Once you have the base data established, such as counties or ZIP Codes, you can group the units by simply selecting them in the ArcGIS. The Districting Extension can help you analyze population densities, housing breakdowns, income and race statistics, and other data. During the districting or redistricting process, statistics are updated for each selection of source geography units. You can assign the selected units immediately to the district or preview the statistics before making the assignment to the district. 2.2.1.2 Crimestat II- Hotspot Analysis II- K-Means Clustering CrimeStat is a spatial statistics package that can analyze crime incident location data. Its purpose is to provide a variety of tools for the spatial analysis of crime incidents or other point locations. It can interface with most desktop geographic information systems. It is designed to operate with large crime incident data sets collected by metropolitan police departments. However, it can be used for other types of applications involving point locations, such as the location of arrests, motor vehicle crashes, emergency medical service pickups, or facilities (e.g., police stations). The K-means routine in CrimeStat makes an initial guess about the K locations and then optimizes the distribution locally. The procedure that is adopted makes initial estimates about location of the K clusters (seeds), assigns all points to its nearest seed location, re-calculates a center for each cluster which becomes a new seed, and then repeats the procedure all over again. The procedure stops when there are very few changes to the cluster composition. The default K-means clustering routine follows an algorithm for grouping all point locations in to one, and only one, of these K groups. Finally, the K-means clustering routine (Kmeans) outputs clusters as ellipses.

TS 47 – GIS Applications – Special Issues Ece Aksoy Clustering With GIS: An Attempt to Classify Turkish District Data Shaping the Change XXIII FIG Congress Munich, Germany, October 8-13, 2006
6/16
2.2.1.3 Matlab 6.2 – SomToolbox2 Public-domain software package that was intended for a general purpose SOM development tool is the SOM Toolbox for the Matlab computing environment by the researchers of the Laboratory of Computer and Information Science of Helsinki University of Technology. “The Toolbox contains functions for the creation, visualization and analysis of Self-Organizing Map.” “The Toolbox can be used to preprocess data, initialize and train SOMs using a range of different kinds of topologies, visualize SOMs in various ways, and analyze the proportias of the SOMs and data….” [1] Because Matlab features a high-level programming language, powerful visualization, graphical user interface tools and a very efficient implementation of matrix calculus, SOM Toolbox can be used with Matlab program. 3. DATA AND PROCESSING 3.1 Geographical Data Classification experiment in this thesis was carried out for Turkey’s district data. While performing clustering algorithm on the data, some limitations are inevitable. All collected geographical data were assumed as limitations for clustering. There are seven types of maps were used in this study; − District Map (Polygon Data) − Center of the Districts Map (Point Data with X, Y Coordinates) − Contour Maps (Polygon Data) − Turkey’s Border Map
− 300 Contour Map − 600 Contour Map − 1200 Contour Map − 1800 Contour Map − 2400 Contour Map − 3000 Contour Map − 3600 Contour Map
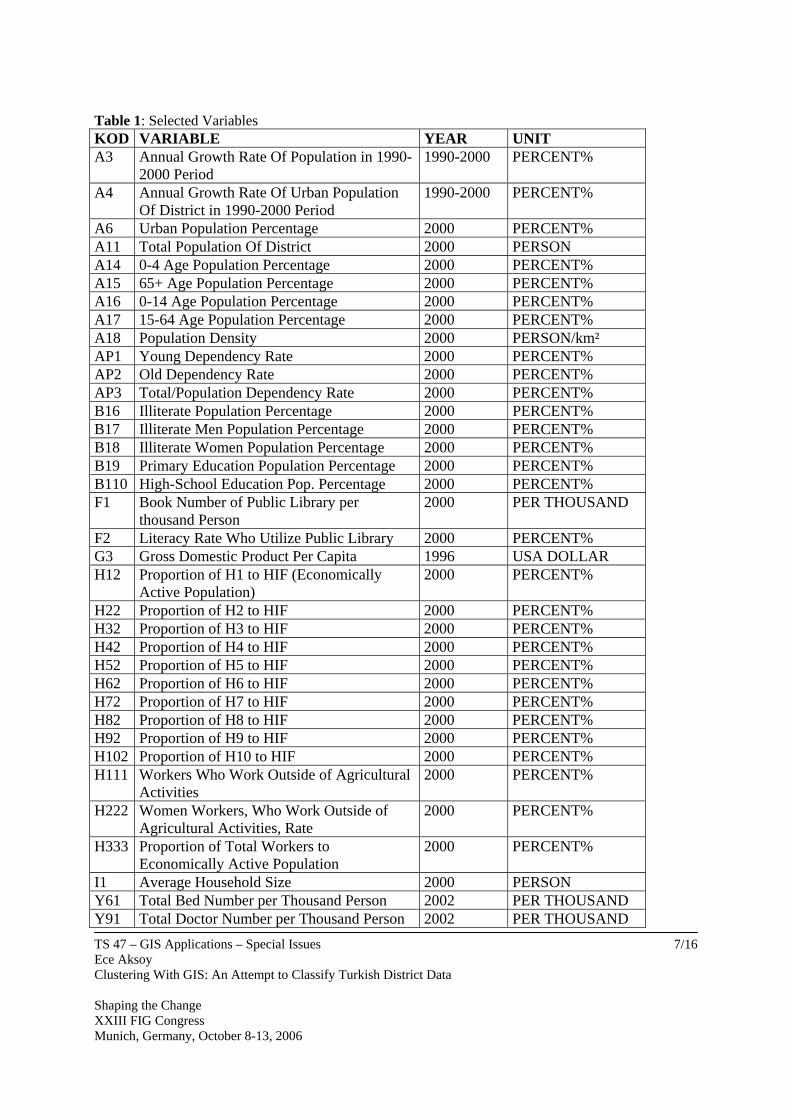
− Physical Map of Turkey (Image from Mineral Research and Exploration, MRE) − Active Faults of Turkey Map (Image from Mineral Research and Exploration, MRE) − Geographical Borders Map (1st Congress of Geography, 1943, Polyline Data) − Basin Development Plans Maps (Polyline Data) 3.2 Tabular Data It was possible to find information about 142 variables at the district level. Some of the data were not be used because of changing number of districts in 1990 and 2000 censuses. Some of the data also were not be used because of the study contents. 36 indicators were selected in point of view of consistency and reliability of indicators from between the whole data.
TS 47 – GIS Applications – Special Issues Ece Aksoy Clustering With GIS: An Attempt to Classify Turkish District Data Shaping the Change XXIII FIG Congress Munich, Germany, October 8-13, 2006
7/16
Table 1: Selected Variables KOD VARIABLE YEAR UNIT A3 Annual Growth Rate Of Population in 1990-
2000 Period 1990-2000 PERCENT%
A4 Annual Growth Rate Of Urban Population Of District in 1990-2000 Period
1990-2000 PERCENT%
A6 Urban Population Percentage 2000 PERCENT% A11 Total Population Of District 2000 PERSON A14 0-4 Age Population Percentage 2000 PERCENT% A15 65+ Age Population Percentage 2000 PERCENT% A16 0-14 Age Population Percentage 2000 PERCENT% A17 15-64 Age Population Percentage 2000 PERCENT% A18 Population Density 2000 PERSON/km² AP1 Young Dependency Rate 2000 PERCENT% AP2 Old Dependency Rate 2000 PERCENT% AP3 Total/Population Dependency Rate 2000 PERCENT% B16 Illiterate Population Percentage 2000 PERCENT% B17 Illiterate Men Population Percentage 2000 PERCENT% B18 Illiterate Women Population Percentage 2000 PERCENT% B19 Primary Education Population Percentage 2000 PERCENT% B110 High-School Education Pop. Percentage 2000 PERCENT% F1 Book Number of Public Library per
thousand Person 2000 PER THOUSAND
F2 Literacy Rate Who Utilize Public Library 2000 PERCENT% G3 Gross Domestic Product Per Capita 1996 USA DOLLAR H12 Proportion of H1 to HIF (Economically
Active Population) 2000 PERCENT%
H22 Proportion of H2 to HIF 2000 PERCENT% H32 Proportion of H3 to HIF 2000 PERCENT% H42 Proportion of H4 to HIF 2000 PERCENT% H52 Proportion of H5 to HIF 2000 PERCENT% H62 Proportion of H6 to HIF 2000 PERCENT% H72 Proportion of H7 to HIF 2000 PERCENT% H82 Proportion of H8 to HIF 2000 PERCENT% H92 Proportion of H9 to HIF 2000 PERCENT% H102 Proportion of H10 to HIF 2000 PERCENT% H111 Workers Who Work Outside of Agricultural
Activities 2000 PERCENT%
H222 Women Workers, Who Work Outside of Agricultural Activities, Rate
2000 PERCENT%
H333 Proportion of Total Workers to Economically Active Population
2000 PERCENT%
I1 Average Household Size 2000 PERSON Y61 Total Bed Number per Thousand Person 2002 PER THOUSAND Y91 Total Doctor Number per Thousand Person 2002 PER THOUSAND
TS 47 – GIS Applications – Special Issues Ece Aksoy Clustering With GIS: An Attempt to Classify Turkish District Data Shaping the Change XXIII FIG Congress Munich, Germany, October 8-13, 2006
8/16
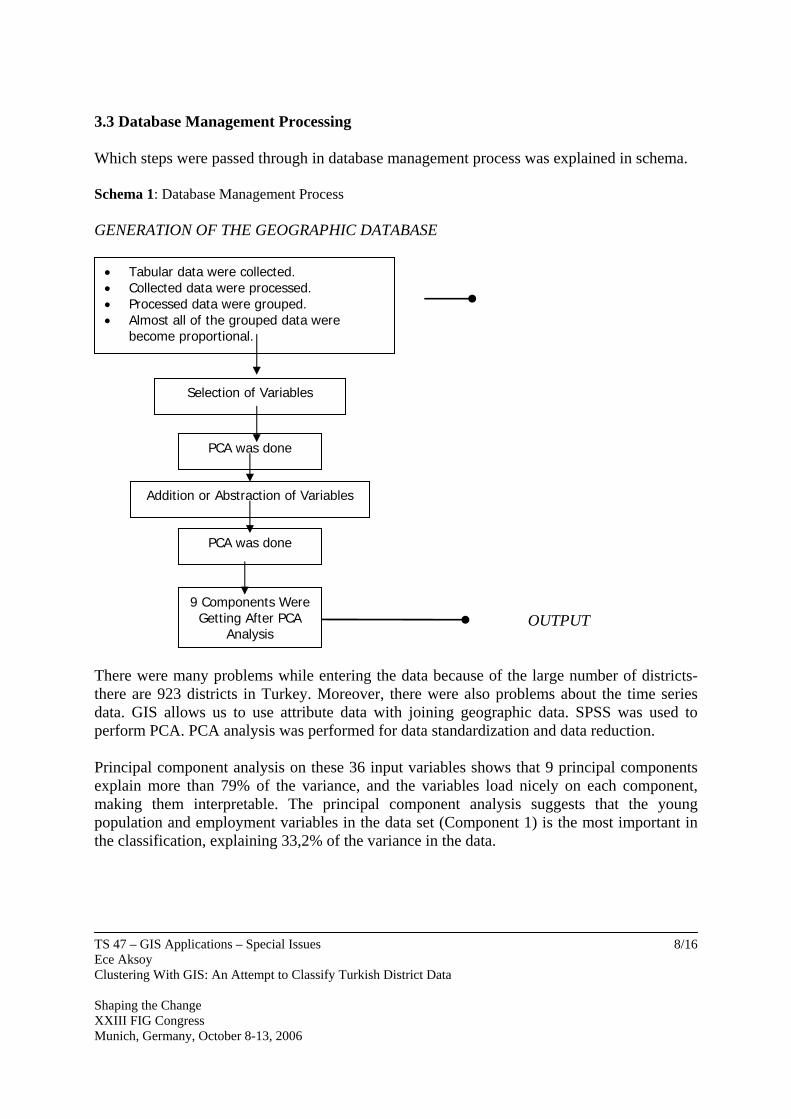
3.3 Database Management Processing Which steps were passed through in database management process was explained in schema. Schema 1: Database Management Process GENERATION OF THE GEOGRAPHIC DATABASE
OUTPUT There were many problems while entering the data because of the large number of districts- there are 923 districts in Turkey. Moreover, there were also problems about the time series data. GIS allows us to use attribute data with joining geographic data. SPSS was used to perform PCA. PCA analysis was performed for data standardization and data reduction. Principal component analysis on these 36 input variables shows that 9 principal components explain more than 79% of the variance, and the variables load nicely on each component, making them interpretable. The principal component analysis suggests that the young population and employment variables in the data set (Component 1) is the most important in the classification, explaining 33,2% of the variance in the data.
• Tabular data were collected. • Collected data were processed. • Processed data were grouped. • Almost all of the grouped data were
become proportional.
Selection of Variables
PCA was done
Addition or Abstraction of Variables
PCA was done
9 Components Were Getting After PCA
Analysis
TS 47 – GIS Applications – Special Issues Ece Aksoy Clustering With GIS: An Attempt to Classify Turkish District Data Shaping the Change XXIII FIG Congress Munich, Germany, October 8-13, 2006
9/16
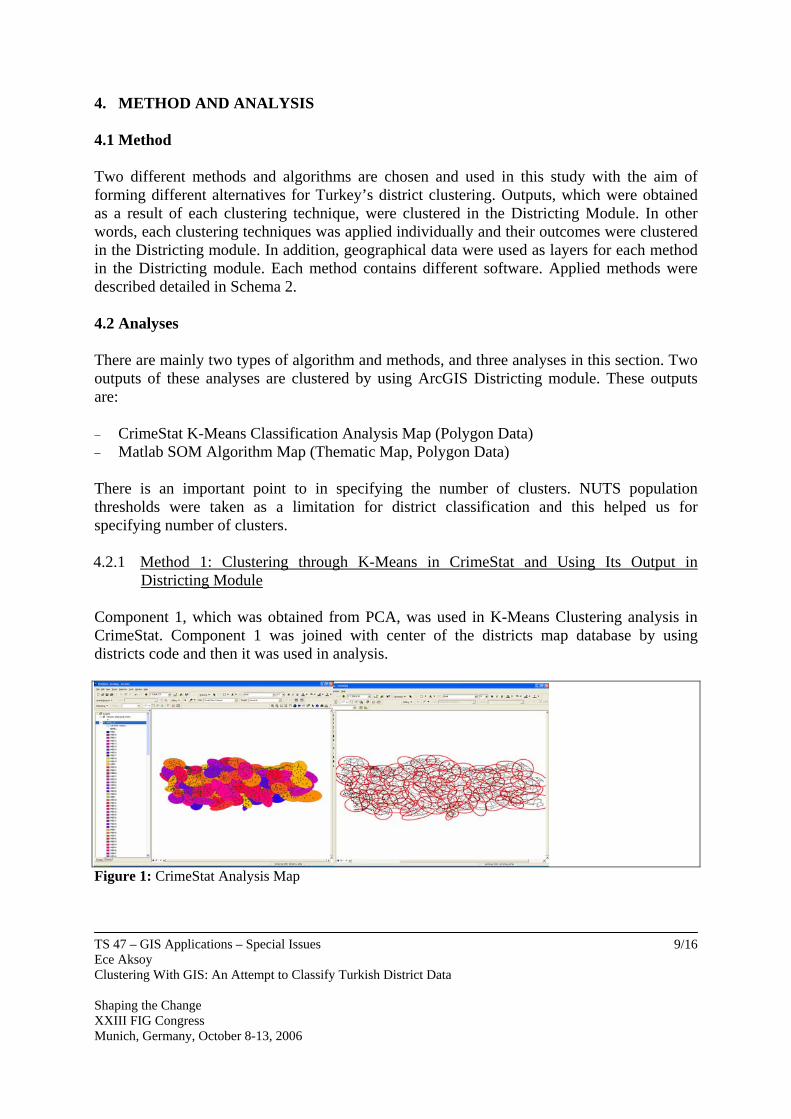
4. METHOD AND ANALYSIS 4.1 Method Two different methods and algorithms are chosen and used in this study with the aim of forming different alternatives for Turkey’s district clustering. Outputs, which were obtained as a result of each clustering technique, were clustered in the Districting Module. In other words, each clustering techniques was applied individually and their outcomes were clustered in the Districting module. In addition, geographical data were used as layers for each method in the Districting module. Each method contains different software. Applied methods were described detailed in Schema 2. 4.2 Analyses There are mainly two types of algorithm and methods, and three analyses in this section. Two outputs of these analyses are clustered by using ArcGIS Districting module. These outputs are: − CrimeStat K-Means Classification Analysis Map (Polygon Data) − Matlab SOM Algorithm Map (Thematic Map, Polygon Data) There is an important point to in specifying the number of clusters. NUTS population thresholds were taken as a limitation for district classification and this helped us for specifying number of clusters. 4.2.1 Method 1: Clustering through K-Means in CrimeStat and Using Its Output in
Districting Module
Component 1, which was obtained from PCA, was used in K-Means Clustering analysis in CrimeStat. Component 1 was joined with center of the districts map database by using districts code and then it was used in analysis.
Figure 1: CrimeStat Analysis Map

TS 47 – GIS Applications – Special Issues Ece Aksoy Clustering With GIS: An Attempt to Classify Turkish District Data Shaping the Change XXIII FIG Congress Munich, Germany, October 8-13, 2006
10/16
Schema 2: Methods METHOD 1 METHOD 2
Inputs Input
Center of the
districts map PCA All Join
CrimeStat K-Means Clustering
Matlab SOM Algorithm
New Variable (U-Matrix)
SPSS K-Means
Clustering
ARCGIS DISTRICTING MODULE
Contour Maps
Physical Map of Turkey
Active Faults of Turkey Map
Geographic Borders Map
Basin Development Plans Map
Thematic Map of this joining
Center of the
districts map
PCA Component
1

TS 47 – GIS Applications – Special Issues Ece Aksoy Clustering With GIS: An Attempt to Classify Turkish District Data Shaping the Change XXIII FIG Congress Munich, Germany, October 8-13, 2006
11/16
There is need to see which points relate which of those ellipses. Because the K-means analysis of CrimeStat software assigns points to one, and only one, cluster, thematic map of the ellipses can be performed by joining output of this analysis with the District map in ArcGIS software. Finally, all points were assigned to clusters that are polygon. It is seen that from the Figure 1 different districts in different ellipses have different color.
Figure 2: Thematic Map of CrimeStat Analysis Map This CrimeStat thematic map, center of the district thematic map, other geographical data and districting plan that was created for this analysis output were opened in the same view as seen in Figure 2.
Figure 3: All Layers In the Same View Before Starting to Create CrimeStat Groupings Clustering was performed in ArcGIS Districting environment by looking same characteristics with showing by color. Selecting, assigning and creating new districts steps were performed. Figure 4 is the final districts according to CrimeStat software classification method. There are 84 new districts in after classification.
TS 47 – GIS Applications – Special Issues Ece Aksoy Clustering With GIS: An Attempt to Classify Turkish District Data Shaping the Change XXIII FIG Congress Munich, Germany, October 8-13, 2006
12/16
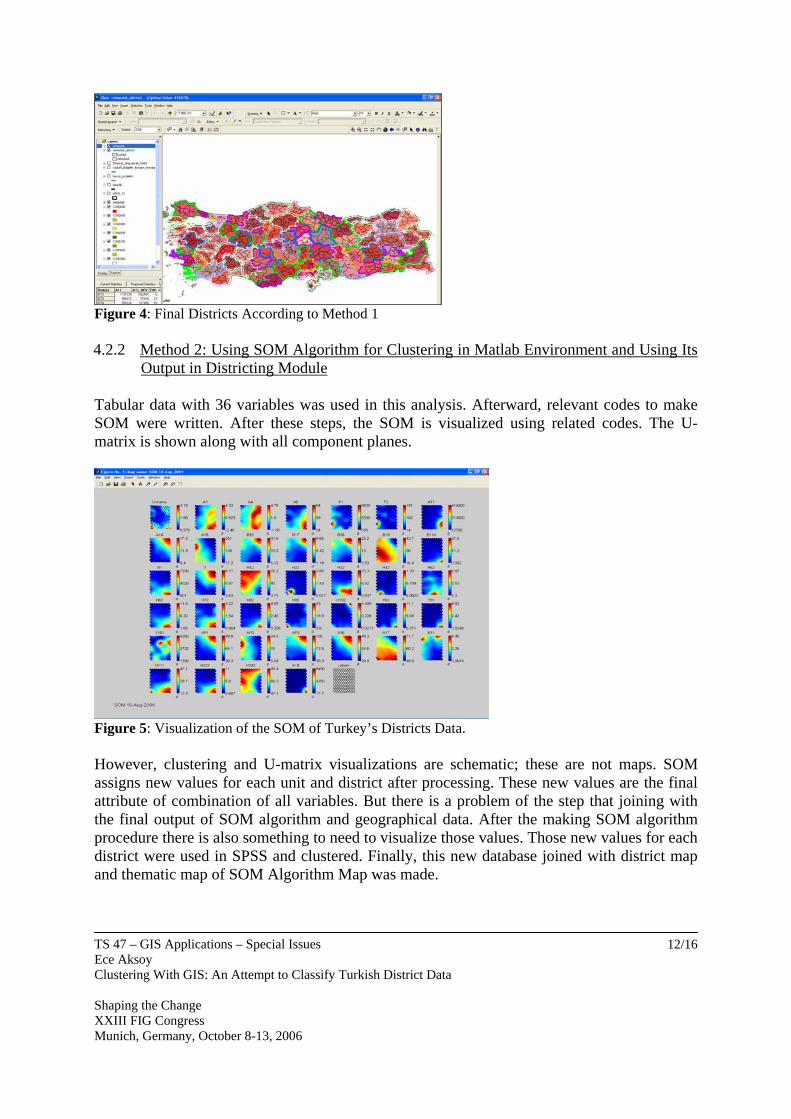
Figure 4: Final Districts According to Method 1 4.2.2 Method 2: Using SOM Algorithm for Clustering in Matlab Environment and Using Its
Output in Districting Module Tabular data with 36 variables was used in this analysis. Afterward, relevant codes to make SOM were written. After these steps, the SOM is visualized using related codes. The U-matrix is shown along with all component planes.
Figure 5: Visualization of the SOM of Turkey’s Districts Data. However, clustering and U-matrix visualizations are schematic; these are not maps. SOM assigns new values for each unit and district after processing. These new values are the final attribute of combination of all variables. But there is a problem of the step that joining with the final output of SOM algorithm and geographical data. After the making SOM algorithm procedure there is also something to need to visualize those values. Those new values for each district were used in SPSS and clustered. Finally, this new database joined with district map and thematic map of SOM Algorithm Map was made.
TS 47 – GIS Applications – Special Issues Ece Aksoy Clustering With GIS: An Attempt to Classify Turkish District Data Shaping the Change XXIII FIG Congress Munich, Germany, October 8-13, 2006
13/16
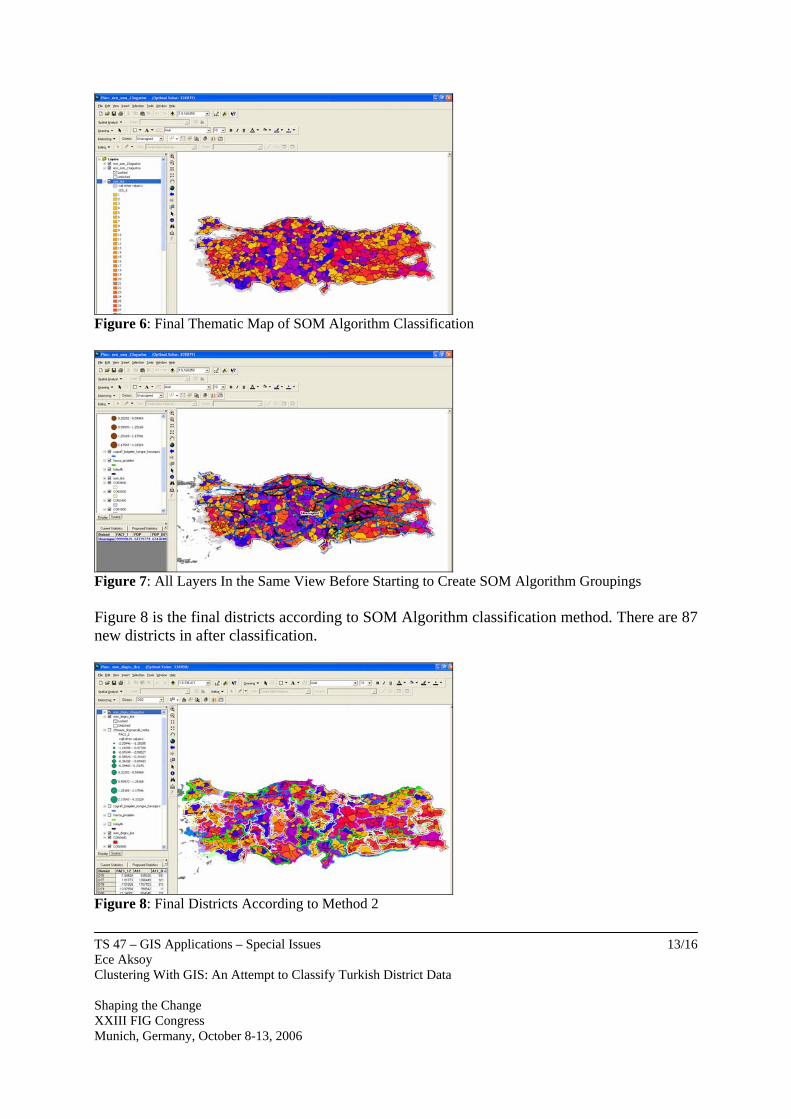
Figure 6: Final Thematic Map of SOM Algorithm Classification
Figure 7: All Layers In the Same View Before Starting to Create SOM Algorithm Groupings Figure 8 is the final districts according to SOM Algorithm classification method. There are 87 new districts in after classification.
Figure 8: Final Districts According to Method 2

TS 47 – GIS Applications – Special Issues Ece Aksoy Clustering With GIS: An Attempt to Classify Turkish District Data Shaping the Change XXIII FIG Congress Munich, Germany, October 8-13, 2006
14/16
5. CONCLUSION 84 districts were obtained in Method 1 by using K-Means algorithm of the CrimeStat software and 87 districts were obtained in Method 2 by using the SOM algorithm in Matlab software. Each grouping is differentiated in each Method, as seen in the Figure 9. Method 1 has more regular in terms of size of the new clusters because each district assign to the group that has the closest centroid at the same distance from the center of the centroid in Method 1. Method 2 has different cluster sizes.
METHOD1
METHOD2 Figure 9: Final Districts for each Method one by one. Method 1 was the most quicker and easy method because; it was already groupings thanks to software ‘spatial’ clustering routine in CrimeStat classification, Method 1. The routine tries to find the best positioning of each center and then assigns each point to the center that is nearest. Those groupings only were divided according to population thresholds actually. For example, there was only one grouping for total Istanbul after classification analysis according to closeness, finally there were 6 new districts after districting. But this method is over the limit of population thresholds. Method 2, SOM Algorithm classification, had good suited and visibly groupings and had best logical classification. It was easy to help geographical limitations while clustering Method 2 outputs, in other words, the best clusters, which were the best fit with the geography, were obtained by the Method 2. Because the SOM algorithm is also for ‘spatial clustering’, while it

TS 47 – GIS Applications – Special Issues Ece Aksoy Clustering With GIS: An Attempt to Classify Turkish District Data Shaping the Change XXIII FIG Congress Munich, Germany, October 8-13, 2006
15/16
is calculating new values for total of the data it takes into consideration being neighbor. These new values are the final attribute of combination of all variables. But there is a problem of the step that joining with the final output of SOM algorithm and geographical data. After the making SOM algorithm procedure there is also something to need to visualize those values. SPSS K-Means classification was used to classify those new values. However, there is need to improve new method to join with SOM algorithm output and geography to better visualization. The use of GIS as a visual tool allows the researcher to explore statistical output that would otherwise be difficult to interpret. Spatial analysis has been used in various fields. However, the connection to GIS has only recently emerged. Since the GIS community grows larger, the need to perform spatial statistical analysis on GIS data will become greater. For that reason, it is critical to integrate spatial statistical functions into GIS. This is also very important for social and economical analysis, like generating ‘regions aiming for statistic only’ proposal, since data are aggregated for different geographical areas or zones, like census tracts and counties. In addition, there is a need for improving clustering analysis in GIS. Kohonen’s self-organizing maps can be used effectively in geo-demographic studies and spatial clustering. Although it has some disadvantages, it can be coping with spatial data’s problems and it provides significant easiness. More productive studies can be made and disadvantages or insufficiencies of Kohonen algorithm can be eliminate with integrating and developing algorithm with other methods by taken Kohonen’s algorithm as the basis. Furthermore, there is need to improve new method to join with SOM algorithm output and geography to better visualization. Because, there is a problem of the step that joining with the final output of SOM algorithm and geographical data. After the making SOM algorithm procedure there is also something to need to visualize those values. SPSS K-Means classification was used to classify those new values. REFERENCES Diansheng, G. (2002) “Spatial Cluster Ordering and Encoding for High-Dimensional
Geographic Knowledge Discovery”, UCGIS2, Summer, 2002 Available at: http://www.cobblestoneconcepts.com/ucgis2summer2002/guo/guo.html (Last
accessed date is 30 May 2004) Jain, A.K., Murty, M.N. and Flynn, P.J. (1999) “Data Clustering: A Review”, ACM
Computing Surveys, Vol. 31, No. 3, September 1999 Kohonen, T. (2001)”Self-Organizing Maps”, Springer Series in Information Sciences, 3rd
Edition, Berlin, Germany, 2001 Openshaw, S. and Turton, I. (1996)“A parallel Kohonen algorithm for the classification of
large spatial datasets”, Centre for Computational Geography, School of Geography, Leeds University, Leeds, Taylor and Francis, London, 1996
WEB Adresses: [1] http://www.cis.hut.fi/projects/somtoolbox (Last accessed 15 June 2004)

TS 47 – GIS Applications – Special Issues Ece Aksoy Clustering With GIS: An Attempt to Classify Turkish District Data Shaping the Change XXIII FIG Congress Munich, Germany, October 8-13, 2006
16/16
CONTACTS Ece Aksoy Akdeniz University Akdeniz University Agricultural Faculty Soil Department 07070 Antalya TURKEY Tel. + 90 2423102411/6537 Fax + 90 2422274564 Email: [email protected]