
Clustering in dynamic causal networks as a measure of systemic risk on the euro zone
20
Clustering in dynamic causal networks as a measure of systemic risk on the euro zone SYstemic Risk TOmography: Signals, Measurements, Transmission Channels, and Policy Interventions M. Billio, H. Gatfaoui, L. Frattarolo, P. de Peretti IESEG/ UniversitÈ Paris1 PanthÈon-Sorbonne/ University CaíFoscari Final SYRTO Conference - Université Paris1 Panthéon-Sorbonne February 19, 2016
-
Upload
syrto-project -
Category
Economy & Finance
-
view
466 -
download
1
Transcript of Clustering in dynamic causal networks as a measure of systemic risk on the euro zone

Clustering in dynamic causal
networks as a measure of systemic
risk on the euro zone
SYstemic Risk TOmography:
Signals, Measurements, Transmission Channels, and Policy Interventions
M. Billio, H. Gatfaoui, L. Frattarolo, P. de Peretti IESEG/ UniversitÈ Paris1 PanthÈon-Sorbonne/ University CaíFoscari
Final SYRTO Conference - Université Paris1 Panthéon-Sorbonne February 19, 2016
Introduction
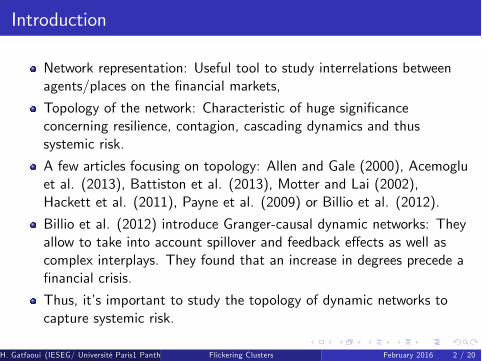
Network representation: Useful tool to study interrelations betweenagents/places on the financial markets,
Topology of the network: Characteristic of huge significanceconcerning resilience, contagion, cascading dynamics and thussystemic risk.
A few articles focusing on topology: Allen and Gale (2000), Acemogluet al. (2013), Battiston et al. (2013), Motter and Lai (2002),Hackett et al. (2011), Payne et al. (2009) or Billio et al. (2012).
Billio et al. (2012) introduce Granger-causal dynamic networks: Theyallow to take into account spillover and feedback e§ects as well ascomplex interplays. They found that an increase in degrees precede afinancial crisis.
Thus, it’s important to study the topology of dynamic networks tocapture systemic risk.
H. Gatfaoui (IESEG/ Université Paris1 Panthéon-Sorbonne/ University Ca’ Foscari)Flickering Clusters February 2016 2 / 20
Main objectives of the paper 1/2
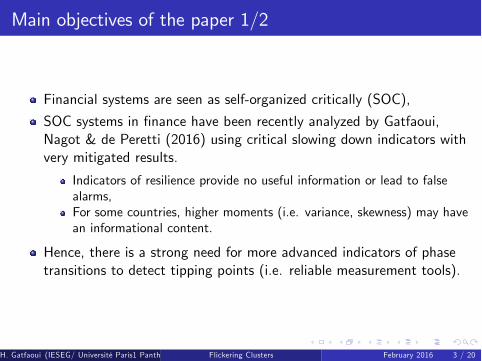
Financial systems are seen as self-organized critically (SOC),
SOC systems in finance have been recently analyzed by Gatfaoui,Nagot & de Peretti (2016) using critical slowing down indicators withvery mitigated results.
Indicators of resilience provide no useful information or lead to falsealarms,For some countries, higher moments (i.e. variance, skewness) may havean informational content.
Hence, there is a strong need for more advanced indicators of phasetransitions to detect tipping points (i.e. reliable measurement tools).
H. Gatfaoui (IESEG/ Université Paris1 Panthéon-Sorbonne/ University Ca’ Foscari)Flickering Clusters February 2016 3 / 20

Main objectives of the paper 2/2
Using daily data on main European stock exchanges, we:
Build a dynamic causal network using an other class of Granger testsbased on the innovations of filtered series,
analyze the topology of the di§erent networks over di§erent periodsof time,
Focus on information transmission patterns, and deduce early warningindicators of phase transition or tipping points.
H. Gatfaoui (IESEG/ Université Paris1 Panthéon-Sorbonne/ University Ca’ Foscari)Flickering Clusters February 2016 4 / 20
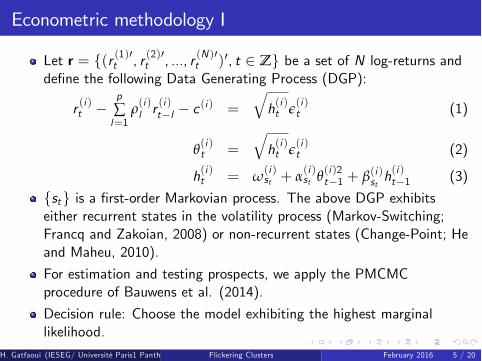
Econometric methodology I
Let r = {(r (1)0t , r (2)0t , ..., r (N )0t )0, t 2 Z} be a set of N log-returns anddefine the following Data Generating Process (DGP):
r (i )t −pÂl=1
r(i )l r(i )t−l − c
(i ) =
qh(i )t e(i )t (1)
q(i )t =
qh(i )t e(i )t (2)
h(i )t = w(i )st + a(i )st q(i )2t−1 + b(i )st h
(i )t−1 (3)
{st} is a first-order Markovian process. The above DGP exhibitseither recurrent states in the volatility process (Markov-Switching;Francq and Zakoian, 2008) or non-recurrent states (Change-Point; Heand Maheu, 2010).
For estimation and testing prospects, we apply the PMCMCprocedure of Bauwens et al. (2014).
Decision rule: Choose the model exhibiting the highest marginallikelihood.
H. Gatfaoui (IESEG/ Université Paris1 Panthéon-Sorbonne/ University Ca’ Foscari)Flickering Clusters February 2016 5 / 20
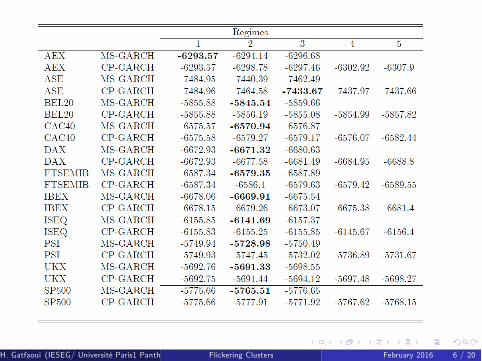
H. Gatfaoui (IESEG/ Université Paris1 Panthéon-Sorbonne/ University Ca’ Foscari)Flickering Clusters February 2016 6 / 20

Econometric methodology III
Let bh ={((bh(1)t )−1/2be(1)t )0, ((bh
(2)t )
−1/2be(2)t )0, ..., ((bh(N )t )−1/2be(N )t )0, t 2 Z} be
a set of normalized innovations.Major issue when computing bivariate relationships to find edges in acausal network over such set: The omitted variable bias.To handle such problem, we orthogonalize all the series with regard tothe SP500 following the methodology of Duchesne and Nkwimi(2013).
Let b# = {(b#(1)0t ,b#(2)0t , ...,b#(N )0t )0, t 2 Z} be the set of orthogonalizedinnovations.Introducing covariances and cross covariances:
C(hh)b# (0) = T−1T
Âi=1b#(h)t b#
(h)0t , h = 1, 2 (4)
C(12)b# (k) =
(T−1 ÂT
i=1 b#(1)t b#
(2)0t−k 0 ≤ k ≤ T − 1
T−1 ÂTi=1 b#
(1)t b#
(2)0t−k 1− T ≤ k ≤ 0.
(5)
H. Gatfaoui (IESEG/ Université Paris1 Panthéon-Sorbonne/ University Ca’ Foscari)Flickering Clusters February 2016 7 / 20
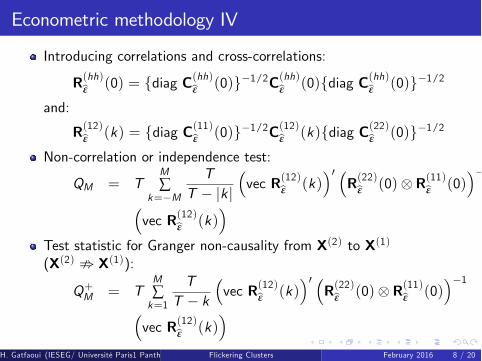
Econometric methodology IV
Introducing correlations and cross-correlations:
R(hh)b# (0) = {diag C(hh)b# (0)}−1/2C(hh)b# (0){diag C(hh)b# (0)}−1/2
and:
R(12)b# (k) = {diag C(11)b# (0)}−1/2C(12)b# (k){diag C(22)b# (0)}−1/2
Non-correlation or independence test:
QM = TMÂ
k=−M
TT − |k |
(vec R(12)b# (k)
)0 (R(22)b# (0)⊗R(11)b# (0)
)−1
(vec R(12)b# (k)
)
Test statistic for Granger non-causality from X(2) to X(1)
(X(2) ; X(1)):
Q+M = TMÂk=1
TT − k
(vec R(12)b# (k)
)0 (R(22)b# (0)⊗R(11)b# (0)
)−1
(vec R(12)b# (k)
)
H. Gatfaoui (IESEG/ Université Paris1 Panthéon-Sorbonne/ University Ca’ Foscari)Flickering Clusters February 2016 8 / 20

Econometric methodology V
Test statistic for Granger non-causality from X(1) to X(2)
(X(1) ; X(2)):
Q−M = T−MÂ
k=−1
TT − |k |
(vec R(12)b# (k)
)0 (R(22)b# (0)⊗R(11)b# (0)
)−1
(vec R(12)b# (k)
)
At one given lag:
Q(k) = TT
T − |k |
(vec R(12)bh (k)
)0 (R(22)bh (0)⊗R(11)bh (0)
)−1
(vec R(12)bh (k)
)
All tests are Chi-square distributed.
H. Gatfaoui (IESEG/ Université Paris1 Panthéon-Sorbonne/ University Ca’ Foscari)Flickering Clusters February 2016 9 / 20

Period-based analysis
Table: Periods of the analysis
Name Dates1 Dot.com bubble 07JAN98-09OCT022 Pre-crisis 10OCT02-02JUL073 Crisis 03JUL07-01MAY094 Post-crisis 02MAY09-30APR105 Sovereign debt crisis 01MAY10-31MAR136 Post-sovereign debt crisis 01APR13-20MAY14
H. Gatfaoui (IESEG/ Université Paris1 Panthéon-Sorbonne/ University Ca’ Foscari)Flickering Clusters February 2016 10 / 20

Period-specific results I
Using non-causality tests (i.e. M = ±7),
Nodes’ states are unstable over time,
Density of the causal network changes dramatically across periods.
After the Global Financial Crisis, causality vanishes.
Unexpectedly, Greece is not a causal variable across periods.
H. Gatfaoui (IESEG/ Université Paris1 Panthéon-Sorbonne/ University Ca’ Foscari)Flickering Clusters February 2016 11 / 20

Period-specific results II
Click me
H. Gatfaoui (IESEG/ Université Paris1 Panthéon-Sorbonne/ University Ca’ Foscari)Flickering Clusters February 2016 12 / 20

Period-specific results III
Figure: Instantaneous correlations. Total degrees and total strength of thenetwork.
H. Gatfaoui (IESEG/ Université Paris1 Panthéon-Sorbonne/ University Ca’ Foscari)Flickering Clusters February 2016 13 / 20
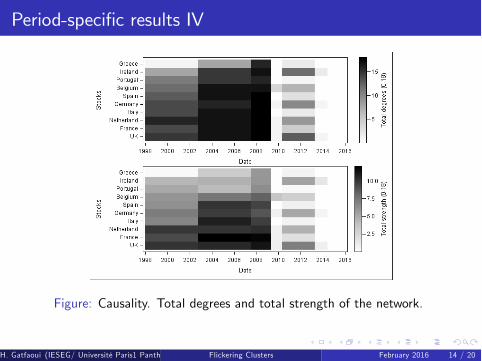
Period-specific results IV
Figure: Causality. Total degrees and total strength of the network.
H. Gatfaoui (IESEG/ Université Paris1 Panthéon-Sorbonne/ University Ca’ Foscari)Flickering Clusters February 2016 14 / 20

Early warning indicators: Goals & Method
Nodes’ states are unstable over time (ever-changing network),
Since we use a dynamic network, information transmission channels(i.e. innovation contagion) are also unstable.
Can we extract information from such time-varying structure?
Goals: try to predict the tipping points (i.e. the sudden shifts orphase transitions in such a complex system),
Build indicators based on the topology of the network, in particularstudy patterns of information di§usion based on short term dynamics.
Methodology: Compute time-varying total clustering coe¢cients(Faggiolo, 2007) are used, based on six-month rolling windows.
H. Gatfaoui (IESEG/ Université Paris1 Panthéon-Sorbonne/ University Ca’ Foscari)Flickering Clusters February 2016 15 / 20

Early warning indicators: Findings I
Before each phase transition, the system flickers in informationtransmission, or becomes noisy.
Flickering as an early warning signal has been reported in complexsystems by Dakos et al., (2013) or Livina et al., (2010).
Dakos et al. (2013): Possibility to observe flickering between basinsof attraction a long time before bifurcation points.
To our knowledge, this is the first time that flickering clusters ininformation di§usion is studied, exhibited and described in financialsystems.
Global Financial Crisis: High clustering at the beginning and the endof the period.
Clustering pattern allows to time the di§erent periods (i.e.information extracted from the dynamic network’s topology).
H. Gatfaoui (IESEG/ Université Paris1 Panthéon-Sorbonne/ University Ca’ Foscari)Flickering Clusters February 2016 16 / 20
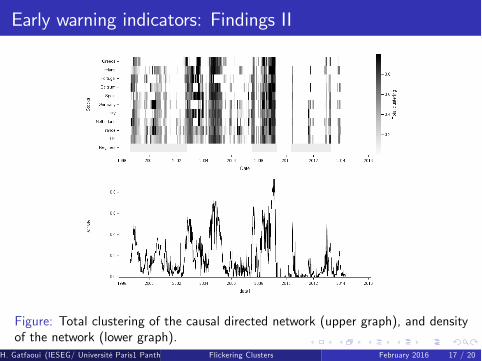
Early warning indicators: Findings II
Figure: Total clustering of the causal directed network (upper graph), and densityof the network (lower graph).
H. Gatfaoui (IESEG/ Université Paris1 Panthéon-Sorbonne/ University Ca’ Foscari)Flickering Clusters February 2016 17 / 20
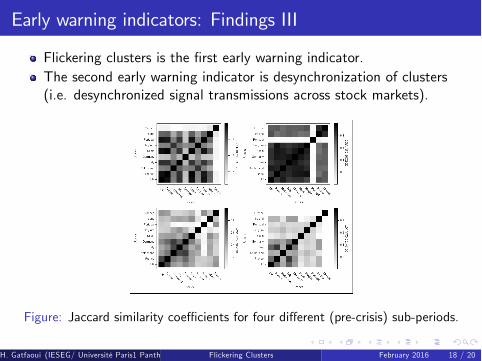
Early warning indicators: Findings III
Flickering clusters is the first early warning indicator.The second early warning indicator is desynchronization of clusters(i.e. desynchronized signal transmissions across stock markets).
Figure: Jaccard similarity coe¢cients for four di§erent (pre-crisis) sub-periods.
H. Gatfaoui (IESEG/ Université Paris1 Panthéon-Sorbonne/ University Ca’ Foscari)Flickering Clusters February 2016 18 / 20
Conclusion
We build a causal dynamics network of stock market places within theEuro zone.
We show the instability of the network over time.
We extract the informational content of flickering clusters anddesynchronization concerning phase transitions.
Instead of investigating potential increases in degrees over time,flickering features should rather be considered as a more reliableinformation.
Despite its apparent simplicity, Granger non-causality can capturesome types of nonlinear relationships such as fire-and-integrateneurons (Zhou et al., 2014).
H. Gatfaoui (IESEG/ Université Paris1 Panthéon-Sorbonne/ University Ca’ Foscari)Flickering Clusters February 2016 19 / 20

This project has received funding from the European Union’s
Seventh Framework Programme for research, technological
development and demonstration under grant agreement n° 320270
www.syrtoproject.eu
This document reflects only the author’s views.
The European Union is not liable for any use that may be made of the information contained therein.


![Bayesian Causal Inference - uni-muenchen.de...from causal inference have been attracting much interest recently. [HHH18] propose that causal [HHH18] propose that causal inference stands](https://static.fdocuments.us/doc/165x107/5ec457b21b32702dbe2c9d4c/bayesian-causal-inference-uni-from-causal-inference-have-been-attracting.jpg)