Clustering in community structure across replicate ...
8
ARTICLE Received 12 Apr 2014 | Accepted 10 Jul 2014 | Published 8 Aug 2014 Clustering in community structure across replicate ecosystems following a long-term bacterial evolution experiment Hasan Celiker 1 & Jeff Gore 2 Experiments to date probing adaptive evolution have predominantly focused on studying a single species or a pair of species in isolation. In nature, on the other hand, species evolve within complex communities, interacting and competing with many other species. It is unclear how reproducible or predictable adaptive evolution is within the context of a multi- species ecosystem. To explore this problem, we let 96 replicates of a multispecies laboratory bacterial ecosystem evolve in parallel for hundreds of generations. Here we find that relative abundances of individual species vary greatly across the evolved ecosystems and that the final profile of species frequencies within replicates clusters into several distinct types, as opposed to being randomly dispersed across the frequency space or converging fully. Our results suggest that community structure evolution has a tendency to follow one of only a few distinct paths. DOI: 10.1038/ncomms5643 1 Electrical Engineering and Computer Science Department, MIT, 400 Technology Square, NE46-625, Cambridge, Massachusetts 02139, USA. 2 Physics Department, MIT, 400 Technology Square, NE46-609, Cambridge, Massachusetts 02139, USA. Correspondence and requests for materials should be addressed to J.G. (email: [email protected]). NATURE COMMUNICATIONS | 5:4643 | DOI: 10.1038/ncomms5643 | www.nature.com/naturecommunications 1 & 2014 Macmillan Publishers Limited. All rights reserved.
Transcript of Clustering in community structure across replicate ...
ARTICLE
Received 12 Apr 2014 | Accepted 10 Jul 2014 | Published 8 Aug 2014
Clustering in community structure acrossreplicate ecosystems following a long-termbacterial evolution experimentHasan Celiker1 & Jeff Gore2
Experiments to date probing adaptive evolution have predominantly focused on studying a
single species or a pair of species in isolation. In nature, on the other hand, species evolve
within complex communities, interacting and competing with many other species. It is
unclear how reproducible or predictable adaptive evolution is within the context of a multi-
species ecosystem. To explore this problem, we let 96 replicates of a multispecies laboratory
bacterial ecosystem evolve in parallel for hundreds of generations. Here we find that relative
abundances of individual species vary greatly across the evolved ecosystems and that the
final profile of species frequencies within replicates clusters into several distinct types, as
opposed to being randomly dispersed across the frequency space or converging fully. Our
results suggest that community structure evolution has a tendency to follow one of only a few
distinct paths.
DOI: 10.1038/ncomms5643
1 Electrical Engineering and Computer Science Department, MIT, 400 Technology Square, NE46-625, Cambridge, Massachusetts 02139, USA. 2 PhysicsDepartment, MIT, 400 Technology Square, NE46-609, Cambridge, Massachusetts 02139, USA. Correspondence and requests for materials should beaddressed to J.G. (email: [email protected]).
NATURE COMMUNICATIONS | 5:4643 | DOI: 10.1038/ncomms5643 | www.nature.com/naturecommunications 1
& 2014 Macmillan Publishers Limited. All rights reserved.
Although research is abound focusing on the adaptiveevolution of a single species or a pair of interactingspecies, the problem of how evolutionary processes shape
a complex natural ecosystem has received less attention1. Giventhe initial biotic and abiotic components of an ecosystem, it is notobvious whether we can ever predict the future communitystructure and species distribution for that ecosystem2. Resolvingthis challenging problem about community evolution is notonly important from an intellectual standpoint, but also hasimplications for our ability to forecast the evolutionary responsesof ecosystems to recent anthropogenic pressures3.
Traditionally, research has pointed to character displacement,whereby co-occurring similar species diverge in their adaptations,and co-evolution as mechanisms to explain and predictadaptation in simple communities2. However, recent theory andexperiments suggest that such predictions from niche occupancypatterns or pairwise species interactions often fail to predictadaptive evolution in more complex ecosystems composed ofmore than two species4,5. For instance, a recent experimentalstudy with microbes found that community complexity cangreatly alter adaptive evolution in a way that is not obvious fromsingle-species evolution6. Diffuse co-evolution studies have alsofound evidence that co-evolution of a focal pair of interactingspecies can be influenced by the presence of other species5,7.
All of these and similar studies mainly strive to elucidatedeterministic mechanisms for multispecies adaptive evolution.However, we may also ask, to what degree is there randomness inthe path that a multispecies ecosystem follows through adaptiveevolution? If we could replay the evolution in a closed communitymany times starting from the same initial state, would we alwaysend up in the same final state with the same abundances andkinds of species? Or would we get a different result each time?Recent theoretical and empirical studies using a single speciessuggest that adaptive diversification can be a surprisingly
deterministic evolutionary process8,9. However, how this relatesto multispecies adaptive evolution is less clear2.
To address this problem, here we present experiments probingthe adaptive evolution of a multispecies model community. Wefound evidence that the adaptive evolution of this experimentalcommunity is not deterministic, yet at the same time is notcompletely random. Our model community consisted of six soilbacteria species spanning three different genera: Enterobacteraerogenes (EA), Serratia marcescens (SM), Pseudomonas fluor-escens (PF), Pseudomonas aurantiaca (PA), Pseudomonas veronii(PV) and Pseudomonas putida (PP). We let this communityevolve in a complex environment containing dozens of carbonsources that can be found in soil (see Methods)10. We chose thespecies on the criteria that they could grow together in our mediawithout aggressively antagonizing each other via either predationor expression of antimicrobial compounds. The carbon utilizationprofiles for these species were not completely overlapping, butalso not fully orthogonal (Supplementary Fig. 1). Compared withnatural ecosystems with complex trophic levels and numeroustypes of species interactions, our model ecosystem is a simple one,where we expect most of the interactions between species to bedriven by competition for resources11.
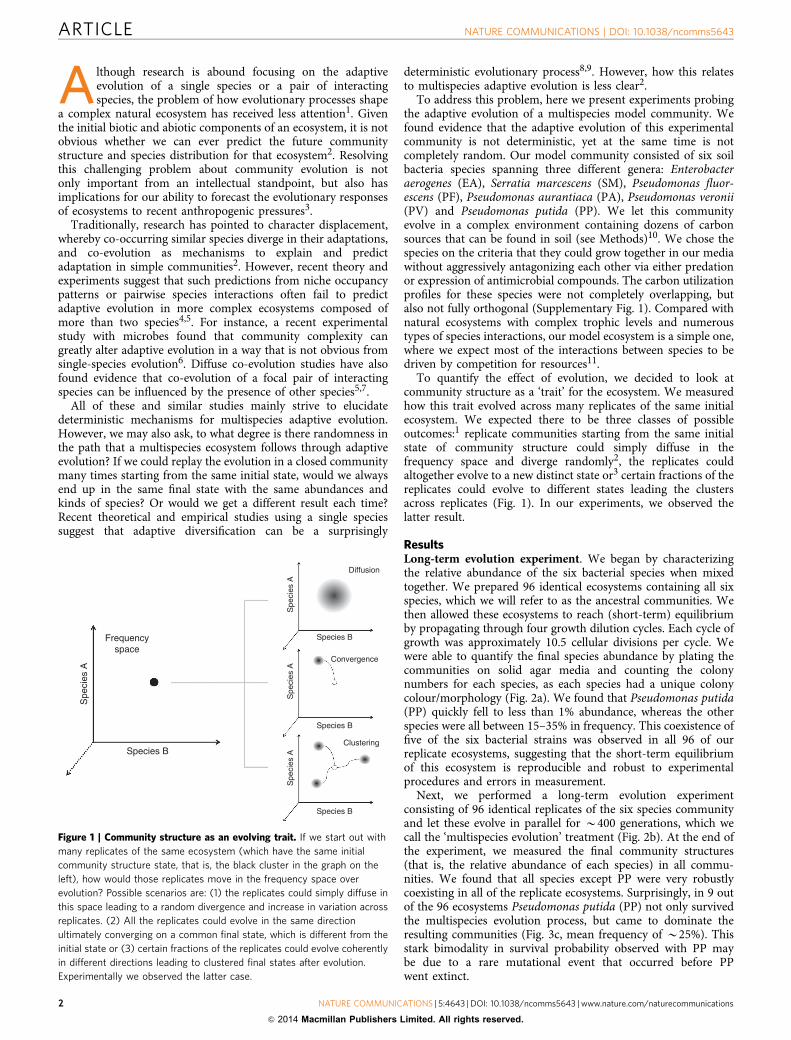
To quantify the effect of evolution, we decided to look atcommunity structure as a ‘trait’ for the ecosystem. We measuredhow this trait evolved across many replicates of the same initialecosystem. We expected there to be three classes of possibleoutcomes:1 replicate communities starting from the same initialstate of community structure could simply diffuse in thefrequency space and diverge randomly2, the replicates couldaltogether evolve to a new distinct state or3 certain fractions of thereplicates could evolve to different states leading the clustersacross replicates (Fig. 1). In our experiments, we observed thelatter result.
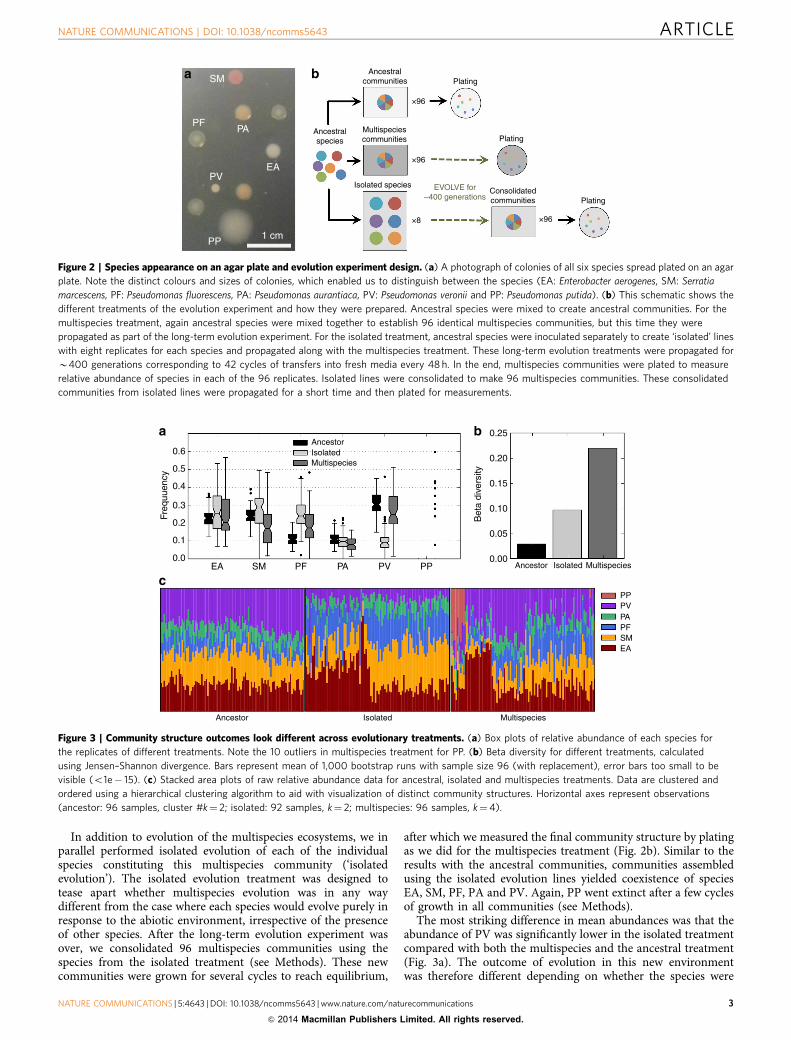
ResultsLong-term evolution experiment. We began by characterizingthe relative abundance of the six bacterial species when mixedtogether. We prepared 96 identical ecosystems containing all sixspecies, which we will refer to as the ancestral communities. Wethen allowed these ecosystems to reach (short-term) equilibriumby propagating through four growth dilution cycles. Each cycle ofgrowth was approximately 10.5 cellular divisions per cycle. Wewere able to quantify the final species abundance by plating thecommunities on solid agar media and counting the colonynumbers for each species, as each species had a unique colonycolour/morphology (Fig. 2a). We found that Pseudomonas putida(PP) quickly fell to less than 1% abundance, whereas the otherspecies were all between 15–35% in frequency. This coexistence offive of the six bacterial strains was observed in all 96 of ourreplicate ecosystems, suggesting that the short-term equilibriumof this ecosystem is reproducible and robust to experimentalprocedures and errors in measurement.
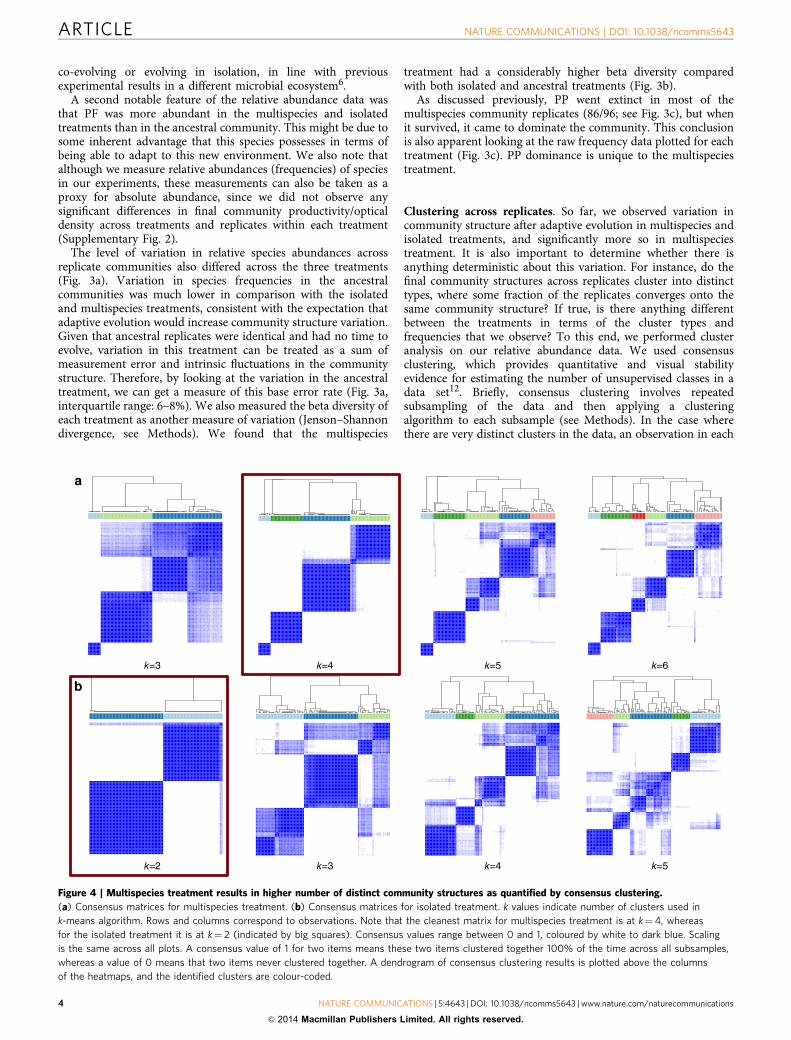
Next, we performed a long-term evolution experimentconsisting of 96 identical replicates of the six species communityand let these evolve in parallel for B400 generations, which wecall the ‘multispecies evolution’ treatment (Fig. 2b). At the end ofthe experiment, we measured the final community structures(that is, the relative abundance of each species) in all commu-nities. We found that all species except PP were very robustlycoexisting in all of the replicate ecosystems. Surprisingly, in 9 outof the 96 ecosystems Pseudomonas putida (PP) not only survivedthe multispecies evolution process, but came to dominate theresulting communities (Fig. 3c, mean frequency of B25%). Thisstark bimodality in survival probability observed with PP maybe due to a rare mutational event that occurred before PPwent extinct.
Frequencyspace
Diffusion
Convergence
Clustering
Species B
Species B
Species B
Spe
cies
AS
peci
es A
Spe
cies
A
Spe
cies
A
Species B
Figure 1 | Community structure as an evolving trait. If we start out with
many replicates of the same ecosystem (which have the same initial
community structure state, that is, the black cluster in the graph on the
left), how would those replicates move in the frequency space over
evolution? Possible scenarios are: (1) the replicates could simply diffuse in
this space leading to a random divergence and increase in variation across
replicates. (2) All the replicates could evolve in the same direction
ultimately converging on a common final state, which is different from the
initial state or (3) certain fractions of the replicates could evolve coherently
in different directions leading to clustered final states after evolution.
Experimentally we observed the latter case.
ARTICLE NATURE COMMUNICATIONS | DOI: 10.1038/ncomms5643
2 NATURE COMMUNICATIONS | 5:4643 | DOI: 10.1038/ncomms5643 | www.nature.com/naturecommunications
& 2014 Macmillan Publishers Limited. All rights reserved.
In addition to evolution of the multispecies ecosystems, we inparallel performed isolated evolution of each of the individualspecies constituting this multispecies community (‘isolatedevolution’). The isolated evolution treatment was designed totease apart whether multispecies evolution was in any waydifferent from the case where each species would evolve purely inresponse to the abiotic environment, irrespective of the presenceof other species. After the long-term evolution experiment wasover, we consolidated 96 multispecies communities using thespecies from the isolated treatment (see Methods). These newcommunities were grown for several cycles to reach equilibrium,
after which we measured the final community structure by platingas we did for the multispecies treatment (Fig. 2b). Similar to theresults with the ancestral communities, communities assembledusing the isolated evolution lines yielded coexistence of speciesEA, SM, PF, PA and PV. Again, PP went extinct after a few cyclesof growth in all communities (see Methods).
The most striking difference in mean abundances was that theabundance of PV was significantly lower in the isolated treatmentcompared with both the multispecies and the ancestral treatment(Fig. 3a). The outcome of evolution in this new environmentwas therefore different depending on whether the species were
SM
PFPA
PVEA
Ancestralcommunities
Multispeciescommunities
Plating
Plating
PlatingConsolidatedcommunities
EVOLVE for~400 generations
Ancestralspecies
Isolated species
×8
×96
×96
×96
PP1 cm
Figure 2 | Species appearance on an agar plate and evolution experiment design. (a) A photograph of colonies of all six species spread plated on an agar
plate. Note the distinct colours and sizes of colonies, which enabled us to distinguish between the species (EA: Enterobacter aerogenes, SM: Serratia
marcescens, PF: Pseudomonas fluorescens, PA: Pseudomonas aurantiaca, PV: Pseudomonas veronii and PP: Pseudomonas putida). (b) This schematic shows the
different treatments of the evolution experiment and how they were prepared. Ancestral species were mixed to create ancestral communities. For the
multispecies treatment, again ancestral species were mixed together to establish 96 identical multispecies communities, but this time they were
propagated as part of the long-term evolution experiment. For the isolated treatment, ancestral species were inoculated separately to create ‘isolated’ lines
with eight replicates for each species and propagated along with the multispecies treatment. These long-term evolution treatments were propagated for
B400 generations corresponding to 42 cycles of transfers into fresh media every 48 h. In the end, multispecies communities were plated to measure
relative abundance of species in each of the 96 replicates. Isolated lines were consolidated to make 96 multispecies communities. These consolidated
communities from isolated lines were propagated for a short time and then plated for measurements.
0.25
0.20
0.15
0.10
0.05
0.00
PPPVPAPFSMEA
Ancestor Isolated Multispecies
Bet
a di
vers
ity
AncestorIsolatedMultispecies
Freq
uuen
cy
0.6
0.5
0.4
0.3
0.2
0.1
0.0
Ancestor Isolated Multispecies
EA SM PF PA PV PP
Figure 3 | Community structure outcomes look different across evolutionary treatments. (a) Box plots of relative abundance of each species for
the replicates of different treatments. Note the 10 outliers in multispecies treatment for PP. (b) Beta diversity for different treatments, calculated
using Jensen–Shannon divergence. Bars represent mean of 1,000 bootstrap runs with sample size 96 (with replacement), error bars too small to be
visible (o1e� 15). (c) Stacked area plots of raw relative abundance data for ancestral, isolated and multispecies treatments. Data are clustered and
ordered using a hierarchical clustering algorithm to aid with visualization of distinct community structures. Horizontal axes represent observations
(ancestor: 96 samples, cluster #k¼ 2; isolated: 92 samples, k¼ 2; multispecies: 96 samples, k¼4).
NATURE COMMUNICATIONS | DOI: 10.1038/ncomms5643 ARTICLE
NATURE COMMUNICATIONS | 5:4643 | DOI: 10.1038/ncomms5643 | www.nature.com/naturecommunications 3
& 2014 Macmillan Publishers Limited. All rights reserved.
co-evolving or evolving in isolation, in line with previousexperimental results in a different microbial ecosystem6.
A second notable feature of the relative abundance data wasthat PF was more abundant in the multispecies and isolatedtreatments than in the ancestral community. This might be due tosome inherent advantage that this species possesses in terms ofbeing able to adapt to this new environment. We also note thatalthough we measure relative abundances (frequencies) of speciesin our experiments, these measurements can also be taken as aproxy for absolute abundance, since we did not observe anysignificant differences in final community productivity/opticaldensity across treatments and replicates within each treatment(Supplementary Fig. 2).
The level of variation in relative species abundances acrossreplicate communities also differed across the three treatments(Fig. 3a). Variation in species frequencies in the ancestralcommunities was much lower in comparison with the isolatedand multispecies treatments, consistent with the expectation thatadaptive evolution would increase community structure variation.Given that ancestral replicates were identical and had no time toevolve, variation in this treatment can be treated as a sum ofmeasurement error and intrinsic fluctuations in the communitystructure. Therefore, by looking at the variation in the ancestraltreatment, we can get a measure of this base error rate (Fig. 3a,interquartile range: 6–8%). We also measured the beta diversity ofeach treatment as another measure of variation (Jenson–Shannondivergence, see Methods). We found that the multispecies
treatment had a considerably higher beta diversity comparedwith both isolated and ancestral treatments (Fig. 3b).
As discussed previously, PP went extinct in most of themultispecies community replicates (86/96; see Fig. 3c), but whenit survived, it came to dominate the community. This conclusionis also apparent looking at the raw frequency data plotted for eachtreatment (Fig. 3c). PP dominance is unique to the multispeciestreatment.
Clustering across replicates. So far, we observed variation incommunity structure after adaptive evolution in multispecies andisolated treatments, and significantly more so in multispeciestreatment. It is also important to determine whether there isanything deterministic about this variation. For instance, do thefinal community structures across replicates cluster into distincttypes, where some fraction of the replicates converges onto thesame community structure? If true, is there anything differentbetween the treatments in terms of the cluster types andfrequencies that we observe? To this end, we performed clusteranalysis on our relative abundance data. We used consensusclustering, which provides quantitative and visual stabilityevidence for estimating the number of unsupervised classes in adata set12. Briefly, consensus clustering involves repeatedsubsampling of the data and then applying a clusteringalgorithm to each subsample (see Methods). In the case wherethere are very distinct clusters in the data, an observation in each
k=3
a
b
k=4 k=5 k=6
k=3k=2 k=4 k=5
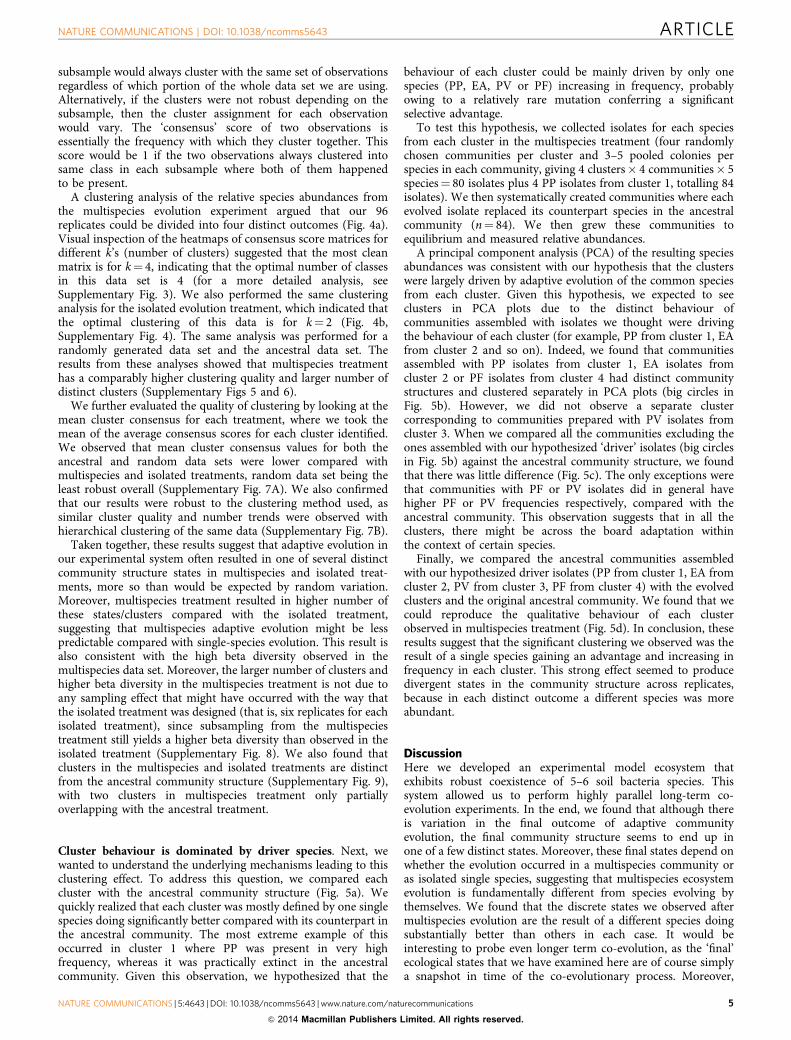
Figure 4 | Multispecies treatment results in higher number of distinct community structures as quantified by consensus clustering.
(a) Consensus matrices for multispecies treatment. (b) Consensus matrices for isolated treatment. k values indicate number of clusters used in
k-means algorithm. Rows and columns correspond to observations. Note that the cleanest matrix for multispecies treatment is at k¼4, whereas
for the isolated treatment it is at k¼ 2 (indicated by big squares). Consensus values range between 0 and 1, coloured by white to dark blue. Scaling
is the same across all plots. A consensus value of 1 for two items means these two items clustered together 100% of the time across all subsamples,
whereas a value of 0 means that two items never clustered together. A dendrogram of consensus clustering results is plotted above the columns
of the heatmaps, and the identified clusters are colour-coded.
ARTICLE NATURE COMMUNICATIONS | DOI: 10.1038/ncomms5643
4 NATURE COMMUNICATIONS | 5:4643 | DOI: 10.1038/ncomms5643 | www.nature.com/naturecommunications
& 2014 Macmillan Publishers Limited. All rights reserved.
subsample would always cluster with the same set of observationsregardless of which portion of the whole data set we are using.Alternatively, if the clusters were not robust depending on thesubsample, then the cluster assignment for each observationwould vary. The ‘consensus’ score of two observations isessentially the frequency with which they cluster together. Thisscore would be 1 if the two observations always clustered intosame class in each subsample where both of them happenedto be present.
A clustering analysis of the relative species abundances fromthe multispecies evolution experiment argued that our 96replicates could be divided into four distinct outcomes (Fig. 4a).Visual inspection of the heatmaps of consensus score matrices fordifferent k’s (number of clusters) suggested that the most cleanmatrix is for k¼ 4, indicating that the optimal number of classesin this data set is 4 (for a more detailed analysis, seeSupplementary Fig. 3). We also performed the same clusteringanalysis for the isolated evolution treatment, which indicated thatthe optimal clustering of this data is for k¼ 2 (Fig. 4b,Supplementary Fig. 4). The same analysis was performed for arandomly generated data set and the ancestral data set. Theresults from these analyses showed that multispecies treatmenthas a comparably higher clustering quality and larger number ofdistinct clusters (Supplementary Figs 5 and 6).
We further evaluated the quality of clustering by looking at themean cluster consensus for each treatment, where we took themean of the average consensus scores for each cluster identified.We observed that mean cluster consensus values for both theancestral and random data sets were lower compared withmultispecies and isolated treatments, random data set being theleast robust overall (Supplementary Fig. 7A). We also confirmedthat our results were robust to the clustering method used, assimilar cluster quality and number trends were observed withhierarchical clustering of the same data (Supplementary Fig. 7B).
Taken together, these results suggest that adaptive evolution inour experimental system often resulted in one of several distinctcommunity structure states in multispecies and isolated treat-ments, more so than would be expected by random variation.Moreover, multispecies treatment resulted in higher number ofthese states/clusters compared with the isolated treatment,suggesting that multispecies adaptive evolution might be lesspredictable compared with single-species evolution. This result isalso consistent with the high beta diversity observed in themultispecies data set. Moreover, the larger number of clusters andhigher beta diversity in the multispecies treatment is not due toany sampling effect that might have occurred with the way thatthe isolated treatment was designed (that is, six replicates for eachisolated treatment), since subsampling from the multispeciestreatment still yields a higher beta diversity than observed in theisolated treatment (Supplementary Fig. 8). We also found thatclusters in the multispecies and isolated treatments are distinctfrom the ancestral community structure (Supplementary Fig. 9),with two clusters in multispecies treatment only partiallyoverlapping with the ancestral treatment.
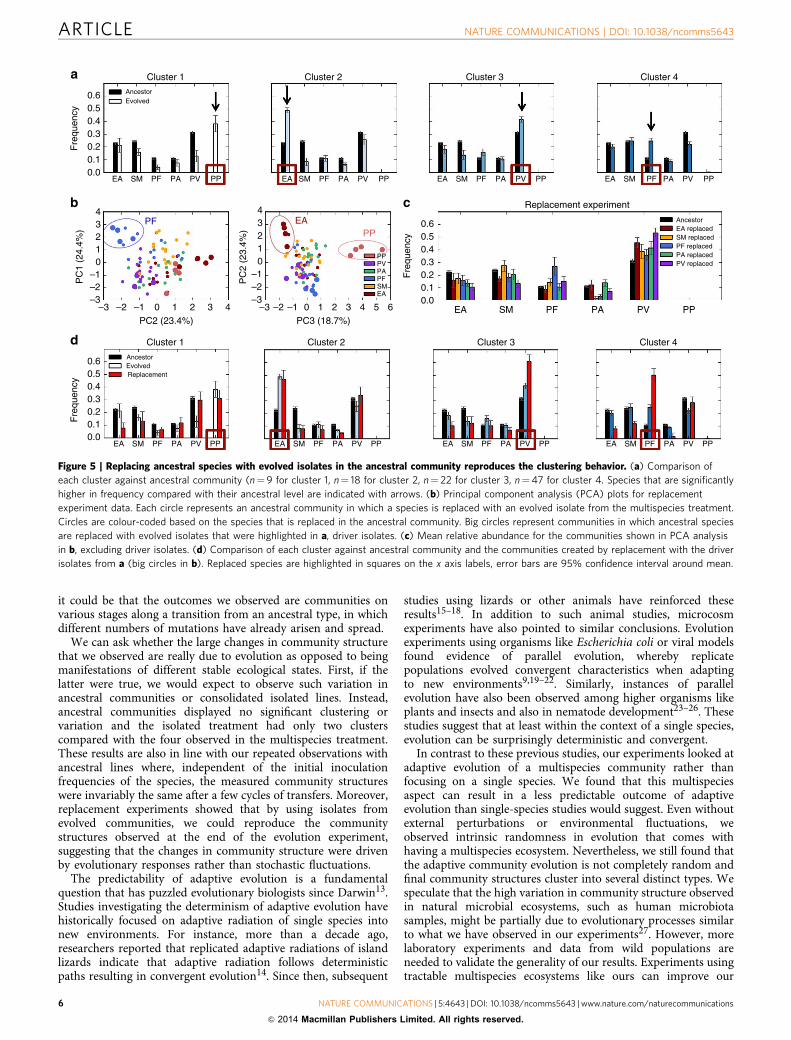
Cluster behaviour is dominated by driver species. Next, wewanted to understand the underlying mechanisms leading to thisclustering effect. To address this question, we compared eachcluster with the ancestral community structure (Fig. 5a). Wequickly realized that each cluster was mostly defined by one singlespecies doing significantly better compared with its counterpart inthe ancestral community. The most extreme example of thisoccurred in cluster 1 where PP was present in very highfrequency, whereas it was practically extinct in the ancestralcommunity. Given this observation, we hypothesized that the
behaviour of each cluster could be mainly driven by only onespecies (PP, EA, PV or PF) increasing in frequency, probablyowing to a relatively rare mutation conferring a significantselective advantage.
To test this hypothesis, we collected isolates for each speciesfrom each cluster in the multispecies treatment (four randomlychosen communities per cluster and 3–5 pooled colonies perspecies in each community, giving 4 clusters� 4 communities� 5species¼ 80 isolates plus 4 PP isolates from cluster 1, totalling 84isolates). We then systematically created communities where eachevolved isolate replaced its counterpart species in the ancestralcommunity (n¼ 84). We then grew these communities toequilibrium and measured relative abundances.
A principal component analysis (PCA) of the resulting speciesabundances was consistent with our hypothesis that the clusterswere largely driven by adaptive evolution of the common speciesfrom each cluster. Given this hypothesis, we expected to seeclusters in PCA plots due to the distinct behaviour ofcommunities assembled with isolates we thought were drivingthe behaviour of each cluster (for example, PP from cluster 1, EAfrom cluster 2 and so on). Indeed, we found that communitiesassembled with PP isolates from cluster 1, EA isolates fromcluster 2 or PF isolates from cluster 4 had distinct communitystructures and clustered separately in PCA plots (big circles inFig. 5b). However, we did not observe a separate clustercorresponding to communities prepared with PV isolates fromcluster 3. When we compared all the communities excluding theones assembled with our hypothesized ‘driver’ isolates (big circlesin Fig. 5b) against the ancestral community structure, we foundthat there was little difference (Fig. 5c). The only exceptions werethat communities with PF or PV isolates did in general havehigher PF or PV frequencies respectively, compared with theancestral community. This observation suggests that in all theclusters, there might be across the board adaptation withinthe context of certain species.
Finally, we compared the ancestral communities assembledwith our hypothesized driver isolates (PP from cluster 1, EA fromcluster 2, PV from cluster 3, PF from cluster 4) with the evolvedclusters and the original ancestral community. We found that wecould reproduce the qualitative behaviour of each clusterobserved in multispecies treatment (Fig. 5d). In conclusion, theseresults suggest that the significant clustering we observed was theresult of a single species gaining an advantage and increasing infrequency in each cluster. This strong effect seemed to producedivergent states in the community structure across replicates,because in each distinct outcome a different species was moreabundant.
DiscussionHere we developed an experimental model ecosystem thatexhibits robust coexistence of 5–6 soil bacteria species. Thissystem allowed us to perform highly parallel long-term co-evolution experiments. In the end, we found that although thereis variation in the final outcome of adaptive communityevolution, the final community structure seems to end up inone of a few distinct states. Moreover, these final states depend onwhether the evolution occurred in a multispecies community oras isolated single species, suggesting that multispecies ecosystemevolution is fundamentally different from species evolving bythemselves. We found that the discrete states we observed aftermultispecies evolution are the result of a different species doingsubstantially better than others in each case. It would beinteresting to probe even longer term co-evolution, as the ‘final’ecological states that we have examined here are of course simplya snapshot in time of the co-evolutionary process. Moreover,
NATURE COMMUNICATIONS | DOI: 10.1038/ncomms5643 ARTICLE
NATURE COMMUNICATIONS | 5:4643 | DOI: 10.1038/ncomms5643 | www.nature.com/naturecommunications 5
& 2014 Macmillan Publishers Limited. All rights reserved.
it could be that the outcomes we observed are communities onvarious stages along a transition from an ancestral type, in whichdifferent numbers of mutations have already arisen and spread.
We can ask whether the large changes in community structurethat we observed are really due to evolution as opposed to beingmanifestations of different stable ecological states. First, if thelatter were true, we would expect to observe such variation inancestral communities or consolidated isolated lines. Instead,ancestral communities displayed no significant clustering orvariation and the isolated treatment had only two clusterscompared with the four observed in the multispecies treatment.These results are also in line with our repeated observations withancestral lines where, independent of the initial inoculationfrequencies of the species, the measured community structureswere invariably the same after a few cycles of transfers. Moreover,replacement experiments showed that by using isolates fromevolved communities, we could reproduce the communitystructures observed at the end of the evolution experiment,suggesting that the changes in community structure were drivenby evolutionary responses rather than stochastic fluctuations.
The predictability of adaptive evolution is a fundamentalquestion that has puzzled evolutionary biologists since Darwin13.Studies investigating the determinism of adaptive evolution havehistorically focused on adaptive radiation of single species intonew environments. For instance, more than a decade ago,researchers reported that replicated adaptive radiations of islandlizards indicate that adaptive radiation follows deterministicpaths resulting in convergent evolution14. Since then, subsequent
studies using lizards or other animals have reinforced theseresults15–18. In addition to such animal studies, microcosmexperiments have also pointed to similar conclusions. Evolutionexperiments using organisms like Escherichia coli or viral modelsfound evidence of parallel evolution, whereby replicatepopulations evolved convergent characteristics when adaptingto new environments9,19–22. Similarly, instances of parallelevolution have also been observed among higher organisms likeplants and insects and also in nematode development23–26. Thesestudies suggest that at least within the context of a single species,evolution can be surprisingly deterministic and convergent.
In contrast to these previous studies, our experiments looked atadaptive evolution of a multispecies community rather thanfocusing on a single species. We found that this multispeciesaspect can result in a less predictable outcome of adaptiveevolution than single-species studies would suggest. Even withoutexternal perturbations or environmental fluctuations, weobserved intrinsic randomness in evolution that comes withhaving a multispecies ecosystem. Nevertheless, we still found thatthe adaptive community evolution is not completely random andfinal community structures cluster into several distinct types. Wespeculate that the high variation in community structure observedin natural microbial ecosystems, such as human microbiotasamples, might be partially due to evolutionary processes similarto what we have observed in our experiments27. However, morelaboratory experiments and data from wild populations areneeded to validate the generality of our results. Experiments usingtractable multispecies ecosystems like ours can improve our
0.60.50.40.30.2F
requ
ency
0.10.0
4
4
3
3
2
2
1
1
0
PC
1 (2
4.4%
)
0PC2 (23.4%)
Cluster 1
AncestorEvolvedReplacement
–1
–1
–2
–2–3
0.60.50.40.3
Fre
quen
cy
0.20.10.0
–3
PF4
4 5 6
EASMPFPAPVPP
3
3
2
2
1
1
0
PC
2 (2
3.4%
)
0PC3 (18.7%)
–1
–1
–2
–2–3
–3
Ancestor
Cluster 1a
b
d
c
Evolved
EA SM PF PA PV PP
EAPP
EA SM PF PA PV PP
Cluster 2
EA SM PF PA PV PP
EA SM PF PA PV PP
Cluster 3
EA SM PF PA PV PP
Cluster 4
EA SM PF PA PV PP
Cluster 2
EA SM PF PA PV PP
Cluster 3
EA SM PF PA PV PP
Cluster 4
EA0.00.10.20.30.4
Fre
quen
cy 0.50.6
SM PF PA
Replacement experiment
AncestorEA replacedSM replacedPF replacedPA replacedPV replaced
PV PP
Figure 5 | Replacing ancestral species with evolved isolates in the ancestral community reproduces the clustering behavior. (a) Comparison of
each cluster against ancestral community (n¼9 for cluster 1, n¼ 18 for cluster 2, n¼ 22 for cluster 3, n¼47 for cluster 4. Species that are significantly
higher in frequency compared with their ancestral level are indicated with arrows. (b) Principal component analysis (PCA) plots for replacement
experiment data. Each circle represents an ancestral community in which a species is replaced with an evolved isolate from the multispecies treatment.
Circles are colour-coded based on the species that is replaced in the ancestral community. Big circles represent communities in which ancestral species
are replaced with evolved isolates that were highlighted in a, driver isolates. (c) Mean relative abundance for the communities shown in PCA analysis
in b, excluding driver isolates. (d) Comparison of each cluster against ancestral community and the communities created by replacement with the driver
isolates from a (big circles in b). Replaced species are highlighted in squares on the x axis labels, error bars are 95% confidence interval around mean.
ARTICLE NATURE COMMUNICATIONS | DOI: 10.1038/ncomms5643
6 NATURE COMMUNICATIONS | 5:4643 | DOI: 10.1038/ncomms5643 | www.nature.com/naturecommunications
& 2014 Macmillan Publishers Limited. All rights reserved.
understanding of the predictability of community structureevolution.
MethodsSpecies and media. The six soil bacteria species we used were Enterobacteraerogenes (ATCC#13048), Serratia marcescens (ATCC#13880), Pseudomonasfluorescens (ATCC#13525), Pseudomonas aurantiaca (ATCC#33663), Pseudomo-nas veronii (ATCC#700474) and Pseudomonas putida (ATCC#12633), and they allwere obtained from ATCC. The growth media was prepared using commerciallyavailable BIOLOG EcoPlates. These microplates contain 31 different carbonsources useful for soil community analysis. In addition to these carbon sources, ineach well there is a tetrazolium dye (5 cyano-2,3 ditolyl tetrazolium chloride),which is reduced to a violet-fluorescent formazan molecule, when the carbonsource is oxidized by the cells. The colour development was measured by lightabsorption at 590 nm, which quantified the productivity of cultures. At the sametime, the optical density of the cultures was measured at 750 nm, where thetetrazolium dye is not absorbent. Our base media was M9 minimal media, whichcontained 1X M9 salts (Sigma Aldrich), 2 mM MgSO4, 0.1 mM CaCl2, 1X tracemetals (Teknova). We filled the EcoPlate by adding 140ml of this base media intoeach well and let the lyophilized carbon sources dissolve for 30 min. Then, wemixed all the contents of the wells (except the blanks) to get a complex mediumcontaining all of the 31 carbon sources. For initial inoculation and growth of thespecies before experiments, we used nutrient broth (0.3% yeast extract, 0.5%peptone). We used nutrient agar plates (nutrient brothþ 1.5% agar) to countcolonies and measure the relative abundances of species. All experiments weredone at 24 �C.
Evolution experiment. From frozen stocks of ancestral lines, we directlyinoculated each species separately into nutrient broth and let them grow for 48 h inloose-cap culture tubes without shaking. Next, we inoculated the grown culturesinto our base media and again let the species grow separately for two cycles oftransfers (48 h each). We diluted these by 1/100 into M9 minimal media (w/ocarbon sources) then added 10 ml of this mixture onto 140 ml of our base mediacorresponding to 1/1,500 dilution in total. These cultures were inoculated intoflat-bottom 96-well plates, every well of the microplate contained 150 ml of mediaplus cells. For each transfer, we diluted cultures by 1/1,500 into freshly preparedmedia. After this initial period of growth, we made frozen stocks of these cultures,and at the same time we initiated the two treatments of the long-term evolutionexperiment1: for the multispecies treatment, we diluted each of the individualspecies by 1/100 and then mixed them by equal volume. After this, we diluted thatmixture by 1/15 into freshly prepared base media and then used this final mixtureto inoculate the wells. We had 96 replicates for this treatment, and these replicateswere spread over two 96-well plates using a checkerboard pattern to mitigate risk ofcross-contamination2. For the isolated treatment, we diluted those same culturesfor the individual species by 1/1,500 and had eight replicates for each speciesadding up to 48 cultures in total for six species. These were also spread over a96-well plate in a checkerboard pattern. Throughout the course of the evolutionexperiment, every 48 h, cultures in both treatments were diluted by 1/1,500 intomedia that were freshly prepared just before the experiment. The cultures wereincubated without orbital shaking.
Measurements after the evolution experiment. After 42 cycles of transfers,we measured the relative abundances in the multispecies treatment by plating onnutrient agar plates. For each replicate, we diluted the final cultures by 1/106 inphosphate-buffered saline, and plated 75 ml of this solution onto an agar plate.We plated each replicate twice, as during preliminary experiments, we found thatthere was large variation in the total number of colonies that showed up on plates.After 48 h, we counted all the colonies on two plates together to measure therelative species abundances. For each replicate at least B90 colonies were counted.We confirmed evolved species identities for at least 20 communities by checkingcarbon utilization profile of each species isolate on Biolog Ecoplates. We also platedall 48 cultures in the isolated evolution treatment to check for possible con-tamination. We found that two replicates of one of the species (PA) had nocolonies on agar plates possibly due to external contamination. We discarded thesereplicates and used the remaining ones. We also made frozen stocks for all of thesefinal cultures.
To prepare the consolidated communities for the isolated treatment, werandomly chose six of the eight replicates for each species. We chose six to balanceout the fact that we had only six viable replicates for one of the species (PA). Next,after inoculation into base media from frozen cultures and growth for two cycles,we randomly chose a replicate from the six replicates for each species and mixedthem equally by volume, then repeated this process for 96 times to get 96 randomlyconsolidated communities using the species from the isolated evolution. We dilutedthese communities by 1/1,500 into fresh media and let them grow for four cycles oftransfers, after which we plated them and measured the relative species abundancesas we have done for the multispecies treatment. We found that four of thesecultures had no growth in the end, so we used the remaining 92 for ourmeasurements. We got visible PP survival only in three of the communities but invery low abundance (B1%, one colony in B100). To see if this was due to the
initial mixing ratios we had used, we repeated consolidation again using the sameprocedure of random mixing but this time instead of using 1/6 of volume for PP,we used a proportionately excess amount of 1/4 in volume while the other speciesequally occupied the other 3/4. After four cycles of growth, PP was visible only insix communities but was still less than 3% in frequency. We decided to use theinitial data set where we had initially mixed all the species by equal volume, as therewas no appreciable effect of increasing the initial frequency of PP. For preparingthe ancestral communities, we revived the frozen stocks of ancestral species thatwere stored during the initiation of the evolution experiment and let them grow inbase media for two cycles then mixed them by equal volume, and created96 replicate communities. After four cycles of transfers of these communities, weplated them and measured relative species abundances. PP colonies were found infour communities, but we could count only one or two colonies per plating in all ofthese cases. We did not observe any significant difference in community structurewith or without PP, either for ancestral communities or for the communitiescreated using isolated lines. Therefore, for our analyses with the ancestral andisolated treatments, we assume that PP is essentially extinct and exclude PP data,also taking into account that these low-frequency measurements could be falsepositives. We also note that our measurement resolution was not sufficient enoughto measure frequencies lower than B1%, but PP could still be surviving in lowerfrequencies in these experiments albeit not detectable by our measurements. InFig. 3, Jensen–Shannon divergence is Hð
Pi Ci�
Pi HðCiÞ where H is Shannon
entropy and Ci is the community structure of ith replicate.
Cluster analysis. For consensus clustering, we used k-means clustering algorithmwith Pearson distance. In total, 80% of the data were subsampled withoutreplacement for a total of 100 iterations. This process was repeated for eachk (number of clusters) and the results from these were used to create consensusmatrices and calculate mean consensus values for each class and each observationin the data set. Items or clusters were not weighted in the subsamples.We generated a random data set by creating 96 artificial observations, where eachobservation contained five frequency variables, as in our actual relative abundancedata sets. These frequency values were assigned by drawing from a uniform dis-tribution and then normalizing across each observation. Having six frequencyvariables instead of five did not change the results. Hierarchical clustering wasperformed using Euclidean distance and ‘ward’ linkage. Calinski–Harabasz index isa measure of the ratio of inter-cluster variation to within cluster variation, hencethe larger this number is the better the cluster separation and cluster compactness.These analyses were performed using R statistical language and open sourcepackages12,28.
Replacement experiments. At the end of the evolution experiment, we frozeall the communities as mentioned previously. To perform the replacementexperiments, for each identified cluster in the multispecies treatment, we inoculatedfour randomly selected communities into fresh media from the frozen stocks(4� 4¼ 16 communities). We propagated these cultures for four cycles of transfersusing the same scheme we had in the long-term evolution experiment. Then, weplated these 16 communities and picked 3–5 colonies per species from each plate.We pooled the picked colonies for a given species from a plated community andthen inoculated those into fresh media (five species per plate from clusters 2, 3, 4;and six species per plate from cluster 1, that is, 3 clusters� 4 communities� 5species¼ 60 isolates in total from clusters 2, 3, 4; plus 1 cluster� 4communities� 6 species¼ 24 isolates from cluster 4). We let these isolates grow fortwo cycles. For the replacement experiment, we mixed each isolate with its com-plementary ancestral species (which were also grown for two cycles in parallel withisolates). For instance, for an EA isolate, we mixed it with ancestral species SM, PF,PA, PV. We again let these newly prepared communities grow for four cycles oftransfers before we plated them to measure relative abundances.
References1. Johnson, M. T. J. & Stinchcombe, J. R. An emerging synthesis between
community ecology and evolutionary biology. Trends Ecol. Evol. 22, 250–257(2007).
2. Turcotte, M. M., Corrin, M. S. C. & Johnson, M. T. J. Adaptive evolution inecological communities. PLoS Biol. 10, e1001332 (2012).
3. Lavergne, S., Mouquet, N., Thuiller, W. & Ronce, O. Biodiversity and climatechange: integrating evolutionary and ecological responses of species andcommunities. Annu. Rev. Ecol. Evol. Syst. 41, 321–350 (2010).
4. De Mazancourt, C., Johnson, E. & Barraclough, T. G. Biodiversity inhibitsspecies’ evolutionary responses to changing environments. Ecol. Lett. 11,380–388 (2008).
5. Strauss, S. Y., Sahli, H. & Conner, J. K. Toward a more trait-centered approachto diffuse (co)evolution. New Phytol. 165, 81–89 (2005).
6. Lawrence, D. et al. Species interactions alter evolutionary responses to a novelenvironment. PLoS Biol. 10, e1001330 (2012).
7. Stinchcombe, J. R. & Rausher, M. D. Diffuse selection on resistance to deerherbivory in the ivyleaf morning glory, Ipomoea hederacea. Am. Nat. 158,376–388 (2001).
NATURE COMMUNICATIONS | DOI: 10.1038/ncomms5643 ARTICLE
NATURE COMMUNICATIONS | 5:4643 | DOI: 10.1038/ncomms5643 | www.nature.com/naturecommunications 7
& 2014 Macmillan Publishers Limited. All rights reserved.
8. Burbrink, F. T., Chen, X., Myers, E. A., Brandley, M. C. & Pyron, R. A. Evidencefor determinism in species diversification and contingency in phenotypicevolution during adaptive radiation. Proc. R. Soc. B Biol. Sci. (2012).
9. Herron, M. D. & Doebeli, M. Parallel evolutionary dynamics of adaptivediversification in Escherichia coli. PLoS Biol. 11, e1001490 (2013).
10. Gravel, D. et al. Experimental niche evolution alters the strength of thediversity–productivity relationship. Nature 469, 89–92 (2011).
11. Foster, K. R. & Bell, T. Competition, not cooperation, dominates interactionsamong culturable microbial species. Curr. Biol. 22, 1–6 (2012).
12. Monti, S., Tamayo, P., Mesirov, J. & Golub, T. Consensus clustering: aresampling-based method for class discovery and visualization of geneexpression microarray data. Mach. Learn. 52, 91–118 (2003).
13. Stern, D. L. & Orgogozo, V. Is genetic evolution predictable? Science 323,746–751 (2009).
14. Losos, J. B., Jackman, T. R., Larson, A., De Queiroz, K. & Rodriguez-Schettino,L. Contingency and determinism in replicated adaptive radiations of islandlizards. Science 279, 2115–2118 (1998).
15. Buckley, T. R., Attanayake, D. & Bradler, S. Extreme convergence in stick insectevolution: phylogenetic placement of the Lord Howe Island tree lobster. Proc.R. Soc. B Biol. Sci. 276, 1055–1062 (2009).
16. Poe, S., Goheen, J. R. & Hulebak, E. P. Convergent exaptation and adaptation insolitary island lizards. Proc. R. Soc. B Biol. Sci. 274, 2231–2237 (2007).
17. Reding, D. M., Foster, J. T., James, H. F., Pratt, H. D. & Fleischer, R. C.Convergent evolution of ‘creepers’ in the Hawaiian honeycreeper radiation.Biol. Lett. 5, 221–224 (2009).
18. Duponchelle, F., Paradis, E., Ribbink, A. J. & Turner, G. F. Parallel life historyevolution in mouthbrooding cichlids from the African Great Lakes. Proc. NatlAcad. Sci. USA 105, 15475–15480 (2008).
19. Cooper, T. F., Remold, S. K., Lenski, R. E. & Schneider, D. Expression profilesreveal parallel evolution of epistatic interactions involving the CRP regulon inEscherichia coli. PLoS Genet. 4, 10 (2008).
20. Bollback, J. P. & Huelsenbeck, J. P. Parallel genetic evolution within andbetween bacteriophage species of varying degrees of divergence. Genetics 181,225–234 (2009).
21. Meyer, J. R. et al. Repeatability and contingency in the evolution of a keyinnovation in phage lambda. Science 335, 428–432 (2012).
22. Wichman, H. A., Badgett, M. R., Scott, L. A., Boulianne, C. M. & Bull, J. J.Different trajectories of parallel evolution during viral adaptation. Science 285,422–424 (1999).
23. Shindo, C. et al. Role of FRIGIDA and FLOWERING LOCUS C in determiningvariation in flowering time of Arabidopsis. Plant Physiol. 138, 1163–1173(2005).
24. Ffrench-Constant, R. H., Pittendrigh, B., Vaughan, A. & Anthony, N. Why arethere so few resistance-associated mutations in insecticide target genes? Philos.Trans. R. Soc. Lond. B Biol. Sci. 353, 1685–1693 (1998).
25. Stern, D. L. & Orgogozo, V. The loci of evolution: how predictable is geneticevolution? Evolution 62, 2155–2177 (2008).
26. Kiontke, K. et al. Trends, stasis, and drift in the evolution of nematode vulvadevelopment. Curr. Biol. 17, 1925–1937 (2007).
27. Ravel, J. et al. Vaginal microbiome of reproductive-age women. Proc. NatlAcad. Sci. USA 108(Suppl), 4680–4687 (2011).
28. Wilkerson, M. D. & Hayes, D. N. ConsensusClusterPlus: a class discovery toolwith confidence assessments and item tracking. Bioinformatics 26, 1572–1573(2010).
AcknowledgementsWe thank Jonathan Friedman, Nic Vega, Eugene Yurtsev and the members of Gore Labfor insightful comments. This work was funded by an NSF CAREER Award. J.G. is anAllen Distinguished Investigator, Pew Scholar in the Biomedical Sciences, Sloan Fellow,and NIH Director’s New Innovator Awardee.
Author contributionsH.C. and J.G. conceived the study. H.C. designed and performed experiments. H.C. andJ.G. analysed data and wrote the paper.
Additional informationSupplementary Information accompanies this paper at http://www.nature.com/naturecommunications
Competing financial interests: The authors declare no competing financial interests.
Reprints and permission information is available online at http://npg.nature.com/reprintsandpermissions/
How to cite this article: Celiker, H. and Gore, J. Clustering in community structureacross replicate ecosystems following a long-term bacterial evolution experiment.Nat. Commun. 5:4643 doi: 10.1038/ncomms5643 (2014).
ARTICLE NATURE COMMUNICATIONS | DOI: 10.1038/ncomms5643
8 NATURE COMMUNICATIONS | 5:4643 | DOI: 10.1038/ncomms5643 | www.nature.com/naturecommunications
& 2014 Macmillan Publishers Limited. All rights reserved.


![Dimensionality reduction of the Human Microbiome data...replicate. It is the necessary starting point to all clustering methods in QIIME2 [7]. Set of commands for dereplication trough](https://static.fdocuments.us/doc/165x107/6111c6f0ae44111e6d7265fb/dimensionality-reduction-of-the-human-microbiome-data-replicate-it-is-the-necessary.jpg)