Clustered or Multilevel Data What are clustered or multilevel data? Why are multilevel data common...
34
Clustered or Multilevel Data • What are clustered or multilevel data? • Why are multilevel data common in outcomes research? • What methods of analysis are available? • What are random versus fixed effects? • How does the N at each level affect model choice? • How does the study question affect model choice?
-
date post
21-Dec-2015 -
Category
Documents
-
view
223 -
download
0
Transcript of Clustered or Multilevel Data What are clustered or multilevel data? Why are multilevel data common...

Clustered or Multilevel Data• What are clustered or multilevel data?
• Why are multilevel data common in outcomes research?
• What methods of analysis are available?
• What are random versus fixed effects?
• How does the N at each level affect model choice?
• How does the study question affect model choice?

What are clustered data?
• Gathering individual observations into larger groups does not create clustered data– Individual observations from a simple, random
sample are never clustered
• Clustering is a result of sampling/design– Usually from stages/levels in obtaining the
individual units of observation

Examples of Clustered Data
• Litters of puppies
• Pieces of leaves (several per leaf)
• Intervention on institutions (eg, schools)
• TB cases and their contacts
• Survey stratified by county and census tract
• A sample of physicians and their patients
• Repeated measurements on individuals

Clustered or Multilevel Data
Level 2 unit #3Level 2 unit #2Level 2 unit #1
Level 2 (cluster):
1,2 2,2 4,31,3 2,3 3,32,1 3,11,1
Level 1 (individual observation):
Physicians, schools, census tracts, leaves
Patients, students, residents, leaf samples

“Cluster analysis” is a different topic: finds clusters in data
x x x x x x x x x x x x x x x x x x
x x x x x x x x x x x x x x x x x
x x x x x x x x x x x x x x x x x x
x x x x x x x x x x x x x x x x x
x x x x x x x x x x x x x x x x x x
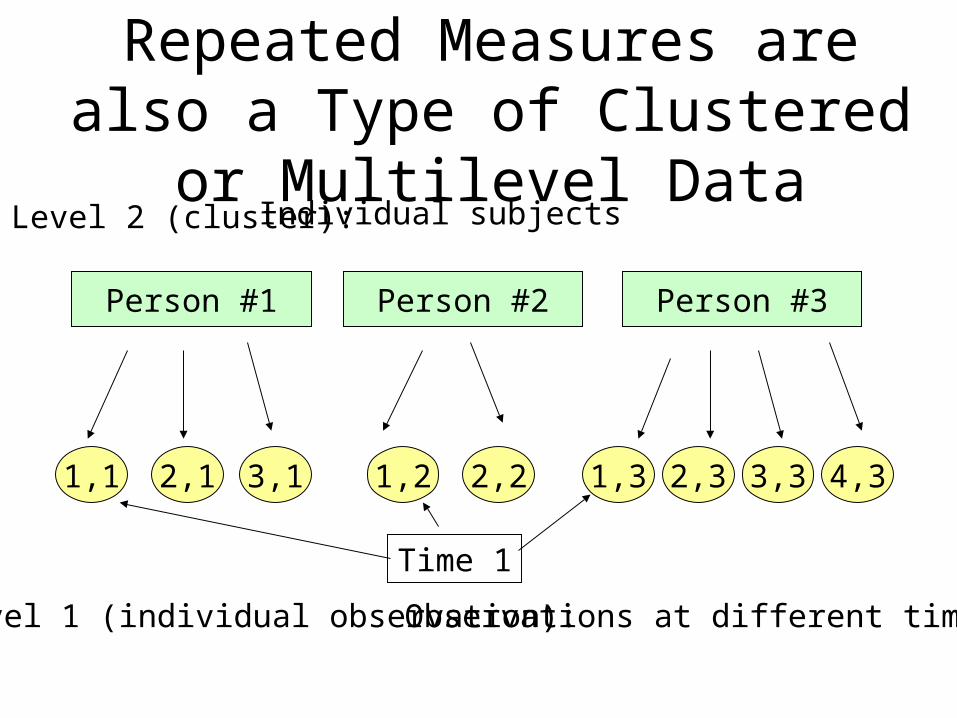
Repeated Measures are also a Type of Clustered or Multilevel Data
Person #3Person #2Person #1
Level 2 (cluster):
4,32,1 3,1 1,2 2,2 1,3 2,3 3,31,1
Level 1 (individual observation):
Individual subjects
Observations at different times
Time 1
Multilevel Data is Common in Outcomes Research
• Secondary data sets are often multilevel:– Patients clustered within physicians clustered
within hospitals or clinics (hospital discharges)
• National health surveys (NHIS, NHANES) are stratified probability surveys
• Health interventions often randomize institutions or geographic areas
• Health policy changes are applied at geographic or institutional level

Characteristics of Clustered Data
• Measurements within clusters are correlated (eg, measures on same person are more alike than measurements across persons)
• Variables can be measured at each level
• The variance of the outcome can be attributed to each level
• Standard statistical models and tests are incorrect

Effects of Clustered Data
• The assumptions of independence and equal variance of standard statistics do not hold– Standard errors for statistical testing will be
incorrect
• Regression models cannot be fit using methods that assume independence of observations– For example, ordinary least squares calculation
of the regression line is incorrect

Example of Multilevel Data with a Linear Outcome Variable
PORT study of type II diabetes patients’ satisfaction with medical care
• Outcome = score from 14 questionnaire items• Sample of 70 physicians (level 2 sample)• Sample of 1492 patients (level 1 sample)
– Mean 21.3 patients per physician– Range from 5 to 45 patients per physician
• Two levels of covariates considered– Physician years in practice, specialty (level 2)– Patient age, gender (level 1)

Clustered/Multi-level Data VarianceOutcome = Patient Satisfaction Score
Variance in the patient score divides into two parts: (1) the variance between physicans = 2
B
(2) the variance within the physicians = 2W
So the total variance = 2B + 2
W
MD3: mean=74MD2: mean=58MD1: mean=81
Level 2: Physicians (N=70)
7985 77 55 61 68 74 7581
Level 1: Patients (N=1492)

Intraclass Correlation Coefficient
The intraclass correlation coefficient (ICC) is a measure of the correlation among the individual observations within the clusters
It is calculated by the ratio of the between cluster variance to the total variance:
2B / (2
B + 2W )

Intraclass Correlation Coefficient (ICC)
Take extreme case where each MD’s patients havethe same score = no variance within the physicians. So, ICC = 2
B / 2B + 2
W = 2B / 2
B + 0 = 1 = perfectcorrelation within the clusters.
MD3: mean=74MD2: mean=58MD1: mean=81
7481 81 58 58 74 74 7481

Methods of Analyzing Multilevel Data
1 Use a single measure per cluster (e.g., mean satisfactions score) as the outcome variable
2 Fit a model with indicator variables for each cluster (minus one)
3 Fit a regression model with generalized estimating equations (GEE model)
4 Fit a fixed effects conditional regression model
5 Fit a random effects regression model

Choice of Analysis Model: Two Main Considerations
• What is the research question
• How many observations are there at level 2 and how many level 1 observations are there per level 2 observation

Choice of Analysis Model: The Research Question
1 What is the relationship of patient age to the MD satisfaction score? (level 1 predictor)
2 What is the relationship between MD years in practice and the score? (level 2 predictor)
3 How much variation is there in the mean satisfaction score between MDs adjusted for level 1 and level 2 predictors? (level 2 variance)

Method (1): Use mean satisfaction score for each physician as outcome
• Single measure for each cluster – simple, easy to understand– loses information, power (N=70, not 1492)– ignores different variance of single outcome if
clusters are different sizes– no individual level variables except as mean values
(eg, mean patient age)
• Only answers question 2 (MD years in practice) although can use mean patient age

Method (2): Use dummy variable for each MD
• Dummy variable represents each MD effect – treats each MD effect as equally well estimated but
some of the clusters small (N=5,7,8, etc.)
• If we had 70 MD’s and only 200 patients, 69 dummy variables would use up too many degrees of freedom
• If we had only 10 MD’s, it is a good choice• Can only answer question 1 (relationship of
patient age to satisfaction score)
Method (3):Regression with Generalized Estimating Equations (GEE)
• Estimates regression coefficients and variance separately to account for clustering– Gives population average effect of age on
satisfaction (“marginal model”)
• Analyst indicates correlation structure within the clusters
• Answers questions 1 and 2 but not 3– Variation in patient satisfaction between MD’s is not
modeled separately

Specifying Correlation within Clusters for GEE Model
• Most common assumption is one correlation coefficient for all pairs of observations within the clusters; called compound symmetry or exchangeable correlation structure
• Other assumptions about the correlation are possible (eg, correlation weakens with time/distance)
• The GEE regression will give good estimate of predictor coefficients even if the correlation specified is incorrect if you use the robust se’s

Method (4): Use Conditional Regression Model with Fixed Effects
• Looks within each MD to model the association between patient age and the score
• No coefficient for MD (“conditioned out”)
• Good choice if number of MD’s large relative to number of patients (70 MD’s, 200 patients)– Matched pairs are analyzed with conditional
regression
• Answers question 1, but not 2 and 3

Method (5): Use a Random Effects Regression Model
• Predictor variables for both individual and cluster level variables
• Models variance associated with MD separately from variance within the clusters in patient satisfaction
• Improves estimate of MD effect by treating MD mean scores as random sample of scores
• Only model that answers all 3 questions

Fixed versus Random Effects
• Effects are random when the levels are a sample of a larger population– have variation because sampled; another
sample would give different data
• Effects are fixed if they represent all possible levels/members of a population:– eg, male/female; treatment groups; all the
regions of the U.S.

Fixed versus Random Effects
• Effects can often be considered fixed or random depending on the research question
• If you want to generalize from the sample of doctors to other doctors, you would consider the doctors as a random effect
• If the doctors in your sample are the only ones you care about, you could consider doctors as a fixed effect

Random Effects Illustrated from the PORT Diabetes Study
• In the MD satisfaction score example, begin by ignoring predictors such as the patients’ age and the physicians’ number of years in practice
• The overall mean patient satisfaction score for all 1492 patients was 67.7 (SD=23.5)
• Separate means calculated for each physician’s patients ranged from 53.4 to 87.1
Random Effects: MD Score
• Consider the satisfaction score as composed of two parts: the overall mean () plus or minus the difference from that overall mean of the mean score for each physician (j)
• Each MD’s difference, j, is a random effect because the 70 MD’s represent a sample of possible MD’s. – If we sampled another 70, the j’s would be different
A Simple Random Effects Model
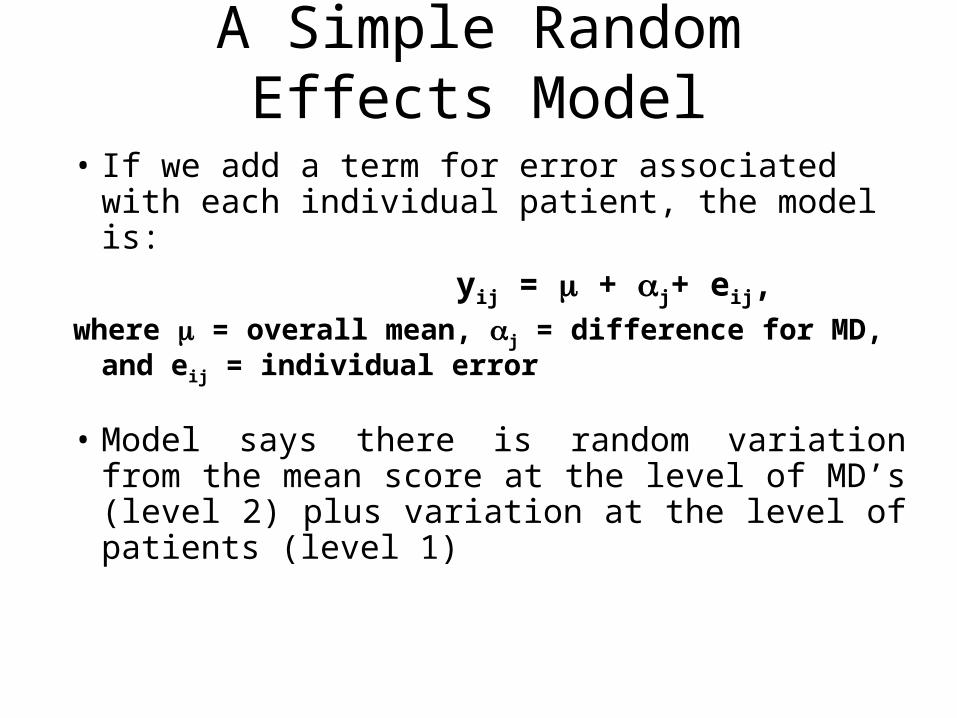
• If we add a term for error associated with each individual patient, the model is:
yij = + j+ eij, where = overall mean, j = difference for MD, and
eij = individual error
• Model says there is random variation from the mean score at the level of MD’s (level 2) plus variation at the level of patients (level 1)

What does the random effects model do?
• Actual MD means vary from 53.4 to 87.1 and patient N for each MD varies from 5 to 45. Thus, actual MD means not very stable.
• Random effects model assumes MD mean scores are from an underlying normal distribution
• It uses the information from all the MDs and the characteristics of a normal distribution to estimate the “true” j’s

Estimating the Random Effects
• In our example from the PORT study, raw means range = 53.4 to 87.1
• Ordinary least squares estimates range = 54.0 and 87.9 (term for each MD, ANCOVA)
• The random effects estimates of the mean patient scores by MD ranged from 60.4 to 78.6; their SD was 4.94.– so random effects are closer to the overall mean

Adding MD and Patient Predictors to the Simple Model
• We want to examine the effect of patient’s age (level 1 variable) and MD years in practice (level 2) on the satisfaction score
• Specify a regression model with 2 predictor variables and a random effect for the MD
• Score for each MD is modeled both by adjusting for patient’s age and MD years in practice and by modeling the distribution of MD mean scores

Final Random (or Mixed) Effects Regression Model
• Positive association with patient age (=0.15, p=0.003, satisfaction score goes up with age)
• No association with MD years in practice (p=0.69)
• Significant variance (24.4) in satisfaction score by MD (random effect)
Summary
• Clustered data should not be analyzed with standard statistical methods and tests
• Reduction of outcome and predictors to one value per cluster is an option but loses information
• Choice of remaining methods (dummy variables, conditional regression, GEE, or random effects) depends on the research question and on the number of observations at each level

Summary
• Research questions affect choice of method– if only care about predictors, GEE models are a good
alternative– if question is about variation between clusters (level 2
variable), a model that produces random effects estimates is needed
• Number of clusters has to be large enough to estimate a random effect (N=30+)
• Small number of clusters can be handled with dummy variables

Data Set for Homework
• CA hospitals CABG registry• Patients (N=28,555) clustered within
hospitals (N=80)• Binary outcome: alive/dead after 30 days• Patient level characteristics and hospital
characteristics• Use STATA to answer questions [syntax for
the models supplied]