CLT INFILL PANELS IN STEEL MOMENT RESISTING...
90
CLT INFILL PANELS IN STEEL MOMENT RESISTING FRAMES AS A HYBRID SEISMIC FORCE RESISTING SYSTEM by Carla Dickof B.A.Sc., The University of Alberta, 2007 A THESIS SUBMITTED IN PARTIAL FULFILLMENT OF THE REQUIREMENTS FOR THE DEGREE OF MASTER OF APPLIED SCIENCE in THE FACULTY OF GRADUATE STUDIES (Civil Engineering) THE UNIVERSITY OF BRITISH COLUMBIA (Vancouver) April 2013 © Carla Dickof, 2013
Transcript of CLT INFILL PANELS IN STEEL MOMENT RESISTING...
CLT INFILL PANELS IN STEEL MOMENT RESISTING FRAMES AS A HYBRID
SEISMIC FORCE RESISTING SYSTEM
by
Carla Dickof
B.A.Sc., The University of Alberta, 2007
A THESIS SUBMITTED IN PARTIAL FULFILLMENT OF
THE REQUIREMENTS FOR THE DEGREE OF
MASTER OF APPLIED SCIENCE
in
THE FACULTY OF GRADUATE STUDIES
(Civil Engineering)
THE UNIVERSITY OF BRITISH COLUMBIA
(Vancouver)
April 2013
© Carla Dickof, 2013
ii
Abstract
This paper examines CLT-steel hybrid systems at three, six, and nine storey heights to
increase seismic force resistance compared to a plain wood system. CLT panels are used as
infill in a steel moment frame combining the ductility of a steel moment frame system with a
stiffness and light weight of CLT panels. This system allows for the combination of high
strength and ductility of steel with high stiffness and light weight of timber. This thesis
examines the seismic response of this type of hybrid seismic force resisting system (SFRS) in
regions with moderate to high seismic hazard indices. A detailed non-linear model of a 2D
infilled frame system and compared to the behavior of a similar plain steel frame at each
height.
Parametric analysis was performed determining the effect of the panels and the connection
configuration, steel frame design, and panel configuration in a multi-bay system. Static
pushover loading was applied alongside semi-static cyclic loading to allow a basis of
comparison to future experimental tests. Dynamic analysis using ten ground motions linearly
scaled to the uniform hazard spectra for Vancouver, Canada with a return period of 2% in 50
years as, 10% in 50 years, and 50% in 50 years to examine the effect of infill panels on the
interstorey drift of the three, six, and nine storey. The ultimate and yield strength and drift
capacity are determined and used to determine the overstrength and ductility factors as
described in the National Building Code of Canada 2010.
iii
Preface
I created and calibrated all the analytical models and wrote all of the contained manuscript.
The material models developed in Chapter 5 were based on the experimental tests performed
at FP Innovations by Johannes Schneider for his 2009 thesis, (Connections in Cross-
Laminated-Timber Shear Walls Considering the Behaviour under Monotonic and Cyclic
Lateral Loading 2009). I was responsible for the calibration of the material model to match
the experimental results as well as all the development of the system model and the resulting
analytical results discussed in Chapter 6.
This thesis is made on the topic the effect on strength and seismic behavior of a steel moment
frame with CLT infill panels. Versions of chapters 2 through 6 have been published in the
following conference papers:
• Stiemer, Dickof, Tesfamariam, “Wood-Steel Hybrid Systems: Overstrength and
Ductility in Design”, 10th International Conference on Advances in Steel Concrete
Composite and Hybrid Structures, Singapore, 2012
• Stiemer, Dickof, Tesfamariam, “Steel-Timber Hybrid Structures – Design
Performance and Dynamic Behaviour”, 22nd Australasian Conference on the
Mechanics of Structures, Sydney Australia, 2012
• Dickof, Stiemer, Tesfamariam, “Wood-Steel Hybrid Seismic Force Resisting
Systems: Seismic Ductility”, World Conference on Timber Engineering, Auckland
NZ, 2012
The research conducted in the above publications and this thesis was completed by me, with
guidance from Dr. Siegfried Stiemer and Dr. Solomon Tesfamariam.
iv
Table of Contents
Abstract .................................................................................................................................... ii
Preface ..................................................................................................................................... iii
Table of Contents ................................................................................................................... iv
List of Tables ......................................................................................................................... vii
List of Figures ....................................................................................................................... viii
Acknowledgements ................................................................................................................. x
Chapter 1: Introduction ........................................................................................................ 1
Chapter 2: Materials.............................................................................................................. 4
2.1 Connections............................................................................................................... 5
2.2 Crossed Laminated Timber (CLT)............................................................................ 6
2.2.1 Experimental Tests................................................................................................ 7
FP Innovations (Popovski and Karacabeyli 2011)........................................................ 7
Ceccotti et al. (2010) ................................................................................................... 10
Fragiacomo et al. (2011) ............................................................................................. 11
2.2.2 Analytical Models of CLT Systems .................................................................... 12
Rinaldin, Amadio and Fragiacomo (2011) ................................................................. 12
Ceccotti (2008)............................................................................................................ 13
Chapter 3: Hybridization .................................................................................................... 14
3.1 Hybrid System Case Studies ................................................................................... 15
Kanazawa M Building (Koshihara, H. and Yusa 2005) ............................................. 15
Scotia Place (Moore 2000) .......................................................................................... 17
Quebec Six Storeys Hybrid Office Building (Mohammad, et al. 2011) ..................... 18
v
3.2 Infill Shear Walls .................................................................................................... 19
Chapter 4: Seismic Force Resisting System Design .......................................................... 21
4.1 Ductility and Force Based Design .......................................................................... 21
4.2 Performance Design ................................................................................................ 23
Chapter 5: Methodology...................................................................................................... 25
5.1 Sample Structure ..................................................................................................... 25
5.2 Design and Modeling .............................................................................................. 28
5.2.1 OpenSees............................................................................................................. 29
5.2.2 Frame Design and Modeling ............................................................................... 30
5.2.3 Wall Design and Modeling ................................................................................. 33
5.2.4 Connection Design and Modeling ...................................................................... 34
5.3 Loading ................................................................................................................... 39
5.3.1 Semi-Static Monotonic Analysis ........................................................................ 40
5.3.2 Semi-static Cyclic Analysis ................................................................................ 40
5.3.3 Ground Motion Analysis..................................................................................... 41
Chapter 6: Results................................................................................................................ 44
6.1 Single Bay, Single Storey, Static and Semi-Static-Cyclic Results ......................... 44
6.2 Multi-Storey Static Results ..................................................................................... 50
6.2.1 Ductility Factors.................................................................................................. 58
6.2.2 Overstrength Factors ........................................................................................... 61
6.3 Seismic Response.................................................................................................... 64
Chapter 7: Conclusion ......................................................................................................... 68
7.1 Summary of Findings .............................................................................................. 68
vi
7.2 Future Research ...................................................................................................... 70
References .............................................................................................................................. 71
Appendices ............................................................................................................................. 75
Appendix A Frame Design ................................................................................................. 75
Appendix B Scaled Ground Motions .................................................................................. 80
B.1 Ground Motions .................................................................................................. 80
B.2 Scaling Factors .................................................................................................... 80
vii
List of Tables
Table 2.1: Materials Properties: Steel, Wood, and Concrete (Khorasani 2010) ....................... 4
Table 4.1: Steel Ductility and Overstrength Information ....................................................... 23
Table 5.1: Single Bay Parameters of Interest .......................................................................... 27
Table 5.2: Multi-Storey Parameters of Interest ....................................................................... 28
Table 5.3: Rotation Requirements for Plastic Hinges (American Society of Civil Engineers
(ASCE) 2006) ......................................................................................................................... 33
Table 5.4: CLT Material Properties (Structurlam n.d.) .......................................................... 33
Table 5.5: Amplitude for Semi-static Cyclic CUREE Protocol ............................................. 36
Table 5.6: Amplitude for Semi-static Cyclic ISO Protocol .................................................... 41
viii
List of Figures
Figure 2.1: Crossed Laminated Timber (CLT) ......................................................................... 7
Figure 2.2: Hysteretic Response of CLT Walls to Lateral Loading (Schneider 2009) ............. 8
Figure 2.3: Semi-static CLT Wall Tests - Effect of Connection Between Panels (Popovski
and Karacabeyli 2011) .............................................................................................................. 9
Figure 2.4: 7 Storey CLT Shake Table Test (Fragiacomo, Dijic and Sustersic 2011) ........... 11
Figure 3.1: Brace Connection Schematic................................................................................ 16
Figure 3.2: Floor Assembly Schematic ................................................................................... 17
Figure 3.3: Six Storey Wood and Concrete Hybrid Building Structure (Mohammad, et al.
2011) ....................................................................................................................................... 18
Figure 3.4: Column Connections ............................................................................................ 19
Figure 5.1: Base Building Floor Plan (left); Base 2D Frame Elevation (right) ..................... 26
Figure 5.2: Single Bay, Single Storey, CLT Infilled Frame with Bracket Locations ............. 27
Figure 5.3: Wall Locations for Frame with Infill Wall Locations .......................................... 28
Figure 5.4: Modified Ibarra Krawinkler Deterioration Model for BILIN Material in
OPENSEES (Lignos and Krawinkler 2011) ........................................................................... 32
Figure 5.5: Failed Bracket (left); Bracket Stress-Strain Curve (right) (Schneider 2009) ....... 34
Figure 5.6: Two Node Link Formulation (Schellenberg n.d.) ................................................ 35
Figure 5.7: Comparison of Test and Analytical Bracket Behavior ......................................... 36
Figure 5.8: Test and Analytical Bracket Behavior Comparison of Important Values ............ 37
Figure 5.9: Elastic Perfectly Plastic Gap Material Behavior (Schellenberg n.d.) ................... 38
Figure 5.10: Combined Bracket Material ............................................................................... 39
Figure 5.11: Static Pushover Initial Periods ........................................................................... 42
Figure 5.12: Scaled Ground Motion Spectrums Compared to Vancouver’s Hazard .............. 43
ix
Figure 6.1: Effect of Infill CLT Panel .................................................................................... 45
Figure 6.2: Effect of Wood Crushing Strength ....................................................................... 46
Figure 6.3: Force in Bracket vs. Overall System Drift for all Brackets Along Both Columns
................................................................................................................................................. 47
Figure 6.4: Effect of Confinement Gap on a Frame with Infill Panel .................................... 48
Figure 6.5: Cyclic and Monotonic Behavior of Single Bay Infilled Frame. Infilled Frame
with 0.0mm Gap (left); Infilled Frame without Confinement (center); Bare Moment Frame
(right) ...................................................................................................................................... 49
Figure 6.6: Parametric Monotonic Pushover Curves .............................................................. 51
Figure 6.7: Ultimate Strength Compared to The Number of CLT Infilled Bays .................... 52
Figure 6.8: Ultimate Drift Capacity Compared to the Number of CLT Infilled Bays ............ 53
Figure 6.9: Yield Strength Compared to the Number of CLT Infilled Bays .......................... 55
Figure 6.10: Yield Drift Capacity Compared to the Number of CLT Infilled Bays ............... 57
Figure 6.11: Ductility Factors for Systems with Type D Frames ........................................... 58
Figure 6.12: Ductility Factors for System for Type LD Frames ............................................. 60
Figure 6.13: Overstrength Factors for System for Type D Frames ........................................ 62
Figure 6.14: Overstrength Factors for System for Type LD Frames ...................................... 62
Figure 6.15: Nine Storey Infilled Ductile Frame Building Drift at Ultimate Drift ................. 65
Figure 6.16: Nine Storey System with Ductile Frame Maximum Inter-storey Drift ............. 65
Figure 6.17: Nine Storey Inter-Drift for all Frame-Infill Configurations ............................... 66
Figure 6.18: Six Storey Inter-Drift for all Frame-Infill Configurations ................................. 67
x
Acknowledgements
I am grateful for all the support of the faculty, staff, and my fellow students at UBC. I would
particularly like to thank my supervisors, Dr. Siegfried Stiemer and Dr. Solomon
Tesfamariam, for their guidance. The feedback and support from the industrial collaborators,
Dr. Marjan Popovski and Mr. Erol Karacabeyli from FP Innovations, is gratefully
acknowledged. Special thanks to Mr. Johannes Schneider for his input and collaboration.
This research was supported through funding to the NSERC Strategic Network on Innovative
Wood Products and Building Systems. Last but not least, I would like to thank my parents for
their unending support.
1
Chapter 1: Introduction
Hybrid systems are found throughout the world, in many types of structures, and with many
different materials. While any system that combines two or more materials to resist loading
can be defined as hybrid; using steel and concrete together is the most common in modern
construction. This includes concrete on metal deck supported on steel beams as a floor
system as well as the typical concrete reinforced with steel. Steel and timber hybrid systems
are less common, but they do exist. For example, Quebec and Northern Ontario have many
steel and wood hybrid bridges (Krisciunas 1996). Some steel and timber systems use timber
as the secondary structure, such as floor joists, with the primary system constructed from
steel, such as the columns, primary beams, and braces.
Hybridization can be divided into three categories: component level, system level, and
building level. In general, the goal of each is to take advantage of the strength of each
material while reducing the impact of their weakness. The main focus of this thesis is on
system level hybridized system using wood and steel; specifically a vertical seismic force
resisting system (SFRS) combining steel moment frames with Cross-Laminated-Timber
(CLT) shearwall panels.
Chapter 2 reviews the material properties of wood and steel as well as highlighting potential
incompatibilities. Steel is much stronger and provides significant post-yield deflection
capability, and so moment frames of steel are extremely ductile, but they generally
experience large deflections during seismic events. Wood is comparatively much weaker
larger members are usually required, resulting in stiffer systems. Furthermore, wood does not
have significant deformation capacity post-yield, especially when loaded perpendicular to the
grain, resulting in a less ductile system overall. The material incompatibilities are overviewed
as they pose important problem for the connections of this kind of system. Steel connectors
are commonly used in timber structures and are effectively a small scale hybridized system.
A discussion of typical wood connections is provided in this section as well. Finally, CLT is
introduced along with the common connectors used in a plane CLT building. Significant
experimental testing has been completed on CLT wall panels and analytical models have
been created for CLT panel systems; the results are summarized herein.
2
Chapter 3 describes component, system, and building level hybridization while provided
specific examples of each. Three case studies of existing steel and timber hybrid buildings
are presented, including one six storey building for Canada. The issues that arose in the case
studies presented are discussed and the advantages are presented. Finally, the type of
hybridization that will be the focus of this thesis is discussed. Steel moment frames with
infill CLT panels is not a system that has notable documentation or case studies, but in many
ways it is similar to masonry infilled moment frames. That type of system is seen in both
steel and several studies are presented demonstrating significantly decrease the drift of the
structures as well as increasing the ultimate and yield strength of the system. These effects
should translate directly to infill CLT panels
Chapter 4 describes the equivalent static force design method in the National Building Code
of Canada (NRC 2010) as well as the method for developing the ductility and overstrength
factors. The force exerted on the building due to an elastic response is calculated, and then
reduced by the ductility factor (µ, Rd) and the overstrength factor (Ω, Ro) to determine the
forces that must be resisted after yielding has occurred. Other design codes provide similar
reduction factors for force based design.
Chapter 5 discusses the parametric analyses performed in OpenSees to determine the
characteristics of a hybrid steel moment frame with infill CLT shearwall panels. The steel
frame is created with non-linear hinge lengths at the member ends to provide non-linear
behavior and the CLT infill panels are simplified as linear-elastic isotropic quadrilateral shell
elements that experience stress only in plane. The connectors between the timber shell
elements and the steel frame elements are modeled as non-linear links; the material model
associated with the links combines the elastic-plastic behavior of the panel crushing with the
pinching hysteretic behavior of a nailed bracket connection.
Chapter 6 reviews the static pushover analysis and dynamic ground motion analysis are
performed in the parametric study. The pushover analysis was done for the full spectrum of
parameters, which include steel moment frames ductility, panel thicknesses, panel strength,
and connection configurations. The pushover analyses are used a basis to provide initial
estimates of ductility and overstrength for the hybrid system. Dynamic analysis was

3
performed using 10 linearly scaled ground motions scaled to Vancouver’s hazard spectrum at
2% in 50 years, 10% in 50 years, and 50% in 50 year return periods. The results of these
ground motion tests are used to analyze the interstorey drifts and associated base shears to
help refine the ductility and overstrength factors.
In Chapter 7, conclusions and future direction are provided.
4
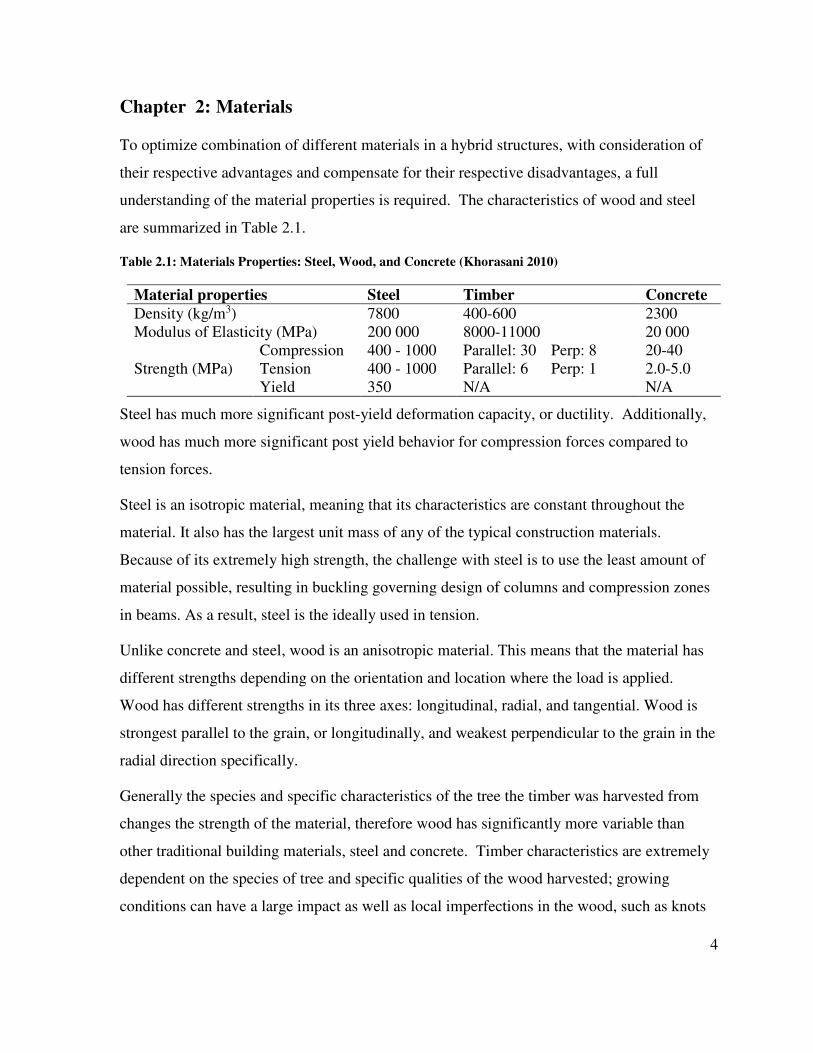
Chapter 2: Materials
To optimize combination of different materials in a hybrid structures, with consideration of
their respective advantages and compensate for their respective disadvantages, a full
understanding of the material properties is required. The characteristics of wood and steel
are summarized in Table 2.1.
Table 2.1: Materials Properties: Steel, Wood, and Concrete (Khorasani 2010)
Material properties Steel Timber Concrete
Density (kg/m3) 7800 400-600 2300
Modulus of Elasticity (MPa) 200 000 8000-11000 20 000
Strength (MPa)
Compression 400 - 1000 Parallel: 30 Perp: 8 20-40
Tension 400 - 1000 Parallel: 6 Perp: 1 2.0-5.0
Yield 350 N/A N/A
Steel has much more significant post-yield deformation capacity, or ductility. Additionally,
wood has much more significant post yield behavior for compression forces compared to
tension forces.
Steel is an isotropic material, meaning that its characteristics are constant throughout the
material. It also has the largest unit mass of any of the typical construction materials.
Because of its extremely high strength, the challenge with steel is to use the least amount of
material possible, resulting in buckling governing design of columns and compression zones
in beams. As a result, steel is the ideally used in tension.
Unlike concrete and steel, wood is an anisotropic material. This means that the material has
different strengths depending on the orientation and location where the load is applied.
Wood has different strengths in its three axes: longitudinal, radial, and tangential. Wood is
strongest parallel to the grain, or longitudinally, and weakest perpendicular to the grain in the
radial direction specifically.
Generally the species and specific characteristics of the tree the timber was harvested from
changes the strength of the material, therefore wood has significantly more variable than
other traditional building materials, steel and concrete. Timber characteristics are extremely
dependent on the species of tree and specific qualities of the wood harvested; growing
conditions can have a large impact as well as local imperfections in the wood, such as knots
5
(Keenan 1986). Another important weakness to note in any use of timber is its susceptibility
to rolling shear, shear leading to strain perpendicular to the grain. If wood is thought of a
series a parallel fibers held together with fairly week bonds between them, then rolling shear
results in the fracture of this type of bond and the fibers “rolling” next to one another. It tends
to cause detachment of one layer of wood grain from another. Wood is much weaker in this
type of shear than in “radial” or “longitudinal” shear.
Also, it is important to note the comparative hydroscopic and thermal properties of wood
compared to steel. Steel is very thermally sensitive, expanding and contracting as
temperatures rise and fall respectively, wood is thermally very stable. Comparatively, wood
is a hydroscopic material, expanding and contracting as its moisture content rises and falls,
respectively, moisture has no effect on the dimensions of steel. The hydroscopic properties
of wood are also affected by its anisotropic properties. The tangential direction shows the
larger shrinkage, followed by the radial direction, with the longitudinal direction showing
very limited shrinkage effects. Tangential shrinkage is generally approximately twice that of
radial shrinkage, although this varies depending on the species. Tangential shrinkage from
green to oven dry ranges from 5% to 12.5%; comparatively, radial shrinkage ranges from
2.2% to 7.7% depending on species. The different amount of shrinkage in different
directions can cause the warping noticeable in some old pieces of wood; this is dependent on
how the tree was milled. Longitudinal shrinkage is almost negligible with most species of
wood showing 0.1 to 0.2% shrinkage longitudinally.
2.1 Connections
Hybrid system should be designed by taking advantage of each material. For this reason,
timber seems ideal to replace typical floor systems and/or wall systems (e.g. shear walls).
This can significantly reduce the weight compared with concrete or masonry infill. There are
significant differences between the ways the materials respond to the load, and this should be
taken into consideration.
Timber shear walls respond very differently than timber braces or timber shear walls: Timber
frames should be designed with different goals that steel frames. Steel frames are designed
6
generally to be more ductile. Timber frames cannot achieve the same ductility. Ductility is
typically introduced into a timber system through deformation of steel connectors.
Connections are important. They must be resolved between the wood members and between
the timber-steel interfaces. One such example is the use of steel dowels in the form of bolts,
nails, rivets, etc. As the dowels deform plastically, they also cause of local crushing of the
wood at the connection location.
An ideal connection involves the largest amount of yielding possible, with the minimum
amount of wood crushing. Steel has the largest deformation capacity and can dissipate large
amounts of energy, a desirable property during a seismic event. Wood crushing also
contributes a significant amount of post-yield displacement capacity. Further, as crushing
occurs and the wood density increases, the strength of the wood increases both perpendicular
and parallel to the grain. Wood splitting should be avoided; it results in brittle failure.
Steel connection plates are commonly used to connect timber members together, or to
connect timber to steel elements. Steel plate connection brackets are common in many steel-
timber hybrid buildings.
Further, connections must also account for different material type incompatibilities. For
example, wood shrinks and swell with changing moisture types; steel expands and contracts
with temperature changes. Care must be taken to allow for these material size changes in the
connection so as not to place unintended internal stresses in the connections. Sometimes this
is as simple as providing slotted bolt holes in the steel. The expansion/contraction and
shrinkage/swelling of the materials can be most sensitive during construction before the
building envelope is in place, which helps control the temperature and moisture of the air
surrounding the structure.
2.2 Crossed Laminated Timber (CLT)
Both shear walls and braced frames are commonly used wood lateral systems, similar to
other common building materials such as steel and concrete. The most common type of
wood shear wall is the sheathed stud wall: studs with nailed plywood or Oriented Strand
Board (OSB). This thesis will focus on a new type of wood shearwall panel – Crossed
7
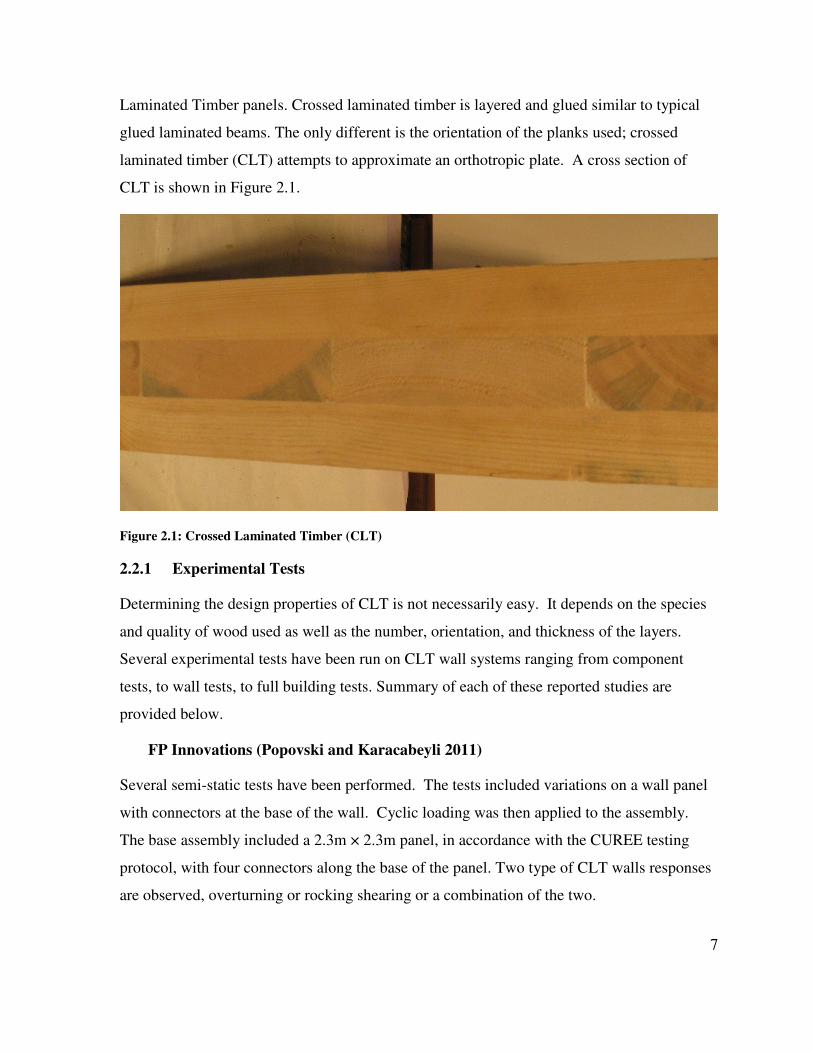
Laminated Timber panels. Crossed laminated timber is layered and glued similar to typical
glued laminated beams. The only different is the orientation of the planks used; crossed
laminated timber (CLT) attempts to approximate an orthotropic plate. A cross section of
CLT is shown in Figure 2.1.
Figure 2.1: Crossed Laminated Timber (CLT)
2.2.1 Experimental Tests
Determining the design properties of CLT is not necessarily easy. It depends on the species
and quality of wood used as well as the number, orientation, and thickness of the layers.
Several experimental tests have been run on CLT wall systems ranging from component
tests, to wall tests, to full building tests. Summary of each of these reported studies are
provided below.
FP Innovations (Popovski and Karacabeyli 2011)
Several semi-static tests have been performed. The tests included variations on a wall panel
with connectors at the base of the wall. Cyclic loading was then applied to the assembly.
The base assembly included a 2.3m × 2.3m panel, in accordance with the CUREE testing
protocol, with four connectors along the base of the panel. Two type of CLT walls responses
are observed, overturning or rocking shearing or a combination of the two.
8
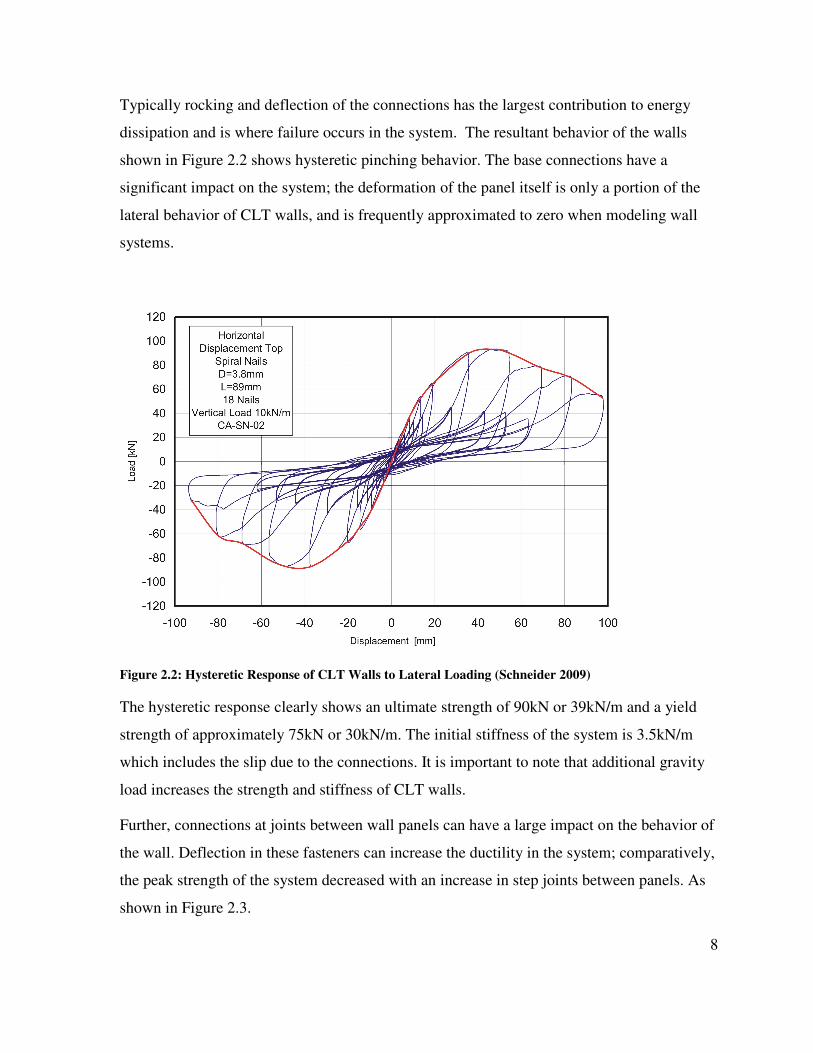
Typically rocking and deflection of the connections has the largest contribution to energy
dissipation and is where failure occurs in the system. The resultant behavior of the walls
shown in Figure 2.2 shows hysteretic pinching behavior. The base connections have a
significant impact on the system; the deformation of the panel itself is only a portion of the
lateral behavior of CLT walls, and is frequently approximated to zero when modeling wall
systems.
Figure 2.2: Hysteretic Response of CLT Walls to Lateral Loading (Schneider 2009)
The hysteretic response clearly shows an ultimate strength of 90kN or 39kN/m and a yield
strength of approximately 75kN or 30kN/m. The initial stiffness of the system is 3.5kN/m
which includes the slip due to the connections. It is important to note that additional gravity
load increases the strength and stiffness of CLT walls.
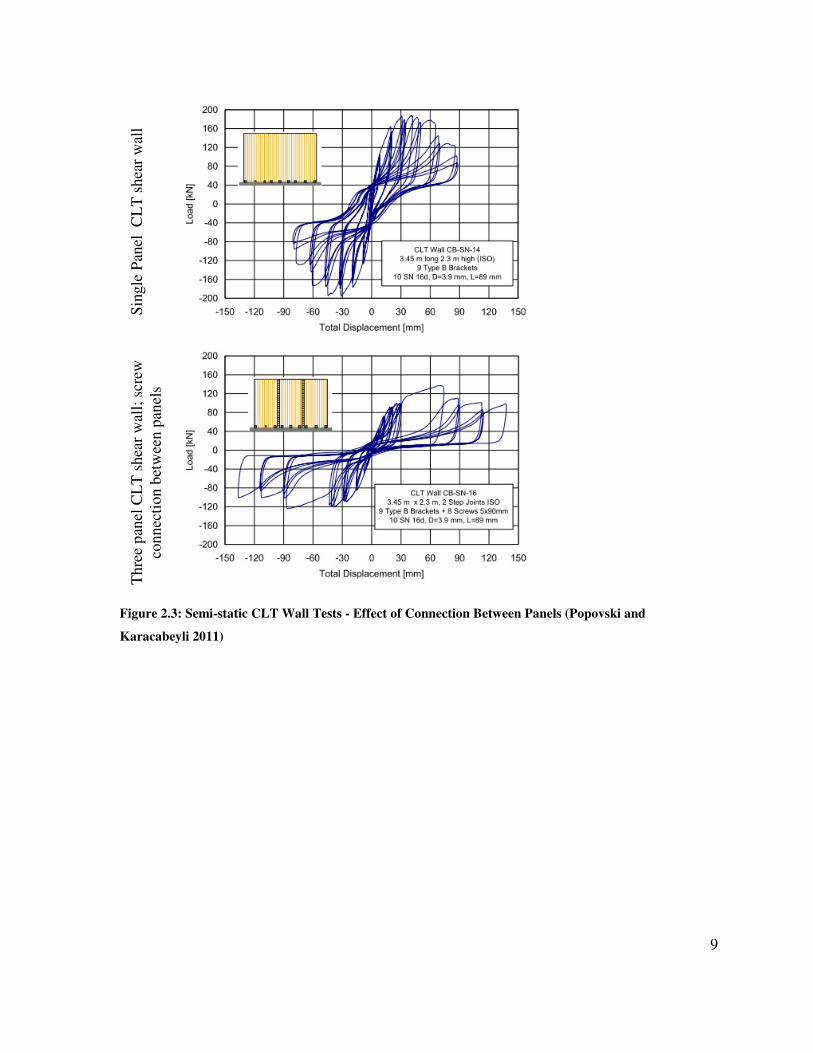
Further, connections at joints between wall panels can have a large impact on the behavior of
the wall. Deflection in these fasteners can increase the ductility in the system; comparatively,
the peak strength of the system decreased with an increase in step joints between panels. As
shown in Figure 2.3.
9
Sin
gle
Pan
el
CL
T s
hea
r w
all
Th
ree
pan
el C
LT
sh
ear
wal
l; s
crew
con
nec
tio
n b
etw
een
pan
els
Figure 2.3: Semi-static CLT Wall Tests - Effect of Connection Between Panels (Popovski and
Karacabeyli 2011)
10
Ceccotti et al. (2010)
Based on testing done in Europe and recommendations for the Eurocode ductility factor, q,
recommendations have been made for conservative ductility (Rd) and overstrength (Ro)
factors for the NBCC. According to evaluation at FPInnovations in Vancouver, Rd = 2.0 and
Ro = 1.5 are conservative estimates for pure CLT structures with nailed and screw
connections. Further, the behavior is superior to that of braced timber frames given then same
factors as CLT constructions “is not susceptible to the soft storey mechanism as the panels
(that are also vertical load carrying elements) are virtually left intact in place even after a
“near collapse” state is reached” (Popovski and Karacabeyli 2011).
Large scale dynamic tests have also been performed on full assemblies. A three storey CLT
building test was performed on a unidirectional shake table by NIED and CNR-IVALSA in
Japan. Tests were performed using Kobe, El Centro, and Nocera Umbra ground motions
adjusted to peak ground accelerations for 0.15g and 0.5g. Finally, the ground motion
acceleration was increased until the “near-collapse” state. The test specimen was
approximately 7m × 7m in plan and 10m tall. The walls were composed on 85mm thick wall
panels and 142mm thick floor panels (Ceccotti, Sandhaas and Yasumuro 2010).
No damage was observed in any component at a peak ground acceleration of 0.5g. When the
ground acceleration was increased to a maximum of 0.8g, slight deformation was noticed in
the screws at the vertical joints between the panels, but no other damage was observed.
Finally, when the peak ground acceleration was increased to 1.2g, hold down failure was
observed through pull out and bending of the nails; deformation in the screws between the
panels was also observed.
11
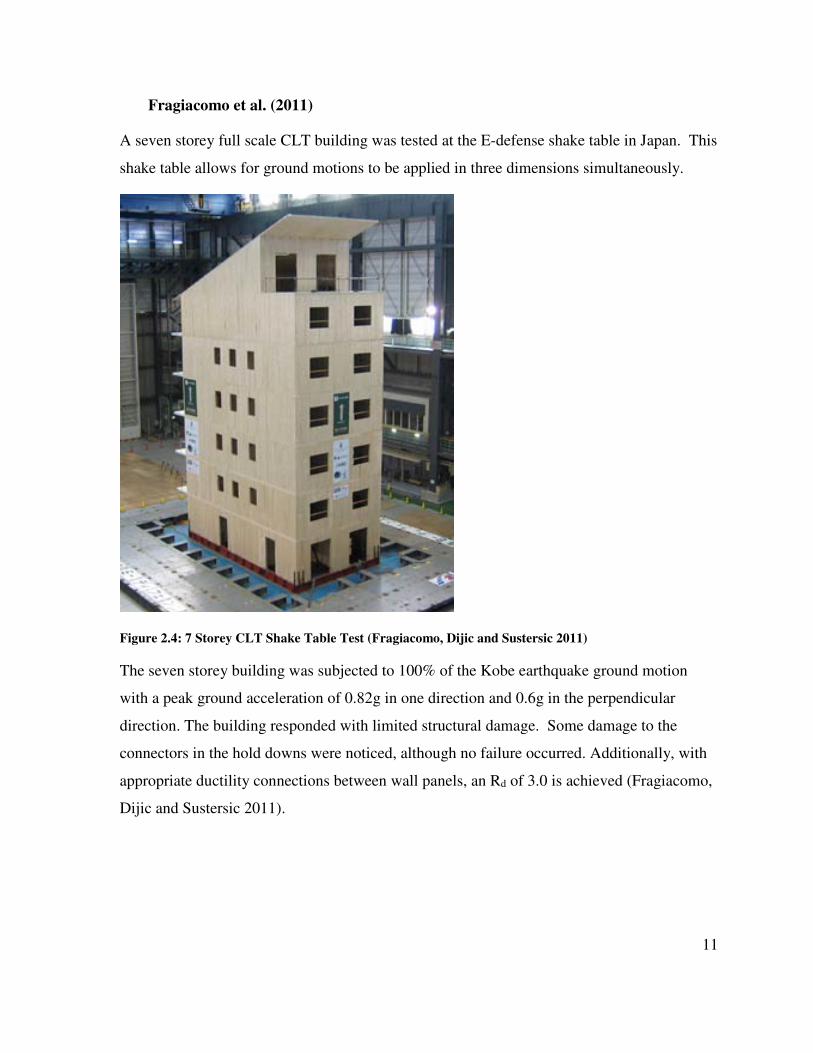
Fragiacomo et al. (2011)
A seven storey full scale CLT building was tested at the E-defense shake table in Japan. This
shake table allows for ground motions to be applied in three dimensions simultaneously.
Figure 2.4: 7 Storey CLT Shake Table Test (Fragiacomo, Dijic and Sustersic 2011)
The seven storey building was subjected to 100% of the Kobe earthquake ground motion
with a peak ground acceleration of 0.82g in one direction and 0.6g in the perpendicular
direction. The building responded with limited structural damage. Some damage to the
connectors in the hold downs were noticed, although no failure occurred. Additionally, with
appropriate ductility connections between wall panels, an Rd of 3.0 is achieved (Fragiacomo,
Dijic and Sustersic 2011).
12
2.2.2 Analytical Models of CLT Systems
When CLT is modeled in a wall or diaphragm system, the CLT is often modeled as a rigid
panel, or in some cases a simplified rigid frame, and the connections are modeled as non-
linear line elements. Several studies show this same trend.
Rinaldin, Amadio and Fragiacomo (2011)
Rinaldin et al. (2011) created a model of a single CLT panel with connecting brackets in
ABAQUS. Similar to other analysis models, two non-linear hysteretic behaviour models
were created for the brackets. One in shear only, to represent the angle bracket connections,
and one for the tension and compression in the hold-down connections.
The bracket spring model was defined with fourteen parameters including three parameters to
determine the stiffness at various points, yield and peak strength, ultimate displacement, and
five degradation characteristics. Comparatively, the hold-down spring model is non-
symmetric, the behavior in compression is linear elastic with a very high stiffness to
approximate contact between the CLT panel and the foundations. The input parameters for
the tension behavior are similar to that of the bracket spring model. The input values were
calibrated to experimental data from wall tests at Ivalsa CNR. Calibration of the input
parameters was aided using So.ph.i (Software for Phenomenological Implementation).
The timber panel was modeled as a shell element. The cross section of the shell was defined
as five layers of linear elastic orthotropic wood material; similar to other analytical models,
the assumption was that all plastic deformations would occur in the connectors. Three
bracket spring models were placed along the base of the shell element, and hold-down
springs were placed at the edges. Contact springs were also placed at the base of each shell
along the bottom of the wall. Contact springs are specialized no tension, high compression
stiffness springs.
The results from this model were compared with the results from wall tests and were found to
match closely in hysteretic behavior as well as total energy dissipated.
13
Ceccotti (2008)
Ceccotti (2008) performed an analysis to predict the results of the 3D three storey building
shake table test. The analytical model was created in Drain3D. The program was modified
to allow for the type of non-linear behavior present in timber connections. The model
consists of three major components, rigid panels modeled as stiff braced frames, and two
types of non-linear springs. One type to represent the angle brackets, with symmetric non-
linear pinching behavior to match experimental data. The other type of non-linear spring
represents the hold-downs, with non-symmetric behavior; non-linear pinching behavior is
modeled in tension and very stuff linear elastic behavior is modeled in tension.
The Nocera Umbra ground motion from the experimental shake table test scaled to a peak
ground acceleration of 1.2g was applied to the analytical model; the results were found match
well with the test results from the shake table test.
For the Kobe earthquake ground motion, scaled to 0.82g peak ground acceleration, the uplift
shown in the modeled varied a maximum of 6% from the experimental data. As the peak
ground acceleration increased, the difference between the model and the experimental data
increased. For the failure case, a 1.2g peak ground acceleration on the Nocera Umbra ground
motion, a maximum of 40% difference between the modeled response and the experimental
results was shown (A. Ceccotti 2008).
14
Chapter 3: Hybridization
A hybrid building uses two or more materials in combination to get the most out of each
material. This thesis focuses on steel and timber. Technically all timber buildings are hybrid
systems as the connections are almost always made of steel (nails for example).
Hybridization can be broken down in to three types: Component Hybridization, System
Hybridization, and Building Hybridization.
Component level hybridization involved more than one material type within a member. One
common example of component level hybridization for timber-steel hybrid is a flitch beam,
composed of one or more steel plate(s) sandwiched between pieces of timber. There are
several advantages to this type of system. The steel beam has significantly higher strength
than the timber members, but a steel plate will generally have significant issues with lateral
torsional buckling. The timber members provide lateral restraint for the steel preventing
lateral torsional buckling or local buckling. The steel and wood are connected together using
bolts spread over the length of the beam to transfer shear. This connection is the important
part of the design to ensure that appropriate distribution of forces occurs without splitting in
the wood.
System level hybridization entails use of multiple material types within a structural system.
The connections between these members are frequently the most complex issue in system
level hybridization. A common example of a hybrid system is steel and wood trusses.
Timber trusses can have distinct advantages for use in buildings where the stored materials
may give rise to environments that could be corrosive to steel. In such situation, the amount
of steelwork can be kept to a minimum so that expensive anti-corrosion costs are minimised.
Typically these are constructed with a timber top chord for the truss and steel bottom chord.
This works to each material’s advantages as timber has high compression strength and steel
is best used in tension.
Building level hybridization is the combination of building systems of different materials.
One example of this is a vertically mixed system. Vertically mixed systems have been
completed around the world, with one timber vertically mixed system in Australia recently
becoming the tallest timber residential building in the world (Harris 2012). The lower
15
floor(s), which support more load and often have a higher storey height, are constructed
entirely from concrete or steel framing; the storeys above are then timber framed. The result
is a significantly reduced total weight of the structure, decreasing the size of the foundations
as well as the requirements for the lower storey(s) design. The stronger material type at the
lower floor(s) prevents the requirement for larger timber sizes at these levels.
3.1 Hybrid System Case Studies
Although the combination of steel and wood in buildings is not as common as hybrid steel
and concrete, there are still some reported studies. Two such case studies are reviewed here,
Kanazawa M Building and Scotia Place.
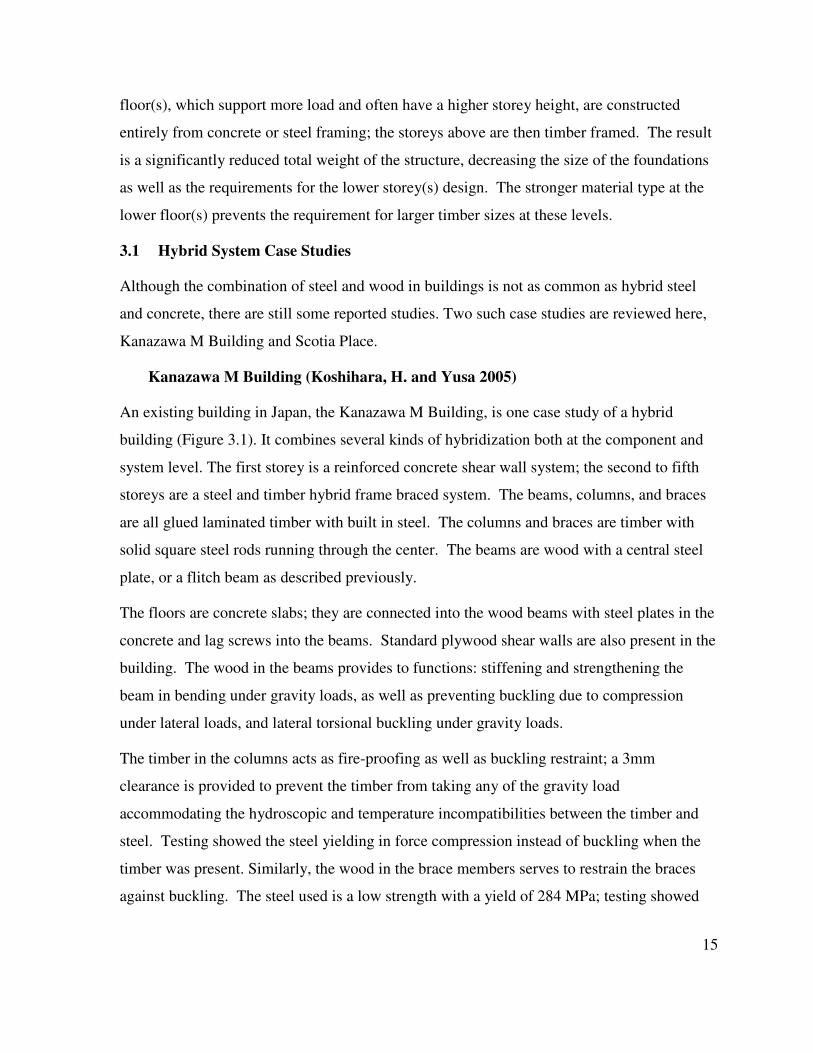
Kanazawa M Building (Koshihara, H. and Yusa 2005)
An existing building in Japan, the Kanazawa M Building, is one case study of a hybrid
building (Figure 3.1). It combines several kinds of hybridization both at the component and
system level. The first storey is a reinforced concrete shear wall system; the second to fifth
storeys are a steel and timber hybrid frame braced system. The beams, columns, and braces
are all glued laminated timber with built in steel. The columns and braces are timber with
solid square steel rods running through the center. The beams are wood with a central steel
plate, or a flitch beam as described previously.
The floors are concrete slabs; they are connected into the wood beams with steel plates in the
concrete and lag screws into the beams. Standard plywood shear walls are also present in the
building. The wood in the beams provides to functions: stiffening and strengthening the
beam in bending under gravity loads, as well as preventing buckling due to compression
under lateral loads, and lateral torsional buckling under gravity loads.
The timber in the columns acts as fire-proofing as well as buckling restraint; a 3mm
clearance is provided to prevent the timber from taking any of the gravity load
accommodating the hydroscopic and temperature incompatibilities between the timber and
steel. Testing showed the steel yielding in force compression instead of buckling when the
timber was present. Similarly, the wood in the brace members serves to restrain the braces
against buckling. The steel used is a low strength with a yield of 284 MPa; testing showed
16
the steel beginning to yield, along with some strength hardening. As the steel deformed, the
timber came in contact with jig and began to take axial load; as load increased, eventually the
timber cracked and buckled. The intent of the timber braced frame system is shown in
Figure 3.1
Figure 3.1: Brace Connection Schematic
The plywood shear walls in the other direction are constructed from 24mm plywood and
8mm diameter screws. The plywood was screwed to the timber in the hybrid columns and
beams. At the base of the second floor, the wall connects into the concrete. Here the shear is
transmitted through the screws into a wood sill which is then bolted to the concrete.
17
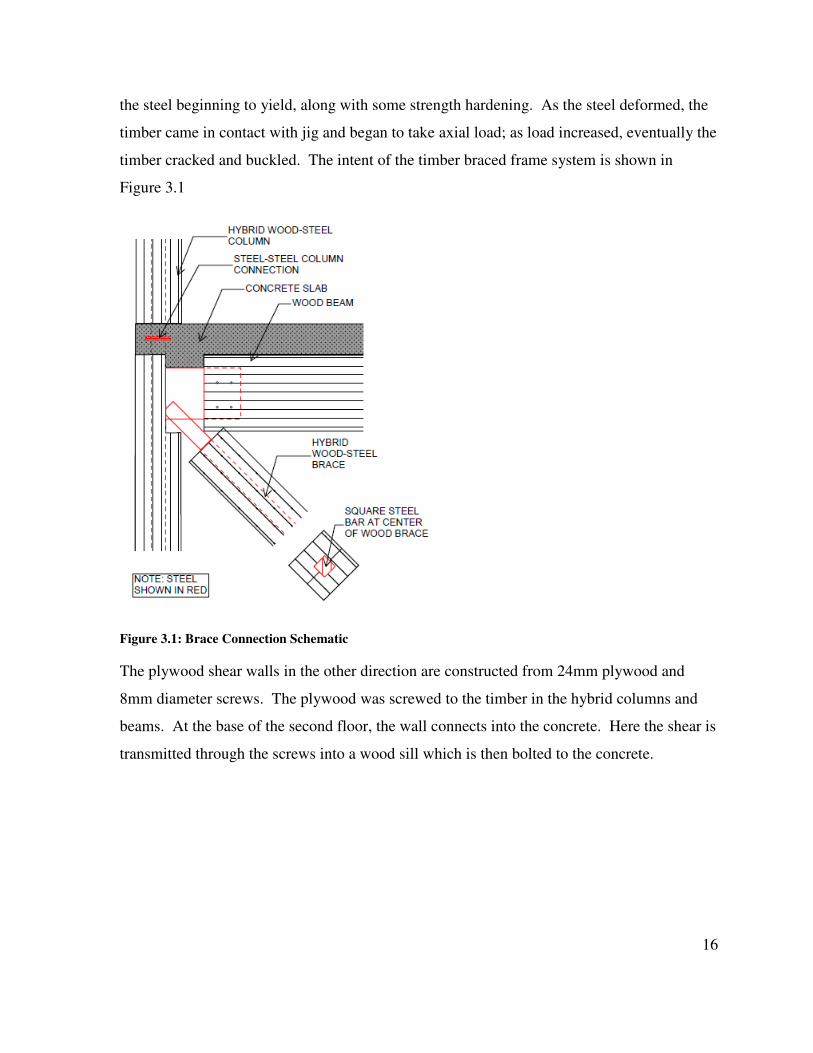
Scotia Place (Moore 2000)
This is a building In New Zealand constructed from steel concentrically braced frames and
wood floors on steel studs. The wood floor acts as the slab for gravity and diaphragm loads.
The vertical structural system in this building is purely a steel frame system. A schematic of
the wood deck at the primary steel framing members are shown in Figure 3.2.
Figure 3.2: Floor Assembly Schematic
The use of wood floors, managed to significantly reduce the weight of the building. This had
significant effect on the structure for both gravity and lateral load resistance. The steel
columns, concrete basement columns, and piles on which the building is supported were all
made smaller as a result of the use of wood floors instead of concrete. Further, the reduction
of weight in the structure resulted in the building frames being governed by wind loading.
Only the design of the wood diaphragm was governed by the seismic loading.
18
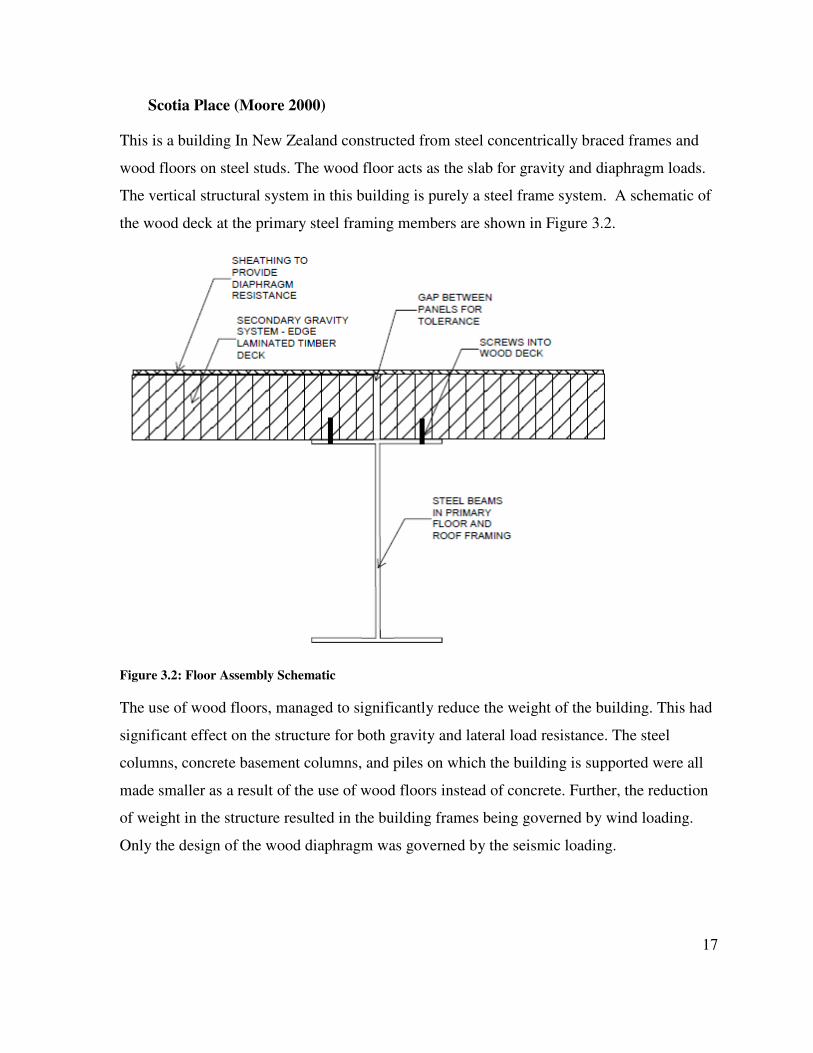
Quebec Six Storeys Hybrid Office Building (Mohammad, et al. 2011)
Building hybridization is the combination a different material system types within a building.
One example that has been constructed in Canada is a six storey hybrid building built in
Quebec. The system is heavy timber framing with concrete shear walls as shown in Figure
3.3.
Figure 3.3: Six Storey Wood and Concrete Hybrid Building Structure (Mohammad, et al. 2011)
This type of system has several advantages compared to an all concrete solution. The wood
framed solution is significantly lighter than a concrete column and slab. This will reduce the
total weight of the building, which will reduce the foundations and seismic design load (i.e.
requirements on the shear walls); often resulting in the building being governed by wind
design. Significant wind studies were done to determine the frequency and damping ratios of
the first three modes of vibrations.
Another important factor in the design was to prevent any issues due to the difference in
shrinkage between the heavy timber frame and the concrete cores. If shrinkage affects the
overall height of the timber frame, there would be a difference between the openings in the
elevator and stair cores, and the floor elevations. To prevent this, the timber frame was
designed with without any intermediate members between the columns. This effectively
prevents any tangential or radial shrinkage affecting the height of floor elevations. In other
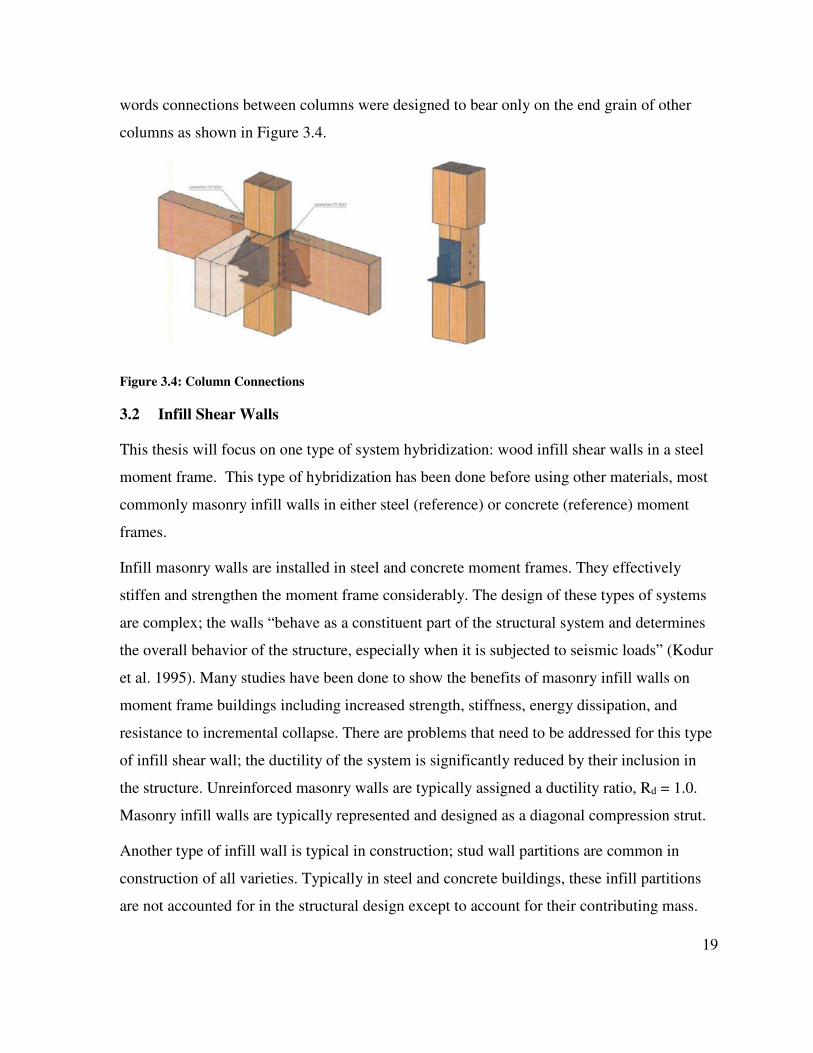
19
words connections between columns were designed to bear only on the end grain of other
columns as shown in Figure 3.4.
Figure 3.4: Column Connections
3.2 Infill Shear Walls
This thesis will focus on one type of system hybridization: wood infill shear walls in a steel
moment frame. This type of hybridization has been done before using other materials, most
commonly masonry infill walls in either steel (reference) or concrete (reference) moment
frames.
Infill masonry walls are installed in steel and concrete moment frames. They effectively
stiffen and strengthen the moment frame considerably. The design of these types of systems
are complex; the walls “behave as a constituent part of the structural system and determines
the overall behavior of the structure, especially when it is subjected to seismic loads” (Kodur
et al. 1995). Many studies have been done to show the benefits of masonry infill walls on
moment frame buildings including increased strength, stiffness, energy dissipation, and
resistance to incremental collapse. There are problems that need to be addressed for this type
of infill shear wall; the ductility of the system is significantly reduced by their inclusion in
the structure. Unreinforced masonry walls are typically assigned a ductility ratio, Rd = 1.0.
Masonry infill walls are typically represented and designed as a diagonal compression strut.
Another type of infill wall is typical in construction; stud wall partitions are common in
construction of all varieties. Typically in steel and concrete buildings, these infill partitions
are not accounted for in the structural design except to account for their contributing mass.
20
Steel frame structures are very flexible; the high comparative stiffness of the infill non-
structural partitions has been shown to have a significant impact on the seismic response of
the structures due to the high comparative stiffness of the infill partitions despite being non-
structural components. Yousuf and Bagchi’s (2009) study on the impact of non-structural
infill partition walls on ductile (type D) steel moment frames found that the impact of infill
partition walls results in decreased deflection and ductility in the structure. Further, hinging
occurred in the columns at locations other than their base. The study showed that it is
important to account effectively isolate non-structural partitions from moment frame system.
Alternatively, partitions could be designed as structural items accounting for the strength of
these walls and provide some guidelines on their constructions.
21
Chapter 4: Seismic Force Resisting System Design
Seismic force resisting system (SFRS) design is generally done in one of two ways: force
based design and displacement based design. Force based design quantifies maximum force
(base shear) at the base of the structure, and then distributes this along the height of the
building to determine the force at each storey, the storey shear; additionally the overturning
moments are determined. The building is then designed to resist these maximum shears and
moments. These forces are then reduced by the ductility and over strength factors. Force
based design is the most common approach used in design codes today.
Displacement based design, on the other hand, determines the maximum displacement that
the structure will observe and then design the structure to resist this either elastically or
plastically (Chopra 2011). Generally plastic design is used as this will dissipate energy
during a seismic event. This will result in much larger amounts of deformation; acceptability
criteria must then be assigned to estimate the amount of allowable damage that can occur
with the building maintaining its required performance. This type of design is much newer; it
is called performance based design and is only present in some design codes. In some cases,
performance based design is still combined with force based design to allow designers to use
familiar methods.
4.1 Ductility and Force Based Design
Design Codes generally use a force based approach in the design of SFRSs. This method
involves determining the force the system would experience if it were to remain elastic and
then reduce it by some factor accounting for ductility, redundancy, and overstrength
(Elnashai and Mwafy 2002).
The focus of this research is the National Building Code of Canada 2010 which divides these
into two factors: ductility factor (µ, Rd) and overstrength factor (Ω, Ro). The equivalent static
force procedure (NRC 2010) calculates the base shear () based on the elastic spectral
response adjusted by the ductility and overstrength factors as well as an importance factor
() and a factor to accound for higher mode effects () shown in equation (1).
22
= (1)
where the spectral acceleration is defined based on the sites soil factor (,) and the areas
response spectrum of the area at the buildings specific fundamental period ( . = < 0.5smin[ , ] 0.5s ≤ < 1.0s ≥ 1.0s # (2)
Mitchell et al. (2003) highlighted that the NBCC defines the system overstrength from a
combination of factors including overstrength of the yield strength of the system ($%), the
probable overstrength of the material (&), the overstrength due to strain hardening of the
material ('), and the redundancy of the collapse mechanism (()'), and the actual yield
to collapse overstrength (*+$,) which will be the focus of this paper.
= $%&+$,'()' (3)
FEMA P695 (2009) outlines a detailed procedure for the development of a systems
overstrength and ductility for the US design codes. The first factor Overstrength (Ω) is
defined as the ratio of the maximum base shear resistance (Vmax) and the design base shear
(V) (Applied Technology Council (ATC) 2009). The FEMA P695 overstrength corresponds
to the yield-collapse overstrength factor +$,:
- = *+$, = (. (4)
If we assume the system is efficiently designed, the frame yield would be the design strength
of the system. For this case we can take the design strength (V) as the yield strength (Vy).
Ductility (µ, Rd) is defined as the ratio between the ultimate roof drift (δu) and the yield roof
drift (δy):
23
/ = = 010+ (5)
Two important yield points are important for assessing the ductility factors: the point at
which first yield occurs, and the point at which the system shows the first indication of
failure. The first yield point is determined by the first sign of local yielding anywhere in the
SFRS. The ultimate roof drift is determined as the point where the system has had a 20%
strength loss, which could be considered failure. Failure is the “near collapse” states, or the
state where the system is no longer stable. Often failure is take as a strength reduction 10%
from the ultimate strength (Applied Technology Council (ATC) 2009)
The NBCC 2005 breaks down ductility levels into 4 simple types, Ductile (D), Moderately
Ductile (MD), Limited Ductility (LD), and Conventional Construction (CC). Higher ductility
levels have more requirements for detailing as well as member sizes and plastic deformation
locations. Further, different SFRS types provide different ductility values (Rd) at each level;
each system and ductility type specifies detailing and hinge formation requirements to
achieve specific ductility and overstrength values.
Table 4.1: Steel Ductility and Overstrength Information
Frame Ductility Type Symbol Moment Frame Braced Frame
Rd Ro Rd Ro
Ductile D 5.0 1.5 4.0 1.5
Moderate Ductility MD 3.5 1.5 3.0 1.3
Limited Ductility LD 2.0 1.3 2.0 1.3
Conventional Construction CC 1.5 1.3 1.5 1.3
Systems with high ductility factors have more specific requirements including which
members will yield and where yielding will occur, this generally results in rigorous detailing
(Elnashai and Mwafy 2002).
4.2 Performance Design
Performance design is based on assigning different performance criteria for different event
probabilities. The NBCC 2005 requires design for a seismic event with a 2% in 50 year
probability of occurrence (a 2500 year return period). It requires a “life safety” design and
provides some guidance on interstorey drift limits. Unfortunately no guidance is provided for
24
other performance levels in the NBCC 2005. ASCE 41 Seismic Rehabilitation of Existing
Buildings provides guidance for performance based design. It provides acceptance criteria for
plastic deformation for different target performance levels: operational, immediate
occupancy, life safety, and collapse. A variety of design seismic events are used: frequent
(50% in 50 years), occasional (20% in 50 years), rare event (10% in 50 years), and the basic
safety objective (BSO) similar to the NBCC 2005 (2% in 50 years). Typically the rare and
the BSO events correspond to the life safety and collapse performance levels, respectively;
buildings with further requirements frequently check both the frequent and occasional events
against the operational and immediate occupancy performance levels.
25
Chapter 5: Methodology
This study will look at steel moment frames designed for a variety of ductility levels and
compare the behavior to similar frames with the addition of crossed laminated timber (CLT)
infill, as a shear wall. This type of frame system is like a hybrid of an infill shear walls
system and a steel plate wall system. Similar to an infill wall system, the walls will act
primarily in compression although hybrid wood and steel infill wall systems would not
provide the stiffness of a masonry infill wall but has the advantage of significantly less added
weight to the system. The CLT infill is connected to the frame on all sides with connectors,
instead of with only the confinement of the frame itself. Also, the wall is susceptible to
buckling, although the buckling strength of the wall is much larger than a steel plate wall;
energy is dissipated through methods other than buckling of the shear wall. Through the use
of CLT shear walls we can obtain a stiffness much great than that of typical OSB or plywood
shear walls.
5.1 Sample Structure
The system of interest is conceived as a steel frame with a CLT shear wall placed in the plane
of the moment frame. The CLT walls are connected to the steel frame with steel brackets
that are nailed to the CLT shear walls and bolted to the steel frame. There would be some
inevitable gap between the edge of the CLT wall and the steel members to allow for
construction tolerances and potential hysteretic behavior of the brackets. The panels in this
study are intended to be one solid panel within each frame bay, as oppose to multiple panels
able to move relative to one another.
Several models will be developed to perform a parametric study on wood and steel hybrid
infill wall systems. Using a single bay frame model, the parametric studies that will be
undertaken for infill system are:
• the effect of frame design (design ductility levels),
• infill configuration (number of infilled bays)
• building height
26
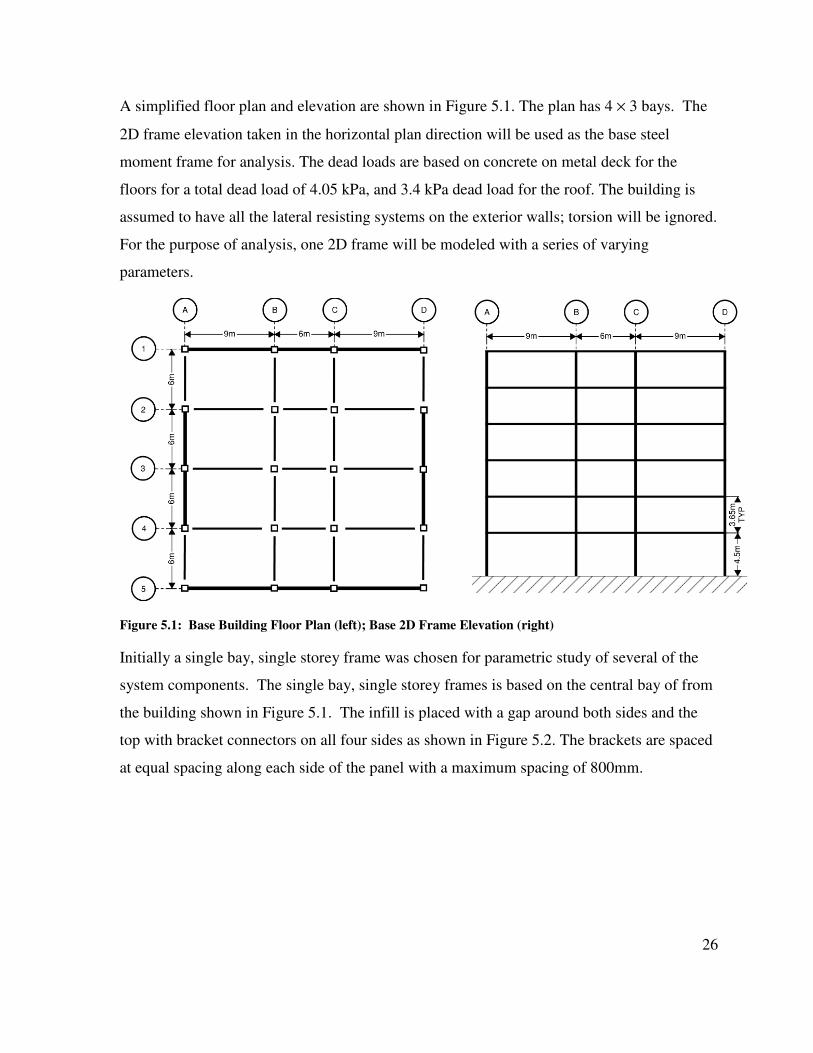
A simplified floor plan and elevation are shown in Figure 5.1. The plan has 4 × 3 bays. The
2D frame elevation taken in the horizontal plan direction will be used as the base steel
moment frame for analysis. The dead loads are based on concrete on metal deck for the
floors for a total dead load of 4.05 kPa, and 3.4 kPa dead load for the roof. The building is
assumed to have all the lateral resisting systems on the exterior walls; torsion will be ignored.
For the purpose of analysis, one 2D frame will be modeled with a series of varying
parameters.
Figure 5.1: Base Building Floor Plan (left); Base 2D Frame Elevation (right)
Initially a single bay, single storey frame was chosen for parametric study of several of the
system components. The single bay, single storey frames is based on the central bay of from
the building shown in Figure 5.1. The infill is placed with a gap around both sides and the
top with bracket connectors on all four sides as shown in Figure 5.2. The brackets are spaced
at equal spacing along each side of the panel with a maximum spacing of 800mm.
27
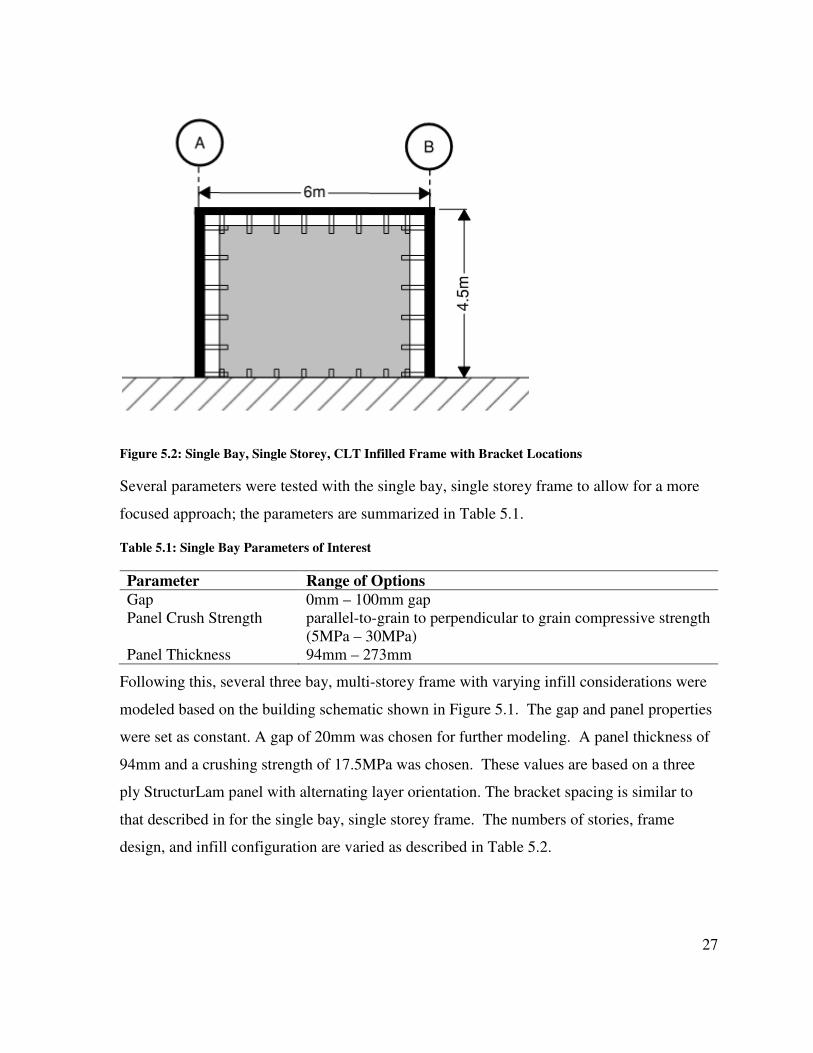
Figure 5.2: Single Bay, Single Storey, CLT Infilled Frame with Bracket Locations
Several parameters were tested with the single bay, single storey frame to allow for a more
focused approach; the parameters are summarized in Table 5.1.
Table 5.1: Single Bay Parameters of Interest
Parameter Range of Options
Gap 0mm – 100mm gap
Panel Crush Strength parallel-to-grain to perpendicular to grain compressive strength
(5MPa – 30MPa)
Panel Thickness 94mm – 273mm
Following this, several three bay, multi-storey frame with varying infill considerations were
modeled based on the building schematic shown in Figure 5.1. The gap and panel properties
were set as constant. A gap of 20mm was chosen for further modeling. A panel thickness of
94mm and a crushing strength of 17.5MPa was chosen. These values are based on a three
ply StructurLam panel with alternating layer orientation. The bracket spacing is similar to
that described in for the single bay, single storey frame. The numbers of stories, frame
design, and infill configuration are varied as described in Table 5.2.
28
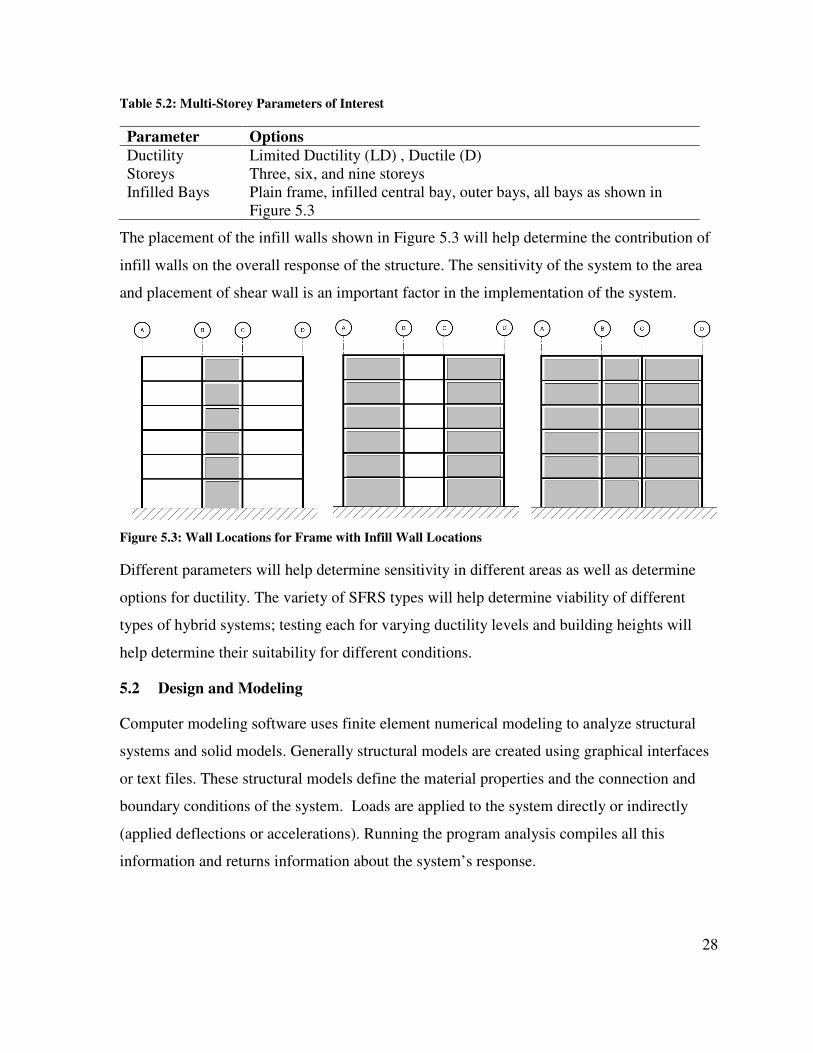
Table 5.2: Multi-Storey Parameters of Interest
Parameter Options
Ductility Limited Ductility (LD) , Ductile (D)
Storeys Three, six, and nine storeys
Infilled Bays Plain frame, infilled central bay, outer bays, all bays as shown in
Figure 5.3
The placement of the infill walls shown in Figure 5.3 will help determine the contribution of
infill walls on the overall response of the structure. The sensitivity of the system to the area
and placement of shear wall is an important factor in the implementation of the system.
Figure 5.3: Wall Locations for Frame with Infill Wall Locations
Different parameters will help determine sensitivity in different areas as well as determine
options for ductility. The variety of SFRS types will help determine viability of different
types of hybrid systems; testing each for varying ductility levels and building heights will
help determine their suitability for different conditions.
5.2 Design and Modeling
Computer modeling software uses finite element numerical modeling to analyze structural
systems and solid models. Generally structural models are created using graphical interfaces
or text files. These structural models define the material properties and the connection and
boundary conditions of the system. Loads are applied to the system directly or indirectly
(applied deflections or accelerations). Running the program analysis compiles all this
information and returns information about the system’s response.
29
Modeling structural frames to determine the seismic response requires non-linear analysis
with either static, dynamic, or response spectrum analysis. Non-linear modeling in a frame is
accomplished generally by creating linear members with plastic hinges at locations of
interest. Alternately, all the members could be given non-linear material properties and an
appropriate mesh to determine the locations of hinging. Meshing is very important for the
implementation of plastic hinges in a frame; different numerical model methods average the
plastic deformation over each segment of the mesh. Further, meshing across the section of
the element is important; outside flanges of an element may act plastically with the interior
remaining elastic. Discrete plastic hinges avoid this by simply providing a force or moment
at which plastic yielding begins and after this moment is reached a stiffness that accounts for
the section shape and elasto-plastic behavior. Additionally, plastic hinges allow for faster
analysis.
A detailed discussion on the numerical procedure of the finite element methods used in
different modeling programs is not in the scope of this paper (give some basic references,
books). A brief overview of the abilities of the modeling programs used is provided.
Information about the types of materials and members is given as well as a review of the
analysis options offered.
5.2.1 OpenSees
OpenSees is an open source, finite element software packed intended for dynamic analysis
created by the Pacific Earthquake Engineering (PEER) center. The program allows for the
analysis of structures and geotechnical systems under dynamic loading; it is intended to
evaluate the response of structures subjected to earthquakes. It consists of modules
developed to create materials and elements, assign loads or accelerations, and perform
analyses. The user has significant control over the behavior of the materials and can create
their own modules for material or element types if none are present that meet their needs.
Further, substantial control is available to over the type of algorithms and integrators to use
during analysis. The flexibility often allows for faster analysis, but can result in more
numerical instability during analysis; results must be checked to avoid instability.
30
OpenSees is capable of three general types of analysis: static, transient, and variable
transient. The only difference between transient loading and variable transient loading is that
variable transient loading allows for a variable time step. Static loading can be either
constant, for a constant load or displacement, or linear, for a linearly increasing load or
displacement. Many more options exist for transient loading including multiple cyclic
loading types, pulses, or time-acceleration files, such as ground motions.
OpenSees is primarily a text based program using the programming language, Tcl/Tk with no
graphical interface. The text based approach to this program makes it significantly less user
friendly compared to commercial programs like SAP2000 or RFEM, but allow for a more
parametric approach. Models can be created in a loop with one or more variables changing
with each run. Graphical User Interfaces (GUIs) have been created for OpenSees, such as
OpenSees Navigator, but don’t provide the same kind of parametric abilities that the text
implementation allows, and often don’t allow the same level of control over output as well as
the full spectrum of material and element types.
5.2.2 Frame Design and Modeling
The steel frames at three, six, and nine storeys are designed to meet an equivalent static load
associated with a combined RdRo of 3.0 based on testing done at FPInnovations, Rd of 2.0
and Ro of 1.5 are conservative estimates for CLT structures with nailed and screw
connections (Popovski and Karacabeyli, 2011). The frames are also designed to meet the
requirements for a ductile (type D) ductility moment frame and a limited ductility (type LD)
as specified in the CSA S16 code (CSA-S16, 2009). The resultant frames different initial
stiffness and system ductility; the stiffer frame meets the requirements of a ductile (type D)
moment frame, the more flexible and weaker system meets the requirements of a limited
ductility (type LD) moment frame. The members are shown in Appendix A.
The system will be modeled using OpenSees. The frame members are modeled as a
combination of non-linear displacement based beam columns and linear elastic beam column
elements; the linear beam column elements for the center of the frame member with the non-
linear beam column elements located at the ends of the member in the plastic hinge zones.
The material property for the non-linear element is a bilinear material property based on the
31
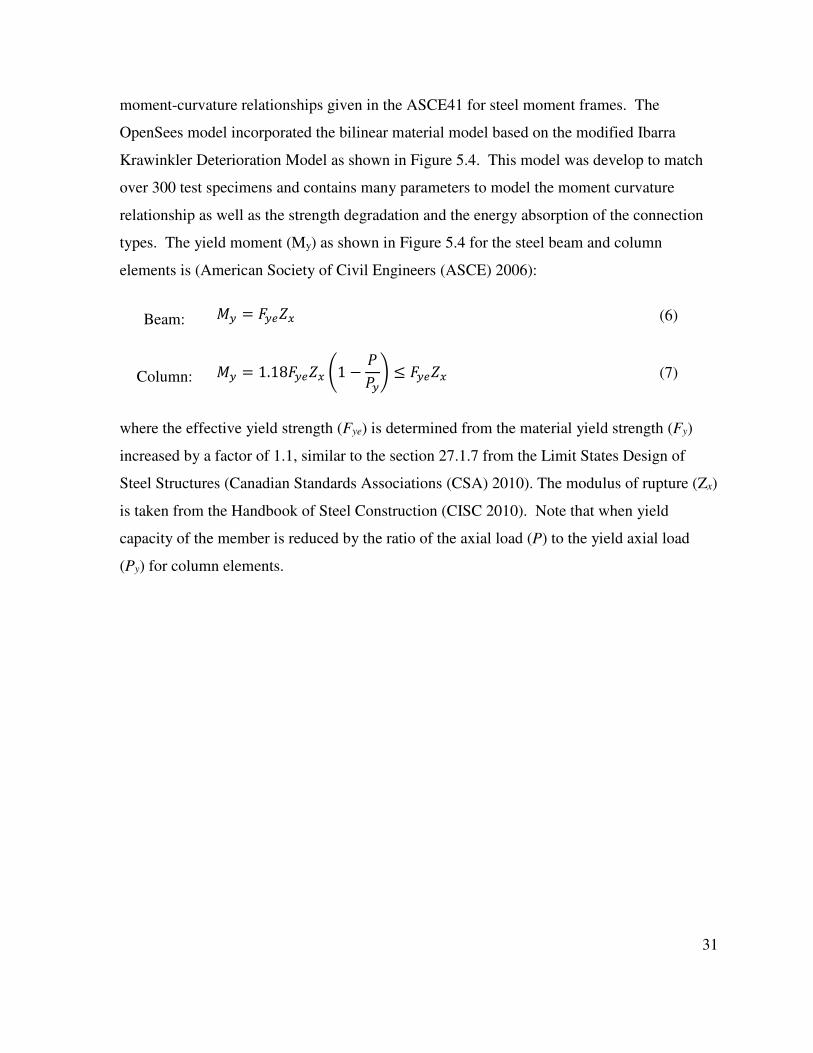
moment-curvature relationships given in the ASCE41 for steel moment frames. The
OpenSees model incorporated the bilinear material model based on the modified Ibarra
Krawinkler Deterioration Model as shown in Figure 5.4. This model was develop to match
over 300 test specimens and contains many parameters to model the moment curvature
relationship as well as the strength degradation and the energy absorption of the connection
types. The yield moment (My) as shown in Figure 5.4 for the steel beam and column
elements is (American Society of Civil Engineers (ASCE) 2006):
Beam: + = +2. (6)
Column: + = 1.18+2. 41 − 66+7 ≤ +2. (7)
where the effective yield strength (Fye) is determined from the material yield strength (Fy)
increased by a factor of 1.1, similar to the section 27.1.7 from the Limit States Design of
Steel Structures (Canadian Standards Associations (CSA) 2010). The modulus of rupture (Zx)
is taken from the Handbook of Steel Construction (CISC 2010). Note that when yield
capacity of the member is reduced by the ratio of the axial load (P) to the yield axial load
(Py) for column elements.
32
Figure 5.4: Modified Ibarra Krawinkler Deterioration Model for BILIN Material in OPENSEES (Lignos
and Krawinkler 2011)
The rotation at yield (θy) is taken as shown in equations 6 and 7 (American Society of Civil
Engineers (ASCE) 2006).The yield rotation is dependent on the length of the member (L) as
well as the moment of inertia (Ix) and the elastic modulus of the steel (E), taken as 200,000
MPa. The yield rotation for columns is reduced as a result of axial load, similar to the
moment capacity. The behavior past yield is defined based on the hinge requirements
(American Society of Civil Engineers (ASCE) 2006).
The plastic rotations are determined based on the class of the sections, with an upper bound
set similar to a class 1 section and a lower bound set by class 3 section (Canadian Standards
Associations (CSA) 2010). The definitions are shown in Table 5.3.
33
Table 5.3: Rotation Requirements for Plastic Hinges (American Society of Civil Engineers (ASCE) 2006)
a b c B
eam
Upper bound: 82: ≤ 52;+ and
<= ≤ 418;+ 9@+ 11@+ 0.6
Lower bound: 82: ≤ 65;+ and
<= ≤ 640;+ 4@+ 6@+ 0.2
Co
lum
n
Upper bound: 82: ≤ 52;+ and
<= ≤ 300;+ 9@+ 11@+ 0.6
Lower bound: 82: ≤ 65;+ and
<= ≤ 460;+ 4@+ 6@+ 0.2
5.2.3 Wall Design and Modeling
CLT was implemented in the models as a linear elastic shell element. Previous analytical
studies on CLT walls used rigid elements, or linear elastic shell elements. The CLT panels
were based on the panels produced by StructureLam (StructurLam n.d.). These panels are
produced from Spruce-Pine-Fir (SPF), often using timber affected by the pine beetle; the
properties used are shown in Table 5.4.
Table 5.4: CLT Material Properties (Structurlam n.d.)
Material properties Design Values
Elastic Modulus (E) 9500 MPa
Shear Strength (Fv) 1.5 MPa
Compression Strength (Fc) 30.0 MPa
Compression Strength Perp-to-Grain (Fcb) 5.0MPa
Poisson’s ratio 0.46
The walls are modeled as 3 ply panels with 33mm laminae, providing an overall panel
thickness of 99mm. In this study, the panels were simplified to a single 99mm panel element
with isotropic properties.
The OpenSees model used Quad elements, elements are intended to carry stresses in the
plane of the panel only, and are therefore appropriate for this type of model. The quad
elements are intended for thin-plate shear element using a bilinear isoparametric formulation.
It is defined by four nodes at each corner and an element thickness and a predefined material.
Modeling of the walls uses shell elements with simplified strength and stiffness properties in
each direction. The material applied to the quad elements was the ndMaterial
34
ElasticIsotropic. As the material name implies, the behavior of the material is both elastic
and isotropic. The use of linear elastic material, or even rigid panels in previous studies
justifies this simplification in the analysis.
5.2.4 Connection Design and Modeling
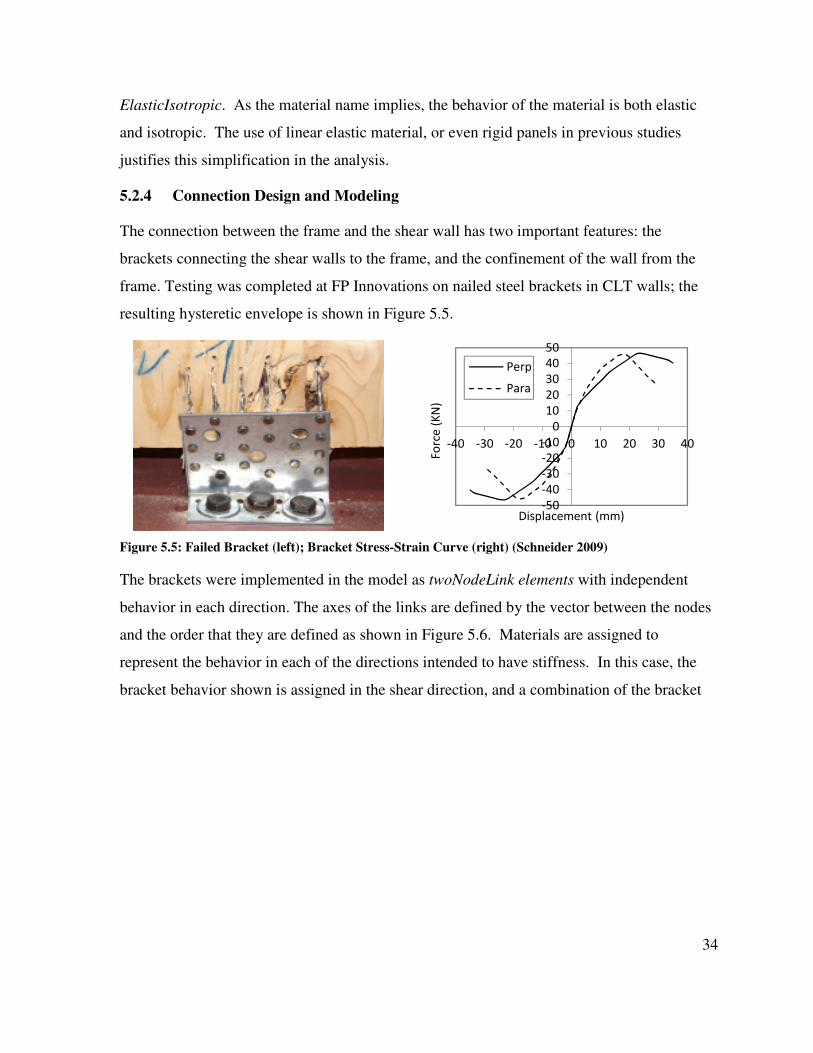
The connection between the frame and the shear wall has two important features: the
brackets connecting the shear walls to the frame, and the confinement of the wall from the
frame. Testing was completed at FP Innovations on nailed steel brackets in CLT walls; the
resulting hysteretic envelope is shown in Figure 5.5.
Figure 5.5: Failed Bracket (left); Bracket Stress-Strain Curve (right) (Schneider 2009)
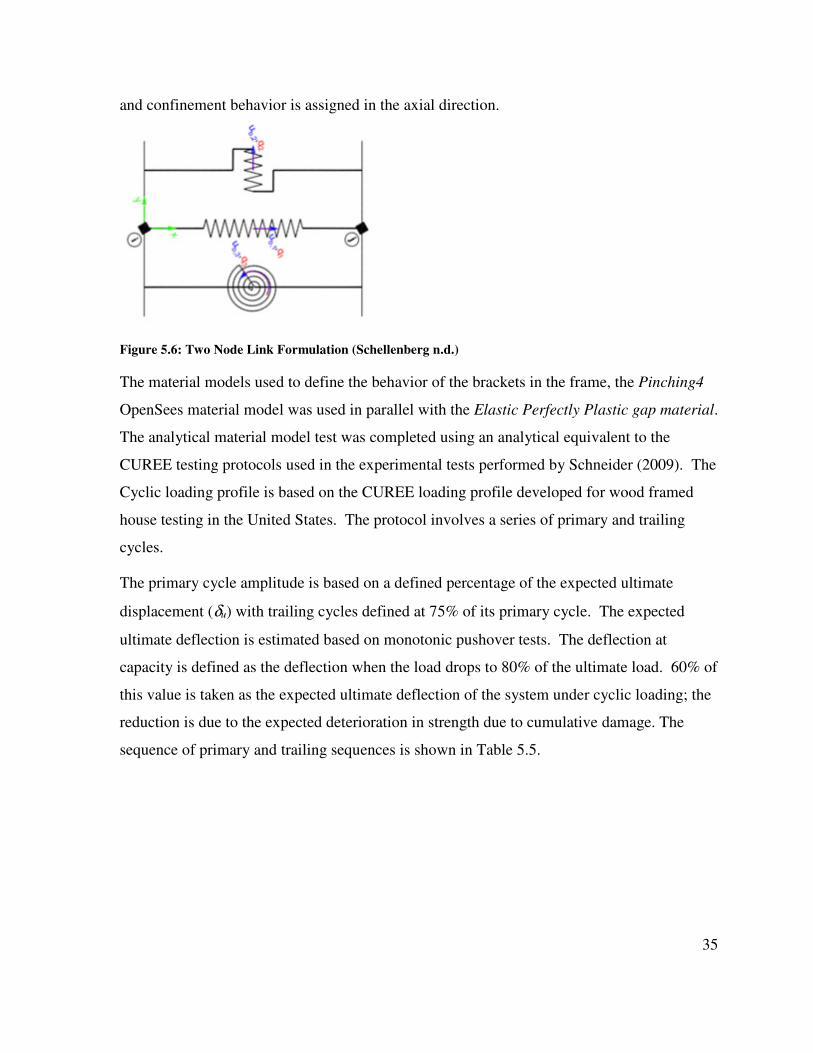
The brackets were implemented in the model as twoNodeLink elements with independent
behavior in each direction. The axes of the links are defined by the vector between the nodes
and the order that they are defined as shown in Figure 5.6. Materials are assigned to
represent the behavior in each of the directions intended to have stiffness. In this case, the
bracket behavior shown is assigned in the shear direction, and a combination of the bracket
-50
-40
-30
-20
-10
0
10
20
30
40
50
-40 -30 -20 -10 0 10 20 30 40F
orc
e (
KN
)
Displacement (mm)
Perp
Para
35
and confinement behavior is assigned in the axial direction.
Figure 5.6: Two Node Link Formulation (Schellenberg n.d.)
The material models used to define the behavior of the brackets in the frame, the Pinching4
OpenSees material model was used in parallel with the Elastic Perfectly Plastic gap material.
The analytical material model test was completed using an analytical equivalent to the
CUREE testing protocols used in the experimental tests performed by Schneider (2009). The
Cyclic loading profile is based on the CUREE loading profile developed for wood framed
house testing in the United States. The protocol involves a series of primary and trailing
cycles.
The primary cycle amplitude is based on a defined percentage of the expected ultimate
displacement (δu) with trailing cycles defined at 75% of its primary cycle. The expected
ultimate deflection is estimated based on monotonic pushover tests. The deflection at
capacity is defined as the deflection when the load drops to 80% of the ultimate load. 60% of
this value is taken as the expected ultimate deflection of the system under cyclic loading; the
reduction is due to the expected deterioration in strength due to cumulative damage. The
sequence of primary and trailing sequences is shown in Table 5.5.
36
Table 5.5: Amplitude for Semi-static Cyclic CUREE Protocol
Step No. of Primary Cycles Primary Amplitude (%CD) No. of Trailing Cycles
1 6 5% -
2 1 7.5% 6
3 1 10% 6
4 1 20% 3
5 1 30% 3
6 1 40% 2
7 1 70% 2
8 1 100% 2
9 1 120% 2
10 1 140% 2
11 1 Step 10 + 20% until failure 2
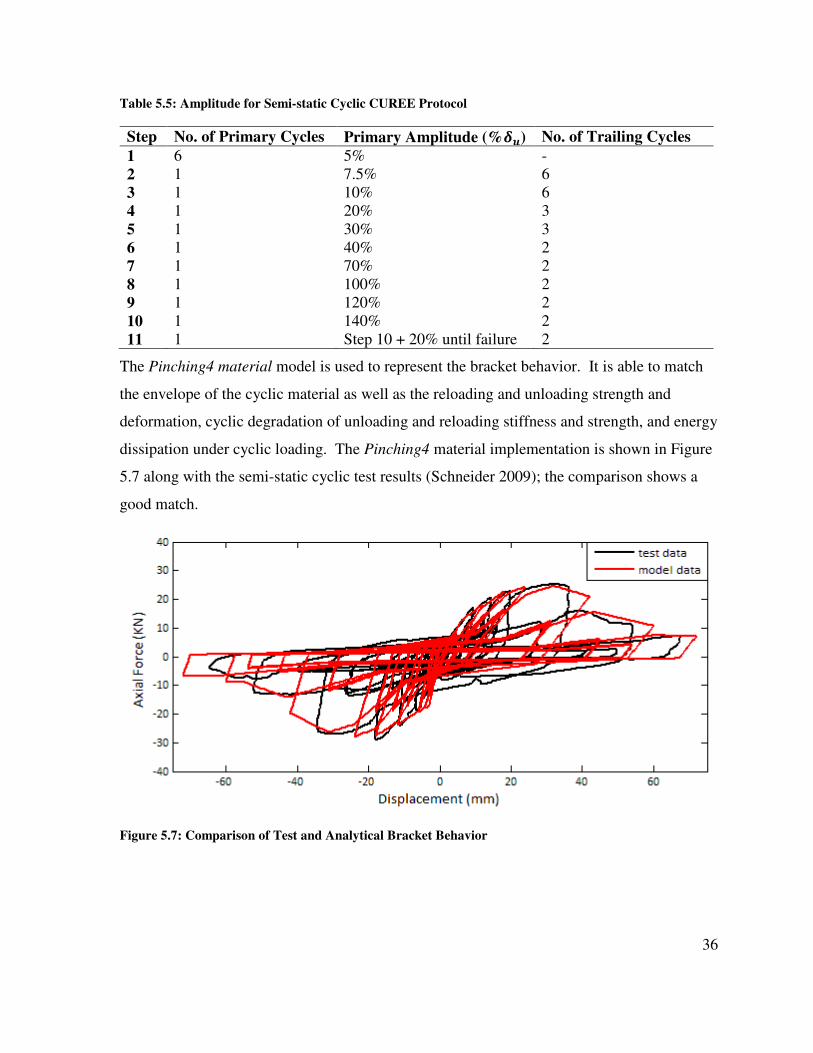
The Pinching4 material model is used to represent the bracket behavior. It is able to match
the envelope of the cyclic material as well as the reloading and unloading strength and
deformation, cyclic degradation of unloading and reloading stiffness and strength, and energy
dissipation under cyclic loading. The Pinching4 material implementation is shown in Figure
5.7 along with the semi-static cyclic test results (Schneider 2009); the comparison shows a
good match.
Figure 5.7: Comparison of Test and Analytical Bracket Behavior
37
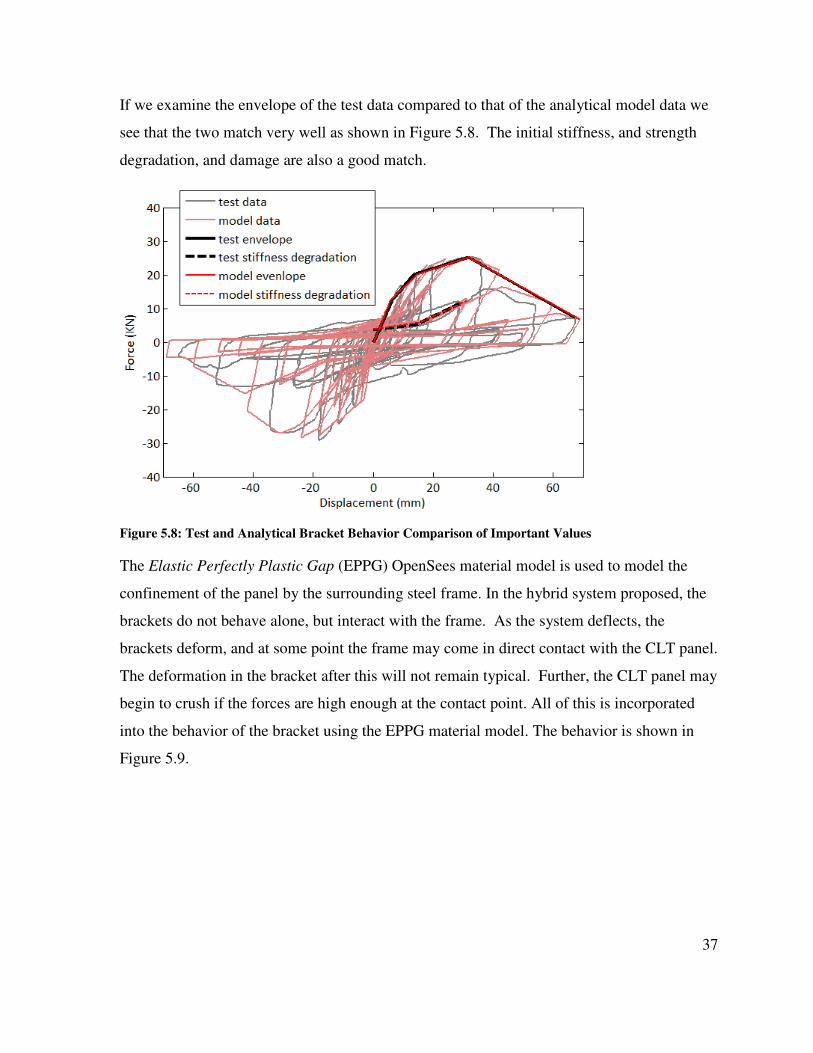
If we examine the envelope of the test data compared to that of the analytical model data we
see that the two match very well as shown in Figure 5.8. The initial stiffness, and strength
degradation, and damage are also a good match.
Figure 5.8: Test and Analytical Bracket Behavior Comparison of Important Values
The Elastic Perfectly Plastic Gap (EPPG) OpenSees material model is used to model the
confinement of the panel by the surrounding steel frame. In the hybrid system proposed, the
brackets do not behave alone, but interact with the frame. As the system deflects, the
brackets deform, and at some point the frame may come in direct contact with the CLT panel.
The deformation in the bracket after this will not remain typical. Further, the CLT panel may
begin to crush if the forces are high enough at the contact point. All of this is incorporated
into the behavior of the bracket using the EPPG material model. The behavior is shown in
Figure 5.9.
38
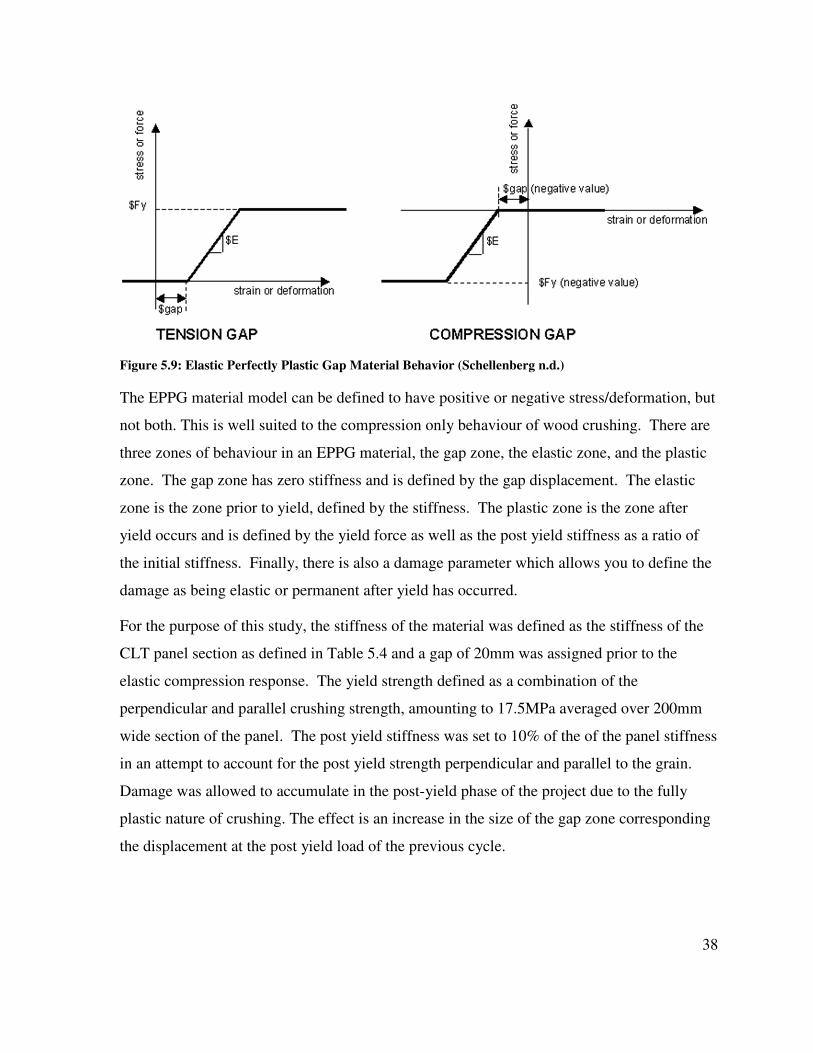
Figure 5.9: Elastic Perfectly Plastic Gap Material Behavior (Schellenberg n.d.)
The EPPG material model can be defined to have positive or negative stress/deformation, but
not both. This is well suited to the compression only behaviour of wood crushing. There are
three zones of behaviour in an EPPG material, the gap zone, the elastic zone, and the plastic
zone. The gap zone has zero stiffness and is defined by the gap displacement. The elastic
zone is the zone prior to yield, defined by the stiffness. The plastic zone is the zone after
yield occurs and is defined by the yield force as well as the post yield stiffness as a ratio of
the initial stiffness. Finally, there is also a damage parameter which allows you to define the
damage as being elastic or permanent after yield has occurred.
For the purpose of this study, the stiffness of the material was defined as the stiffness of the
CLT panel section as defined in Table 5.4 and a gap of 20mm was assigned prior to the
elastic compression response. The yield strength defined as a combination of the
perpendicular and parallel crushing strength, amounting to 17.5MPa averaged over 200mm
wide section of the panel. The post yield stiffness was set to 10% of the of the panel stiffness
in an attempt to account for the post yield strength perpendicular and parallel to the grain.
Damage was allowed to accumulate in the post-yield phase of the project due to the fully
plastic nature of crushing. The effect is an increase in the size of the gap zone corresponding
the displacement at the post yield load of the previous cycle.
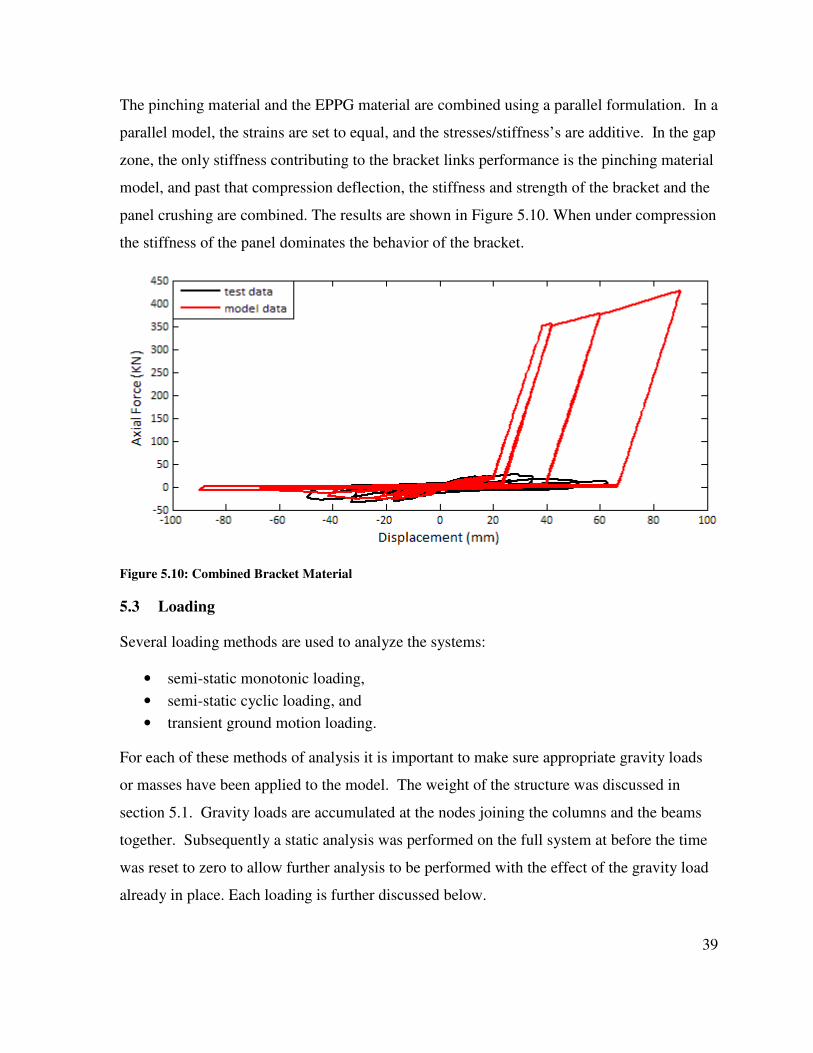
39
The pinching material and the EPPG material are combined using a parallel formulation. In a
parallel model, the strains are set to equal, and the stresses/stiffness’s are additive. In the gap
zone, the only stiffness contributing to the bracket links performance is the pinching material
model, and past that compression deflection, the stiffness and strength of the bracket and the
panel crushing are combined. The results are shown in Figure 5.10. When under compression
the stiffness of the panel dominates the behavior of the bracket.
Figure 5.10: Combined Bracket Material
5.3 Loading
Several loading methods are used to analyze the systems:
• semi-static monotonic loading,
• semi-static cyclic loading, and
• transient ground motion loading.
For each of these methods of analysis it is important to make sure appropriate gravity loads
or masses have been applied to the model. The weight of the structure was discussed in
section 5.1. Gravity loads are accumulated at the nodes joining the columns and the beams
together. Subsequently a static analysis was performed on the full system at before the time
was reset to zero to allow further analysis to be performed with the effect of the gravity load
already in place. Each loading is further discussed below.
40
5.3.1 Semi-Static Monotonic Analysis
Monotonic or Pushover analysis is when a point load, series of point loads along the height
of the structure, distributed load over the height of the structure is applied. The load(s) is
then increased linearly and the deflection of the structure is measured. The choice of load
application shape is very important. Generally for multi-storey buildings point loads are
applied at each floor/roof level. The scale of each load is important and creates what is
called the load shape. There are several different load shapes frequently used in pushover
analysis including: uniform distribution, inverted triangular distribution, first mode shape
distribution, and code static earthquake load distribution. In some cases, the load shape is
adapted as the structure moves into the plastic range and the effective period of the structure
begins to change. The load shape has increasing importance for tall buildings as higher
modes have a larger effect on their seismic response.
For the purpose of this study, the code static equivalent load distribution described in Chapter
4 will be used. This is based on an inverted triangular distribution with additional load
placed at the top of the structure in an effort to account for the typical form of the first mode
shape. This simple distribution should be sufficient given the buildings on which the frames
are based are a maximum of nine storeys.
5.3.2 Semi-static Cyclic Analysis
Semi static cyclic tests are generally performed to help to determine the hysteretic behavior
of the test subject. This can be used to determine the elastic and inelastic properties of the
element or system which may be used to help determine the seismic behavior. The semi-
static cyclic analysis performed is based on the ISO protocol. The cyclic displacement is
based on a series of reversed cycles are determined based on the predicted ultimate
displacement (01), usually obtained from a static monotonic pushover test. The peak
displacement at each cycle is defined as a percentage of the predicted ultimate displacement a
shown in Table 5.6.
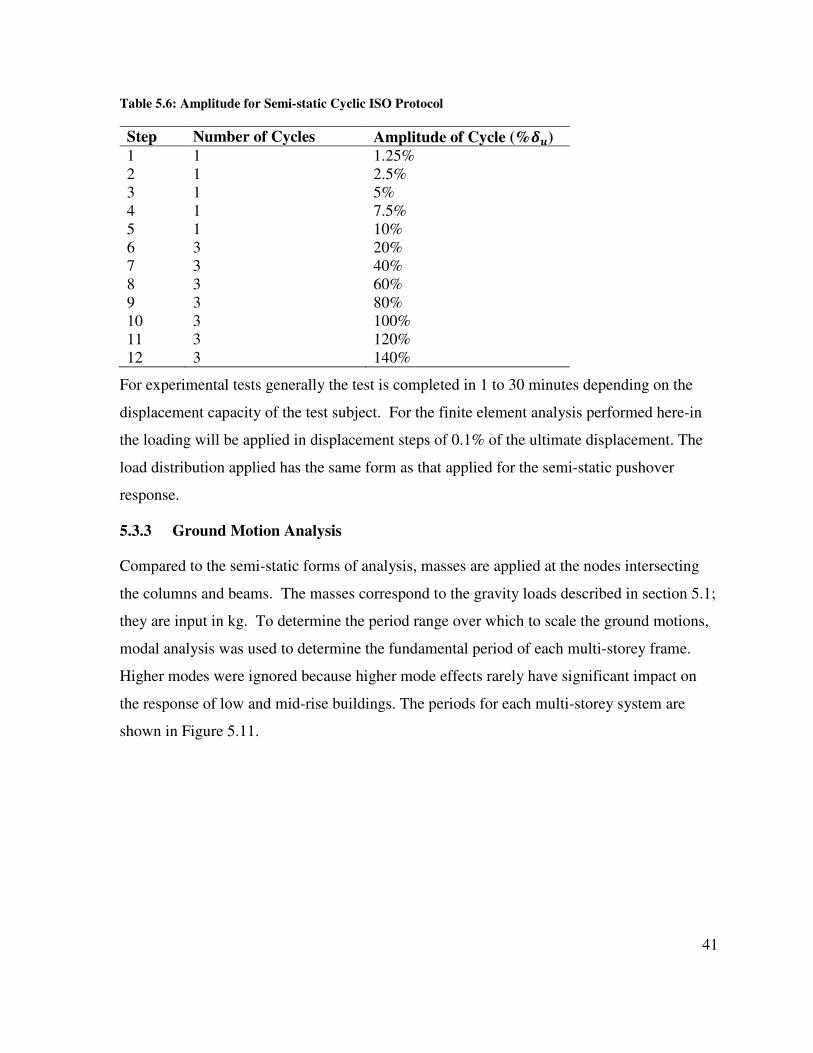
41
Table 5.6: Amplitude for Semi-static Cyclic ISO Protocol
Step Number of Cycles Amplitude of Cycle (%CD)
1 1 1.25%
2 1 2.5%
3 1 5%
4 1 7.5%
5 1 10%
6 3 20%
7 3 40%
8 3 60%
9 3 80%
10 3 100%
11 3 120%
12 3 140%
For experimental tests generally the test is completed in 1 to 30 minutes depending on the
displacement capacity of the test subject. For the finite element analysis performed here-in
the loading will be applied in displacement steps of 0.1% of the ultimate displacement. The
load distribution applied has the same form as that applied for the semi-static pushover
response.
5.3.3 Ground Motion Analysis
Compared to the semi-static forms of analysis, masses are applied at the nodes intersecting
the columns and beams. The masses correspond to the gravity loads described in section 5.1;
they are input in kg. To determine the period range over which to scale the ground motions,
modal analysis was used to determine the fundamental period of each multi-storey frame.
Higher modes were ignored because higher mode effects rarely have significant impact on
the response of low and mid-rise buildings. The periods for each multi-storey system are
shown in Figure 5.11.
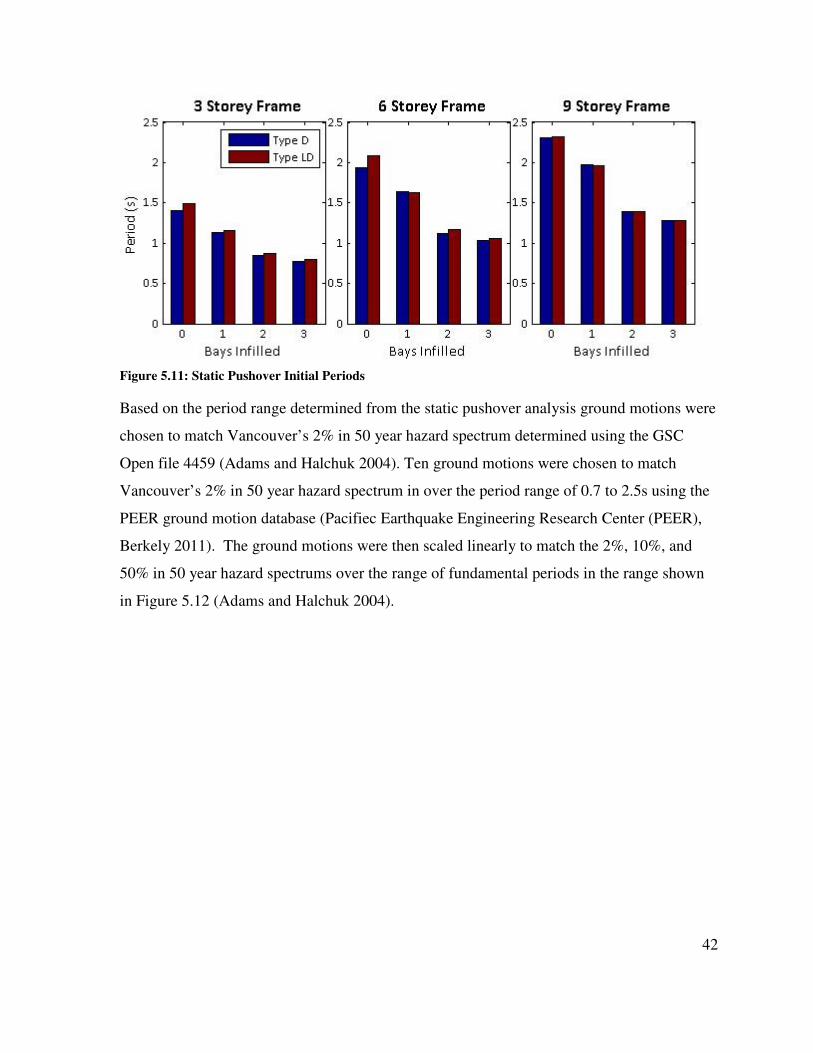
42
Figure 5.11: Static Pushover Initial Periods
Based on the period range determined from the static pushover analysis ground motions were
chosen to match Vancouver’s 2% in 50 year hazard spectrum determined using the GSC
Open file 4459 (Adams and Halchuk 2004). Ten ground motions were chosen to match
Vancouver’s 2% in 50 year hazard spectrum in over the period range of 0.7 to 2.5s using the
PEER ground motion database (Pacifiec Earthquake Engineering Research Center (PEER),
Berkely 2011). The ground motions were then scaled linearly to match the 2%, 10%, and
50% in 50 year hazard spectrums over the range of fundamental periods in the range shown
in Figure 5.12 (Adams and Halchuk 2004).
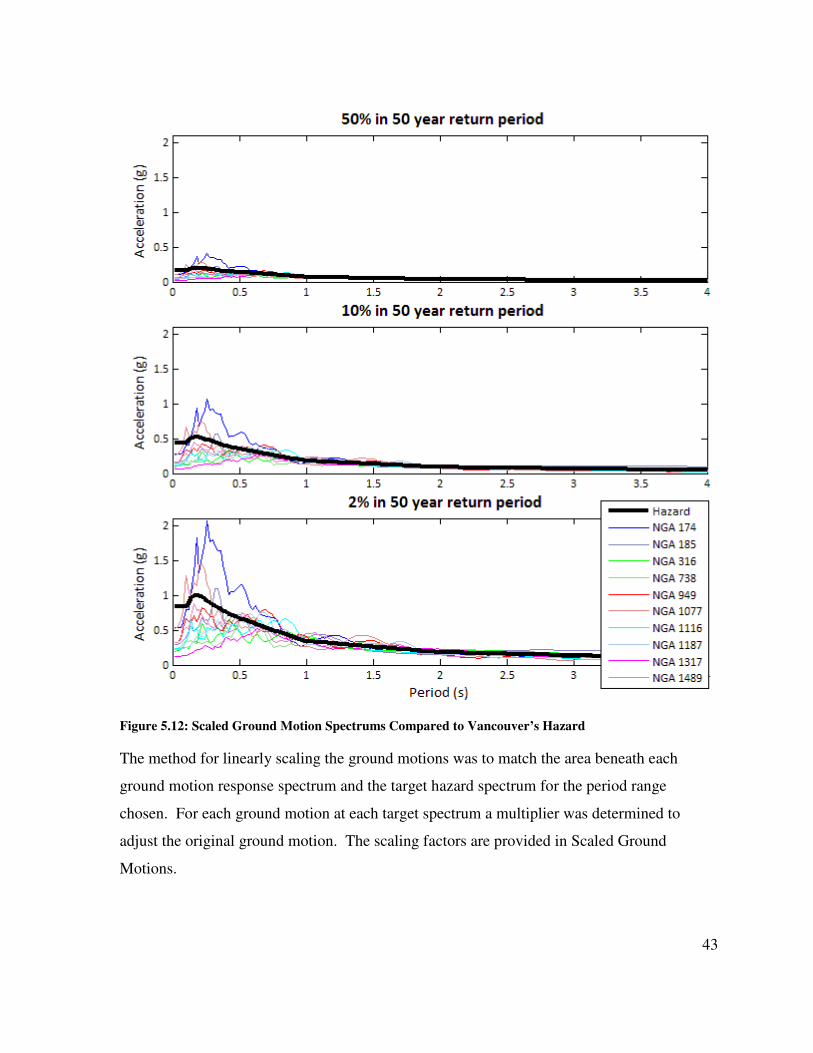
43
Figure 5.12: Scaled Ground Motion Spectrums Compared to Vancouver’s Hazard
The method for linearly scaling the ground motions was to match the area beneath each
ground motion response spectrum and the target hazard spectrum for the period range
chosen. For each ground motion at each target spectrum a multiplier was determined to
adjust the original ground motion. The scaling factors are provided in Scaled Ground
Motions.
44
Chapter 6: Results
For the purpose of this study the following information files were output after each analysis.
• Base reactions
• Total displacement at each storey
• Forces in non-linear beam and column elements
• Forces in bracket links
• Displacement in bracket links
• Stress in panel elements
For each output file associated with the response of a specific element, output files were also
created listing the element IDs to allow determination of the where in the model certain
behaviors were occurring.
6.1 Single Bay, Single Storey, Static and Semi-Static-Cyclic Results
Semi-static monotonic and cyclic analysis was performed to determine the response of the
system described in Figure 5.2. It is a simple finite element model requiring limited non-
linearity and is much simpler than larger multi-storey, multi-bay systems. The simplicity of
this model makes it well suited for element level parametric study described in Table 5.1.
The first parameter analyzed was the thickness of the CLT panel. An infill panel was
implemented in a bare steel frame with the varying thicknesses commercially available from
StructurLam: 99mm, 169mm, 239mm, and 309mm. These thicknesses correspond with
typical three-ply, five-ply, seven-ply, and nine-ply CLT panels. An analysis was also
performed on a much thinner, 10mm panel and a bare frame for the purpose of comparison;
the 10mm panel is analogous to plywood. The results can be seen in Figure 6.1.
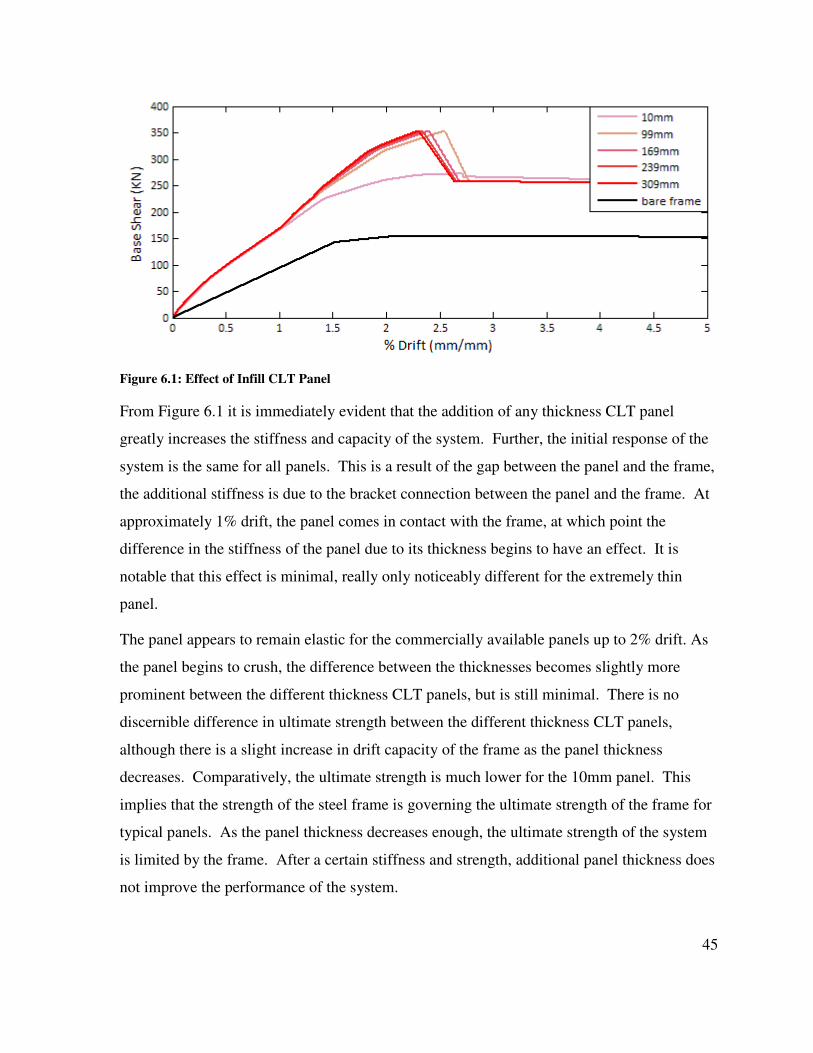
45
Figure 6.1: Effect of Infill CLT Panel
From Figure 6.1 it is immediately evident that the addition of any thickness CLT panel
greatly increases the stiffness and capacity of the system. Further, the initial response of the
system is the same for all panels. This is a result of the gap between the panel and the frame,
the additional stiffness is due to the bracket connection between the panel and the frame. At
approximately 1% drift, the panel comes in contact with the frame, at which point the
difference in the stiffness of the panel due to its thickness begins to have an effect. It is
notable that this effect is minimal, really only noticeably different for the extremely thin
panel.
The panel appears to remain elastic for the commercially available panels up to 2% drift. As
the panel begins to crush, the difference between the thicknesses becomes slightly more
prominent between the different thickness CLT panels, but is still minimal. There is no
discernible difference in ultimate strength between the different thickness CLT panels,
although there is a slight increase in drift capacity of the frame as the panel thickness
decreases. Comparatively, the ultimate strength is much lower for the 10mm panel. This
implies that the strength of the steel frame is governing the ultimate strength of the frame for
typical panels. As the panel thickness decreases enough, the ultimate strength of the system
is limited by the frame. After a certain stiffness and strength, additional panel thickness does
not improve the performance of the system.
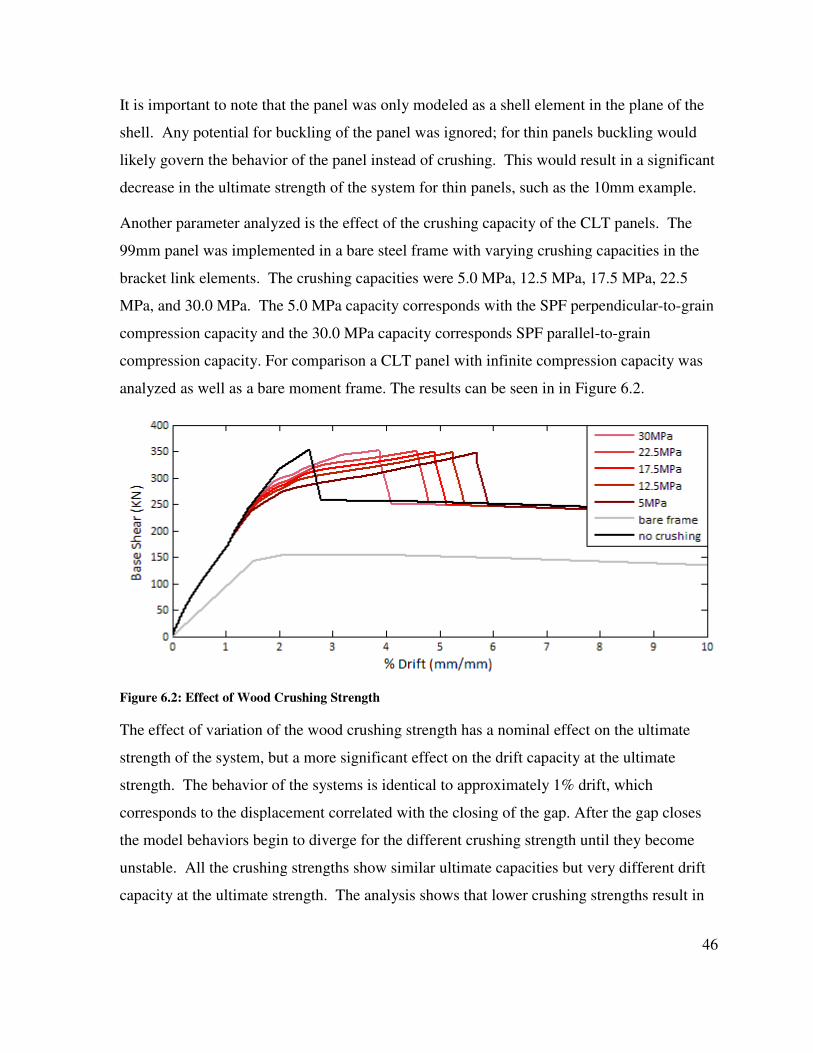
46
It is important to note that the panel was only modeled as a shell element in the plane of the
shell. Any potential for buckling of the panel was ignored; for thin panels buckling would
likely govern the behavior of the panel instead of crushing. This would result in a significant
decrease in the ultimate strength of the system for thin panels, such as the 10mm example.
Another parameter analyzed is the effect of the crushing capacity of the CLT panels. The
99mm panel was implemented in a bare steel frame with varying crushing capacities in the
bracket link elements. The crushing capacities were 5.0 MPa, 12.5 MPa, 17.5 MPa, 22.5
MPa, and 30.0 MPa. The 5.0 MPa capacity corresponds with the SPF perpendicular-to-grain
compression capacity and the 30.0 MPa capacity corresponds SPF parallel-to-grain
compression capacity. For comparison a CLT panel with infinite compression capacity was
analyzed as well as a bare moment frame. The results can be seen in in Figure 6.2.
Figure 6.2: Effect of Wood Crushing Strength
The effect of variation of the wood crushing strength has a nominal effect on the ultimate
strength of the system, but a more significant effect on the drift capacity at the ultimate
strength. The behavior of the systems is identical to approximately 1% drift, which
corresponds to the displacement correlated with the closing of the gap. After the gap closes
the model behaviors begin to diverge for the different crushing strength until they become
unstable. All the crushing strengths show similar ultimate capacities but very different drift
capacity at the ultimate strength. The analysis shows that lower crushing strengths result in
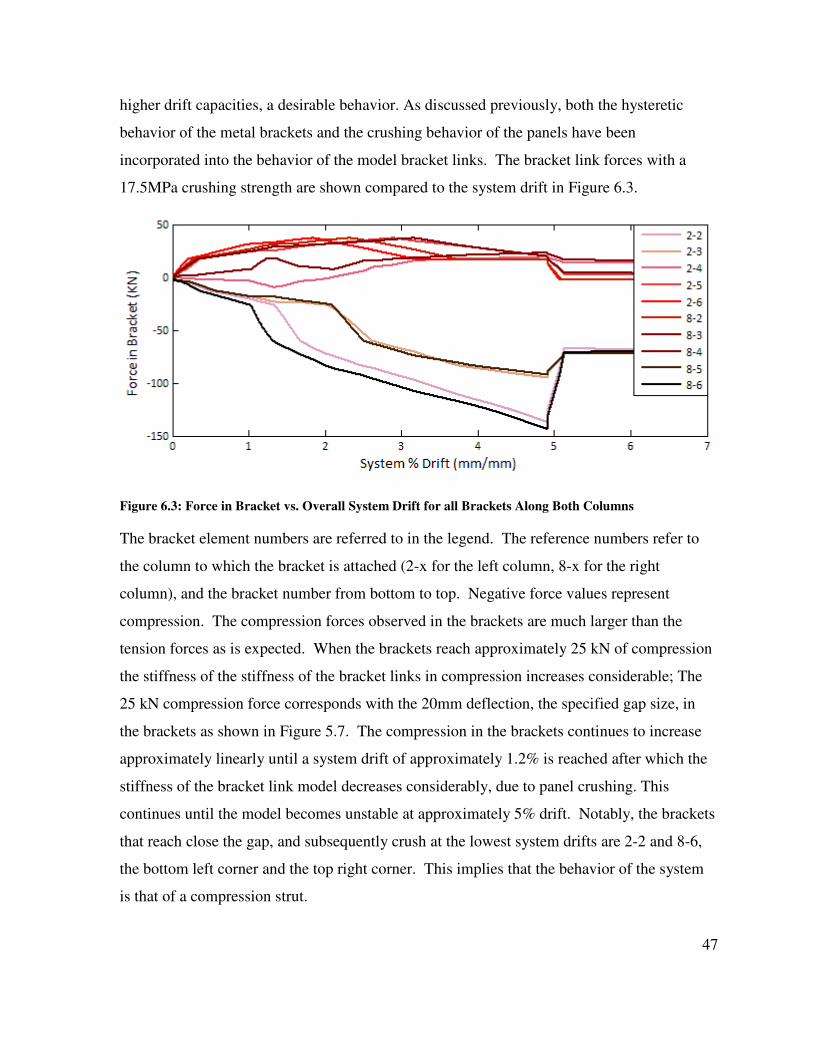
47
higher drift capacities, a desirable behavior. As discussed previously, both the hysteretic
behavior of the metal brackets and the crushing behavior of the panels have been
incorporated into the behavior of the model bracket links. The bracket link forces with a
17.5MPa crushing strength are shown compared to the system drift in Figure 6.3.
Figure 6.3: Force in Bracket vs. Overall System Drift for all Brackets Along Both Columns
The bracket element numbers are referred to in the legend. The reference numbers refer to
the column to which the bracket is attached (2-x for the left column, 8-x for the right
column), and the bracket number from bottom to top. Negative force values represent
compression. The compression forces observed in the brackets are much larger than the
tension forces as is expected. When the brackets reach approximately 25 kN of compression
the stiffness of the stiffness of the bracket links in compression increases considerable; The
25 kN compression force corresponds with the 20mm deflection, the specified gap size, in
the brackets as shown in Figure 5.7. The compression in the brackets continues to increase
approximately linearly until a system drift of approximately 1.2% is reached after which the
stiffness of the bracket link model decreases considerably, due to panel crushing. This
continues until the model becomes unstable at approximately 5% drift. Notably, the brackets
that reach close the gap, and subsequently crush at the lowest system drifts are 2-2 and 8-6,
the bottom left corner and the top right corner. This implies that the behavior of the system
is that of a compression strut.
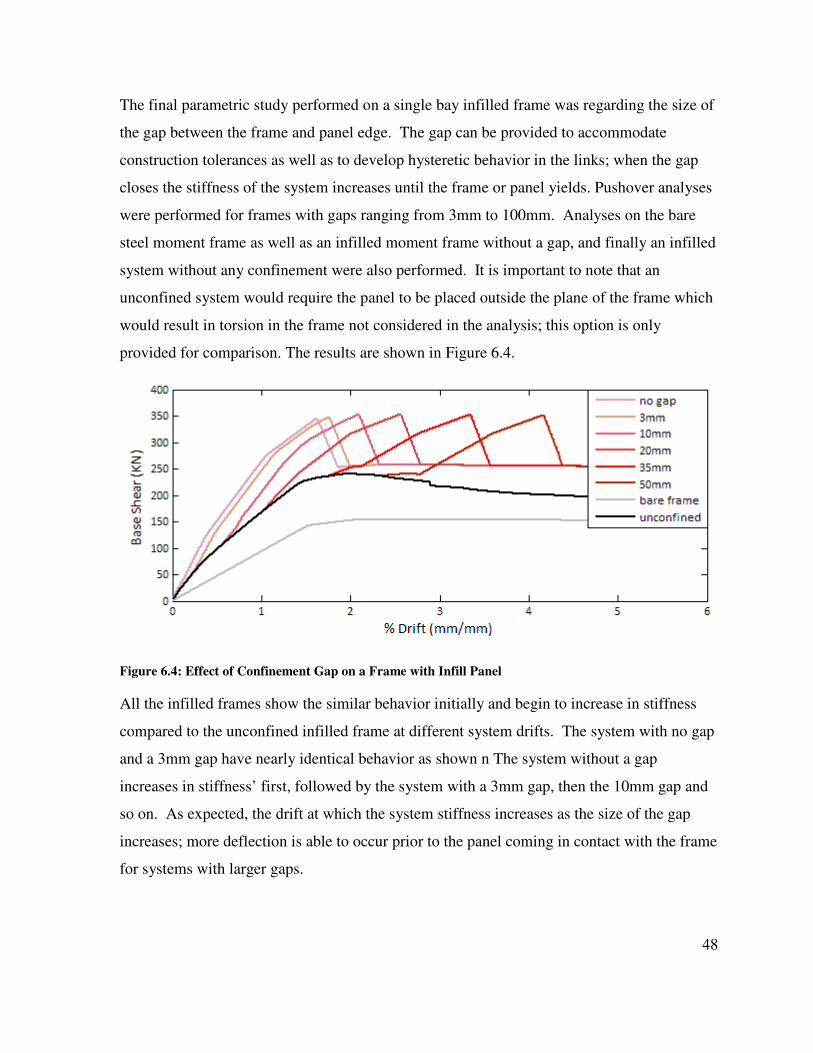
48
The final parametric study performed on a single bay infilled frame was regarding the size of
the gap between the frame and panel edge. The gap can be provided to accommodate
construction tolerances as well as to develop hysteretic behavior in the links; when the gap
closes the stiffness of the system increases until the frame or panel yields. Pushover analyses
were performed for frames with gaps ranging from 3mm to 100mm. Analyses on the bare
steel moment frame as well as an infilled moment frame without a gap, and finally an infilled
system without any confinement were also performed. It is important to note that an
unconfined system would require the panel to be placed outside the plane of the frame which
would result in torsion in the frame not considered in the analysis; this option is only
provided for comparison. The results are shown in Figure 6.4.
Figure 6.4: Effect of Confinement Gap on a Frame with Infill Panel
All the infilled frames show the similar behavior initially and begin to increase in stiffness
compared to the unconfined infilled frame at different system drifts. The system with no gap
and a 3mm gap have nearly identical behavior as shown n The system without a gap
increases in stiffness’ first, followed by the system with a 3mm gap, then the 10mm gap and
so on. As expected, the drift at which the system stiffness increases as the size of the gap
increases; more deflection is able to occur prior to the panel coming in contact with the frame
for systems with larger gaps.
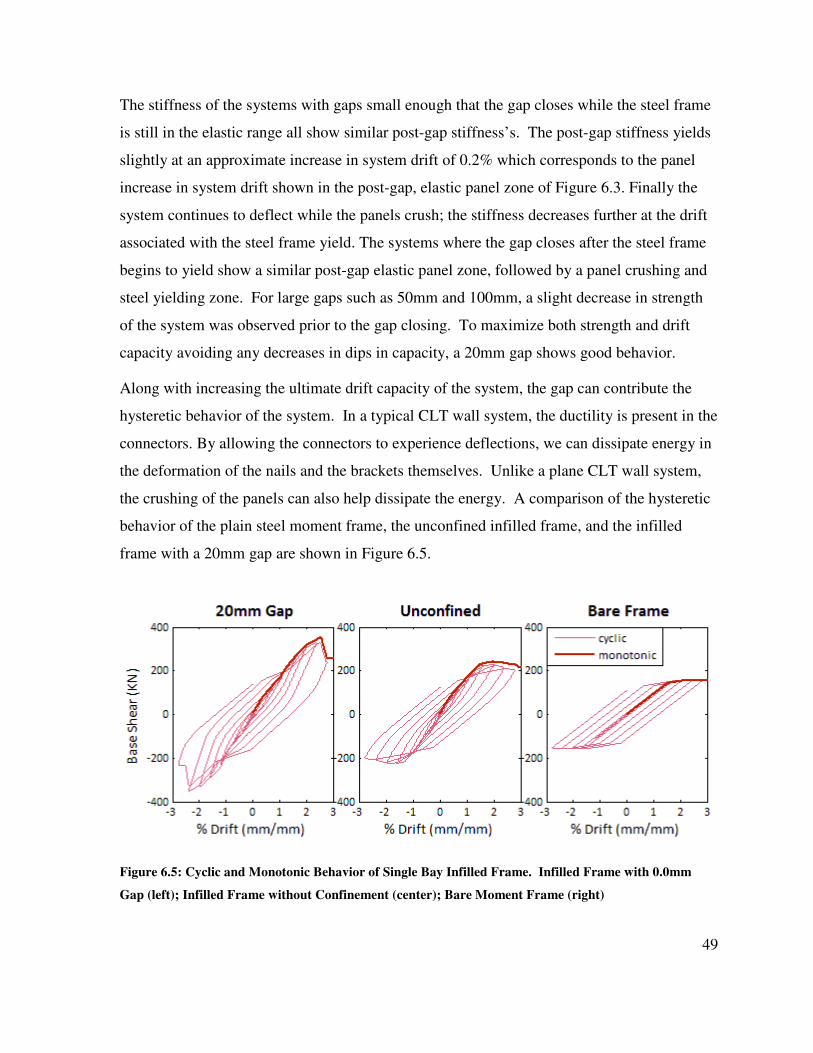
49
The stiffness of the systems with gaps small enough that the gap closes while the steel frame
is still in the elastic range all show similar post-gap stiffness’s. The post-gap stiffness yields
slightly at an approximate increase in system drift of 0.2% which corresponds to the panel
increase in system drift shown in the post-gap, elastic panel zone of Figure 6.3. Finally the
system continues to deflect while the panels crush; the stiffness decreases further at the drift
associated with the steel frame yield. The systems where the gap closes after the steel frame
begins to yield show a similar post-gap elastic panel zone, followed by a panel crushing and
steel yielding zone. For large gaps such as 50mm and 100mm, a slight decrease in strength
of the system was observed prior to the gap closing. To maximize both strength and drift
capacity avoiding any decreases in dips in capacity, a 20mm gap shows good behavior.
Along with increasing the ultimate drift capacity of the system, the gap can contribute the
hysteretic behavior of the system. In a typical CLT wall system, the ductility is present in the
connectors. By allowing the connectors to experience deflections, we can dissipate energy in
the deformation of the nails and the brackets themselves. Unlike a plane CLT wall system,
the crushing of the panels can also help dissipate the energy. A comparison of the hysteretic
behavior of the plain steel moment frame, the unconfined infilled frame, and the infilled
frame with a 20mm gap are shown in Figure 6.5.
Figure 6.5: Cyclic and Monotonic Behavior of Single Bay Infilled Frame. Infilled Frame with 0.0mm
Gap (left); Infilled Frame without Confinement (center); Bare Moment Frame (right)
50
The hysteretic behavior of the plains steel moment frame is extremely regular, as is expected
from steel. There is no noticeable strength degradation due to cyclical behavior which is
expected in drifts less than 4%. The unconfined infilled frame shows the effect of the
brackets alone on the hysteretic behavior. The brackets do cause some strength degradation,
which is expected (Schneider 2009). The hysteretic behavior also shows some stiffness
degradation for the system as a whole due to the brackets, although the effect is much less
severe than that is shown in the brackets alone in Figure 5.8. The hysteretic behavior of the
confined infilled frame with a 20mm gap does not shows larger strength and stiffness
degradation than the unconfined system due to the crushing of the panels. Overall, both
infilled frame systems have effectively eliminated the pinching behavior observed in plain
CLT wall systems shown in Figure 2.2, therefore significantly more energy dissipation.
6.2 Multi-Storey Static Results
A monotonic pushover analysis was performed for multiple storey heights, frame ductilities,
and infill configurations. Three, six, and nine storey frames with three bays were modeled as
bare frames and infilled frames. Infilled frames with one, two, and three of the frame bays
infilled were modeled. 99mm thick CLT panel with a crushing strength set to 17.5MPa and
20mm gaps were considered for the infilled frames. Each system was pushed to either model
instability or 10% drift. The steel yield points and panel crushing points are identified on the
pushover curves. The steel yield values are output from the model when the material model
for the element is created for each non-linear member. The panel crush values are the same
for all bracket link elements. Figure 6.6 shows the results of these pushover analyses. The
pushover curves show a significant increase the strength of the system as frame bays are
infilled with CLT panels, as one would expect. The drift capacity of the systems also appear
to decrease as additional bays are infilled.
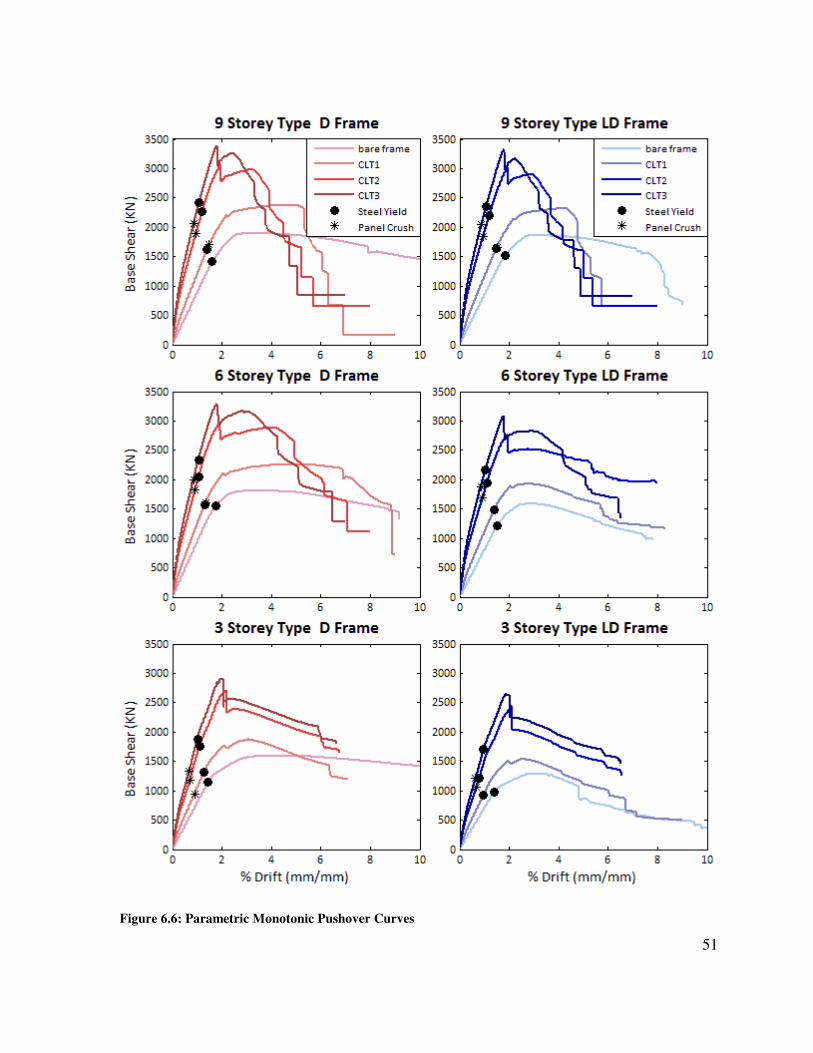
51
Figure 6.6: Parametric Monotonic Pushover Curves
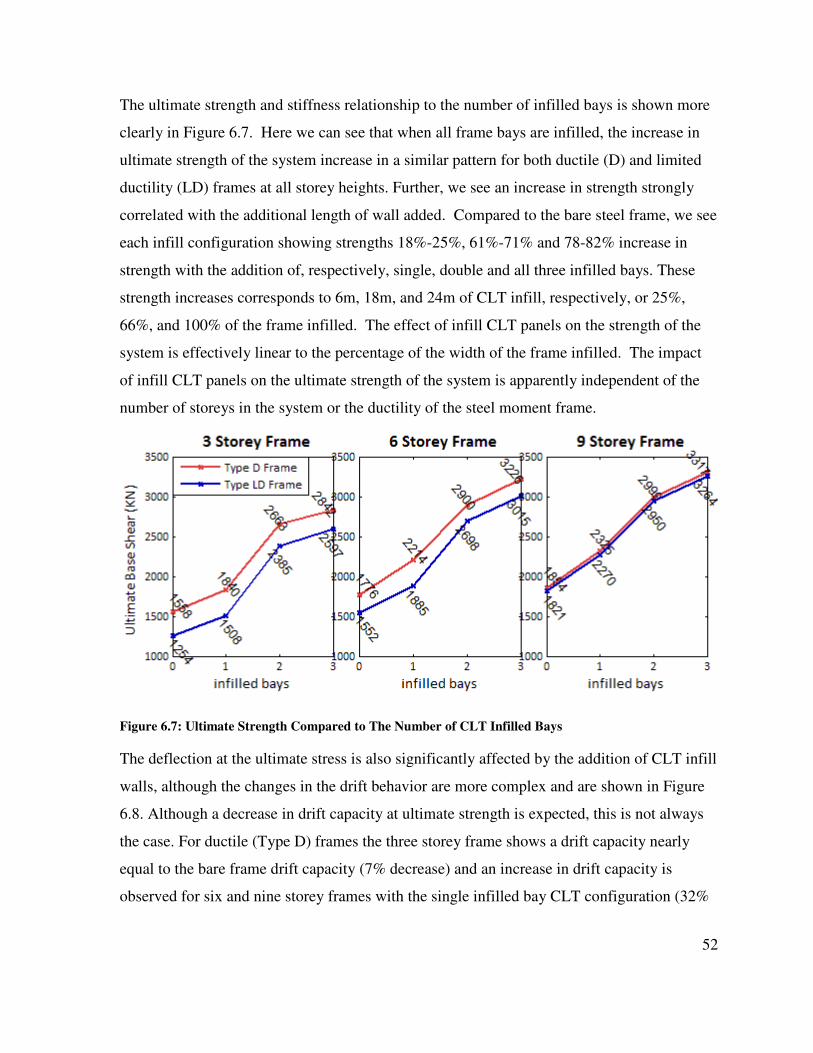
52
The ultimate strength and stiffness relationship to the number of infilled bays is shown more
clearly in Figure 6.7. Here we can see that when all frame bays are infilled, the increase in
ultimate strength of the system increase in a similar pattern for both ductile (D) and limited
ductility (LD) frames at all storey heights. Further, we see an increase in strength strongly
correlated with the additional length of wall added. Compared to the bare steel frame, we see
each infill configuration showing strengths 18%-25%, 61%-71% and 78-82% increase in
strength with the addition of, respectively, single, double and all three infilled bays. These
strength increases corresponds to 6m, 18m, and 24m of CLT infill, respectively, or 25%,
66%, and 100% of the frame infilled. The effect of infill CLT panels on the strength of the
system is effectively linear to the percentage of the width of the frame infilled. The impact
of infill CLT panels on the ultimate strength of the system is apparently independent of the
number of storeys in the system or the ductility of the steel moment frame.
Figure 6.7: Ultimate Strength Compared to The Number of CLT Infilled Bays
The deflection at the ultimate stress is also significantly affected by the addition of CLT infill
walls, although the changes in the drift behavior are more complex and are shown in Figure
6.8. Although a decrease in drift capacity at ultimate strength is expected, this is not always
the case. For ductile (Type D) frames the three storey frame shows a drift capacity nearly
equal to the bare frame drift capacity (7% decrease) and an increase in drift capacity is
observed for six and nine storey frames with the single infilled bay CLT configuration (32%
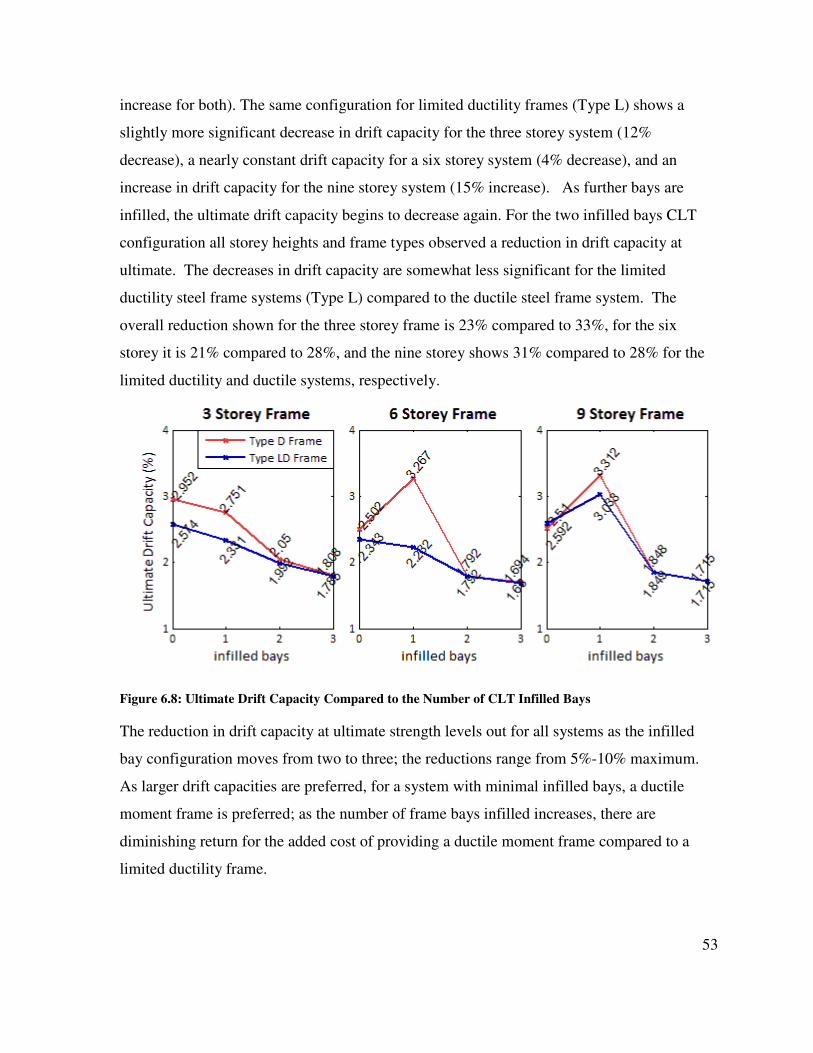
53
increase for both). The same configuration for limited ductility frames (Type L) shows a
slightly more significant decrease in drift capacity for the three storey system (12%
decrease), a nearly constant drift capacity for a six storey system (4% decrease), and an
increase in drift capacity for the nine storey system (15% increase). As further bays are
infilled, the ultimate drift capacity begins to decrease again. For the two infilled bays CLT
configuration all storey heights and frame types observed a reduction in drift capacity at
ultimate. The decreases in drift capacity are somewhat less significant for the limited
ductility steel frame systems (Type L) compared to the ductile steel frame system. The
overall reduction shown for the three storey frame is 23% compared to 33%, for the six
storey it is 21% compared to 28%, and the nine storey shows 31% compared to 28% for the
limited ductility and ductile systems, respectively.
Figure 6.8: Ultimate Drift Capacity Compared to the Number of CLT Infilled Bays
The reduction in drift capacity at ultimate strength levels out for all systems as the infilled
bay configuration moves from two to three; the reductions range from 5%-10% maximum.
As larger drift capacities are preferred, for a system with minimal infilled bays, a ductile
moment frame is preferred; as the number of frame bays infilled increases, there are
diminishing return for the added cost of providing a ductile moment frame compared to a
limited ductility frame.
54
The yield strength and drift capacity of the systems is also significantly impacted by the
addition of infilled bays. This can be seen in Figure 6.9 and Figure 6.10. Figure 6.9 shows
the increase in the force at which the frame begins to yield, as well as the force where the
panels beginning to crush relative to the number of bays infilled. The force at which panel
crushing begins increase almost linearly with the number of bays infilled with CLT panels.
This behavior is independent of frame ductility and number of storeys. For both the six and
nine storey frames the addition of infill CLT the panels begin to crush with a strength higher
than that of the bare frame. Further, the yield strength of the steel frames increases at a
greater rate than that of the CLT panels; in all cases, the CLT begins to crush prior to the
steel yield. Panel crushing is a preferred type of plastic behavior over steel yield due to the
ease of CLT panel replacement compared with moment frame connections. Comparatively
the three storey frames show a decrease in yield strength for the limited ductility frame as
well as a panel crushing strength below the bare frame yield strength. Comparatively the
yield strength of the ductile moment frame increased with the additional in CLT infill walls,
but the system panel crush strength is lower than the bare frame yield strength of the system.
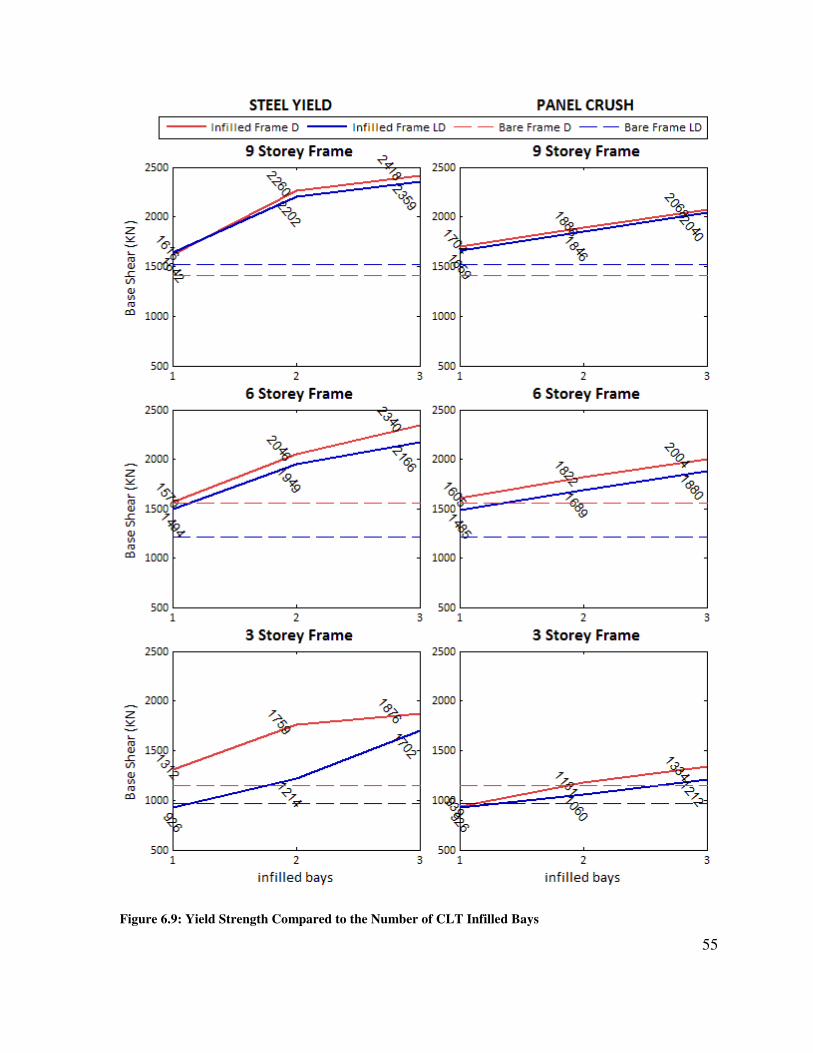
55
Figure 6.9: Yield Strength Compared to the Number of CLT Infilled Bays
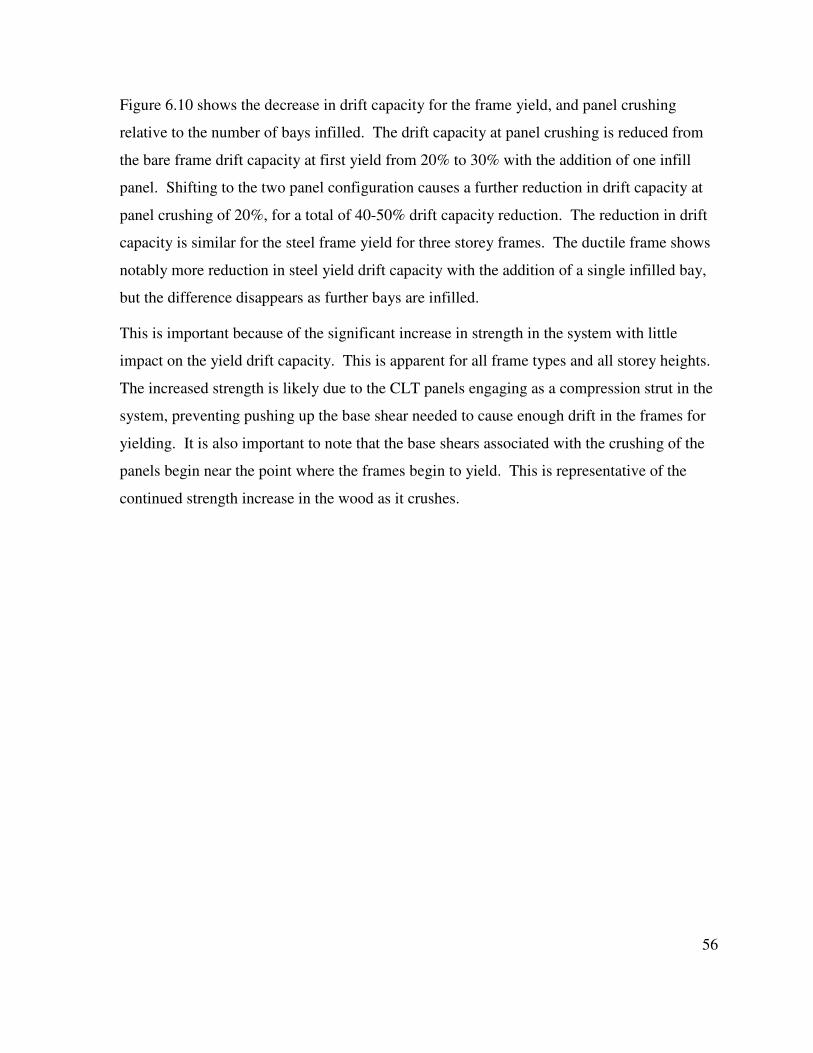
56
Figure 6.10 shows the decrease in drift capacity for the frame yield, and panel crushing
relative to the number of bays infilled. The drift capacity at panel crushing is reduced from
the bare frame drift capacity at first yield from 20% to 30% with the addition of one infill
panel. Shifting to the two panel configuration causes a further reduction in drift capacity at
panel crushing of 20%, for a total of 40-50% drift capacity reduction. The reduction in drift
capacity is similar for the steel frame yield for three storey frames. The ductile frame shows
notably more reduction in steel yield drift capacity with the addition of a single infilled bay,
but the difference disappears as further bays are infilled.
This is important because of the significant increase in strength in the system with little
impact on the yield drift capacity. This is apparent for all frame types and all storey heights.
The increased strength is likely due to the CLT panels engaging as a compression strut in the
system, preventing pushing up the base shear needed to cause enough drift in the frames for
yielding. It is also important to note that the base shears associated with the crushing of the
panels begin near the point where the frames begin to yield. This is representative of the
continued strength increase in the wood as it crushes.
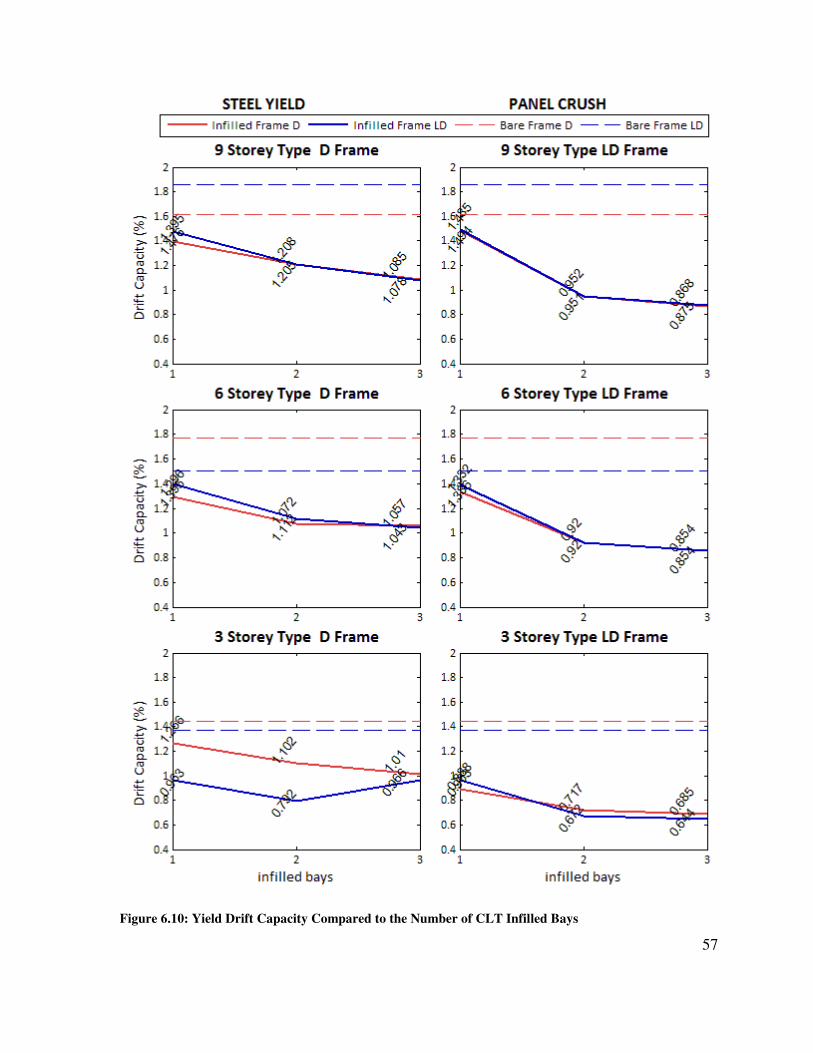
57
Figure 6.10: Yield Drift Capacity Compared to the Number of CLT Infilled Bays
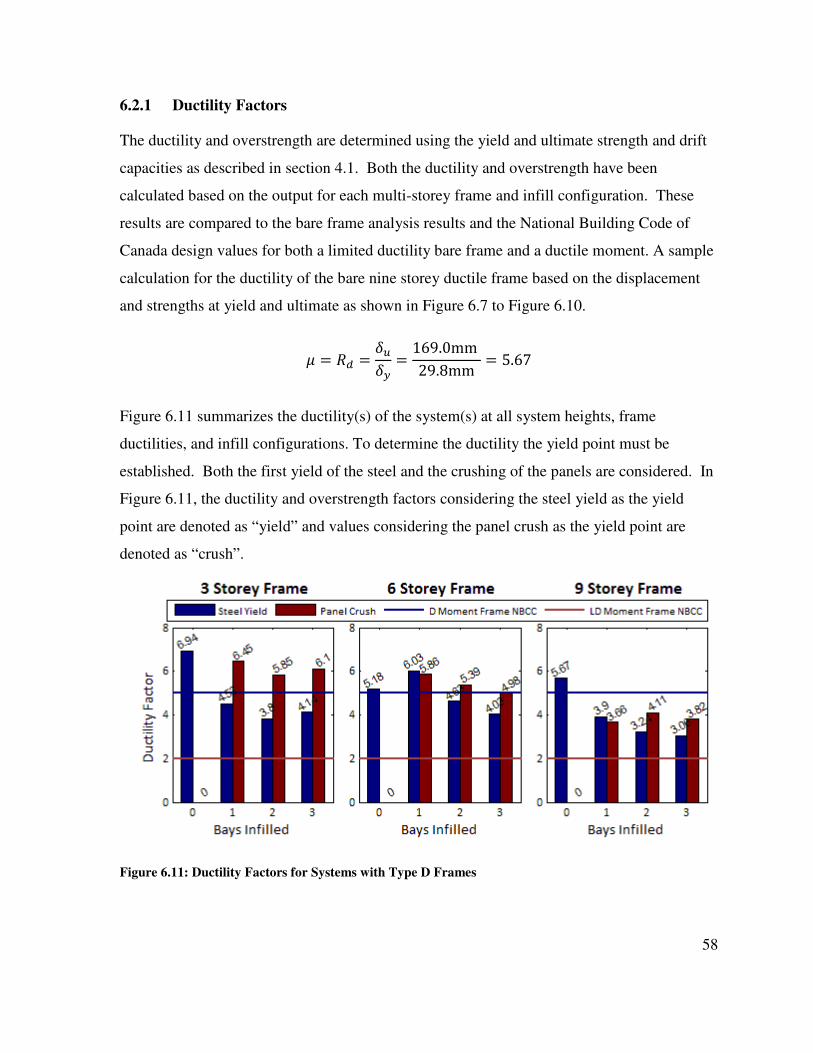
58
6.2.1 Ductility Factors
The ductility and overstrength are determined using the yield and ultimate strength and drift
capacities as described in section 4.1. Both the ductility and overstrength have been
calculated based on the output for each multi-storey frame and infill configuration. These
results are compared to the bare frame analysis results and the National Building Code of
Canada design values for both a limited ductility bare frame and a ductile moment. A sample
calculation for the ductility of the bare nine storey ductile frame based on the displacement
and strengths at yield and ultimate as shown in Figure 6.7 to Figure 6.10.
/ = = 010+ = 169.0mm29.8mm = 5.67
Figure 6.11 summarizes the ductility(s) of the system(s) at all system heights, frame
ductilities, and infill configurations. To determine the ductility the yield point must be
established. Both the first yield of the steel and the crushing of the panels are considered. In
Figure 6.11, the ductility and overstrength factors considering the steel yield as the yield
point are denoted as “yield” and values considering the panel crush as the yield point are
denoted as “crush”.
Figure 6.11: Ductility Factors for Systems with Type D Frames
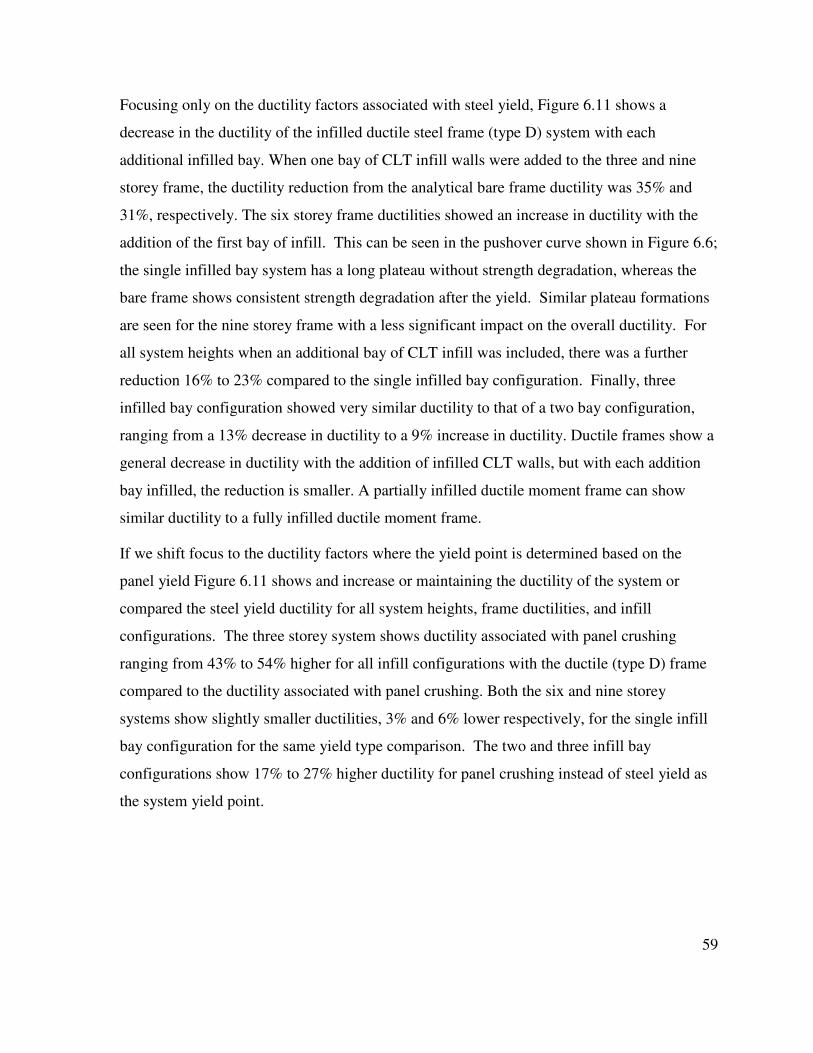
59
Focusing only on the ductility factors associated with steel yield, Figure 6.11 shows a
decrease in the ductility of the infilled ductile steel frame (type D) system with each
additional infilled bay. When one bay of CLT infill walls were added to the three and nine
storey frame, the ductility reduction from the analytical bare frame ductility was 35% and
31%, respectively. The six storey frame ductilities showed an increase in ductility with the
addition of the first bay of infill. This can be seen in the pushover curve shown in Figure 6.6;
the single infilled bay system has a long plateau without strength degradation, whereas the
bare frame shows consistent strength degradation after the yield. Similar plateau formations
are seen for the nine storey frame with a less significant impact on the overall ductility. For
all system heights when an additional bay of CLT infill was included, there was a further
reduction 16% to 23% compared to the single infilled bay configuration. Finally, three
infilled bay configuration showed very similar ductility to that of a two bay configuration,
ranging from a 13% decrease in ductility to a 9% increase in ductility. Ductile frames show a
general decrease in ductility with the addition of infilled CLT walls, but with each addition
bay infilled, the reduction is smaller. A partially infilled ductile moment frame can show
similar ductility to a fully infilled ductile moment frame.
If we shift focus to the ductility factors where the yield point is determined based on the
panel yield Figure 6.11 shows and increase or maintaining the ductility of the system or
compared the steel yield ductility for all system heights, frame ductilities, and infill
configurations. The three storey system shows ductility associated with panel crushing
ranging from 43% to 54% higher for all infill configurations with the ductile (type D) frame
compared to the ductility associated with panel crushing. Both the six and nine storey
systems show slightly smaller ductilities, 3% and 6% lower respectively, for the single infill
bay configuration for the same yield type comparison. The two and three infill bay
configurations show 17% to 27% higher ductility for panel crushing instead of steel yield as
the system yield point.
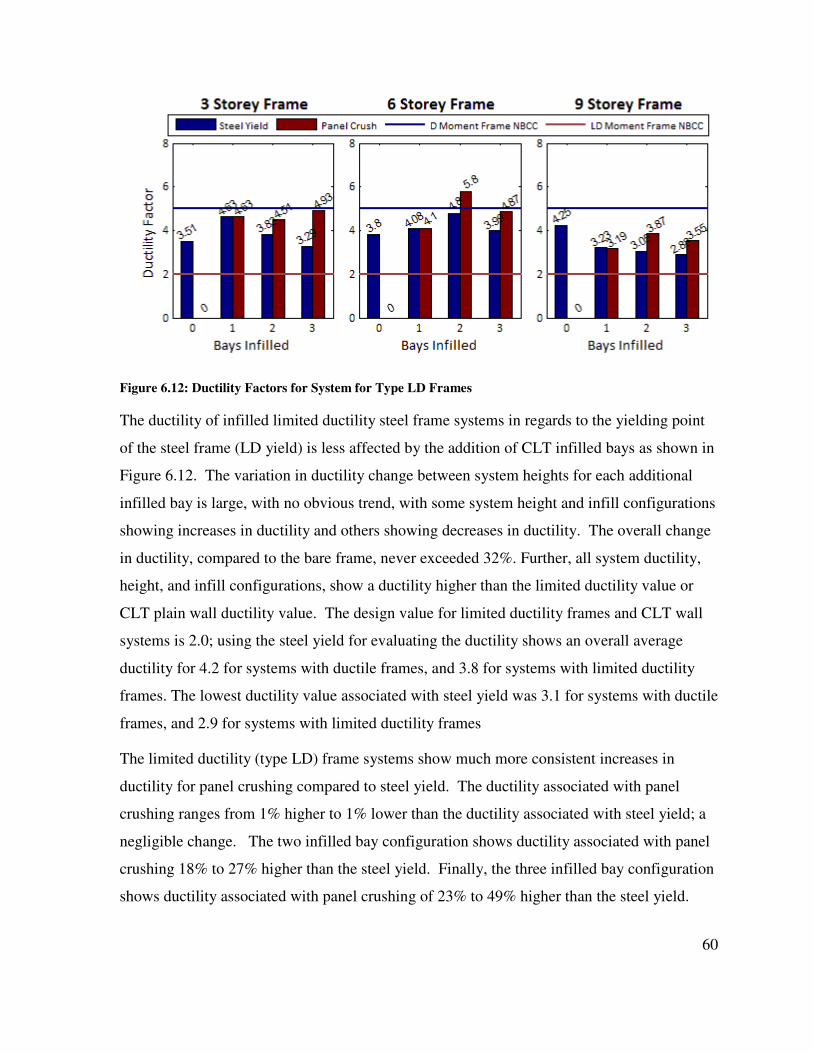
60
Figure 6.12: Ductility Factors for System for Type LD Frames
The ductility of infilled limited ductility steel frame systems in regards to the yielding point
of the steel frame (LD yield) is less affected by the addition of CLT infilled bays as shown in
Figure 6.12. The variation in ductility change between system heights for each additional
infilled bay is large, with no obvious trend, with some system height and infill configurations
showing increases in ductility and others showing decreases in ductility. The overall change
in ductility, compared to the bare frame, never exceeded 32%. Further, all system ductility,
height, and infill configurations, show a ductility higher than the limited ductility value or
CLT plain wall ductility value. The design value for limited ductility frames and CLT wall
systems is 2.0; using the steel yield for evaluating the ductility shows an overall average
ductility for 4.2 for systems with ductile frames, and 3.8 for systems with limited ductility
frames. The lowest ductility value associated with steel yield was 3.1 for systems with ductile
frames, and 2.9 for systems with limited ductility frames
The limited ductility (type LD) frame systems show much more consistent increases in
ductility for panel crushing compared to steel yield. The ductility associated with panel
crushing ranges from 1% higher to 1% lower than the ductility associated with steel yield; a
negligible change. The two infilled bay configuration shows ductility associated with panel
crushing 18% to 27% higher than the steel yield. Finally, the three infilled bay configuration
shows ductility associated with panel crushing of 23% to 49% higher than the steel yield.
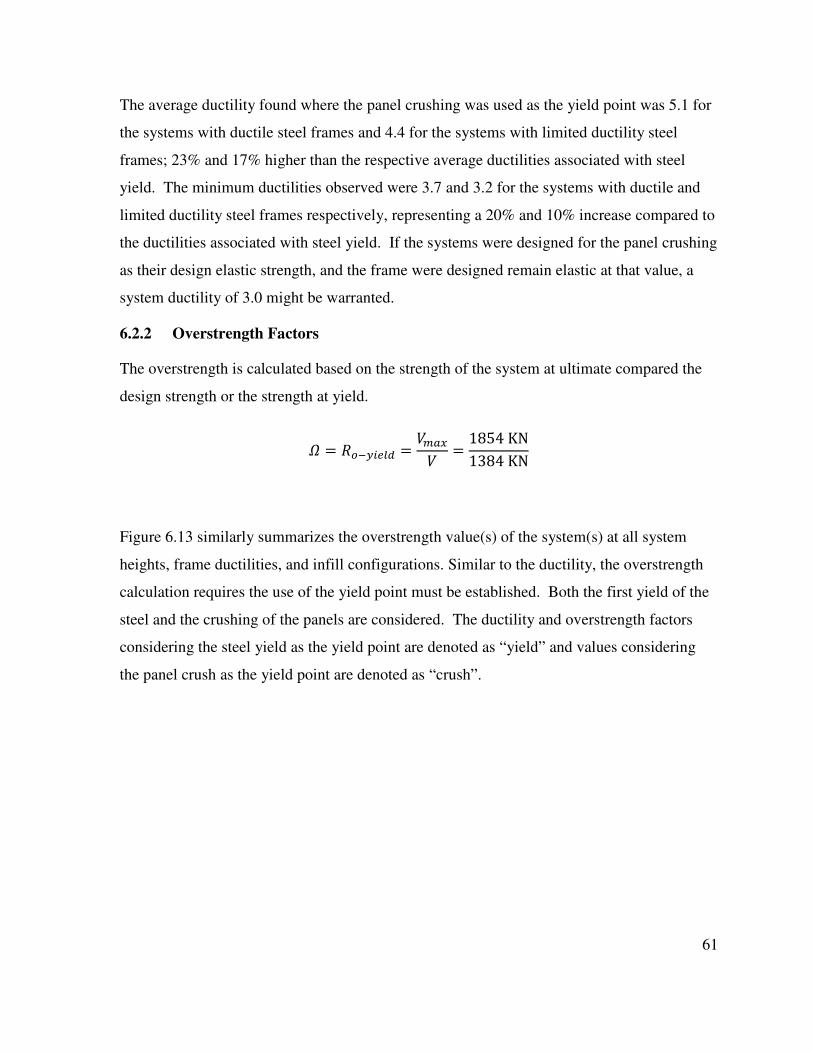
61
The average ductility found where the panel crushing was used as the yield point was 5.1 for
the systems with ductile steel frames and 4.4 for the systems with limited ductility steel
frames; 23% and 17% higher than the respective average ductilities associated with steel
yield. The minimum ductilities observed were 3.7 and 3.2 for the systems with ductile and
limited ductility steel frames respectively, representing a 20% and 10% increase compared to
the ductilities associated with steel yield. If the systems were designed for the panel crushing
as their design elastic strength, and the frame were designed remain elastic at that value, a
system ductility of 3.0 might be warranted.
6.2.2 Overstrength Factors
The overstrength is calculated based on the strength of the system at ultimate compared the
design strength or the strength at yield.
- = *+$, = (. = 1854KN1384KN
Figure 6.13 similarly summarizes the overstrength value(s) of the system(s) at all system
heights, frame ductilities, and infill configurations. Similar to the ductility, the overstrength
calculation requires the use of the yield point must be established. Both the first yield of the
steel and the crushing of the panels are considered. The ductility and overstrength factors
considering the steel yield as the yield point are denoted as “yield” and values considering
the panel crush as the yield point are denoted as “crush”.
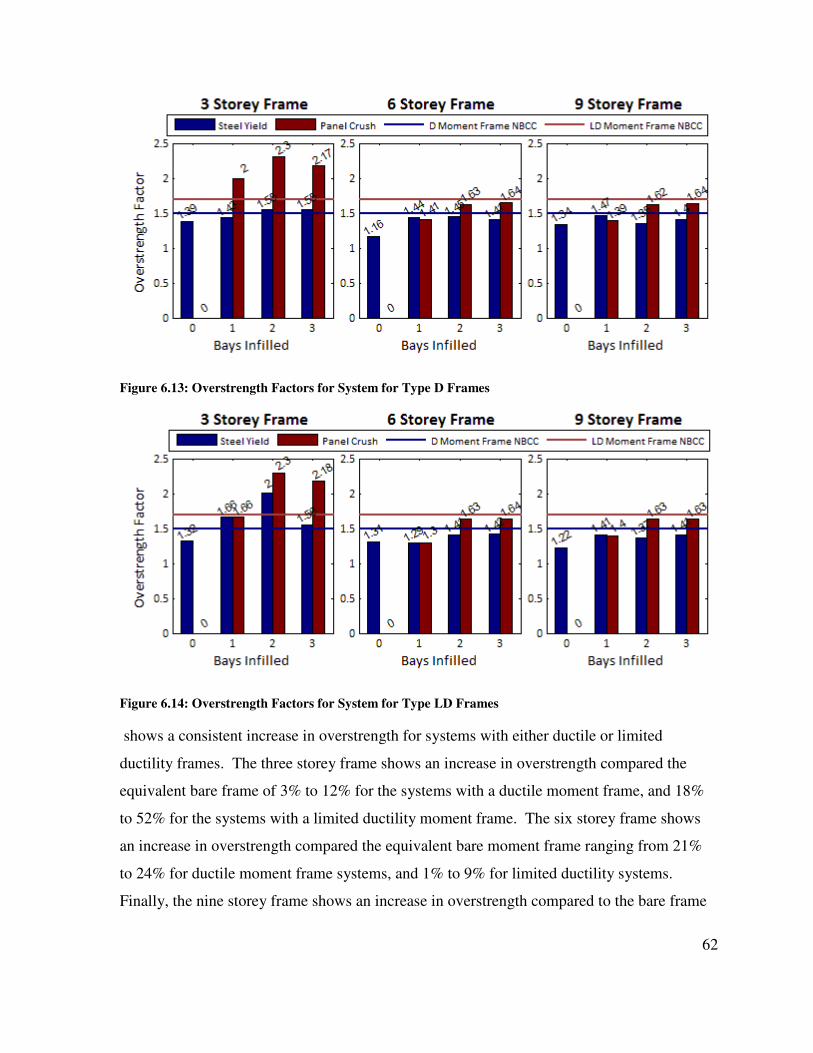
62
Figure 6.13: Overstrength Factors for System for Type D Frames
Figure 6.14: Overstrength Factors for System for Type LD Frames
shows a consistent increase in overstrength for systems with either ductile or limited
ductility frames. The three storey frame shows an increase in overstrength compared the
equivalent bare frame of 3% to 12% for the systems with a ductile moment frame, and 18%
to 52% for the systems with a limited ductility moment frame. The six storey frame shows
an increase in overstrength compared the equivalent bare moment frame ranging from 21%
to 24% for ductile moment frame systems, and 1% to 9% for limited ductility systems.
Finally, the nine storey frame shows an increase in overstrength compared to the bare frame
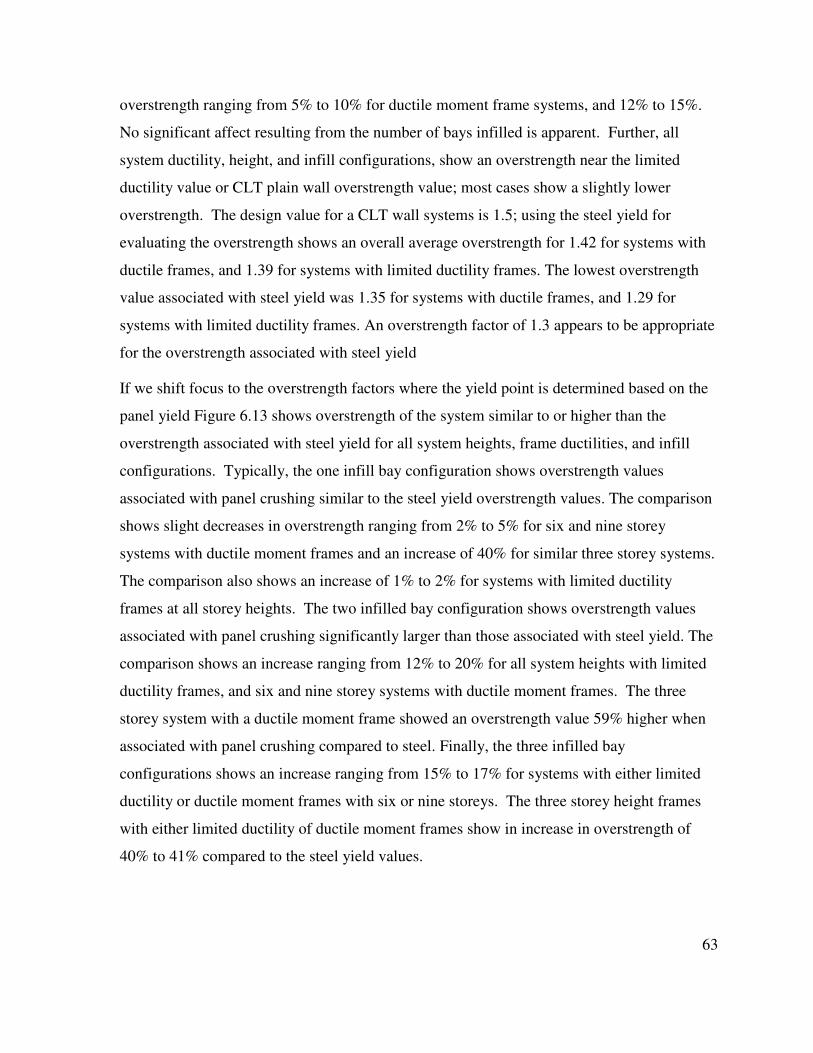
63
overstrength ranging from 5% to 10% for ductile moment frame systems, and 12% to 15%.
No significant affect resulting from the number of bays infilled is apparent. Further, all
system ductility, height, and infill configurations, show an overstrength near the limited
ductility value or CLT plain wall overstrength value; most cases show a slightly lower
overstrength. The design value for a CLT wall systems is 1.5; using the steel yield for
evaluating the overstrength shows an overall average overstrength for 1.42 for systems with
ductile frames, and 1.39 for systems with limited ductility frames. The lowest overstrength
value associated with steel yield was 1.35 for systems with ductile frames, and 1.29 for
systems with limited ductility frames. An overstrength factor of 1.3 appears to be appropriate
for the overstrength associated with steel yield
If we shift focus to the overstrength factors where the yield point is determined based on the
panel yield Figure 6.13 shows overstrength of the system similar to or higher than the
overstrength associated with steel yield for all system heights, frame ductilities, and infill
configurations. Typically, the one infill bay configuration shows overstrength values
associated with panel crushing similar to the steel yield overstrength values. The comparison
shows slight decreases in overstrength ranging from 2% to 5% for six and nine storey
systems with ductile moment frames and an increase of 40% for similar three storey systems.
The comparison also shows an increase of 1% to 2% for systems with limited ductility
frames at all storey heights. The two infilled bay configuration shows overstrength values
associated with panel crushing significantly larger than those associated with steel yield. The
comparison shows an increase ranging from 12% to 20% for all system heights with limited
ductility frames, and six and nine storey systems with ductile moment frames. The three
storey system with a ductile moment frame showed an overstrength value 59% higher when
associated with panel crushing compared to steel. Finally, the three infilled bay
configurations shows an increase ranging from 15% to 17% for systems with either limited
ductility or ductile moment frames with six or nine storeys. The three storey height frames
with either limited ductility of ductile moment frames show in increase in overstrength of
40% to 41% compared to the steel yield values.
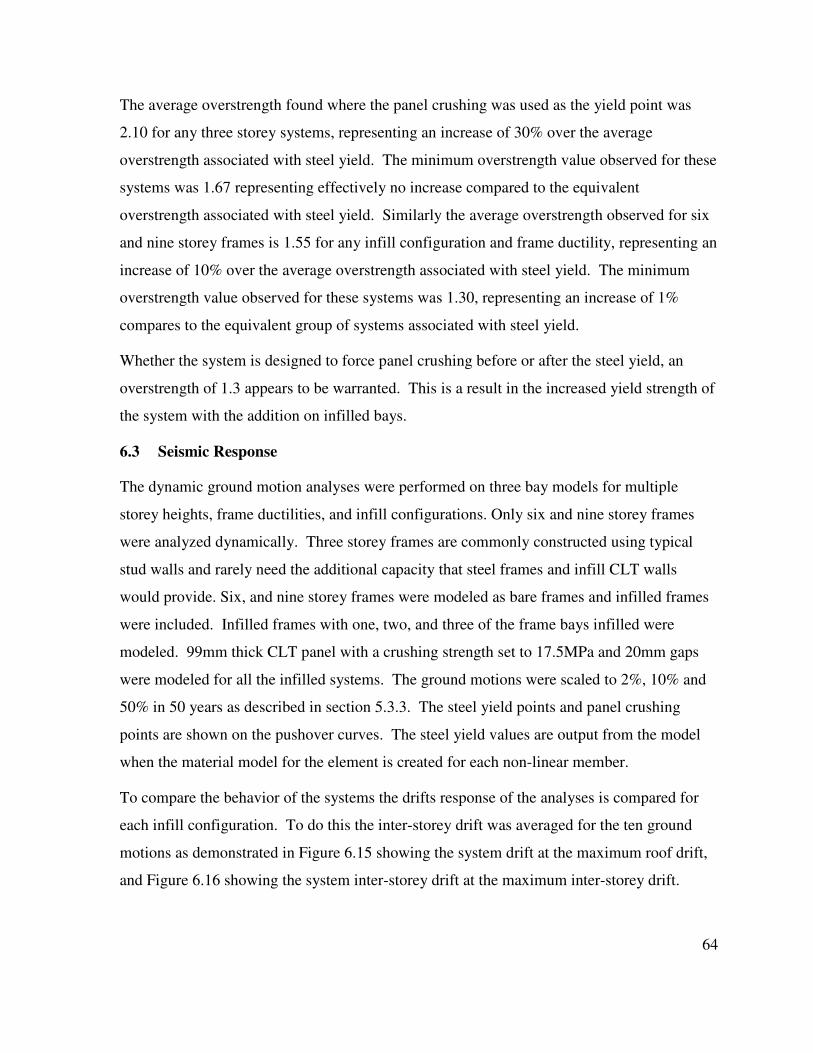
64
The average overstrength found where the panel crushing was used as the yield point was
2.10 for any three storey systems, representing an increase of 30% over the average
overstrength associated with steel yield. The minimum overstrength value observed for these
systems was 1.67 representing effectively no increase compared to the equivalent
overstrength associated with steel yield. Similarly the average overstrength observed for six
and nine storey frames is 1.55 for any infill configuration and frame ductility, representing an
increase of 10% over the average overstrength associated with steel yield. The minimum
overstrength value observed for these systems was 1.30, representing an increase of 1%
compares to the equivalent group of systems associated with steel yield.
Whether the system is designed to force panel crushing before or after the steel yield, an
overstrength of 1.3 appears to be warranted. This is a result in the increased yield strength of
the system with the addition on infilled bays.
6.3 Seismic Response
The dynamic ground motion analyses were performed on three bay models for multiple
storey heights, frame ductilities, and infill configurations. Only six and nine storey frames
were analyzed dynamically. Three storey frames are commonly constructed using typical
stud walls and rarely need the additional capacity that steel frames and infill CLT walls
would provide. Six, and nine storey frames were modeled as bare frames and infilled frames
were included. Infilled frames with one, two, and three of the frame bays infilled were
modeled. 99mm thick CLT panel with a crushing strength set to 17.5MPa and 20mm gaps
were modeled for all the infilled systems. The ground motions were scaled to 2%, 10% and
50% in 50 years as described in section 5.3.3. The steel yield points and panel crushing
points are shown on the pushover curves. The steel yield values are output from the model
when the material model for the element is created for each non-linear member.
To compare the behavior of the systems the drifts response of the analyses is compared for
each infill configuration. To do this the inter-storey drift was averaged for the ten ground
motions as demonstrated in Figure 6.15 showing the system drift at the maximum roof drift,
and Figure 6.16 showing the system inter-storey drift at the maximum inter-storey drift.
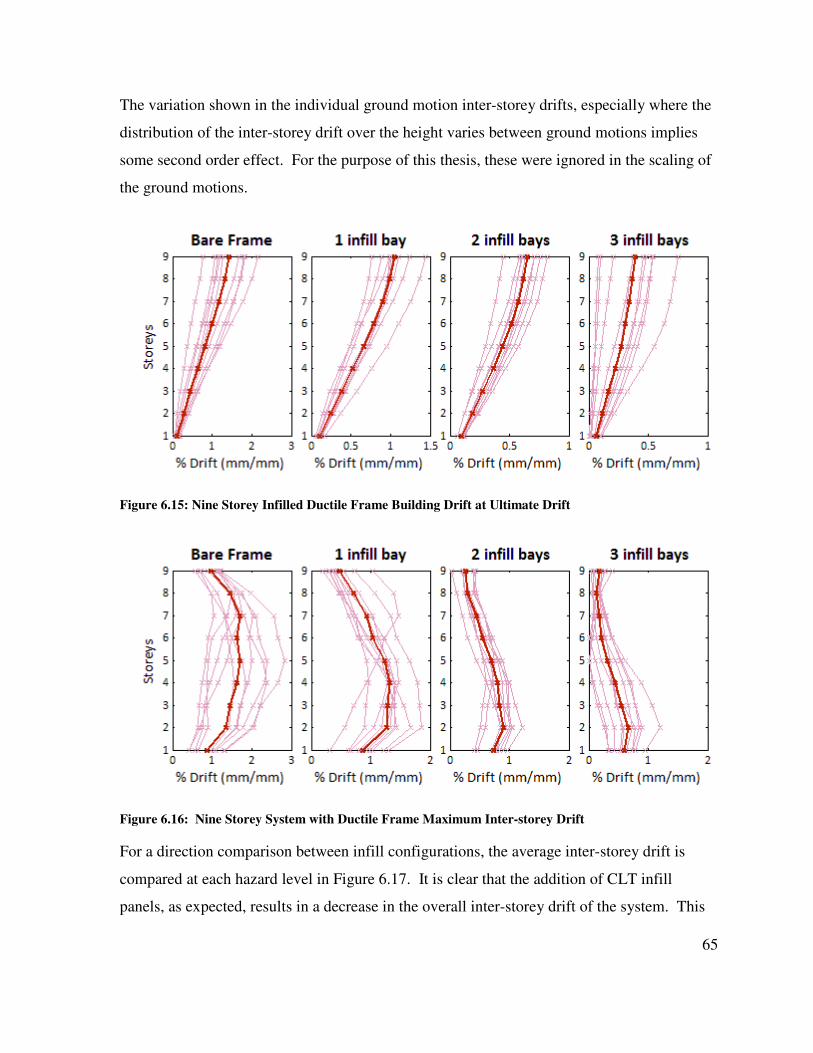
65
The variation shown in the individual ground motion inter-storey drifts, especially where the
distribution of the inter-storey drift over the height varies between ground motions implies
some second order effect. For the purpose of this thesis, these were ignored in the scaling of
the ground motions.
Figure 6.15: Nine Storey Infilled Ductile Frame Building Drift at Ultimate Drift
Figure 6.16: Nine Storey System with Ductile Frame Maximum Inter-storey Drift
For a direction comparison between infill configurations, the average inter-storey drift is
compared at each hazard level in Figure 6.17. It is clear that the addition of CLT infill
panels, as expected, results in a decrease in the overall inter-storey drift of the system. This
66
is not surprising based on the overall reduction in both yield and ultimate drift of the system
shown static pushover analysis in Figure 6.8 and Figure 6.10.
Figure 6.17: Nine Storey Inter-Drift for all Frame-Infill Configurations
It is also clear that the distribution of the inter-storey drifts over the height of the frame is
heavily influenced by the addition of each CLT infilled bay. The plain frames show a more
even distribution of inter-storey drift over the building height compared to the infilled
systems. Further, each infilled system shows further concentration of the inter-storey drifts
at the base of the structure. Effectively, with each additional infilled bay, as expected, the
system behaves more like a shearwall system. This effect remains for the ground motions
scaled to the lower hazard spectrums, although the change is less dramatic. Further, the infill
configurations with more panels are more similar at lower hazard spectra. This can be
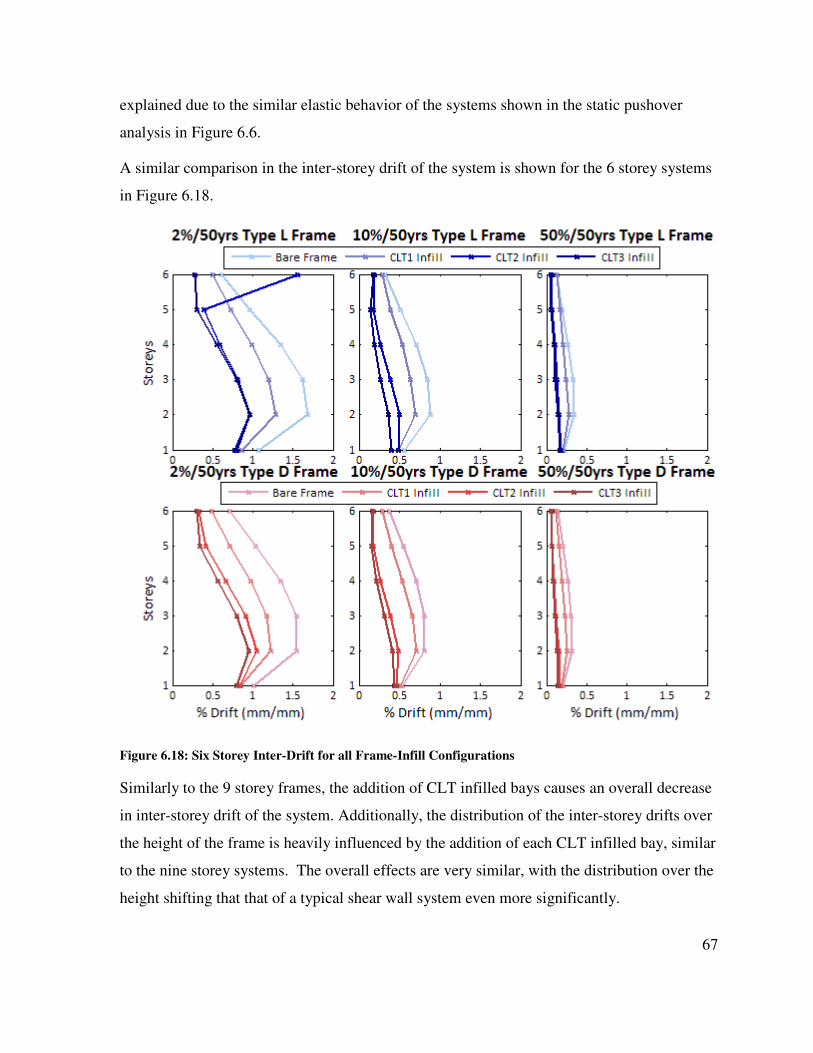
67
explained due to the similar elastic behavior of the systems shown in the static pushover
analysis in Figure 6.6.
A similar comparison in the inter-storey drift of the system is shown for the 6 storey systems
in Figure 6.18.
Figure 6.18: Six Storey Inter-Drift for all Frame-Infill Configurations
Similarly to the 9 storey frames, the addition of CLT infilled bays causes an overall decrease
in inter-storey drift of the system. Additionally, the distribution of the inter-storey drifts over
the height of the frame is heavily influenced by the addition of each CLT infilled bay, similar
to the nine storey systems. The overall effects are very similar, with the distribution over the
height shifting that that of a typical shear wall system even more significantly.
68
Chapter 7: Conclusion
Hybrid systems are commonly used in all forms of structure, with several examples existing
of the hybridization of wood and steel. Design focused on the different material properties
has been done in existing buildings to create efficient, sound structures. This thesis has
focused on one specific form of wood and steel hybridization: CLT infill panels in a steel
moment frame.
7.1 Summary of Findings
The purpose of this thesis was to determine how the addition of CLT infill panels to a steel
moment frame affects the behavior of the structure. The CLT panels are placed within frame
bay(s), and panels are connected using typical CLT brackets bolted to the frame and nailed to
the panel. The gap between the two was modeled allowing for some construction tolerances
and bracket deformation; bracket deformation being the main source of ductility in a plain
CLT wall system. Several parameters were analyzed, including system height, steel frame
design, CLT panel thickness and strength, and placement of the CLT panel.
A single bay, single storey was analyzed statically with a monotonic pushover load and a
cyclic load with a range of values for the CLT panel parameters and the panel placement
parameters. After the system deflects enough to close the gap between the panel and the
frame, the stiffness of the system is larger as a result of the increased thickness of the panel.
The ultimate strength of the system is not significantly affected, but drift at the ultimate
condition increases as the panel thickness decreases. The effect on ultimate strength and the
drift at ultimate is a result of the increased strength in the panel. This is seen more clearly
with the analysis carrying the strength of the panel only; increasing panel strength causes a
moderate increase in the strength of the system, but a significant reduction of the drift at
ultimate. Finally the effect of the gap was analyzed; larger gaps result in larger increased
drift at ultimate strength without showing any significant effect on the ultimate strength of
the system.
Several three bay, multi-storey frames were examined using both static pushover analysis
and dynamic ground motion analysis. The static pushover analysis was used to determine the
69
effect of the panels on the strength and stiffness of the system, as well as to determine some
preliminary values for the ductility and overstrength of the system. The dynamic analysis
was used to determine the effect of the infill panels on the inter-storey drift of the system.
The addition of panels was found to increase the strength and stiffness of the system almost
linearly with each panel. However, the addition of panels also resulted in a decrease in the
drift at ultimate, although the effect was less dramatic than the strength. A decrease in
ductility with the additional panels was also noticed in the systems with significant ductility
in the steel frame, but less dramatically in the limited ductility frame. Overall, the results
suggest that the addition of infill bays is less beneficial in ductile moment frames; CLT infill
panels are better suited to lower ductility systems. The overstrength was increased compared
to the overstrength of the bare frames, but not significantly. Ultimately, a ductility factor of
3.0 is recommended for the infilled frame system, and an overstrength factor of 1.3.
The addition of infill walls also reduced the overall inter-storey drift and caused the frame to
behave more similarly to a shear wall system. There was some evidence of higher modes
affecting the response of the taller systems; if a steel moment frame infilled with CLT walls
were used as the structural seismic resisting system in increasingly taller buildings,
significant attention should be paid to higher mode effects.
Overall the system shows significant promise for future construction. The addition of CLT
infill walls to a steel moment frame shows a significant increase in strength and stiffness of
the system and reduction in inter-storey drift. Further, preliminary values indicate the panel
crushing allows for ductility values higher than that of a limited ductility moment frame
70
7.2 Future Research
The analytical results present several limits in the existing knowledge for some of the
components as well as the overall system. To date no testing has been performed on this type
of infilled wall system. I recommend the following experimental research for the
development of CLT infill walls in steel moment frames as a system:
1. Experimental investigations of small pieces of CLT to determine the diagonal
crushing behavior of the panel. Specifically, how the panel behaves as crushing
begins, and how the panel fails
2. Experimental investigations of large pieces of CLT in plane to determine a what loads
and sizes buckling becomes an issue for the panel strength
3. Experimental investigations of a single bay frame of the system monotonically and
cyclically to confirm the interaction between the two systems
To further develop a full design methodology for CLT infill wall systems, further analytical
research is also required include the development of more detailed material models for the
brackets and panel crushing based on the experimental testing programs described above.
Also, a full incremental dynamic analysis as described in FEMA P695 to determine the
specific ductility and overstrength factors.
Finally, the concept of CLT infill walls in steel moment frames can be significantly expanded
by researching other connection types. One possibility is to include multiple panels as infill
within a single bay. The panels could be connected with energy dissipating connections.
Strong connections with more ductility could be used between the panels and the frame, and
the placement and size of the panels can be optimized to increase the efficiency of the
system.
71
References
Adams, J., and S. Halchuk. 2004. Fourth Generation Seismic Hazard Maops of Canada: Values for
over 650 Canadian Localities Intended for the 2005 National Building Code of Canadaa.
Geological Survey of Canada, Ottawa: National Eartquake Hazards Program.
American Society of Civil Engineers (ASCE). 2006. Seismic Rehabilitation of Existing Buildings, ASCE
41. American Society of Civil Engineers.
Applied Technology Council (ATC). 2009. Quatification of Buildign Seismic Performance Factors,
FEMA P695. Federal Emergency Management Acengcy (FEMA).
Blass, H., and P. Fellmoser. 2010. "Design of Sold Wood Panels with Cross Layers." World Conference
on Timber Engineering (WCTE). Trentino, Italy.
Canadian Standards Associations (CSA). 2010. Design of Steel Structures 2010, CSA S16-09. Ottawa:
Canadian Institute of Steel Construction.
Ceccotti, A, C Sandhaas, and M Yasumuro. 2010. "Seismic Behaviour of Multistory Cross-laminated
Timber Buildings." International Convention of Society of Wood Science and Technology .
Geneva, Switzerland.
Ceccotti, A, M Lauriola, M Pinna, and C Sandhaas. 2006. "SOFIE Project – Cyclic Tests on Cross-
Laminated Wooden Panels." World Conference on Timber Engineering (WCTE). Portaland,
USA. 1-8.
Ceccotti, A. 2008. "New Technologies for Construction of Medium_rise Buildings in Seismic Regions:
The XLAM Case." Structural Enginerring International, Vol.18 (No.2) 156-165.
Ceccotti, A., and E. Karacabeyli. 2002. "Validation of Seismic Design parameters for Wood-frame
Shearwall Sysems." Canadian Journal of Civil Engineering, Vol.29 (No.3) 484-498.
Chopra. 2011. Dynamics of Structures. Prentice Hall.
CISC. 2010. Handbook of Steel Construction, 10th edition, CSA S16-09. Toronto, ON: Quadratone
Graphics Ltd.
Clarke, C. 2009. Midply Shear Wlls Use in Non-residential Buildings. Thesis (MASc), Vancouver,
Canada: University opf British Columbia.
Dujic, B., K. Strus, R. Zarnic, and A. Ceccotti. 2010. "Prediction of Dynamic Response of a 7 Storey
Massive Crosslam Wooden Building Tested on a Shaking Table." World Conference on
Timber Engineering (WCTE_. Trentino, Italy.
72
Elnashai, A., and A. Mwafy. 2002. "Overstrength and Force Reduction Factors of Multistorey
Reinforced-Concrete Buildings." Structural Design of Tall Buildings, Vol.11 329-351.
Forestry Products Laboratory (FPL). 1999. "Chapter 3: Physical Properties and Miosture Relations of
Wood." In Wood Handbook, by William Simpson and Anton TenWolde, 1-24. Madison,
United States: Forest Products Laboratory.
Fragiacomo, M., B. Dijic, and I. Sustersic. 2011. "Elastic and Ductile Design of Multi-storey Crosslam
massive Wooden Buildings under Seismic Actions." Elsevier Engineering Structures, Vol. 33
(No.11) 1-11.
Harris, M. 2012. "Wood Goes High-rise." Engineering & Technology, Vol. 7 (No. 9) 43-45.
Inel, M., and H.B. Ozmen. 2006. "Effects of Plastic Hinge Properties in Nonlinear Analysis of
Reinforeced Concrete Buildings." Engineering Structures, Vol.28 (No.11) 1494-1502.
Internation Standardization Organization (ISO). 2007. Timber Structure - Static and Cyclic Lateral
Load Test Method for Shear Walls - ISO 21581.
Keenan, F. 1986. Limit States Design of Wood Structures. Toronto, ON: Canada Morrison Hershfield
Ltd.
Khorasani, Y. 2010. Feasibility Study of Hybrid Wood Steel Structures. Thesis (MASc), Vancouver,
Canada: University of British Columbia.
Kodor, V.R., M.A. Erki, and J. Quenneville. 1995. "Seismic Design and Analysis of Masonry Infilled
Frames." Canadian Journal of Civil Engineering Vol. 22 (No.3) 576-587.
Koshihara, M., Isoda H., and S. Yusa. 2005. "The Design and Installation of Five-Storey New Timber
Building in Japan." Summary of Technical Papers of Annual Meeting. Architectural Institute
of Japan. 201-206.
Krawinkler, H., F. Parisi, L. Ibarra, A. Ayoub, and R. Medina. n.d. Development of a Testing Protocol
for Woodframe Structures. CUREE Publication No. W-02, Consortium of Universities for
Research in Earthquake Engineering (CUREE).
Krisciunas, R. 1996. "Ontario's experience with Composite Wood/Steel Bridges." National
Conference on Wood Tansportation Structures. Madison, US: US Department of Agriculture,
Forest Sevice, Forest, Products Lab.
Lignos, D., and H. Krawinkler. 2011. "Deterioration Modeling of Steel Components in Support of
Collapse Prediction of Steel Moment Frames under Earthqauke Loading." Journal of
Structural Engineering, ASCE, Vol. 137 (No.11) 1291-1302.
73
Maloney. 1996. "The Family of wood Composite Materials." Forest Porducts Journal, Vol. 46 (No.2)
19-26.
Mitchell, D, R Tremblay, E Karacabeyli, P Paultre, M Saatcioglu, and D Anderson. 2003. "Seismic
force modification factors for the proposed 2005 edition of the National Building Code of
Canada." Canadian Journal of Civil Engineering Vol.30 308-327.
Mohammad, M., S. Gagnon, E. Karacabeyli, and M. Popovski. 2011. "Innovative Mid-rise Timber
Structures Offer New Opportunities for Designers." Structural Engineers Association of
California (SEAOC). Las Vegas, US.
Moore, M. 2000. "Scotia Place - 12 Stprey Apartment Building A Cas Study of High-Rise Construction
Using Wood and Steel." World Conference of Timber Engineering (WCTE). Vancouver,
Canada.
NRC. 2010. National Building Code of Canada 2010. Ottawa, Ontario: National Research Council of
Canada.
Pacifiec Earthquake Engineering Research Center (PEER), Berkely. 2011. Peer Ground Motion
Database. November 8. Accessed December 08, 2012.
http://peer.berkeley.edu/peer_ground_motion_database/.
Popovski, M, J. Schneider, and M. Schweinsteiger. 2010. "Lateral Load Resistance of Cross-
Laminated Wood Panels." World Conference on Timber Engineering. Trentino, Italy: WCTE.
Popovski, M., and E. Karacabeyli. 2011. Seismic Performance of CLT Structures. Vancouver, Canada:
FPInnovations.
Reid, S., and C. Peng. 1997. "Dynamic Uniaxial Crushing of Wood." International Journal of Impact
Engineering, Vol. 19 (No.5-6) 531-570.
Rinaldin, G., C. Amadio, and M. Fragiacomo. 2011. "A Component Approach for Non-lilnear
Behaviour of Cross-Laminated Solid Timber Panels." 14th ANIDIS Conference. Ohrid,
Macedonia.
Schellenberg, A. n.d. OpenSeesWiki: Two Node Link Element. Accessed 03 03, 2013.
http://opensees.berkeley.edu/wiki/index.php/Two_Node_Link_Element.
Schneider, J. 2009. Connections in Cross-Laminated-Timber Shear Walls Considering the Behaviour
under Monotonic and Cyclic Lateral Loading. Thesis (M.A.Sc), Stutgart, Germany: University
of Stutgart.
74
Smith, T., S. Pampanin, M. Fragiacomo, and A. Buchanan. 2008. "Design and Construction of
Prestressed Timber Buildings for Seismic Areas." New Zealand Timber Design Journal Vol. 16
(No.3) 3-10.
Structurlam. n.d. "Cross Laminated Timber Design Guide." Structurlam Cross Laminated Timber.
Accessed 12 07, 2012.
http://www.structurlam.com/product/images/CLT_Design_Guide_Ver6.pdf.
StructurLam. n.d. "Cross Laminated Timber Design Guide." StructurLam Cross Laminated Timber.
Accessed 12 04, 2012.
http://www.structurlam.com/product/images/CLT_Design_Guide_Ver6.pdf.
Sturzenbecher, R., K. Hofstetter, and J Eberhardsteiner. 2010. "Cross Laminated Timber: A Multi-
Layer, Shear Compliant Plate and its Mechanical Behaviour." World Conference on Timber
Engineering (WCTE). Terntino, Italy.
Varoglu, Karacabeyli, Stiemer, Ni, Buitlaar, and Lungu. 2007. "Midply Shear wall System:
Performance in Dynamic testing." ASCE Journal of Structural Engineering, Vol. 133 (No.7)
1035-1042.
Xiong, H., and G. Jia. 2008. "Research on Seismic Behaviour of Wood-Concrete Hybrid Structure."
World Conference on Timber Engineering (WCTE). Miyazaki, Japan.
Yousuf, M., and A. Bagchi. 2009. "Seismic Design and Performance Evaluation of Steel-Frame
Buildings Designed Using the 2005 National Building Code of Canada." Candian Journal of
Civil Engineering, Vol. 36 (No.2) 280-294.
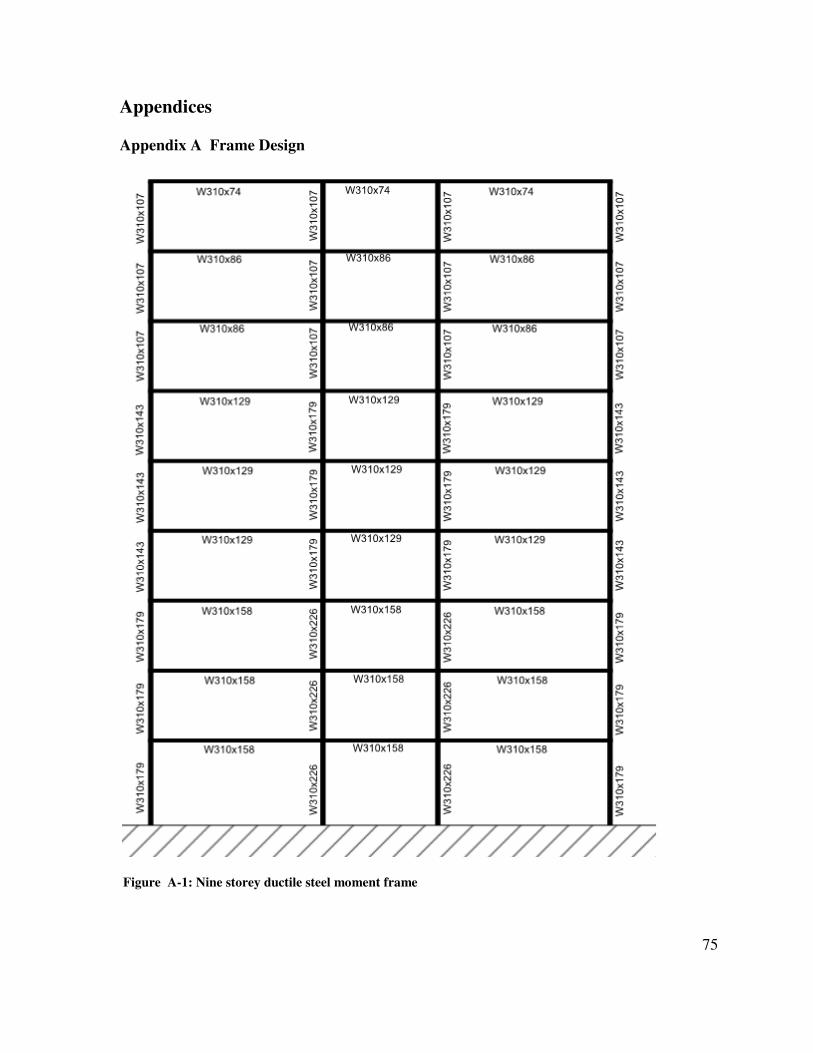
75
Appendices
Appendix A Frame Design
Figure A-1: Nine storey ductile steel moment frame
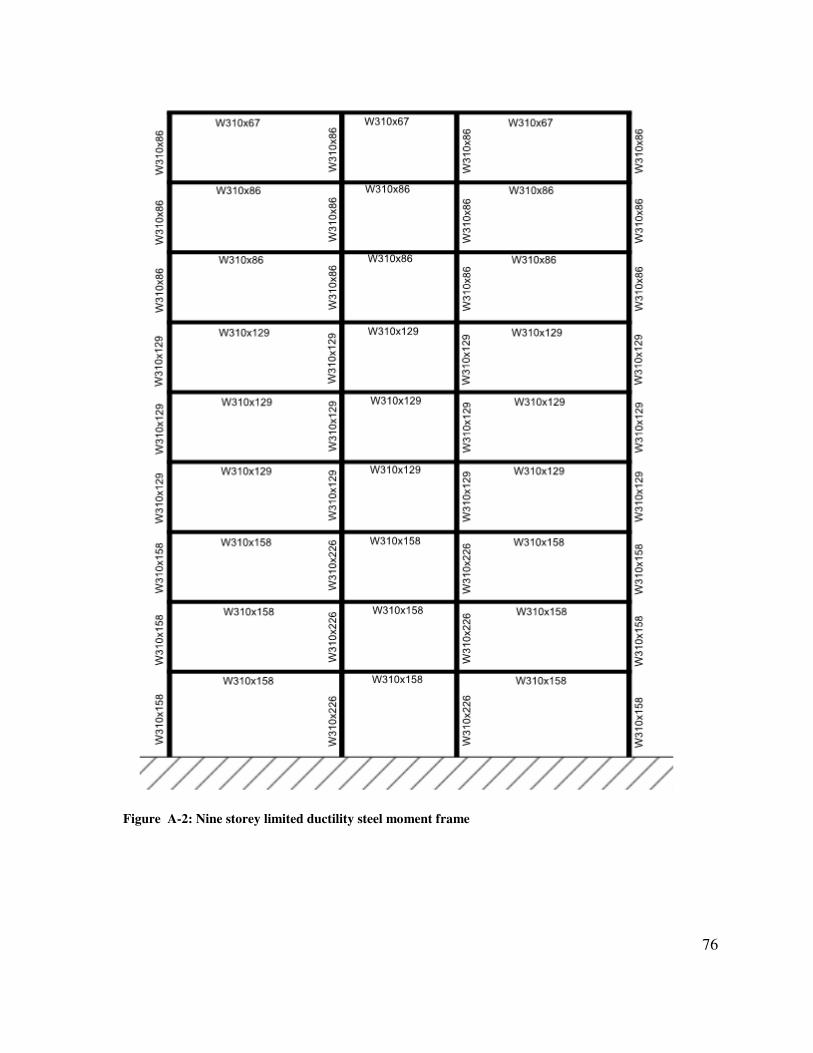
76
Figure A-2: Nine storey limited ductility steel moment frame
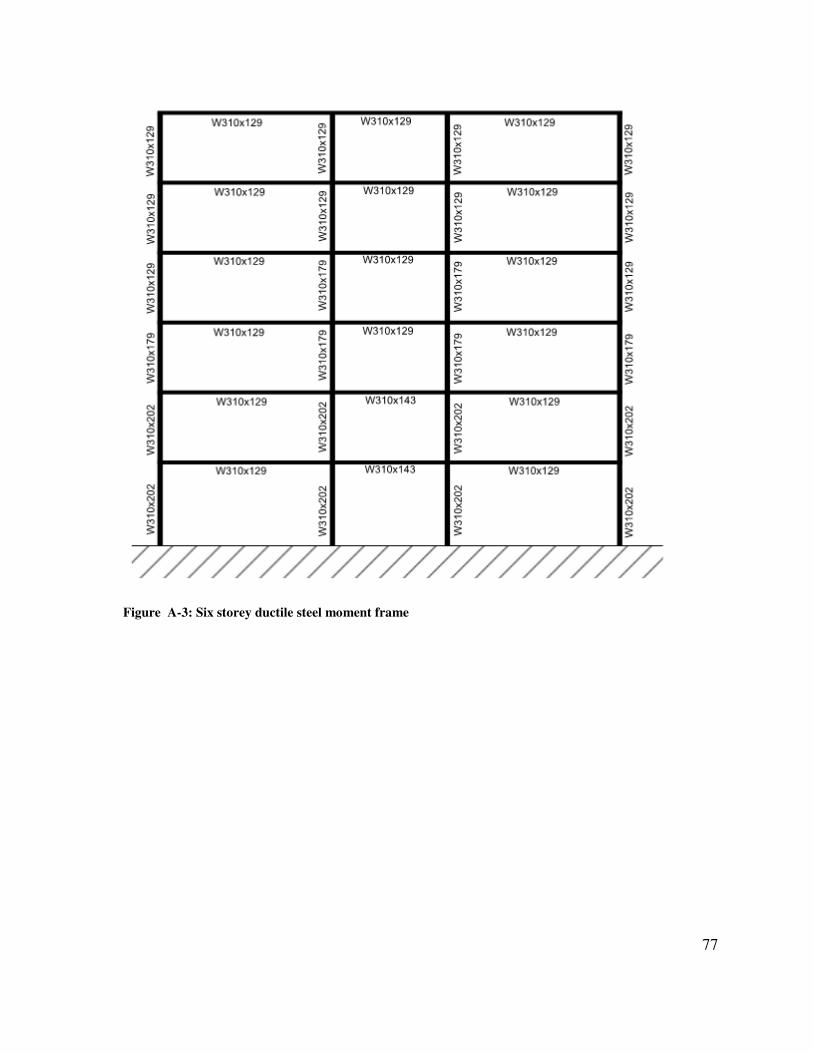
77
Figure A-3: Six storey ductile steel moment frame
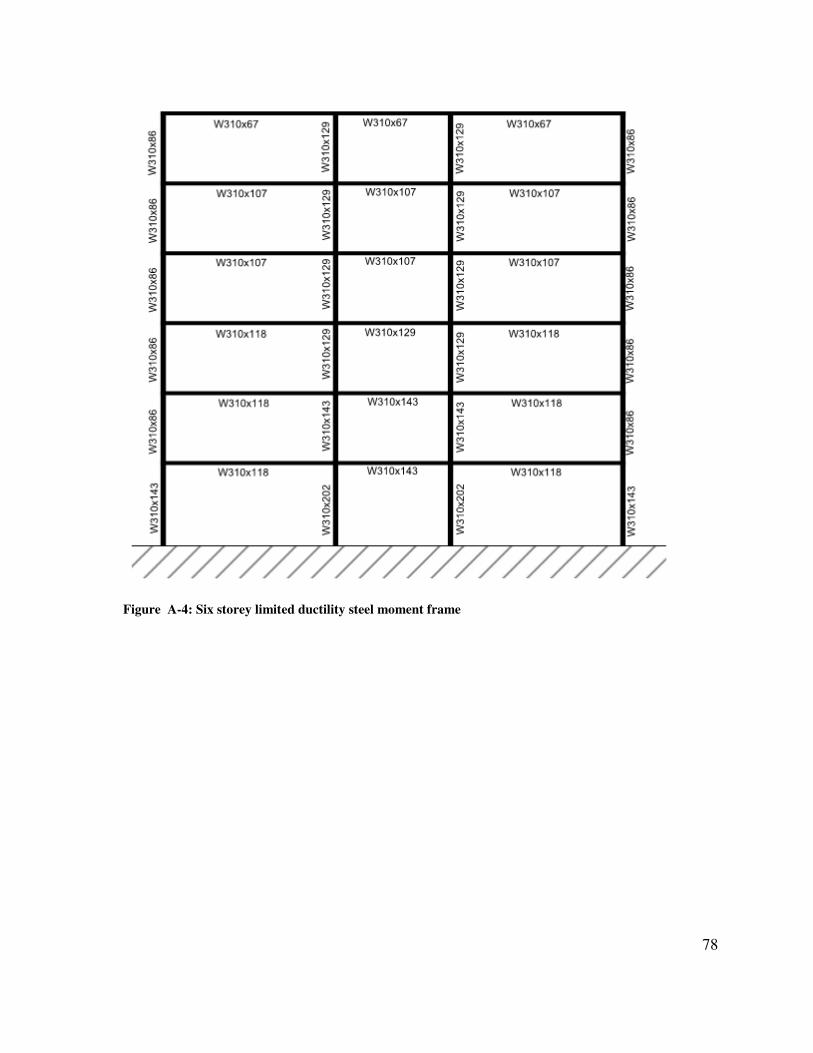
78
Figure A-4: Six storey limited ductility steel moment frame
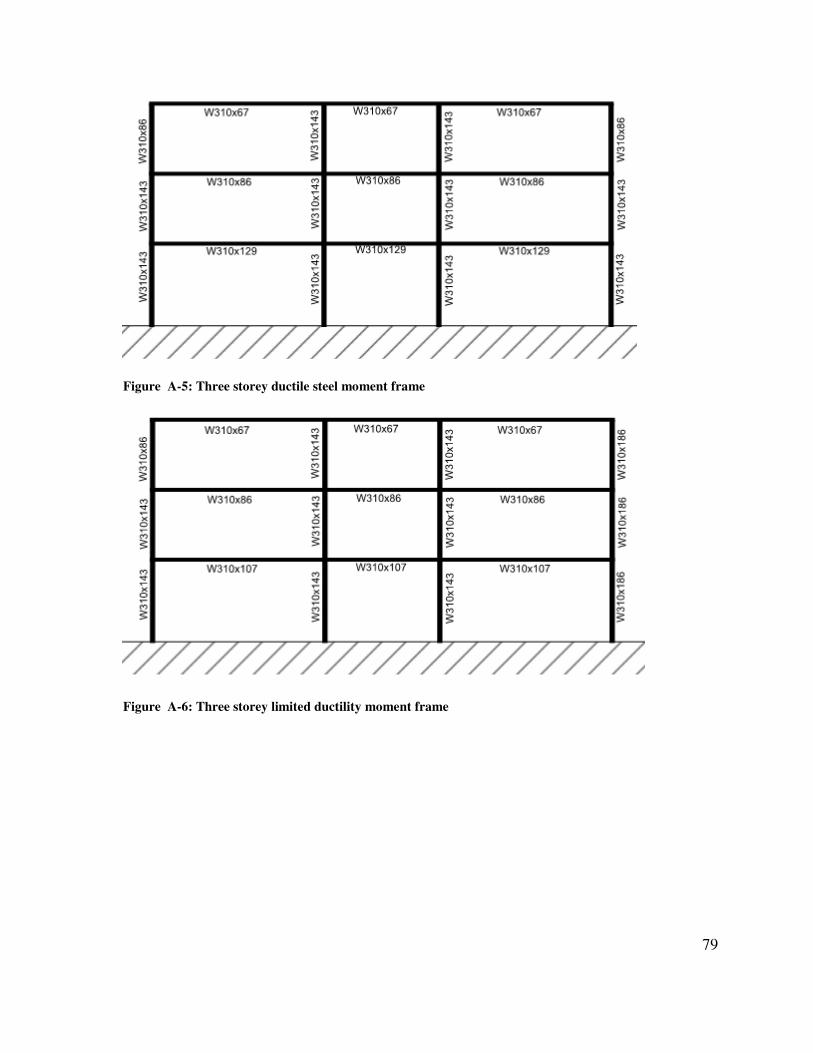
79
Figure A-5: Three storey ductile steel moment frame
Figure A-6: Three storey limited ductility moment frame
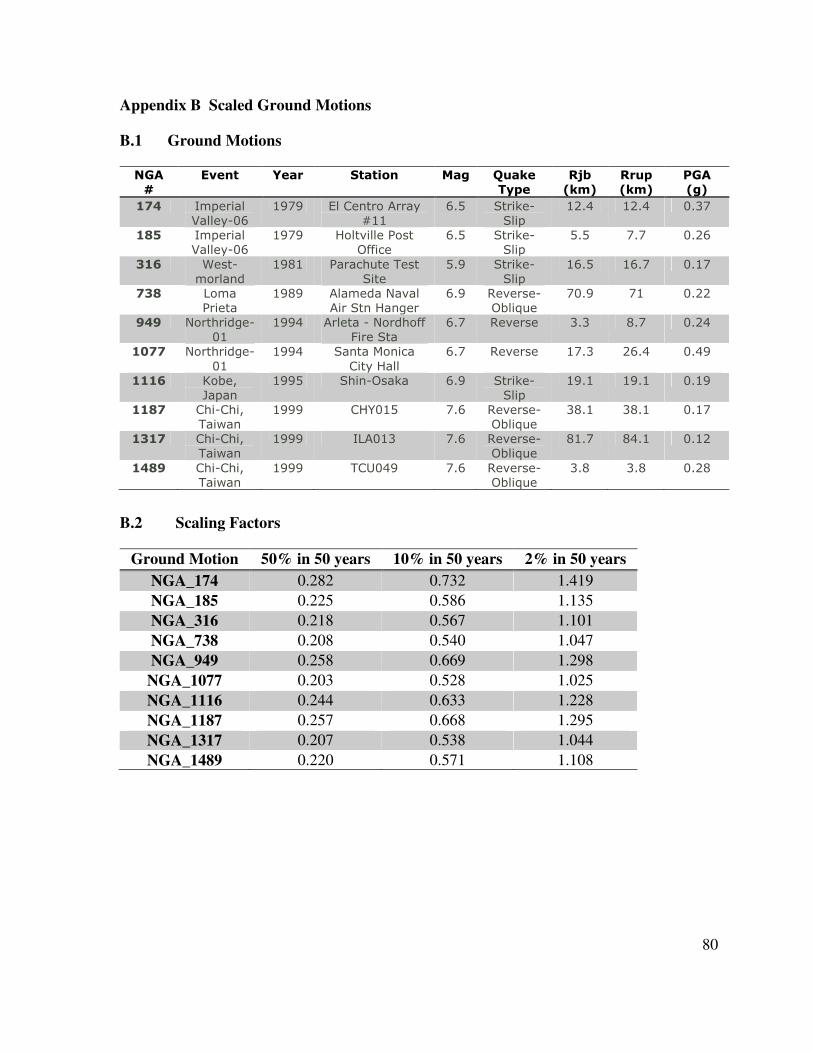
80
Appendix B Scaled Ground Motions
B.1 Ground Motions
NGA
#
Event Year Station Mag Quake
Type
Rjb
(km)
Rrup
(km)
PGA
(g)
174 Imperial
Valley-06
1979 El Centro Array
#11
6.5 Strike-
Slip
12.4 12.4 0.37
185 Imperial
Valley-06
1979 Holtville Post
Office
6.5 Strike-
Slip
5.5 7.7 0.26
316 West-
morland
1981 Parachute Test
Site
5.9 Strike-
Slip
16.5 16.7 0.17
738 Loma
Prieta
1989 Alameda Naval
Air Stn Hanger
6.9 Reverse-
Oblique
70.9 71 0.22
949 Northridge-
01
1994 Arleta - Nordhoff
Fire Sta
6.7 Reverse 3.3 8.7 0.24
1077 Northridge-
01
1994 Santa Monica
City Hall
6.7 Reverse 17.3 26.4 0.49
1116 Kobe,
Japan
1995 Shin-Osaka 6.9 Strike-
Slip
19.1 19.1 0.19
1187 Chi-Chi,
Taiwan
1999 CHY015 7.6 Reverse-
Oblique
38.1 38.1 0.17
1317 Chi-Chi,
Taiwan
1999 ILA013 7.6 Reverse-
Oblique
81.7 84.1 0.12
1489 Chi-Chi,
Taiwan
1999 TCU049 7.6 Reverse-
Oblique
3.8 3.8 0.28
B.2 Scaling Factors
Ground Motion 50% in 50 years 10% in 50 years 2% in 50 years
NGA_174 0.282 0.732 1.419
NGA_185 0.225 0.586 1.135
NGA_316 0.218 0.567 1.101
NGA_738 0.208 0.540 1.047
NGA_949 0.258 0.669 1.298
NGA_1077 0.203 0.528 1.025
NGA_1116 0.244 0.633 1.228
NGA_1187 0.257 0.668 1.295
NGA_1317 0.207 0.538 1.044
NGA_1489 0.220 0.571 1.108