
CLOU 15129 2013 Annual Report · construction mindset, then construct with an operations mindset,...
119
ENGINEERED FOR PRODUCTIVITY 2013 ANNUAL REPORT For personal use only
Transcript of CLOU 15129 2013 Annual Report · construction mindset, then construct with an operations mindset,...

engineereD for proDuctivity
clo
ug
H
20
13 an
nu
al r
epo
rt
2013 annual report
For
per
sona
l use
onl
y
contract value contract type
> $1 billion
$401 million - $1 billion
$251 - $401 million
$51 - $401 million
< $50 million
BRISBANE
PORT MORESBY
MELBOURNE ENGINEERING CENTRE
PERTH
NAAN3 50%
Gorgon Project EPCM 20%
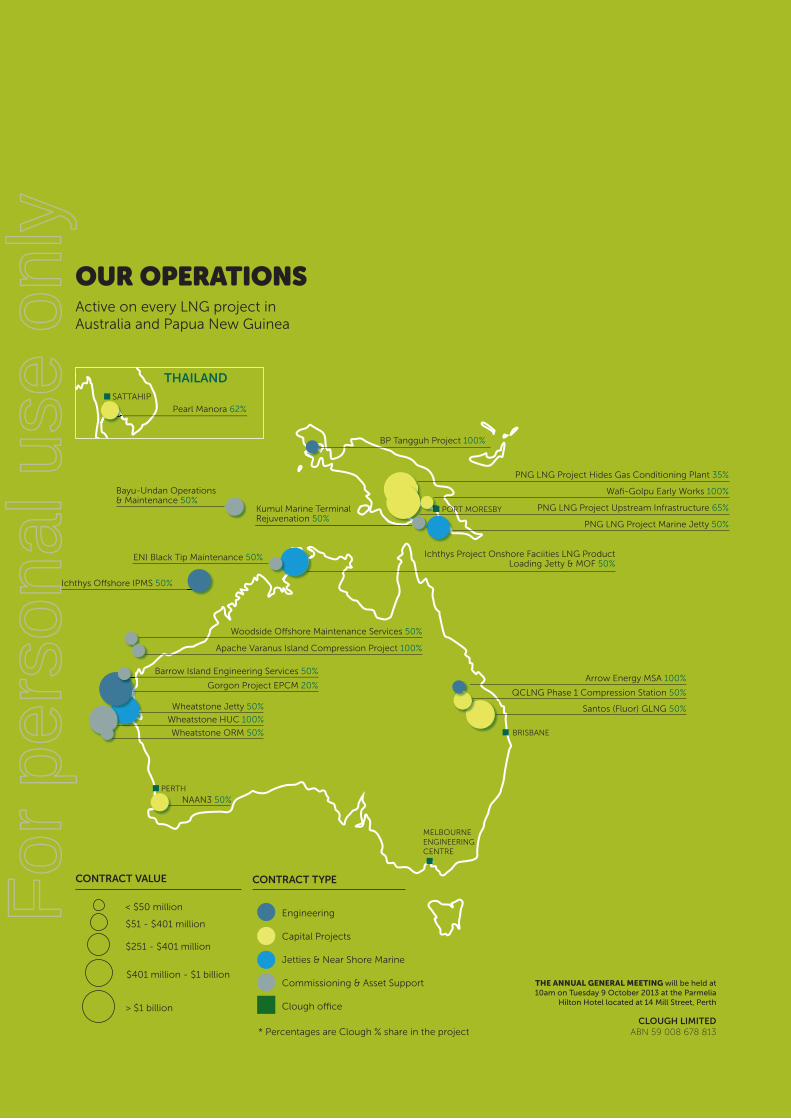
Bayu-Undan Operations & Maintenance 50%
Kumul Marine Terminal Rejuvenation 50%
BP Tangguh Project 100%
Woodside Off shore Maintenance Services 50%
Apache Varanus Island Compression Project 100%
Wheatstone HUC 100%
Wheatstone ORM 50%
Wheatstone Jetty 50%
Ichthys Off shore IPMS 50%
Ichthys Project Onshore Faciities LNG Product Loading Jetty & MOF 50%
ENI Black Tip Maintenance 50%
Santos (Fluor) GLNG 50%
CLOuGH LImITEDABN 59 008 678 813
tHe AnnUAl GeneRAl MeetinG will be held at 10am on Tuesday 9 October 2013 at the Parmelia
Hilton Hotel located at 14 Mill Street, Perth
QCLNG Phase 1 Compression Station 50%
Arrow Energy MSA 100%Barrow Island Engineering Services 50%
PNG LNG Project Marine Jetty 50%
Wafi -Golpu Early Works 100%
PNG LNG Project Hides Gas Conditioning Plant 35%
PNG LNG Project Upstream Infrastructure 65%
SATTAHIP
Pearl Manora 62%
Capital Projects
Jetties & Near Shore Marine
* Percentages are Clough % share in the project
Commissioning & Asset Support
Clough offi ce
Engineering
our operationsActive on every LNG project in Australia and Papua New Guinea
thailand
For
per
sona
l use
onl
y

engineered for productivity
engineereD for proDuctivityWe work with the world’s largest energy and resources companies to engineer, construct, commission, maintain and optimise a comprehensive range of infrastructure for energy, chemical, mining and mineral projects.
YEAR ESTABLISHED
1919PEoPLE
6,343
DELIvERIng vALuE
We strive to add real value to our clients’ operations through industry leading safety, productivity and people performance.
SafetySafety is a value on which we do not compromise. Our safety culture is underpinned by behavioural based safety programs and an enduring commitment to Zero Harm to our people, the environment and the communities in which we operate.
ProductivityWe aim to set the industry benchmark for productivity. Our productivity program employs proprietary systems, processes and discipline to produce project performance reports that enable real time intervention to drive enhanced productivity performance.
PeopleWe are investing in our people to cultivate a strong pipeline of leaders, from graduates to executives, across our core competencies of engineering, project management, commissioning and production operations.
engineered for productivity
ouR DIffEREncEClough strives to eliminate cost and schedule overruns by managing risk across the project lifecycle.
We engineer to construct, and then construct to operate, optimising safety, productivity and cost across every phase of a project.
For
per
sona
l use
onl
y

cLougH HAS A SuccESSfuL TRAck REcoRD SPAnnIng 94 YEARS, THougH wE ARE STILL on A jouRnEY To TRAnSfoRm THE BuSInESS. wITH A nEw LEADERSHIP TEAm AnD InvIgoRATED STRATEgY, wE ARE RESPonDIng To InDuSTRY cHALLEngES, BY DRIvIng Down coST, EnHAncIng PRoDucTIvITY AnD DEvELoPIng THE PEoPLE, SkILLS AnD TEcHnoLogY To SuPPoRT THE InDuSTRY.
Our focus is on project execution excellence across the entire project lifecycle, from early concept evaluation and feasibility studies through to engineering design, construction, commissioning and long-term asset support and optimisation. We engineer with a construction mindset, then construct with an operations mindset, managing risk and driving out ineffi ciency at every phase of the project lifecycle.
Our improved operational performance, combined with strategies to reduce cost, diversify earnings and drive sustainable growth is delivering real value to our shareholders. Clough has delivered record results in a turbulent market environment, while closing the year with an order book at historically high levels.
This strong performance has been recognised by our major shareholder, Murray & Roberts, who has off ered to buy out our minority shareholders. The off er price of $1.46 represents an opportunity for Clough shareholders to realise signifi cant value for their investment and aligns with our aim of providing superior shareholder value.
a journey of transforMation
For
per
sona
l use
onl
y

overviewhighlights 04
the Clough report 06
our business model 08
our values 09
Cfo review 10
contents
operations overviewengineering 12
projects 14
Commissioning & asset support 16
safety 18
environment 19
leadership and governancegiving back 20
people 22
executive Committee 24
board of directors 26
Corporate governance 28
financial reportdirectors’ report 33
auditor’s independence declaration 53
Consolidated income statement 54
Consolidated statement ofComprehensive income 55
Consolidated balance sheet 56
Consolidated statement of Cash flows 57
Consolidated statement of Changes in equity 58
notes to the Consolidated financial statements 59
directors’ declaration 111
independent auditor’s report 112
shareholder and investor information 114
For
per
sona
l use
onl
y

clough annual report 20134
npat $ million
Basic eps cents
111% 109%
Clough has aChieved reCordfinanCial results while improving operational performanCe and sustaining an order book at historiCally high levels
read more aBout clough operationssee pages 12 - 17
total revenue $ million
50%
1,50
9.8
2013
782.5
2011
1,005.4
2012
eBit $ million
144%
2013
2011
2012
90.7
35.8
37.2
73.9
34.8
35.1
2013
2011
2012
9.5
4.6
4.6
2013
2011
2012
net assets $ million
32%
461
.8
310.6 34
9.5
2013
2011
2012
highlights overview
HigHligHts of a proDuctive year
closing order Book $ Billion
-2013
2013
2011
2012
2.3
1.3
2.3
For
per
sona
l use
onl
y

5engineered for productivity
full year HigHligHts
fy2013 FY2012 % change
financial – continuing operations $ million unless stated
Net profit after tax (NPAT) 73.9 35.1 111%
Basic earnings per share (EPS) cents 9.5c 4.6c 109%
Earnings before interest and tax (EBIT)1 90.7 37.2 144%
EBIT margin (%)1 6.0% 3.7% 62%
Total revenue2 1,509.8 1,005.4 50%
Net assets3 461.8 349.5 32%
Cash at hand3 441.2 146.5 201%
safety & people
Total Recordable Injury Frequency (TRIF) per million workhours 1.96 2.28 14%
Lost Time Injury Frequency (LTIF) per million workhours 0.13 0.14 7%
Workforce 6,343 4,785 33%
workforce people
33%
2013
2011
2012
6,343
3,636
4,785
trif safety performance per million work hours
14%
1.96
2.89
2.28
2013
2011
2012
ltif safety performance per million work hours
2011 7%
0.13
0.18
0.14
2013
2011
2012
* Total revenue and EBIT are non-IFRS earnings measures – refer to page 11 for details on non-IFRS financial information, a detailed profit and loss analysis and the footnotes referenced above.
For
per
sona
l use
onl
y

clough annual report 20136
chairman + ceo review
OperationsClough continued to work on over 20 major projects across Australia and Papua New Guinea throughout the year, with a good spread of projects across our four business divisions. We remain well positioned in the Liquefi ed Natural Gas (LNG) and Coal Seam Gas (CSG) sectors, and are working on every major LNG project in the execution phase in Australia and Papua New Guinea today. You can read more about these projects in the operations section of our Annual Report.
Our safety performance improved throughout the year, with Lost Time Injury rates declining by 7 per cent and Total Recordable Injury rates declining by 14 per cent. While these rates are Australian industry leading, we view safety as a never ending journey. Our aim is to make Clough a workplace that operates free of injury or incident.
Sadly, in July 2013, Clough recorded its fi rst fatality in 10 years on our PNG LNG project. This is a sobering reminder of how we must always remain vigilant on safety. Since this tragic incident, signifi cant work has been done on improving our safety risk processes to identify and reduce the risk of future fatalities.
FY2013 was characterised by a slowdown in economic growth in China leading to weaker demand for the commodities our clients provide. Along with the well-publicised productivity and cost challenges facing Australian projects, this has resulted in the postponement of many major mining and minerals projects and turbulent markets.
Clough has responded to industry challenges by implementing proactive austerity measures to eliminate cost ineffi ciency. In the past year these
measures have safely and sustainably achieved over $10 million in operational savings. During FY2014 the Company will continue to focus on driving down costs to remain competitive in an increasingly global environment.
In response to productivity challenges, Clough has invested signifi cantly in technology and systems to improve productivity performance. This includes proprietary software to enable real time productivity reporting on our projects. Productivity performance will be driven from the top, with Clough’s operating committee (Opcom) providing governance and oversight for all operations. We are driving the right behaviours at the project level, by aligning incentive programs for project staff with safety, cost and productivity outcomes.
Clough’s workforce grew by 33 per cent to 6,343 people throughout the year due to increased demand for our services. We continued to take a long term view by increasing investment in building the capability of our people. Leadership was strengthened with key appointments, including Rick Robinson as Executive Vice President of Projects, Geoff Bird as Vice President of Strategy and Commercial, and Peter Hayward as Vice President, Health, Safety and Environment. Succession planning and talent development programs continue to bolster our pipeline of future leaders, from graduates to executives.
In 2014 we will launch a project management development program in line with our long term aim to build superior project management capability that will diff erentiate Clough from our competition.
Your Company achieved record results in FY2013. Our commitment to establishing best practice in the areas of safety, cost and productivity underpinned strong fi nancial and operational performance.
tHe clougH reportkeith spence & kevin gallagher
safety iMproveDTotal recordable injuries down 14%, Lost time injuries down 7%
significant investMent in productivity systems & programs
neW HoriZons strategy developed
in sustainable cost savings achieved
>$10M
from 3.7 % to 6.0%
$2.3b Order book at historically high levels
Revenue secured for FY2014
$1.4b
$441.2M
ebit Margin iMproveD
cash
For
per
sona
l use
onl
y

7engineered for productivity
kEITH SPEncEINDEPENDENT NON-EXECUTIVE CHAIRMAN
kEvIn gALLAgHERCEO AND MANAGING DIRECTOR
We will seek to diversify earnings across our business divisions, markets and geographic regions. Re-establishing our business in the mining and minerals market remains a key part of our diversifi cation strategy. Despite a market correction of unprecedented proportions, we believe the cyclical nature of the mining and minerals sector will see this rebound, and Clough will be well positioned to leverage opportunities when this time comes. Our aim is to grow mining and minerals project revenue to 10 – 20 per cent of annual revenue.
In the short term, cost pressures and a signifi cant slowdown across the mining and minerals sector will create challenges, however in the mid to longer term we remain confi dent about the outlook for Clough. We see signifi cant opportunities in the LNG operations phase, including brownfi eld engineering, operations and maintenance services and minor and medium sustaining capital works, which combined with a controlled international expansion, will supplement the revenue from the major capital projects work, and drive long-term shareholder value.
I would like to take this opportunity to thank our shareholders, clients, partners and employees for your support throughout another successful year.
Strategic ProgressWe continued to implement our strategy, guided by our 4+2+3 foundation business model comprising four services: Engineering, Capital Projects, Jetties and Near Shore Marine and Commissioning & Asset Support; two market sectors: Energy and Chemicals and Mining and Minerals; and three key regions: Australia, Papua New Guinea and International.
Clough’s services span the full project lifecycle, from engineering through to operations. We off er clients a unique value proposition by engineering to construct, then constructing to operate, reducing risk by optimising safety, productivity and cost across every phase of a project. This full lifecycle service is a key competitive diff erentiator.
Our Engineering and Commissioning & Asset Support businesses represent our medium term growth areas both domestically and internationally, where we continue to invest in building capability. We strengthened our commissioning capability signifi cantly during FY2013 through the acquisition of leading Australian commissioning contractor e2o and the establishment of the Clough Coens Joint Venture, to provide commissioning services to the world’s largest fabrication yards in Korea and China.
Capital Projects and Jetties & Near Shore Marine represent our core foundation businesses, where our focus is on providing excellence in project execution and superior productivity for our clients.
In line with our strategy we took the decision to sell our 36 per cent holding in Forge Group Limited (Forge) for net proceeds of $184 million. Forge delivered strong growth and was an outstanding investment for Clough.
We were also pleased to evolve our strategy, with the introduction of our “new horizons” growth plan. This will manifest itself in the short to medium term with a controlled and orderly expansion of engineering led activities beyond Australia and Papua New Guinea. The fi rst step in this expansion will be the establishment of a United Kingdom engineering centre, in FY2014, to provide engineering services to the North Sea and Africa, where we see future LNG opportunities.
As a result of this new strategy, we have revised our business model to include new international regions, as outlined on page 8.
m&R ProposalOn 31 July 2013 Murray & Roberts (M&R) announced a conditional proposal (“the Proposal”) to acquire all outstanding shares in Clough it does not already own.
The off er price of $1.46 comprises a cash payment by M&R of $1.32 and the payment of a $0.14 dividend per share by Clough. This dividend is expected to be fully franked, providing up to an additional $0.06 per share for those Clough shareholders who are able to utilise the franking credit.
The Proposal is conditional on M&R completing confi rmatory due diligence, execution of a Scheme Implementation Agreement, and fi nal M&R Board approval.
The Proposal represents an opportunity for Clough shareholders to realise signifi cant value for their investment. The off er price is at a premium to the price at which Clough shares have traded on the ASX and is a 30.9% premium to the closing share price on the day prior to the announcement of the Proposal.
Clough’s independent directors intend to unanimously support the transaction, subject to an Independent Expert determining that the transaction is in the best interests of Clough shareholders, and no superior proposal emerging.
OutlookClough enters FY2014 in excellent shape. Our order book remains at record levels, at $2.3 billion, with $1.4 billion already secured for FY2014, and $705 million already secured for FY2015, and our operating margins continue to improve quarter on quarter.
In the coming year we will continue to invest in building capabilities and technology to strengthen our service off ering and deliver better cost and productivity outcomes to our clients. Expanding our asset support capability to provide increased operational support to clients will be a key focus as the LNG industry transitions from the construction phase to the operations phase.
in tHe coMing year WeWill continue to invest in builDing capabilities & tecHnology to strengtHen our service offering anD Deliver better cost & proDuctivity outcoMes to our clients
For
per
sona
l use
onl
y

A STRATEgY of EXcELLEncE
our business MoDel
2marketSectors
upstream, downstream, off shore, onshore, oil, gas and lng and petrochemicals markets
iron ore, coal, precious & other metals markets
energy & chemicals mining & minerals
4 Regions
australia png asia europe & africa
4core
Businesses
engineeringminor &
medium Capital projects
onshore projects
Jetties & near shore marine
Commissioning & asset support
maJor capital proJects
clougH’s 4+4+2 business MoDel structures tHe business for engineering leD international expansion
clough annual report 20138
We will focus on 4 key regions to continue our growth journey. We will expand our global footprint by entering new international regions including Asia, Europe and Africa, while continuing to deliver our full lifecycle services in our core regions of Australia and Papua new Guinea.
Engineering and Commissioning & Asset Support represent our growth businesses, where we continue to develop high value skills to service our core regions today and underpin our global expansion in the future.
minor, medium and major Capital Projects represent our foundation businesses where our focus is on execution excellence, cost effi ciency and superior productivity for our clients in our core regions.
We will deliver these services to blue chip clients operating in the Energy & Chemical and mining & minerals sectors.
For
per
sona
l use
onl
y

ZER
O H
ARM
PERFORMANCE PRO
DU
CTIV
ITY
INN
OVATIO
N INTEGRITY
C
LIEN
T FO
CU
SPURSUIT OF EXCELLENCE
9engineered for productivity
our values
perforManceWe take accountability for our performance and stretch ourselves to achieve our potential. We collaborate effectively to deliver business success.
proDuctivityWe strive for superior productivity through excellence in project execution, cost efficiency, planning and discipline. Our aim is to become the industry performance leader in each sector we operate.
client focusWe understand our clients’ needs and build strong win-win relationships that add real value to our clients’ operations.
integrityWe act with honesty and integrity. We have the courage to do the right thing.
innovationWe apply innovation to solve complex problems and adapt to the changing needs of our industry. We utilise leading edge technology, processes, systems and ideas to create and maintain a competitive advantage.
Zero HarMWe work sustainably and keep each other safe. Our goal is Zero Harm to our people, the environment and the communities in which we work.
pursuit of excellence is tHe pHilosopHy tHat Drives tHe clougH culture. it is tHe clougH Way.This philosophy is at the core of our values system, which embodies the areas of performance, productivity, client focus, integrity, innovation and Zero Harm. These values align with corporate initiatives we have implemented to address industry challenges.
For
per
sona
l use
onl
y
clough annual report 201310
financial results
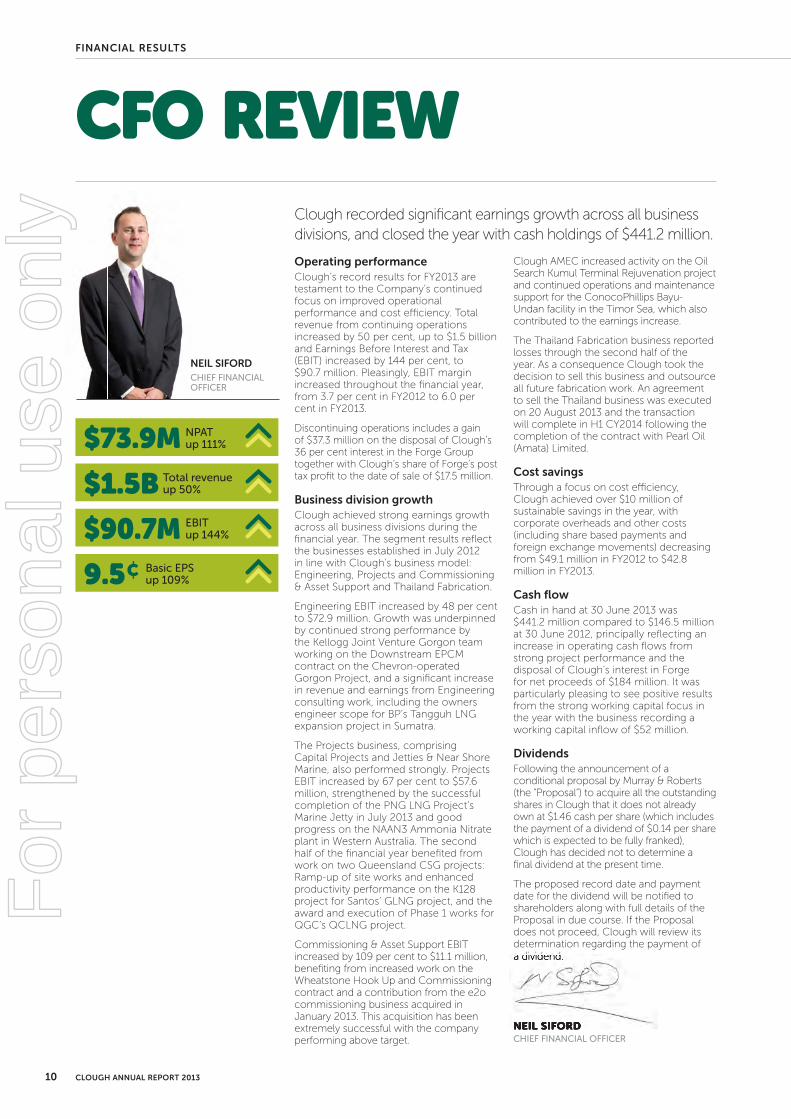
cfo revieWClough recorded signifi cant earnings growth across all business divisions, and closed the year with cash holdings of $441.2 million.
Operating performanceClough’s record results for FY2013 are testament to the Company’s continued focus on improved operational performance and cost effi ciency. Total revenue from continuing operations increased by 50 per cent, up to $1.5 billion and Earnings Before Interest and Tax (EBIT) increased by 144 per cent, to $90.7 million. Pleasingly, EBIT margin increased throughout the fi nancial year, from 3.7 per cent in FY2012 to 6.0 per cent in FY2013.
Discontinuing operations includes a gain of $37.3 million on the disposal of Clough’s 36 per cent interest in the Forge Group together with Clough’s share of Forge’s post tax profi t to the date of sale of $17.5 million.
Business division growthClough achieved strong earnings growth across all business divisions during the fi nancial year. The segment results refl ect the businesses established in July 2012 in line with Clough’s business model: Engineering, Projects and Commissioning & Asset Support and Thailand Fabrication.
Engineering EBIT increased by 48 per cent to $72.9 million. Growth was underpinned by continued strong performance by the Kellogg Joint Venture Gorgon team working on the Downstream EPCM contract on the Chevron-operated Gorgon Project, and a signifi cant increase in revenue and earnings from Engineering consulting work, including the owners engineer scope for BP’s Tangguh LNG expansion project in Sumatra.
The Projects business, comprising Capital Projects and Jetties & Near Shore Marine, also performed strongly. Projects EBIT increased by 67 per cent to $57.6 million, strengthened by the successful completion of the PNG LNG Project’s Marine Jetty in July 2013 and good progress on the NAAN3 Ammonia Nitrate plant in Western Australia. The second half of the fi nancial year benefi ted from work on two Queensland CSG projects: Ramp-up of site works and enhanced productivity performance on the K128 project for Santos’ GLNG project, and the award and execution of Phase 1 works for QGC’s QCLNG project.
Commissioning & Asset Support EBIT increased by 109 per cent to $11.1 million, benefi ting from increased work on the Wheatstone Hook Up and Commissioning contract and a contribution from the e2o commissioning business acquired in January 2013. This acquisition has been extremely successful with the company performing above target.
Clough AMEC increased activity on the Oil Search Kumul Terminal Rejuvenation project and continued operations and maintenance support for the ConocoPhillips Bayu-Undan facility in the Timor Sea, which also contributed to the earnings increase.
The Thailand Fabrication business reported losses through the second half of the year. As a consequence Clough took the decision to sell this business and outsource all future fabrication work. An agreement to sell the Thailand business was executed on 20 August 2013 and the transaction will complete in H1 CY2014 following the completion of the contract with Pearl Oil (Amata) Limited.
Cost savingsThrough a focus on cost effi ciency, Clough achieved over $10 million of sustainable savings in the year, with corporate overheads and other costs (including share based payments and foreign exchange movements) decreasing from $49.1 million in FY2012 to $42.8 million in FY2013.
Cash fl owCash in hand at 30 June 2013 was $441.2 million compared to $146.5 million at 30 June 2012, principally refl ecting an increase in operating cash fl ows from strong project performance and the disposal of Clough’s interest in Forge for net proceeds of $184 million. It was particularly pleasing to see positive results from the strong working capital focus in the year with the business recording a working capital infl ow of $52 million.
DividendsFollowing the announcement of a conditional proposal by Murray & Roberts (the “Proposal”) to acquire all the outstanding shares in Clough that it does not already own at $1.46 cash per share (which includes the payment of a dividend of $0.14 per share which is expected to be fully franked), Clough has decided not to determine a fi nal dividend at the present time.
The proposed record date and payment date for the dividend will be notifi ed to shareholders along with full details of the Proposal in due course. If the Proposal does not proceed, Clough will review its determination regarding the payment of a dividend.
neil sifordCHIEF FINANCIAL OFFICER
nEIL SIfoRDCHIEF FINANCIAL OFFICER
a dividend.
nEIL SIfoRD
$73.9M NPAT up 111%
$1.5b Total revenue up 50%
9.5 Basic EPS up 109%
$90.7M EBIT up 144%
For
per
sona
l use
onl
y
11engineered for productivity
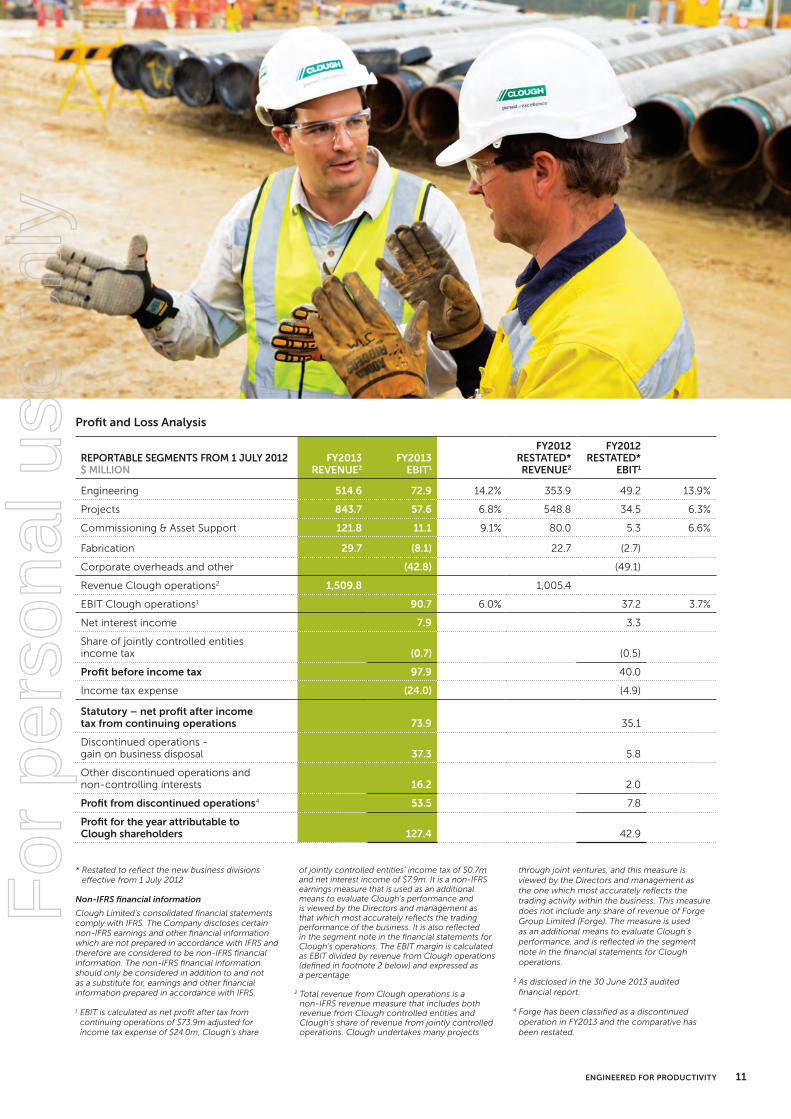
reportaBle segments from 1 July 2012 $ million
fy2013 revenue2
fy2013 eBit1
fy2012 restated* revenue2
fy2012 restated*
eBit1
Engineering 514.6 72.9 14.2% 353.9 49.2 13.9%
Projects 843.7 57.6 6.8% 548.8 34.5 6.3%
Commissioning & Asset Support 121.8 11.1 9.1% 80.0 5.3 6.6%
Fabrication 29.7 (8.1) 22.7 (2.7)
Corporate overheads and other (42.8) (49.1)
Revenue Clough operations2 1,509.8 1,005.4
EBIT Clough operations1 90.7 6.0% 37.2 3.7%
Net interest income 7.9 3.3
Share of jointly controlled entities income tax (0.7) (0.5)
Profit before income tax 97.9 40.0
Income tax expense (24.0) (4.9)
Statutory – net profit after income tax from continuing operations 73.9 35.1
Discontinued operations - gain on business disposal 37.3 5.8
Other discontinued operations and non-controlling interests 16.2 2.0
profit from discontinued operations4 53.5 7.8
profit for the year attributable to clough shareholders 127.4 42.9
* Restated to reflect the new business divisions effective from 1 July 2012
Non-IFRS financial information
Clough Limited’s consolidated financial statements comply with IFRS. The Company discloses certain non-IFRS earnings and other financial information which are not prepared in accordance with IFRS and therefore are considered to be non-IFRS financial information. The non-IFRS financial information should only be considered in addition to and not as a substitute for, earnings and other financial information prepared in accordance with IFRS.
1 EBIT is calculated as net profit after tax from continuing operations of $73.9m adjusted for income tax expense of $24.0m, Clough’s share
of jointly controlled entities’ income tax of $0.7m and net interest income of $7.9m. It is a non-IFRS earnings measure that is used as an additional means to evaluate Clough’s performance and is viewed by the Directors and management as that which most accurately reflects the trading performance of the business. It is also reflected in the segment note in the financial statements for Clough’s operations. The EBIT margin is calculated as EBIT divided by revenue from Clough operations (defined in footnote 2 below) and expressed as a percentage.
2 Total revenue from Clough operations is a non-IFRS revenue measure that includes both revenue from Clough controlled entities and Clough’s share of revenue from jointly controlled operations. Clough undertakes many projects
through joint ventures, and this measure is viewed by the Directors and management as the one which most accurately reflects the trading activity within the business. This measure does not include any share of revenue of Forge Group Limited (Forge). The measure is used as an additional means to evaluate Clough’s performance, and is reflected in the segment note in the financial statements for Clough operations.
3 As disclosed in the 30 June 2013 audited financial report.
4 Forge has been classified as a discontinued operation in FY2013 and the comparative has been restated.
Profit and Loss Analysis
For
per
sona
l use
onl
y

clough annual report 201312
operations overview
Engineering excellence across every phaseClough’s Engineering business continued to work on fi ve major contracts and over 20 Master Service Agreements with blue chip clients during the fi nancial year, which has supported improved fi nancial performance.
Our engineering services are provided across the entire project lifecycle, which is a key competitive diff erentiator. We deliver concept and feasibility studies, front end engineering design (FEED) and detailed design services at the development stage, through to highly specialised process optimisation and debottlenecking services to enhance asset production, uptime and life during the operations phase.
Safety is inherent in the delivery of our engineering services. Our engineers design for construction to minimise risk during the construction phase of the project. Designing with a construction mindset makes the execution phase of a project safer and more effi cient.
Engineering highlightsOur commitment to adding real value to our clients’ projects was rewarded with increased scopes on existing contracts and the achievement of major development milestones on key projects.
A signifi cant achievement has been growing our number of engineers to more than 400 people, which has strengthened our technical capability and capacity to provide enhanced services to clients.
We continued to make strong progress on the Chevron-operated Gorgon Project as part of the Kellogg Joint Venture Gorgon’s Downstream EPCM team. We have approximately 730 people committed to the Project, including over 100 engineers. The project has successfully transitioned from the engineering and procurement phase to the construction phase and is based on Barrow Island in Western Australia.
Also in Western Australia, on Varanus Island our people have completed
detailed engineering and procurement services for Apache’s Varanus Island compressor station project, while on CSBP’s NAAN3 project, we provided a team of 80 engineers to implement the Early Contractor Involvement phase through to construction.
On the international front, we achieved signifi cant scope growth on the BP Tangguh project in Indonesia, a testament to the value we add through our highly specialised process engineering services. This project has grown from a small original scope to a full basis of engineering design, which has recently been completed. We will soon commence engineering support on the expansion of the Tangguh LNG facility.
We continue to work as part of an integrated team with INPEX on the Off shore Integrated Project Management Support Services (IPMS) contract. A signifi cant milestone was the commencement of fabrication for the off shore facilities in Korea.
Several conceptual studies have been completed for international energy clients including Woodside and Chevron. The work is an important initial step in the planning and budgeting of any asset under consideration.
Creating engineering pathways Our total engineering workforce has increased by 62 per cent to 1,371 people employed across Australasia. We expect this number to continue to rise in FY2014 with several new opportunities in the pipeline and existing projects set to mature to peak workforce.
We are striving to broaden the skills and expertise of our people by implementing a rotation program that enables our engineers to experience diff erent projects and roles. Around 50 per cent of our engineers are seconded to work on our projects or in-house with our clients throughout the year.
engineering
This fi nancial year has seen our reputation continue to grow as the leading provider of full lifecycle engineering services to the Australian oil and gas sector. We increased scopes on some of our largest engineering contracts, expanded our workforce and delivered record fi nancial results.gary Bowtell
EXECUTIVE VICE PRESIDENT, ENGINEERING
34.1%
contriBution to total revenue %
eBit engineering $ million
revenue engineering $ million
workforce engineeringpeople
48%
45%
62%
49.2
353.9
846
2013
2013
2013
2012
2012
2012
72.9
514.6
1,37
1
engineering
proJects
faBrication
commissioning & asset support
For
per
sona
l use
onl
y

13engineered for productivity
Our 12-week vacation student internship and three-year graduate program continued to attract, nurture and progress some of Australia’s brightest young engineering talent. Today we employ 50 graduate engineers across the three year program.
Our vacation internship, an important pipeline for our graduate program, was recently ranked as number 16 across all intern programs in Australia by the Australian Association of Graduate Employers.
We were pleased to award the first two scholarships to the University of Western Australia’s top engineering students, as part of our reinvigorated Clough Scholars program. This program was initially established by Harold Clough
in 1969 and ran until 2004. The program was relaunched in 2012. The new Clough scholars will join the Clough Scholars Alumni, which is a global network of leaders in industry, business and government.
Engineering led international expansionIn FY2014 we will embark on a strategy of engineering led international expansion. We are opening an engineering office in the UK to provide engineering services to the North Sea and Africa and will re-establish an engineering office in Jakarta to support the Tangguh project and leverage opportunities in South East Asia.
We will also continue to provide our specialised engineering services to some of the world’s largest resource projects in Australia, where we see growth opportunities in the short and medium term.
We are striving tobroaDen tHe skills anD expertise of our people by iMpleMenting a rotation prograM tHat enables our engineers to experience Different projects anD roles
Clients
For
per
sona
l use
onl
y

clough annual report 201314
operations overview
projects
Our Projects business enters FY2014 in a strong position after achieving excellent fi nancial results and a record order book. During the year we increased scopes on existing projects and have set new benchmarks in productivity through continued innovation.
The Australian contracting industry endured a challenging year. Market conditions softened with our clients taking a more cautious approach to investment in new energy and resources projects. In this competitive market the onus has been on contractors to demonstrate greater client value through improved safety, productivity and cost performance.
Clough’s Projects business continued to deliver project construction milestones which drove strong fi nancial results including improved EBIT and cash fl ow performance.
Our constructability approach of designing to construct, then constructing to operate enables greater management of risk across the entire project lifecycle. Supported by our full range of project services we are well positioned for continued growth in Australia and internationally.
HighlightsOur workforce in Papua New Guinea (PNG) grew to over 3,000 people as we continued to execute three scopes of work for ExxonMobil’s PNG LNG Project. The PNG LNG Marine Jetty was safely completed while our strong performance on the PNG LNG Upstream Infrastructure work scope resulted in a further $75 million of work orders, and a scope increase for installation of a portion of the onshore pipeline project.
The recent completion of the Komo Airfi eld enabled the PNG LNG project team to deliver large items to the Hides Gas Conditioning Plant via Antonov aircraft. The construction of the Hides Gas Conditioning Plant continues to progress well, and has recorded 12 million work hours lost time injury free.
Our INPEX Ichthys jetty and module offl oading facility projects began to ramp up in the Northern Territory, with the construction team mobilising to site in July 2013. Chevron’s Wheatstone LNG jetty in Western Australia also progressed, and will move into the execution phase in FY2014.
Strong productivity performance continued on CSBP’s NAAN3 project, which continues to deliver on cost, schedule and safety targets, as the project team works towards completion in December 2013.
Performance has also improved on Santos’ GLNG K128 contract, which involves the construction of 400 kilometres of gas and water transmission pipelines, compression facilities and camps. The project team achieved three million work hours lost time injury free, and greater productivity through better client and contractor alignment.
The Stage 1 work for QGC’s QCLNG Compressor Station project was secured and since commencement, the project value has increased from $80 million up to $176 million. While we did not progress to Stage 2, there are opportunities to be involved in future phases of work as the project progresses.
People and leadership Our Projects’ leadership team was strengthened through key management appointments during the year. Rob Powers was appointed General Manager for Queensland Projects, Ivor Peries was appointed Head of Operations for PNG, and Andy Antoci has taken the new position of General Manager, Projects for Western Australia.
A new organisational structure was implemented to enhance our alignment with the corporate strategy. The change has provided more control over our business processes and project outcomes.
Credit goes to all staff who contributed to our strong safety performance in FY2013. A total of 35 million work hours were completed across Australia and PNG without a single lost time injury, up to 30 June 2013.
Productivity innovationOur new productivity off ering, Clear View, will set the industry benchmark for
rick roBinsonEXECUTIVE VICE PRESIDENT, PROJECTS
eBit proJects $ million
revenue proJects $ million
workforce proJectspeople
67%
54%
33%
34.5
548.8
3,214
2013
2013
2013
2012
2012
2012
57.6
843.7
4,286
55.9%
contriBution to total revenue %
engineering
proJects
faBrication
commissioning & asset support
For
per
sona
l use
onl
y

15engineered for productivity
productivity performance. Clear View uses metrics and proprietary software to enable real-time reporting on our project performance. Productivity will be driven from the top through daily reports which will be reviewed by leadership and project management.
These reports will focus on making project and construction managers accountable for productivity performance.
Outlook and growthThe year ahead will continue to be challenging however we start from a strong position and in the longer term, we see many opportunities to enhance our healthy order book in the oil and gas and mining and minerals sectors.
There will be opportunities to service the iron ore and bauxite industries in Western Australia and Queensland. Clough is also strongly positioned in the Queensland CSG sector, with many future opportunities on the horizon.
Our continued focus on safety, productivity and cost efficiency will further enhance our market competitiveness and continue to underpin growth in the short and medium term.
Clientsour continueD
focus on safety, proDuctivity anD cost efficiency Will furtHer enHance our Market coMpetitiveness anD continue to unDerpin groWtH in tHe sHort anD MeDiuM terM
For
per
sona
l use
onl
y
clough annual report 201316
operations overview
coMMissioning & asset support
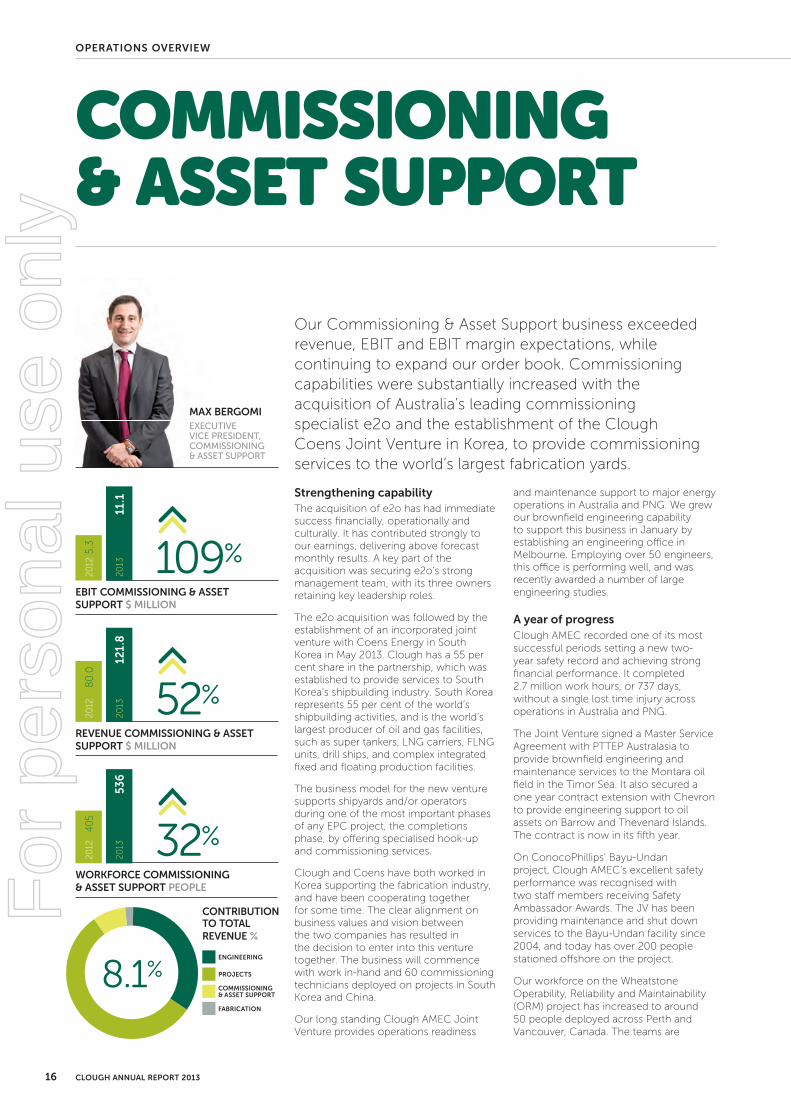
Our Commissioning & Asset Support business exceeded revenue, EBIT and EBIT margin expectations, while continuing to expand our order book. Commissioning capabilities were substantially increased with the acquisition of Australia’s leading commissioning specialist e2o and the establishment of the Clough Coens Joint Venture in Korea, to provide commissioning services to the world’s largest fabrication yards.
Strengthening capabilityThe acquisition of e2o has had immediate success fi nancially, operationally and culturally. It has contributed strongly to our earnings, delivering above forecast monthly results. A key part of the acquisition was securing e2o’s strong management team, with its three owners retaining key leadership roles.
The e2o acquisition was followed by the establishment of an incorporated joint venture with Coens Energy in South Korea in May 2013. Clough has a 55 per cent share in the partnership, which was established to provide services to South Korea’s shipbuilding industry. South Korea represents 55 per cent of the world’s shipbuilding activities, and is the world’s largest producer of oil and gas facilities, such as super tankers, LNG carriers, FLNG units, drill ships, and complex integrated fi xed and fl oating production facilities.
The business model for the new venture supports shipyards and/or operators during one of the most important phases of any EPC project, the completions phase, by off ering specialised hook-up and commissioning services.
Clough and Coens have both worked in Korea supporting the fabrication industry, and have been cooperating together for some time. The clear alignment on business values and vision between the two companies has resulted in the decision to enter into this venture together. The business will commence with work in-hand and 60 commissioning technicians deployed on projects in South Korea and China.
Our long standing Clough AMEC Joint Venture provides operations readiness
and maintenance support to major energy operations in Australia and PNG. We grew our brownfi eld engineering capability to support this business in January by establishing an engineering offi ce in Melbourne. Employing over 50 engineers, this offi ce is performing well, and was recently awarded a number of large engineering studies.
A year of progressClough AMEC recorded one of its most successful periods setting a new two-year safety record and achieving strong fi nancial performance. It completed 2.7 million work hours, or 737 days, without a single lost time injury across operations in Australia and PNG.
The Joint Venture signed a Master Service Agreement with PTTEP Australasia to provide brownfi eld engineering and maintenance services to the Montara oil fi eld in the Timor Sea. It also secured a one year contract extension with Chevron to provide engineering support to oil assets on Barrow and Thevenard Islands. The contract is now in its fi fth year.
On ConocoPhillips’ Bayu-Undan project, Clough AMEC’s excellent safety performance was recognised with two staff members receiving Safety Ambassador Awards. The JV has been providing maintenance and shut down services to the Bayu-Undan facility since 2004, and today has over 200 people stationed off shore on the project.
Our workforce on the Wheatstone Operability, Reliability and Maintainability (ORM) project has increased to around 50 people deployed across Perth and Vancouver, Canada. The teams are
maX BergomiEXECUTIVE VICE PRESIDENT, COMMISSIONING & ASSET SUPPORT
eBit commissioning & asset support $ million
revenue commissioning & asset support $ million
workforce commissioning & asset support people
109%
52%
32%
5.3
80.0
405
2013
2013
2013
2012
2012
2012
11.1
121.8
536
8.1%
contriBution to total revenue %
engineering
proJects
faBrication
commissioning & asset support
For
per
sona
l use
onl
y

17engineered for productivity
working on completing the offshore platform operations manual, maintenance build, and training modules for employees required to operate the facility.
Work on Chevron’s Wheatstone Hook-Up and Commissioning (HUC) project continues to progress well. Our people are providing labour, materials and an accommodation support vessel to assist Chevron with the pre-commissioning, commissioning of integrated float over deck systems, offshore hook-up and start-up assistance. The focus for this year has been to place a number of large contracts, such as securing a state-of-the-art 400 man Accommodation Support Vessel that will be required during the offshore phase, and preparing for the commissioning phase in Korea, which is expected to start in Q1 of 2014.
Our role in supporting the Kellogg Joint Venture Gorgon team on the Chevron-operated Gorgon Project continues with commissioning personnel deployed to help prepare for the final stage of the Project. We also have dedicated commissioning and completions teams
supporting Santos and Origin on the GLNG and APLNG projects respectively.
People As part of a wider corporate strategy, we have invested in building capability through succession planning, career development, competency assessment and training of our people, from trades through to management. Our people strength combined with our focus on strong governance and compliance with our management systems and project controls is key to our success, especially in an environment where productivity is paramount.
In line with our people focus, Clough Coens has set up a competency assessment program focused on technical and behavioural based safety for all its technical resources. Testing is carried out prior to employing staff and contractors, and will be certified by Cough Coens, with results available to our clients. All testing and necessary training will be carried out at Clough Coens training facilities in Korea.
Outlook The Commissioning & Asset Support business has a strong growth outlook with Australian LNG projects transitioning from the construction phase to operations phase.
The decision to partner with Coens allows Clough to target the world’s largest fabrication yards in South Korea and China with innovative commissioning
and completions services, with over 100 potential opportunities identified in these yards over the near to medium term.
With the dedication, commitment and drive of our management team and staff, we are confident we will continue to grow our business, deliver excellent quality and service, and exceed client expectations.
Clients
tHe Decision to partnerWitH coens alloWs clougH to target tHe WorlD’s largest fabrication yarDs in soutH korea anD cHina WitH innovative coMMissioning anD coMpletions services
For
per
sona
l use
onl
y

18 clough annual report 2013
Industry leading safety performanceClough continued to record industry leading safety performance during FY2013. Total recordable injury rates (TRI) declined by 14 per cent to 1.96 per million work hours and lost time injury (LTI) rates declined by 7 per cent to 0.14 per million work hours.
Our continued strong performance is a reflection of the strength of our Target Zero safety program and ability to adapt and integrate with clients’ safety systems and processes.
Highlights and AchievementsOur Papua New Guinea workforce continued to overcome a culturally and logistically challenging environment to achieve over 26 million work hours LTI free during the financial year, while our Australian projects also continued to demonstrate strong safety performance.
The Clough Downer Joint Venture achieved three million hours LTI free on its K128 coal seam gas project in Queensland, and our Commissioning & Asset Support business recorded a second successive year LTI free. This contributed to our client, ConocoPhillips, receiving the APPEA Safety Performance Award for the fourth successive year.
Incidents and learningsIn early FY2014, Clough suffered its first fatality in over 10 years when a contractor was crushed during pipeline fitting activity in Papua New Guinea.
A thorough investigation was undertaken to establish the root causes of the incident, and the investigation has resulted in a series of recommendations to reduce the risk of a similar tragedy occurring on Clough’s projects in the future. These included better on-site communication methods, improved risk identification procedures and updated safety processes for pipeline work.
As a result of this tragedy, Clough is implementing a series of workshops which will require every team across our organisation to examine the circumstances surrounding the incident and explore the relevant control barriers. Each employee will also be asked to develop a personal safety commitment.
InnovationAs part of the drive to embed behavioural based safety practices into everyday business our corporate and project Health, Safety and Environment (HSE) teams participated in further training with the founder and CEO of B-Safe Management Systems, Dr Dominic Cooper. The B-Safe process creates a safety partnership between management and the workforce by continually focusing everyone’s attention and actions on their own, and others’, safety behaviour.
An inaugural HSE Managers Forum was also held to build stronger links across Clough’s HSE function and develop a clear understanding of strategic direction. The sessions were essential in establishing the fundamentals of our HSE Strategy and will drive improvement across our operations and help guarantee HSE excellence in all new business we undertake.
Clough is committed to providing an environment free from injury or incident. During the year, injury rates continued to decline, while safety and environmental innovation helped drive improved performance.
safety & environment overview
Zero HarM
safety
tHe b-safe process creates a safety partnersHip betWeen ManageMent anD tHe Workforce by continually focusing everyone’s attention anD actions on tHeir oWn, anD otHers’, safety beHaviour
ltif safety performance per million work hours
trif safety performance per million work hours
7%
14%
0.14
2.28
2013
2013
2012
2012
0.13
1.96
For
per
sona
l use
onl
y

In the past year our environmental performance has continued to set new standards as our projects strive to be world leaders in environmental management. Working on the largest construction projects currently being undertaken in Australia and Papua New Guinea has significantly improved the knowledge of our people and systems. As a result of this our spill to ground incident rate across our projects remains extremely low as we strive to achieve positive environmental outcomes across our operations.
Environmental innovationClough continued to develop and implement innovative environmental solutions across our range of projects. Central to this is the use of technology, including Geographic Information Systems to identify and mitigate environmental constraints including cultural heritage, land access and topography.
On the Chevron-operated Gorgon Project, the Kellogg Joint Venture Quarantine team – which includes Clough personnel – continues to set new standards for the protection of Barrow Island, a Class A Nature Reserve. In June 2013 the team achieved a major milestone, with over 20 million kilograms of food and associated items having been inspected at the Jandakot Food Consolidation Centre for shipment to the island. This facility is currently inspecting around 1 million kilograms of food per month.
To reflect our commitment to protect Papua New Guinea’s pristine environment, the Clough Curtain Joint Venture (CCJV) developed strategies to foster stronger environmental awareness on its scope of the PNG LNG Project. This has included the development of a new field handbook, nomination of employee environment representatives across the team and the development of an
Environmental Scorecard ratings system to encourage staff to outperform peers in the area of environmental management.
Importantly, the CCJV team takes the time to recognise, reward and celebrate environmental performance, fostering a strong workplace culture and incentivising staff to go that extra mile.
HSE LeadershipIn December 2012 Clough appointed Peter Hayward as Vice President Health, Safety and Environment. Reporting directly to the CEO and Managing Director, Peter’s remit is to develop the strategies, programs and tools to support industry leading HSE performance.
Respect for the environment is fundamental to our operations and Clough endeavours to deliver environmentally sustainable outcomes during all stages of our projects.
environMent
tHe ccjv teaM takestHe tiMe to recognise, reWarD anD celebrate environMental perforMance, fostering a strong Workplace culture anD incentivising staff to go tHat extra Mile
For
per
sona
l use
onl
y

20 clough annual report 2013
Launched in FY2012, our six pillar CSR strategy aims to provide sustained benefit to local communities, strengthen stakeholder relationships and encourage employee involvement in community initiatives. We invested over $300,000 across a range of initiatives, which align with our six pillars of children and education, academic, empowering women, indigenous, arts and sport.
Building strong and active communitiesIn the past year Clough became primary sponsor of the Glory in the Community program. Run by Perth Glory, this program delivers physical, social and educational benefits for more than 30,000 children across Western Australia.
Clough’s support for grass roots sport was affirmed by the launch of the Clough Community Sports Program, an initiative providing $1,000 donations for employee-nominated local amateur clubs.
During the year many of our employees participated in a range of fundraising initiatives. The most notable was the participation of our Chief Executive Officer and Managing Director Kevin Gallagher in the annual Vinnies CEO Sleepout. With strong support from across the business, Kevin raised more than $50,000 for essential homeless services.
Supporting the next generation of professionalsClough strengthened its commitment to support the next generation of talented professionals through investment in partnerships with leading universities.
The Clough Scholars initiative, a 40 year partnership with the University of Western Australia, was reinstated to provide grants to two of the university’s most talented engineering undergraduates, while we continued to support engineering students at Curtin University through our sponsorship of the Curtin Engineering Centre.
A core focus of Clough’s social investment strategy is to increase female interest in Engineering with a view to improving female representation in the profession. Our partnership with student-run organisation Women in Engineering Curtin Division (WIECD) at Curtin University of Technology supports the development of female students in science, technology, engineering and maths (STEM) fields.
To reflect the geographical location of our operations, Clough is extending its support for talented Engineering students to PNG. Managed through a partnership with youth development organisation The Voice, Clough will provide four individual annual bursaries to help leading PNG Engineering students pay for their education. Graduate engineers will become part of the Clough vacation and graduate program.
Bringing the Arts to new audiencesIn FY2013 Clough built strong relationships with leading Indigenous Arts companies. Ochre Contemporary Dance Company is a fledgling organisation with the vision of promoting Aboriginal stories through contemporary dance. In late 2012, Clough supported its inaugural production, while in April 2013 Clough funding helped Yirra Yaakin, an indigenous performing arts organisation, bring a traditional dreamtime story to a contemporary audience.
The Clough FoundationIn FY2014, the way Clough’s social investment decisions are taken will
change, through the creation of the Clough Foundation. Overseen by an independent Board, the Foundation will provide a delivery vehicle for community partnerships and sponsorships to ensure funding is targeted appropriately and provides optimum benefits to our local communities.
Through our investments we will look to provide long-term viability and success to the organisations and initiatives we support. Our goal is to create opportunities that would not be possible without the help of the business community.
Clough understands the importance of giving back to the communities in which we live and work. During FY2013 we supported a range of local community groups in line with our six pillar Corporate Social Responsibility (CSR) strategy.
giving backcommunity overview
tHe clougH scHolarsinitiative, a 40 year partnersHip WitH tHe university of Western australia, Was reinstateD to proviDe grants to tWo of tHe university’s Most talenteD engineering unDergraDuates
For
per
sona
l use
onl
y

21engineered for productivity
For
per
sona
l use
onl
y

22 clough annual report 2013
Building leadership capacityClough is positioning for its next phase of growth by building leadership capacity across the organisation. Our focus is on developing the core skills and systems to meet our clients’ needs, both domestically and internationally.
Our leadership development initiatives are commencing with the introduction of the Leadership for High Performance Framework through partnership with a major international management consultancy group. This program is designed to develop the leadership styles and organisational climate necessary to drive high performance consistent with our company values.
Identifying tomorrow’s leaders requires clear career paths and development objectives for each of our employees. Our new performance management system, My Pursuit of Excellence, was launched in early 2013. The system maps individual objectives, identifies skill gaps, provides each staff member with a development plan and enables employee remuneration to have greater alignment.
We aim to resource core leadership positions on every Clough project with existing employees who are familiar with our systems and project execution methodologies. This will reduce the need to “hire off the street” when resourcing projects, and will assist in optimising schedule outcomes through efficient project start up and aligned teams.
Recognising that project managers are critical to successful project execution, we will be implementing a new project management development program in FY2014. Potential project managers will receive structured career paths supported by project management training, to ensure they have the technical, commercial and leadership skills to deliver on project requirements. Our aim is to develop the best project managers in our industry.
Structured for growthClough’s new Organisational Principles define accountabilities for the business and functional divisions, ensuring executives responsible for business success are provided with the people and skills they need to deliver on their business objectives.
The new Principles group individuals with similar skills and technical expertise into skill pools. Designated skill pool managers will be responsible for developing core capabilities to support our business while ensuring all employees in their skill pool have access to career paths aligned with their area of expertise.
DiversityClough aims to create a workforce profile which reflects the talent available in the many communities in which we work. Women represent 24 per cent of our workforce and we are seeing an increase in women being appointed to senior leadership positions.
Last year the Board approved measurable objectives for gender diversity while growth targets for the proportion of women in the workplace have been approved for FY2014.
While the female composition of Clough’s workforce compares favourably with other companies operating in the construction and mining and resources industries, improving female participation remains a key focus area for Clough.
Attracting bright young minds
Performance development starts at graduate level. We view our graduates as the beginning of the leadership pipeline and invest in developing and nurturing their skills.
In FY2013 we inducted 17 engineering graduates into our three-year program. Clough’s industry-leading vacation intern program accepted eight promising engineering students during the year. The program was ranked at number 16 in Australia by the Australian Association of Graduate Employers.
Remuneration Rewarding strong performance is essential to retain and motivate high performing staff. Clough’s new Remuneration Standard provides a fit for purpose model which aligns performance with reward. Benchmarked against clear banding and industry trends, it provides clarity and fairness across our business divisions and projects, while ensuring our cost base remains market competitive.
Clough’s workforce increased by 33 per cent to 6,343 people in FY2013, reflecting the ramp up of major LNG projects across Australia and Papua New Guinea. Development programs focused on cultivating a strong pipeline of leaders, from graduate to executive, in our core competencies of engineering, project management, commissioning and production operations.
people & organisational development overview
people
talent ManageMentanD succession planning prograMs iMpleMenteDproject ManageMent training prograM DevelopeD
workforce people
33%
2013
2012
6,343
4,785
For
per
sona
l use
onl
y

For
per
sona
l use
onl
y

24 clough annual report 2013
leadership strength
clougH executive coMMittee
kEvIn gALLAgHERB.EnG (mEChAnICAL) (honS), FIEAuST
Kevin joined Clough as CEO and Managing Director on 3 November 2011. Kevin is a senior executive with more than 22 years experience in managing oil and gas operations in Australia, the USA and North and West Africa.
A qualifi ed mechanical engineer, Kevin commenced his career as a drilling engineer with Mobil North Sea, before joining Woodside in 1998. During his 13 year tenure with Woodside, Kevin led the drilling organisation through rapid growth, delivering several Australian and international development projects and exploration campaigns and setting drilling performance records whilst improving safety. He also led the Australian Oil Business Unit.
Prior to joining Clough, Kevin was responsible for production on Australia’s largest resource project, the North West Shelf, where he held the positions of Executive Vice President, North West Shelf Business Unit and CEO, North West Shelf Venture at Woodside.
During his time at Clough, Kevin has implemented a program to improve fi nancial and operational performance while establishing the leadership team, systems and people capabilities to deliver on the company’s extensive project portfolio and drive strong, profi table growth.
CHIEF ExECuTIvE OFFICER & mAnAGInG DIRECTOR
BARRY HowARD mCQI CQp
Barry joined Clough in June 2009 and comes with 26 years of international oil and gas experience, previously with Leighton, Transocean and KBR.
Barry commenced his career in the shipbuilding industry, followed by roles within oil and gas EPC and drilling contractors. With a project execution background, Barry has extensive experience in the control of Engineering, Procurement, Construction and Commissioning activities on projects for leading oil and gas operators including Hess, Shell, BP, ConocoPhillips and Petrobras. He has worked in Europe, South America, Australia and Asia.
Barry is accountable for leading the Business Systems & Supply Chain function covering project controls, supply chain management, quality, information systems/technology and corporate services.
ExECuTIvE vICE PRESIDEnT BuSInESS SySTEmS & SuPPLy CHAIn
mAX BERgomI B.EnG (mAnAGEmEnT & pRoDuCTIon)
Max joined Clough in February 2008 in the role of Executive General Manager, Business Acquisitions and was promoted to the role of Executive Vice President in February 2009. In March 2012 Max’s role was expanded to take on the Executive Vice President Commissioning & Asset Support role.
In his role as Executive Vice President of Commissioning & Asset Support, Max is responsible for developing Clough’s capability and capacity in this business to deliver on growth targets.
As well as being part of Clough’s Executive Committee (Excom) he also represents Clough on the Board of the Clough AMEC joint venture.
With an engineering background, Max brings signifi cant global experience in engineering, project management and commercial responsibilities primarily in the oil and gas industry sector. His prior experience includes senior positions with Saipem and Maverick Tube Corporation in Milan, Houston, Jakarta and London.
ExECuTIvE vICE PRESIDEnT COmmISSIOnInG & ASSET SuPPORT
gARY BowTELL B.EnG (mEChAnICAL) FIEAuST
Gary joined Clough in July 2010 and has more than 30 years experience in the development, execution and operations in the Energy and Chemicals sector.
Gary’s career spans assignments in Australia, UK, Germany, Italy, Brunei and Japan. Prior to joining Clough he held general management positions for Woodside’s LNG Development division. He also held senior engineering and management positions with INPEX, Shell Petroleum and Worley Parsons.
As Executive Vice President, Engineering, Gary oversees all Engineering operations. Clough’s Engineering division has over 1,000 personnel working in Australia and abroad, and covers all of the services provided in the EPCM, PMC and Engineering disciplines.
ExECuTIvE vICE PRESIDEnT EnGInEERInG
For
per
sona
l use
onl
y
25engineered for productivity
RAjIv RATnESER B.Com, LLB
RIck RoBInSonB.EnG (CIvIL), mSC
nEIL SIfoRDBSC (GEoGRAphY) (honS), ACA
Raj is a practicing solicitor and commenced with Clough as a Legal Counsel in 2004 before becoming General Counsel in 2008. Raj assumed his current role in March 2012.
Raj has over 15 years of legal experience in both dispute resolution and front end contract negotiation of large capital projects. He has extensive experience and knowledge in Clough’s major forms of contracting. He has been heavily involved with the negotiation and administration of many of Clough’s project contracts in all of the markets in which Clough operates.
GROuP GEnERAL COunSEL & COmPAny SECRETARy
Rick joined Clough in 2007 as the Project Director for Infrastructure on the Gorgon Downstream LNG project. He has more than 35 years of international engineering, procurement and project execution experience for large oil and gas and mining projects.
Prior to joining Clough, Rick held senior executive positions in project and general management at Fluor, including the position of President, Fluor Constructors, Inc. His international work experience spans five continents working on upstream and downstream projects in the USA, Canada, Puerto Rico, South Africa, Netherlands and Russia.
Rick is a qualified Civil Engineer with a Bachelor of Science in Engineering attained from University of Southern California, and a Master of Science in Engineering from Stanford University. He also has professional engineering registrations in both the USA and Canada.
Neil joined Clough in 2006 as Finance Manager for Capital Projects and Asset Support and held a variety of senior finance management positions before being promoted to his current role of Chief Financial Officer in November 2009. He is a Chartered Accountant with more than 26 years of business and financial management experience gained in international organisations in the UK and Australia.
ExECuTIvE vICE PRESIDEnT PROjECTS
CHIEF FInAnCIAL OFFICER
For
per
sona
l use
onl
y

26 clough annual report 2013
ExPERIEnCE
Keith Spence joined the Clough Limited Board in August 2008 and was appointed Independent Non-Executive Chairman in October 2010. Mr Spence has more than 30 years experience in the oil and gas industry, including 18 years with Shell and 14 years with Woodside. During his tenure with Woodside he held top executive positions with the company. Mr Spence currently holds a number of board, council and advisory positions relating to the Australian energy, resources and education sectors.
COmmITTEE mEmBERSHIP
Audit & Risk Committee
Governance & Nominations Committee
Health, Safety, Environment & Sustainability Committee
Remuneration & Human Resources Committee
CuRREnT DIRECTORSHIPS
Non-Executive Chairman of Geodynamics Limited
Non-Executive Director of Oil Search Limited
Non-Executive Director of Synergy/Verve Energy
Board Member of Australian Workforce and Productivity Agency
Chairman of National Offshore Petroleum Safety and Environmental Management Authority
Chairman of State Training Board of Western Australia
ExPERIEnCE
Kevin Gallagher joined Clough as CEO and Managing Director on 3 November 2011. Kevin is a senior executive with more than 22 years experience in managing oil and gas operations in Australia, the USA and North and West Africa. A qualified mechanical engineer, Kevin commenced his career as a drilling engineer with Mobil North Sea, before joining Woodside in 1998. During his 13 year tenure with Woodside, Kevin led the drilling organisation, the Australian Oil Business Unit and the North West Shelf Venture.
COmmITTEE mEmBERSHIP
Health, Safety, Environment & Sustainability Committee
APPEA Productivity Committee
CuRREnT DIRECTORSHIPS
Non-Executive Director of Australian Contractors Association (ACA)
Non-Executive Director of Curtin Graduate School of Business
Executive Director of Clough AMEC Pty Ltd
ExPERIEnCE
David Crawford joined the Clough Limited Board in May 2011 as a Non-Executive Director. He is also Non-Executive Chairman of Perth Airport Pty Ltd and President of the National Competition Council. Prior to joining Clough, David was Corporate Affairs Director at Wesfarmers Limited and held senior executive positions with Ranger Minerals NL, Western Collieries Ltd and CSR Limited. He has been a member and/or Chairman of a number of government and non-government committees in the agriculture and mining industries and a management committee member of both educational and service organisations.
COmmITTEE mEmBERSHIP
Health, Safety, Environment & Sustainability Committee
Remuneration & Human Resources Committee
CuRREnT DIRECTORSHIPS
Non-Executive Chairman of Perth Airport Pty Ltd
President of National Competition Council
kEITH SPEncEBSC (GEophYSICS) (honS), FAIm
InDEPEnDEnT nOn-ExECuTIvE CHAIRmAn
nOn-ExECuTIvE DIRECTOR
CHIEF ExECuTIvE OFFICER & mAnAGInG DIRECTOR
InDEPEnDEnT nOn-ExECuTIvE DIRECTOR
coBuS BESTERBCom (ACC) (honS), CA(SA)
kEvIn gALLAgHERB.EnG (mEChAnICAL) (honS), FIEAuST
DAvID cRAwfoRDB.Com (EConomICS) (honS), mA (poL SC), FAICD
leadership strength
clougH boarD
ExPERIEnCE
Cobus Bester is the Group Financial Director of Murray & Roberts Holdings Limited. He is a Chartered Accountant with more than 23 years experience in the construction and engineering industry. He was the Group Financial Director for Basil Read and Concor Limited for three and six years respectively and was appointed Managing Director of Concor in 2005. Concor was acquired by Murray & Roberts in 2006 and subsequently delisted from JSE Limited (previously the Johannesburg Stock Exchange). Cobus has been a Director of Murray & Roberts Limited since 2007 and joined the Clough Limited Board in July 2011.
COmmITTEE mEmBERSHIP
Audit & Risk Committee
CuRREnT DIRECTORSHIPS
Director of Murray & Roberts Holdings Limited and related subsidiary companies
For
per
sona
l use
onl
y

engineered for productivity
ExPERIEnCE
Ian Henstock joined the Clough Board in January 2012. He is the Group Commercial Director of Murray & Roberts, and also serves on the Boards of Murray & Roberts Limited and Murray & Roberts International Holdings Limited. Prior to joining Murray & Roberts, Ian held a number of leadership roles in the financial sector. He commenced his career with Ernst & Young as an articled clerk, and rose to the position of Executive Deputy Chairman, before joining Capital Partners as Executive Director.
Following a period with Deloitte & Touche as Corporate Finance Managing Partner, he took the role as the Chief Executive of Bridge Capital, growing that business into a successful niche investment banking firm. In 2004 he was approached by the ABSA Group to head up ABSA Merchant Bank and shortly thereafter was promoted to Deputy Managing Executive of ABSA Corporate & Merchant Bank, a position he held until 2006 when he transferred to ABSA Private Bank as Senior Executive: Strategic Wealth Management to create a private wealth capability in the Private Bank.
COmmITTEE mEmBERSHIP
Remuneration & Human Resources Committee
CuRREnT DIRECTORSHIPS
Director of Murray & Roberts International Holdings Limited and related subsidiary companies
ExPERIEnCE
Henry Laas is the Group Chief Executive of Murray & Roberts Holdings Limited. He holds a Bachelor of Engineering (Mining) degree from the University of Pretoria and an MBA from the University of the Witwatersrand. He has extensive experience in the mineral resources and mining contracting sectors. As former Managing Director of Murray & Roberts Cementation and its predecessor RUC Mining Contractors for more than 10 years, he played an instrumental role in the expansion of the Cementation Mining Group’s global footprint. Henry joined the Clough Board in July 2011.
COmmITTEE mEmBERSHIP
Governance & Nomination Committee
Health, Safety, Environment & Sustainability Committee
CuRREnT DIRECTORSHIPS
Director of Murray & Roberts Holdings Limited and related subsidiary companies
ExPERIEnCE
Neil Siford joined Clough in 2006 as Finance Manager for Capital Projects and Asset Support and held a variety of senior finance management positions before being promoted to his current role of Chief Financial Officer in November 2009. He is a Chartered Accountant with more than 26 years of business and financial management experience gained in international organisations in the UK and Australia.
CuRREnT DIRECTORSHIPS
Executive Director of Clough AMEC Pty Ltd
ExPERIEnCE
Emma Stein is an experienced Non-Executive Director and Audit Committee Chair serving on the boards of several listed companies. Ms Stein has considerable experience with industrial customers and comprehensive set of commercial skills in the international energy and utilities markets, investments in long life assets and projects, and the upstream oil and gas sector. She is an Ambassador for the Guides.
COmmITTEE mEmBERSHIP
Audit & Risk Committee
Governance & Nomination Committee
CuRREnT DIRECTORSHIPS
Independent Director of DUET Group
Independent Non-Executive Director of Alumina Limited
Independent Non-Executive Director of Transpacific Industries Group Limited
Independent Non-Executive Director of Programmed Maintenance Services Limited
Board Member Australian Institute of Company Directors
nOn-ExECuTIvE DIRECTOR
nOn-ExECuTIvE DIRECTOR
CHIEF FInAnCIAL OFFICER & ExECuTIvE DIRECTOR
InDEPEnDEnT nOn-ExECuTIvE DIRECTOR
HEnRY LAASB.EnG (mInInG), mBA
IAn HEnSTockBCompT (honS), CA(SA), hDIp TAx LAw, mBA
nEIL SIfoRDBSC (GEoGRAphY) (honS), ACA
EmmA STEInBSC (phYSICS) (honS), mBA, FAICD
27
For
per
sona
l use
onl
y
Clough annual report 201328
corporate governance statement 2013
corporate governance
Clough’s corporate governance statement has been prepared in line with the Australian Securities Exchange (ASX) ‘Corporate Governance Principles and Recommendations with 2010 Amendments’ 2nd edition (Corporate Governance Principles).
asX p & r1
if not, why not2
Recommendation 1.1 72.9
Recommendation 1.2 7 57.6
Recommendation 1.3 7 11.1
Recommendation 2.1 7 7
Recommendation 2.2 7
Recommendation 2.3 7
Recommendation 2.4 7
Recommendation 2.5 7
Recommendation 2.6 7
Recommendation 3.1 7
Recommendation 3.2 7
Recommendation 3.3 7
Recommendation 3.4 7
Recommendation 3.5 7
Recommendation 4.1 7
Recommendation 4.2 7
Recommendation 4.3 7
Recommendation 4.4 7
Recommendation 5.1 7
Recommendation 5.2 7
Recommendation 6.1 7
Recommendation 6.2 7
Recommendation 7.1 7
Recommendation 7.2 7
Recommendation 7.3 7
Recommendation 7.4 7
Recommendation 8.1 7
Recommendation 8.2 7
Recommendation 8.3 7
Recommendation 8.4 7
1 Indicates where the Company has followed the
recommendations contained in the Corporate
Governance principles 2 Indicates where the Company has provided “if not,
why not” disclosure.3 Information based recommendations 1.3, 2.6, 3.5,
4.4, 5.2, 6.2, 7.4 and 8.4 are not adopted or reported
against using the “if not, why not” disclosure -
information is either provided or it is not.
coRPoRATE govERnAncE PRIncIPLE 1: LAY SoLID founDATIonS foR mAnAgEmEnT AnD ovERSIgHTThe Board has adopted a formal charter which is available on Clough’s website www.clough.com.au in the Corporate Governance section under “Investors and Media”. The Charter sets out the role and responsibilities of the Board and explains the functions reserved for the Board and those functions delegated to the Chief Executive Officer (CEO) and other senior executives. The Board has further delegated, by way of delegation of authority, certain Board functions to the CEO and management.
The Board regularly reviews management performance on an ongoing basis. The Board undertakes an annual review of the CEO’s performance. Performance measures are established between the Remuneration & Human Resources Committee and the CEO which are then approved by the Board. All senior executives are also subject to a formal annual performance evaluation which is undertaken by the relevant manager through the ‘My Pursuit of Excellence’ process. This process involves a meeting between the senior executive and employee at which performance objectives and behavioural competencies are assessed. This process is described in further detail in the Directors’ Report, at page 41. An evaluation of senior executives’ performance took place during the reporting period in accordance with this process.
PRIncIPLE 2: STRucTuRE THE BoARD To ADD vALuEThe Clough Board is comprised of eight directors:
Keith Spence Chairman and Non-Executive Director
Independent
David Crawford
Non-Executive Director
Independent
Emma Stein Non- Executive Director
Independent
Cobus Bester Non- Executive Director
Non- Independent
Henry Laas Non- Executive Director
Non- Independent
Ian Henstock Non-Executive Director
Non- Independent
Kevin Gallagher
CEO and Managing Director
Non- Independent
Neil Siford CFO and Executive Director
Non-Independent
performance evaluationIn 2012, a review was undertaken of the way in which Board and Committee performance is evaluated. Following that review, the Board resolved to adopt annual evaluations of the performance of the Board, each Committee, the Chairman, the Chairs of each Committee and of each individual director. Questionnaires are developed by an independent consultant and are completed by each director. The responses are compiled by the independent consultant and a report delivered to the Chairman. The annual performance evaluation for 2013 is scheduled to be discussed at the October 2013 Board meeting.
nomination and appointmentIn 2012, the Board established a Governance & Nominations Committee, whose members include Keith Spence (Chair), Emma Stein and Henry Laas. Emma Stein and Keith Spence are Independent, Non-Executive Directors. Henry Laas is a Non-Independent, Non-Executive Director. The qualifications of members of the Governance & Nominations Committee are set out in this Annual Report under the section ‘Clough Board’, at page 26. Members of the Governance & Nominations Committee attended the number of meetings set out in this Annual Report under the heading ‘Directors’ Meetings’, at page 36.
The Governance & Nominations Committee Charter deals with additional aspects of the Company’s nomination and appointment policy and is also available on the Company’s website.
New directors are provided with a letter of appointment setting out the Company’s expectations, their responsibilities, rights and the terms and conditions of their employment. All new directors participate in a comprehensive induction program which covers the operation of the Board and its Committees, together with financial, strategic, operations and risk management issues.
Clough places great importance on high levels of corporate governance and believes in the correlation between good governance and performance.
For
per
sona
l use
onl
y

29engineered for productivity
The skills, experience and expertise relevant to the position of director held by each director in office, and their term of office, as at the date of this Annual Report is set out under the section ‘Clough Board’, at page 26.
independenceThe Board measures the independence of its directors having regard to the relationships affecting independent status listed in Box 2.1 of the Corporate Governance Principles. Keith Spence, Emma Stein and David Crawford are considered to be Independent Directors, as they are Non-Executive Directors who are not members of management and who are free of any business or other relationship that could materially interfere with, or could reasonably be perceived to materially interfere with, the independent exercise of their judgement.
Clough has a majority shareholder, Murray & Roberts Limited, which requires representation on the Clough Board. The Murray & Roberts nominated directors include senior executives from Murray & Roberts Limited who bring significant industry experience and expertise to the Clough Board.
Having regard to the relationships affecting independent status listed in Box 2.1 of the Corporate Governance Principles, Cobus Bester, Henry Laas and Ian Henstock are considered to be Non-Independent Directors as they serve on the board of directors of Murray & Roberts Limited (the majority shareholder of Clough).
The directors who are also considered to be Non-Independent are Kevin Gallagher and Neil Siford as they are both Executive Directors and members of Clough’s management.
Clough acknowledges that as a result of these representations, the Board does not have a majority of independent directors and has therefore not followed recommendation 2.1 of the Corporate Governance Principles.
The status of each member of the Board in this regard is set out in the table below:
director status
Keith Spence (Chairman since 26 October 2010)
Independent
David Crawford (Director since 2 May 2011)
Independent
Emma Stein (Director since 1 July 2008)
Independent
Cobus Bester (Director since 17 July 2011)
Non-Independent. Mr Bester is an officer of Murray & Roberts Limited (the controlling shareholder of Clough) and is therefore not considered to be independent
Henry Laas (Director since 17 July 2011)
Non-Independent. Mr Laas is an officer of Murray & Roberts Limited (the controlling shareholder of Clough) and is therefore not considered to be independent
Ian Henstock (Director since 20 January 2012)
Non-Independent. Mr Henstock is an officer of Murray & Roberts Limited (the controlling shareholder of Clough) and is therefore not considered to be independent
Neil Siford (Director since 19 August 2010)
Non-Independent. Mr Siford is the Chief Financial Officer and an Executive Director of Clough and is therefore not considered to be independent
Kevin Gallagher (Director since 3 November 2011)
Non-Independent. Mr Gallagher is the Chief Executive Officer and Managing Director of Clough and is therefore not considered to be independent
No Directors have left their position during the current reporting period
Clough also believes that employing a materiality concept is essential in judging whether customer, supplier, consultant or professional adviser relationships affect the independence of Clough directors. Clough has adopted AASB Standard 1031 to determine levels of materiality.
Board committeesClough has four standing committees of the Board: Governance & Nominations Committee, Audit & Risk Committee, Remuneration & Human Resources Committee and Health, Safety, Environment and Sustainability Committee.
All Board committees have a charter which sets out their respective roles and responsibilities. These charters can be found in the Corporate Governance section of the Company’s website. The number of meetings held by each committee, and attendance at those meetings, is outlined in the Directors’ Report under the heading ‘Directors’ Meetings’, at page 36.
independent adviceDirectors may seek external professional advice at the expense of the Company on matters relating to their roles as directors of Clough. They must first obtain approval from the Chairman of the Board, which must not be unreasonably withheld. If permission is withheld, the matter may be referred to the whole Board. All directors have access to the Company Secretary.
PRIncIPLE 3: PRomoTE ETHIcAL AnD RESPonSIBLE DEcISIon-mAkIngcode of conductClough has adopted a Code of Conduct fully endorsed by the Board, which prescribes standards of honesty, integrity, fairness and equity in all aspects of working for Clough. The Code of Conduct comprises of eight key principles being:
• Safetyisparamount–targetzero;• Wepursueexcellence;• Weactwithhonestyandintegrity;• Weactprofessionallyandrespectfully;• Weworkasateam;• Wecomplywithlawsandourpolicies
andstandards;• Weavoidandmanageconflictsof
interest;and• WeprotectClough’sconfidential
information and intellectual property.
The Code of Conduct can be found in the Corporate Governance section of the Company’s website. An online Code of Conduct training program was implemented across the Clough group in April 2013 which requires successful completion by all directors, officers, employees and contractors by 30 June of each year. The results are monitored by the Corporate Governance team and are reported to the Board. Successful completion of the training is also mandatory for new employees and contractors on induction.
Clough is committed to ensuring shareholder value and encourages the reporting of matters that may cause financial and non-financial loss to the Company or damage to the Company’s reputation. All employees are required to immediately report circumstances that may involve a breach (or suspected breach) of the Code of Conduct to their next-up manager or head of department. However, it is recognised that in some situations this may not be appropriate, so an external confidential ethics hotline is available to employees, whereby any Code of Conduct issues may be reported anonymously by telephone, email or mail.
Clough has also adopted a Share Trading Policy which sets out how and when directors, officers and employees holding senior management positions may trade in the Company’s shares. The Share Trading Policy is available in the Corporate Governance section of the Company website.
diversityClough’s commitment to diversity is set out in the Diversity Policy which can be found in the Corporate Governance section of the Company’s website. Clough aims to create a workforce profile whichreflectsthetalentavailableinthemany communities in which we work.
With regard to gender diversity, the Board approved measurable objectives for the financial year ended 30 June 2013 and progress against these was reviewed on a monthly basis by the Operating
For
per
sona
l use
onl
y

clough annual report 201330
Committee (Opcom). Overall progress was also assessed by the Board.
Clough underwent significant restructuring of its operations during the financial year ended 30 June 2013 and targets were set to account for this. Growth targets for the proportion of women in the workplace have been approved by the Board for the financial year ending 30 June 2014.
The participation of women in the workplace continues to be a key focus for Clough and the proportion of women in Clough’s overall workforce continues to compare favourably with other companies in similar industries such as construction, mining and resources.
Progress against gender diversity targets were facilitated through the following:
• Enhancing an inclusive culture Cloughoffersflexiblework
arrangements and also provides paid parental leave.
• Capability enhancement During the financial year ended 30
June 2013, talent assessment days were held at Executive Committee (Excom) level, evaluating the performance and potential of all key talent across the organisation. Twelve per cent of this group were women.
Further, all employees have access to developmental opportunities through personal development plans.
• Recruitment During the financial year ended
30 June 2013, 24.2% of all roles were filled by women.
PRIncIPLE 4: SAfEguARD InTEgRITY In fInAncIAL REPoRTIngThe Corporate Governance Principles require that companies have a structure to independently verify and safeguard the integrity of their financial reporting. Clough has an Audit & Risk Committee whose members include Emma Stein (Chair), Keith Spence and Cobus Bester. Emma Stein and Keith Spence are Independent, Non-Executive Directors. Cobus Bester is a Non-Independent, Non-Executive Director. The qualifications of members of the Audit & Risk Committee are set out in this Annual Report under the section ‘Clough Board’, at page 26. Members of the Audit & Risk Committee attended the number of meetings set out in this Annual Report under the heading ‘Directors Meetings’ at page 36. The Audit & Risk Committee Charter can be found in the Corporate Governance section of the Company’s website.
The role of the Audit & Risk Committee is to report to the Board in relation to the following:
External Reporting. Whether external reporting is consistent with the committee member’s information and knowledge of the business and is adequate for shareholders’ needs, including an assessment of the
management processes supporting external reporting.
External Audit. Procedures for the selection and appointment of the external auditor and the rotation of the external audit engagement partner. Recommendations for the appointment and, if necessary, the removal of the external auditor. Reviewing and approving the annual external audit plan and audit fee. Assessing the performance and independence of the external auditor and, where the external auditor provides non-audit services, that the provision of those services does not compromise the auditor’s independence.
Accounting Policies and Standards. Ensuring compliance with the appropriate accounting standards and ensuring the consistency, quality and appropriateness of the accounting policies and practices adopted by the Company.
Internal Audit. Assessing the performance and objectivity of the internal audit function and recommendations for the appointment and, if necessary, the dismissal of the head of internal audit.
Risk management and Internal Control. Assessing the risk management and internal control system.
Assurance. Assessing the performance and objectivity of the governance and assurance processes operating within the business.
Insurance. Overseeing the Company’s insurance program and conducting an annual review.
Legal Compliance. Oversight of the processes to ensure compliance with legislation in the respective jurisdictions in which the Company operates.
Related Party Transactions. Oversight of all related party transactions.
Fraud. Oversight of the fraud prevention and detection measures taken within the business.
The Audit & Risk Committee has access to both internal audit and the external auditor without the presence of other management. Internal audit has a direct reporting relationship with the Audit & Risk Committee and provides written reports to the Committee. The Audit & Risk Committee leads the review of the performance of the external auditor.
The CEO, CFO, Company Secretary, Group Risk Manager, Risk and Assurance and external auditors attend the Audit & Risk Committee meetings by invitation. The Committee meets and reports to the Board four times each year. Meetings are timed to coincide with profit announcements made to the ASX and audit engagement.
The CEO and CFO provide appropriate representations to the Audit & Risk Committee and the Board in support of the full year and half year accounts.
PRIncIPLE 5: mAkE TImELY AnD BALAncED DIScLoSuREClough’s Continuous Disclosure Policy details the process by which information is disclosed to the market. This policy is available in the Corporate Governance section of the Company’s website.
The Board has ultimate authority and responsibility for market disclosure. This responsibility is delegated to the CEO and CFO, who seek approval from the Chairman in relation to all significant matters. The Chairman seeks the approval of the Board as required.
PRIncIPLE 6: RESPEcT THE RIgHTS of SHAREHoLDERSClough’s Shareholder Communications Policy details the means by which the Company promotes and maintains effective communications with its shareholders. This policy is available in the Corporate Governance Section of the Company’s website.
Shareholder meetings represent an opportunity for shareholders to meet with and question the Board and management of Clough. Clough’s external auditor attends all Annual General Meetings and is available to answer shareholder questions.
Clough’s website is a key source of information for the Company’s shareholders and prospective shareholders. Clough places all Company announcements on the site immediately following confirmation of their release to ASX. Clough also displays on its website annual and half-year reports, notices of meeting and information briefings given to analysts and media.
PRIncIPLE 7: REcognISE AnD mAnAgE RISkClough is committed to risk management as part of good governance and business practice.
The Board has adopted a Risk Management Policy which is available in the Corporate Governance Section of the Company’s website. Clough has developed a risk management approach that is consistent with International Standard ISO 31000:2009 Risk Management. The Board is responsible for approving the Company’s policies on risk oversight and management and satisfying itself that management has developed and implemented a sound system of risk management and internal control.Riskismanagedatthreelevels–enterprise, business portfolio and project lifecycle.
corporate governance statement 2013F
or p
erso
nal u
se o
nly

31engineered for productivity
Under the policy, the Board delegates day-to-day management of risk to the CEO who is accountable to ensure that the Company’s risk appetite is defined and risks that may impact the business are identified, assessed, managed and monitored, with continued review and reporting to the relevant levels of the organisation.
The Audit & Risk Committee monitor and review the integrity of financial reporting and the Company’s internal control and risk management systems.
The Audit & Risk Committee requires management to maintain risk management and internal control systems to manage the Company’s material business risks and to report to it confirming that those risks are being managed effectively.
The CEO and the CFO have provided a declaration to the Board in accordance with section 295A of the Corporations Act and have assured the Board that such declaration is founded on a sound system of risk management and internal control, and that the system is operating effectively in all material respects in relation to financial reporting risks.
PRIncIPLE 8: REmunERATE fAIRLY AnD RESPonSIBLYThe ASX recommends the Company ensures that the level of remuneration is sufficient and reasonable and that its relationship to performance is clear. The Board has established a Remuneration & Human Resources Committee and Governance & Nominations Committee. The Committee Charters are available in the Corporate Governance section of the Company’s website. The Committees oversee the following:
remuneration strategy & policy • Theoverallremunerationframework
including short term incentive and long term incentive plans.
human resources strategy and policyceo engagement • Recruitment,appointment,retention
and termination.• Settingannualperformancetargets
and KPIs.• Performanceevaluationprocess.• Determinationofannualsalary
adjustments and incentive payments (in conjunction with the Board of directors).
• Successionplanning.
engagement of senior executives• ApprovingtheCEO’srecommendations
in relation to the appointment and termination of senior executives and senior management direct reports.
• ApprovingtheCEO’srecommendationsin relation to annual salary adjustments and incentive payments.
• Successionplanning.
superannuation • OversightoftheClough
Superannuation Fund.
non-executive directors’ fees• TheannualreviewofNon-Executive
Directors’ fees.• EnsuringtheNon-ExecutiveDirectors’
fees remain within the cap approved by the shareholders.
short term incentive scheme • ReviewandapprovetheCEO’s
recommendations in relation to annual targets, performance against targets and the quantum of annual payments.
long term incentive scheme • ReviewandapprovetheCEO’s
recommendation in relation to the annual grant of performance rights and options to employees.
key talent • Oversightoftheprocessesemployed
within the business to identify and develop key talent.
Clough distinguishes the structure of Non-Executive Director remuneration from that of Executive Directors and senior executives. Details of Clough’s director and senior management remuneration policy are set out in the Directors’ Report, at page 39. There are no schemes for retirement benefits for Non-Executive Directors.
The Share Trading Policy prohibits executives and employees holding senior management positions from entering into transactions or arrangements which limit the economic risk of participating in unvested entitlements.
The members of the Remuneration & Human Resources Committee are David Crawford (Chairman), Keith Spence and Ian Henstock. Keith Spence and David Crawford are Independent Non-Executive Directors and Ian Henstock is a Non-Independent, Non-Executive Director.
Members of the Remuneration & Human Resources Committee attended the number of meetings set out in this Annual Report under the heading Directors’ Meetings, at page 36.
corporate governance statement 2013F
or p
erso
nal u
se o
nly

these fi nancial statements are the consolidated fi nancial statements of the consolidated entity consisting of clough limited and its subsidiaries. the fi nancial statements are presented in the australian currency. clough limited is a company limited by shares, incorporated and domiciled in australia. its registered offi ce and principal place of business is:
clough limited level 15, 58 mounts Bay roadperth wa 6000
a description of the nature of the consolidated entity’s operations and its principal activities is included in the directors’ report contained in this fi nancial report. the fi nancial report was authorised for issue by the directors on 20 august 2013. the directors have the power to amend and reissue the fi nancial report. through the use of the internet, we have ensured that our corporate reporting is timely and complete. all press releases, fi nancial reports and other information are available at our investors & media centre on our website: www.clough.com.au
32 engineered for productivity
financial report
financial contents
directors’ report 33
auditor’s independence declaration 53
Consolidated income statement 54
Consolidated statement ofComprehensive income 55
Consolidated balance sheet 56
Consolidated statement of Cash flows 57
Consolidated statement of Changes in equity 58
notes to the Consolidated financial statements 59
directors’ declaration 111
independent auditor’s report 112
shareholder and investor information 114
For
per
sona
l use
onl
y

33EnginEErEd for productivity
The Directors of Clough Limited present their report on the consolidated entity consisting of Clough Limited (the Company) and the entities that it controlled during the financial year (the Group or the Clough Group).
1 DirectorsThe Directors of the Company in office during the financial year and until the date of this report were as follows:
Director Main Duties
KT Gallagher Chief Executive Officer (CEO) and Managing Director
K Spence Chairman and Non-Executive Director
AJ Bester Non-Executive Director
DI Crawford Non-Executive Director
IW Henstock Non-Executive Director
HJ Laas Non-Executive Director
NE Siford Chief Financial Officer (CFO) and Executive Director
ER Stein Non-Executive Director
All Directors held office during the whole of the year and up to the date of this report.
The details relating to Directors’ qualifications, experience and special responsibilities are detailed below.
RV Ratneser (BCom, LLB) was appointed as Company Secretary on 15 March 2013 and held office at the date of this report. JC Whitehand (BCom, CPA) resigned as Company Secretary on 15 March 2013 and MJ Uchanski (BBus, FCIS, CA, FCDA Dip CD, FTIA, FASFA, FAIST) resigned as Joint Company Secretary on 1 March 2013.
Information on Directors
KT Gallagher, BEng (Mechanical)(Hons), FIEAust (CEO and Managing Director)
Term of Office
Kevin joined Clough as CEO and Managing Director on 3 November 2011.
Experience
Kevin is a senior executive with more than 22 years experience in managing oil and gas operations in Australia, the USA and North and West Africa. A qualified mechanical engineer, Kevin commenced his career as a drilling engineer with Mobil North Sea, before joining Woodside in 1998.
During his 13 year tenure with Woodside, Kevin led the drilling organisation through rapid growth, delivering several Australian and international development projects and exploration campaigns and setting drilling performance records whilst improving safety. He also led the Australian Oil Business Unit.
Prior to joining Clough, Kevin was responsible for production on Australia’s largest resource project, the North West Shelf, where he held the positions of Executive Vice President, North West Shelf Business Unit and CEO, North West Shelf Venture at Woodside.
During his time at Clough, Kevin has conducted a detailed strategic review of the business, providing strategic clarity and streamlining operations to improve project delivery performance and profitability. His short term focus is on establishing the leadership team, systems and people capabilities to deliver on the Company’s extensive project portfolio and drive strong, profitable growth.
Other current directorships (listed entities): None.
Former directorships in last 3 years (listed entities): Forge Group Limited – 3 November 2011 to 28 March 2013.
K Spence, BSc (Geophysics)(Hons), FAIM (Chairman, Non-Executive Director)
Term of Office
Keith joined the Board on 1 August 2008 and was appointed Independent Non-Executive Chairman in October 2010.
Experience
Keith has more than 30 years experience in the oil and gas industry, including 18 years with Shell and 14 years with Woodside. During his tenure with Woodside he held top executive positions with the company. Keith currently holds a number of board, council and advisory positions relating to the Australian energy, resources and education sectors.
Directors’ report30 June 2013
For
per
sona
l use
onl
y

Clough annual report 201334
Directors’ report
K Spence, BSc (Geophysics)(Hons), FAIM (Chairman, Non-Executive Director) (continued)
Experience (continued)
Keith chairs the Board of the National Offshore Petroleum Safety and Environmental Management Authority, is Non-Executive Chairman of Geodynamics Limited and a Non-Executive Director of Oil Search Limited and on the Board of the merged Synergy / Verve Energy. He chairs the State Training Board of Western Australia and the Industry Advisory Board of the Australian Centre for Energy and Process Training. He is a member of the Board of the Australian Workforce and Productivity Agency and a member of Curtin University Council. Keith is a member of the National Carbon Capture and Storage (CCS) Council which advises the Australian Government on the accelerated development and deployment of CCS in Australia.
Other current directorships (listed entities): Geodynamics Limited since 10 July 2008, Oil Search Limited since 9 May 2012.
Former directorships in last 3 years (listed entities): None.
AJ Bester, BCom (Acc)(Hons), CA(SA) (Non-Executive Director)
Term of Office
Cobus joined the Board on 17 July 2011.
Experience
Cobus is the Group Financial Director of Murray & Roberts Holdings Limited. He is a Chartered Accountant with over 23 years experience in the construction and engineering industry. He was the Group Financial Director for Basil Read and Concor Limited for 3 and 6 years respectively and was appointed Managing Director of Concor in 2005. Concor was acquired by Murray & Roberts in 2006 and subsequently delisted from JSE Limited (previously the Johannesburg Stock Exchange). Cobus has been a Director of Murray & Roberts Limited since 2007.
Other current directorships (listed entities): Murray & Roberts Holdings Limited since 1 July 2011.
Former directorships in last 3 years (listed entities): None.
DI Crawford, BCom (Economics)(Hons), MA (Political Science), FAICD (Non-Executive Director)
Term of Office
David joined the Board on 2 May 2011.
Experience
David is Non-Executive Chairman of Perth Airport Pty Ltd and President of the National Competition Council. Prior to joining Clough, David was Corporate Affairs Director at Wesfarmers Limited and held senior executive positions with Ranger Minerals NL, Western Collieries Ltd and CSR Limited. He has been a member and Chairman of a number of government and non-government committees in the agriculture and mining industries and a management committee member of both educational and service organisations.
Other current directorships (listed entities): None.
Former directorships in last 3 years (listed entities): None.
IW Henstock, BCompt (Hons), CA(SA), HDip Tax Law, MBA (Non-Executive Director)
Term of Office
Ian joined the Board on 20 January 2012.
Experience
Ian is the Group Commercial Director of Murray & Roberts, and is also a director of Murray & Roberts Limited and Murray & Roberts International Holdings Limited.
Prior to joining Murray & Roberts, Ian held a number of leadership roles in the financial sector. He commenced his career with Ernst & Young as an articled clerk, and rose to the position of Executive Deputy Chairman, before leaving to take the role as Executive Director of Capital Partners. After a short time with Deloitte & Touche as a Senior Partner, he took the role as the Chief Executive of Bridge Capital, growing that business into a successful niche investment banking firm. He joined ABSA Group in 2004 to head up ABSA Merchant Bank, and within six months he was promoted to Managing Executive, before transferring to ABSA Private Bank in April 2006 after Barclays Bank acquired control of the ABSA Group, being appointed as Senior Executive: Strategic Wealth Management. In April 2008 Ian established an independent management consultant and corporate finance firm. He joined Murray & Roberts as Group Commercial Director effective from 1 July 2008.
Other current directorships (listed entities): None.
Former directorships in last 3 years (listed entities): None.
1 Directors (continueD)
30 June 2013
For
per
sona
l use
onl
y

35EnginEErEd for productivity
HJ Laas, BEng (Mining), MBA (Non-Executive Director)
Term of Office
Henry joined the Board on 17 July 2011.
Experience
Henry is the Group Chief Executive of Murray & Roberts Holdings Limited. Henry holds a Bachelor of Engineering (Mining) degree from the University of Pretoria and an MBA from the University of the Witwatersrand. He has extensive experience in the mineral resources and mining contracting sectors. As Managing Director of Murray & Roberts Cementation and its predecessor RUC Mining Contractors over 10 years since March 2001, he played an instrumental role in the expansion of the Cementation Group global footprint. Henry has been a director of Murray & Roberts Limited since 2007.
Other current directorships (listed entities): Murray & Roberts Holdings Limited since 1 April 2011.
Former directorships in last 3 years (listed entities): None.
NE Siford, BSc (Geography)(Hons), ACA (CFO and Executive Director)
Term of Office
Neil was promoted to CFO in November 2009 and became an Executive Director on 19 August 2010.
Experience
Neil joined Clough in 2006 as Finance Manager for Capital Projects and Asset Support and held a variety of senior finance management positions before being promoted to his current position of Chief Financial Officer in November 2009. He is a Chartered Accountant with over 26 years of business and financial management experience gained in international organisations in the UK and Australia.
Other current directorships (listed entities): None.
Former directorships in last 3 years (listed entities): Forge Group Limited – 8 August 2011 to 28 March 2013.
ER Stein, BSc (Physics)(Hons), MBA, FAICD (Non-Executive Director)
Term of Office
Emma joined the Board on 1 July 2008.
Experience
Emma is an experienced Non-Executive Director and Audit Committee Chair serving on the boards of listed companies DUET Group (majority owner of the Dampier to Bunbury Pipeline), Alumina Limited, Transpacific Industries and Programmed Maintenance Group. Ms Stein has considerable experience with industrial customers and has a comprehensive set of commercial skills in international energy and utilities markets, investments in long life assets and projects, and the upstream oil and gas sector.
Formerly the UK Managing Director for French utility Gaz de France’s energy retailing operations, Ms Stein moved to Australia in 2003. Beginning a career as a Non-Executive Director, Ms Stein took up board appointments at Integral Energy, the NSW Growth Centres Commission and Arc Energy. She is also an Ambassador for the Guides.
Other current directorships (listed entities): DUET Group since 16 June 2004, Programmed Maintenance Services Limited since 16 June 2010, Alumina Limited since 3 February 2011, Transpacific Industries Group Limited since 1 August 2011.
Former directorships in last 3 years (listed entities): Transfield Services Infrastructure Fund from 13 October 2010 to 5 July 2011.
1 Directors (continueD)
30 June 2013
For
per
sona
l use
onl
y

Clough annual report 201336
2 Directors’ MeetinGsThe number of Directors meetings and number of meetings attended by each of the Directors of Clough Limited during the financial year are as follows:
DirectorBoard of
Directors*Directors -
Special
Audit & Risk Committee
Remuneration &
HR Committee
*Remuneration & HR Committee -
Special
Health, Safety, Environment &
SustainabilityGovernance &
Nomination
Held Attended Held Attended Held Attended Held Attended Held Attended Held Attended Held Attended
AJ Bester 6 6 3 2 5 5 ** ** ** ** ** ** ** **
DI Crawford 6 6 11 11 ** ** 4 4 3 3 3 3 ** **
KT Gallagher 6 6 3 3 ** ** ** ** ** ** 3 3 ** **
IW Henstock 6 6 4 4 ** ** 4 4 3 3 ** ** ** **
HJ Laas 6 6 3 3 ** ** ** ** ** ** 3 3 1 1
NE Siford 6 6 3 3 ** ** ** ** ** ** ** ** ** **
K Spence 6 6 11 11 5 5 4 4 3 3 3 3 1 1
ER Stein 6 6 11 11 5 5 ** ** ** ** ** ** 1 1
* Special meetings related to organisational restructure, continuous disclosure and other matters.
** Not a member of the relevant committee.
3 principAL ActiVitiesThe principal activities of the Clough Group were delivery of engineering and construction contracting and procurement and construction services primarily to the oil and gas and minerals sectors. There were no significant changes in the nature of these activities during the year.
4 DiViDenDsThe Company has not determined a final dividend as explained in section 6.
5 operAtinG AnD FinAnciAL reVieW
Introduction
This operating and financial review is designed to assist readers with their understanding of Clough Limited and to convey the Board’s view of the FY2013 operational and financial performance. It should be read in conjunction with the financial statements together with the accompanying notes.
Clough is an engineering, construction and asset support contractor servicing the energy and resource market sectors in Australia, Papua New Guinea and South East Asia. The Company services the entire project lifecycle from concept development to detailed design, procurement, construction, commissioning and long term asset support.
Clough offers clients a unique value proposition by engineering to construct, then constructing to operate, reducing risk by optimising safety, productivity and cost across every phase of a project. This full spectrum service offering is a key competitive differentiator.
The Company worked on over 20 major projects across Australia and Papua New Guinea throughout the year including every major Liquefied Natural Gas (LNG) project in the execution phase in Australia and Papua New Guinea and is therefore well positioned in the LNG and Coal Seam Gas (CSG) sectors.
Safety
Clough’s safety performance improved throughout the year, with Lost Time Injury rates declining by 7% to 0.14 per million work hours and Total Recordable Injury rates declining by 14% to 1.96 per million work hours. While these rates are Australian industry leading, safety is viewed as a never-ending journey. Clough’s aim is to create a workplace that operates free of injury or incident.
This continued strong performance is a reflection of the strength of Clough’s Target Zero safety program and its ability to adapt and integrate with clients’ safety systems and processes.
Clough’s Papua New Guinea workforce continued to overcome a culturally and logistically challenging environment to achieve over 26 million work hours lost time injury free during the financial year, while the Company’s Australian projects also continued to demonstrate strong safety performance.
The Clough Downer Joint Venture achieved three million hours lost time injury free on the K128 coal seam gas project in Queensland, and the Commissioning and Asset Support Division recorded a second successive year lost time injury free. This contributed to ConocoPhillips, receiving the APPEA Safety Performance Award for the fourth successive year.
Directors’ report
30 June 2013
For
per
sona
l use
onl
y

37EnginEErEd for productivity
Whilst Clough’s safety statistics are strong, there were still safety incidents occurring on project sites. The most serious incident took place in the Sattahip fabrication yard in Thailand, when a worker severed his finger after reaching into an area beneath an unguarded table saw without isolating the machine.
As a result of this accident, the project team strengthened the approvals process to ensure subcontractor supplied equipment is safe to use and that rotating parts are appropriately shielded. These safeguards will reduce the risk of similar incidents occurring in the future.
Environment
Respect for the environment is fundamental to operations and Clough endeavours to deliver environmentally sustainable outcomes during all stages of its projects.
In the past year environmental performance has continued to set new standards as projects strive to be world leaders in environmental management. Working on the largest construction projects currently being undertaken in Australia and Papua New Guinea has significantly improved the knowledge of Clough’s people and systems. As a result of this Clough’s spill to ground incident rate across its projects remains extremely low as the Company strives to achieve positive environmental outcomes across operations.
Strategy
Clough continued to implement its agreed strategy, guided by the 4+2+3 foundation business model comprising four services: Engineering, Capital Projects, Jetties and Near Shore Marine and Commissioning and Asset Support; two market sectors: Energy and Chemicals and Mining and Minerals; and three key regions: Australia, Papua New Guinea and International.
The Engineering and Commissioning and Asset Support businesses represent medium term growth areas both domestically and internationally, where the Company continues to invest in building capability. Clough strengthened its commissioning capability during FY2013 through the acquisition of leading Australian commissioning contractor e2o and the establishment of the Clough Coens Joint Venture, to provide commissioning services to the world’s largest fabrication yards in Korea and China.
The Projects division, that incorporates the Capital Projects and Jetties and Near Shore Marine businesses, represents the Company’s core foundation business, where focus is on providing excellence in project execution and superior productivity for clients.
In line with the Company’s strategy a decision was taken to sell the 36% holding in Forge Group Limited (Forge) for gross proceeds of $187 million. Forge delivered strong growth and was an outstanding investment for Clough.
Management were also pleased to evolve the Company’s strategy, with the introduction of the “new horizons” growth plan. This will manifest itself in the short to medium term with a controlled and orderly expansion of engineering led activities beyond Australia and Papua New Guinea. The first step in this expansion will be the establishment of a United Kingdom engineering centre in Glasgow, Scotland, in FY2014, to provide low cost engineering services to the North Sea and Africa, where Management see future LNG opportunities.
Market Overview
The financial year was characterised by a slowdown in economic growth in China leading to weaker demand for the commodities Clough’s clients provide. Along with the well-publicised productivity and cost challenges facing Australian projects, this has resulted in the postponement of many major mining and minerals projects and turbulent markets.
Clough responded to industry challenges by implementing proactive austerity measures to eliminate cost inefficiency. In the past year these measures have safely and sustainably achieved over $10 million in operational savings. During FY2014 the company will continue to focus on driving down costs to remain competitive in an increasingly global environment.
A continued focus on excellence in execution and contract delivery has driven the development of programs to enhance productivity and improve project management procedures and capabilities. In addition, diversification of contract risk has resulted in a reduced risk profile, with an order book consisting of approximately 79% cost reimbursable contracts at 30 June 2013.
In response to productivity challenges, Clough has invested significantly in technology and systems to improve productivity performance. This includes proprietary software to enable real time productivity reporting on Clough’s projects. Productivity performance will be driven from the top, with Clough’s operating committee providing governance and oversight for all operations. Management are driving the right behaviours at the project level, by aligning incentive programs for project staff with safety, cost and productivity outcomes.
In 2014 the Company will launch a project management development program in line with the long term aim to build superior project management capability that will differentiate Clough from its competition.
5 operAtinG AnD FinAnciAL reVieW (continueD)
30 June 2013
For
per
sona
l use
onl
y

Clough annual report 201338
Financial Performance
Clough’s record results for FY2013 are a testament to the Company’s continued focus on improved operational performance and cost efficiency. Total revenue from continuing operations increased by 50%, up to $1.5 billion and Earnings Before Interest and Tax (EBIT) increased by 144%, to $90.7 million. Pleasingly, EBIT margin increased throughout the financial year, from 3.7% in FY2012 to 6.0% in FY2013.
Discontinuing operations include a post tax gain of $37.3 million on the disposal of Clough’s 36% interest in the Forge Group together with Clough’s share of Forge’s post tax profit to the date of sale of $17.5 million.
Clough’s engineering division worked on five major contracts and over 20 Master Service Agreements with blue chip clients during the financial year, which has supported improved financial performance. Engineering EBIT increased by 48% to $72.9 million. Growth was underpinned by continued strong performance by the Kellogg Joint Venture working on the EPCM contract for Chevron’s Gorgon LNG project, and a significant increase in revenue and earnings from engineering consulting work including BP’s Tangguh LNG expansion project in Sumatra.
Projects EBIT increased by 67% to $57.6 million, strengthened by the successful completion of PNG LNG export jetty in July 2013 and good progress on the NAAN 3 Ammonia Nitrate plant in Kwinana. The second half of the financial year benefited from work on two Queensland CSG projects: the ramp up of site works and enhanced productivity performance on the K128 project for Santos’ GLNG project, and the award and execution of Phase 1 works for QGC’s QCLNG project.
Commissioning and Asset Support EBIT increased by 109% to $11.1 million, benefiting from increased work on the fully reimbursable Wheatstone Hook Up and Commissioning contract and a contribution from the e2o commissioning business acquired in January 2013. This acquisition has been extremely successful with the company performing above target.
Clough AMEC increased activity on the Oil Search Kumul Terminal Rejuvenation project and continued operations and maintenance support for the ConocoPhillips Bayu-Undan facility in the Timor Sea, which also contributed to the earnings increase.
Corporate overheads and other costs (including share based payments and foreign exchange movements) decreased from $49.1 million in FY2012 to $42.8 million in FY2013 and Clough achieved over $10 million of sustainable savings in the year including reductions in divisional overhead.
Cash in hand at 30 June 2013 was $441.2 million compared to $146.5 million at 30 June 2012, principally reflecting an increase in operating cash flows from strong project performance and the disposal of Clough’s interest in Forge for gross proceeds of $187 million. It was particularly pleasing to see positive results from the strong working capital focus in the year with the business recording a working capital inflow of approximately $52 million.
Outlook
Clough enters FY2014 with an order book of secured revenue at $2.3 billion, with $1.4 billion secured for FY2014, and $705 million secured for FY2015.
The Company will continue to invest in building capabilities and technology to strengthen the service offering and deliver better cost and productivity outcomes to its clients. Expanding asset support capability to provide increased operational support to clients will be a key focus as the LNG industry transitions from the construction phase to the operations phase.
Clough will seek to diversify earnings across its business divisions, markets and geographic regions and re-establishing its business in the mining and minerals market remains a key part of the Company’s diversification strategy. Despite a market correction of unprecedented proportions, Management believe the cyclical nature of the mining and minerals sector will see this rebound and Clough will be well positioned to leverage opportunities when this time comes. Clough aims to grow mining and minerals project revenue to between 10% and 20% of annual revenue.
6 MAtters suBseQuent to tHe enD oF tHe FinAnciAL YeArNo matters or circumstances have arisen since the end of the financial year, which significantly affected or may significantly affect the operations of the consolidated entity, the results of those operations, or the state of the affairs of the consolidated entity in periods subsequent to the year ended 30 June 2013, apart from the matters noted below.
On 31 July 2013, Clough announced that it had received a conditional proposal (the “Proposal”) from its major shareholder, Murray & Roberts Holdings Limited (“Murray & Roberts”) to acquire all the outstanding shares in Clough that it does not already own for consideration of $1.46 per share. The Proposal allows for the offer price of $1.46 to comprise a cash payment by Murray & Roberts of $1.32 and the payment by Clough of a dividend of $0.14 per share. The Proposal is conditional upon satisfactory completion of due diligence, execution of a scheme implementation agreement, final Murray & Roberts board approval and unanimous recommendation by Clough’s independent directors in support of the transaction.
Clough is currently working with Murray & Roberts to enter into a binding scheme implementation agreement and for the transaction to be put to shareholders.
5 operAtinG AnD FinAnciAL reVieW (continueD)
Directors’ report
30 June 2013
For
per
sona
l use
onl
y
39EnginEErEd for productivity
Following the announcement of the Proposal by Murray & Roberts to acquire all the outstanding shares in Clough that it does not already own at $1.46 cash per share (which includes the payment of a dividend of $0.14 per share which is expected to be fully franked), Clough has decided not to determine a final dividend at the present time.
The proposed record date and payment date for the dividend will be notified to shareholders along with full details of the Proposal in due course. If the Proposal does not proceed, Clough will review its determination regarding the payment of a dividend.
7 LiKeLY DeVeLopMentsDisclosure of information relating to likely developments in the operations of the consolidated entity is contained in the operating and financial review.
8 enVironMentAL reGuLAtionsThe operations of the consolidated entity are subject to environmental regulations under Commonwealth, State and Territory legislation. Overseas operations are also subject to relevant environmental regulations. The standard policy of the Company in relation to the environment requires all operations to be conducted in a manner to protect and preserve the environment. The Directors are not aware of any material breaches of environmental regulations during or since the end of the financial year.
9 reMunerAtion report - AuDiteD
Introduction
The Directors are pleased to present the Remuneration Report for the year ended 30 June 2013, which sets out remuneration information for Clough Limited’s Non-Executive Directors, Executive Directors and other Key Management Personnel.
This Remuneration Report outlines remuneration arrangements in accordance with the requirements of the Corporations Act 2001 and its Regulations. Key Management Personnel of the Group are defined as those persons having authority and responsibility for planning, directing and controlling the major activities of the Company and the Group, directly or indirectly, including any director of the parent company.
9.1 remuneration philosophy and principles used to determine the nature and amount of remunerationRemuneration levels are set with the objective of attracting and retaining appropriately qualified and experienced employees. Remuneration packages are structured to recognise, encourage and reward improved performance and business growth, balanced between short-term and long-term goals. Benchmarking is undertaken on a regular basis to ensure remuneration packages are competitively positioned in the market. The short-term incentive plan is designed to align employees’ interests with the objectives of the business and to incentivise individual contribution to achieving overall results. The long-term incentive plan is designed to align senior employee’s interests with the Company’s longer term objective of growth in market capitalisation and earnings per share.
Remuneration and Human Resource Committee
The objective of the Remuneration and Human Resource Committee is to review the Company’s remuneration and human resource policies and strategies and to take appropriate action by reporting and making recommendations to the Board as it deems advisable. The Committee consists of three appropriately qualified and experienced Non-Executive Directors. The Committee is chaired by an independent Non-Executive Director. The Committee will generally meet four times per annum but as often as it is required to discharge its responsibilities. Members are generally appointed for a term of three years.
6 MAtters suBseQuent to tHe enD oF tHe FinAnciAL YeAr (continueD)
30 June 2013
For
per
sona
l use
onl
y
Clough annual report 201340
9.1 remuneration philosophy and principles used to determine the nature and amount of remuneration (continued)The Committee will oversee:
(i) Remuneration policy and strategy including the overall remuneration framework, including incentive plans.
(ii) Human resource policy and strategy.
(iii) The remuneration of the CEO including:
• UndertakingtheCEOperformancereviewandmakerecommendationstotheBoard.
• Settingannualperformancetargetsandkeyperformanceindicators.
• Determinationofannualsalaryadjustmentsandincentivepayments.
(iv) The engagement of Senior Executives including CEO direct reports:
• CEO’srecommendationsinrelationtotheappointmentandterminationofseniorexecutivesanddirectreports.
• CEO’srecommendationsinrelationtoannualsalaryadjustmentsandincentivepayments.
• Successionplanning.
(v) The Clough Superannuation Fund.
(vi) Non-Executive Directors fees:
• SettingofNon-ExecutiveDirectors’feesannually.
• Non-ExecutiveDirectors’feesremainingwithinthelimitapprovedbytheshareholders.
(vii) Short-Term Incentive Plan:
• CEO’srecommendationsinrelationtoannualtargets,performanceagainsttargetsandthequantumofannualpayments.
(viii) Long-Term Incentive Plan:
• CEO’srecommendationsinrelationtohurdles,performanceperiodandvestingperiod.
• CEO’srecommendationsinrelationtothegrantofperformancerightsandoptionstoemployees.
(ix) Key talent:
• Theprocessesemployedwithinthebusinesstoidentifyanddevelopkeytalent.
Non-Executive Director Remuneration
Fees paid to Non-Executive Directors reflect the demands made on, and the responsibilities of the position. Non-Executive Directors’ fees and payments are reviewed annually by the Board. The Chairman’s fee is determined independently of the fees of other Non-Executive Directors based on comparative roles in the external market and includes committee fees. The Chairman is not present at any discussions relating to determination of his own remuneration. Non-Executive Directors who are members of a Board sub-committee receive an additional fee.
The Constitution of Clough Limited and the ASX Listing Rules specify that the aggregate remuneration of Non-Executive Directors shall be determined from time to time by the members at a general meeting. The current limit of $900,000 was approved by shareholders at the Annual General Meeting of the Company held on 9 November 2005.
Executive Remuneration including the Chief Executive Officer
Executive Directors do not receive Directors’ fees.
The executive remuneration framework has three components and the combination of these comprise the executive’s total remuneration:
• BaseSalaryandBenefits
• Short-TermIncentives
• Long-TermIncentives
Base Salary and Benefits
Employees are offered a competitive base salary and benefits that comprises the fixed component of the remuneration package. Base salary and benefits are reviewed annually to ensure the employee’s remuneration is competitive in relation to the market. Base salary is also reviewed on promotion. Employment contracts do not guarantee increases in base salary and benefits.
Benefits include superannuation; wellbeing, vehicle and parking allowances; further education assistance; paid parental leave and salary continuance insurance. Employees are encouraged to join the Clough Superannuation Fund. The superannuation fund is a self-managed corporate accumulation fund established for the benefit of Clough employees.
9 reMunerAtion report - AuDiteD (continueD)
Directors’ report
30 June 2013
For
per
sona
l use
onl
y

41EnginEErEd for productivity
9.1 remuneration philosophy and principles used to determine the nature and amount of remuneration (continued)
Short-Term Incentives
The objective of the short-term incentive plan (STIP) is to align the interests of Senior Management with those of shareholders through the payment of short-term incentives linked to pre-agreed targets. Targets for FY13 included earnings before interest and tax, order intake, margin in order intake and operating cash flow chosen for short-term operational management and long-term sustainability.
At the start of each year, the Board of Directors sets a threshold earnings target that must be achieved for that year before any short-term incentive becomes potentially payable to employees. Once the threshold target has been met, employees earn 50% of the maximum short-term incentive opportunity if agreed business plan targets are met and a further 50% where stretch targets have been met. A moderating factor of 0 to 1.3 times may be applied to the total STIP value dependant on individual performance in the year. The aggregate STIP payment in any one year is limited to a maximum 10% of EBIT.
The key determinants of the actual short-term incentive amount paid to an individual employee are:
• Basesalary(includingvehicleallowance)
• EmploymentbandindicatingSTIP%
• CompanyperformanceagainstCompanytarget
• Individualperformanceagainstindividualperformancetargetsandobjectives
Long-Term Incentives
Senior Management participate in Clough’s long-term incentive plan through the granting of options issued pursuant to the Clough Limited Employee Option Plan. The objective of the option plan is to align the interests of Senior Management with shareholders through the granting of options with a deferred vesting date. Under the current policy, options granted on or after 8 March 2013 will vest at the end of a three year vesting period with 50% subject to Total Shareholder Return hurdles and 50% subject to Earnings Per Share hurdles. The Share Trading Policy prohibits executives from entering into transactions or arrangements that limit the economic risk of participating in unvested security entitlements. A closed period applies to nominated Senior Management during the month preceding the release of half-yearly and annual results.
Use of a remuneration consultant
During the financial year under review, Clough Limited’s Remuneration and Human Resource Committee had access to a variety of industry available benchmarks and based decisions on these in setting the remuneration levels for the Chief Executive Officer and other Key Management Personnel. The Committee also employed the services of Guerdon Associates for the purposes of benchmarking Non-Executive Director’s and CEO Remuneration. A total of $46,458 was spent on this process.
Performance Evaluation
Individual performance is measured through the My Pursuit of Excellence process. Individual financial and non-financial objectives from the Balanced Scorecard are cascaded down throughout all levels of the organisation and form the basis for assessing performance for the purposes of the annual salary and STIP review processes. Increases as a result of salary reviews are consequently not guaranteed. Individuals must adequately meet performance objectives and behavioural competency requirements in order to qualify for any salary movements.
Group Performance
The table below shows the performance of the Group for the past five years.
Financial Year End
Net Profit attributable to owners of Clough
Limited
$’000
Share Price at beginning of the financial year
Cents
Share Price at end of the financial year
Cents
Market Capitalisation
$’000
Dividend paid per share
Cents
2009 52,426 73.00 71.00 475,783 1.0
2010 50,090 71.00 77.00 591,957 2.0
2011 33,345 77.00 71.00 546,559 2.2
2012 42,898 71.00 74.50 577,275 2.2
2013 127,414 74.50 107.00 831,034 2.6
9 reMunerAtion report - AuDiteD (continueD)
30 June 2013
For
per
sona
l use
onl
y

Clough annual report 201342
9.2 Details of remuneration
Amounts of Remuneration
Details of the nature and amount of each element of the remuneration of each Non-Executive Director and Executive Director of Clough Limited and the Key Management Personnel of the consolidated entity are set out in the following tables. The short-term incentives are dependent on the satisfaction of the performance conditions as set out in the section headed “Short-Term Incentives,” as disclosed in section 9.1.
Non-Executive Directors of Clough Limited
2013 Short-Term BenefitsPost-Employment
Benefits Total
Name
Directors’ Fee
$
Travel Allowance
$
Non-Monetary Benefits ^
$
Other *
$
Superannuation
$ $
AJ Bester (i) 73,821 27,983 - - - 101,804
DI Crawford 83,814 - - 412 7,543 91,769
IW Henstock (i) 73,821 27,983 - - - 101,804
HJ Laas (i) 77,152 27,983 - - - 105,135
K Spence 184,685 - 8,526 1,372 16,622 211,205
ER Stein 92,833 27,983 - 584 10,873 132,273
2012 Short-Term BenefitsPost-Employment
Benefits Total
Name
Directors’ Fee
$
Travel Allowance
$
Non-Monetary Benefits ^
$
Other *
$
Superannuation
$ $
AJ Bester (i), (ii) 65,341 24,768 - - - 90,109
DI Crawford 70,007 - - 387 6,301 76,695
IW Henstock (i), (iv) 31,088 11,785 - - - 42,873
NWR Harvey (i), (iii) 38,162 14,465 - - - 52,627
HJ Laas (i), (ii) 59,965 24,768 - - - 84,733
K Spence 173,250 - 8,136 480 15,593 197,459
ER Stein 80,949 26,250 - 560 9,648 117,407
^ Non-monetary benefits include fringe benefits tax and parking costs paid by the Company.
* Other short-term benefits include life insurance and income protection insurance premiums paid by the Company.
(i) The Directors’ fees for AJ Bester (from 17 July 2011), IW Henstock (from 20 January 2012), HJ Laas (from 17 July 2011), NWR Harvey (until 20 January 2012) are paid to Murray & Roberts Pty Ltd.
(ii) AJ Bester and HJ Laas were appointed as Non-Executive Directors on 17 July 2011.
(iii) NWR Harvey resigned as a Non-Executive Director on 20 January 2012.
(iv) IW Henstock was appointed as a Non-Executive Director on 20 January 2012.
9 reMunerAtion report - AuDiteD (continueD)
Directors’ report
30 June 2013
For
per
sona
l use
onl
y

43EnginEErEd for productivity
9.2 Details of remuneration (continued)
Executive Directors of Clough Limited
2013 Short-Term Benefits
Post- Employment
Benefits
Share- Based
Payments
Share- Based
Payments
Share- Based
Payments Total
Proportion of Remun- eration
Performance Related Ø
Share-Based Payments
value as Proportion of Remun-
eration
Name
Salary #
$
Incentive €
$
Non- Monetary Benefits ^
$
Other *
$
Super- annuation
$
Shares
$
Perform- ance
Rights
$
Options
$ $ % %
KT Gallagher 1,093,014 1,010,184 8,526 6,762 98,371 - - 105,387 2,322,244 48 5
NE Siford 598,202 302,500 8,526 4,958 53,838 - 73,443 59,092 1,100,559 33 12
2012 Short-Term Benefits
Post- Employment
Benefits
Share- Based
Payments
Share- Based
Payments
Share- Based
Payments Total
Proportion of Remun- eration
Performance Related Ø
Share-Based Payments
value as Proportion of Remun-
eration
Name
Salary #
$
Incentive €
$
Non- Monetary Benefits ^
$
Other *
$
Super- annuation
$
Shares
$
Perform- ance
Rights
$
Options
$ $ % %
KT Gallagher (i) 709,829 512,863 6,143 403,332 63,885 900,000 - 21,678 2,617,730 20 35
J Smith (ii) 531,218 666,912 50,112 36,937 47,810 - - (484,299) 848,690 36 (57)
NE Siford (iii) 427,171 186,923 8,136 4,145 38,445 - 25,229 38,527 728,576 31 9
# Salary includes payments for all allowances and short-term compensated absences (e.g. paid annual leave, sick leave, etc.) and the movement in the provision for annual leave and entitled long service leave.
Ø Options with performance conditions are included in performance related remuneration.
^ Non-monetary benefits include fringe benefits tax and parking costs paid by the Company.
* Other short-term benefits include life insurance and income protection insurance premiums, airfares and sign-on payments.
€ The short-term incentive payment is based on the Company’s performance relative to the targets set at the beginning of the year and the remuneration band of the employee moderated by the individual’s assessed performance.
(i) KT Gallagher was appointed as Chief Executive Officer and Managing Director on 3 November 2011. As part of KT Gallagher’s appointment the Board approved a sign-on payment of $1.3 million ($400,000 cash and $900,000 shares). The sign-on payment compensated KT Gallagher for remuneration foregone when leaving his previous employer, and was negotiated when finalising KT Gallagher’s employment contract (for further details refer to section 9.3). As KT Gallagher is a related party of the Company (i.e. a Director), in accordance with Listing Rule 10.11, the proposed issue of securities required prior approval of shareholders. The issue of the sign-on shares was approved by the shareholders at the Annual General Meeting of the Company held on 18 October 2011.
(ii) J Smith resigned as Chief Executive Officer and Managing Director on 2 November 2011. J Smith’s final date of service was 23 December 2011. The remuneration disclosed above was for the period 1 July 2011 to 23 December 2011.
(iii) 305,885 performance rights were issued to NE Siford after shareholder approval had been obtained at the Company’s Annual General Meeting held on 23 October 2012, on the same terms as the performance rights granted to certain other executives on 1 March 2012. In accordance with Accounting Standard AASB 2 Share-based Payment, the grant date of the performance rights issued to NE Siford is the date of shareholder approval. The Standard requires that when the grant date occurs after an employee has begun rendering a service, the entity is to recognise the services when received. The above stated performance rights value of $25,229 represents the estimated grant date fair value of the performance rights for the purposes of recognising the services received during the period from the service commencement date (being 1 March 2012) to 30 June 2012. During the current year, these performance rights were revalued on 23 October 2012 and this resulted in a decrease in the valuation for the prior year of $662. This adjustment has been included in the current year amount of $73,443.
9 reMunerAtion report - AuDiteD (continueD)
30 June 2013
For
per
sona
l use
onl
y

Clough annual report 201344
9.2 Details of remuneration (continued)
Other Key Management Personnel of the Consolidated Entity
2013 Short-Term Benefits
Post- Employment
Benefits
Share- Based
Payments
Share- Based
Payments Total
Proportion of Remun- eration
Performance Related Ø
Share-Based Payments
value as Proportion of Remun-
eration
Name
Salary #
$
Incentive €
$
Non- Monetary Benefits ^
$
Other *
$
Super- annuation
$
Perform- ance
Rights
$
Options
$
Termin- ation
Benefits
$ $
β
%
β
%
MCG Bergomi α Executive Vice President - Commissioning & Asset Support
488,262 279,010 8,526 4,857 43,944 76,104 74,374 - 975,077 36 15
GN Bowtell α Executive Vice President - Engineering
490,346 202,491 9,698 4,951 44,131 76,104 46,349 - 874,070 28 14
RW Robinson (i) αExecutive Vice President - Projects
455,322 275,000 8,010 23,238 40,979 95,697 64,610 - 962,856 35 17
2012 Short-Term Benefits
Post- Employment
Benefits
Share- Based
Payments
Share- Based
Payments Total
Proportion of Remun- eration
Performance Related Ø
Share-Based Payments
value as Proportion of Remun-
eration
Name
Salary #
$
Incentive €
$
Non- Monetary Benefits ^
$
Other *
$
Super- annuation
$
Perform- ance
Rights
$
Options
$
Termin- ation
Benefits
$ $
β
%
β
%
MCG Bergomi α Executive Vice President - Strategy & Business Acquisition and Commissioning & Asset Support
428,853 161,820 14,584 4,746 38,597 25,229 68,683 - 742,512 31 13
GN Bowtell α Executive Vice President - Engineering
438,792 135,861 12,183 3,624 39,491 25,229 21,670 - 676,850 23 7
WJ Boyle (ii) αFormer Group Chief Operating Officer
515,424 - 28,968 47,841 123,047 - (13,222) 947,311 1,649,369 (1) (1)
9 reMunerAtion report - AuDiteD (continueD)
Directors’ report
30 June 2013
For
per
sona
l use
onl
y

45EnginEErEd for productivity
9.2 Details of remuneration (continued)
Other Key Management Personnel of the Consolidated Entity (continued)
# Salary includes payments for all allowances and short-term compensated absences (e.g. paid annual leave, sick leave, etc.) and the movement in the provision for annual leave and entitled long service leave.
Ø Options with performance conditions are included in performance related remuneration.
^ Non-monetary benefits include fringe benefits tax and parking costs paid by the Company.
* Other short-term benefits include life insurance, income protection insurance and inpat insurance premiums, relocation costs, airfares and other incidental costs paid by the Company in relation to employment.
α An executive that in the opinion of the Directors meets the definition of ‘key management personnel’ as defined in AASB 124 Related Party Disclosures. In the opinion of the Directors, no other executives met the definition of key management personnel.
β Percentage based on total remuneration for the year.
€ The short-term incentive payment is based on the Company’s performance relative to the targets set at the beginning of the year and the remuneration band of the employee moderated by the individual’s assessed performance.
(i) RW Robinson was regarded as being a key management person from 2 October 2012. The remuneration disclosed above was from the date RW Robinson was regarded as being a key management person.
(ii) WJ Boyle’s contract was terminated on 7 February 2012. WJ Boyle received a termination payment in accordance with the terms and conditions of his employment contract of $947,311, including accrued annual leave of $95,551 and payment in lieu of notice of $851,760. WJ Boyle’s termination resulted in a share-based payment expense write-back of $65,264 due to 986,471 options being forfeited on leaving the Company.
9.3 senior executive employment contractsRemuneration and other terms of employment for the Chief Executive Officer are formalised in a senior executive employment contract. At 30 June 2013, major provisions of the agreement and relevant remuneration information are set out below.
KT Gallagher - Chief Executive Officer
Employment commenced on 3 November 2011.
• Fixedremunerationcomprisingabasesalaryof$1,110,092perannumandsuperannuationof$99,908,being9%ofthebasesalary,including a super cashback for all amounts exceeding $25,000.
• Sign-onpaymentof$1.3million,being$400,000cashand$900,000CloughLimitedshares.
1,136,394 fully paid ordinary Clough Limited shares were issued to KT Gallagher. The shares were originally unlisted and were not freely transferable until the first anniversary of employment at which time quotation was sought and obtained. The number of contractual shares issued to KT Gallagher was calculated as follows:
$900,000 divided by the five day volume weighted average price of Clough Limited shares traded on the ASX up to and including the trading day before the employment commencement date.
If the employee resigns within 12 months of the employment commencement date, the employee agrees to immediately repay an amount of $715,000 (being the estimated after tax value of the sign-on payments).
• Anannualincentivepaymentofupto70%ofbasesalary(includingsuperannuation),basedonsuccessfulperformancetothesatisfaction of the Board and application of a moderating factor of 1. Where Short Term Incentives are significantly exceeded, a moderating factor of a maximum of 1.3 may be applied to the final Short-Term Incentive Plan value. Refer to Short-Term Incentives contained in section 9.1 of the Directors’ Report for further details.
• Otherbenefitsincludeparking,salarycontinuanceinsuranceandreasonabletelephonecosts.
• ShareoptionswillbegrantedtoKTGallagherinaccordancewiththetermsandconditionsoftheCloughLimitedEmployeeOptionPlan or such other long term incentive plan as may be approved by the Board from time to time.
• CloughLimitedmayterminatetheemployee’semploymentbygiving12monthswrittennoticeor12monthspaymentinlieuofnotice, or a combination of notice and payment in lieu of notice.
• TheemployeemayresignfromCloughLimitedbygiving12month’swrittennotice.
9 reMunerAtion report - AuDiteD (continueD)
30 June 2013
For
per
sona
l use
onl
y

Clough annual report 201346
9.3 senior executive employment contracts (continued)
Other Senior Executives
Remuneration and other terms of employment for other senior executives are formalised in service agreements. At 30 June 2013, major provisions of the agreements are set out below.
Name Term of Agreement
Base salary, allowances and superannuation
$
Maximum Incentive % of base salary (including travel
allowance) ^
Contractual Notice Period:
Employee
Contractual Notice Period:
Employer *
MCG Bergomi On-going commencing 11 February 2008
506,850 50 % 3 months 12 months
GN Bowtell On-going commencing 26 July 2010
510,649 50 % 3 months 3 months
RW Robinson On-going commencing 2 October 2012
599,500 50 % 6 months 6 months
NE Siford On-going commencing 29 May 2006
617,410 50 % 3 months 6 months
* Termination benefits are payable on early termination by the Company, other than for gross misconduct; unless otherwise indicated they are equal to the base salary including allowances and superannuation for the remaining notice period of the agreement.
^ Refer to Short-Term Incentives contained in section 9.1 of the Directors’ Report for further details.
9.4 Voting and comments made at the company’s 2012 Annual General MeetingClough Limited received more than 91% of “yes” votes on its Remuneration Report for the 2012 financial year.
9.5 share-based compensation
Options
Options are granted to senior employees under the Clough Limited Employee Option Plan (“Plan”) to align their interests with those of the shareholders of the Company and for staff retention purposes. The maximum number of Options that can be issued is subject to the following test.
The Company must not grant any Options or procure the issue of any Shares under this Plan if immediately following the grant of Options or an issue of Shares from an exercise of Options, the aggregate of: the total number of unissued Shares over which Options or Performance Rights have been granted; and the total number of Shares issued during the preceding five years under the Clough Limited Employee Option Plan and the Clough Limited Executive Incentive Scheme, would exceed 5% of the number of Shares on issue at the time of the proposed grant or issue, except for an issue of Options or Performance Rights to Executive Directors for which separate shareholder approval is obtained.
During the year, the Company issued 4,296,720 (2012: 5,578,685) options to employees under the Plan, 2,630,533 (2012: 4,927,994) options were exercised, 75,000 options expired (2012: 60,000) and a total of 3,678,547 (2012: 7,491,098) options were forfeited by employees leaving the Company.
At 30 June 2013, the terms of each grant of options affecting remuneration in the current or a future reporting period are:
Grant date Vesting dateNumber of Options Balance at year end Exercise price
Value per option at grant date Date exercisable
16 March 2010 16 March 2013 680,000 $0.90 $0.3570 16/03/13 – 16/03/16
16 March 2010 16 March 2014 2,039,748 $0.82 $0.3210 16/03/14 – 16/03/17
24 February 2011 23 February 2015 2,920,908 $0.89 $0.3437 23/02/15 – 23/02/18
24 February 2012 24 February 2016 4,369,805 $0.68 $0.3629 24/02/16 – 24/02/19
8 March 2013 (i) 8 March 2016 4,296,720 $1.055 $0.5858 08/03/16 – 08/03/19
(i) The model inputs for the options granted during the year ended 30 June 2013 are:
• Theoptionshaveasixyearlifespan,aregrantedfornoconsiderationandareexercisableatanytimebetweenthevestingdateand the expiry date.
• Grantdate:8March2013;Vestingdate:8March2016;andExpirydate:8March2019.
• Sharepriceatgrantdate:$1.32;andExerciseprice:$1.055.
• Expectedpricevolatilityoftheshares:55%;Expecteddividendyield:3.0%;andRisk-freeinterestrate:3.03%.
9 reMunerAtion report - AuDiteD (continueD)
Directors’ report
30 June 2013
For
per
sona
l use
onl
y

47EnginEErEd for productivity
9.5 share-based compensation (continued)
Performance Rights
Performance Rights were granted to key management personnel and senior executives under the Clough Limited Executive Incentive Scheme (“Scheme”) to align their interests with those of the shareholders of the Company and for executive retention purposes, following the appointment of Kevin Gallagher in 2011. Performance Rights may also be potentially used for the purposes of sign-on incentives for Senior Management commencing with Clough.
Further, the Company must not grant any Performance Rights or procure the issue of any Shares under this Scheme if immediately following the grant of Performance Rights or an issue of Shares from the vesting of Performance Rights, the aggregate of: the total number of unissued Shares over which Performance Rights or Options have been granted; and the total number of Shares issued during the preceding five years under the Clough Limited Executive Incentive Scheme and the Clough Limited Employee Option Plan, would exceed 5% of the number of Shares on issue at the time of the proposed grant or issue, except for an issue of Performance Rights or Options to Executive Directors for which separate shareholder approval is obtained.
During the year, the Company issued 874,067 (2012: 1,284,717) performance rights under the Scheme; nil (2012: nil) performance rights were exercised and nil (2012: nil) performance rights were forfeited by employees leaving the Company.
At 30 June 2013, the terms of each grant of performance rights affecting remuneration in the current or a future reporting period are:
Grant date Vesting date
Number of Performance Rights Balance at year end Exercise price
Value per Performance Right
at grant date
1 March 2012 1 March 2015 1,284,717 $nil $0.7464
23 October 2012 – Tranche A (a) * 1 March 2015 305,885 $nil $0.7268
15 August 2012 – Tranche 1 (a) 15 August 2014 189,394 $nil $0.6404
15 August 2012 – Tranche 2 (a) 15 August 2015 189,394 $nil $0.6215
15 August 2012 – Tranche 3 (a) 15 August 2016 189,394 $nil $0.6031
* 305,885 performance rights were issued to NE Siford after shareholder approval had been obtained at the Company’s AGM held on 23 October 2012, on the same terms as the performance rights granted on 1 March 2012.
(a) The model inputs for the performance rights granted during the year ended 30 June 2013 are:
• Theperformancerightsaregrantedfornoconsiderationandautomaticallyvestonthevestingdateandhavealifeof:TrancheA: 2.3 years, Tranche 1: 2 years, Tranche 2: 3 years and Tranche 3: 4 years. These rights have no performance criteria that must be met before they vest. However, participants must remain employed by the Company until the relevant vesting date to take ownership of the rights. In addition, if a Change of Control Event occurs, then all performance rights granted under the Scheme vest automatically.
• Eachperformancerightwhichvestsentitlestheparticipanttoeither,attheCompany’selection,toreceiveoneshareorreceivein cash the market price of one share at the vesting date.
• Grantdate:TrancheA:23October2012,Tranches1,2and3:15August2012;Vestingdates:TrancheA:1March2015,Tranche1:15 August 2014, Tranche 2: 15 August 2015 and Tranche 3: 15 August 2016.
• Sharepriceatgrantdate:TrancheA:78cents,Tranches1,2and3:68cents;andExerciseprice:nilcents.
• ExpectedpricevolatilityoftheCompany’sshares:TrancheA:40%,Tranche1:40%,Tranche2:40%andTranche3:55%;Expecteddividend yield: Tranche A: 3.0%, Tranche 1: 3.0%, Tranche 2: 3.0% and Tranche 3: 3.0%; and Risk-free interest rate: Tranche A: 2.52%, Tranche 1: 2.89%, Tranche 2: 2.75% and Tranche 3: 2.86%.
For additional information, refer to note 38 “Share-based payments” of the notes to the financial statements.
9 reMunerAtion report - AuDiteD (continueD)
30 June 2013
For
per
sona
l use
onl
y

Clough annual report 201348
9.5 share-based compensation (continued)
Incentive and share-based compensation benefits – Directors and Other Key Management Personnel
For each incentive and grant of options / performance rights included in the Remuneration Report, the percentage of the available incentive or grant that was paid, or that vested, in the financial year, the percentage that was forfeited because the person did not meet the service or performance criteria and the maximum total value of the grant yet to vest is set out below.
Incentive Share-based compensation (Options and Performance Rights)
Name
Paid
%
Forfeited
%
Number of Options /
Performance Rights ^ granted Grant Date
Vested
%
Forfeited
%
Financial years in which
Options / Performance
Rights vest
Maximum total value
of grant yet to vest
$
KT Gallagher 100 - 687,185 24/02/2012 - - 30/06/2016 165,400
707,035 08/03/2013 - - 30/06/2016 371,132
NE Siford 100 - 50,000 05/03/2008 100 - 30/06/2011 Nil
94,185 11/02/2009 100 - 30/06/2012 Nil
141,364 16/03/2010 - - 30/06/2014 8,044
164,692 α18/10/2011 - - 30/06/2015 23,378
202,474 24/02/2012 - - 30/06/2016 48,734
^305,885 *23/10/2012 - - 30/06/2015 123,645
250,217 08/03/2013 - - 30/06/2016 131,342
MCG Bergomi 100 - 330,000 01/02/2008 100 - 30/06/2011 Nil
330,000 01/02/2009 100 - 30/06/2012 Nil
340,000 16/03/2010 100 - 30/06/2013 Nil
160,717 24/02/2011 - - 30/06/2015 22,814
209,444 24/02/2012 - - 30/06/2016 50,411
^ 305,885 01/03/2012 - - 30/06/2015 126,979
211,555 08/03/2013 - - 30/06/2016 111,048
GN Bowtell 100 - 175,671 24/02/2011 - - 30/06/2015 24,937
207,137 24/02/2012 - - 30/06/2016 49,856
^ 305,885 01/03/2012 - - 30/06/2015 126,979
204,713 08/03/2013 - - 30/06/2016 107,457
RW Robinson 100 - 377,119 16/03/2010 - - 30/06/2014 21,460
186,678 24/02/2011 - - 30/06/2015 26,499
220,116 24/02/2012 - - 30/06/2016 52,980
^189,394 15/08/2012 - - 30/06/2015 68,287
^189,394 15/08/2012 - - 30/06/2016 83,417
^189,394 15/08/2012 - - 30/06/2017 89,284
250,217 08/03/2013 - - 30/06/2016 131,342
^ Represents performance rights.
α The 18 October 2011 grant date represents the date of shareholders approval at the Company’s Annual General Meeting.
* The 23 October 2012 grant date represents the date of shareholders approval at the Company’s Annual General Meeting.
9 reMunerAtion report - AuDiteD (continueD)
Directors’ report
30 June 2013
For
per
sona
l use
onl
y

49EnginEErEd for productivity
9.5 share-based compensation (continued)
Incentive and share-based compensation benefits – Directors and Other Key Management Personnel (continued)
Details of options and performance rights over ordinary shares in the Company provided as remuneration during the year to each Director of Clough Limited and Other Key Management Personnel of the Group are set out below.
Name
Number of options granted and issued
during the yearNumber of options
vested during the year
Directors of Clough Limited
KT Gallagher 707,035 -
NE Siford 250,217 -
Other Key Management Personnel of the Group
MCG Bergomi 211,555 340,000
GN Bowtell 204,713 -
RW Robinson 250,217 -
Name
Number of performance rights granted and issued
during the yearNumber of performance
rights vested during the year
Directors of Clough Limited
NE Siford 305,885 -
Other Key Management Personnel of the Group
RW Robinson 568,182 -
The assessed fair value of the options and performance rights granted to Directors and Other Key Management Personnel is allocated equally over the period from grant date to vesting date, and the amount is included in the remuneration tables in section 9.2. Fair values at grant date are independently determined using a Binomial pricing model that takes into account the exercise price, the term, the vesting and expected life, the non-tradeable nature, the share price at grant date and expected price volatility of the underlying share, the expected dividend yield and the risk-free interest rate.
Further details relating to remuneration and options in Clough Limited is set out below:
Name
A Value of options granted
during the year
$
B Intrinsic value of options
exercised during the year
$
C Intrinsic value of options
lapsed during the year
$
KT Gallagher 414,216 - -
NE Siford 146,590 12,000 -
MCG Bergomi 123,939 - -
GN Bowtell 119,931 - -
RW Robinson 146,590 - -
* On 19 April 2013, NE Siford exercised 20,000 options for a consideration of $11,400. The fair value of 20,000 Clough Limited ordinary shares on 19 April 2013 was $23,400.
A The fair value of the options is determined at the grant date in accordance with AASB 2 Share-based Payment.
B The fair value is determined at the date of exercise and reflects the intrinsic value of the options.
C The fair value is determined at the date of lapse and reflects the intrinsic value of the options.
9 reMunerAtion report - AuDiteD (continueD)
30 June 2013
For
per
sona
l use
onl
y

Clough annual report 201350
9.5 share-based compensation (continued)
Incentive and share-based compensation benefits – Directors and Other Key Management Personnel (continued)
Further details relating to performance rights in Clough Limited is set out below:
Name A Value of performance
rights granted during the year
$
B Intrinsic value of performance
rights exercised during the year
$
C Intrinsic value of performance
rights lapsed during the year
$
NE Siford 222,295 - -
RW Robinson 353,200 - -
A The fair value of the performance rights is determined at the grant date in accordance with AASB 2 Share-based Payment.
B The fair value is determined at the date of exercise and reflects the intrinsic value of the performance rights.
C The fair value is determined at the date of lapse and reflects the intrinsic value of the performance rights.
10 sHAre options AnD perForMAnce riGHtsUnissued ordinary shares of Clough Limited under option / performance right at the date of this report are as follows:
Grant date Vesting dateNumber of Options /
Performance Rights ^ Exercise price Date exercisable
26 November 2007 Vested 200,000 $0.75 26/11/10 – 26/11/13
1 February 2008 Vested 330,000 $0.86 01/02/11 – 01/02/14
5 March 2008 Vested 800,000 $0.86 05/03/11 – 05/03/14
1 February 2009 Vested 330,000 $0.34 01/02/12 – 01/02/15
11 February 2009 Vested 1,152,954 $0.34 11/02/12 – 11/02/15
16 March 2010 Vested 340,000 $0.90 16/03/13 – 16/03/16
16 March 2010 (i) 16 March 2014 2,039,748 $0.82 16/03/14 – 16/03/17
24 February 2011 (ii) 23 February 2015 ~ 2,791,263 $0.89 23/02/15 – 23/02/18
24 February 2012 (iii) 24 February 2016 ~ 4,217,662 $0.68 24/02/16 – 24/02/19
1 March 2012 (iv) 1 March 2015 ^ 1,284,717 $nil 01/03/15
15 August 2012 (iv) 15 August 2014 ^ 189,394 $nil 15/08/14
15 August 2012 (iv) 15 August 2015 ^ 189,394 $nil 15/08/15
15 August 2012 (iv) 15 August 2016 ^ 189,394 $nil 15/08/16
23 October 2012 (iv) * 1 March 2015 ^ 305,885 $nil 01/03/15
8 March 2013 (v) 8 March 2016 4,296,720 $1.055 08/03/16 – 08/03/19
^ Represents performance rights.
* Comprises 305,885 performance rights issued to NE Siford in the current year which were approved by shareholders at the Company’s Annual General Meeting held on 23 October 2012. These performance rights were issued on the same terms as the performance rights granted on 1 March 2012.
~ A total of 129,645 options granted on 24 February 2011 and 152,143 options granted on 24 February 2012 have a revised vesting date of 29 June 2013 as approved by the Remuneration and HR Committee during the year. These options vested on 29 June 2013 and were exercised on 15 July 2013.
(i) The options will vest if the share price at the vesting date (adjusted for any dividends paid between grant date and vesting date) is equal to or above $1.29.
(ii) The options will vest if the share price at the vesting date (adjusted for any dividends paid between grant date and vesting date) is equal to or above $1.39.
(iii) The options will vest if the share price at the vesting date (adjusted for any dividends paid between grant date and vesting date) is equal to or above $1.07.
(iv) The performance rights have no performance criteria that must be met before they vest. However, the employees must remain employed by the Company until vesting date to take ownership of the rights.
9 reMunerAtion report - AuDiteD (continueD)
Directors’ report
30 June 2013
For
per
sona
l use
onl
y

51EnginEErEd for productivity
(v) 25% will vest if Clough’s Total Shareholder Return (TSR) is equal to the return of the ASX 200 accumulation index over the period between the grant date and vesting date, 25% will vest on a straight line basis if Clough’s TSR is between 100% and 125%, 12.5% will vest if Clough’s annualised basic earnings per share (EPS) for the year ended 31 December 2015 is a minimum of 11.1 cents, 25% will vest if Clough’s basic EPS is a minimum of 12.8 cents on a sliding scale between 11.1 cents and 12.8 cents and 12.5% will vest if Clough’s basic EPS is a minimum of 14.6 cents on a sliding scale between 12.8 cents and 14.6 cents.
For additional information, refer to note 38 “Share-based payments” to the financial statements.
11 rounDinG oF AMountsClough Limited is a company of the kind referred to in Class Order 98/100, issued by the Australian Securities and Investments Commission, relating to the “rounding off” of amounts in the Directors’ Report and Financial Report. All amounts have been rounded off to the nearest thousand dollars, unless otherwise stated.
12 Directors’ interestsInterests of Directors of Clough Limited in the ordinary shares, options and performance rights of the Company at the date of this report are:
Director Ordinary Shares Options Performance Rights
HJ Laas and AJ Bester through Murray & Roberts Limited ^ 478,957,478 - -
KT Gallagher # 1,136,394 1,394,220 -
NE Siford 20,000 902,932 305,885
ER Stein 74,900 - -
^ HJ Laas and AJ Bester are directors of Murray & Roberts Holdings Limited whose related entities hold ordinary shares in Clough Limited through Murray & Roberts Limited.
# These shares were issued to KT Gallagher as part of his sign-on arrangements. The issue of the shares was approved by shareholders at the Company’s Annual General Meeting held on 18 October 2011. The shares were originally unlisted and quotation was sought and obtained on 3 November 2012.
13 inDeMniFicAtion AnD insurAnce oF oFFicers AnD AuDitorsThe Company has entered into agreements to indemnify all Directors of the Company named in section 1 of this report and current and former executive officers of the Company and its controlled entities against all liabilities to persons (other than the Company or a related body corporate) which arise out of the performance of their normal duties as Director or executive officer unless the liability relates to conduct involving a lack of good faith.
The Company has agreed to indemnify the Directors and executive officers against all costs and expenses incurred in defending an action that falls within the scope of the indemnity and any resulting payments.
During the financial year the Company paid insurance premiums in respect of Directors’ and Officers’ Liability insurance. The policy does not specify the premium for individual Directors and executive officers. Disclosure of the premium paid is subject to confidentiality requirements under the contract of insurance.
The Company has not otherwise, during or since the end of the financial year, except to the extent permitted by law, indemnified or agreed to indemnify an officer or auditor of the Company or of any related body corporate against a liability incurred by such an officer or auditor.
14 AuDitor inDepenDence AnD non-AuDit serVicesA copy of the auditors’ independence declaration required under section 307C of the Corporations Act 2001 is set out on page 53.
Non-audit services
The Company may decide to employ the auditor on assignments additional to their statutory audit duties where the auditor has relevant expertise and where the auditor’s independence is not compromised.
Details of the amounts paid or payable to the auditor Deloitte Touche Tohmatsu Australian firm and related entities for audit and non-audit services provided during the year are set out below.
10 sHAre options AnD perForMAnce riGHts (continueD)
30 June 2013
For
per
sona
l use
onl
y

CLOUGH ANNUAL REPORT 201352
The Board of Directors has considered the position and, in accordance with advice received from the Audit & Risk Committee, is satisfi ed that the provision of the non-audit services is compatible with the general standard of independence for auditors imposed by the Corporations Act 2001. The Directors are satisfi ed that the provision of non-audit services by the auditor, as set out below, did not compromise the auditor independence requirements of the Corporations Act 2001 for the following reasons:
• allnon-auditserviceshavebeenreviewedbytheAudit&RiskCommitteetoensuretheydonotimpacttheimpartialityandobjectivity of the auditor; and
• noneoftheservicesunderminethegeneralprinciplesrelatingtoauditorindependenceassetoutinAPES110CodeofEthicsforProfessional Accountants.
During the year the following fees were paid or payable for audit and non-audit services provided by the auditor of the Company, its related practices and non-related audit fi rms:
Deloitte Touche Tohmatsu Australian fi rm
2013
$
2012
$
Audit and other assurance services
Audit and review of fi nancial statements 477,757 609,935
Other services
Taxation services 7,725 350
Total remuneration 485,482 610,285
Related practices of Deloitte Touche Tohmatsu Australian fi rm
Audit and other assurance services
Audit and review of fi nancial statements 77,972 57,290
Other services
Other services 1,638 5,273
Total remuneration 79,610 62,563
Non-Deloitte Touche Tohmatsu audit fi rms
Audit and other assurance services
Audit and review of fi nancial statements 25,772 5,130
Other services
Taxation services 3,089 1,945
Total remuneration 28,861 7,075
Total auditors’ remuneration 593,953 679,923
This report is made in accordance with a resolution of the Directors.
PERTH
20 August 2013
Kevin Thomas Gallagher Keith SpenceManaging Director Chairman Kevin Thomas Gallagher Keith SpenceManaging Director Chairman
14 AuDitor inDepenDence AnD non-AuDit serVices (continueD)
Directors’ report
30 June 2013
For
per
sona
l use
onl
y

53ENGINEERED FOR PRODUCTIVITY
The Board of Directors Clough Limited 58 Mounts Bay Road Perth WA 6000
20 August 2013
Dear Board Members
Auditor’s Independence Declaration to Clough Limited
In accordance with section 307C of the Corporations Act 2001, I am pleased to provide the following declaration of independence to the directors of Clough Limited.
As lead audit partner for the audit of the consolidated financial statements of Clough Limited for the year ended 30 June 2013, I declare that to the best of my knowledge and belief, there have been no contraventions of:
(i) the auditor independence requirements of the Corporations Act 2001 in relation to the audit; and
(ii) any applicable code of professional conduct in relation to the audit.
Yours sincerely
Deloitte Touche Tohmatsu
Ross Jerrard Partner Chartered Accountants
Deloitte Touche Tohmatsu A.C.N. 74 490 121 060
Woodside Plaza Level 14 240 St Georges Terrace Perth WA 6000
GPO Box A46 Perth WA 6837 Australia
DX 206 Tel: +61 (0) 8 9365 7000 Fax: +61 (0) 8 9365 7001 www.deloitte.com.au
Liability limited by a scheme approved under Professional Standards Legislation.Member of Deloitte Touche Tohmatsu Limited
AuDitor’s inDepenDence DecLArAtion
For
per
sona
l use
onl
y

CLOUGH ANNUAL REPORT 201354
Notes
2013
$’000
2012
$’000
Revenue from continuing operations 4 624,729 431,442
Other income 5 1,443 1,039
Labour costs (409,783) (288,145)
Materials, plant and subcontractor costs (145,425) (94,688)
Other expenses (55,963) (62,025)
Finance costs (107) (392)
Share of net profit of jointly controlled entities accounted for using the equity method 33 83,056 52,798
Profit before income tax 6 97,950 40,029
Income tax expense 7 (24,040) (4,936)
Profit from continuing operations 73,910 35,093
Profit from discontinued operations 8 53,504 8,129
Profit for the year 127,414 43,222
Profit for the year is attributable to:
Owners of Clough Limited 127,414 42,898
Non-controlling interests - 324
127,414 43,222
Cents Cents
Earnings per share for profit from continuing operations attributable to the ordinary equity holders of the Company:
Basic earnings per share 37 9.52 4.55
Diluted earnings per share 37 9.48 4.53
Earnings per share for profit attributable to the ordinary equity holders of the Company:
Basic earnings per share 37 16.42 5.56
Diluted earnings per share 37 16.34 5.54
The above consolidated income statement should be read in conjunction with the accompanying notes.
consoliDateD incoMe stateMentFor the year ended 30 June 2013
For
per
sona
l use
onl
y

Clough annual report 2013 55ENGINEERED FOR PRODUCTIVITY
2013
$’000
2012
$’000
Profit for the year 127,414 43,222
Other comprehensive income
Items that may be reclassified to profit or loss
Changes in the fair value of cash flow hedges 2,062 3,320
Exchange differences on translation of foreign operations 1,488 7,432
Income tax relating to these items (619) (996)
Other comprehensive income for the year, net of tax 2,931 9,756
Total comprehensive income for the year 130,345 52,978
Total comprehensive income for the year is attributable to:
Owners of Clough Limited 130,345 52,654
Non-controlling interests - 324
130,345 52,978
Total comprehensive income for the year attributable to owners of Clough Limited arises from:
Continuing operations 76,841 37,231
Discontinued operations 53,504 15,423
130,345 52,654
The above consolidated statement of comprehensive income should be read in conjunction with the accompanying notes.
consoliDateD stateMent of coMprehensive incoMeFor the year ended 30 June 2013
For
per
sona
l use
onl
y
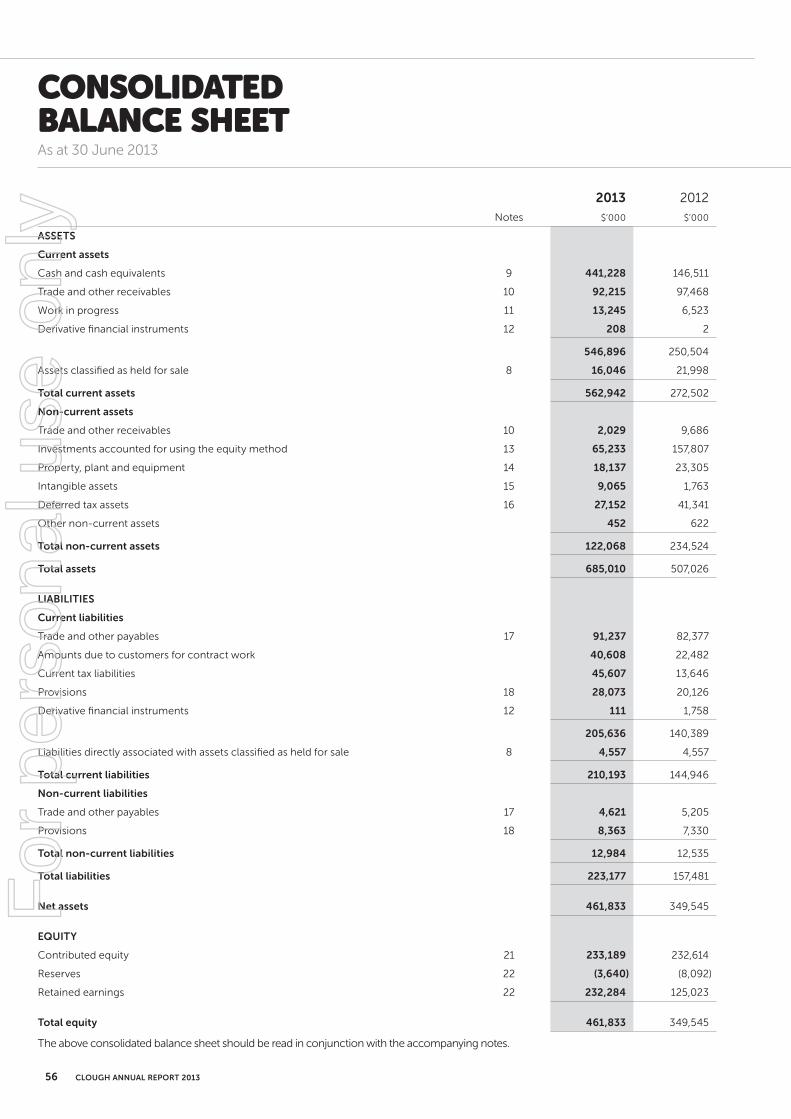
CLOUGH ANNUAL REPORT 201356
Notes
2013
$’000
2012
$’000
ASSETS
Current assets
Cash and cash equivalents 9 441,228 146,511
Trade and other receivables 10 92,215 97,468
Work in progress 11 13,245 6,523
Derivative financial instruments 12 208 2
546,896 250,504
Assets classified as held for sale 8 16,046 21,998
Total current assets 562,942 272,502
Non-current assets
Trade and other receivables 10 2,029 9,686
Investments accounted for using the equity method 13 65,233 157,807
Property, plant and equipment 14 18,137 23,305
Intangible assets 15 9,065 1,763
Deferred tax assets 16 27,152 41,341
Other non-current assets 452 622
Total non-current assets 122,068 234,524
Total assets 685,010 507,026
LIABILITIES
Current liabilities
Trade and other payables 17 91,237 82,377
Amounts due to customers for contract work 40,608 22,482
Current tax liabilities 45,607 13,646
Provisions 18 28,073 20,126
Derivative financial instruments 12 111 1,758
205,636 140,389
Liabilities directly associated with assets classified as held for sale 8 4,557 4,557
Total current liabilities 210,193 144,946
Non-current liabilities
Trade and other payables 17 4,621 5,205
Provisions 18 8,363 7,330
Total non-current liabilities 12,984 12,535
Total liabilities 223,177 157,481
Net assets 461,833 349,545
EQUITY
Contributed equity 21 233,189 232,614
Reserves 22 (3,640) (8,092)
Retained earnings 22 232,284 125,023
Total equity 461,833 349,545
The above consolidated balance sheet should be read in conjunction with the accompanying notes.
consoliDateD balance sheetAs at 30 June 2013
For
per
sona
l use
onl
y

Clough annual report 2013 57ENGINEERED FOR PRODUCTIVITY
Notes
2013
$’000
2012
$’000
Cash flows from operating activities
Receipts from customers (inclusive of goods and services tax) 677,122 476,008
Payments to suppliers and employees (inclusive of goods and services tax) (615,604) (490,851)
61,518 (14,843)
Dividends and distributions received from equity accounted entities 90,089 28,899
Income taxes paid (7,277) (2,886)
Net cash inflow from operating activities 35 144,330 11,170
Cash flows from investing activities
Payments for acquisition of subsidiary, net of cash acquired 30 (8,188) -
Payments for property, plant and equipment (including software) (3,387) (8,336)
Payments for investments in equity accounted entities - (18,200)
Repayment of contributions by/(contributions to) equity accounted entities 1,440 (5,912)
Net loans and advances (to)/from equity accounted entities (18,565) 43,281
Proceeds from sale of property, plant and equipment 232 3,767
Proceeds from disposal of assets classified as held for sale 6,407 524
Interest received 6,758 3,056
Proceeds from sale of equity accounted investment in Forge Group Limited, net of sale costs 8 183,990 -
Proceeds from sale of the Marine Construction business, net of cash disposed 8 - 87,830
Net cash inflow from investing activities 168,687 106,010
Cash flows from financing activities
Proceeds from issues of shares 353 -
Proceeds from conversion of options 1,376 2,660
Payments for shares bought back 21 (1,507) (738)
Proceeds from borrowings - 5,949
Repayment of borrowings - (50,175)
Dividends paid to Clough Limited’s shareholders 23 (20,153) (16,936)
Interest paid - (2,057)
Net cash outflow from financing activities (19,931) (61,297)
Net increase in cash and cash equivalents 293,086 55,883
Cash and cash equivalents at the beginning of the financial year 146,511 90,450
Effects of exchange rate changes on cash and cash equivalents 1,631 178
Cash and cash equivalents at end of year 9 441,228 146,511
Non-cash investing and financing activities 36
The above consolidated statement of cash flows should be read in conjunction with the accompanying notes.
consoliDateD stateMent of cash flowsFor the year ended 30 June 2013
For
per
sona
l use
onl
y

CLOUGH ANNUAL REPORT 201358
Attributable to owners of Clough Limited
Notes
Contributed equity
$’000
Reserves
$’000
Retained earnings
$’000
Total
$’000
Non- controlling
interests
$’000
Total equity
$’000
Balance at 1 July 2011 229,792 (18,570) 99,061 310,283 318 310,601
Profit for the year - - 42,898 42,898 324 43,222
Other comprehensive income - 9,756 - 9,756 - 9,756
Total comprehensive income for the year - 9,756 42,898 52,654 324 52,978
Transactions with owners in their capacity as owners:
Contributions of equity 21 3,560 - - 3,560 - 3,560
Share buy-back 21 (738) - - (738) - (738)
Employee share options and performance rights 22 - 722 - 722 - 722
Non-controlling interests removed on disposal of a subsidiary 31 - - - - (642) (642)
Dividends paid 23 - - (16,936) (16,936) - (16,936)
2,822 722 (16,936) (13,392) (642) (14,034)
Balance at 30 June 2012 232,614 (8,092) 125,023 349,545 - 349,545
Balance at 1 July 2012 232,614 (8,092) 125,023 349,545 - 349,545
Profit for the year - - 127,414 127,414 - 127,414
Other comprehensive income - 2,931 - 2,931 - 2,931
Total comprehensive income for the year - 2,931 127,414 130,345 - 130,345
Transactions with owners in their capacity as owners:
Contributions of equity 21 2,082 - - 2,082 - 2,082
Share buy-back 21 (1,507) - - (1,507) - (1,507)
Employee share options and performance rights 22 - 1,521 - 1,521 - 1,521
Dividends paid 23 - - (20,153) (20,153) - (20,153)
575 1,521 (20,153) (18,057) - (18,057)
Balance at 30 June 2013 233,189 (3,640) 232,284 461,833 - 461,833
The above consolidated statement of changes in equity should be read in conjunction with the accompanying notes.
consoliDateD stateMent ofchanges in equityFor the year ended 30 June 2013
For
per
sona
l use
onl
y

Clough annual report 2013 59ENGINEERED FOR PRODUCTIVITY
1 suMMArY oF siGniFicAnt AccountinG poLiciesThe principal accounting policies adopted in the preparation of these consolidated financial statements are set out below. These policies have been consistently applied to all the years presented, unless otherwise stated. The financial statements are for the consolidated entity consisting of Clough Limited (the Company or Parent Entity) and its subsidiaries, together referred to as the Group or Consolidated Entity.
(a) Basis of preparation
These general purpose financial statements have been prepared in accordance with Australian Accounting Standards and Interpretations issued by the Australian Accounting Standards Board (AASB) and the Corporations Act 2001. Clough Limited is a for-profit entity for the purpose of preparing the financial statements.
The Company is of a kind referred to in Class Order 98/100, issued by the Australian Securities and Investments Commission, relating to the ‘’rounding off’’ of amounts in the financial statements. Amounts in the financial statements have been rounded off in accordance with that Class Order to the nearest thousand dollars, or in certain cases, the nearest dollar.
(i) Compliance with IFRS
The consolidated financial statements of the Clough Limited Group also comply with International Financial Reporting Standards (IFRS) as issued by the International Accounting Standards Board (IASB).
(ii) New and amended standards adopted by the Group
None of the new standards and amendments to standards that are mandatory for the first time for the financial year beginning 1 July 2012 affected any of the amounts recognised in the current period or any prior period and are not likely to affect future periods. However, amendments made to AASB 101 Presentation of Financial Statements effective 1 July 2012 now require the statement of comprehensive income to show the items of comprehensive income grouped into those that are not permitted to be reclassified to profit or loss in a future period and those that may have to be reclassified if certain conditions are met.
(iii) Early adoption of standards
The Group has not elected to apply any pronouncements before their operative date in the annual reporting period beginning 1 July 2012.
(iv) Historical cost convention
These financial statements have been prepared under the historical cost convention, as modified by the revaluation of financial assets and liabilities (including derivative instruments) at fair value through profit or loss.
(v) Critical accounting estimates
The preparation of financial statements requires the use of certain critical accounting estimates. It also requires management to exercise its judgement in the process of applying the Group’s accounting policies. The areas involving a higher degree of judgement or complexity, or areas where assumptions and estimates are significant to the financial statements, are disclosed in note 2.
(vi) Comparative information
Comparative amounts have been reclassified where necessary so they are consistent with amounts reported in the current period.
(b) Principles of consolidation
(i) Subsidiaries
The consolidated financial statements incorporate the financial statements of the Company and entities controlled by the Company. Control is achieved when the Company has the power to govern the financial and operating policies of an entity so as to obtain benefits from its activities.
Subsidiaries are included in the consolidated financial report from the date on which control commences and up to the effective date of disposal, as appropriate. They are de-consolidated from the date that control ceases.
The acquisition method of accounting is used to account for the acquisition of subsidiaries by the Company.
Intercompany transactions, balances and unrealised profits and losses on transactions between Group companies are eliminated in full. The financial statements of subsidiaries are prepared for the same reporting period as the Company using consistent accounting policies.
Non-controlling interests in the results and equity of subsidiaries are shown separately in the consolidated income statement, statement of comprehensive income, statement of changes in equity and balance sheet respectively.
notes to the consoliDateDfinancial stateMents30 June 2013
For
per
sona
l use
onl
y

CLOUGH ANNUAL REPORT 201360
(b) Principles of consolidation (continued)
(ii) Associates
Associates are entities over which the Group has significant influence but not control or joint control, generally accompanying a shareholding of between 20% and 50% of voting rights. Investments in associates are accounted for using the equity method of accounting. Details of associates are included in note 32.
Under this method the Group’s share of its associates’ post acquisition profits or losses is recognised in profit or loss, and its share of post acquisition movements in other comprehensive income is recognised in other comprehensive income. The cumulative post acquisition movements are adjusted against the carrying amount of the investment. Dividends receivable from associates are recognised as reduction in the carrying amount of the investment.
(iii) Joint ventures
Jointly controlled entities
Interests in jointly controlled entities are accounted for using the equity method after initially being recognised at cost. Under the equity method, the share of the profits or losses of the jointly controlled entities is recognised in profit or loss, and the share of post acquisition movements in reserves is recognised in other comprehensive income. Details of the jointly controlled entities are set out in note 33.
Profits or losses on transactions establishing a jointly controlled entity and transactions with a jointly controlled entity are eliminated to the extent of the Group’s ownership interest until such time as they are realised by the jointly controlled entity on consumption or sale. However, a loss on the transaction is recognised immediately if the loss provides evidence of a reduction in the net realisable value of current assets, or an impairment loss.
(c) Foreign currency translation
(i) Functional and presentation currency
Items included in the financial statements of each of the Group’s entities are measured using the currency of the primary economic environment in which the entity operates (‘the functional currency’). The consolidated financial statements are presented in Australian dollars, which is Clough Limited’s functional and presentation currency.
(ii) Transactions and balances
Foreign currency transactions are translated into the functional currency using the exchange rates prevailing at the dates of the transactions. Foreign exchange gains and losses resulting from the settlement of such transactions and from the year end translation of monetary assets and liabilities denominated in foreign currencies are recognised in profit or loss, except when they are deferred in other comprehensive income as qualifying cash flow hedges and qualifying net investment hedges or are attributable to part of the net investment in a foreign operation.
(iii) Foreign operations
The results and financial position of foreign operations that have a functional currency different from the presentation currency are translated into the presentation currency as follows:
• assetsandliabilitiesforeachbalancesheetpresentedaretranslatedattheclosingrateatthedateofthatbalancesheet
• incomeandexpensesforeachconsolidatedincomestatementandconsolidatedstatementofcomprehensiveincomearetranslated at average exchange rates (unless this is not a reasonable approximation of the cumulative effect of the rates prevailing on the transaction dates, in which case income and expenses are translated at the dates of the transactions), and
• allresultingexchangedifferencesarerecognisedinothercomprehensiveincome.
On consolidation, exchange differences arising from the translation of any net investment in foreign entities, and of borrowings and other financial instruments designated as hedges of such investments, are recognised in other comprehensive income. When a foreign operation is sold or any borrowings forming part of the net investment are repaid, the associated exchange differences are reclassified to profit or loss, as part of the gain or loss on sale.
Goodwill and fair value adjustments arising on the acquisition of a foreign operation are treated as assets and liabilities of the foreign operation and translated at the closing rate.
(d) Revenue recognition
Revenue is measured at the fair value of the gross consideration received or receivable.
The Group recognises revenue when the amount of revenue can be reliably measured, it is probable that future economic benefits will flow to the entity and specific criteria have been met for each of the Group’s activities as described below. The Group bases its estimates on historical results, taking into consideration the type of customer, the type of transaction and the specifics of each arrangement.
Revenue is recognised for the major business activities as follows:
1 suMMArY oF siGniFicAnt AccountinG poLicies (continueD)
notes to tHe consoLiDAteD FinAnciAL stAteMents
30 June 2013
For
per
sona
l use
onl
y

61ENGINEERED FOR PRODUCTIVITY
(d) Revenue recognition (continued)
(i) Construction contracting
Contract revenue and expenses are recognised in accordance with the percentage of completion method unless the outcome of the contract cannot be reliably estimated. Where it is probable that a loss will arise from a construction contract, the excess of total costs over revenue is recognised as an expense.
Where the outcome of a contract cannot be reliably estimated, contract costs are recognised as an expense as incurred, and where it is probable that the costs will be recovered, revenue is recognised to the extent of costs incurred.
The Directors do not consider it appropriate to recognise profits earned during the establishment and initial stages of a contract and accordingly recognition of profit is deferred during that period. For such contracts, the difference between the progress claims rendered (less contract retentions held by the client in cash or bonds) and direct costs (including an appropriate proportion of fixed and variable overheads) is carried forward as either construction work in progress (amounts due from customers for contract work) or amounts due to customers for contract work. Where a contract has progressed beyond the early stages, contract revenue and expenses are recognised on a percentage completion basis as noted above.
For fixed price contracts the stage of completion is measured by reference to contract costs for work performed to date as a percentage of estimated total contract costs for each contract. Revenue from cost plus contracts is recognised by reference to the recoverable costs incurred during the reporting period plus the percentage of fees earned. Percentage of fees earned is measured by the proportion of total costs incurred compared to the estimated total costs of the contract.
(ii) Land development and resale
Land is not sold until the development work is completed, and revenue is recognised when risks and rewards of ownership have passed to the buyer.
(iii) Interest income
Interest income is recognised when it is probable that the economic benefits will flow to the Group and the amount of revenue can be measured reliably. Interest income is accrued using the effective interest rate method.
(iv) Dividends
Dividends from investments are recognised as revenue when the Group’s right to receive payment is established. However, the investment may need to be tested for impairment as a consequence, refer note 1(h).
(e) Income tax
The income tax expense or revenue for the period is the tax payable on the current period’s taxable income based on the applicable income tax rate for each jurisdiction adjusted by changes in deferred tax assets and liabilities attributable to temporary differences and to unused tax losses.
The current income tax charge is calculated on the basis of the tax laws enacted or substantively enacted at the end of the reporting period in the countries where the Company’s subsidiaries, associates and jointly controlled entities operate and generate taxable income. Management periodically evaluates positions taken in tax returns with respect to situations in which applicable tax regulation is subject to interpretation. It establishes provisions where appropriate on the basis of amounts expected to be paid to the tax authorities.
Deferred income tax is provided in full, using the liability method, on temporary differences arising between the tax bases of assets and liabilities and their carrying amounts in the consolidated financial statements. However, deferred tax liabilities are not recognised if they arise from the initial recognition of goodwill. Deferred income tax is also not accounted for if it arises from initial recognition of an asset or liability in a transaction other than a business combination that at the time of the transaction affects neither accounting nor taxable profit or loss. Deferred income tax is determined using tax rates (and laws) that have been enacted or substantially enacted by the end of the reporting period and are expected to apply when the related deferred income tax asset is realised or the deferred income tax liability is settled.
Deferred tax assets are recognised for deductible temporary differences and unused tax losses only if it is probable that future taxable amounts will be available to utilise those temporary differences and losses.
Deferred tax liabilities and assets are not recognised for temporary differences between the carrying amount and tax bases of investments in foreign operations where the company is able to control the timing of the reversal of the temporary differences and it is probable that the differences will not reverse in the foreseeable future.
Deferred tax assets and liabilities are offset when there is a legally enforceable right to offset current tax assets and liabilities and when the deferred tax balances relate to the same taxation authority. Current tax assets and tax liabilities are offset where the entity has a legally enforceable right to offset and intends either to settle on a net basis, or to realise the asset and settle the liability simultaneously.
Clough Limited and its wholly-owned Australian controlled entities have implemented the tax consolidation legislation. As a consequence, these entities are taxed as a single entity and the deferred tax assets and liabilities of these entities are set off in the consolidated financial statements.
Current and deferred tax is recognised in profit or loss, except to the extent that it relates to items recognised in other comprehensive income or directly in equity. In this case, the tax is also recognised in other comprehensive income or directly in equity, respectively.
1 suMMArY oF siGniFicAnt AccountinG poLicies (continueD)
30 June 2013
For
per
sona
l use
onl
y

CLOUGH ANNUAL REPORT 201362
(f) Leases
Leases of property, plant and equipment where the Group, as lessee, has substantially all the risks and rewards of ownership are classified as finance leases. Finance leases are capitalised at the lease’s inception at the fair value of the leased property or, if lower, the present value of the minimum lease payments. The corresponding rental obligations, net of finance charges, are included in other short term and long term payables. Each lease payment is allocated between the liability and finance cost. The finance cost is charged to the profit or loss over the lease period so as to produce a constant periodic rate of interest on the remaining balance of the liability for each period.
Leases in which a significant portion of the risks and rewards of ownership are not transferred to the Group as lessee are classified as operating leases. Payments made under operating leases (net of any incentives received from the lessor) are charged to profit or loss on a straight line basis over the period of the lease.
(g) Business combinations
Business combinations are accounted for using the acquisition method of accounting. Cost is measured as the fair value of the assets given, shares issued or liabilities incurred or assumed at the date of exchange. Acquisition costs are expensed as incurred.
Identifiable assets acquired and liabilities assumed in a business combination are measured initially at their fair values at the acquisition date, irrespective of the extent of any non-controlling interest. The excess of the cost of acquisition over the fair value of the Group’s share of the identifiable net assets acquired is recorded as goodwill. If those amounts are less than the fair value of the net identifiable assets of the subsidiary acquired and the measurement of all amounts has been reviewed, the difference is recognised directly in profit or loss as a bargain purchase.
Any contingent consideration to be transferred by the acquirer is recognised at fair value at the acquisition date.
(h) Impairment of assets
Goodwill and intangible assets that have an indefinite useful life are not subject to amortisation and are tested annually for impairment, or more frequently if events or changes in circumstances indicate that they might be impaired. Other assets are tested for impairment whenever events or changes in circumstances indicate that the carrying amount may not be recoverable. An impairment loss is recognised for the amount by which the asset’s carrying amount exceeds its recoverable amount. The recoverable amount is the higher of an asset’s fair value less costs to sell and value-in-use. For the purposes of assessing impairment, assets are grouped at the lowest levels for which there are separately identifiable cash inflows which are largely independent of the cash inflows from other assets or groups of assets (cash-generating units). Non-financial assets other than goodwill that suffered an impairment are reviewed for possible reversal of the impairment at the end of each reporting period.
(i) Cash and cash equivalents
Cash and cash equivalents includes cash on hand, deposits held at call with financial institutions, other short-term, highly liquid investments with original maturities of three months or less that are readily convertible to known amounts of cash and which are subject to an insignificant risk of changes in value, and bank overdrafts. Bank overdrafts, if applicable, are shown within borrowings in current liabilities in the consolidated balance sheet.
(j) Trade receivables
Trade receivables are recognised initially at fair value and subsequently measured at amortised cost, using the effective interest method, less provision for impairment.
Collectability of trade receivables is reviewed on a monthly basis. Debts which are known to be uncollectible are written off by reducing the carrying amount directly. An impairment allowance is used when there is objective evidence that the Group will not be able to collect all amounts due according to the original terms of the receivables. Significant financial difficulties of the debtor, probability that the debtor will enter bankruptcy or financial re-organisation and default or delinquency in payments are considered indicators that the trade receivable may not be collected. The amount of the impairment allowance is the difference between the asset’s carrying amount and the present value of estimated future cash flows, discounted at the original effective interest rate. Cash flows relating to short term receivables are not discounted if the effect of discounting is immaterial.
The amount of the impairment loss is recognised in profit or loss within other expenses. When a trade receivable for which an impairment allowance had been recognised becomes uncollectible in a subsequent period, it is written off against the allowance account. Subsequent recoveries of amounts previously written off are credited against other expenses in profit or loss.
1 suMMArY oF siGniFicAnt AccountinG poLicies (continueD)
notes to tHe consoLiDAteD FinAnciAL stAteMents
30 June 2013
For
per
sona
l use
onl
y
63ENGINEERED FOR PRODUCTIVITY
(k) Work in progress and property developments
(i) Work in progress
Construction work in progress is stated at the aggregate of contract costs incurred to date plus recognised profits less recognised losses and progress billings, and the net amounts are presented in assets as amounts due from customers for contract work. If there are contracts where progress billings exceed the aggregate costs incurred plus profits less losses, the net amounts are presented in liabilities as amounts due to customers for contract work.
Contract costs include all costs directly related to specific contracts, costs that are specifically chargeable to the customer under the terms of the contract and an allocation of overhead expenses incurred in connection with the Group’s construction activities in general.
(ii) Property developments
Property developments are stated at the lower of cost and net realisable value. Cost is assigned by specific identification and includes the cost of acquisition, and development and borrowing costs during development. When development is completed borrowing costs and other holding charges are expensed as incurred.
(l) Non-current assets (or disposal groups) held for sale and discontinued operations
Non-current assets (or disposal groups) are classified as held for sale and stated at the lower of their carrying amount and fair value less costs to sell if their carrying amount will be recovered principally through a sale transaction rather than through continuing use and a sale is considered highly probable.
An impairment loss is recognised for any initial or subsequent write down of the asset (or disposal group) to fair value less costs to sell. A gain is recognised for any subsequent increases in fair value less costs to sell of an asset (or disposal group), but not in excess of any cumulative impairment loss previously recognised. A gain or loss not previously recognised by the date of the sale of the asset (or disposal group) is recognised at the date of derecognition.
A discontinued operation is a component of the entity that has been disposed of or is classified as held for sale and that represents a separate major line of business or geographical area of operation, is part of a single co-ordinated plan to dispose of such a line of business or area of operations, or is a subsidiary acquired exclusively with a view to resale. The results of discontinued operations are presented separately on the face of the income statement and the assets and liabilities are presented separately on the face of the balance sheet.
(m) Financial assets
Classification
The Group classifies its financial assets in the following categories: financial assets at fair value through profit or loss and loans and receivables. The classification depends on the purpose for which the investments were acquired. Management determines the classification of its investments at initial recognition.
(i) Financial assets at fair value through profit or loss
This category comprises only derivative financial instruments. They are carried in the balance sheet at fair value with changes in fair value recognised through profit and loss.
(ii) Loans and receivables
Loans and receivables are non-derivative financial assets with fixed or determinable payments that are not quoted in an active market. They are included in current assets, except for those with maturities greater than 12 months after the reporting period which are classified as non-current assets.
(n) Derivatives and hedging activities
Derivatives are initially recognised at fair value on the date a derivative contract is entered into and are subsequently remeasured to their fair value at the end of each reporting period. The accounting for subsequent changes in fair value depends on whether the derivative is designated as a hedging instrument, and if so, the nature of the item being hedged. The Group designates certain derivatives as either; (1) hedges of the fair value of recognised assets or liabilities or a firm commitment (fair value hedges); or (2) hedges of the cash flows of recognised assets and liabilities and highly probable forecast transactions (cash flow hedges).
Where the Group determines that it wants to establish a hedge relationship, the Group documents at the inception of the hedging transaction, the relationship between hedging instruments and hedged items, as well as its risk management objective and strategy for undertaking various hedge transactions. The Group also documents its assessment, both at hedge inception and on an ongoing basis, of whether the derivatives that are used in hedging transactions have been and will continue to be highly effective in offsetting changes in fair values or cash flows of hedged items.
1 suMMArY oF siGniFicAnt AccountinG poLicies (continueD)
30 June 2013
For
per
sona
l use
onl
y

CLOUGH ANNUAL REPORT 201364
(n) Derivatives and hedging activities (continued)
The fair values of various derivative financial instruments used for hedging purposes are disclosed in note 12. Movements in the hedging reserve in shareholders’ equity are shown in note 22. The full fair value of a hedging derivative is classified as a non-current asset or liability when the remaining maturity of the hedged item is more than 12 months; it is classified as a current asset or liability when the remaining maturity of the hedged item is less than 12 months.
(i) Fair value hedge
Changes in the fair value of derivatives that are designated and qualify as fair value hedges are recorded in profit or loss, together with any changes in the fair value of the hedged asset or liability that are attributable to the hedged risk.
(ii) Cash flow hedge
The effective portion of changes in the fair value of derivatives that are designated and qualify as cash flow hedges is recognised in other comprehensive income and accumulated in reserves in equity. The gain or loss relating to the ineffective portion is recognised immediately in profit or loss within other income or other expense.
Amounts accumulated in equity are reclassified to profit or loss in the periods when the hedged item affects profit or loss (for instance when the forecast sale that is hedged takes place). The gain or loss relating to the effective portion of forward foreign exchange contracts hedging sales is recognised in profit or loss within ‘revenue’. However, when the forecast transaction that is hedged results in the recognition of a non-financial asset (for example, inventory or fixed assets) the gains and losses previously deferred in equity are reclassified from equity and included in the initial measurement of the cost of the asset. The deferred amounts are ultimately recognised in profit or loss as cost of goods sold in the case of inventory, or as depreciation or impairment in the case of fixed assets.
When a hedging instrument expires or is sold or terminated, or when a hedge no longer meets the criteria for hedge accounting, any cumulative gain or loss existing in equity at that time remains in equity and is recognised when the forecast transaction is ultimately recognised in profit or loss. When a forecast transaction is no longer expected to occur, the cumulative gain or loss that was reported in equity is immediately reclassified to profit or loss.
(iii) Derivatives that do not qualify for hedge accounting
Certain derivative instruments do not qualify for hedge accounting. Changes in the fair value of any derivative instrument that does not qualify for hedge accounting are recognised immediately in profit or loss and are included in other income or other expenses.
(o) Property, plant and equipment
Property, plant and equipment is stated at historical cost less accumulated depreciation. Historical cost includes expenditure that is directly attributable to the acquisition of the items and may include transfers from equity of any gains or losses on qualifying cash flow hedges of foreign currency purchases of property, plant and equipment.
Subsequent costs are included in the asset’s carrying amount or recognised as a separate asset, as appropriate, only when it is probable that future economic benefits associated with the item will flow to the Group and the cost of the item can be measured reliably. All other repairs and maintenance are charged to profit or loss during the financial period in which they are incurred.
All property, plant and equipment, other than freehold land, is depreciated or amortised at rates appropriate to the estimated useful life of the assets or in the case of leasehold improvements and certain leased plant and equipment, the shorter lease term. The expected useful lives are as follows:
- Land Not depreciated
- Buildings 5 - 20 years
- Leasehold improvements - owned 5 - 12 years
- Plant and equipment - owned 5 - 20 years
Buildings and leasehold improvements are depreciated using the straight line method. Plant and equipment - owned is depreciated using the reducing balance method and the straight line method.
Plant and equipment are depreciated to their estimated residual value. The assets’ residual values and useful lives are reviewed, and adjusted if appropriate, at the end of each reporting date.
An asset’s carrying amount is written down immediately to its recoverable amount if the asset’s carrying amount is greater than its estimated recoverable amount (note 1(h)).
Gains and losses on disposals are determined by comparing proceeds with carrying amount. These are included in profit or loss.
1 suMMArY oF siGniFicAnt AccountinG poLicies (continueD)
notes to tHe consoLiDAteD FinAnciAL stAteMents
30 June 2013
For
per
sona
l use
onl
y

65ENGINEERED FOR PRODUCTIVITY
(p) Intangible assets
(i) Goodwill
Goodwill is measured as described in note 1(h). Goodwill on acquisitions of subsidiaries is included in intangible assets. Goodwill is not amortised but it is tested for impairment annually, or more frequently if events or changes in circumstances indicate that it might be impaired, and is carried at cost less accumulated impairment losses. Gains and losses on the disposal of an entity include the carrying amount of goodwill relating to the entity sold.
Goodwill is allocated to cash-generating units for the purpose of impairment testing. The allocation is made to those cash-generating units or groups of cash-generating units that are expected to benefit from the business combination in which the goodwill arose, identified according to operating segments (note 3).
(ii) IT development and software
Costs incurred in developing products or systems and costs incurred in acquiring software and licenses that will contribute to future period financial benefits through revenue generation and/or cost reduction are capitalised to software and systems. Costs capitalised include external direct costs of materials and service and direct payroll and payroll related costs of employees’ time spent on the project. Amortisation is calculated on a straight-line basis over periods generally ranging from 4 to 5 years.
IT development costs include only those costs directly attributable to the development phase and are only recognised following completion of technical feasibility and where the Group has an intention and ability to use the asset.
(iii) Customer contracts
Customer contracts acquired as part of a business combination are recognised separately from goodwill. The customer contracts are carried at their fair value at the date of acquisition less accumulated amortisation and impairment losses. Amortisation is calculated based on the timing of projected cash flows of the contracts over their estimated useful lives, which currently are up to 3 years.
(q) Trade and other payables
These amounts represent liabilities for goods and services provided to the Group prior to the end of financial year which are unpaid. They are initially recognised at fair value, net of transaction costs incurred and subsequently measured at amortised cost using the effective interest rate method.
(r) Borrowings
Borrowings are initially recognised at fair value of the consideration received, less transaction costs incurred. Borrowings are subsequently measured at amortised cost using the effective interest method. Gains and losses are recognised in profit or loss when the liabilities are derecognised.
(s) Borrowing costs
Borrowing costs incurred for the construction of any qualifying asset are capitalised during the period of time that is required to complete and prepare the asset for its intended use or sale. Other borrowing costs are expensed.
(t) Provisions
Provisions for legal claims, service warranties and make good obligations are recognised when the Group has a present legal or constructive obligation as a result of past events, it is probable that an outflow of resources will be required to settle the obligation and the amount has been reliably estimated. Provisions are not recognised for future operating losses.
Where there are a number of similar obligations, the likelihood that an outflow will be required in settlement is determined by considering the class of obligations as a whole. A provision is recognised even if the likelihood of an outflow with respect to any one item included in the same class of obligations may be small.
Provisions are measured at the present value of management’s best estimate of the expenditure required to settle the present obligation at the end of the reporting period. The discount rate used to determine the present value is a pre-tax rate that reflects current market assessments of the time value of money and the risks specific to the liability. The increase in the provision due to the passage of time is recognised as interest expense.
Present obligations arising under onerous contracts are recognised and measured as provisions. An onerous contract is considered to exist where the Group has a contract under which the unavoidable costs of meeting the obligations under the contract exceed the economic benefits expected to be received under it.
1 suMMArY oF siGniFicAnt AccountinG poLicies (continueD)
30 June 2013
For
per
sona
l use
onl
y

CLOUGH ANNUAL REPORT 201366
(u) Employee benefits
(i) Short-term obligations
Liabilities for wages and salaries, including non-monetary benefits, annual leave and long service leave expected to be settled within 12 months of the reporting date are recognised in trade and other payables and the provision for employee benefits in respect of employee services up to the reporting date. All other short term employee benefit obligations are presented as payables.
(ii) Other long-term employee benefit obligations
The liability for long service leave which is not expected to be settled within 12 months after the end of the period in which the employees render the related service is recognised in the provision for employee benefits and measured as the present value of expected future payments to be made in respect of services provided by employees up to the end of the reporting period using the projected unit credit method. Consideration is given to expected future wage and salary levels, experience of employee departures and periods of service. Expected future payments are discounted using market yields at the end of the reporting period on national government bonds with terms to maturity and currency that match, as closely as possible, the estimated future cash outflows.
(iii) Defined contribution plans
Contributions to defined contribution superannuation plans are expensed when employees have rendered service entitling them to the contributions.
(iv) Share-based payments
Share based compensation benefits are provided to employees via the Clough Limited Executive Option Plan (options) and the Clough Limited Executive Incentive Scheme (performance rights) as detailed in note 38.
The fair value of options granted under the Clough Limited Executive Option Plan and performance rights granted under the Clough Limited Executive Incentive Scheme are recognised as an employee benefit expense (in labour costs) with a corresponding increase in equity. The fair value is measured at grant date and recognised over the period during which the employees become unconditionally entitled to the options / performance rights.
The fair value at grant date is independently determined using a Binomial option pricing model that takes into account the exercise price, the term of the option / performance right, the vesting and performance criteria, the impact of dilution, the non-tradeable nature of the option / performance right, the share price at grant date and expected price volatility of the underlying share, the expected dividend yield and the risk-free interest rate for the term of the option / performance right.
The fair value of the options / performance rights granted is adjusted to reflect market vesting conditions, but excludes the impact of any non-market vesting conditions (for example, profitability and sales growth targets). Non-market vesting conditions are included in assumptions about the number of options / performance rights that are expected to vest. The total expense is recognised over the vesting period, which is the period over which all of the specified vesting conditions are to be satisfied. At the end of each period, the entity revises its estimates of the number of options / performance rights that are expected to vest based on the non-market vesting conditions. It recognises the impact of the revision to original estimates, if any, in profit or loss, with a corresponding adjustment to equity.
Upon the exercise of options, the proceeds received, net of any directly attributable transaction costs, are credited to share capital.
(v) Contributed equity
Ordinary shares are classified as equity.
Incremental costs directly attributable to the issue of new shares are shown in equity as a deduction, net of tax, from the proceeds. Incremental costs directly attributable to the issue of new shares for the acquisition of a business are not included in the cost of the acquisition as part of the purchase consideration.
If the entity reacquires its own equity instruments, for example as the result of a share buy-back, the consideration paid, including any directly attributable incremental costs (net of income taxes) is deducted from equity attributable to the owners of Clough Limited as treasury shares until the shares are cancelled.
(w) Dividends
Provision is made for the amount of any dividend declared on or before the end of the reporting period but not distributed at the end of the reporting period.
(x) Earnings per share
(i) Basic earnings per share
Basic earnings per share is calculated by dividing:
• theprofitattributabletoownersoftheCompany,excludinganycostsofservicingequityotherthanordinaryshares
• bytheweightedaveragenumberofordinarysharesoutstandingduringthefinancialyear,adjustedforbonuselementsinordinary shares issued during the year.
1 suMMArY oF siGniFicAnt AccountinG poLicies (continueD)
notes to tHe consoLiDAteD FinAnciAL stAteMents
30 June 2013
For
per
sona
l use
onl
y

67ENGINEERED FOR PRODUCTIVITY
(x) Earnings per share (continued)
(ii) Diluted earnings per share
Diluted earnings per share adjusts the figures used in the determination of basic earnings per share to take into account:
• theafterincometaxeffectofinterestandotherfinancingcostsassociatedwithdilutivepotentialordinaryshares,and
• theweightedaveragenumberofadditionalordinarysharesthatwouldhavebeenoutstandingassumingtheconversionofalldilutive potential ordinary shares.
(y) Goods and Services Tax (GST)
Revenues, expenses and assets are recognised net of the amount of associated GST, unless the GST incurred is not recoverable from the taxation authority. In this case it is recognised as part of the cost of acquisition of the asset or as part of the expense.
Receivables and payables are stated inclusive of the amount of GST receivable or payable. The net amount of GST recoverable from, or payable to, the taxation authority is included with other receivables or payables in the consolidated balance sheet.
Cash flows are presented on a gross basis. The GST components of cash flows arising from investing or financing activities which are recoverable from, or payable to the taxation authority, are presented as operating cash flows.
(z) New accounting standards and interpretations
Certain new accounting standards and interpretations have been published that are not mandatory for 30 June 2013 reporting periods and have not been early adopted by the Group. The Group’s assessment of the impact of these new standards and interpretations is set out below.
(i) AASB 9 Financial Instruments, AASB 2009-11 Amendments to Australian Accounting Standards arising from AASB 9, AASB 2010-7 Amendments to Australian Accounting Standards arising from AASB 9 (December 2010) and AASB 2012-6 Amendments to Australian Accounting Standards - Mandatory Effective Date of AASB 9 and Transition Disclosures (effective from 1 January 2015)
AASB 9 Financial Instruments addresses the classification, measurement and derecognition of financial assets and financial liabilities. These requirements improve and simplify the approach for classification and measurement of financial assets and financial liabilities compared with the requirements of AASB 139 Financial Instruments Recognition and Measurement. The standard is not applicable until 1 January 2015 but is available for early adoption. The Group has not determined the potential impact of the new standard.
(ii) AASB 10 Consolidated Financial Statements, AASB 11 Joint Arrangements, AASB 12 Disclosure of Interests in Other Entities, revised AASB 127 Separate Financial Statements, AASB 128 Investments in Associates and Joint Ventures, AASB 2011-7 Amendments to Australian Accounting Standards arising from the Consolidation and Joint Arrangements Standards and AASB 2012-10 Amendments to Australian Accounting Standards - Transition Guidance and Other Amendments (effective 1 January 2013)
In August 2011, the AASB issued a suite of five new and amended standards which address the accounting for joint arrangements, consolidated financial statements and associated disclosures.
AASB 10 establishes a new control model that applies to all entities. It replaces parts of AASB 27 Consolidated and Separate Financial Statements dealing with accounting for consolidated financial statements and Interpretation 12 Consolidation - Special Purpose Entities. The new control model broadens the situations when an entity is considered to be controlled by another entity and includes new guidance for applying the model to specific situations. The core principle that a consolidated entity presents a parent and its subsidiaries as if they are a single economic entity remains unchanged, as do the mechanics of consolidation. However the standard introduces a single definition of control that applies to all entities. It focuses on the need to have both power and rights or exposure to variable returns before control is present. Power is the current ability to direct the activities that significantly influence returns. The Group does not expect the new standard to have any significant impact on its composition.
AASB 11 introduces a revised approach to accounting for joint arrangements. The focus is no longer on the legal structure of joint arrangements, but rather on how rights and obligations are shared by the parties to the joint arrangement. Based on the assessment of rights and obligations, a joint arrangement will be classified as either a joint operation or a joint venture. Joint ventures are accounted for using the equity method, whereas parties to a joint operation will account for their share of revenues, expenses, assets and liabilities. AASB 11 also provides guidance for parties that participate in joint arrangements but do not share joint control.
The Group is in the final stages of its review and assessment of the impact of AASB 11. As a result of the new standard, it is expected that Clough’s joint ventures will be classified as joint operations under the new rules. The Group currently applies the equity method in accounting for its interests in its joint ventures, and as a result, AASB 11 is expected to have a significant impact on the amounts recognised in the financial statements. Although there will be no change to the net profit, net assets or equity of the Group, the proportional consolidation of the Group’s joint ventures would result in Clough recognising its share of the assets, liabilities, revenue and expenses of the joint ventures rather than as a single line investment in the consolidated balance sheet and share of net profits in the consolidated income statement as is currently the case. This would have the impact of grossing up the individual assets, liabilities, income and expenses reported in the consolidated balance sheet and income statement. It is noted that Clough’s segment revenue which includes its share of revenue of its joint ventures is disclosed in note 3.
1 suMMArY oF siGniFicAnt AccountinG poLicies (continueD)
30 June 2013
For
per
sona
l use
onl
y

CLOUGH ANNUAL REPORT 201368
(z) New accounting standards and interpretations (continued)
(ii) AASB 10 Consolidated Financial Statements, AASB 11 Joint Arrangements, AASB 12 Disclosure of Interests in Other Entities, revised AASB 127 Separate Financial Statements, AASB 128 Investments in Associates and Joint Ventures, AASB 2011-7 Amendments to Australian Accounting Standards arising from the Consolidation and Joint Arrangements Standards and AASB 2012-10 Amendments to Australian Accounting Standards - Transition Guidance and Other Amendments (effective 1 January 2013) (continued)
AASB 12 sets out the required disclosures for entities reporting under the two new standards, AASB 10 and AASB 11, and replaces the disclosure requirements currently found in AASB 127 and AASB 128. Application of this standard by the Group will not affect any of the amounts recognised in the financial statements, but will impact the type of information disclosed in relation to the Group’s investments.
The Group will adopt the new standards from their operative date, being 1 July 2013.
(iii) AASB 13 Fair Value Measurement and AASB 2011-8 Amendments to Australian Accounting Standards arising from AASB 13 (effective 1 January 2013)
AASB 13 establishes a single source of guidance for determining the fair value of assets and liabilities. AASB 13 does not change when an entity is required to use fair value, but rather, provides guidance on how to determine fair value when fair value is required or permitted. Application of this definition may result in different fair values being determined for the relevant assets. AASB 13 also expands the disclosure requirements for all assets or liabilities carried at fair value. The Group does not expect the new standard to have a significant impact on the Group.
(iv) Revised AASB 119 Employee Benefits and AASB 2012-10 Amendments to Australian Accounting Standards arising from AASB 119 (September 2012)
The main change introduced by this standard is to revise the accounting for defined benefit plans. The amendment removes the options for accounting for the liability, and requires that the liabilities arising from such plans is recognised in full with actuarial gains and losses being recognised in other comprehensive income. This change will have no impact on the Group.
The revised standard changes the definition of short term employee benefits. The distinction between short term and other long term employee benefits is now based on whether the benefits are expected to be settled wholly within 12 months after the reporting date. It should also be noted that consequential amendments were made to other standards via AASB 2011-10 Amendments to Australian Accounting Standards arising from AASB 119. The Group has not determined the potential impact of the changes to the standards, except as noted above.
The Group will apply the new standard when it becomes operative, being from 1 July 2013.
There are no other standards that are not yet effective and that are expected to have a material impact on the entity in the current or future reporting periods and on foreseeable future transactions.
(aa) Parent entity financial information
The financial information for the parent entity, Clough Limited, disclosed in note 39 has been prepared on the same basis as the consolidated financial statements, except as set out below.
(i) Investments in subsidiaries
Investments in subsidiaries are accounted for at cost in the financial statements of Clough Limited.
(ii) Tax consolidation legislation
Clough Limited and its wholly-owned Australian controlled entities have implemented the tax consolidation legislation.
The head entity, Clough Limited, and the controlled entities in the tax consolidated group account for their own current and deferred tax amounts. These tax amounts are measured as if each entity in the tax consolidated group continues to be a stand-alone taxpayer in its own right.
In addition to its own current and deferred tax amounts, Clough Limited also recognises the current tax liabilities (or assets) and the deferred tax assets arising from unused tax losses and unused tax credits assumed from controlled entities in the tax consolidated group.
The entities have also entered into a tax funding agreement under which the wholly-owned entities fully compensate Clough Limited for any current tax payable assumed and are compensated by Clough Limited for any current tax receivable and deferred tax assets relating to unused tax losses or unused tax credits that are transferred to Clough Limited under the tax consolidation legislation. The funding amounts are determined by reference to the amounts recognised in the wholly-owned entities’ financial statements.
The amounts receivable/payable under the tax funding agreement are due upon receipt of the funding advice from the head entity, which is issued as soon as practicable after the end of each financial year. The head entity may also require payment of interim funding amounts to assist with its obligations to pay tax instalments.
1 suMMArY oF siGniFicAnt AccountinG poLicies (continueD)
notes to tHe consoLiDAteD FinAnciAL stAteMents
30 June 2013
For
per
sona
l use
onl
y

69ENGINEERED FOR PRODUCTIVITY
(aa) Parent entity financial information (continued)
(ii) Tax consolidation legislation (continued)
Assets or liabilities arising under tax funding agreements with the tax consolidated entities are recognised as current amounts receivable from or payable to other entities in the Group.
Any difference between the amounts assumed and amounts receivable or payable under the tax funding agreement are recognised as a contribution to (or distribution from) wholly owned tax consolidated entities.
2 criticAL AccountinG estiMAtes AnD juDGeMentsThe preparation of the consolidated financial statements requires management to make judgements and estimates and form assumptions that affect how certain assets, liabilities, revenue, expenses and equity are reported. These judgements and estimates are based on historical experience and various other factors believed to be reasonable under the circumstances, the results of which form the basis of the carrying values of assets and liabilities that are not readily apparent from other sources. Actual results may differ from these estimates under different assumptions and conditions.
Management have identified the following critical accounting policies for which significant judgements, estimates and assumptions are made.
(i) Accounting for construction contracts
The Group accounts for construction contracts in accordance with AASB 111 Construction Contracts. The detailed accounting policy can be found in Note 1(d)(i).
Accounting for construction contracts involves the continuous use of assessed estimates based on a number of detailed assumptions consistent with the project scope and schedule, contract and risk management processes. These contracts may span several accounting periods requiring estimates and assumptions to be updated on a regular basis.
Details of the procedures followed in accounting for the Group’s construction contracts are detailed below.
• Forecastcostsatcompletion
The estimates of the forecast costs at completion of all construction contracts are regularly updated in accordance with the agreed work scope and schedule under the respective contracts. Forecast costs are based on rates expected to apply when the related activity is expected to be undertaken. Appropriate contingencies are included in the forecast costs to completion in order to cover risks inherent in those forecasts. Any additional contractual obligations, including liquidated damages, are also assessed to the extent that these are due and payable under the contract recognising the contractual status from both the Group’s and the client’s viewpoints.
• Revenues
Revenues reflect the contract price agreed in the contract and variations where it is probable that the client will approve those variations or are due under the contract (schedule of rates type contracts would fall under this latter category for example). Claims are included in contract revenue only where negotiations have reached an advanced stage such that it is probable that the client will accept the claim and recovery of the amount involved is probable.
• Profitrecognitiononconstructioncontracts
Accounting for construction contracts involves making regular judgements due to the nature of construction contracts themselves. These judgements include the determination of the point at which a contract has progressed beyond its establishment and initial stages, and that it is appropriate to start recognising profits earned on the contract and the recognition of profits under risk and reward schemes.
• Contractsmateriallyimpactedbyaclient’sactions
In limited circumstances, contracts may be materially impacted by a client’s actions such that the Group is unable to complete the contracted works at all or in the manner originally forecast. This may involve dispute resolution procedures under the relevant contract and/or litigation. In these circumstances the assessment of the project outcome, whilst following the basic principles noted above, becomes more judgemental.
Forecast costs at completion are based on a similar approach to that noted above. Revenues include an assessment of the likely outcome of reaching agreement with the client which is generally arrived at by assessing the probabilities of a number of different commercial outcomes including an estimate of the costs, (which would include legal costs for example) to reach that agreement and the impact of customers calling bank guarantees where viewed to be probable. Profits would not be recognised on a contract in these circumstances. Similarly, where the project outcome cannot be reliably measured because of the particular features of the dispute, revenues are recognised to the extent of costs incurred that are probable of recovery from the client. Costs that are not probable of recovery are expensed.
1 suMMArY oF siGniFicAnt AccountinG poLicies (continueD)
30 June 2013
For
per
sona
l use
onl
y

CLOUGH ANNUAL REPORT 201370
(i) Accounting for construction contracts (continued)
• Contractclaimsanddisputes
Certain claims arising out of engineering and construction contracts have been made against certain controlled entities in the ordinary course of business, some of which involve litigation or arbitration.
Estimates and assumptions regarding the likely outcome of these claims have been made and these have been recognised in the carrying value of assets and liabilities recorded in the financial report. In making these estimates and assumptions, legal opinion has been obtained as appropriate.
(ii) Impairment
The Group assesses impairment at each reporting date by evaluating conditions specific to the consolidated entity that may lead to impairment of assets. Where an impairment trigger exists, the recoverable amount of the asset is determined. Value-in-use calculations performed in assessing recoverable amounts incorporate a number of key estimates and assumptions.
(iii) Income taxes
The Group is subject to income taxes in Australia and jurisdictions where it has foreign operations. Significant judgement is required in determining the worldwide provision for income taxes. There are certain transactions and calculations undertaken during the ordinary course of business for which the ultimate tax determination is uncertain. The Group estimates its tax liabilities based on the Group’s understanding of the tax law. Where the final tax outcome of these matters is different from the amounts that were initially recorded, such differences will impact the current and deferred income tax assets and liabilities in the period in which such determination is made.
The Group recognises deferred tax assets arising from unused tax losses and timing differences of the tax consolidated group to the extent that it is probable that future taxable profits of the tax consolidated group will be available against which the asset can be utilised.
To estimate the ability for the Group to recover the deferred tax assets, the following items are taken into account:
• Forecasttaxableresultswithappropriateriskweighting;
• Analysisofthepasttaxableresults;and
• Existenceofsignificantandnon-recurrentincomeandexpenses,includedinthepasttaxresults,whichshouldnotrepeatinthefuture.
3 seGMent inForMAtion
(a) Description of segments
Management has determined the operating segments based on reports reviewed by its chief operating decision maker that are used to make strategic decisions. The chief operating decision maker has been identified as comprising of the Chief Executive Officer, the Chief Financial Officer and the Board of Directors (the CODM).
The CODM considers the business from a Business Division perspective and has identified four reportable segments as detailed below. Discrete financial information about each of these Business Divisions is reported to the CODM on a monthly basis.
Clough has reported new Business Divisions, which were effective from 1 July 2012, and form its reporting segments in respect of the year ended 30 June 2013. The reported segments for the year ended 30 June 2012 have been restated to reflect the new Business Divisions. The new Business Divisions comprise Engineering, Projects (an aggregation of Capital Projects and Jetties & Near Shore Marine) and Commissioning & Asset Support. The operating results of these Business Divisions, together with the Fabrication operation in Thailand, are reviewed regularly by the CODM, and as such are regarded as operating segments. Although the Fabrication operation does not meet the set quantitative thresholds, management considers that information about the segment is useful to users of the financial statements.
Engineering
This comprises concept, front-end engineering and design (FEED), detailed design and engineering, procurement and construction management (EPCM) services to the energy, chemicals and mining and mineral markets primarily in Australia and Papua New Guinea.
The Engineering business has been determined as both an operating segment and a reportable segment.
Projects
This comprises Capital Projects and Jetties & Near Shore Marine businesses.
Capital Projects comprises the delivery of project management, engineering, procurement and construction (EPC) services to the energy, chemicals and mining and mineral markets primarily in Australia and Papua New Guinea.
Jetties & Near Shore Marine comprises an integrated design and construction service for LNG and mineral offloading jetties and other near shore marine structures including loading platforms, dolphin berthing structures and ports.
The Projects business has been determined as both an operating segment and a reportable segment.
2 criticAL AccountinG estiMAtes AnD juDGeMents (continueD)
notes to tHe consoLiDAteD FinAnciAL stAteMents
30 June 2013
For
per
sona
l use
onl
y

71ENGINEERED FOR PRODUCTIVITY
(a) Description of segments (continued)
Commissioning and Asset Support
This comprises engineering led services to enable the commissioning, engineering, operation, maintenance, shutdown and decommissioning of upstream oil and gas infrastructure both offshore and onshore primarily in Australia and Papua New Guinea.
The Commissioning and Asset Support business has been determined as both an operating segment and a reportable segment.
Fabrication
This comprises Clough’s fabrication and assembly operation.
Discontinued segments
These comprise Clough’s investment in Forge Group Limited, Property, Marine Construction and Petrosea which are included in discontinued operations as disclosed in note 8.
Corporate overheads and other
Corporate overheads and other, including share-based payments and central foreign exchange movements, are not allocated to the above operating segments as they are not considered to be part of the core operations of any segment.
(b) Segment information provided to the CODM
The segment information provided to the CODM for the reportable segments for the year ended 30 June 2013 and the restated segment information for the year ended 30 June 2012 is as follows:
2013 Engineering ProjectsCommissioning & Asset Support Fabrication Total
$’000 $’000 $’000 $’000 $’000
Total segment revenue * 514,639 843,658 121,811 29,645 1,509,753
Revenue from external customers 514,639 843,658 121,811 29,645 1,509,753
Earnings (loss) before interest, tax and corporate overheads and other 72,883 57,578 11,115 (8,131) 133,445
Corporate overheads and other ^ (42,709)
Earnings before interest and tax 90,736
Depreciation and amortisation ^ - - - 363 363
2012 Engineering ProjectsCommissioning & Asset Support Fabrication Total
$’000 $’000 $’000 $’000 $’000
Total segment revenue * 353,863 548,780 79,960 22,824 1,005,427
Revenue from external customers 353,863 548,780 79,960 22,824 1,005,427
Earnings (loss) before interest, tax and corporate overheads and other 49,192 34,508 5,264 (2,663) 86,301
Corporate overheads and other ^ (49,083)
Earnings before interest and tax 37,218
Depreciation and amortisation ^ - - - 470 470
* Includes share of revenue of jointly controlled entities.
^ Corporate overheads and other includes depreciation and amortisation expense of $4,025,000 (2012: $2,793,000) and impairment charges of $4,170,000 (2012: $nil).
3 seGMent inForMAtion (continueD)
30 June 2013
For
per
sona
l use
onl
y

CLOUGH ANNUAL REPORT 201372
(c) Other segment information
(i) Segment revenue
Segment revenue reconciles to revenue from construction contracts as disclosed in note 4 as follows:
2013
$’000
2012
$’000
Total segment revenue 1,509,753 1,005,427
Segment revenue from jointly controlled entities (1,137,303) (710,194)
Revenue from construction contracts (note 4) 372,450 295,233
The entity is domiciled in Australia. The total segment revenue from external customers in Australia is $1,109,234,000 (2012: $562,308,000 ), and the total from other countries is $400,519,000 (2012: $443,119,000) and includes $369,696,000 (2012: $407,975,000) from Papua New Guinea. Segment revenues are allocated based on the country in which the work is performed.
Significant revenues have been derived from a number of external customers. Revenues of $241,633,000 (2012: $186,494,000) have been derived from a single customer in the Engineering segment and revenues of $313,944,000 (2012: $362,161,000) and $297,415,000 (2012: $33,910,000) have been derived from single customers in the Projects segment.
(ii) Earnings before interest and tax
The CODM assesses the performance of the operating segments based on earnings before interest and tax. Corporate overheads and other, including share-based payments and central foreign exchange gains/losses, are not allocated to the operating segments as they are not considered to be part of the core operations of any segment. Interest income and expenditure are not allocated to segments as the financing function of the Group is centralised through the Group’s treasury function.
A reconciliation of segment earnings before interest and tax to profit before income tax from continuing operations is provided as follows:
2013
$’000
2012
$’000
Segment earnings before interest and tax 90,736 37,218
Interest income 7,334 3,585
Finance costs (107) (392)
Tax expense included in share of net profit of equity accounted entities (727) (492)
Net interest income included in share of net profit of equity accounted entities 714 110
Profit before income tax from continuing operations 97,950 40,029
(iii) Segment assets and liabilities
The amounts provided to the CODM with respect to total assets and liabilities are measured in a manner consistent with that of the financial statements. The total assets and liabilities are provided for the Group as a whole and are not allocated to each operating segment.
3 seGMent inForMAtion (continueD)
notes to tHe consoLiDAteD FinAnciAL stAteMents
30 June 2013
For
per
sona
l use
onl
y

73ENGINEERED FOR PRODUCTIVITY
4 reVenue
2013
$’000
2012
$’000
From continuing operations
Revenue
Construction contracts 372,450 295,233
Other revenue
Rental income 6,635 7,666
Interest income 7,334 3,585
Other revenue (including recharges to jointly controlled entities) 238,310 124,958
252,279 136,209
624,729 431,442
From discontinued operations
Revenue
Construction contracts 6,148 31,772
Other revenue
Interest income 17 578
Other revenue (including recharges to jointly controlled entities) 30 16,851
47 17,429
6,195 49,201
Revenue - Group and jointly controlled entities
The consolidated entity’s share of construction contract revenue from jointly controlled entities is excluded from revenue noted above and is included within Clough’s share of net profit of jointly controlled entities. The Group delivers a number of projects through jointly controlled entities and its share of revenue from these jointly controlled entities (after any necessary proportional consolidation adjustments) is shown below.
2013
$’000
2012
$’000
Revenue - Group and jointly controlled entities
Construction contract revenue - Group 372,450 295,233
Construction contract revenue - jointly controlled entities 1,137,303 710,194
1,509,753 1,005,427
5 otHer incoMe
2013
$’000
2012
$’000
Net gain on disposal of property, plant and equipment - 1,029
Net gain on winding up controlled entity 85 -
Net foreign exchange gains 1,358 -
Other income - 10
1,443 1,039
30 June 2013
For
per
sona
l use
onl
y

CLOUGH ANNUAL REPORT 201374
6 expenses
2013
$’000
2012
$’000
Profit before income tax includes the following specific expenses:
Employee benefits expenses
Defined contribution superannuation expense 18,522 13,538
Depreciation and amortisation
Plant and equipment 1,772 1,711
Leasehold improvements 1,437 1,344
Computer software 679 208
Customer relationships 500 -
Total depreciation and amortisation 4,388 3,263
Net loss on disposal of property, plant and equipment 863 -
Rental expense relating to operating leases
Minimum lease payments 29,995 26,916
Impairment losses
Other receivables 670 -
Leasehold improvements 3,500 -
4,170 -
Net foreign exchange losses - 1,236
7 incoMe tAx expense
(a) Income tax expense
2013
$’000
2012
$’000
Current tax 44,489 11,812
Deferred tax 12,949 (5,717)
Adjustments for current tax of prior periods (454) (394)
56,984 5,701
Income tax expense is attributable to:
Profit from continuing operations 24,040 4,936
Profit from discontinued operations 32,944 765
Aggregate income tax expense 56,984 5,701
Deferred income tax expense (revenue) included in income tax expense comprises:
Decrease (increase) in deferred tax assets (note 16) 14,241 (3,195)
Decrease in deferred tax liabilities (note 20) (1,292) (2,522)
12,949 (5,717)
notes to tHe consoLiDAteD FinAnciAL stAteMents
30 June 2013
For
per
sona
l use
onl
y

75ENGINEERED FOR PRODUCTIVITY
(b) Numerical reconciliation of income tax expense to prima facie tax payable
2013
$’000
2012
$’000
Profit from continuing operations before income tax expense 97,950 40,029
Profit from discontinuing operations before income tax expense 86,448 8,894
184,398 48,923
Tax at the Australian tax rate of 30% (2012 - 30%) 55,319 14,677
Tax effect of amounts which are not deductible (taxable) in calculating taxable income:
Profits from equity accounted entities (6,264) (6,387)
Share-based payments 456 487
Entertainment 151 83
Foreign branch profits (295) (140)
Sale of Marine Construction business - (1,645)
Gain on sale of Forge 11,552 -
Withholding taxes 671 399
Other sundry items 3,277 5,338
64,867 12,812
Difference in overseas tax rates 226 482
Over provision in prior years - current tax (454) (394)
Under (over) provision in prior years - deferred tax (1,410) 2,266
Deferred tax assets (liabilities) now derecognised 323 1,213
Losses utilised in current period not previously brought into account (6,817) (10,275)
Tax losses (not previously recognised now brought into account) previously brought into account now derecognised - (8,055)
Tax losses not brought into account 249 1,237
Provision for overseas tax liability - 4,891
Derecognition of overseas withholding tax receivable - 1,258
Impact of deferred tax expense of changes in overseas tax rates - 266
Total income tax expense 56,984 5,701
(c) Amounts recognised directly in other comprehensive income
2013
$’000
2012
$’000
Aggregate current and deferred tax arising in the reporting period and not recognised in net profit or loss but directly debited or credited to other comprehensive income
Net deferred tax - debited directly to other comprehensive income 619 996
(d) Tax losses
2013
$’000
2012
$’000
Unused tax losses for which no deferred tax asset has been recognised 17,705 30,139
Potential tax benefit at appropriate tax rates 5,342 7,702
7 incoMe tAx expense (continueD)
30 June 2013
For
per
sona
l use
onl
y

CLOUGH ANNUAL REPORT 201376
8 DiscontinueD operAtionsDiscontinued operations comprise Clough’s investment in Forge Group Limited (“Forge”), the Property business, the Marine Construction business and PT Petrosea Tbk and related entities (“Petrosea”) as detailed below.
The results of Clough’s discontinued operations are summarised as follows:
2013
$’000
2012
$’000
Discontinued operations
Forge 54,792 15,639
Property (1,705) (9,981)
Marine Construction - 2,971
Petrosea 417 (500)
Profit from discontinued operations 53,504 8,129
Discontinued Operation - Forge
On 25 March 2013, Clough disposed of its entire 35.85% shareholding in Forge at a price of $6.05 per share. The sales proceeds after brokerage and other costs of sale were $183,990,000.
The carrying value of the equity accounted investment in Forge at the date of sale was $113,791,000 and the gain on disposal after tax was $37,262,000.
(a) Financial performance and cash flow information of Forge
The financial performance and cash flows of Forge to the date of sale are detailed below.
2013
$’000
2012
$’000
Profit from Forge
Share of net profit of Forge accounted for using the equity method 17,530 16,809
Fair value loss on Forge Put Option arrangement - (1,170)
Profit after income tax 17,530 15,639
Gain on sale 37,262 -
Profit from Forge 54,792 15,639
Cash flows from Forge (including sale proceeds)
Net cash inflow from operating activities 5,561 3,732
Net cash inflow (outflow) from investing activities 183,990 (18,200)
Net increase (decrease) in cash generated 189,551 (14,468)
notes to tHe consoLiDAteD FinAnciAL stAteMents
30 June 2013
For
per
sona
l use
onl
y

77ENGINEERED FOR PRODUCTIVITY
Discontinued Operation - Property business
The Company is continuing to exit from the property business and an active sales process is ongoing. It is expected that the sale of the remaining property developments will be completed within the next 12 months.
(a) Financial performance and cash flow information of the property business
The financial performance and cash flows of the property business for the years ended 30 June 2013 and 2012 are detailed below.
2013
$’000
2012
$’000
Loss of the property business
Revenue 6,148 2,655
Other revenue 47 663
Impairment of property development inventory (960) (6,828)
Expenses (6,778) (7,036)
Loss before income tax (1,543) (10,546)
Income tax (expense) benefit (162) 565
Loss after income tax of the property business (1,705) (9,981)
Cash flows of the property business
Net cash inflow (outflow) from operating activities 5,750 (1,226)
Net cash inflow from investing activities 1,700 986
Net increase (decrease) in cash generated by the property business 7,450 (240)
(b) Carrying amounts of assets and liabilities of the property business
The carrying amounts of assets and liabilities of the property business are as follows:
2013
$’000
2012
$’000
Assets classified as held for sale
Interests in jointly controlled entities 4,711 4,708
Property development inventories 11,335 17,290
Total assets 16,046 21,998
Liabilities directly associated with assets classified as held for sale
Loan from jointly controlled entity 4,557 4,557
Total liabilities 4,557 4,557
Net assets 11,489 17,441
Discontinued Operation - Marine Construction business
Following a strategic review of its operations during the year ended 30 June 2011, the Company resolved to exit the asset owning Marine Construction business and focus on core activities being that of an Engineering led EPC company in the oil and gas and minerals sectors.
On 8 August 2011, Clough announced that it had signed a conditional Master Sale and Purchase Agreement to sell its Marine Construction business to SapuraCrest Petroleum Berhad (“SapuraCrest”), a listed Malaysian entity, and the sale was completed on 22 December 2011.
8 DiscontinueD operAtions (continueD)
30 June 2013
For
per
sona
l use
onl
y

CLOUGH ANNUAL REPORT 201378
(a) Financial performance and cash flow information of the Marine Construction business
The financial performance and cash flow information of the Marine Construction business for period ended 22 December 2011 is detailed below.
Period ended 22 December 2011
$’000
Profit (loss) of the Marine Construction business
Revenue 29,117
Other revenue 16,766
Other income 1,037
Expenses (48,468)
Loss before income tax (1,548)
Income tax expense (1,330)
Loss after income tax of the Marine Construction business (2,878)
Gain on sale of the Marine Construction business (note (b)) 5,849
Profit of the Marine Construction business 2,971
Cash flows of the Marine Construction business (including sales proceeds)
Net cash outflow from operating activities (320)
Net cash inflow from investing activities 86,083
Net cash outflow from financing activities (42,989)
Net increase in cash generated by the Marine Construction business 42,774
(b) Details of the sale of the Marine Construction business
2012
$’000
Consideration received
Cash 129,533
Less: adjustment amount repaid (based on final net assets at date of sale) (3,483)
Total disposal consideration 126,050
Less: Carrying amount of net assets sold (102,170)
Less: Non-controlling interests 671
Less: Foreign currency translation reserve reclassified to profit or loss on sale (6,133)
Less: Costs associated with the sale (12,569)
Gain on sale before income tax 5,849
Income tax expense -
Gain on sale after income tax 5,849
Discontinued Operation - Petrosea
Clough sold its investment in Petrosea to PT Indika Energy Tbk (“PT Indika”) during the year ended 30 June 2010. During the year ended 30 June 2011, Clough received a claim from PT Indika in relation to a warranty included in the Petrosea sales agreement. The dispute with PT Indika was resolved in October 2012 and Clough recorded a net gain on settlement of $417,000 (2012: loss $500,000).
8 DiscontinueD operAtions (continueD)
notes to tHe consoLiDAteD FinAnciAL stAteMents
30 June 2013
For
per
sona
l use
onl
y

79ENGINEERED FOR PRODUCTIVITY
9 cAsH AnD cAsH eQuiVALents
2013
$’000
2012
$’000
Current assets
Cash at bank and in hand 88,779 66,212
Deposits at call 352,449 80,299
441,228 146,511
(a) Risk exposure
The Group’s exposure to interest rate risk is discussed in note 24. The maximum exposure to credit risk at the end of the reporting period is the carrying amount of each class of cash and cash equivalents mentioned above.
10 trADe AnD otHer receiVABLes
2013
$’000
2012
$’000
Current
Trade receivables 68,504 63,496
Provision for impairment of receivables (note (a)) (1,737) (1,567)
66,767 61,929
Loans to other persons 1,642 1,700
Loans to jointly controlled entities - 1,312
Other receivables 19,469 25,515
Prepayments and deposits 4,337 7,012
92,215 97,468
Non-current
Other receivables - 4,781
Prepayments 2,029 2,783
Loans to other persons - 2,122
2,029 9,686
(a) Impaired trade receivables
As at 30 June 2013, trade receivables with a nominal value of $1,737,000 (2012: $1,567,000) were impaired and have been fully provided for. These trade receivables are over 12 months old and the only movement in the provision for impairment of receivables in the year were exchange rate movements of $170,000 (2012: $11,000).
30 June 2013
For
per
sona
l use
onl
y

CLOUGH ANNUAL REPORT 201380
(b) Past due but not impaired
As of 30 June 2013, trade receivables of $346,000 (2012: $2,069,000) were past due but not impaired. These relate to a number of trade receivable balances where for various reasons the payment terms have not been met. These receivables are less than 12 months old and have been assessed to be fully recoverable.
The other classes within trade and other receivables do not contain impaired assets, apart from loans to other persons disclosed below, and are not past due. Based on the credit history of these other classes, it is expected that these amounts will be received when due.
A provision for impairment of $600,000 was taken during the year to reduce the carrying value of current loans to other persons to the value of the security held.
(c) Foreign exchange and interest rate risk
Information about the Group’s exposure to foreign currency risk and interest rate risk in relation to trade and other receivables is provided in note 24.
(d) Fair value and credit risk
Due to the short-term nature of the current receivables, their carrying amount is assumed to approximate their fair value. The fair value of the non-current receivables is as follows:
2013 2012Carrying amount
$’000
Fair value
$’000
Carrying amount
$’000
Fair value
$’000
Other loans and receivables 2,029 2,029 9,686 9,686
(e) Risk exposure
The maximum exposure to credit risk at the end of the reporting period is the carrying amount of each class of receivables mentioned above. No collateral is held in relation to these receivable apart from loans to other persons as disclosed above.
11 current Assets - WorK in proGress
2013
$’000
2012
$’000
Construction work in progress
Amounts due from customers for contract work 13,245 6,523
(a) Construction contracts
Retentions on construction contracts in progress included in current receivables total $nil (2012: $750,000). There were no advances received from customers in relation to construction contracts in progress at 30 June 2013 (2012: $nil).
12 DeriVAtiVe FinAnciAL instruMents
2013
$’000
2012
$’000
Current assets
Forward foreign exchange contracts - cash flow hedges (note (a)(i)) 208 2
Total current derivative financial instrument assets 208 2
Current liabilities
Forward foreign exchange contracts - cash flow hedges (note (a)(i)) 111 1,758
Total current derivative financial instrument liabilities 111 1,758
97 (1,756)
10 trADe AnD otHer receiVABLes (continueD)
notes to tHe consoLiDAteD FinAnciAL stAteMents
30 June 2013
For
per
sona
l use
onl
y

81ENGINEERED FOR PRODUCTIVITY
(a) Instruments used by the Group
The Group is party to derivative financial instruments in the normal course of business in order to hedge exposure to fluctuations in foreign exchange rates in accordance with the Group financial risk management policies (refer to note 24).
(i) Forward exchange contracts - cash flow hedges
The forward exchange contracts in place at 30 June 2013 and 30 June 2012 comprise:
• hedgingofhighlyprobableforecastcontractualforeigncurrencypayments(principallyUSdollarsandIndonesianrupiah)duewithin the next financial year. The contracts are timed to mature when payments are due and will be settled by the delivery of Australian dollars.
• hedgingofhighlyprobableUSdollarreceiptstobereceivedinthenextfinancialyearinrelationtotheprovisionofengineeringservices. The contracts are timed to mature when payments are due and Australian dollars will be received on settlement.
The portion of the gain or loss on the hedging instrument that is determined to be an effective hedge is recognised in other comprehensive income. During the year ended 30 June 2013, losses of $1,799,000 (2012: $4,479,000) were reclassified from other comprehensive income and recognised in profit or loss when the underlying hedged transactions were recognised.
(ii) Derivative financial instrument at fair value through profit or loss - Forge Put Option arrangement
On 15 March 2011, Clough entered into a Put Option agreement (Agreement) with certain Forge management. Under the terms of the Agreement, Clough was required to purchase Option Securities (in total 750,000 Forge shares and 2,500,000 Forge options) at an agreed price ($5.60 per Forge share and $5.25 per Forge option) during specific time periods in 2012, should the option be exercised. On 31 December 2011, the exercise period for the option was extended to 30 June 2012.
Forge management exercised the option on 17 May 2012 resulting in Clough acquiring all the Option Securities for total consideration of $17,325,000.
The Put Option arrangement was accounted for by Clough as being a derivative financial instrument at fair value through profit or loss. Clough recorded a fair value loss on the Put Option arrangement of $1,170,000 in the year ended 30 June 2012 which is included as part of Forge discontinued operations in note 8.
(b) Risk exposures and fair value measurements
Information about the Group’s exposure to credit risk, foreign exchange and interest rate risk and about the methods and assumptions used in determining fair values is provided in note 24. The maximum exposure to credit risk at the end of the reporting period is the carrying amount of each class of derivative financial assets mentioned above.
13 non-current Assets - inVestMents AccounteD For usinG tHe eQuitY MetHoD
2013
$’000
2012
$’000
Investments in associates (note 32) - 101,822
Interest in jointly controlled entities (note 33) 65,233 55,985
65,233 157,807
12 DeriVAtiVe FinAnciAL instruMents (continueD)
30 June 2013
For
per
sona
l use
onl
y

CLOUGH ANNUAL REPORT 201382
14 non-current Assets - propertY, pLAnt AnD eQuipMent
Freehold land and buildings
$’000
Plant and equipment
$’000
Leasehold improvements
$’000
Total
$’000
At 1 July 2011
Cost 391 9,704 14,128 24,223
Accumulated depreciation (55) (733) (1,283) (2,071)
Net book amount 336 8,971 12,845 22,152
Year ended 30 June 2012
Opening net book amount 336 8,971 12,845 22,152
Additions - 4,145 2,389 6,534
Reclassification of leasehold improvements (227) - 227 -
Disposals (98) (603) (1,630) (2,331)
Depreciation charge - (1,711) (1,344) (3,055)
Exchange differences - 5 - 5
Closing net book amount 11 10,807 12,487 23,305
At 30 June 2012
Cost 11 13,678 15,009 28,698
Accumulated depreciation - (2,871) (2,522) (5,393)
Net book amount 11 10,807 12,487 23,305
Year ended 30 June 2013
Opening net book amount 11 10,807 12,487 23,305
Additions - 1,117 1,376 2,493
Acquisition of subsidiary - 86 - 86
Reclassification of leasehold improvements - (595) 595 -
Disposals - (329) (766) (1,095)
Depreciation charge - (1,772) (1,437) (3,209)
Impairment loss (note (c)) - - (3,500) (3,500)
Exchange differences 1 25 31 57
Closing net book amount 12 9,339 8,786 18,137
At 30 June 2013
Cost 12 13,047 16,188 29,247
Accumulated depreciation - (3,708) (7,402) (11,110)
Net book amount 12 9,339 8,786 18,137
(a) Assets in the course of construction
The carrying amounts of the assets disclosed above include expenditure recognised in relation to plant and equipment which is in the course of construction of $479,000 (2012: $76,000).
(b) Non-current assets pledged as security
Refer to note 19 for information on non-current assets pledged as security by the Group.
(c) Impairment loss
An impairment loss of $3,500,000 has been recognised due to the change in intended use of certain leasehold improvements.
notes to tHe consoLiDAteD FinAnciAL stAteMents
30 June 2013
For
per
sona
l use
onl
y

83ENGINEERED FOR PRODUCTIVITY
15 non-current Assets - intAnGiBLe Assets
Goodwill
$’000
Computer software
$’000
Other intangibles
$’000
Total
$’000
At 1 July 2011
Cost - 8,789 - 8,789
Accumulation amortisation - (8,099) - (8,099)
Net book amount - 690 - 690
Year ended 30 June 2012
Opening net book amount - 690 - 690
Additions - 1,279 - 1,279
Amortisation charge - (208) - (208)
Exchange differences - 2 - 2
Closing net book amount - 1,763 - 1,763
At 30 June 2012
Cost - 10,070 - 10,070
Accumulation amortisation - (8,307) - (8,307)
Net book amount - 1,763 - 1,763
Year ended 30 June 2013
Opening net book amount - 1,763 - 1,763
Additions - 950 - 950
Acquisition of business * 5,530 - 2,100 7,630
Disposals - (108) - (108)
Amortisation charge - (679) (500) (1,179)
Exchange differences - 9 - 9
Closing net book amount 5,530 1,935 1,600 9,065
At 30 June 2013
Cost 5,530 10,931 2,100 18,561
Accumulated amortisation - (8,996) (500) (9,496)
Net book amount 5,530 1,935 1,600 9,065
* Goodwill and other intangible assets, comprising customer relationships, arose on the acquisition of e2o Pty Ltd and related entities (e2o) on 31 January 2013 - refer note 30.
(a) Impairment test for goodwill
The goodwill relates to e2o which is a separate cash generating unit (CGU). The recoverable amount of the CGU has been determined at 30 June 2013 based on value-in-use calculations. These calculations use cash flow projections based on financial budgets approved by management covering a period of 5 years. The budgeted gross margin was based on past performance and expectations for the future. The growth rate used is consistent with industry forecasts and a range of discount rates have been used to reflect the specific risks relating to the business in which e2o operates and to stress test the sensitivity of the value-in-use calculations performed. Based on the calculations performed, there was no impairment of the goodwill at 30 June 2013.
30 June 2013
For
per
sona
l use
onl
y

CLOUGH ANNUAL REPORT 201384
16 non-current Assets - DeFerreD tAx Assets
2013
$’000
2012
$’000
The balance comprises temporary differences attributable to:
Tax losses - 20,345
Employee benefits 7,956 6,087
Doubtful debts 180 313
Unrealised foreign exchange gains/losses - 255
Accrued revenue 4,330 2,094
Project accruals/provisions 3,066 2,941
Other accrued expenses 2,917 970
Assessable (deductible) amounts in work in progress 6,532 7,287
Payments received in advance 1,070 1,837
Cash flow hedges 114 733
Equity accounted profits 1,410 -
Other 499 -
Total deferred tax assets 28,074 42,862
Set-off of deferred tax liabilities pursuant to set-off provisions (note 20) (922) (1,521)
Net deferred tax assets 27,152 41,341
Deferred tax assets expected to be recovered within 12 months 10,493 11,317
Deferred tax assets expected to be recovered after more than 12 months 17,581 31,545
28,074 42,862
Movements:
Opening balance 42,862 40,227
Charged/credited:
- to profit or loss - tax losses (utilised)/booked (20,345) 6,216
- to profit or loss - other temporary differences 6,104 (3,021)
- to other comprehensive income (619) (996)
Other movements 72 -
Disposal of business - 436
Closing balance 28,074 42,862
notes to tHe consoLiDAteD FinAnciAL stAteMents
30 June 2013
For
per
sona
l use
onl
y

85ENGINEERED FOR PRODUCTIVITY
17 trADe AnD otHer pAYABLes
2013
$’000
2012
$’000
Current
Trade payables, other creditors and accruals 61,115 33,778
Amounts due to jointly controlled entities 29,539 48,016
Deferred revenue 583 583
91,237 82,377
Non-current
Deferred revenue 4,621 5,205
4,621 5,205
Deferred revenue comprises deferred lease incentive fees.
(a) Risk exposure
Information about the Group’s exposure to foreign exchange risk is provided in note 24.
18 proVisions
2013
$’000
2012
$’000
Current
Employee benefits 27,511 19,638
Other provisions 562 488
28,073 20,126
Non-current
Employee benefits 6,501 5,202
Other provisions 1,862 2,128
8,363 7,330
Other provisions includes make good and onerous lease provisions in respect of leased premises.
(a) Movements in provisions
Movements in each class of provision during the financial year, other than employee benefits, are set out below:
2013
Current other
provisions
$’000
Non-current other
provisions
$’000
Carrying amount at the start of the year 488 2,128
Additional provisions recognised 329 299
Transferred from non-current to current 233 (233)
Amounts used during the year (488) (332)
Carrying amount at end of year 562 1,862
30 June 2013
For
per
sona
l use
onl
y

CLOUGH ANNUAL REPORT 201386
19 FinAncinG ArrAnGeMentsThe Group has no borrowings at 30 June 2013 (2012: $nil).
Bank facilities are provided by a syndicate of banks. Borrowings, bonds and guarantees provided under the banking facilities are secured by fixed, floating and mortgage charges over some of the consolidated entity’s assets. Borrowings, bonds and guarantees provided are repayable immediately if the consolidated entity defaults on payments of interest or principal, or is in breach of a financial undertaking for which no rectification period is granted. Financial undertakings differ between financial institutions and facilities.
(a) Financing arrangements
The Group had access to the following bank facilities at the reporting date:
2013
$’000
2012
$’000
Total facilities *
Borrowings, bonds and guarantees 351,000 357,000
Used at balance date *
Borrowings - -
Bonds and guarantees 218,497 223,065
218,497 223,065
Unused at balance date *
Borrowings, bonds and guarantees 132,503 133,935
Borrowing facilities (included in total facilities above) *
Total facilities 21,000 22,000
Unused at balance date 21,000 22,000
* Included in the total facilities above is a borrowing facility of $20,000,000 (2012: $20,000,000) that forms part of a syndicated facility with a number of banks and may also be utilised when required as a bonds and guarantees facility.
Each party to the Banking Syndicate reviews the facilities provided to Clough Limited at least annually in accordance with their own internal policies and procedures.
(b) Assets pledged as security
The carrying amounts of assets pledged as security for the banking facilities above are as follows:
2013
$’000
2012
$’000
Current
Floating charge
Cash and cash equivalents 432,858 145,095
Trade and other receivables 79,409 96,273
Work in progress 7,124 6,523
Derivative financial instruments 208 2
Assets classified as held for sale 11,335 21,998
Total current assets pledged as security 530,934 269,891
notes to tHe consoLiDAteD FinAnciAL stAteMents
30 June 2013
For
per
sona
l use
onl
y

87ENGINEERED FOR PRODUCTIVITY
(b) Assets pledged as security (continued)
2013
$’000
2012
$’000
Non-current
Floating charge
Trade and other receivables - non-current 2,029 9,686
Investments accounting for using the equity method 65,075 157,651
Property, plant and equipment 17,130 23,305
Intangible assets - computer software 1,845 1,763
Other non-current assets 452 622
Total non-current assets pledged as security 86,531 193,027
Total assets pledged as security 617,465 462,918
20 non-current LiABiLities - DeFerreD tAx LiABiLities
2013
$’000
2012
$’000
The balance comprises temporary differences attributable to:
Depreciable assets 694 844
Other - 677
Unrealised foreign exchange gains/losses 228 -
Total deferred tax liabilities 922 1,521
Set-off of deferred tax liabilities pursuant to set-off provisions (note 16) (922) (1,521)
Net deferred tax liabilities - -
Deferred tax liabilities expected to be settled after more than 12 months 922 1,521
Movements:
Opening balance 1,521 4,043
Charged/credited:
- profit or loss (1,292) (2,522)
Acquisition of subsidiary 693 -
Closing balance 922 1,521
30 June 2013
19 FinAncinG ArrAnGeMents (continueD)
For
per
sona
l use
onl
y

CLOUGH ANNUAL REPORT 201388
21 contriButeD eQuitY
(a) Contributed equity
2013
Shares
2012
Shares
2013
$’000
2012
$’000
Ordinary shares fully paid 777,210,042 774,865,657 233,783 232,614
Treasury shares (note (d)) (542,769) - (594) -
Total contributed equity 776,667,273 774,865,657 233,189 232,614
(b) Movements in ordinary share capital
Date Details NotesNumber of
shares Issue price $’000
1 July 2011 Opening balance 769,801,269 229,792
Issue of shares 1,136,394 $0.79 900
Exercise of options 4,927,994 $0.54 2,660
Shares bought back and cancelled (e) (1,000,000) $0.74 (738)
30 June 2012 Closing balance 774,865,657 232,614
1 July 2012 Opening balance 774,865,657 232,614
Shares issued under Employee Share Plan 523,852 $1.35 706
Exercise of options 2,630,533 $0.52 1,376
Shares bought back and cancelled (e) (810,000) $1.13 (913)
30 June 2013 Closing balance 777,210,042 233,783
(c) Ordinary shares
Ordinary shares entitle the holder to participate in dividends and to one vote per share at meetings of the Company. Ordinary shares participate in the proceeds on winding up of the Company in proportion to the number of and amounts paid on the shares held.
(d) Treasury shares
Treasury shares comprise ordinary fully paid shares in Clough Limited that have been acquired on market under the current share buy-back but had not been cancelled at 30 June 2013.
(e) Share buy-back
During June 2013, the Company purchased on market 1,352,769 ordinary shares (2012: 1,000,000 shares) in order to offset shares expected to be issued as a result of the exercise of options under the Clough Limited Employee Option Plan. The shares were acquired at an average price of $1.1138 per share (2012: $0.7347 per share), with prices ranging from $1.07 to $1.14 (2012: $0.705 to $0.755). The total cost of the share buy-back of $1,507,000 (2012: $738,000), including $15,000 (2012: $3,000) of after tax transaction costs, was deducted from contributed equity.
At 30 June 2013, an on-market share buy-back was in progress as announced to the Australian Securities Exchange on 30 May 2013. The Company’s intention was to buy back a total of 1,648,000 shares over the period 13 June 2013 to 4 July 2013. As at 30 June 2013, a total of 1,352,769 shares had been bought back of which 810,000 had been cancelled.
30 June 2013
notes to tHe consoLiDAteD FinAnciAL stAteMentsF
or p
erso
nal u
se o
nly

89ENGINEERED FOR PRODUCTIVITY
22 reserVes AnD retAineD eArninGs
(a) Reserves
2013
$’000
2012
$’000
Convertible note premium reserve 394 394
Hedging reserve - cash flow hedges (267) (1,710)
Share-based payments reserve 7,389 5,868
Minority buy-back reserve (7,952) (7,952)
Foreign currency translation reserve (3,924) (5,412)
Capital reserve 720 720
(3,640) (8,092)
2013
$’000
2012
$’000
Movements:
Hedging reserve - cash flow hedges
Balance 1 July (1,710) (4,034)
Revaluation - gross 263 (1,159)
Deferred tax (79) 348
Transfer to profit or loss (gross) 1,799 4,479
Deferred tax (540) (1,344)
Balance 30 June (267) (1,710)
Share-based payments reserve
Balance 1 July 5,868 5,146
Option and performance right expense 1,521 722
Balance 30 June 7,389 5,868
Foreign currency translation reserve
Balance 1 July (5,412) (12,844)
Currency translation differences arising during the year 1,573 1,299
Transferred to profit or loss on disposal of controlled and jointly controlled entities during the year (85) 6,133
Balance 30 June (3,924) (5,412)
30 June 2013
For
per
sona
l use
onl
y

CLOUGH ANNUAL REPORT 201390
(b) Retained earnings
Movements in retained earnings were as follows:
2013
$’000
2012
$’000
Balance 1 July 125,023 99,061
Net profit for the year 127,414 42,898
Dividends (20,153) (16,936)
Balance 30 June 232,284 125,023
(c) Nature and purpose of reserves
(i) Convertible note premium reserve
The convertible note premium reserve is used to record the equity conversion component of the convertible notes that were issued on 15 December 2006 and the associated deferred tax liability.
(ii) Hedging reserve - cash flow hedges
The hedging reserve is used to record gains or losses on a hedging instrument in a cash flow hedge that are recognised in other comprehensive income, as described in note 1(n). Amounts are reclassified to profit or loss when the associated hedged transaction affects profit or loss.
(iii) Share-based payments reserve
The share-based payments reserve is used to recognise the grant date fair value of options and performance rights issued to employees but not exercised.
(iv) Minority buy-back reserve
The minority buy-back reserve arose on the acquisition of a 70% interest in Ocean Flow International LLC on 14 August 2009 and comprises the fair value of the estimated consideration for acquiring the non-controlling interest from the minority shareholder at that date.
(v) Foreign currency translation reserve
Exchange differences arising on translation of foreign entities are recognised in other comprehensive income as described in note 1(c) and accumulated in the foreign currency translation reserve within equity. The cumulative amount is reclassified to profit or loss when the net investment in a foreign entity is disposed of.
23 DiViDenDs
(a) Ordinary shares
2013
$’000
2012
$’000
Final dividend for the year ended 30 June 2012 of 2.6 cents (2011: 2.2 cents) per fully paid share paid on 5 October 2012
Franked to 25% based on tax paid @ 30% (2011: franked to 45%) 20,153 16,936
(b) Franking credits
2013
$’000
2012
$’000
Franking credits available for subsequent reporting periods based on a tax rate of 30% (2012: 30%) 44,742 2,325
The above amount represents the balance of the franking account as at the end of the reporting period, adjusted for:
(a) franking credits that will arise from the payment of the amount of the provision for income tax
(b) franking debits that will arise from the payment of dividends recognised as a liability at the reporting date, and
(c) franking credits that will arise from the receipt of dividends recognised as receivables at the reporting date.
The franking account balance excludes franking credits that will arise on income tax instalments to be paid during the year ended 30 June 2014.
30 June 2013
22 reserVes AnD retAineD eArninGs (continueD)
notes to tHe consoLiDAteD FinAnciAL stAteMentsF
or p
erso
nal u
se o
nly

91ENGINEERED FOR PRODUCTIVITY
24 FinAnciAL risK MAnAGeMentThe Group’s principal financial instruments comprise trade and other receivables, trade and other payables, cash and short term bank deposits and derivatives.
The Group manages its exposure to key financial risks in accordance with the Group’s financial risk management policies, the objective of which is to support the delivery of the Group’s financial plan. Financial risk comprises market risk (including currency risk and interest rate risk), credit risk and liquidity risk.
The Group enters into derivative transactions, principally forward currency contracts, the purpose of which is to manage the currency risks arising from the Group’s operations. Trading in derivatives is not undertaken by the Group. The main risks arising from the Group’s financial instruments are interest rate risk, foreign currency risk, price risk, credit risk and liquidity risk. The Group uses a number of methods to measure and manage these different types of risks. These include monitoring levels of exposure to interest rate and foreign exchange risk and assessments of market forecasts for interest and foreign exchange rates. Ageing analyses and monitoring is undertaken to manage credit risk. Liquidity risk is monitored through regularly updated cash flow forecasts.
Primary responsibility for identification and control of financial risks rests with the Audit & Risk Committee under the authority of the Board.
(a) Market risk
(i) Foreign exchange risk
The Group operates internationally and is exposed to foreign exchange risk arising from various currency exposures, primarily with respect to the US dollar.
Foreign exchange risk arises when future commercial transactions and recognised assets and liabilities are denominated in a currency that is not the entity’s functional currency. The Group seeks to mitigate the effect of its foreign currency exposure primarily through natural hedging where the currencies in which project revenues are received are matched against the currencies in which costs are incurred. Where this is not achievable, the Group uses forward currency contracts to mitigate exposures on significant committed transactions. It is the Group’s policy not to enter into forward contracts until a firm commitment is in place and to negotiate the transaction to establish an effective hedge. The net result of operations with a functional currency other than Australian dollars is not hedged.
The Group also has transactional currency exposures. Such exposure arises from sales or purchases by an operating entity in currencies other than the functional currency.
The Group’s exposure to foreign currency risk in respect of US dollars at the end of the reporting period, expressed in Australian dollars, is as follows:
30 June 2013 30 June 2012
$’000 $’000
Cash and cash equivalents 14,721 7,832
Trade and other receivables 10,034 6,689
Trade and other payables (10,079) (3,197)
Forward exchange contracts
- buy foreign currency (cash flow hedges) 4,915 4,931
- sell foreign currency (cash flow hedges) (744) (7,292)
Sensitivity
At 30 June 2013, had the Australian dollar weakened/strengthened by 10% (2012: 10%) against the US dollar with all other variables held constant, the Group’s post tax profit for the year would have been $1,977,000 higher / $1,618,000 lower (2012: $1,465,000 higher / $1,198,000 lower) and equity would have been $111,000 higher / $91,000 lower (2012: $495,000 lower / $911,000 higher).
The Group’s exposure to foreign exchange risk in respect of other currencies is not material.
30 June 2013
For
per
sona
l use
onl
y

CLOUGH ANNUAL REPORT 201392
(a) Market risk (continued)
(ii) Interest rate risk
The Group has cash and cash equivalents at 30 June 2013 of $441,228,000 (2012: $146,511,000) which comprises cash at bank and on hand and bank deposits at call.
Cash at bank and on hand and deposits at call includes an amount of $68,107,000 (2012: $48,760,000) bearing floating interest rates with a weighted average rate of 1.38% (2012: 2.91%).
Bank deposits at call of $352,449,000 (2012: $80,299,000) include deposits bearing fixed interest rates of $348,504,000 (2012: $80,299,000) with a weighted average interest rate of 3.94% (2012: 5.01%).
The Group’s current and non-current receivables are non-interest bearing apart from a current loan with a gross value of $2,235,000 (2011: non-current $2,122,000) which carries interest at the rate of the AUD 90 day bank bill swap reference rate plus a 2% margin (2012: 3.3% margin) - the interest rate at 30 June 2013 was 5.05% (2012: 6.26%).
Sensitivity
At 30 June 2013, if interest rates had changed by +/ 100 basis points from the year end rates with all other variables held constant, post tax profit for the year would have been $492,000 higher / lower (2012: $356,000 higher / lower). As at 30 June 2013 and 30 June 2012, the Group only had interest bearing financial assets that were at a variable rate of interest.
(b) Credit risk
Credit risk arises from the financial assets of the Group, which comprise cash and cash equivalents, trade and other receivables and derivative instruments. The Group’s exposure to credit risk arises from potential default of the counter party, with a maximum exposure equal to the carrying amount of these instruments. Exposure at balance sheet date is addressed in each applicable note.
It is the Group’s policy that all customers who wish to trade on credit terms are subject to credit verification procedures including an assessment of their independent credit rating, financial position, past experience and industry reputation.
There are no significant concentrations of credit risk within the Group and financial instruments are spread amongst a number of financial institutions to minimise the risk of default of counterparties.
(c) Liquidity risk
Liquidity risk is the risk that the Group will not be able to meet its financial obligations as and when they fall due. The Group manages liquidity risk by maintaining adequate cash reserves and banking facilities and by continuously monitoring actual and forecast cashflows.
The Group has no borrowings and a summary of the Group’s undrawn borrowing facilities are disclosed in note 19.
Maturities of financial liabilities
The Group’s financial liabilities comprise trade and other payables and gross settled derivatives (forward exchange contracts - cash flow hedges). The contractual maturities of the Group’s financial liabilities are all due within one year.
(d) Fair value measurements
The fair value of financial assets and financial liabilities must be estimated for recognition and measurement or for disclosure purposes.
All financial assets and financial liabilities, with the exception of derivatives, are initially recognised at the fair value of the consideration paid or received, net of directly attributable transaction costs. Subsequently, the financial assets and financial liabilities, other than derivatives, are measured at amortised cost. The carrying value of the financial assets and liabilities approximate their fair values.
AASB 7 Financial Instruments: Disclosures requires disclosure of fair value measurements by level of the following fair value measurement hierarchy:
(a) quoted prices (unadjusted) in active markets for identical assets or liabilities (level 1)
(b) inputs other than quoted prices included within level 1 that are observable for the asset or liability, either directly (as prices) or indirectly (derived from prices) (level 2), and
(c) inputs for the asset or liability that are not based on observable market data (unobservable inputs) (level 3).
The fair value of the Group’s derivatives used for hedging are categorised as Level 2.
30 June 2013
24 FinAnciAL risK MAnAGeMent (continueD)
notes to tHe consoLiDAteD FinAnciAL stAteMentsF
or p
erso
nal u
se o
nly

93ENGINEERED FOR PRODUCTIVITY
30 June 2013
25 KeY MAnAGeMent personneL DiscLosures
(a) Key management personnel compensation
2013
$
2012
$
Short-term employee benefits 5,991,335 5,966,778
Post-employment benefits 316,301 382,817
Termination benefits - 947,311
Share-based payments 671,160 628,724
6,978,796 7,925,630
Detailed remuneration disclosures are provided in the Remuneration Report included in the Directors’ Report.
(b) Equity instrument disclosures relating to key management personnel
(i) Options, performance rights and shares provided as remuneration
Details of options over ordinary shares, performance rights and shares in the Company provided as remuneration to each director of Clough Limited and other key management personnel of the Group are set out in the Remuneration Report included in the Directors’ Report. Further information on share-based payments is set out in note 38.
(ii) Options holdings
The number of options over ordinary shares in the Company granted under the Clough Limited Employee Option Plan that were held during the financial year by each Director of Clough Limited and other key management personnel of the Group, including their personally related parties, are set out below.
2013 Name
Balance at start of the year
Granted as compensation
Exercised in year
Other changes
Balance at end of the year
Vested and exercisable Unvested
KT Gallagher 687,185 707,035 - - 1,394,220 - 1,394,220
NE Siford 672,715 250,217 (20,000) - 902,932 144,185 758,747
MCG Bergomi 1,370,161 211,555 - - 1,581,716 1,000,000 581,716
GN Bowtell 382,808 204,713 - - 587,521 - 587,521
RW Robinson 783,913 250,217 - - 1,034,130 - 1,034,130
2012 Name
Balance at start of the year
Granted as compensation
Exercised in year
Other changes #
Balance at end of the year
Vested and exercisable Unvested
KT Gallagher - 687,185 - - 687,185 - 687,185
NE Siford 305,549 367,166 - - 672,715 164,185 508,530
J Smith 3,000,000 - - (3,000,000) - - -
MCG Bergomi 1,160,717 209,444 - - 1,370,161 660,000 710,161
GN Bowtell 175,671 207,137 - - 382,808 - 382,808
WJ Boyle 3,653,818 - - (3,653,818) - - -
All vested options are exercisable at the end of the year.
# The option holdings for key management personnel who ceased employment with the Clough Group during the year have been removed in other changes at the date that they ceased employment.
For
per
sona
l use
onl
y

CLOUGH ANNUAL REPORT 201394
(b) Equity instrument disclosures relating to key management personnel (continued)
(iii) Performance rights holdings
The number of performance rights over ordinary shares in the Company granted under the Clough Limited Executive Incentive Scheme that were held during the financial year by each Director of Clough Limited and other key management personnel of the Group, including their personally related parties, are set out below.
2013 Name
Balance at start of the year
Granted as compensation Vested in year
Other changes
Balance at end of the year
NE Siford - 305,885 - - 305,885
MCG Bergomi 305,885 - - - 305,885
GN Bowtell 305,885 - - - 305,885
RW Robinson - 568,182 - - 568,182
2012 Name
Balance at start of the year
Granted as compensation Vested in year
Other changes
Balance at end of the year
MCG Bergomi - 305,885 - - 305,885
GN Bowtell - 305,885 - - 305,885
(iv) Share holdings
The number of shares in the Company held during the financial year by each Director of Clough Limited and other key management personnel of the Group, including their personally related parties, are set out below.
2013 Name
Balance at start of the year
Granted as compensation
Received on the exercise of
optionsOther
changesBalance at end
of the year
AJ Bester and HJ Laas through Murray & Roberts Limited ^ 478,957,478 - - - 478,957,478
KT Gallagher 1,136,394 - - - 1,136,394
NE Siford - - 20,000 - 20,000
ER Stein 74,900 - - - 74,900
2012 Name
Balance at start of the year
Granted as compensation
Received on the exercise of
optionsOther
changes #Balance at end
of the year
AJ Bester and HJ Laas through Murray & Roberts Limited ^ 478,957,478 - - - 478,957,478
KT Gallagher - 1,136,394 - - 1,136,394
J Smith 3,000,000 - - (3,000,000) -
ER Stein 74,900 - - - 74,900
^ AJ Bester and HJ Laas are directors of Murray & Roberts Holdings Limited whose related entities hold shares in Clough Limited through Murray & Roberts Limited.
# The share holdings for key management personnel who ceased employment with the Clough Group have been removed in other changes during the year at the date that they ceased employment.
(c) Other transactions with key management personnel
For details of transactions with director related entities refer to note 29.
30 June 2013
25 KeY MAnAGeMent personneL DiscLosures (continueD)
notes to tHe consoLiDAteD FinAnciAL stAteMentsF
or p
erso
nal u
se o
nly
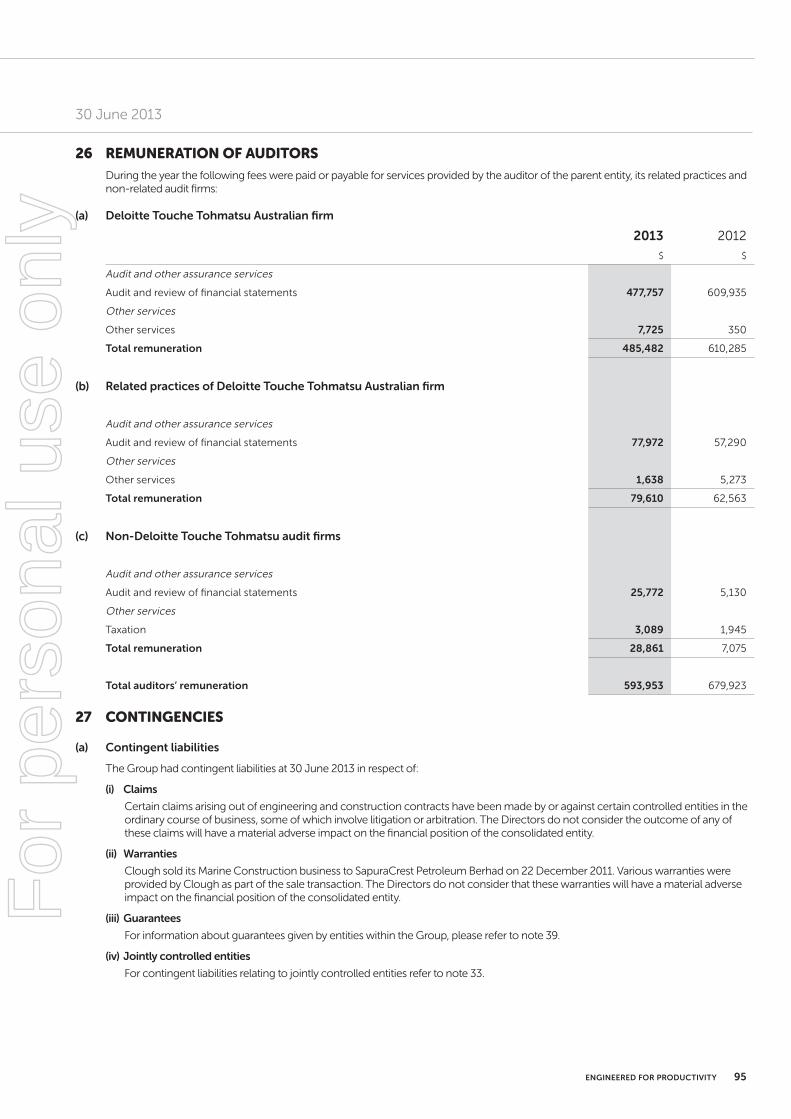
95ENGINEERED FOR PRODUCTIVITY
26 reMunerAtion oF AuDitorsDuring the year the following fees were paid or payable for services provided by the auditor of the parent entity, its related practices and non-related audit firms:
(a) Deloitte Touche Tohmatsu Australian firm
2013
$
2012
$
Audit and other assurance services
Audit and review of financial statements 477,757 609,935
Other services
Other services 7,725 350
Total remuneration 485,482 610,285
(b) Related practices of Deloitte Touche Tohmatsu Australian firm
Audit and other assurance services
Audit and review of financial statements 77,972 57,290
Other services
Other services 1,638 5,273
Total remuneration 79,610 62,563
(c) Non-Deloitte Touche Tohmatsu audit firms
Audit and other assurance services
Audit and review of financial statements 25,772 5,130
Other services
Taxation 3,089 1,945
Total remuneration 28,861 7,075
Total auditors’ remuneration 593,953 679,923
27 continGencies
(a) Contingent liabilities
The Group had contingent liabilities at 30 June 2013 in respect of:
(i) Claims
Certain claims arising out of engineering and construction contracts have been made by or against certain controlled entities in the ordinary course of business, some of which involve litigation or arbitration. The Directors do not consider the outcome of any of these claims will have a material adverse impact on the financial position of the consolidated entity.
(ii) Warranties
Clough sold its Marine Construction business to SapuraCrest Petroleum Berhad on 22 December 2011. Various warranties were provided by Clough as part of the sale transaction. The Directors do not consider that these warranties will have a material adverse impact on the financial position of the consolidated entity.
(iii) Guarantees For information about guarantees given by entities within the Group, please refer to note 39.
(iv) Jointly controlled entities
For contingent liabilities relating to jointly controlled entities refer to note 33.
30 June 2013
For
per
sona
l use
onl
y

CLOUGH ANNUAL REPORT 201396
28 coMMitMents
(a) Capital commitments
Capital expenditure contracted for at the reporting date but not recognised as liabilities is as follows:
2013
$’000
2012
$’000
Property, plant and equipment 279 349
(b) Lease commitments: group as lessee
Non-cancellable operating leases
2013
$’000
2012
$’000
Commitments for minimum lease payments in relation to non-cancellable operating leases are payable as follows:
Within one year 26,331 28,453
Later than one year but not later than five years 84,121 90,080
Later than five years 76,460 93,940
186,912 212,473
29 reLAteD pArtY trAnsActions
(a) Parent entities
The ultimate Australian parent entity within the Group is Clough Limited. The ultimate parent entity and ultimate controlling party is Murray & Roberts Holdings Limited, a company incorporated in South Africa, which at 30 June 2013 has an interest in 61.67% (2012: 61.81%) of the issued ordinary shares of Clough Limited.
(b) Subsidiaries
Interests in subsidiaries are set out in note 31.
(c) Key management personnel
Disclosures relating to key management personnel are set out in note 25.
(d) Other transactions with key management personnel or entities related to them
Information on transactions with key management personnel or entities related to them, other than compensation, are set out below.
Other transactions and balances with ultimate parent entity and related entities
Dividend paid
On 5 October 2012, Clough Limited paid a dividend of $0.026 per fully paid ordinary share franked to 25%, based on tax paid of 30%. A dividend of $12,452,894 was paid to Murray & Roberts Limited.
Rent paid
During the year ended 30 June 2013, Murray & Roberts Australia Pty Ltd paid $410,288 to Clough Projects Pty Ltd for sub-leasing certain rental properties.
Travel expenses
During the year ended 30 June 2013, Clough Limited paid $106,144 to Murray & Roberts Limited for travel expenses incurred in respect of AJ Bester, HJ Laas and IW Henstock attending to their duties as directors of Clough Limited.
30 June 2013
notes to tHe consoLiDAteD FinAnciAL stAteMentsF
or p
erso
nal u
se o
nly

97ENGINEERED FOR PRODUCTIVITY
(e) Transactions with other related parties
The following transactions occurred with related parties:
2013
$
2012
$
Provision of goods and services to equity accounted entities
Associates 2,049,360 2,383,853
Jointly controlled entities 482,376,730 377,764,659
484,426,090 380,148,512
Provision of goods and services by equity accounted entities
Jointly controlled entities - 2,723,534
Superannuation contributions
Contributions to superannuation funds on behalf of employees 18,522,330 13,537,519
(f) Outstanding balances
The following balances are outstanding at the end of the reporting period in relation to transactions with related parties:
2013
$
2012
$
Current receivables (provision of goods and services)
Associates - 635,844
Jointly controlled entities 53,276,995 75,592,662
53,276,995 76,228,506
Current receivables (loans)
Jointly controlled entities - 1,312,429
Current payables
Jointly controlled entities 4,326,380 2,323,338
Current payables (loans)
Jointly controlled entities 9,034,510 32,085,924
Current payables (advances)
Jointly controlled entities 25,062,187 20,487,406
There is no allowance account for impaired receivables in relation to any outstanding balances, and no expense has been recognised in respect of impaired receivables due from related parties apart from an impairment loss recognised in relation to a loan to a jointly controlled entity of $69,842 (2012: $nil) which is in the process of being wound up.
30 June 2013
29 reLAteD pArtY trAnsActions (continueD)
For
per
sona
l use
onl
y

CLOUGH ANNUAL REPORT 201398
(g) Loans to/from related parties
2013
$
2012
$
Loans to associates
Beginning of the year - 3,709,364
Loans advanced - 3,000,000
Removed on disposal of associates - (6,792,827)
Exchange differences - 83,463
End of year - -
Loans to jointly controlled entities
Beginning of the year 1,312,429 11,926,755
Loans advanced 1,540,745 3,512,429
Loans repayments made (2,783,332) (2,200,000)
Impairment losses recognised (69,842) -
Removed on disposal of jointly controlled entities - (12,162,716)
Exchange differences - 235,961
End of year - 1,312,429
Loans from jointly controlled entities
Beginning of the year 32,085,924 8,952,322
Loans advanced 49,987,620 35,426,847
Loans repayments made (73,038,665) (12,295,539)
Exchange differences (369) 2,294
End of year 9,034,510 32,085,924
notes to tHe consoLiDAteD FinAnciAL stAteMents
30 June 2013
29 reLAteD pArtY trAnsActions (continueD)
For
per
sona
l use
onl
y
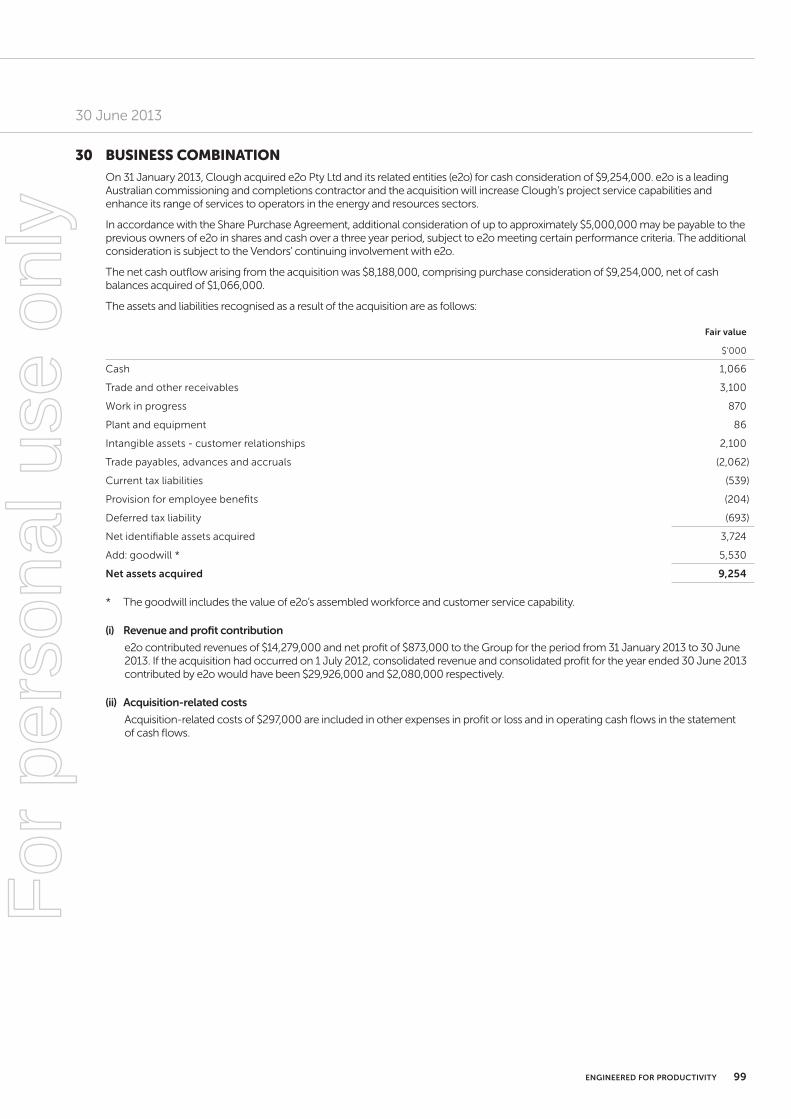
99ENGINEERED FOR PRODUCTIVITY
30 Business coMBinAtion On 31 January 2013, Clough acquired e2o Pty Ltd and its related entities (e2o) for cash consideration of $9,254,000. e2o is a leading Australian commissioning and completions contractor and the acquisition will increase Clough’s project service capabilities and enhance its range of services to operators in the energy and resources sectors.
In accordance with the Share Purchase Agreement, additional consideration of up to approximately $5,000,000 may be payable to the previous owners of e2o in shares and cash over a three year period, subject to e2o meeting certain performance criteria. The additional consideration is subject to the Vendors’ continuing involvement with e2o.
The net cash outflow arising from the acquisition was $8,188,000, comprising purchase consideration of $9,254,000, net of cash balances acquired of $1,066,000.
The assets and liabilities recognised as a result of the acquisition are as follows:
Fair value
$’000
Cash 1,066
Trade and other receivables 3,100
Work in progress 870
Plant and equipment 86
Intangible assets - customer relationships 2,100
Trade payables, advances and accruals (2,062)
Current tax liabilities (539)
Provision for employee benefits (204)
Deferred tax liability (693)
Net identifiable assets acquired 3,724
Add: goodwill * 5,530
Net assets acquired 9,254
* The goodwill includes the value of e2o’s assembled workforce and customer service capability.
(i) Revenue and profit contribution
e2o contributed revenues of $14,279,000 and net profit of $873,000 to the Group for the period from 31 January 2013 to 30 June 2013. If the acquisition had occurred on 1 July 2012, consolidated revenue and consolidated profit for the year ended 30 June 2013 contributed by e2o would have been $29,926,000 and $2,080,000 respectively.
(ii) Acquisition-related costs
Acquisition-related costs of $297,000 are included in other expenses in profit or loss and in operating cash flows in the statement of cash flows.
30 June 2013
For
per
sona
l use
onl
y

CLOUGH ANNUAL REPORT 2013100
31 suBsiDiAries
(a) Significant investments in subsidiaries
The consolidated financial statements incorporate the assets, liabilities and results of the following principal subsidiaries in accordance with the accounting policy described in note 1(b):
Equity holding and ownership interest
Name of entity Country of incorporation
2013
%
2012
%
Clough Engineering & Integrated Solutions (CEIS) Pty Ltd Australia 100 100
Clough Niugini Limited Papua New Guinea 100 100
Clough Operations Pty Ltd Australia 100 100
Clough Project Holdings Pty Ltd Australia 100 100
Clough Projects Australia Pty Ltd Australia 100 100
Clough Projects International Pty Ltd Australia 100 100
Clough Projects Pty Ltd Australia 100 100
Clough Seam Gas Pty Ltd Australia 100 100
e2o Pty Ltd Australia 100 -
(b) Acquisition and disposal of subsidiaries
(i) Acquisition of subsidiaries
On 31 January 2013, Clough acquired e2o Pty Ltd and related entities as disclosed in note 30.
There were no acquisitions of subsidiaries in the prior year.
(ii) Disposal of subsidiaries
There were no disposals of subsidiaries in the current year.
In the prior year, Clough sold its Marine Construction business to SapuraCrest Petroleum Berhad on 22 December 2011. The following subsidiaries were disposed of as a result of this sale:
• CloughJavaOffshorePteLtd
• CloughSeaTrucksJointVenture-DomGas
• CloughSingaporeConstructorPteLtd
• CloughUSAHoldingsInc.
• OceanFlowInternationalLLC
• RemCloughPtyLtd
• SCProjectsAustraliaPtyLtd
For further details on the sale of the Marine Construction business, refer to note 8.
notes to tHe consoLiDAteD FinAnciAL stAteMents
30 June 2013
For
per
sona
l use
onl
y

101ENGINEERED FOR PRODUCTIVITY
32 inVestMents in AssociAtesInvestments in associates comprise Clough’s investment in Forge, an Australian listed company.
(a) Movements in carrying amounts of investments in associates
2013
$’000
2012
$’000
Carrying amount at the beginning of the financial year 101,822 72,529
Share of profits after income tax 17,530 16,809
Interests in associates acquired - 18,200
Fair value loss on Forge Put Option securities exercised in year - (1,625)
Dividends received (5,561) (3,732)
Unrealised gain on sale of land to associate - (359)
Interests in associates sold (113,791) -
Carrying amount at the end of the financial year - 101,822
(b) Summarised financial information of associates
The Group’s share of the results of Forge and its aggregated assets (including goodwill) and liabilities are as follows:
Group’s share of:
Ownership Interest
%
Assets
$’000
Liabilities
$’000
Revenues
$’000
Profit
$’000
2013 (to date of disposal)
Forge - - - 349,538 17,529
2012
Forge 35.85 214,777 112,955 259,547 16,809
(c) Fair value of listed investments in associates
2013
$’000
2012
$’000
Forge - 135,002
30 June 2013
For
per
sona
l use
onl
y
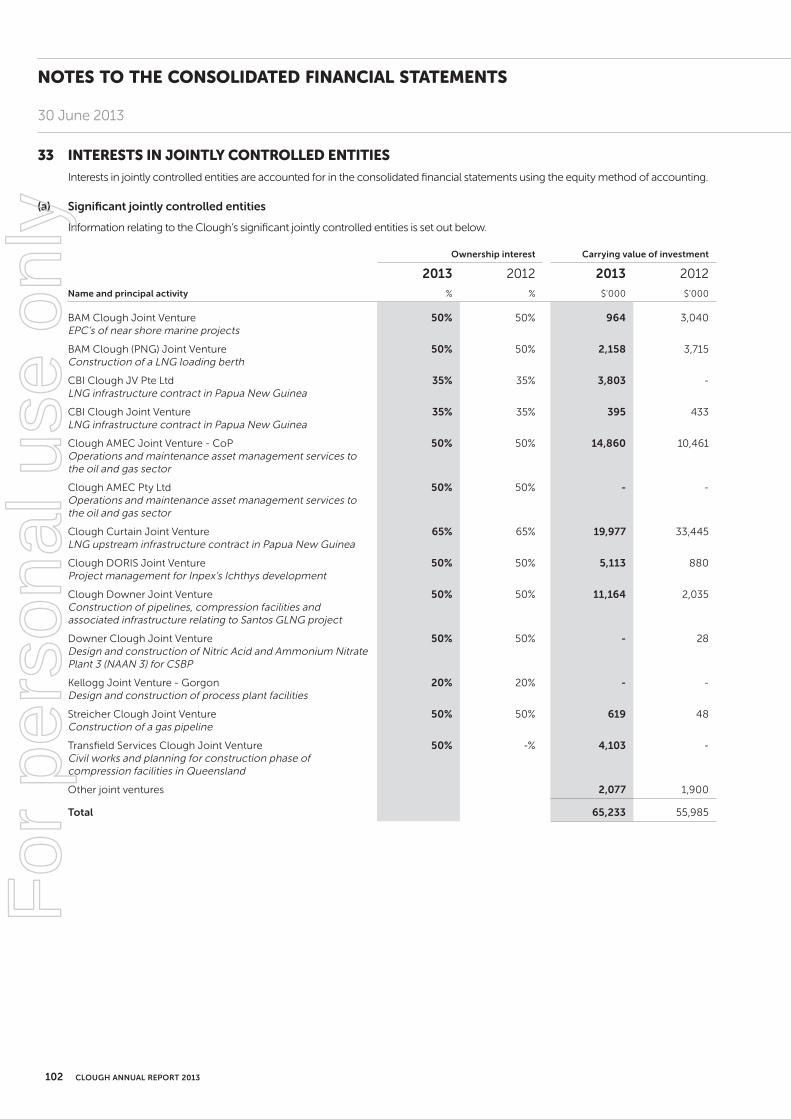
CLOUGH ANNUAL REPORT 2013102
33 interests in jointLY controLLeD entitiesInterests in jointly controlled entities are accounted for in the consolidated financial statements using the equity method of accounting.
(a) Significant jointly controlled entities
Information relating to the Clough’s significant jointly controlled entities is set out below.
Ownership interest Carrying value of investment
Name and principal activity
2013
%
2012
%
2013
$’000
2012
$’000
BAM Clough Joint Venture EPC’s of near shore marine projects
50% 50% 964 3,040
BAM Clough (PNG) Joint Venture Construction of a LNG loading berth
50% 50% 2,158 3,715
CBI Clough JV Pte Ltd LNG infrastructure contract in Papua New Guinea
35% 35% 3,803 -
CBI Clough Joint Venture LNG infrastructure contract in Papua New Guinea
35% 35% 395 433
Clough AMEC Joint Venture - CoP Operations and maintenance asset management services to the oil and gas sector
50% 50% 14,860 10,461
Clough AMEC Pty Ltd Operations and maintenance asset management services to the oil and gas sector
50% 50% - -
Clough Curtain Joint Venture LNG upstream infrastructure contract in Papua New Guinea
65% 65% 19,977 33,445
Clough DORIS Joint Venture Project management for Inpex’s Ichthys development
50% 50% 5,113 880
Clough Downer Joint Venture Construction of pipelines, compression facilities and associated infrastructure relating to Santos GLNG project
50% 50% 11,164 2,035
Downer Clough Joint Venture Design and construction of Nitric Acid and Ammonium Nitrate Plant 3 (NAAN 3) for CSBP
50% 50% - 28
Kellogg Joint Venture - Gorgon Design and construction of process plant facilities
20% 20% - -
Streicher Clough Joint Venture Construction of a gas pipeline
50% 50% 619 48
Transfield Services Clough Joint Venture Civil works and planning for construction phase of compression facilities in Queensland
50% -% 4,103 -
Other joint ventures 2,077 1,900
Total 65,233 55,985
notes to tHe consoLiDAteD FinAnciAL stAteMents
30 June 2013
For
per
sona
l use
onl
y

103ENGINEERED FOR PRODUCTIVITY
(b) Movements in carrying amounts of investments in jointly controlled entities
2013
$’000
2012
$’000
Movements in carrying amounts of investments in jointly controlled entities
Carrying amount at the beginning of the financial year 55,985 31,621
Contributions (repaid) made (1,439) 5,912
Share of profits after income tax 83,056 52,798
Dividends and distributions received (84,529) (25,167)
Other movements 775 (2,426)
Share of movements in reserves 2,062 3,370
Reclassification of negative equity accounted investment balances against other components of interests in jointly controlled entities 8,551 (10,134)
Exchange differences 772 11
Carrying amount at the end of the financial year 65,233 55,985
(c) Additional information on jointly controlled entities
2013
$’000
2012
$’000
Share of jointly controlled entities’ assets and liabilities
Current assets 372,081 322,784
Non-current assets 14,263 3,002
Total assets 386,344 325,786
Current liabilities 320,493 269,801
Non-current liabilities 618 -
Total liabilities 321,111 269,801
Net assets 65,233 55,985
Share of jointly controlled entities’ revenue, expenses and results
Revenue 1,272,689 761,208
Expenses (1,188,906) (707,919)
Income tax (727) (491)
Profit after income tax 83,056 52,798
Share of jointly controlled entities’ commitments
Commitments for minimum lease payments in relation to non-cancellable operating leases are payable as follows:
Within one year 3,361 11,969
Later than one year but not later than five years 1,717 3,244
More than 5 years 268 -
5,346 15,213
Capital commitments 13,150 -
30 June 2013
33 interests in jointLY controLLeD entities (continueD)
For
per
sona
l use
onl
y

CLOUGH ANNUAL REPORT 2013104
34 eVents occurrinG AFter tHe reportinG perioDNo matters or circumstances have arisen since the end of the financial year, which significantly affected or may significantly affect the operations of the consolidated entity, the results of those operations, or the state of affairs of the consolidated entity in periods subsequent to the year ended 30 June 2013, apart from the matters noted below.
On 31 July 2013, Clough announced that it had received a conditional proposal (the “Proposal”) from its major shareholder, Murray & Roberts Holdings Limited (“Murray & Roberts”) to acquire all the outstanding shares in Clough that it does not already own for consideration of $1.46 per share. The Proposal allows for the offer price of $1.46 to comprise a cash payment by Murray & Roberts of $1.32 and the payment by Clough of a dividend of $0.14 per share. The Proposal is conditional upon satisfactory completion of due diligence, execution of a scheme implementation agreement, final Murray & Roberts board approval and unanimous recommendation by Clough’s independent directors in support of the transaction.
Clough is currently working with Murray & Roberts to enter into a binding scheme implementation agreement and for the transaction to be put to shareholders.
Following the announcement of the Proposal by Murray & Roberts to acquire all the outstanding shares in Clough that it does not already own at $1.46 cash per share (which includes the payment of a dividend of $0.14 per share which is expected to be fully franked), Clough has decided not to determine a final dividend at the present time.
The proposed record date and payment date for the dividend will be notified to shareholders along with full details of the Proposal in due course. If the Proposal does not proceed, Clough will review its determination regarding the payment of a dividend.
35 reconciLiAtion oF proFit AFter incoMe tAx to net cAsH inFLoW FroM operAtinG ActiVities
2013
$’000
2012
$’000
Profit for the year 127,414 43,222
Depreciation and amortisation 4,388 3,263
Non-cash employee benefits expense - share-based payments 1,874 1,622
Impairment losses 4,170 -
Impairment of property development inventories classified as held for sale 960 6,828
Net loss (gain) on disposal of property, plant and equipment 863 (1,027)
Net loss on sale of assets classified as held for sale 327 1,202
Fair value loss on Forge Put Option securities - 1,170
Gain on sale of Forge (37,262) -
Gain on sale of the Marine Construction business - (5,849)
Difference between equity accounted profits of associates and jointly controlled entities and dividends or distributions received (10,496) (39,288)
Interest income (7,344) (3,585)
Net exchange differences and other non-cash items (1,828) (4,012)
Change in operating assets and liabilities, net of effects from purchase/sale of controlled entities:
Decrease (increase) in trade and other receivables (562) (54,166)
Decrease (increase) in work in progress (5,852) 4,859
Increase (decrease) in trade and other payables 23,042 11,583
Increase (decrease) in amounts due to customers for contract work 18,126 28,593
Increase (decrease) in provision for income taxes payable 16,763 7,536
Increase (decrease) in other provisions 9,747 9,219
Net cash inflow from operating activities 144,330 11,170
notes to tHe consoLiDAteD FinAnciAL stAteMents
30 June 2013
For
per
sona
l use
onl
y

105ENGINEERED FOR PRODUCTIVITY
36 non-cAsH inVestinG AnD FinAncinG ActiVities
2013
$’000
2012
$’000
Acquisition of property, plant and equipment on surrender of lease - 1,853
Issue of shares in Clough Limited 353 900
37 eArninGs per sHAre
(a) Basic earnings per share
2013
Cents
2012
Cents
From continuing operations attributable to the ordinary equity holders of the Company 9.52 4.55
From discontinued operations 6.90 1.01
Total basic earnings per share attributable to the ordinary equity holders of the Company 16.42 5.56
(b) Diluted earnings per share
2013
Cents
2012
Cents
From continuing operations attributable to the ordinary equity holders of the Company 9.48 4.53
From discontinued operations 6.86 1.01
Total diluted earnings per share attributable to the ordinary equity holders of the Company 16.34 5.54
(c) Reconciliation of earnings used in calculating earnings per share
2013
$’000
2012
$’000
Basic and diluted earnings per share
Profit attributable to the ordinary equity holders of the Company used in calculating basic and diluted earnings per share:
From continuing operations 73,910 35,093
From discontinued operations 53,504 8,129
Profit from discontinued operations attributable to non-controlling interests - (324)
Profit attributable to the ordinary equity holders of the Company used in calculating basic and diluted earnings per share 127,414 42,898
(d) Weighted average number of shares used as denominator
2013
Number
2012
Number
Weighted average number of ordinary shares used as the denominator in calculating basic earnings per share 775,965,580 771,240,439
Adjustments for calculation of diluted earnings per share:
Options and performance rights 3,809,563 2,832,204
Weighted average number of ordinary and potential ordinary shares used as the denominator in calculating diluted earnings per share 779,775,143 774,072,643
30 June 2013
For
per
sona
l use
onl
y

CLOUGH ANNUAL REPORT 2013106
(e) Information on the classification of securities
(i) Options and performance rights
Options granted to employees under the Clough Limited Employee Option Plan and performance rights granted to executives under the Clough Limited Executive Incentive Scheme are considered to be potential ordinary shares and have been included in the determination of diluted earnings per share to the extent to which they are dilutive. The options and performance rights have not been included in the determination of basic earnings per share.
38 sHAre-BAseD pAYMents
(a) Employee Option Plan
Options are granted under the Clough Limited Employee Option Plan (Plan) which was approved by shareholders at the Annual General Meeting of the Company held on 16 November 1998 and amended at the Company’s Annual General Meetings held on 23 November 2007, 28 October 2009 and 18 October 2011.
The following are the key aspects of the long term incentive scheme:
The Board determines the eligibility of executives and their entitlement having regard to, amongst other things, the performance and future potential contribution of each executive. Participation by executive directors is subject to shareholder approval.
The number of options granted to an employee is determined by the employee’s base salary, the employment band and the notional value of each option at the date of grant.
Under the current policy, the vesting period is three years and the options will only vest if total shareholder return (TSR) and earnings per share (EPS) hurdles are met.
Set out below are summaries of options granted under the Plan:
30 June 2013
37 eArninGs per sHAre (continueD)
notes to tHe consoLiDAteD FinAnciAL stAteMentsF
or p
erso
nal u
se o
nly

107ENGINEERED FOR PRODUCTIVITY
(a) Employee Option Plan
Grant date
Expiry date
Exercise price
Balance at start of
the year
Granted during
the year
Exercised during
the year
Forfeited/ expired during
the year (i)
Balance at end of the year
Vested and exercisable
at end of the year
Number Number Number Number Number Number
2013
23-Apr-07 23-Apr-13 $0.57 405,000 - (325,000) (80,000) - -
26-Nov-07 26-Nov-13 $0.75 1,700,000 - (250,000) (1,250,000) 200,000 200,000
01-Feb-08 1-Feb-14 $0.86 660,000 - (330,000) - 330,000 330,000
05-Mar-08 5-Mar-14 $0.86 1,170,000 - (255,000) (95,000) 820,000 820,000
01-Feb-09 1-Feb-15 $0.34 660,000 - (330,000) - 330,000 330,000
11-Feb-09 11-Feb-15 $0.34 2,293,487 - (1,140,533) - 1,152,954 1,152,954
16-Mar-10 16-Mar-16 $0.90 680,000 - - - 680,000 680,000
16-Mar-10 16-Mar-17 $0.82 2,282,263 - - (242,515) 2,039,748 -
24-Feb-11 (ii) 23-Feb-18 $0.89 3,922,828 - - (1,001,920) 2,920,908 129,645
24-Feb-12 (ii) 24-Feb-19 $0.68 5,453,917 - - (1,084,112) 4,369,805 152,143
08-Mar-13 8-Mar-19 $1.06 - 4,296,720 - - 4,296,720 -
19,227,495 4,296,720 (2,630,533) (3,753,547) 17,140,135 3,794,742
Weighted average exercise price $0.72 $1.06 $0.52 $0.77 $0.82 $0.65
Grant date
Expiry date
Exercise price
Balance at start of
the year
Granted during
the year
Exercised during
the year
Forfeited/ expired during
the year (i)
Balance at end of the year
Vested and exercisable
at end of the year
Number Number Number Number Number Number
2012
17-Nov-05 17-Nov-11 $0.31 605,000 - (545,000) (60,000) - -
23-Apr-07 23-Apr-13 $0.57 585,000 - (145,000) (35,000) 405,000 405,000
23-Nov-07 31-Jul-14 $0.58 1,000,000 - (250,000) (750,000) - -
23-Nov-07 31-Jul-15 $0.58 1,000,000 - - (1,000,000) - -
23-Nov-07 31-Jul-16 $0.58 1,000,000 - - (1,000,000) - -
26-Nov-07 26-Nov-13 $0.75 2,200,000 - (500,000) - 1,700,000 1,700,000
01-Feb-08 1-Feb-14 $0.86 660,000 - - - 660,000 660,000
05-Mar-08 5-Mar-14 $0.86 1,420,000 - - (250,000) 1,170,000 1,170,000
08-Sep-08 8-Sep-14 $0.69 2,000,000 - (2,000,000) - - -
01-Feb-09 1-Feb-15 $0.34 660,000 - - - 660,000 660,000
11-Feb-09 11-Feb-15 $0.34 5,016,931 - (1,487,994) (1,235,450) 2,293,487 2,293,487
16-Mar-10 16-Mar-16 $0.90 680,000 - - - 680,000 -
16-Mar-10 16-Mar-17 $0.82 3,662,572 - - (1,380,309) 2,282,263 -
24-Feb-11 23-Feb-18 $0.89 5,473,707 164,692 - (1,715,571) 3,922,828 -
24-Feb-12 24-Feb-19 $0.68 - 5,578,685 - (124,768) 5,453,917 -
25,963,210 5,743,377 (4,927,994) (7,551,098) 19,227,495 6,888,487
Weighted average exercise price $0.67 $0.69 $0.54 $0.66 $0.72 $0.59
(i) During the year ended 30 June 2013, 3,678,547 (2012: 7,491,098) options were forfeited and 75,000 (2012: 60,000) options expired.
(ii) A total of 129,645 options granted on 24 February 2011 and 152,143 options granted on 24 February 2012 have a revised vesting date of 29 June 2013 as approved by the Remuneration & Human Resources Committee during the year ended 30 June 2013. These options vested on 29 June 2013.
30 June 2013
38 sHAre-BAseD pAYMents (continueD)
For
per
sona
l use
onl
y

CLOUGH ANNUAL REPORT 2013108
(a) Employee Option Plan (continued)
The weighted average remaining contractual life of share options outstanding at 30 June 2013 was 4.40 years (30 June 2012: 4.43 years).
Fair value of options granted
The assessed fair value at grant date of options granted during the year ended 30 June 2013 was 58.58 cents per option (as detailed below) (2012: 36.29 cents) and was determined by the directors based on an independent valuation prepared by RSM Bird Cameron Corporate Pty Ltd. The fair value at grant date is independently determined using a Binomial option pricing model that takes into account the exercise price, the term of the option, the vesting date and expected life, the non-tradeable nature of the option, the share price at grant date and expected price volatility of the underlying share, the expected dividend yield and the risk-free interest rate for the term of the option.
The model inputs for options granted during the year ended 30 June 2013 included:
(i) options are granted for no consideration and 50% vest based on Clough Limited’s TSR relative to the TSR of the ASX200 Accumulation Index over a three year period ending 31 December 2015 and 50% vest based on the compound annual growth rate in Clough’s EPS in the three years ending 31 December 2015. Vested options are exercisable for a period of three years after vesting
(ii) grant date: 8 March 2013 (2012: 24 February 2012)
(iii) vesting date: 8 March 2016 (2012: 24 February 2016)
(iv) expiry date: 8 March 2019 (2012: 24 February 2019)
(v) exercise price: $1.055 (2012: $0.68)
(vi) share price at grant date: $1.32 (2012: $0.81)
(vii) expected price volatility of the Company’s shares: 55% (2012: 62%)
(viii) expected dividend yield: 3% (2012: 2.7%)
(ix) risk-free interest rate: 3.03% (2012: 3.72%)
The options issued on 8 March 2013 can be segmented into two tranches as a result of their vesting conditions. The tranche of options with a vesting condition that is subject to Clough’s TSR performance have an assessed fair value of $0.5311 and the tranche of options with a vesting condition that is subject to the growth rate in Clough’s EPS have an assessed fair value of $0.6406. The average of these two assessed fair values is $0.5858 per option.
The expected price volatility is based on the historic volatility corresponding to the remaining life of the options.
Performance criteria attached to remaining unvested options at 30 June 2013
The performance criteria that must be met before the remaining unvested options at 30 June 2013 vest are as follows:
Options issued on 16 March 2010: the options will vest if Clough’s share price at the vesting date (adjusted for any dividends paid between the grant date and vesting date) is equal to or above $1.29.
Options issued on 24 February 2011: the options will vest if Clough’s share price at the vesting date (adjusted for any dividends paid between the grant date and vesting date) is equal to or above $1.39.
Options issued on 24 February 2012: the options will vest if Clough’s share price at the vesting date (adjusted for any dividends paid between the grant date and vesting date) is equal to or above $1.07.
(b) Executive Incentive Scheme
Performance rights are granted to key management personnel and senior executives under the Clough Limited Executive Incentive Scheme (Incentive Scheme) to align their interests with those of the shareholders of the Company and for executive retention purposes.
The following are the key aspects of the Incentive Scheme:
The Board determines the eligibility of executives and their entitlement having regard to, amongst other things, the performance and future potential contribution of each executive. Participation by executive directors is subject to shareholder approval.
During the year ended 30 June 2013, two tranches of performance rights were granted to executives of the Group under the Clough Limited Executive Incentive Scheme for executive retention purposes. The performance rights have a nil exercise price, have no performance criteria and will vest automatically providing that the executive is still employed by the Company at the vesting date. Details of these performance rights are as follows:
A total of 568,182 performance rights were granted on 15 August 2012 split into three tranches of 189,394 performance rights with vesting dates of 15 August 2014 (Tranche 1), 15 August 2015 (Tranche 2) and 15 August 2016 (Tranche 3).
30 June 2013
38 sHAre-BAseD pAYMents (continueD)
notes to tHe consoLiDAteD FinAnciAL stAteMentsF
or p
erso
nal u
se o
nly

109ENGINEERED FOR PRODUCTIVITY
(b) Executive Incentive Scheme (continued)
305,885 performance rights (Tranche A) were granted on 23 October 2012 and have a vesting date of 1 March 2015. These performance rights were issued once approved at the Company’s Annual General Meeting held on 23 October 2012 on the same terms as the performance rights granted on 1 March 2012.
The assessed fair value at grant date of performance rights granted during the year ended 30 June 2013 are performance rights granted on 15 August 2012: Tranche 1: $0.6404, Tranche 2: $0.6215 and Tranche 3: $0.6031 and the performance rights granted on 23 October 2012: Tranche A: $0.7268 (2012: 1 March 2012 $0.7464) and were determined by the directors based on independent valuations prepared by RSM Bird Cameron Corporate Pty Ltd. The fair value at grant date is independently determined using a Black-Scholes option pricing model that takes into account the exercise price, the term of the performance right, the vesting date, the non-tradeable nature of the right, the share price at grant date and expected price volatility of the underlying share, the expected dividend yield and the risk-free interest rate for the term of the performance right.
The model inputs for performance rights granted during the year ended 30 June 2013 included:
(i) performance rights are granted for no consideration and have no performance conditions
(ii) grant date: Tranches 1, 2 and 3: 15 August 2012, Tranche A: 23 October 2012 (2012: 1 March 2012)
(iii) vesting date: Tranche 1: 15 August 2014, Tranche 2: 15 August 2015, Tranche 3: 15 August 2016 and Tranche A: 1 March 2015 (2012: 1 March 2015)
(iv) exercise price: $nil (2012: $nil)
(v) share price at grant date: Tranches 1, 2 and 3: $0.68, Tranche A: $0.78 (2012: $0.81)
(vi) expected price volatility of the Company’s shares: Tranche 1: 40%, Tranche 2: 40%, Tranche 3: 55% and Tranche A: 40% (2012: 62%)
(vii) expected dividend yield: Tranches 1, 2, 3 and A: 3% (2012: 2.7%)
(viii) risk-free interest rate: Tranche 1: 2.89%, Tranche 2: 2.75%, Tranche 3: 2.86% and Tranche A: 2.52% (2012: 3.68%)
The number of performance rights outstanding are as follows:
2013
Number
2012
Number
Performance rights granted on 1 March 2012 1,284,717 1,284,717
Performance rights granted on 15 August 2012 568,182 -
Performance rights granted on 23 October 2012 305,885 -
2,158,784 1,284,717
(c) Employee Share Plan
During the year the Company established the Clough Limited Employee Share Plan (“Plan”). Under the Plan, eligible employees were invited to acquire $1,000 of Clough shares by salary sacrifice with the Company matching each share acquired with another share for no additional consideration.
Under the Plan, a total of 353 employees subscribed for shares for a total amount of $353,000 and this was matched by Clough, resulting in a share-based payment expense of $353,000.
A total of 523,852 shares were issued during the year under the Plan at an issue price of $1.3467 per share.
(d) Sign-on shares issued to KT Gallagher
1,136,394 fully paid ordinary Clough Limited shares with a fair value of $900,000 were issued to KT Gallagher on 7 November 2011 as part of his sign-on payment. The issue of these shares was approved at the Company’s Annual General Meeting held on 18 October 2011.
30 June 2013
38 sHAre-BAseD pAYMents (continueD)
For
per
sona
l use
onl
y
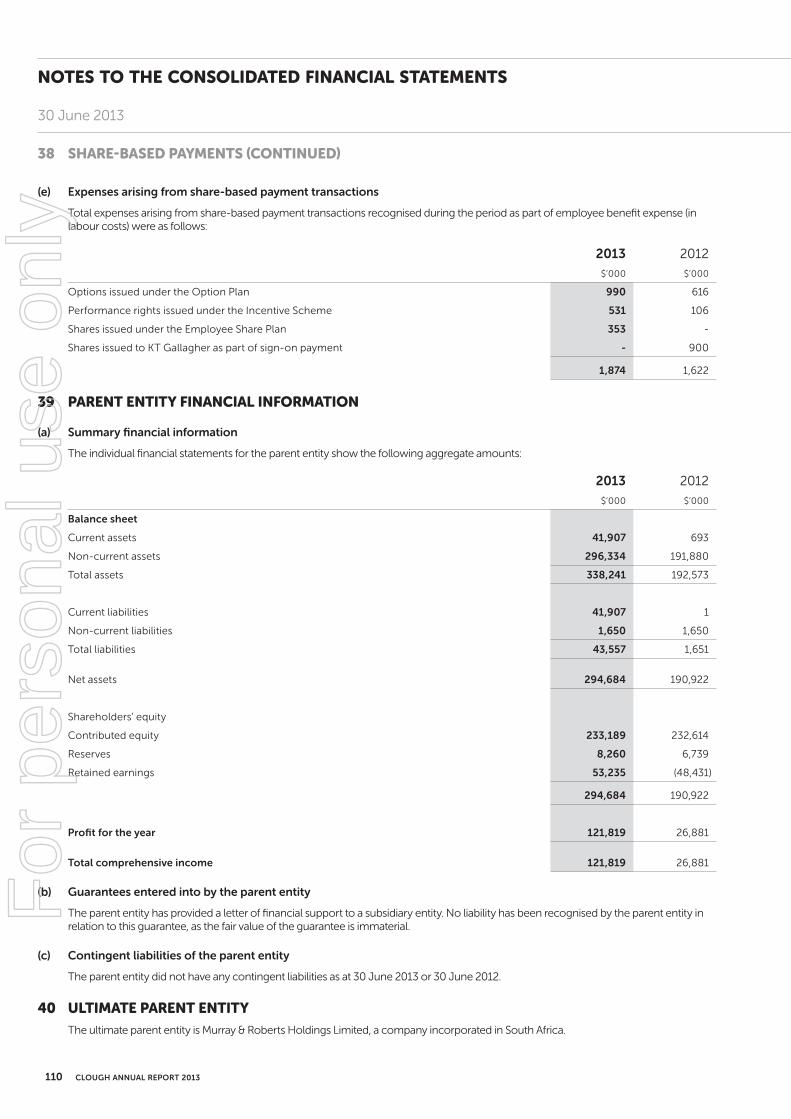
CLOUGH ANNUAL REPORT 2013110
(e) Expenses arising from share-based payment transactions
Total expenses arising from share-based payment transactions recognised during the period as part of employee benefit expense (in labour costs) were as follows:
2013
$’000
2012
$’000
Options issued under the Option Plan 990 616
Performance rights issued under the Incentive Scheme 531 106
Shares issued under the Employee Share Plan 353 -
Shares issued to KT Gallagher as part of sign-on payment - 900
1,874 1,622
39 pArent entitY FinAnciAL inForMAtion
(a) Summary financial information
The individual financial statements for the parent entity show the following aggregate amounts:
2013
$’000
2012
$’000
Balance sheet
Current assets 41,907 693
Non-current assets 296,334 191,880
Total assets 338,241 192,573
Current liabilities 41,907 1
Non-current liabilities 1,650 1,650
Total liabilities 43,557 1,651
Net assets 294,684 190,922
Shareholders’ equity
Contributed equity 233,189 232,614
Reserves 8,260 6,739
Retained earnings 53,235 (48,431)
294,684 190,922
Profit for the year 121,819 26,881
Total comprehensive income 121,819 26,881
(b) Guarantees entered into by the parent entity
The parent entity has provided a letter of financial support to a subsidiary entity. No liability has been recognised by the parent entity in relation to this guarantee, as the fair value of the guarantee is immaterial.
(c) Contingent liabilities of the parent entity
The parent entity did not have any contingent liabilities as at 30 June 2013 or 30 June 2012.
40 uLtiMAte pArent entitYThe ultimate parent entity is Murray & Roberts Holdings Limited, a company incorporated in South Africa.
30 June 2013
38 sHAre-BAseD pAYMents (continueD)
notes to tHe consoLiDAteD FinAnciAL stAteMentsF
or p
erso
nal u
se o
nly

111ENGINEERED FOR PRODUCTIVITY
In the Directors’ opinion:
(a) the fi nancial statements and notes set out on pages 54 to 110 are in accordance with the Corporations Act 2001, including:
(i) complying with Accounting Standards, the Corporations Regulations 2001 and other mandatory professional reporting requirements, and
(ii) giving a true and fair view of the consolidated entity’s fi nancial position as at 30 June 2013 and of its performance for the year ended on that date, and
(b) there are reasonable grounds to believe that the Company will be able to pay its debts as and when they become due and payable.
Note 1(a)(i) confi rms that the fi nancial statements also comply with International Financial Reporting Standards as issued by the International Accounting Standards Board.
The Directors have been given the declarations by the chief executive offi cer and chief fi nancial offi cer required by section 295A of the Corporations Act 2001.
This declaration is made in accordance with a resolution of Directors.
PERTH
20 August 2013
KT Gallagher K SpenceDirector Director
Directors’ DecLArAtion
30 June 2013
For
per
sona
l use
onl
y

CLOUGH ANNUAL REPORT 2013112
independent Auditor’s report to the Members of clough Limited
Report on the Financial Report
We have audited the accompanying financial report of Clough Limited, which comprises the consolidated balance sheet as at 30 June 2013, the consolidated income statement, the consolidated statement of comprehensive income, the consolidated statement of cash flows and the consolidated statement of changes in equity for the year ended on that date, notes comprising a summary of significant accounting policies and other explanatory information, and the directors’ declaration of the consolidated entity, comprising the company and the entities it controlled at the year’s end or from time to time during the financial year as set out on pages 54 to 111.
Directors’ Responsibility for the Financial Report
The directors of the company are responsible for the preparation of the financial report that gives a true and fair view in accordance with Australian Accounting Standards and the Corporations Act 2001 and for such internal control as the directors determine is necessary to enable the preparation of the financial report that gives a true and fair view and is free from material misstatement, whether due to fraud or error. In Note 1, the directors also state, in accordance with Accounting Standard AASB 101 Presentation of Financial Statements, that the consolidated financial statements comply with International Financial Reporting Standards.
Auditor’s Responsibility
Our responsibility is to express an opinion on the financial report based on our audit. We conducted our audit in accordance with Australian Auditing Standards. Those standards require that we comply with relevant ethical requirements relating to audit engagements and plan and perform the audit to obtain reasonable assurance whether the financial report is free from material misstatement.
An audit involves performing procedures to obtain audit evidence about the amounts and disclosures in the financial report. The procedures selected depend on the auditor’s judgement, including the assessment of the risks of material misstatement of the financial report, whether due to fraud or error. In making those risk assessments, the auditor considers internal control, relevant to the company’s preparation of the financial report that gives a true and fair view, in order to design audit procedures that are appropriate in the circumstances, but not for the purpose of expressing an opinion on the effectiveness of the company’s internal control. An audit also includes evaluating the appropriateness of accounting policies used and the reasonableness of accounting estimates made by the directors, as well as evaluating the overall presentation of the financial report.
inDepenDent AuDitor’s report
Deloitte Touche Tohmatsu A.C.N. 74 490 121 060
Woodside Plaza Level 14 240 St Georges Terrace Perth WA 6000
GPO Box A46 Perth WA 6837 Australia
DX 206 Tel: +61 (0) 8 9365 7000 Fax: +61 (0) 8 9365 7001 www.deloitte.com.au
Liability limited by a scheme approved under Professional Standards Legislation.Member of Deloitte Touche Tohmatsu Limited
30 June 2013
For
per
sona
l use
onl
y

113ENGINEERED FOR PRODUCTIVITY
We believe that the audit evidence we have obtained is sufficient and appropriate to provide a basis for our audit opinion.
Auditor’s Independence Declaration
In conducting our audit, we have complied with the independence requirements of the Corporations Act 2001. We confirm that the independence declaration required by the Corporations Act 2001, which has been given to the directors of Clough Limited, would be in the same terms if given to the directors as at the time of this auditor’s report.
Opinion
In our opinion:
(a) the financial report of Clough Limited is in accordance with the Corporations Act 2001, including:
(i) giving a true and fair view of the consolidated entity’s financial position as at 30 June 2013 and of its performance for the year ended on that date; and
(ii) complying with Australian Accounting Standards and the Corporations Regulations 2001; and
(b) the consolidated financial statements also comply with International Financial Reporting Standards as disclosed in Note 1.
Report on the Remuneration Report
We have audited the Remuneration Report included in pages 39 to 50 of the directors’ report for the year ended 30 June 2013. The directors of the company are responsible for the preparation and presentation of the Remuneration Report in accordance with section 300A of the Corporations Act 2001. Our responsibility is to express an opinion on the Remuneration Report, based on our audit conducted in accordance with Australian Auditing Standards.
Opinion
In our opinion the Remuneration Report of Clough Limited for the year ended 30 June 2013, complies with section 300A of the Corporations Act 2001.
DELOITTE TOUCHE TOHMATSU
Ross Jerrard Partner Chartered Accountants
Perth, 20 August 2013
Liability limited by a scheme approved under Professional Standards Legislation.Member of Deloitte Touche Tohmatsu Limited
30 June 2013
30 June 2013
inDepenDent AuDitor’s report (continueD)
For
per
sona
l use
onl
y
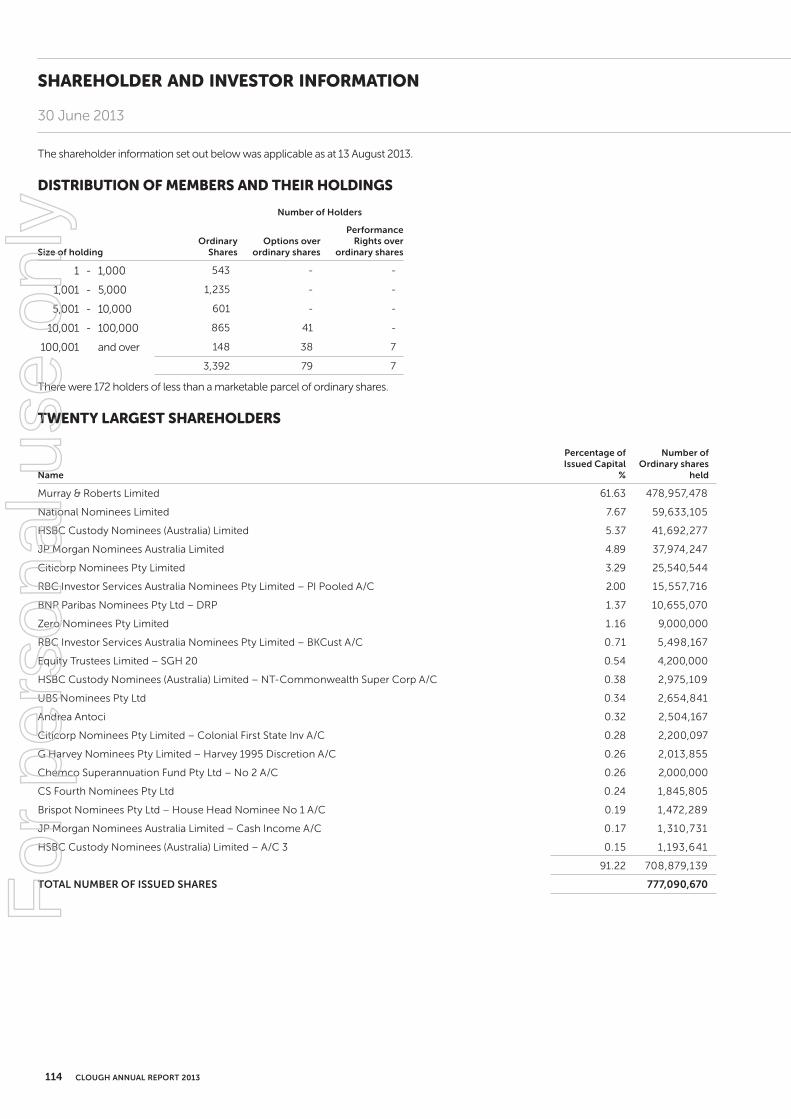
Clough annual report 2013114
The shareholder information set out below was applicable as at 13 August 2013.
DistriBution oF MeMBers AnD tHeir HoLDinGs
Number of Holders
Size of holdingOrdinary
SharesOptions over
ordinary shares
Performance Rights over
ordinary shares
1 - 1,000 543 - -
1,001 - 5,000 1,235 - -
5,001 - 10,000 601 - -
10,001 - 100,000 865 41 -
100,001 and over 148 38 7
3,392 79 7
There were 172 holders of less than a marketable parcel of ordinary shares.
tWentY LArGest sHAreHoLDers
Name
Percentage of Issued Capital
%
Number of Ordinary shares
held
Murray & Roberts Limited 61.63 478,957,478
National Nominees Limited 7.67 59,633,105
HSBC Custody Nominees (Australia) Limited 5.37 41,692,277
JP Morgan Nominees Australia Limited 4.89 37,974,247
Citicorp Nominees Pty Limited 3.29 25,540,544
RBC Investor Services Australia Nominees Pty Limited – PI Pooled A/C 2.00 15,557,716
BNP Paribas Nominees Pty Ltd – DRP 1.37 10,655,070
Zero Nominees Pty Limited 1.16 9,000,000
RBC Investor Services Australia Nominees Pty Limited – BKCust A/C 0.71 5,498,167
Equity Trustees Limited – SGH 20 0.54 4,200,000
HSBC Custody Nominees (Australia) Limited – NT-Commonwealth Super Corp A/C 0.38 2,975,109
UBS Nominees Pty Ltd 0.34 2,654,841
Andrea Antoci 0.32 2,504,167
Citicorp Nominees Pty Limited – Colonial First State Inv A/C 0.28 2,200,097
G Harvey Nominees Pty Limited – Harvey 1995 Discretion A/C 0.26 2,013,855
Chemco Superannuation Fund Pty Ltd – No 2 A/C 0.26 2,000,000
CS Fourth Nominees Pty Ltd 0.24 1,845,805
Brispot Nominees Pty Ltd – House Head Nominee No 1 A/C 0.19 1,472,289
JP Morgan Nominees Australia Limited – Cash Income A/C 0.17 1,310,731
HSBC Custody Nominees (Australia) Limited – A/C 3 0.15 1,193,641
91.22 708,879,139
TOTAL NUMBER OF ISSUED SHARES 777,090,670
sHAreHoLDer AnD inVestor inForMAtion
30 June 2013
For
per
sona
l use
onl
y

115EnginEErEd for productivity
suBstAntiAL sHAreHoLDersThe number of shares held by substantial shareholders, as disclosed in the substantial shareholding notice given to the Company.
Shareholder Number held
Murray & Roberts Limited 478,957,478
unQuoteD eQuitY securities
Options
There are 16,498,347 options issued to 79 executives under the Clough Limited Executive Option Plan to take up ordinary shares.
Performance Rights
There are 2,158,784 performance rights issued to 7 executives under the Clough Limited Executive Incentive Scheme to take up ordinary shares.
VotinG riGHtsOrdinary shares carry voting rights of one vote per share.
Options and Performance Rights have no voting rights.
sHAreHoLDer inQuiriesShareholders can obtain information about their shares or dividend payments by contacting the Company’s share registry:
Link Market Services Limited Ground Floor 178 St George’s Terrace Perth, Western Australia 6000 Telephone +613 0055 4474 Facsimile +612 9287 0303
stocK excHAnGe ListinGSecurities in Clough Limited are quoted on the Australian Securities Exchange.
cHAnGe oF ADDressShareholders should notify the share registry in writing immediately there is a change of their registered address or change in banking details for dividends electronically credited to a bank account in Australia.
puBLicAtionsThe annual report is the main source of information for shareholders.
reMoVAL FroM AnnuAL report MAiLinG ListShareholders who do not wish to receive the annual report, or who are receiving more than one copy, should advise the share registry in writing.
cLouGH LiMiteD WeBsiteClough Limited has an internet address at www.clough.com.au
This contains the Company’s latest annual report, interim reports and media statements released through the Australian Securities Exchange.
30 June 2013
sHAreHoLDer AnD inVestor inForMAtion (continueD)
For
per
sona
l use
onl
y

CLOUGH ANNUAL REPORT 2013116
This page has been left blank intentionally.
For
per
sona
l use
onl
y

clo
ug
H
20
13 an
nu
al r
epo
rt
www.clough.com.au
follow us at
58 Mounts Bay RoadPerth, Western Australia 6000
t +61 8 9281 9281f +61 8 9281 9943
e [email protected] De
sig
n b
y m
ind
fi e
ld
For
per
sona
l use
onl
y