
Closing the Quality Gap: What role surveillance ? Andrew Longmate Kirsty Ellis Stirling Royal...
32
Closing the Quality Gap: What role surveillance ? Andrew Longmate Kirsty Ellis Stirling Royal Infirmary SICS Annual Audit Meeting November 2007
-
Upload
david-webster -
Category
Documents
-
view
213 -
download
0
Transcript of Closing the Quality Gap: What role surveillance ? Andrew Longmate Kirsty Ellis Stirling Royal...

Closing the Quality Gap:What role surveillance ?
Andrew Longmate Kirsty Ellis
Stirling Royal InfirmarySICS Annual Audit Meeting
November 2007

SurveillanceSupervise, closely observe, watch or guard over a
person, especially a criminal or prisoner
A dynamic process of gathering, managing, analyzing and reporting data on events that occur in a specific population
The act of systematically collecting, tabulating analysing and disseminating data on the occurrence of nosocomial infections.

Consuming the results for
improvement
Surveillance is not complete until the results are disseminated to those who use it to prevent and control
Partner stakeholders to implement effective prevention strategies (CDC)

One Unit’s History
• Before 2004 we did not measure incidence of HAI in our ITU.
• Anecdotally seemed high
• We performed a pilot for 4 months which quantified rates for VAP 45%(40 /1000vd), CrBSI 17%(16/1000pd) and MRSA acquisition (10%).
• All seemed quite high.

What gets measured gets controlled
• Local Surveillance Quality Improvement programme for 2 years
• HELICS participation • Dedicated nurse, Consultant Lead• Multimodal Interventions for QI• Basic infection control practices including
hand hygiene , engagement, feedback education, behaviour change, local root cause analysis, iterative problem solving.

Concurrent• Flexible• Informative• Timely• Capable of cluster
detection• Capable of changing
behaviour• ExpensiveActive• Accurate• Complete• Expensive
Retrospective• Depends on
completeness, validity and accuracy of existing data
• Does not identify problems as promptly as concurrent does
• But isn’t expensivePassive• Misclassification• Underreporting• Lack of timeliness• Less expensive
Surveillance may be……….

6 monthly ICU acquired Meticillin Related Staphylococcus Aureus #
(per 1000 at risk patient days)
0
5
10
15
20
25
Sept 05 -Feb 06
Mar - Aug
Sept -Feb 07
Mar - Aug
per 1
000
at ri
sk p
atie
nt d
ays
# colonisation and infection

g chart MRSA at risk patient
days between acquisition
0
100
200
300
400
500
600
700
800
1 2 3 4 5 6 7 8 9 10 11 12 13 14 15 16 17 18 19 20 21 22 23 24 25 26 27 28 29 30 31 32 33
outbreak 9-132004 10%2005-6 7.2%2006-7 3.3%
Cepeda 10-12%91% with patient sources in wardHH compliance 21%
Hawthorne Effect
Change in behaviour or performance (usually improvement)
New or increased attention (or change in environment) “the feeling or awareness of being studied or subject to an intervention”
Temporary and short lived - gradual return to baseline
Independent of the manipulation or intervention

Purposes of surveillance
1. To reduce the risks and rate of HAI2. To reduce morbidity and mortality• Establishing baseline rates• Identifying outbreaks• Convincing medical staff• Satisfying regulators• Defending malpractice claims • To reduce the costs to the patients, the
hospital and the healthcare system • To compare infection rates among hospitals

SENIC (Study on Efficacy of Nosocomial Infection Control) Haley RW, Culver DH, White JW et al Am J Epidemiol 1985; 121(2): 182-205 The efficacy of infection surveillance and control programs in preventing nosocomial infections in US hospitals.
• Retrospectively surveyed 169,526 admissions in 338 hospitals between April 1975 and March 1976. Randomly sampled medical records from 500 patients admitted in the 12 month study period.
• 30% reduction UTIs, Surgical Wound Infections, Pneumonia, Bacteraemias
• if their infection surveillance and control programme included 4 components:
• appropriate emphasis on surveillance activities and vigorous control efforts,
• at least one full time ICN per 250 beds, • a trained hospital epidemiologist• feedback of wound infection rates to surgeons.

Effectiveness of a nationwide nosocomial infection surveillance system for reducing nosocomial infections. Gastmeier P, Geffers C, Brandt C et al J Hosp Infect. 2006 Sept;64(1): 16-22
• Participation in KISS was associated with a significant reduction in 3 Nosocomial Infections.
• Relative risk for VAP 0.71 (CI 0.66-0.76)
• Relative risk for CRBSI 0.8 (CI 0.72-0.90)

Opinion
• WHO 1981 advisory group to consider surveillance control and prevention of HAI.Recommended prevalence surveys. Stressed that they did not directly point to the causes of the diseases that they record.
• CDC/NNIS• HELICs 1994: The creation of a database intended for the
comparative analysis and reduction in the rates of hospital acquired infections in the 15 countries.
• ATS Guidelines 2005 for the HAP, VAP and HCAP. Surveillance of ICU infections to identify and quantify endemic and new MDR pathogens, and preparation of timely data for infection control and to guide appropriate, antimicrobial therapy in patients with suspected HAP or other nosocomial infections are recommended (level II). (moderately well designed controlled trials without randomisation).

The Scottish Executive• 2002 SEHD (Scottish Executive Health Department) recommended that
surveillance of healthcare associated infection, be piloted in ICUs, demonstrated that data collection from 5 sites was possible and concluded that it should be expanded.
• 2006 (NHS HDL (2006) 38)- A revised Framework for National Surveillance of HealthCare Associated Infection in Scotland - all infection control teams should also target local HAI surveillance to locally identified priority areas.Boards are encouraged to implement as many voluntary list surveillance topics as possible, and a minimum of two in addition to compulsory elements.An integrated and validated system of surveillance is vital for informing local and national interventions and strategic development, and in ensuring the earliest possible ascertainment and characterisation of new and re-emerging hazards.
• 2007 IHI National Patient Safety Alliance

HELICS DEFINITION ofCRI (central venous catheter-related infection)
CRI 1 Local CVC-related infection (no positive blood culture)quantitative CVC culture 103 CFU/ml (3) or semi-quantitative CVC culture > 15 CFU (4) and pus/inflammation at the insertion site or tunnel
CRI 2 General CVC-related infection (no positive blood culture)quantitative CVC culture 103 CFU/ml or semi-quantitative CVC culture > 15 CFU andclinical signs improve within 48 hours after catheter removal
CRI 3 CVC-related BSIBSI occurring 48 hours before or after catheter removaland positive culture with the same micro-organism of either:semi-quantitative CVC culture > 15 CFU or quantitative CVC culture 103 CFU/ml or quantitive
blood culture ratio CVC blood sample/peripheral blood sample> 5(5)differential delay of positivity of blood cultures (6): CVC blood sample culture positive 2 hours or less
before peripheral blood culture (blood samples drawn at the same time)positive culture with the same micro-organism from pus from insertion site
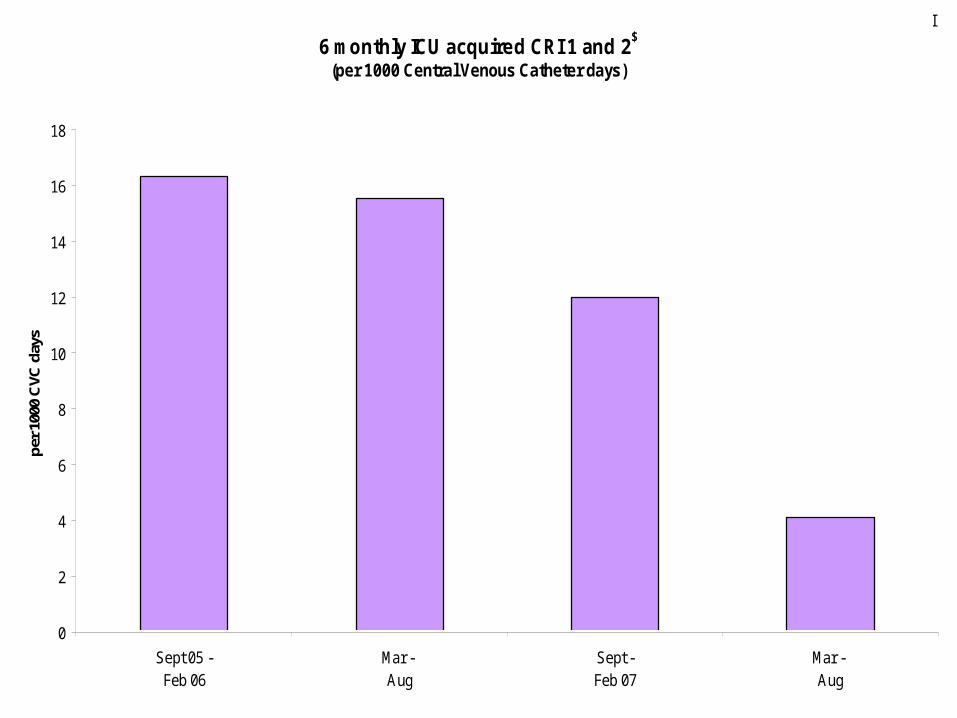
6 monthly ICU acquired CRI 1 and 2$
(per 1000 Central Venous Catheter days)
0
2
4
6
8
10
12
14
16
18
Sept 05 -Feb 06
Mar - Aug
Sept -Feb 07
Mar - Aug
per 1
000
CVC
day
s$ excluding CRBSI

G chartNumber of days since last Diagnosis of CRI 1 and 2
0
10
20
30
40
50
60
70
80
90
1 2 3 4 5 6 7 8 9 10 11 12 13 14 15 16 17 18 19 20 21 22 23 24 25 26 27 28 29 30 31 32 33 34 35 36 37 38 39 40 41 42 43 44 45 46 47 48

6 monthly ICU acquired CRI 3 (CRBSI) (per 1000 Central Venous Catheter days)
0
1
2
3
4
5
6
Sept 05 -Feb 06
Mar - Aug
Sept -Feb 07
Mar - Aug
per 1
000
CVC
day
s
?

G chartDays since last CRBSI diagnosed
0
20
40
60
80
100
120
140
160
180
200

CRBSI U chart 09/05 - 08/07
0
0.002
0.004
0.006
0.008
0.01
0.012
0.014
0.016
0.018
0.02
Sept Oct Nov Dec Jan Feb Mar Apr May Jun Jul Aug Sept Oct Nov Dec Jan Feb Mar Apr May Jun Jul Aug
Pro
port
ion
UCL
LCL
Process Avg
UWL
LWL

Quality Improvement in the NHS
• Bridging the gap between best evidence and effective implementation in our hospitals
• Identifying and overcoming barriers to change
• Not just us but everyone – only as strong as the weakest link

Change/Quality ImprovementKey Concepts for Sustainability for QI (Wall)
• Leadership Support• Interdisciplinary Teams• Standardise and Simplify work• Embed Measurement in Daily Work• Transparency and Avoidance of Blame• Real Time Process Measurement• Continuous Audit and Feedback• Systems approach
Structure, Process and Outcome

.
Wall RJ, Ely EW, Elasy TA, et al. 2005. Using Real Time Process Measurements to reduce Catheter Related Blodd Stream Infections in the Intensive Care Unit. Quality and Safety in Healthcare, 14 ; 295-302.
Berenholtz SM, Pronovost PJ, Lipsett PA, et al.. Eliminating catheter-related bloodstream infections in the intensive care unit. Crit Berenholtz SM, Pronovost PJ, Lipsett PA, et al.. Eliminating catheter-related bloodstream infections in the intensive care unit. Crit Care Med. 2004 ImpleCare Med. 2004 Implementing 5 staggered interventions over a 4 year periodmenting 5 staggered interventions over a 4 year period

Effecting Change
• Passive interventions are unlikely to achieve significant improvements in provider behaviour and thus it is unlikely that significant improvement in infection rates should occur as a result of such interventions if the appropriate process measures are not improved.
• IHI Recommend specific QI strategies for implementing bundles such as audit and feedback of infection rates and all or none measurements, use of multidisciplinary rounds and setting daily patient goals.

EBM• Evidence for QI strategies to improve adherence to
preventative interventions for HAI is generally of sub optimal quality, consisting primarily of single centre simple B and A studies of limited internal and external validity.
• Unable to reach any firm conclusions regarding actionable QI strategies to prevent HAI.
• Most studies reporting adherence to process measures reported a significant improvement. Striking lack of negative reporting is highly likely to be a manifestation of publication bias.
• Very few assessments of potential adverse effects of the intervention
• No high quality studies assessed cost-benefit of intervention
Prevention of Health Care Associated Infections.A Critical Analysis of Quality Improvement Strategies.Agency for Healthcare Research and Quality. Jan 2007

Lack of strong evidence supporting use of specific QI strategies should not be taken to mean that ongoing QI efforts in HAI prevention have been uniformly unsuccessful or that current strategies should not be continued.
Higher quality studies of QI strategies for HAI prevention are urgently needed.Following strategies are worthy of future study and possibly wider implementation:
Use of printed or computer based reminders with stop orders to reduce unnecessary catheterisation
Printed or computer based reminders to improve surgical antibiotic prophylaxis.
Active educational Interventions, use of checklists to improve improve adherence to preventative interventions for VAP.

Annual ICU acquired Ventilator associated Pneumonia(per 1000 invasive mechanical ventilation days)
0
5
10
15
20
25
Sept 05 -Aug 06
Sept 06 -Aug 07
per 1
000
vent
day
s
2004: 40/1000

Protocol Compliance across three cycles
0%
20%
40%
60%
80%
100%
120%
semi-recumbent HMEF above mouth chlorhexidine sub-glottic w eaning plan sedation holiday
Nov-06 May-07
Oct-07
Hawe, Ellis, Cairns, Longmate

g chart VAP
at risk ventialtion days between.
0
5
10
15
20
25
30
35
40
45
50At
risk
pat
ient
s ve
ntila
ted
betw
een
VAP
12
34
1 ) Audit started.01/12/2006
2) Education started.27/02/07
3) Second audit cycle 07/05/07
4) guideline refined /relaunched01/08/07
guidelines in place

Conclusions
• Trends towards reduction in HAI
• Confounders
• Early
• Consistent with what we know about surveillance, educational interventions

QuestionsDo we believe it ? Is it Hawthorne ? Does it matter if you are a patient ?
What intervention is causing the benefit ?Do you need measurement (surveillance) ?
or just QI without measurement ?Can you separate the measuring from the behaviour change
FV – dedicated nurse data collection education and change, active, concurrent and clinically owned.
Relatively expensiveIs it an unnecessary luxury ?Should we continue ?How can we make it sustainable ?
National Patient Safety Alliance. National Surveillance.

BSI-A:1 positive blood culture for a recognised pathogen orPatient has at least one of the following signs or symptoms: fever (>38°C.), chills, or hypotension and 2 positive blood cultures for a common skin contaminant (from 2 separate blood samples drawn within 48 hours).skin contaminants = coagulase-negative staphylococci, Micrococcus sp., Propionibacterium acnes, Bacillus sp., Corynebacterium sp.
BSI-B: Patient has at least one of the following signs or symptoms: fever (>38°C.), chills, or hypotension And either 1 positive blood culture with a skin contaminant in patient with an intravascular line in place and in whom the physician instituted appropriate antimicrobial therapy.orpositive blood Antigen test (e.g. H.influenzae, S.pneumoniae, N. meningitidis or Group B Streptococcus)